Embed Size (px)
Citation preview
ALL DYNAMIC CRUST CR MEGA PACKET
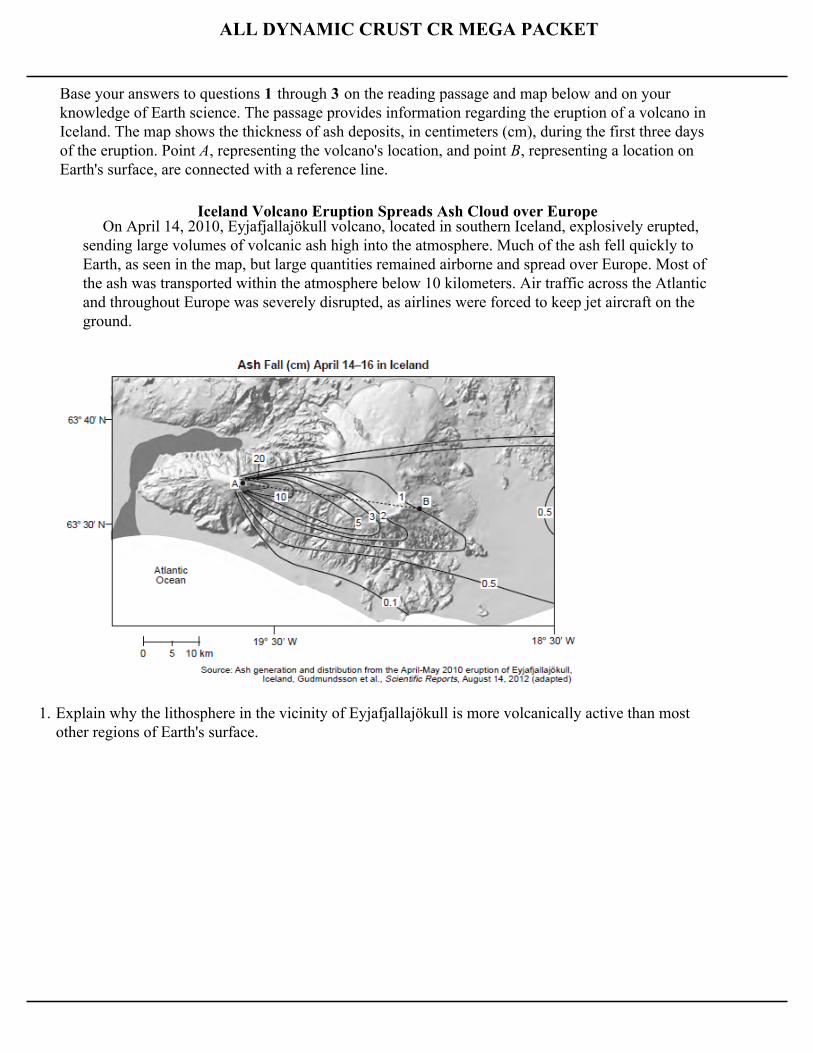
Base your answers to questions 1 through 3 on the reading passage and map below and on yourknowledge of Earth science. The passage provides information regarding the eruption of a volcano inIceland. The map shows the thickness of ash deposits, in centimeters (cm), during the first three daysof the eruption. Point A, representing the volcano's location, and point B, representing a location onEarth's surface, are connected with a reference line.
Iceland Volcano Eruption Spreads Ash Cloud over Europe On April 14, 2010, Eyjafjallajökull volcano, located in southern Iceland, explosively erupted,sending large volumes of volcanic ash high into the atmosphere. Much of the ash fell quickly toEarth, as seen in the map, but large quantities remained airborne and spread over Europe. Most ofthe ash was transported within the atmosphere below 10 kilometers. Air traffic across the Atlanticand throughout Europe was severely disrupted, as airlines were forced to keep jet aircraft on theground.
1. Explain why the lithosphere in the vicinity of Eyjafjallajökull is more volcanically active than mostother regions of Earth's surface.
ALL DYNAMIC CRUST CR MEGA PACKET
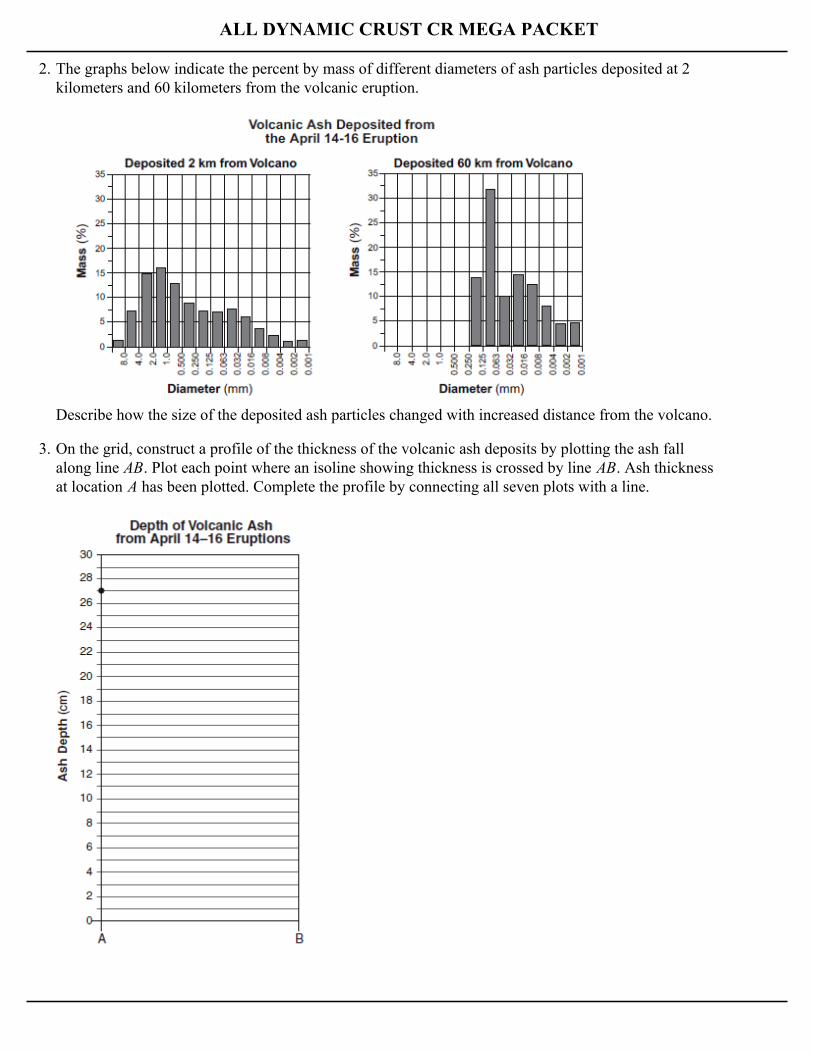
2. The graphs below indicate the percent by mass of different diameters of ash particles deposited at 2kilometers and 60 kilometers from the volcanic eruption.
Describe how the size of the deposited ash particles changed with increased distance from the volcano.
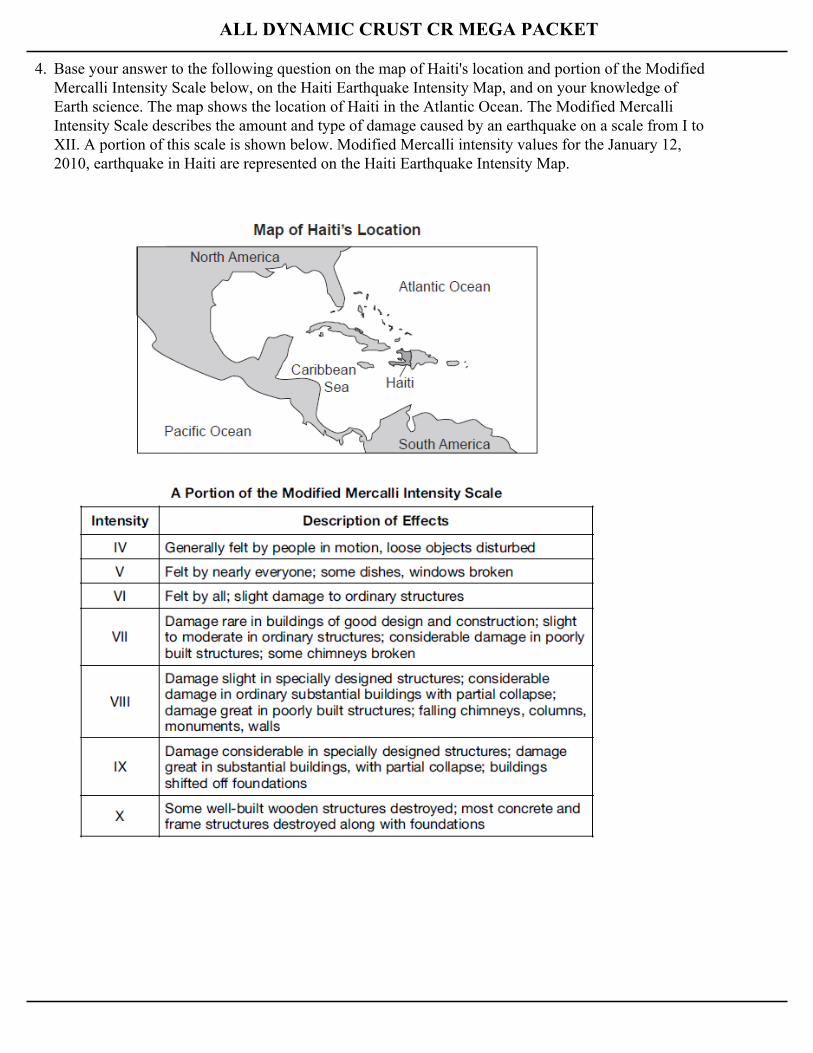
3. On the grid, construct a profile of the thickness of the volcanic ash deposits by plotting the ash fallalong line AB. Plot each point where an isoline showing thickness is crossed by line AB. Ash thicknessat location A has been plotted. Complete the profile by connecting all seven plots with a line.
ALL DYNAMIC CRUST CR MEGA PACKET
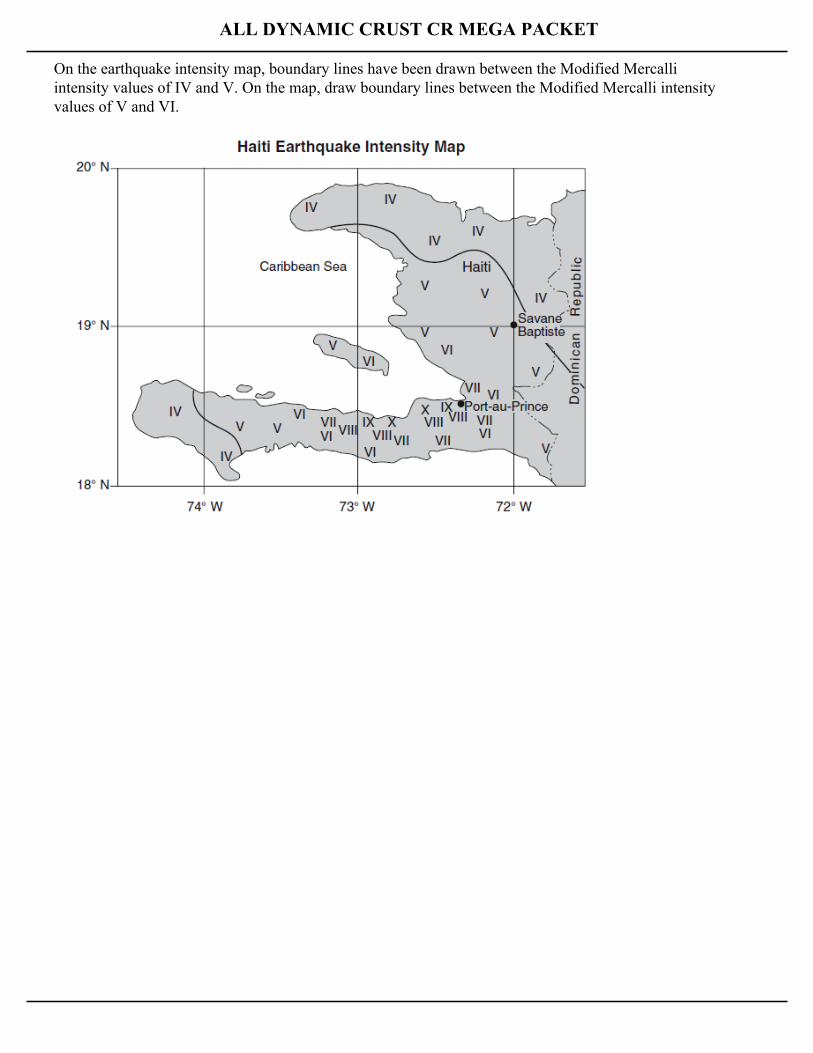
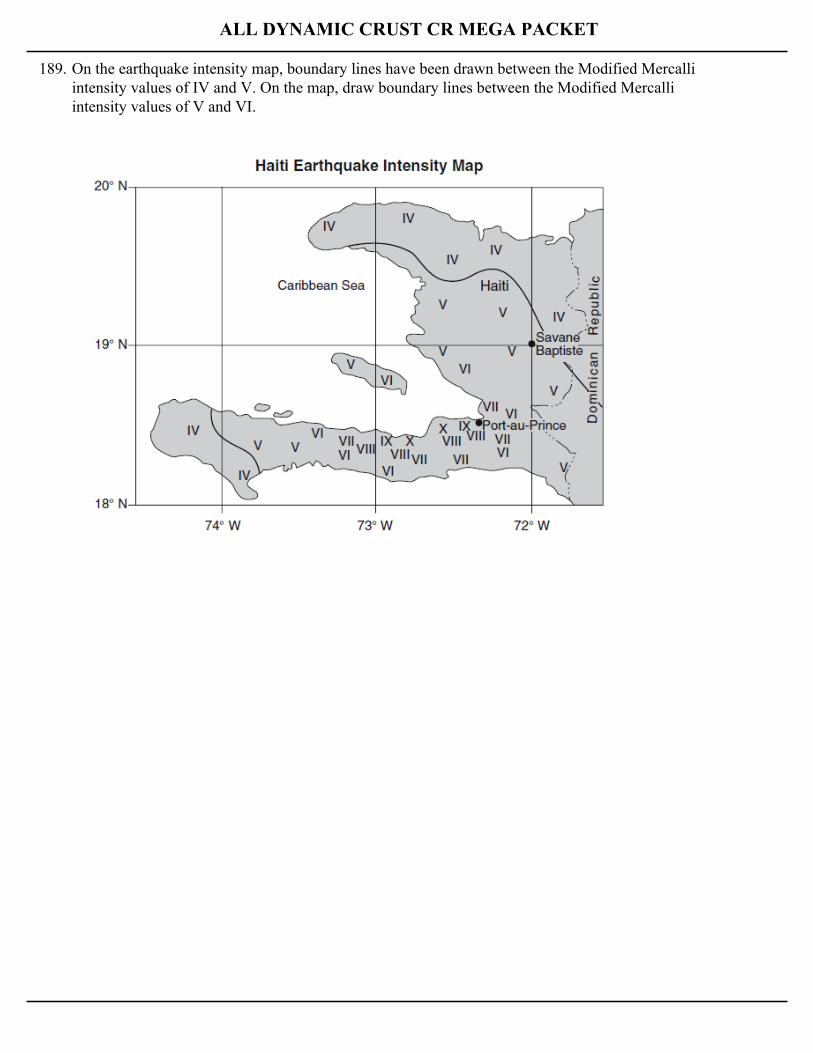
4. Base your answer to the following question on the map of Haiti's location and portion of the ModifiedMercalli Intensity Scale below, on the Haiti Earthquake Intensity Map, and on your knowledge ofEarth science. The map shows the location of Haiti in the Atlantic Ocean. The Modified MercalliIntensity Scale describes the amount and type of damage caused by an earthquake on a scale from I toXII. A portion of this scale is shown below. Modified Mercalli intensity values for the January 12,2010, earthquake in Haiti are represented on the Haiti Earthquake Intensity Map.
ALL DYNAMIC CRUST CR MEGA PACKET
On the earthquake intensity map, boundary lines have been drawn between the Modified Mercalliintensity values of IV and V. On the map, draw boundary lines between the Modified Mercalli intensityvalues of V and VI.
ALL DYNAMIC CRUST CR MEGA PACKET
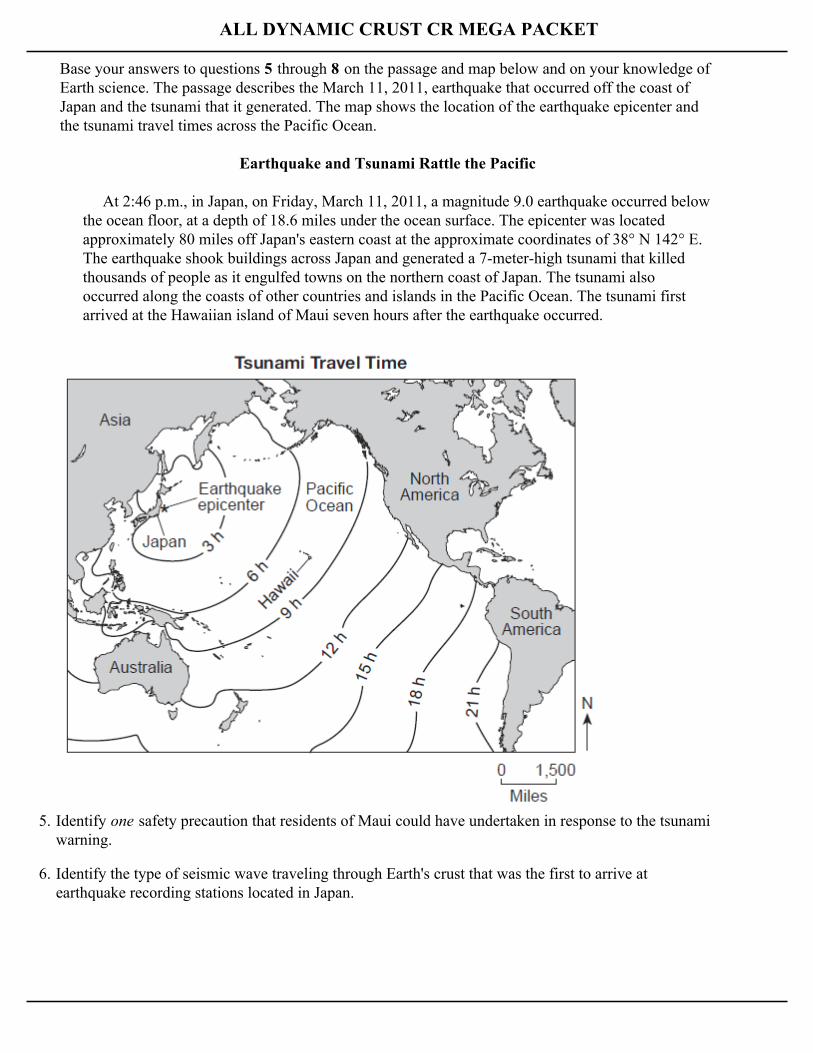
Base your answers to questions 5 through 8 on the passage and map below and on your knowledge ofEarth science. The passage describes the March 11, 2011, earthquake that occurred off the coast ofJapan and the tsunami that it generated. The map shows the location of the earthquake epicenter andthe tsunami travel times across the Pacific Ocean.
Earthquake and Tsunami Rattle the Pacific
At 2:46 p.m., in Japan, on Friday, March 11, 2011, a magnitude 9.0 earthquake occurred belowthe ocean floor, at a depth of 18.6 miles under the ocean surface. The epicenter was locatedapproximately 80 miles off Japan's eastern coast at the approximate coordinates of 38° N 142° E.The earthquake shook buildings across Japan and generated a 7-meter-high tsunami that killedthousands of people as it engulfed towns on the northern coast of Japan. The tsunami alsooccurred along the coasts of other countries and islands in the Pacific Ocean. The tsunami firstarrived at the Hawaiian island of Maui seven hours after the earthquake occurred.
5. Identify one safety precaution that residents of Maui could have undertaken in response to the tsunamiwarning.
6. Identify the type of seismic wave traveling through Earth's crust that was the first to arrive atearthquake recording stations located in Japan.
ALL DYNAMIC CRUST CR MEGA PACKET
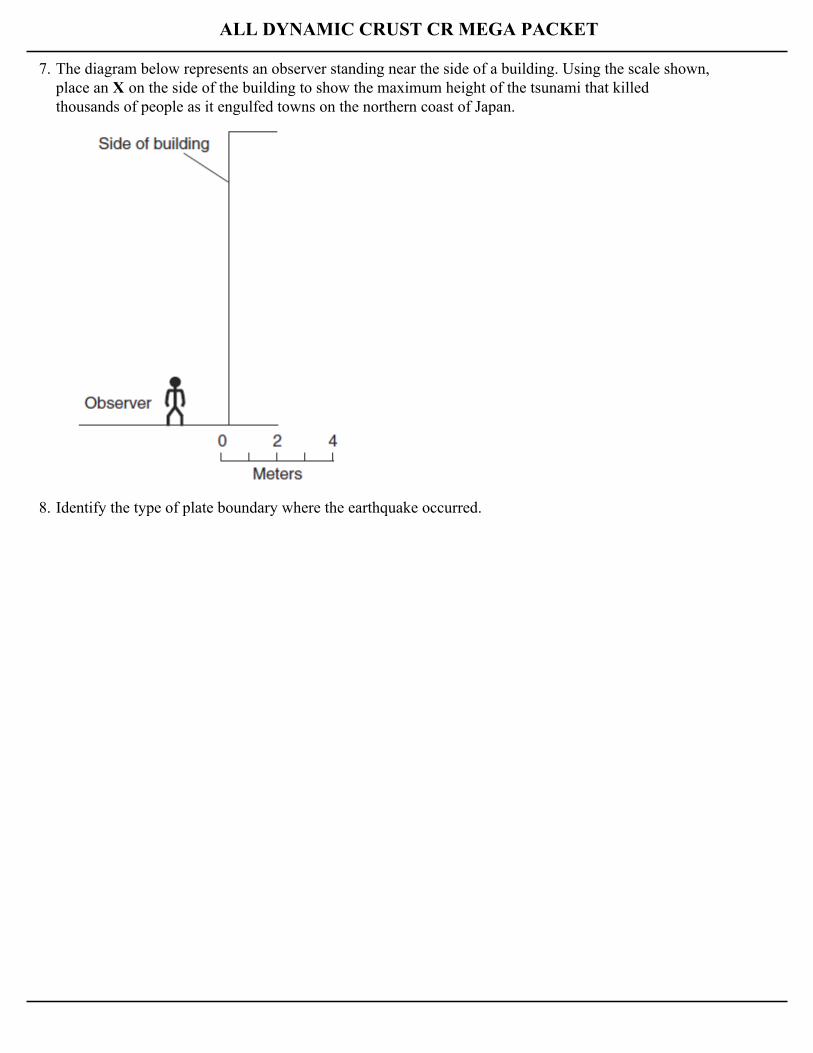
7. The diagram below represents an observer standing near the side of a building. Using the scale shown,place an X on the side of the building to show the maximum height of the tsunami that killedthousands of people as it engulfed towns on the northern coast of Japan.
8. Identify the type of plate boundary where the earthquake occurred.
ALL DYNAMIC CRUST CR MEGA PACKET
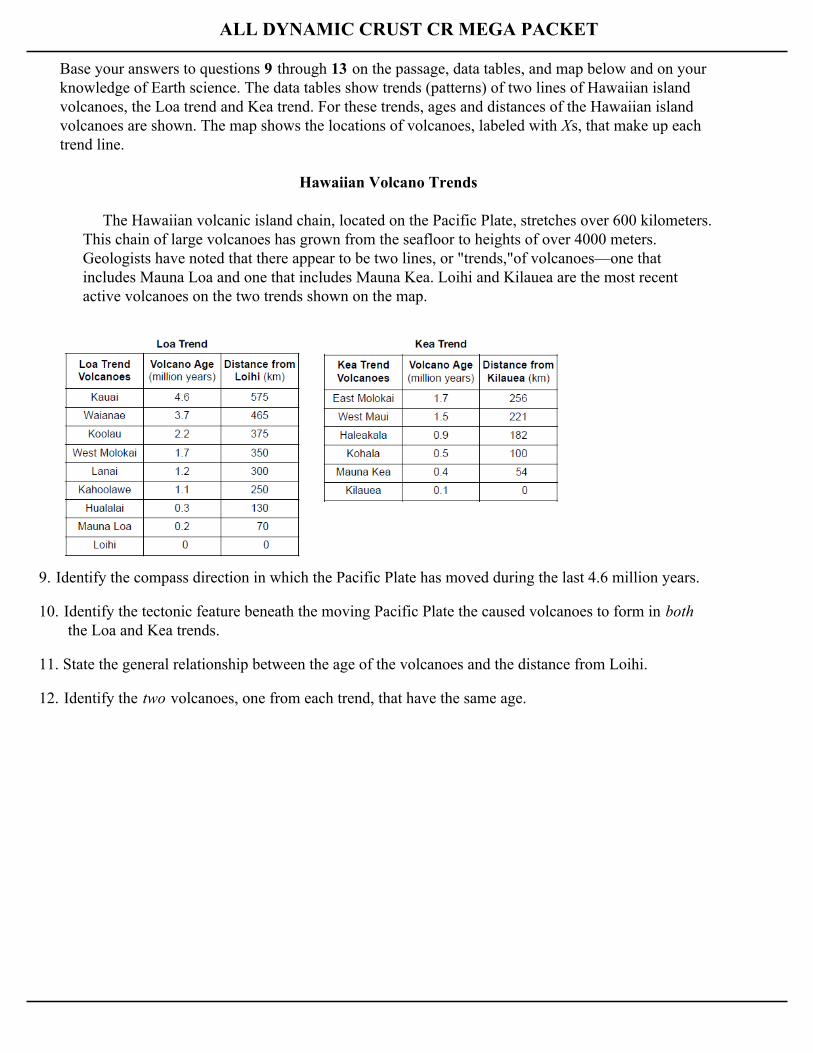
Base your answers to questions 9 through 13 on the passage, data tables, and map below and on yourknowledge of Earth science. The data tables show trends (patterns) of two lines of Hawaiian islandvolcanoes, the Loa trend and Kea trend. For these trends, ages and distances of the Hawaiian islandvolcanoes are shown. The map shows the locations of volcanoes, labeled with Xs, that make up eachtrend line.
Hawaiian Volcano Trends
The Hawaiian volcanic island chain, located on the Pacific Plate, stretches over 600 kilometers.This chain of large volcanoes has grown from the seafloor to heights of over 4000 meters.Geologists have noted that there appear to be two lines, or "trends,"of volcanoes—one thatincludes Mauna Loa and one that includes Mauna Kea. Loihi and Kilauea are the most recentactive volcanoes on the two trends shown on the map.
9. Identify the compass direction in which the Pacific Plate has moved during the last 4.6 million years.
10. Identify the tectonic feature beneath the moving Pacific Plate the caused volcanoes to form in both the Loa and Kea trends.
11. State the general relationship between the age of the volcanoes and the distance from Loihi.
12. Identify the two volcanoes, one from each trend, that have the same age.
ALL DYNAMIC CRUST CR MEGA PACKET
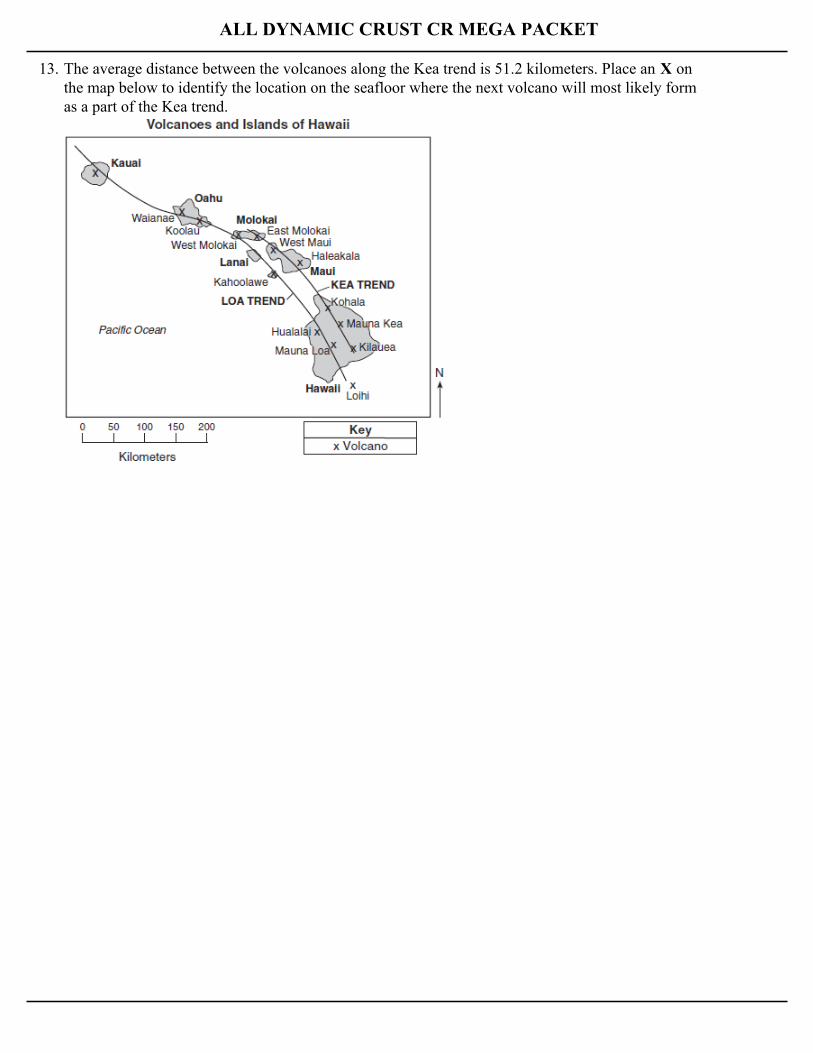
13. The average distance between the volcanoes along the Kea trend is 51.2 kilometers. Place an X onthe map below to identify the location on the seafloor where the next volcano will most likely formas a part of the Kea trend.
ALL DYNAMIC CRUST CR MEGA PACKET
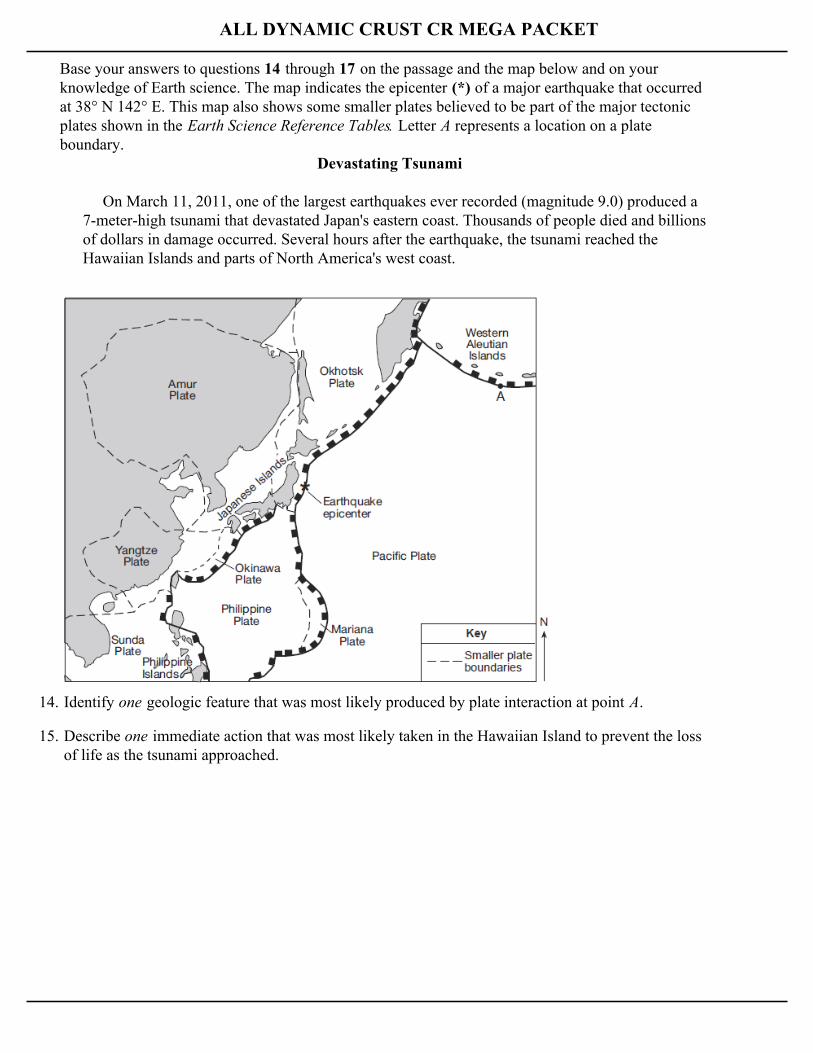
Base your answers to questions 14 through 17 on the passage and the map below and on yourknowledge of Earth science. The map indicates the epicenter (*) of a major earthquake that occurredat 38° N 142° E. This map also shows some smaller plates believed to be part of the major tectonicplates shown in the Earth Science Reference Tables. Letter A represents a location on a plateboundary.
Devastating Tsunami
On March 11, 2011, one of the largest earthquakes ever recorded (magnitude 9.0) produced a7-meter-high tsunami that devastated Japan's eastern coast. Thousands of people died and billionsof dollars in damage occurred. Several hours after the earthquake, the tsunami reached theHawaiian Islands and parts of North America's west coast.
14. Identify one geologic feature that was most likely produced by plate interaction at point A.
15. Describe one immediate action that was most likely taken in the Hawaiian Island to prevent the lossof life as the tsunami approached.
ALL DYNAMIC CRUST CR MEGA PACKET
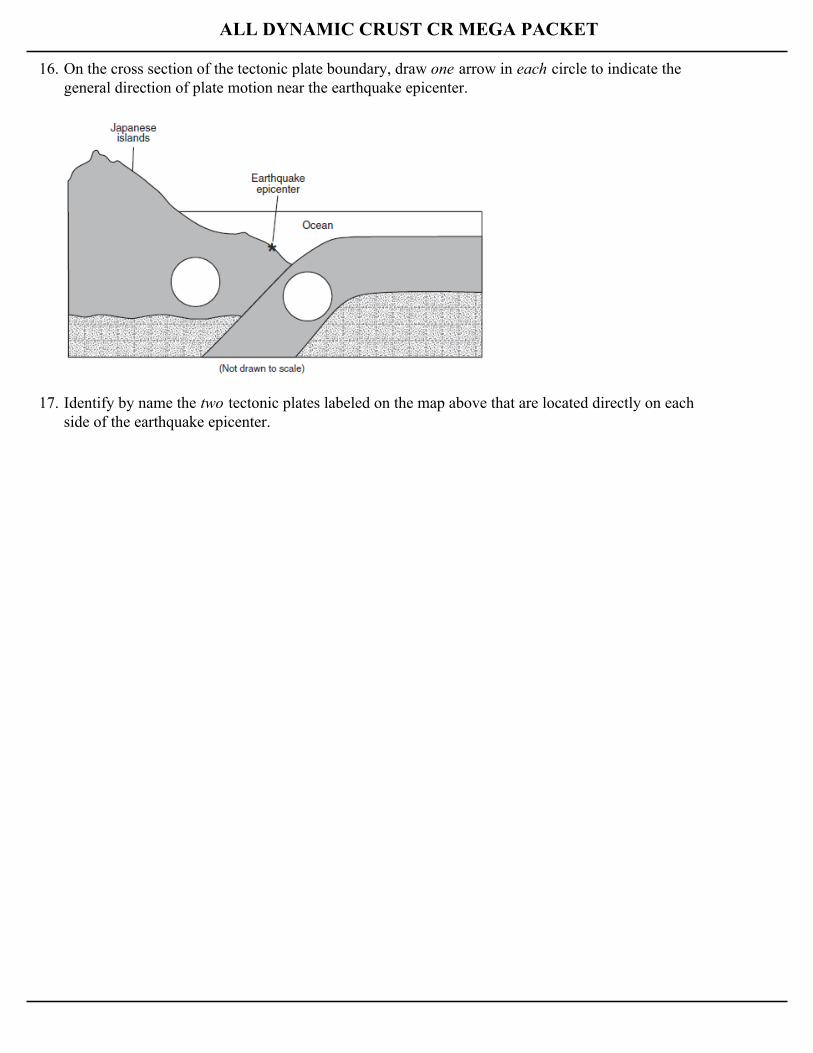
16. On the cross section of the tectonic plate boundary, draw one arrow in each circle to indicate thegeneral direction of plate motion near the earthquake epicenter.
17. Identify by name the two tectonic plates labeled on the map above that are located directly on eachside of the earthquake epicenter.
ALL DYNAMIC CRUST CR MEGA PACKET
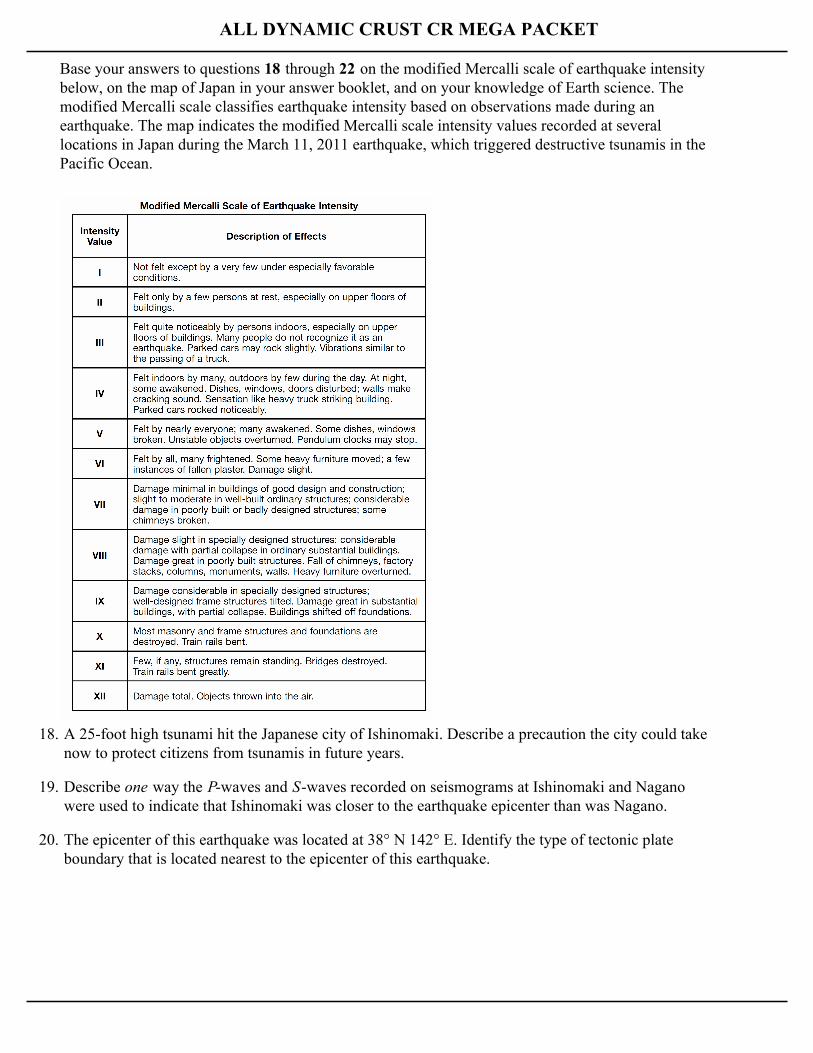
Base your answers to questions 18 through 22 on the modified Mercalli scale of earthquake intensitybelow, on the map of Japan in your answer booklet, and on your knowledge of Earth science. Themodified Mercalli scale classifies earthquake intensity based on observations made during anearthquake. The map indicates the modified Mercalli scale intensity values recorded at severallocations in Japan during the March 11, 2011 earthquake, which triggered destructive tsunamis in thePacific Ocean.
18. A 25-foot high tsunami hit the Japanese city of Ishinomaki. Describe a precaution the city could takenow to protect citizens from tsunamis in future years.
19. Describe one way the P-waves and S-waves recorded on seismograms at Ishinomaki and Naganowere used to indicate that Ishinomaki was closer to the earthquake epicenter than was Nagano.
20. The epicenter of this earthquake was located at 38° N 142° E. Identify the type of tectonic plateboundary that is located nearest to the epicenter of this earthquake.
ALL DYNAMIC CRUST CR MEGA PACKET
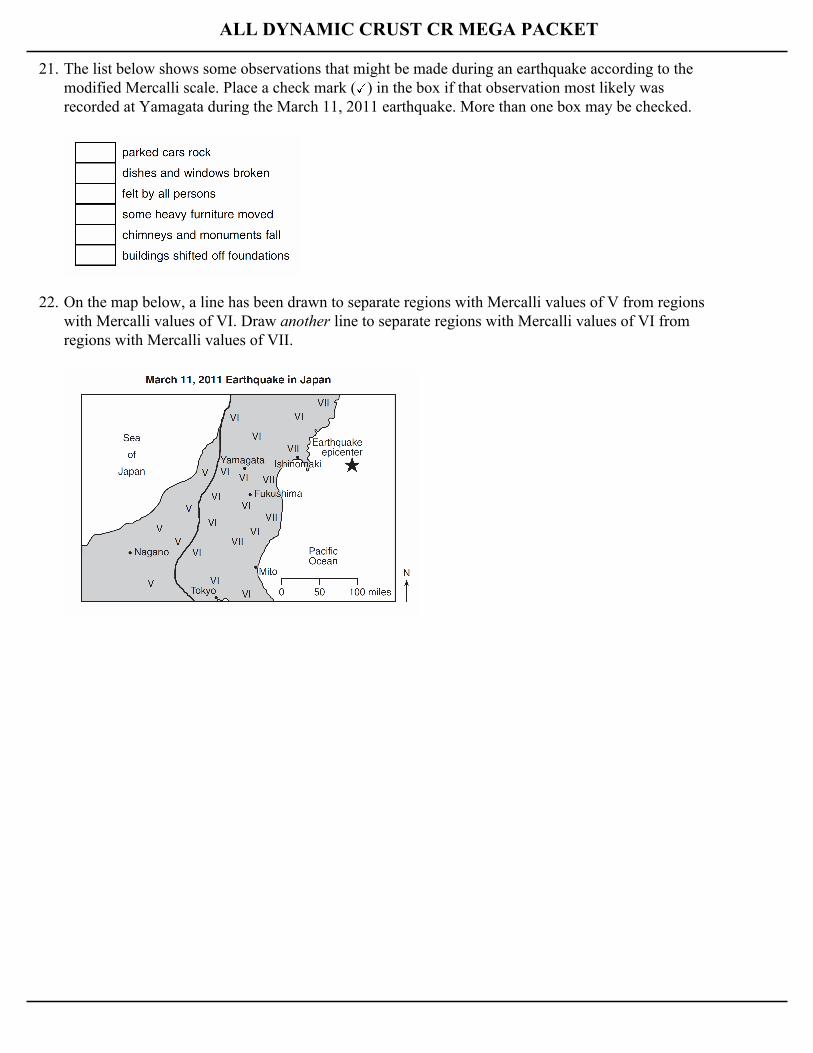
21. The list below shows some observations that might be made during an earthquake according to themodified Mercalli scale. Place a check mark ( ) in the box if that observation most likely wasrecorded at Yamagata during the March 11, 2011 earthquake. More than one box may be checked.
22. On the map below, a line has been drawn to separate regions with Mercalli values of V from regionswith Mercalli values of VI. Draw another line to separate regions with Mercalli values of VI fromregions with Mercalli values of VII.
ALL DYNAMIC CRUST CR MEGA PACKET
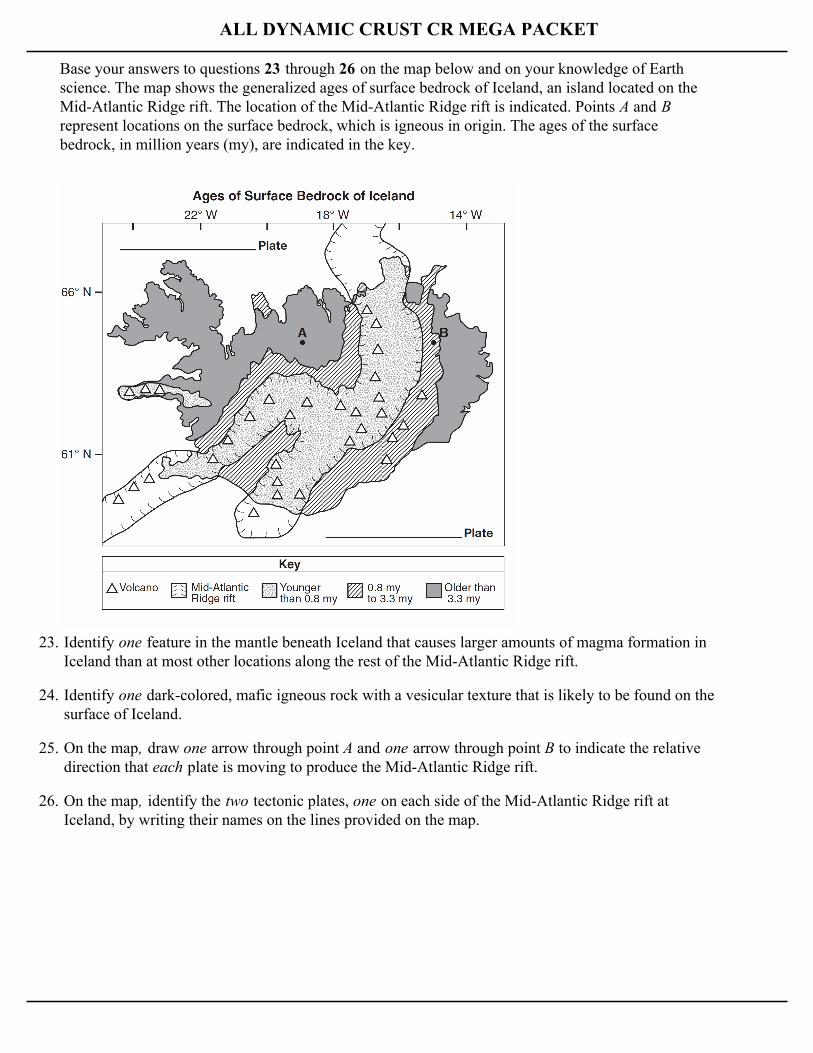
Base your answers to questions 23 through 26 on the map below and on your knowledge of Earthscience. The map shows the generalized ages of surface bedrock of Iceland, an island located on theMid-Atlantic Ridge rift. The location of the Mid-Atlantic Ridge rift is indicated. Points A and B represent locations on the surface bedrock, which is igneous in origin. The ages of the surfacebedrock, in million years (my), are indicated in the key.
23. Identify one feature in the mantle beneath Iceland that causes larger amounts of magma formation inIceland than at most other locations along the rest of the Mid-Atlantic Ridge rift.
24. Identify one dark-colored, mafic igneous rock with a vesicular texture that is likely to be found on thesurface of Iceland.
25. On the map, draw one arrow through point A and one arrow through point B to indicate the relativedirection that each plate is moving to produce the Mid-Atlantic Ridge rift.
26. On the map, identify the two tectonic plates, one on each side of the Mid-Atlantic Ridge rift atIceland, by writing their names on the lines provided on the map.
ALL DYNAMIC CRUST CR MEGA PACKET
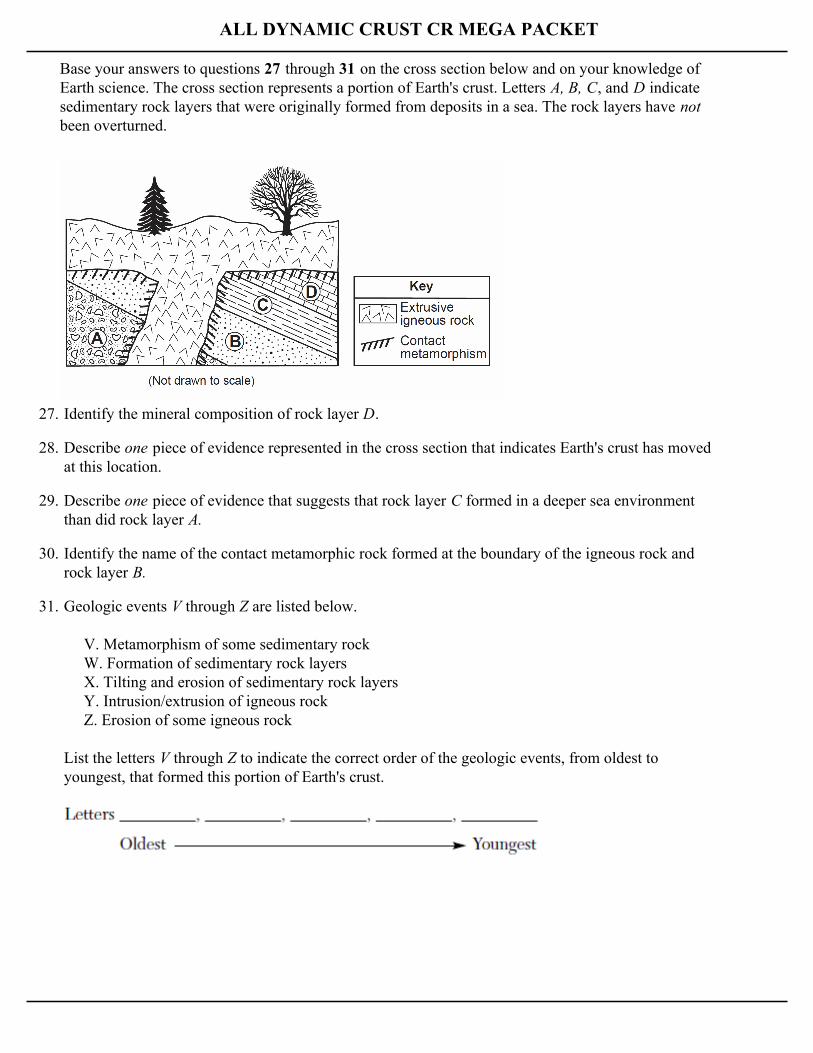
Base your answers to questions 27 through 31 on the cross section below and on your knowledge ofEarth science. The cross section represents a portion of Earth's crust. Letters A, B, C, and D indicatesedimentary rock layers that were originally formed from deposits in a sea. The rock layers have not been overturned.
27. Identify the mineral composition of rock layer D.
28. Describe one piece of evidence represented in the cross section that indicates Earth's crust has movedat this location.
29. Describe one piece of evidence that suggests that rock layer C formed in a deeper sea environmentthan did rock layer A.
30. Identify the name of the contact metamorphic rock formed at the boundary of the igneous rock androck layer B.
31. Geologic events V through Z are listed below.
V. Metamorphism of some sedimentary rock W. Formation of sedimentary rock layers X. Tilting and erosion of sedimentary rock layers Y. Intrusion/extrusion of igneous rock Z. Erosion of some igneous rock
List the letters V through Z to indicate the correct order of the geologic events, from oldest toyoungest, that formed this portion of Earth's crust.
ALL DYNAMIC CRUST CR MEGA PACKET
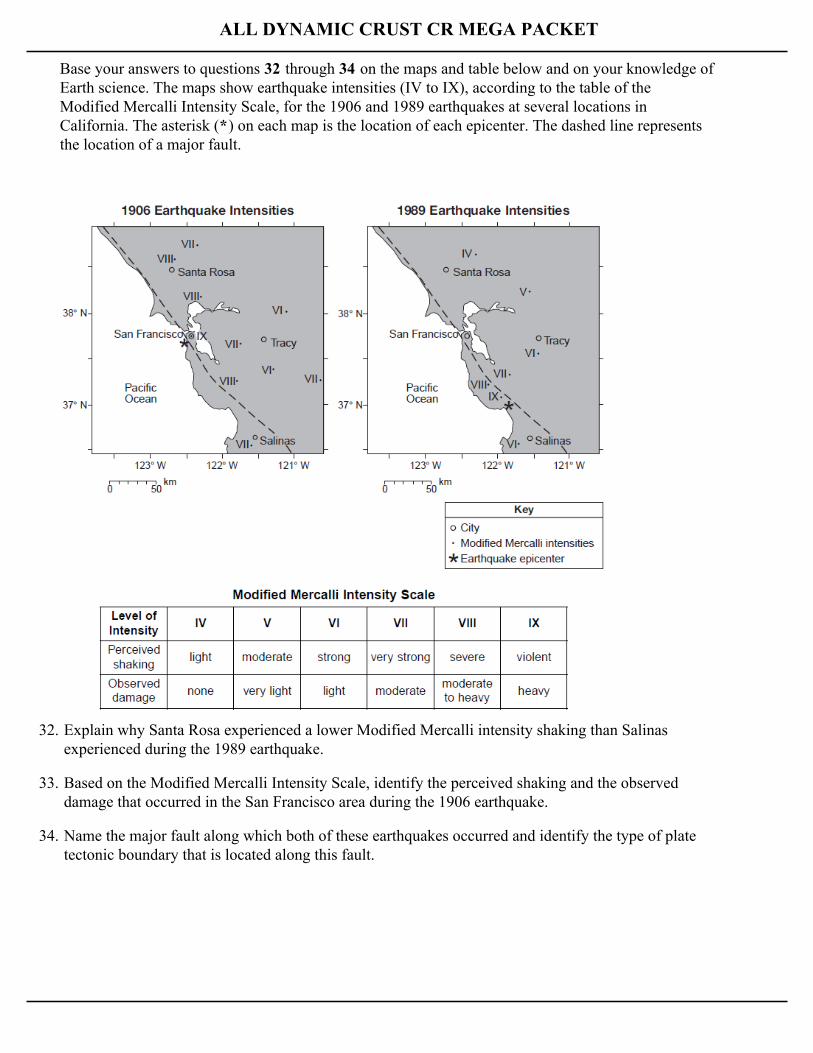
Base your answers to questions 32 through 34 on the maps and table below and on your knowledge ofEarth science. The maps show earthquake intensities (IV to IX), according to the table of theModified Mercalli Intensity Scale, for the 1906 and 1989 earthquakes at several locations inCalifornia. The asterisk (*) on each map is the location of each epicenter. The dashed line representsthe location of a major fault.
32. Explain why Santa Rosa experienced a lower Modified Mercalli intensity shaking than Salinasexperienced during the 1989 earthquake.
33. Based on the Modified Mercalli Intensity Scale, identify the perceived shaking and the observeddamage that occurred in the San Francisco area during the 1906 earthquake.
34. Name the major fault along which both of these earthquakes occurred and identify the type of platetectonic boundary that is located along this fault.
ALL DYNAMIC CRUST CR MEGA PACKET
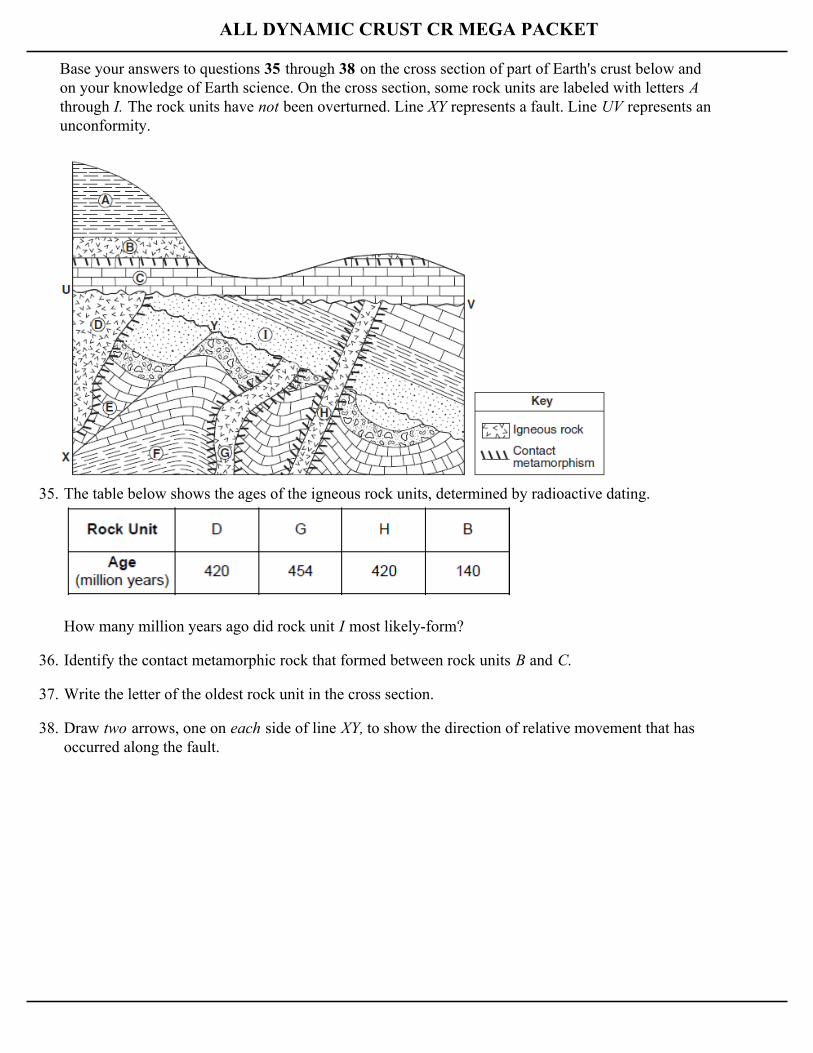
Base your answers to questions 35 through 38 on the cross section of part of Earth's crust below andon your knowledge of Earth science. On the cross section, some rock units are labeled with letters A through I. The rock units have not been overturned. Line XY represents a fault. Line UV represents anunconformity.
35. The table below shows the ages of the igneous rock units, determined by radioactive dating.
How many million years ago did rock unit I most likely-form?
36. Identify the contact metamorphic rock that formed between rock units B and C.
37. Write the letter of the oldest rock unit in the cross section.
38. Draw two arrows, one on each side of line XY, to show the direction of relative movement that hasoccurred along the fault.
ALL DYNAMIC CRUST CR MEGA PACKET
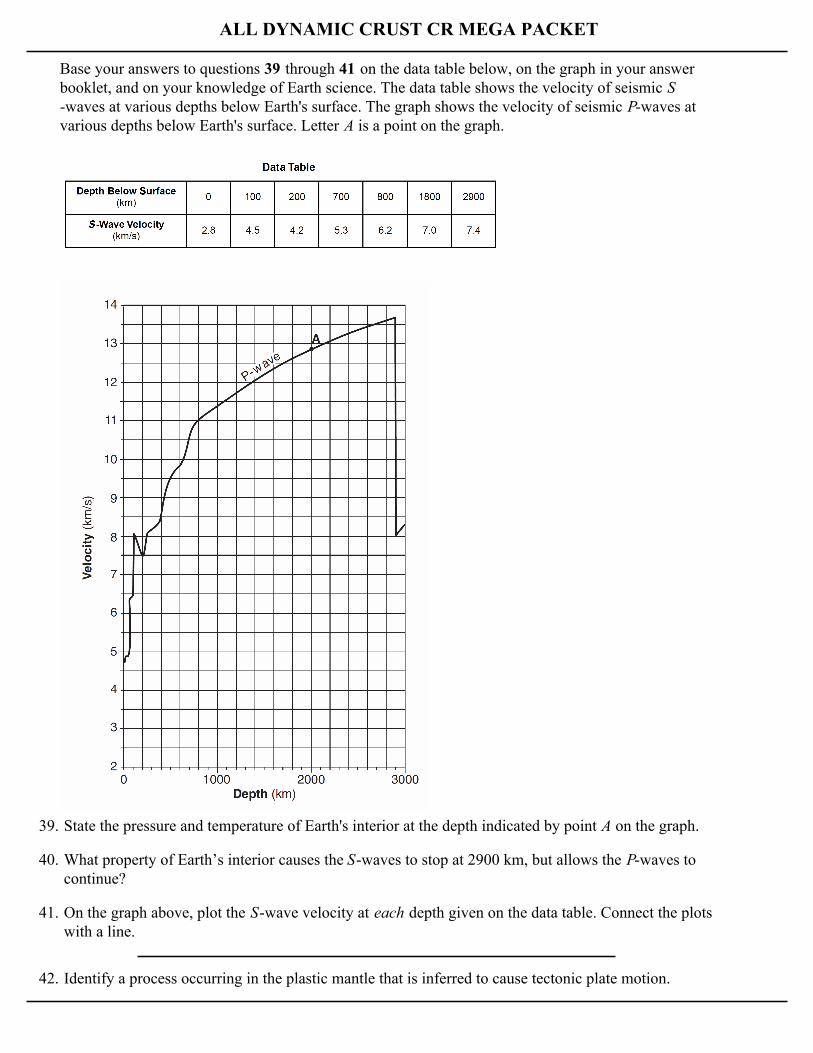
Base your answers to questions 39 through 41 on the data table below, on the graph in your answerbooklet, and on your knowledge of Earth science. The data table shows the velocity of seismic S-waves at various depths below Earth's surface. The graph shows the velocity of seismic P-waves atvarious depths below Earth's surface. Letter A is a point on the graph.
39. State the pressure and temperature of Earth's interior at the depth indicated by point A on the graph.
40. What property of Earth’s interior causes the S-waves to stop at 2900 km, but allows the P-waves tocontinue?
41. On the graph above, plot the S-wave velocity at each depth given on the data table. Connect the plotswith a line.
42. Identify a process occurring in the plastic mantle that is inferred to cause tectonic plate motion.
ALL DYNAMIC CRUST CR MEGA PACKET
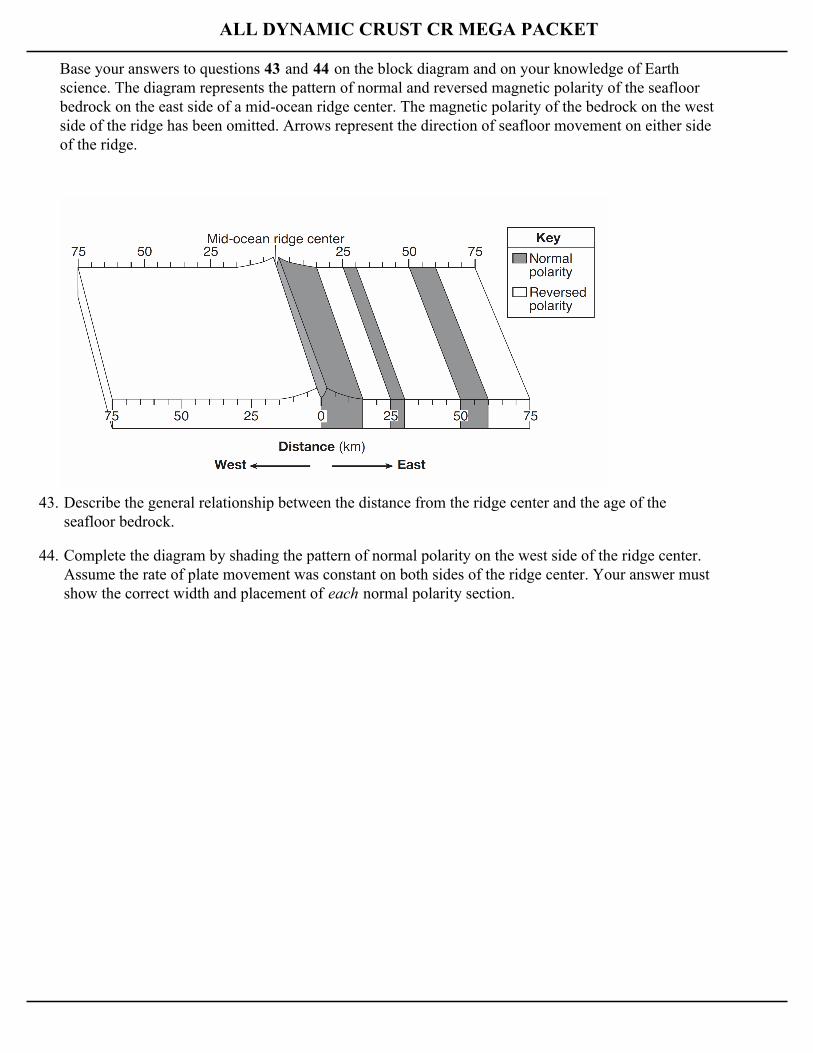
Base your answers to questions 43 and 44 on the block diagram and on your knowledge of Earthscience. The diagram represents the pattern of normal and reversed magnetic polarity of the seafloorbedrock on the east side of a mid-ocean ridge center. The magnetic polarity of the bedrock on the westside of the ridge has been omitted. Arrows represent the direction of seafloor movement on either sideof the ridge.
43. Describe the general relationship between the distance from the ridge center and the age of theseafloor bedrock.
44. Complete the diagram by shading the pattern of normal polarity on the west side of the ridge center.Assume the rate of plate movement was constant on both sides of the ridge center. Your answer mustshow the correct width and placement of each normal polarity section.
ALL DYNAMIC CRUST CR MEGA PACKET
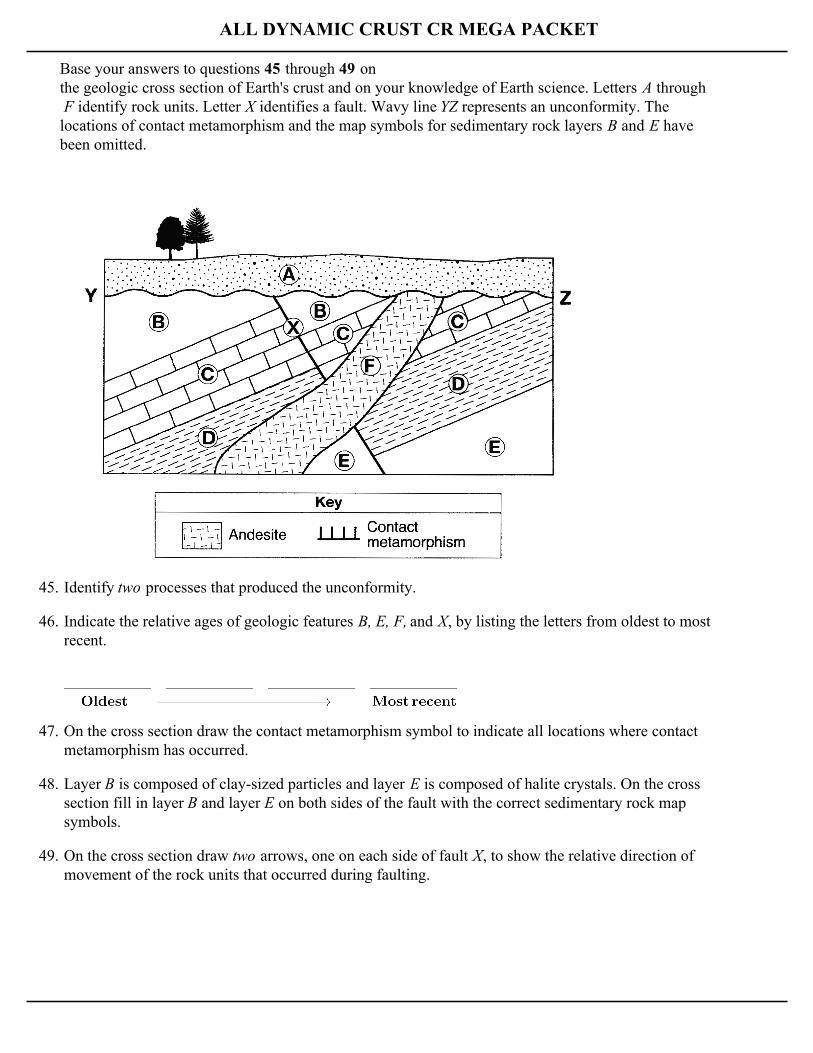
Base your answers to questions 45 through 49 on the geologic cross section of Earth's crust and on your knowledge of Earth science. Letters A through F identify rock units. Letter X identifies a fault. Wavy line YZ represents an unconformity. Thelocations of contact metamorphism and the map symbols for sedimentary rock layers B and E havebeen omitted.
45. Identify two processes that produced the unconformity.
46. Indicate the relative ages of geologic features B, E, F, and X, by listing the letters from oldest to mostrecent.
47. On the cross section draw the contact metamorphism symbol to indicate all locations where contactmetamorphism has occurred.
48. Layer B is composed of clay-sized particles and layer E is composed of halite crystals. On the crosssection fill in layer B and layer E on both sides of the fault with the correct sedimentary rock mapsymbols.
49. On the cross section draw two arrows, one on each side of fault X, to show the relative direction ofmovement of the rock units that occurred during faulting.
ALL DYNAMIC CRUST CR MEGA PACKET
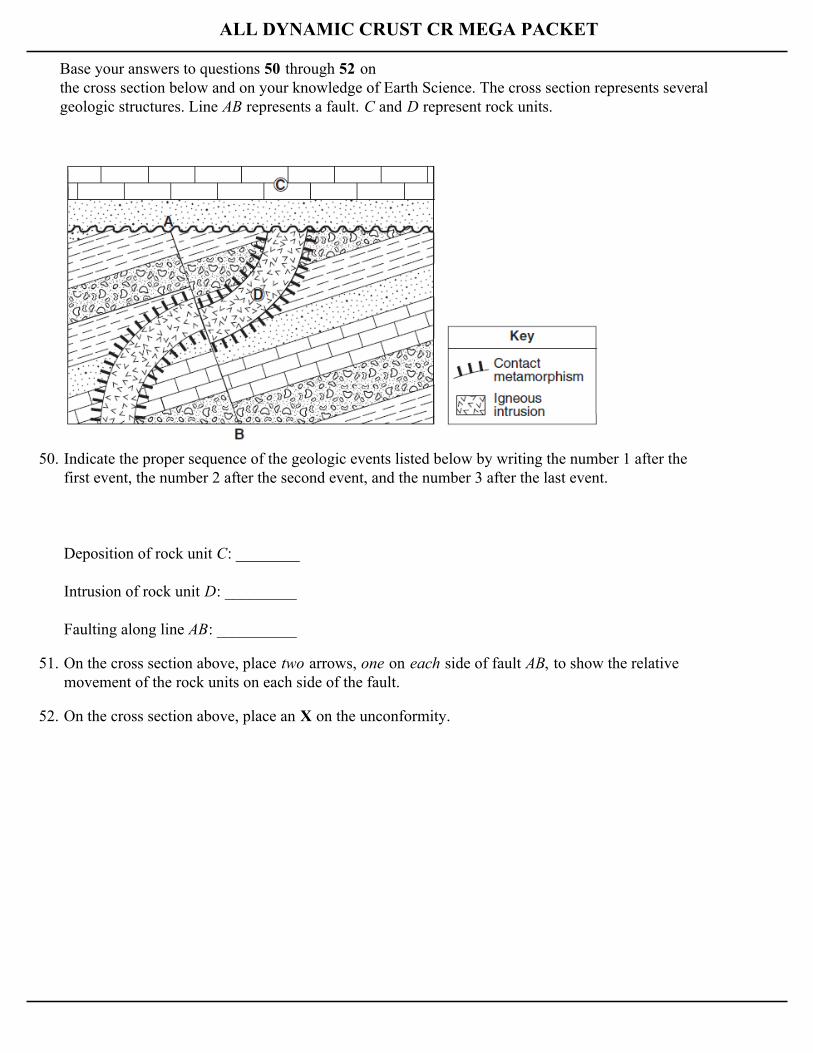
Base your answers to questions 50 through 52 on the cross section below and on your knowledge of Earth Science. The cross section represents severalgeologic structures. Line AB represents a fault. C and D represent rock units.
50. Indicate the proper sequence of the geologic events listed below by writing the number 1 after thefirst event, the number 2 after the second event, and the number 3 after the last event.
Deposition of rock unit C: ________
Intrusion of rock unit D: _________
Faulting along line AB: __________
51. On the cross section above, place two arrows, one on each side of fault AB, to show the relativemovement of the rock units on each side of the fault.
52. On the cross section above, place an X on the unconformity.
ALL DYNAMIC CRUST CR MEGA PACKET
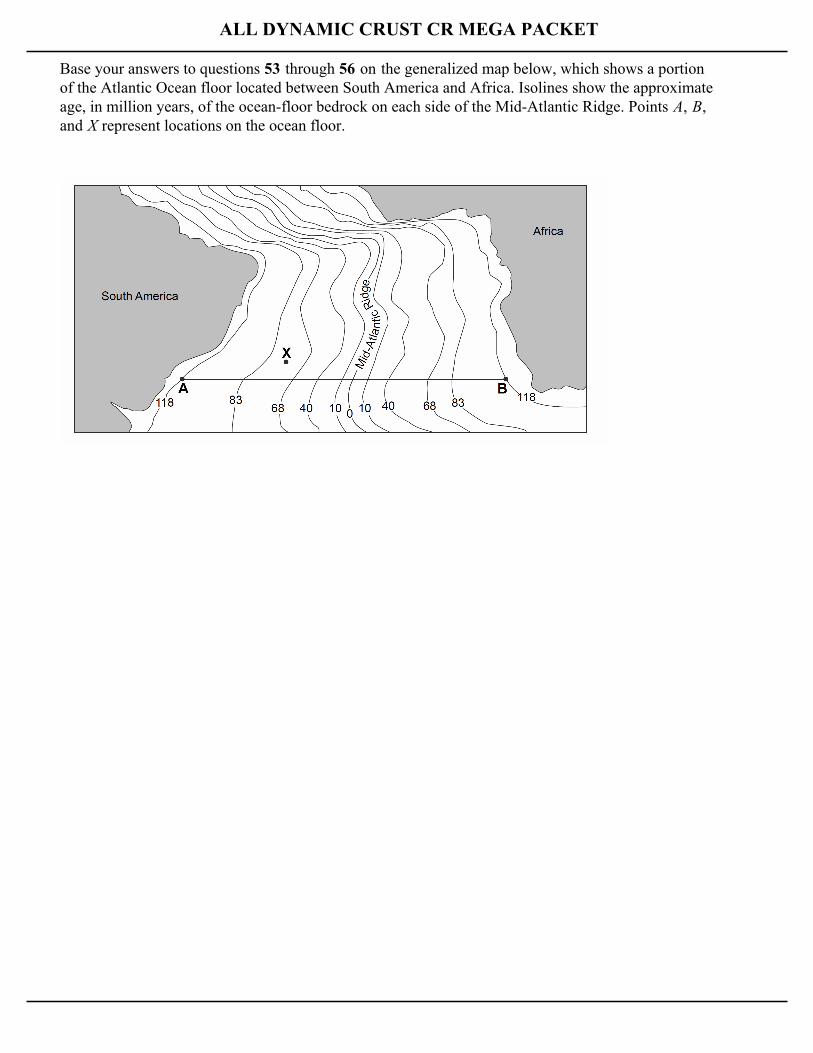
Base your answers to questions 53 through 56 on the generalized map below, which shows a portionof the Atlantic Ocean floor located between South America and Africa. Isolines show the approximateage, in million years, of the ocean-floor bedrock on each side of the Mid-Atlantic Ridge. Points A, B,and X represent locations on the ocean floor.
ALL DYNAMIC CRUST CR MEGA PACKET
53. The Mid-Atlantic Ridge separates pairs of crustal plates, such as the South American Plate and theAfrican Plate. Identify one other pair of crustal plates separated by the Mid-Atlantic Ridge.
54. Explain why the age of the ocean-floor bedrock increases as the distance from the Mid-AtlanticRidge increases.
55. Estimate the age of the ocean-floor bedrock at point X.
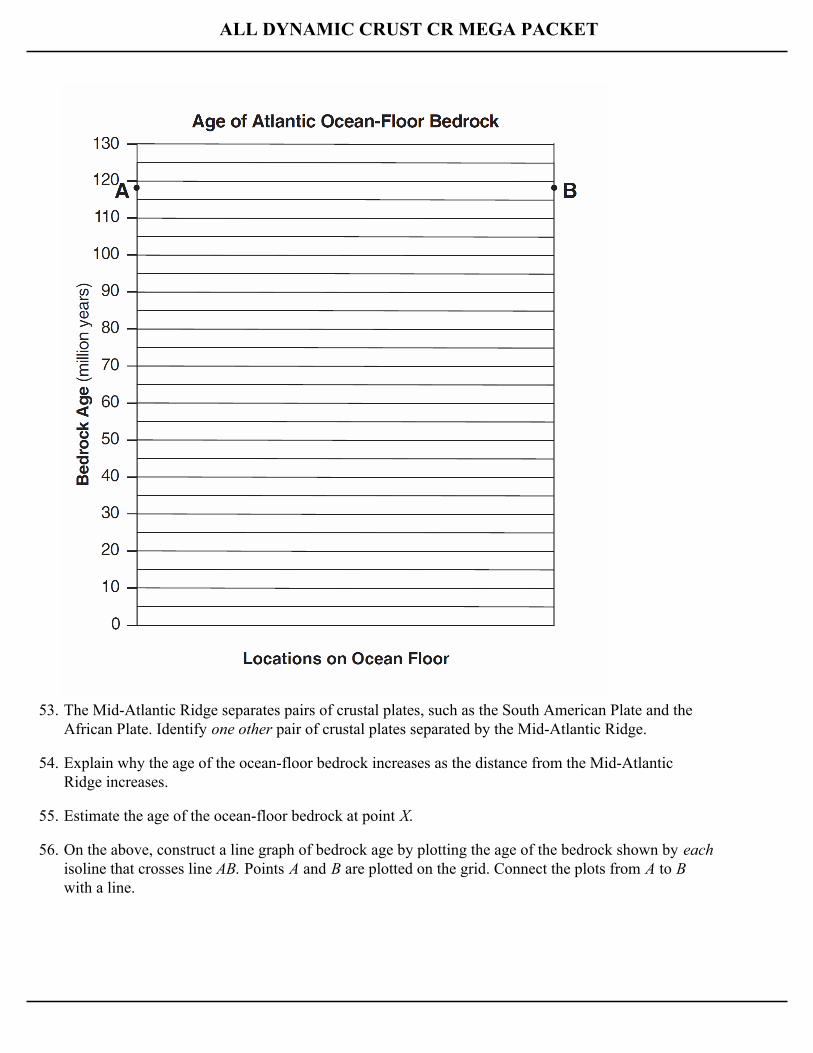
56. On the above, construct a line graph of bedrock age by plotting the age of the bedrock shown by eachisoline that crosses line AB. Points A and B are plotted on the grid. Connect the plots from A to B with a line.
ALL DYNAMIC CRUST CR MEGA PACKET
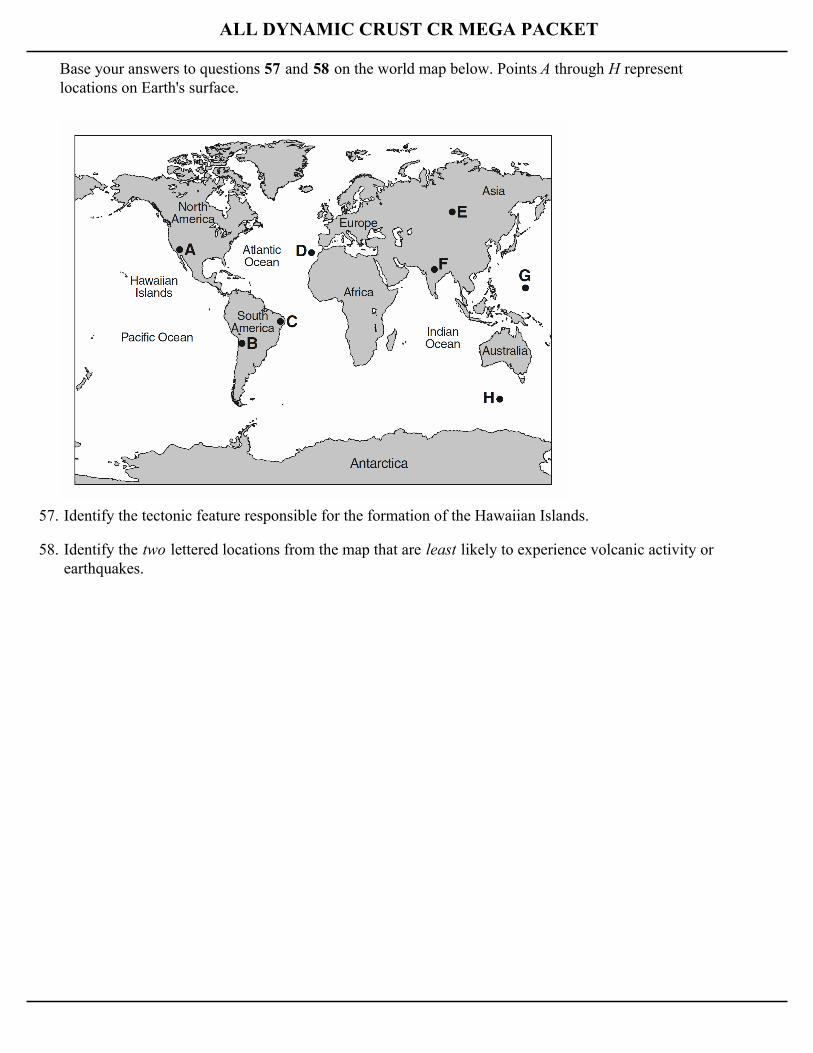
Base your answers to questions 57 and 58 on the world map below. Points A through H representlocations on Earth's surface.
57. Identify the tectonic feature responsible for the formation of the Hawaiian Islands.
58. Identify the two lettered locations from the map that are least likely to experience volcanic activity orearthquakes.
ALL DYNAMIC CRUST CR MEGA PACKET
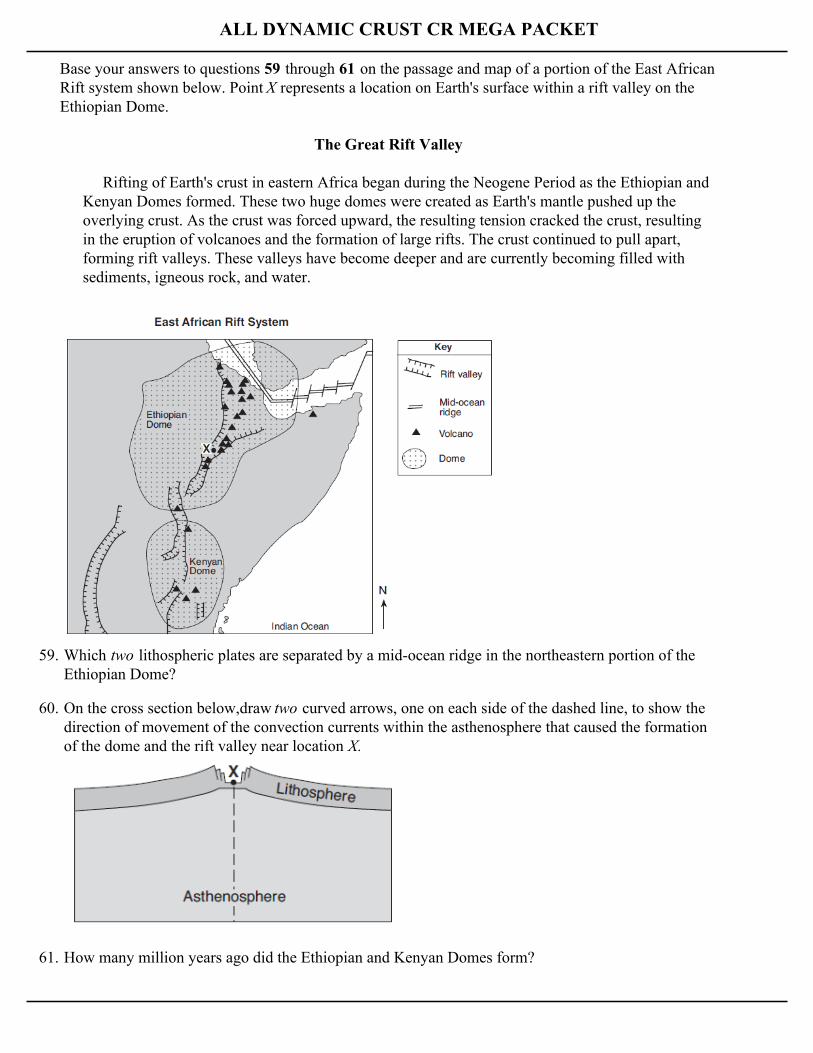
Base your answers to questions 59 through 61 on the passage and map of a portion of the East AfricanRift system shown below. Point X represents a location on Earth's surface within a rift valley on theEthiopian Dome.
The Great Rift Valley
Rifting of Earth's crust in eastern Africa began during the Neogene Period as the Ethiopian andKenyan Domes formed. These two huge domes were created as Earth's mantle pushed up theoverlying crust. As the crust was forced upward, the resulting tension cracked the crust, resultingin the eruption of volcanoes and the formation of large rifts. The crust continued to pull apart,forming rift valleys. These valleys have become deeper and are currently becoming filled withsediments, igneous rock, and water.
59. Which two lithospheric plates are separated by a mid-ocean ridge in the northeastern portion of theEthiopian Dome?
60. On the cross section below,draw two curved arrows, one on each side of the dashed line, to show thedirection of movement of the convection currents within the asthenosphere that caused the formationof the dome and the rift valley near location X.
61. How many million years ago did the Ethiopian and Kenyan Domes form?
ALL DYNAMIC CRUST CR MEGA PACKET
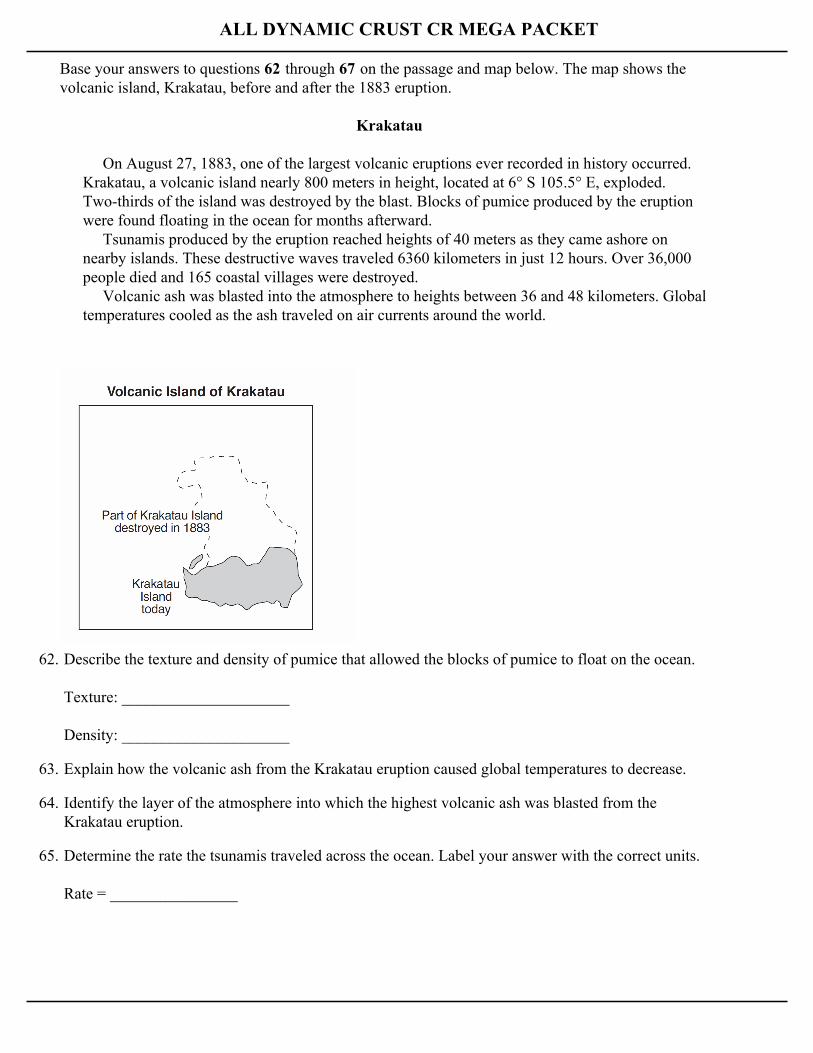
Base your answers to questions 62 through 67 on the passage and map below. The map shows thevolcanic island, Krakatau, before and after the 1883 eruption.
Krakatau
On August 27, 1883, one of the largest volcanic eruptions ever recorded in history occurred.Krakatau, a volcanic island nearly 800 meters in height, located at 6° S 105.5° E, exploded.Two-thirds of the island was destroyed by the blast. Blocks of pumice produced by the eruptionwere found floating in the ocean for months afterward. Tsunamis produced by the eruption reached heights of 40 meters as they came ashore onnearby islands. These destructive waves traveled 6360 kilometers in just 12 hours. Over 36,000people died and 165 coastal villages were destroyed. Volcanic ash was blasted into the atmosphere to heights between 36 and 48 kilometers. Globaltemperatures cooled as the ash traveled on air currents around the world.
62. Describe the texture and density of pumice that allowed the blocks of pumice to float on the ocean.
Texture: _____________________
Density: _____________________
63. Explain how the volcanic ash from the Krakatau eruption caused global temperatures to decrease.
64. Identify the layer of the atmosphere into which the highest volcanic ash was blasted from theKrakatau eruption.
65. Determine the rate the tsunamis traveled across the ocean. Label your answer with the correct units.
Rate = ________________
ALL DYNAMIC CRUST CR MEGA PACKET
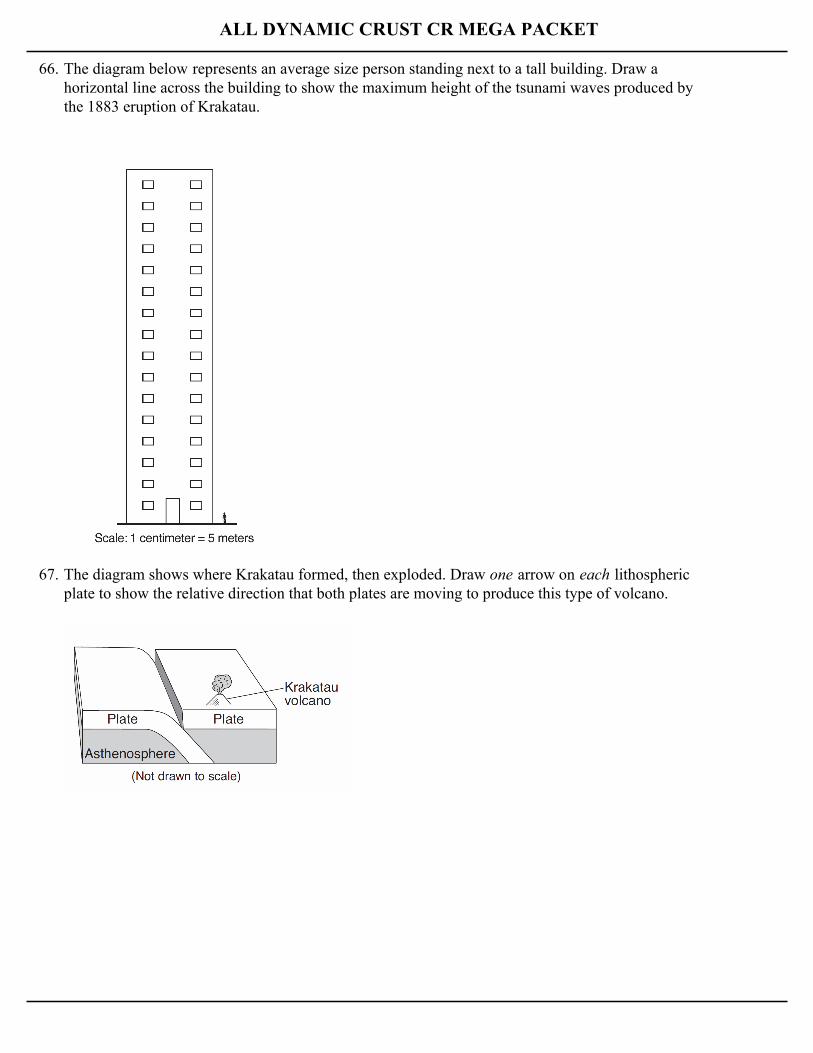
66. The diagram below represents an average size person standing next to a tall building. Draw ahorizontal line across the building to show the maximum height of the tsunami waves produced bythe 1883 eruption of Krakatau.
67. The diagram shows where Krakatau formed, then exploded. Draw one arrow on each lithosphericplate to show the relative direction that both plates are moving to produce this type of volcano.
ALL DYNAMIC CRUST CR MEGA PACKET
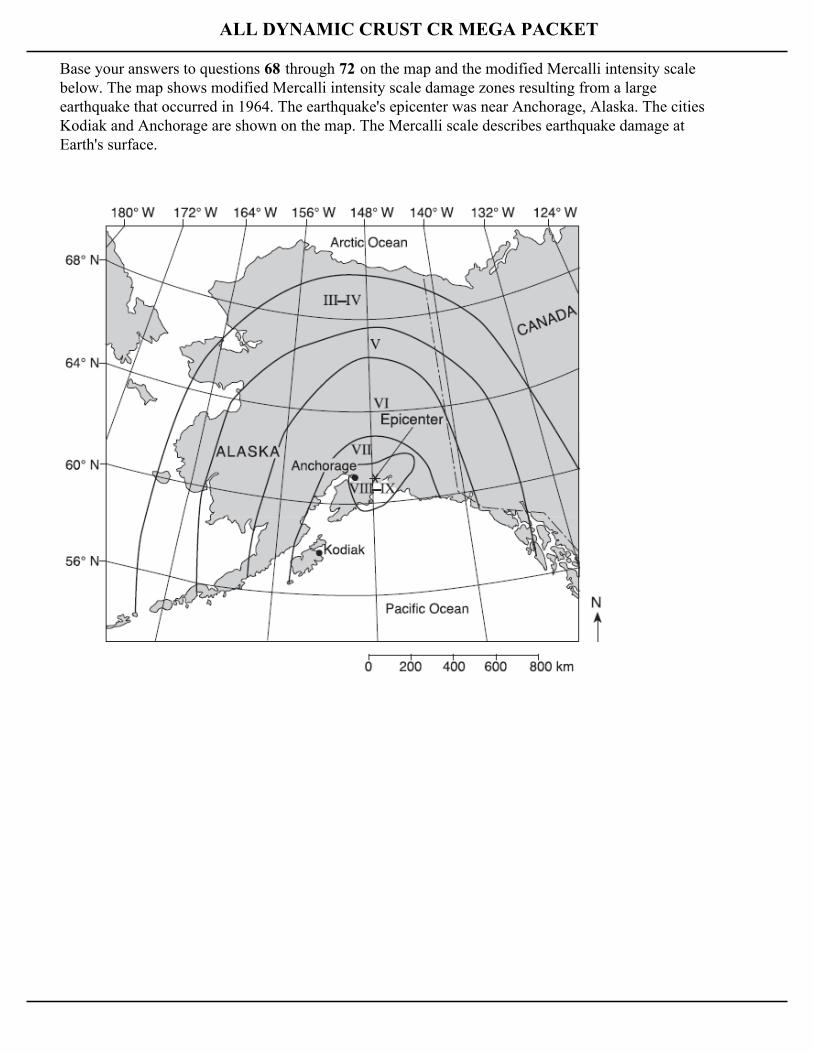
Base your answers to questions 68 through 72 on the map and the modified Mercalli intensity scalebelow. The map shows modified Mercalli intensity scale damage zones resulting from a largeearthquake that occurred in 1964. The earthquake's epicenter was near Anchorage, Alaska. The citiesKodiak and Anchorage are shown on the map. The Mercalli scale describes earthquake damage atEarth's surface.
ALL DYNAMIC CRUST CR MEGA PACKET
68. Determine the latitude and longitude of this epicenter. Include the units and compass directions inyour answer.
69. This earthquake produced a large ocean-floor displacement. Identify one dangerous geologic eventaffecting Pacific Ocean shorelines as a result of this ocean-floor displacement.
70. Explain why S-waves from this earthquake were not directly received on the oppositeside of Earth.
71. Write the name of the two converging tectonic plates that caused this earthquake
72. Describe one type of damage that occurred in Anchorage but not in Kodiak.
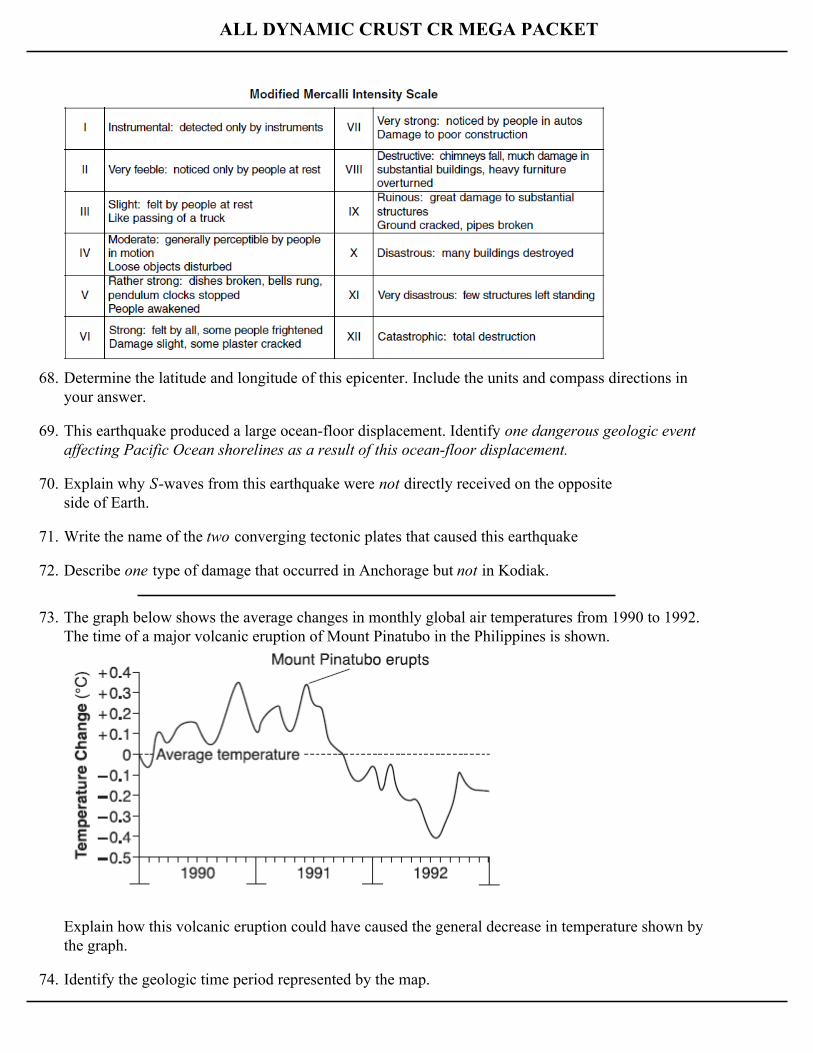
73. The graph below shows the average changes in monthly global air temperatures from 1990 to 1992.The time of a major volcanic eruption of Mount Pinatubo in the Philippines is shown.
Explain how this volcanic eruption could have caused the general decrease in temperature shown bythe graph.
74. Identify the geologic time period represented by the map.
ALL DYNAMIC CRUST CR MEGA PACKET
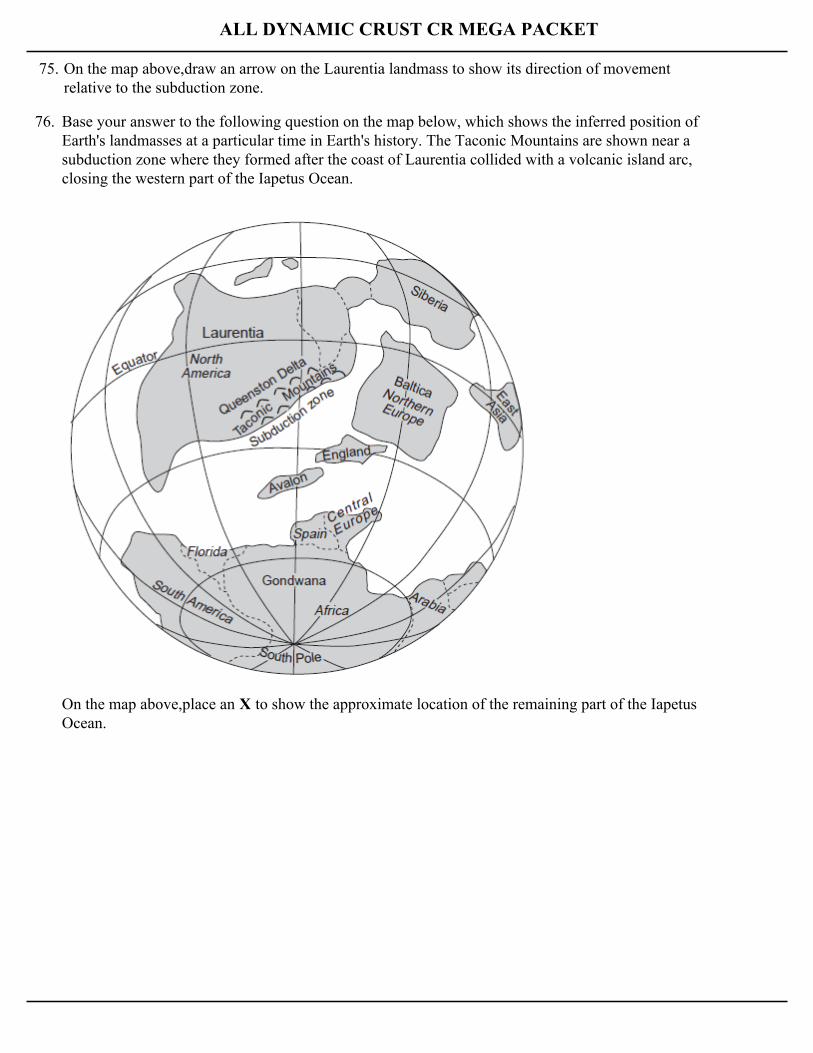
75. On the map above,draw an arrow on the Laurentia landmass to show its direction of movementrelative to the subduction zone.
76. Base your answer to the following question on the map below, which shows the inferred position ofEarth's landmasses at a particular time in Earth's history. The Taconic Mountains are shown near asubduction zone where they formed after the coast of Laurentia collided with a volcanic island arc,closing the western part of the Iapetus Ocean.
On the map above,place an X to show the approximate location of the remaining part of the IapetusOcean.
ALL DYNAMIC CRUST CR MEGA PACKET
Base your answers to questions 77 through 79 on on the passage and diagram below.
Siccar Point
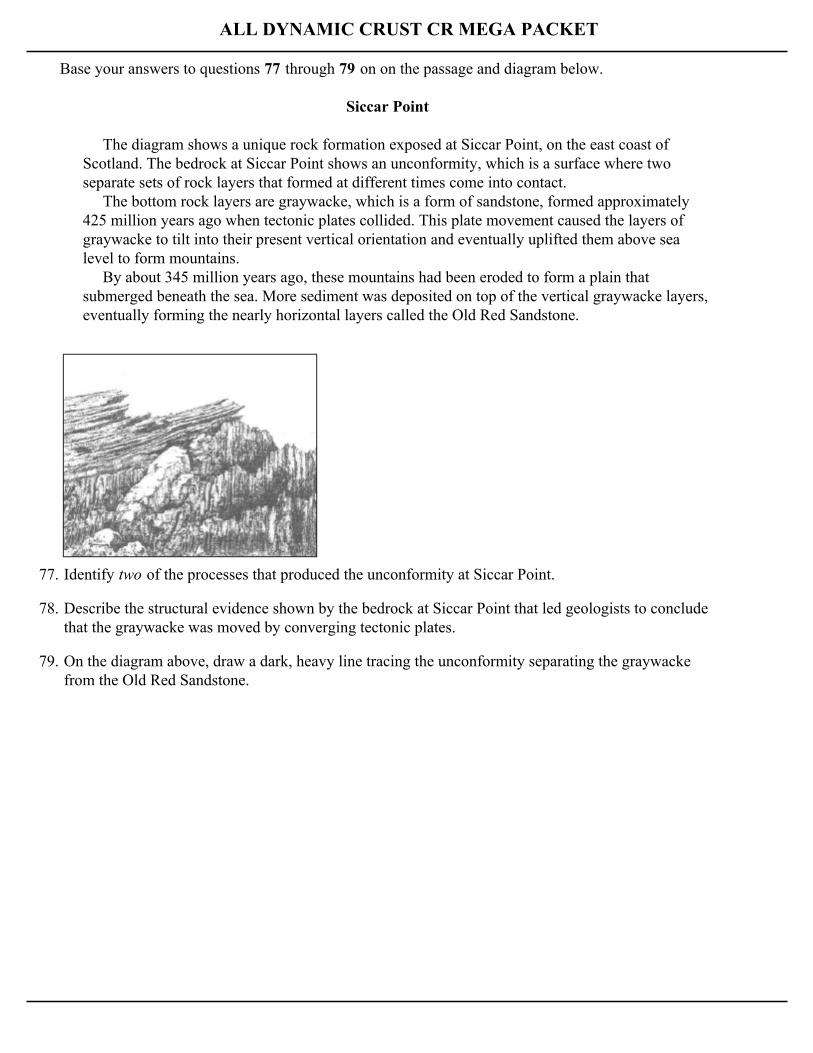
The diagram shows a unique rock formation exposed at Siccar Point, on the east coast ofScotland. The bedrock at Siccar Point shows an unconformity, which is a surface where twoseparate sets of rock layers that formed at different times come into contact. The bottom rock layers are graywacke, which is a form of sandstone, formed approximately425 million years ago when tectonic plates collided. This plate movement caused the layers ofgraywacke to tilt into their present vertical orientation and eventually uplifted them above sealevel to form mountains. By about 345 million years ago, these mountains had been eroded to form a plain thatsubmerged beneath the sea. More sediment was deposited on top of the vertical graywacke layers,eventually forming the nearly horizontal layers called the Old Red Sandstone.
77. Identify two of the processes that produced the unconformity at Siccar Point.
78. Describe the structural evidence shown by the bedrock at Siccar Point that led geologists to concludethat the graywacke was moved by converging tectonic plates.
79. On the diagram above, draw a dark, heavy line tracing the unconformity separating the graywackefrom the Old Red Sandstone.

ALL DYNAMIC CRUST CR MEGA PACKET
Base your answers to questions 80 through 82 on on the diagram below, which shows a seismograph that recorded seismic waves from an earthquakelocated 4000 kilometers from this seismic station.
80. How long does the first S-wave take to travel from the earthquake epicenter to this seismograph?
81. Which type of seismic wave was recorded first on the rotating drum?
82. State one possible cause of the earthquake that resulted in the movement of the bedrock detected bythis seismograph.
ALL DYNAMIC CRUST CR MEGA PACKET
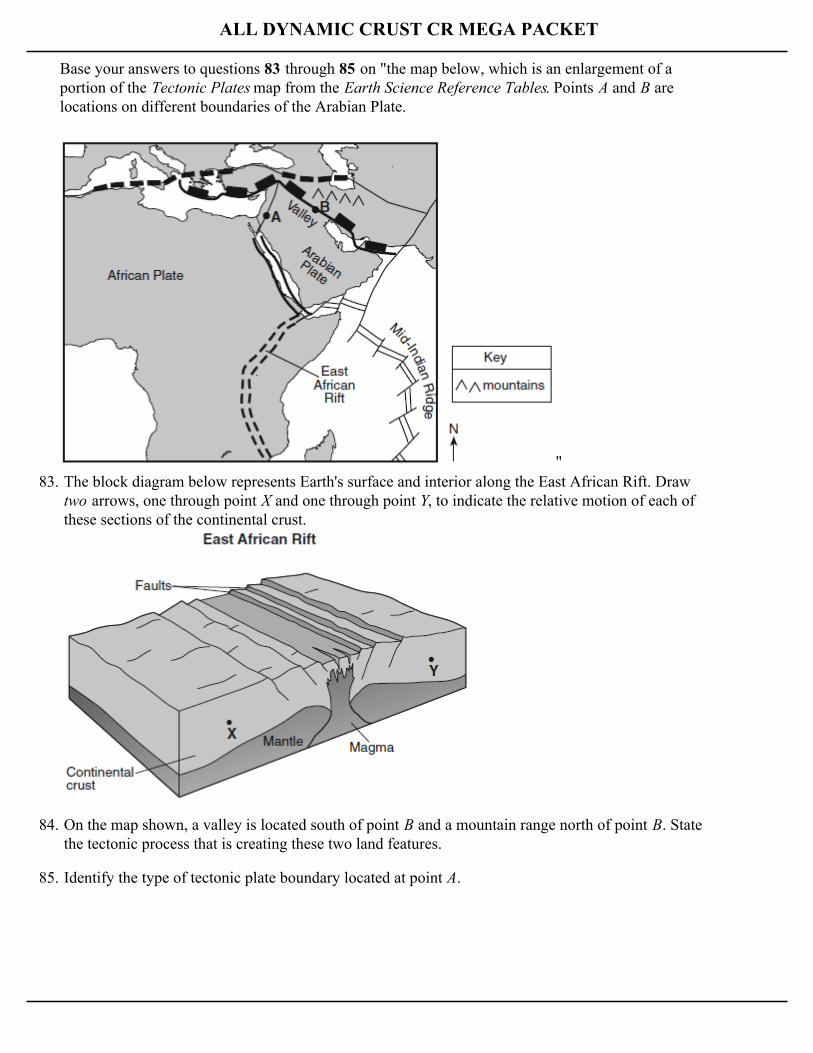
Base your answers to questions 83 through 85 on "the map below, which is an enlargement of aportion of the Tectonic Plates map from the Earth Science Reference Tables. Points A and B arelocations on different boundaries of the Arabian Plate.
"83. The block diagram below represents Earth's surface and interior along the East African Rift. Draw
two arrows, one through point X and one through point Y, to indicate the relative motion of each ofthese sections of the continental crust.
84. On the map shown, a valley is located south of point B and a mountain range north of point B. Statethe tectonic process that is creating these two land features.
85. Identify the type of tectonic plate boundary located at point A.
ALL DYNAMIC CRUST CR MEGA PACKET
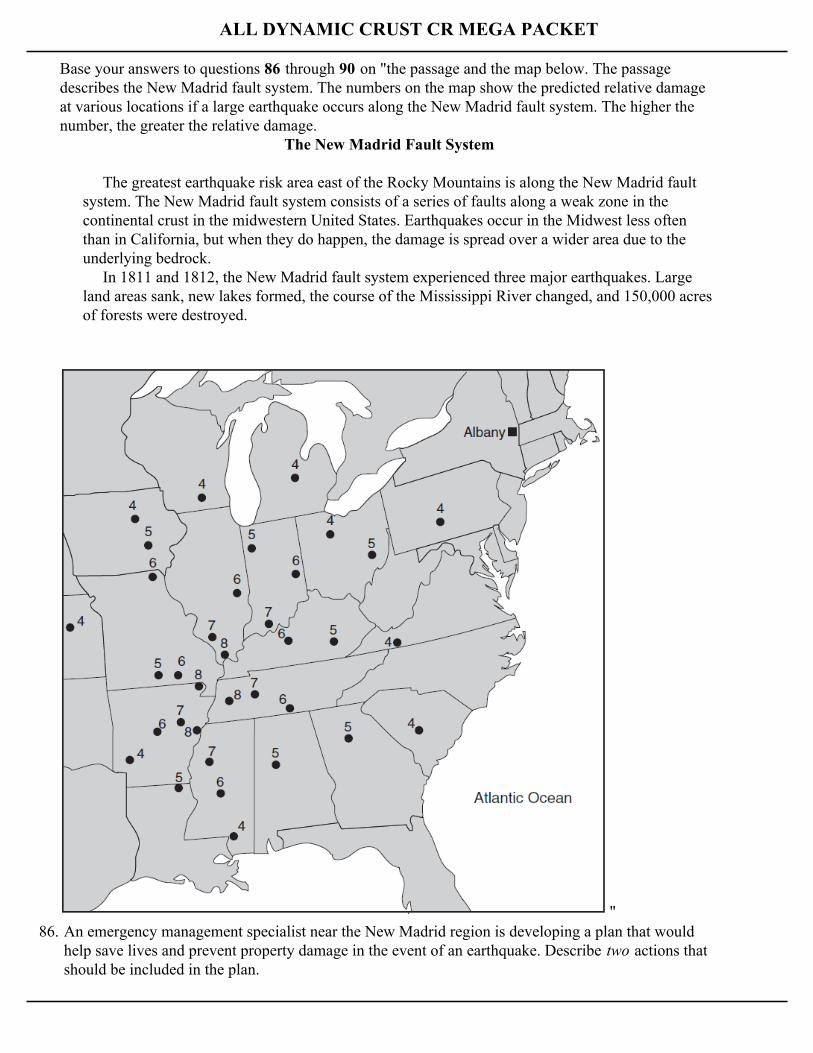
Base your answers to questions 86 through 90 on "the passage and the map below. The passagedescribes the New Madrid fault system. The numbers on the map show the predicted relative damageat various locations if a large earthquake occurs along the New Madrid fault system. The higher thenumber, the greater the relative damage.
The New Madrid Fault System
The greatest earthquake risk area east of the Rocky Mountains is along the New Madrid faultsystem. The New Madrid fault system consists of a series of faults along a weak zone in thecontinental crust in the midwestern United States. Earthquakes occur in the Midwest less oftenthan in California, but when they do happen, the damage is spread over a wider area due to theunderlying bedrock. In 1811 and 1812, the New Madrid fault system experienced three major earthquakes. Largeland areas sank, new lakes formed, the course of the Mississippi River changed, and 150,000 acresof forests were destroyed.
"86. An emergency management specialist near the New Madrid region is developing a plan that would
help save lives and prevent property damage in the event of an earthquake. Describe two actions thatshould be included in the plan.
ALL DYNAMIC CRUST CR MEGA PACKET
87. State one reason why earthquakes occur more frequently on the western coast of the United Statesthan in the New Madrid region.
88. The distance between the New Madrid fault system and Albany, New York, is 1800 kilometers. Whatwas the time difference between the arrival of the first P-wave and the arrival of the first S-wave atAlbany when the 1812 earthquake occurred?
89. Using the predicted damage numbers, place an X on the map to indicate where the New Madrid faultsystem most likely exists.
90. On the map above, draw the 4, 6, and 8 isolines indicating relative damage.
ALL DYNAMIC CRUST CR MEGA PACKET
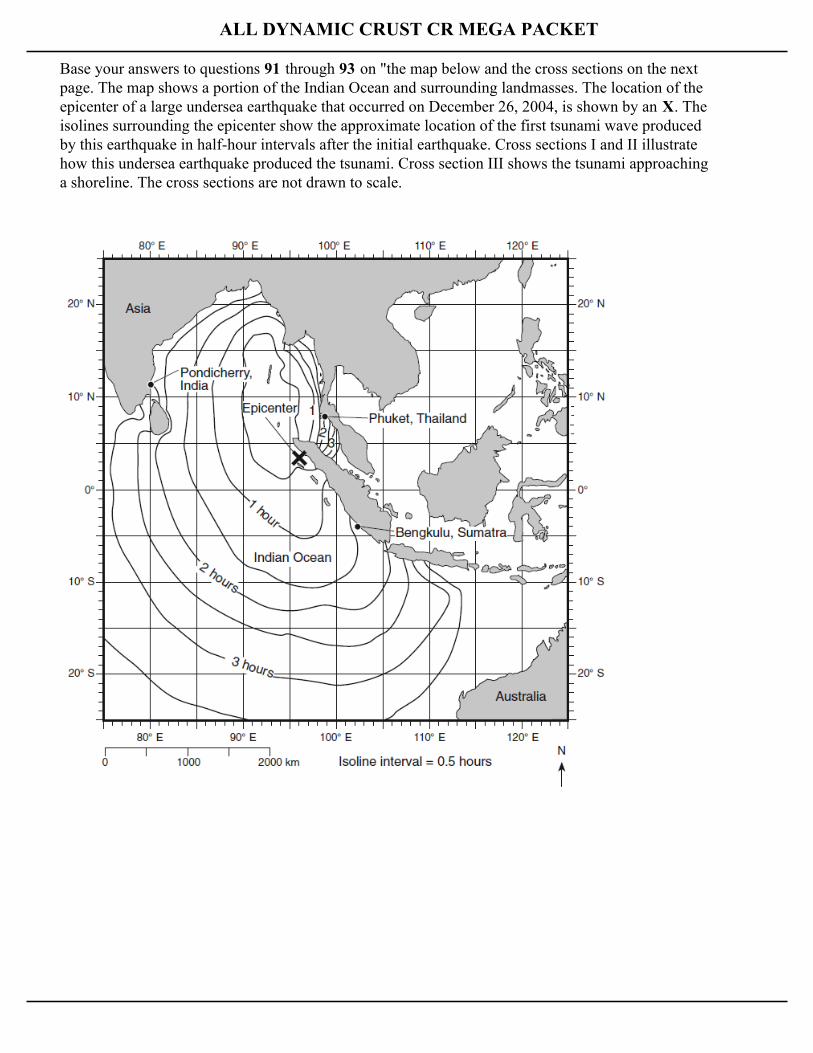
Base your answers to questions 91 through 93 on "the map below and the cross sections on the nextpage. The map shows a portion of the Indian Ocean and surrounding landmasses. The location of theepicenter of a large undersea earthquake that occurred on December 26, 2004, is shown by an X. Theisolines surrounding the epicenter show the approximate location of the first tsunami wave producedby this earthquake in half-hour intervals after the initial earthquake. Cross sections I and II illustratehow this undersea earthquake produced the tsunami. Cross section III shows the tsunami approachinga shoreline. The cross sections are not drawn to scale.
ALL DYNAMIC CRUST CR MEGA PACKET
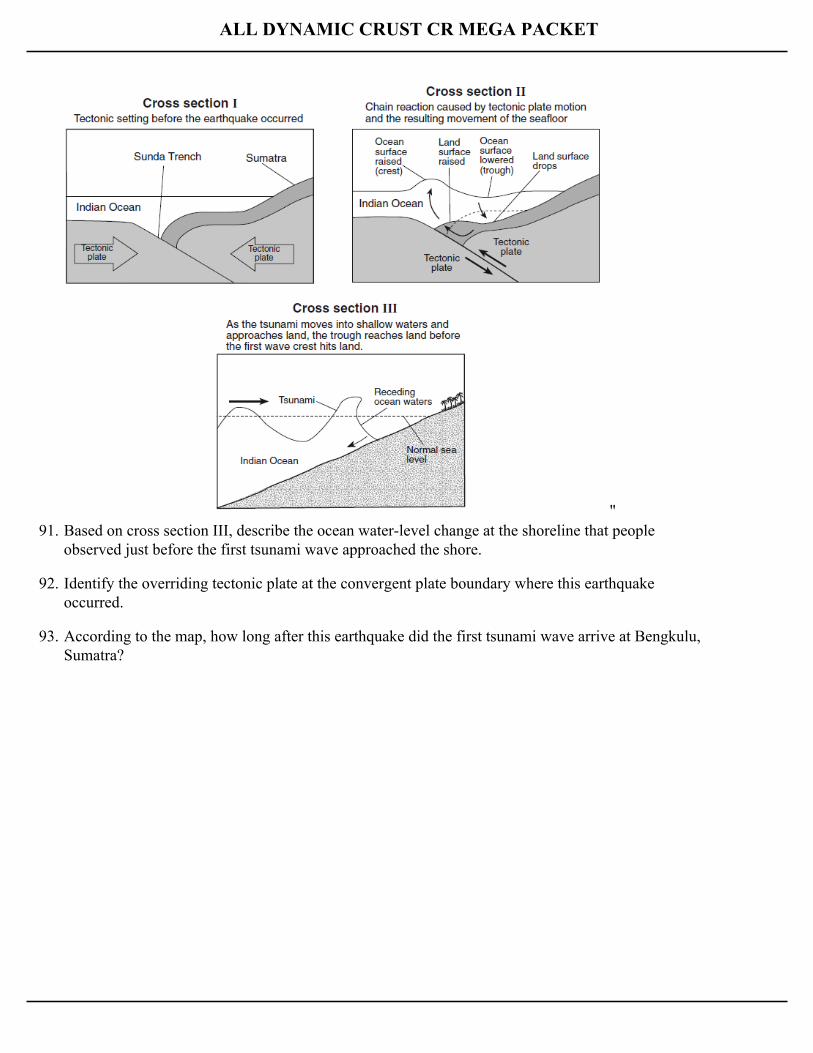
"91. Based on cross section III, describe the ocean water-level change at the shoreline that people
observed just before the first tsunami wave approached the shore.
92. Identify the overriding tectonic plate at the convergent plate boundary where this earthquakeoccurred.
93. According to the map, how long after this earthquake did the first tsunami wave arrive at Bengkulu,Sumatra?
ALL DYNAMIC CRUST CR MEGA PACKET
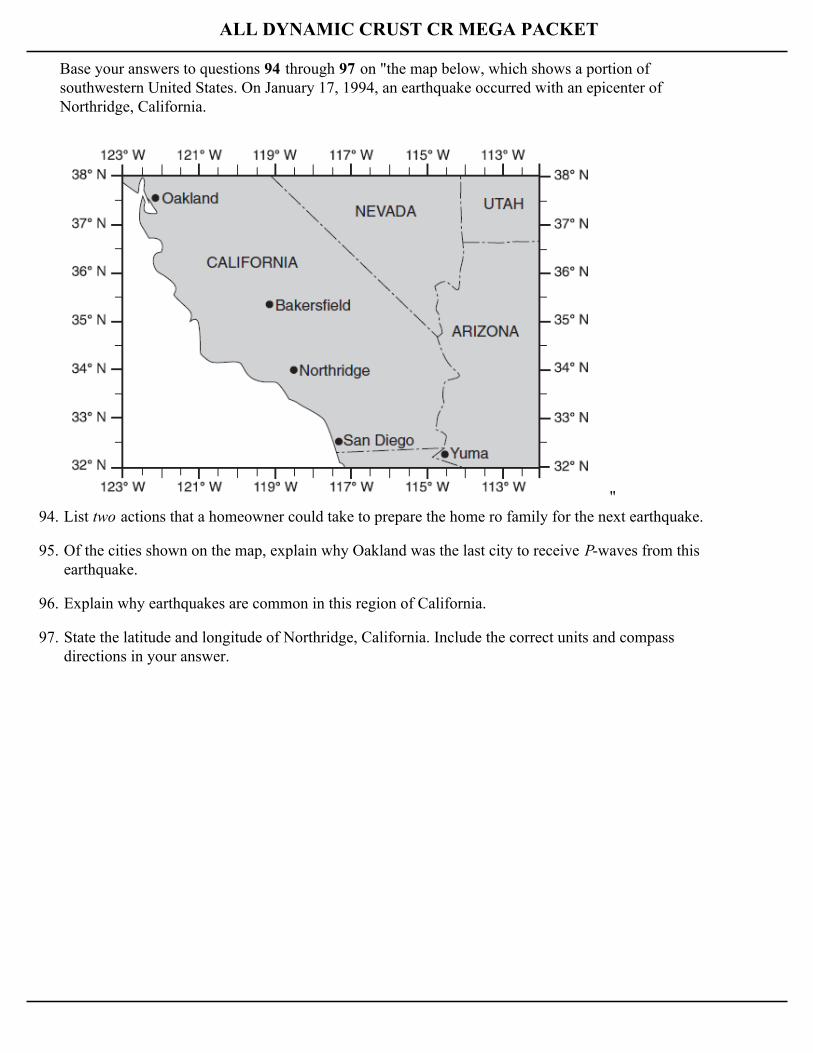
Base your answers to questions 94 through 97 on "the map below, which shows a portion ofsouthwestern United States. On January 17, 1994, an earthquake occurred with an epicenter ofNorthridge, California.
"94. List two actions that a homeowner could take to prepare the home ro family for the next earthquake.
95. Of the cities shown on the map, explain why Oakland was the last city to receive P-waves from thisearthquake.
96. Explain why earthquakes are common in this region of California.
97. State the latitude and longitude of Northridge, California. Include the correct units and compassdirections in your answer.
ALL DYNAMIC CRUST CR MEGA PACKET
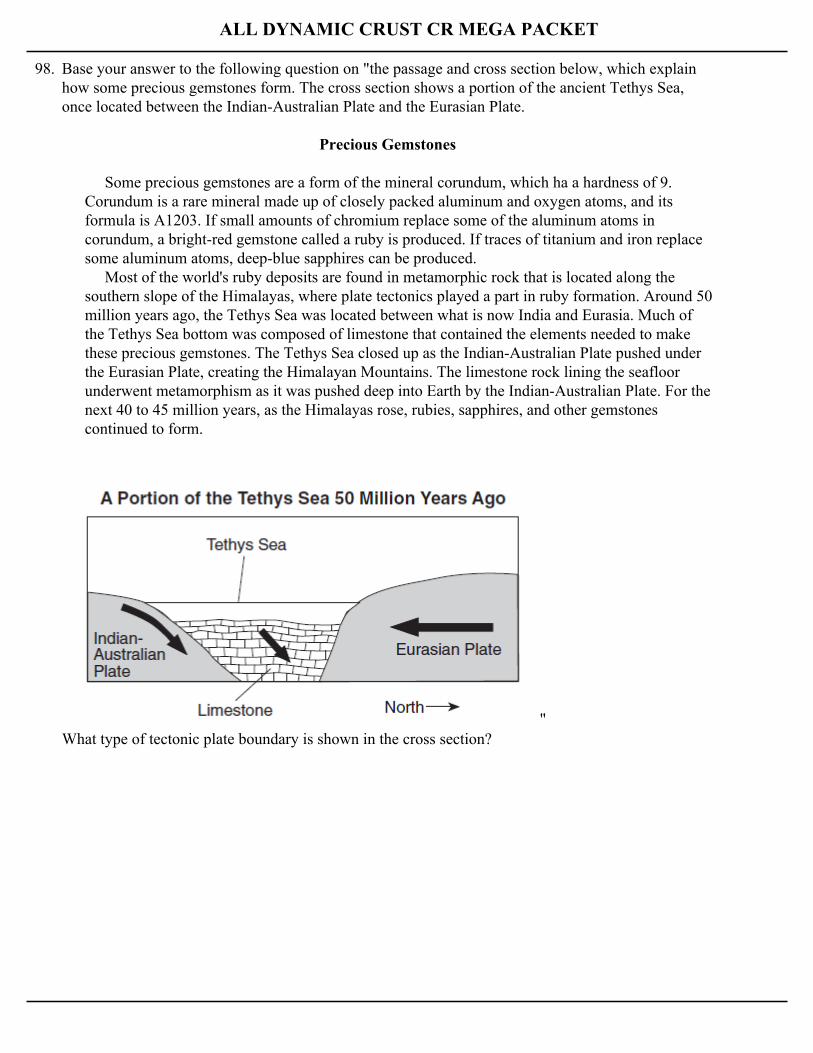
98. Base your answer to the following question on "the passage and cross section below, which explainhow some precious gemstones form. The cross section shows a portion of the ancient Tethys Sea,once located between the Indian-Australian Plate and the Eurasian Plate.
Precious Gemstones
Some precious gemstones are a form of the mineral corundum, which ha a hardness of 9.Corundum is a rare mineral made up of closely packed aluminum and oxygen atoms, and itsformula is A1203. If small amounts of chromium replace some of the aluminum atoms incorundum, a bright-red gemstone called a ruby is produced. If traces of titanium and iron replacesome aluminum atoms, deep-blue sapphires can be produced. Most of the world's ruby deposits are found in metamorphic rock that is located along thesouthern slope of the Himalayas, where plate tectonics played a part in ruby formation. Around 50million years ago, the Tethys Sea was located between what is now India and Eurasia. Much ofthe Tethys Sea bottom was composed of limestone that contained the elements needed to makethese precious gemstones. The Tethys Sea closed up as the Indian-Australian Plate pushed underthe Eurasian Plate, creating the Himalayan Mountains. The limestone rock lining the seafloorunderwent metamorphism as it was pushed deep into Earth by the Indian-Australian Plate. For thenext 40 to 45 million years, as the Himalayas rose, rubies, sapphires, and other gemstonescontinued to form.
"What type of tectonic plate boundary is shown in the cross section?
ALL DYNAMIC CRUST CR MEGA PACKET
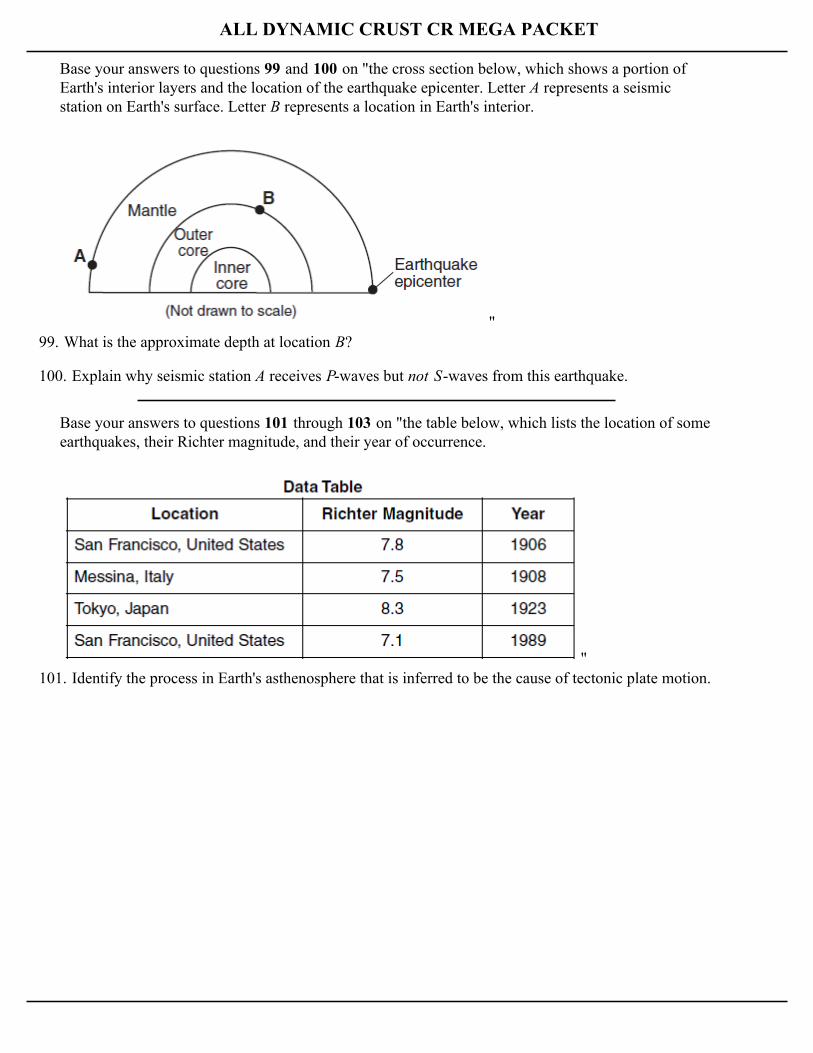
Base your answers to questions 99 and 100 on "the cross section below, which shows a portion ofEarth's interior layers and the location of the earthquake epicenter. Letter A represents a seismicstation on Earth's surface. Letter B represents a location in Earth's interior.
"99. What is the approximate depth at location B?
100. Explain why seismic station A receives P-waves but not S-waves from this earthquake.
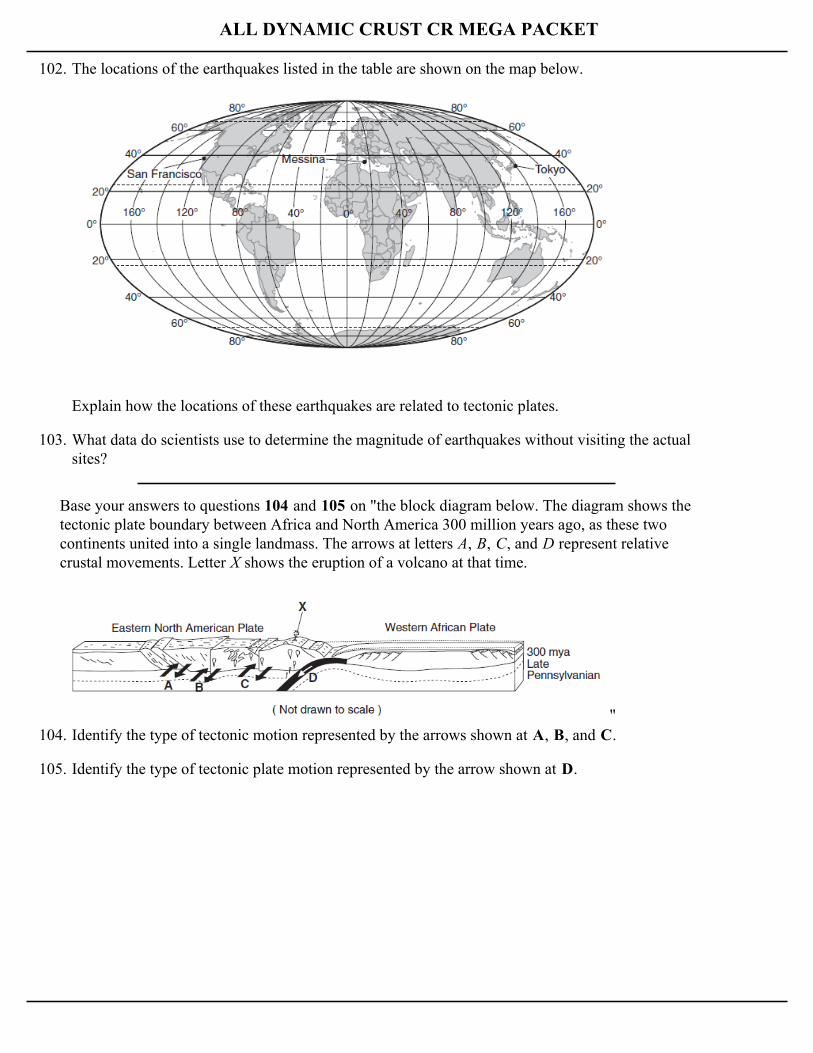
Base your answers to questions 101 through 103 on "the table below, which lists the location of someearthquakes, their Richter magnitude, and their year of occurrence.
"101. Identify the process in Earth's asthenosphere that is inferred to be the cause of tectonic plate motion.
ALL DYNAMIC CRUST CR MEGA PACKET
102. The locations of the earthquakes listed in the table are shown on the map below.
Explain how the locations of these earthquakes are related to tectonic plates.
103. What data do scientists use to determine the magnitude of earthquakes without visiting the actualsites?
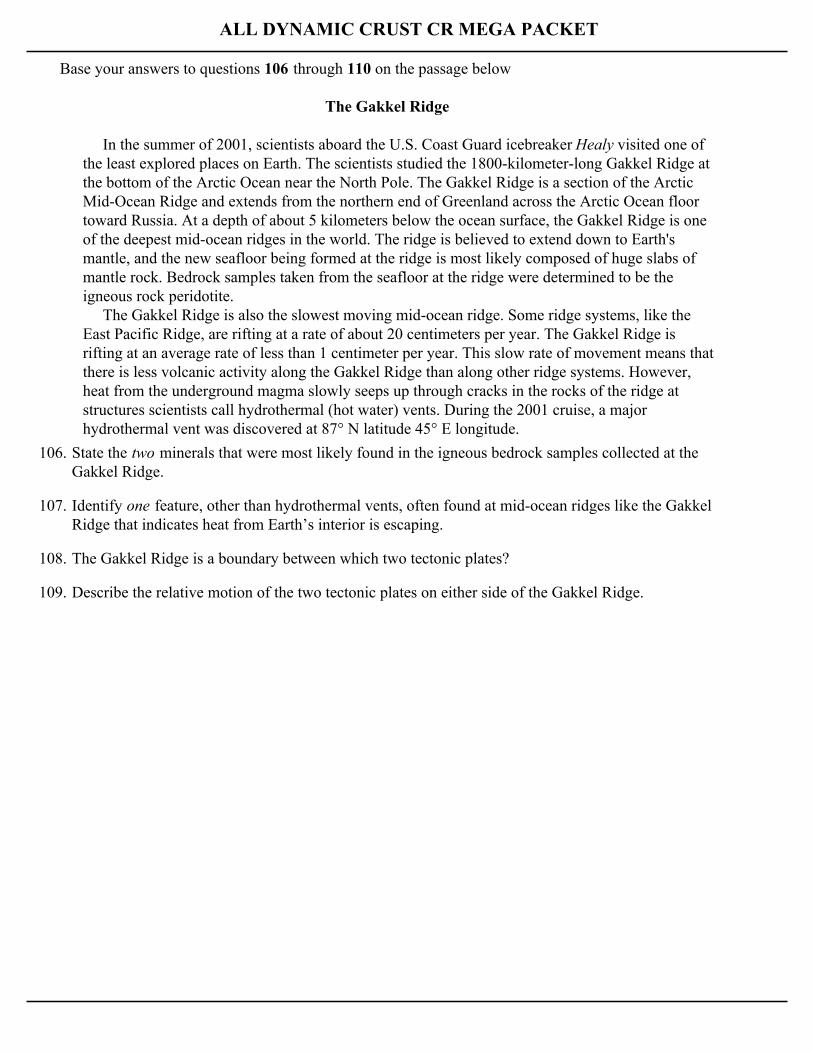
Base your answers to questions 104 and 105 on "the block diagram below. The diagram shows thetectonic plate boundary between Africa and North America 300 million years ago, as these twocontinents united into a single landmass. The arrows at letters A, B, C, and D represent relativecrustal movements. Letter X shows the eruption of a volcano at that time.
"104. Identify the type of tectonic motion represented by the arrows shown at A, B, and C.
105. Identify the type of tectonic plate motion represented by the arrow shown at D.
ALL DYNAMIC CRUST CR MEGA PACKET
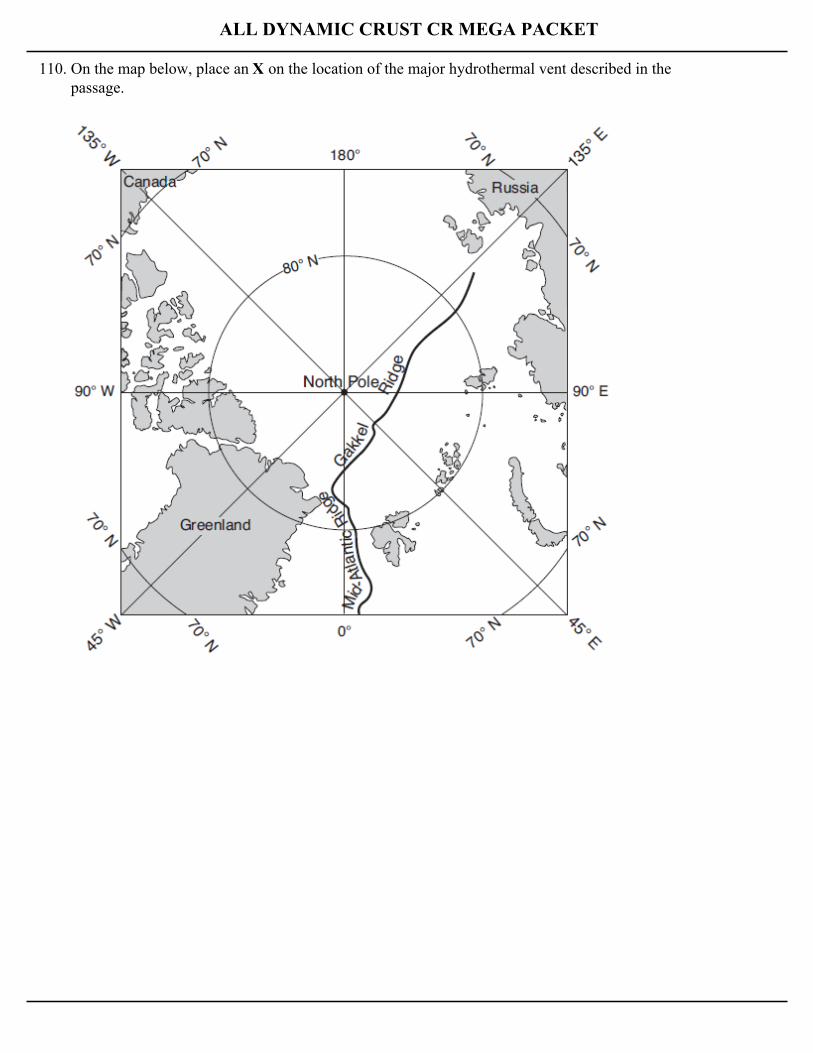
Base your answers to questions 106 through 110 on the passage below
The Gakkel Ridge
In the summer of 2001, scientists aboard the U.S. Coast Guard icebreaker Healy visited one ofthe least explored places on Earth. The scientists studied the 1800-kilometer-long Gakkel Ridge atthe bottom of the Arctic Ocean near the North Pole. The Gakkel Ridge is a section of the ArcticMid-Ocean Ridge and extends from the northern end of Greenland across the Arctic Ocean floortoward Russia. At a depth of about 5 kilometers below the ocean surface, the Gakkel Ridge is oneof the deepest mid-ocean ridges in the world. The ridge is believed to extend down to Earth'smantle, and the new seafloor being formed at the ridge is most likely composed of huge slabs ofmantle rock. Bedrock samples taken from the seafloor at the ridge were determined to be theigneous rock peridotite. The Gakkel Ridge is also the slowest moving mid-ocean ridge. Some ridge systems, like theEast Pacific Ridge, are rifting at a rate of about 20 centimeters per year. The Gakkel Ridge isrifting at an average rate of less than 1 centimeter per year. This slow rate of movement means thatthere is less volcanic activity along the Gakkel Ridge than along other ridge systems. However,heat from the underground magma slowly seeps up through cracks in the rocks of the ridge atstructures scientists call hydrothermal (hot water) vents. During the 2001 cruise, a majorhydrothermal vent was discovered at 87° N latitude 45° E longitude.
106. State the two minerals that were most likely found in the igneous bedrock samples collected at theGakkel Ridge.
107. Identify one feature, other than hydrothermal vents, often found at mid-ocean ridges like the GakkelRidge that indicates heat from Earth’s interior is escaping.
108. The Gakkel Ridge is a boundary between which two tectonic plates?
109. Describe the relative motion of the two tectonic plates on either side of the Gakkel Ridge.
ALL DYNAMIC CRUST CR MEGA PACKET
110. On the map below, place an X on the location of the major hydrothermal vent described in thepassage.
ALL DYNAMIC CRUST CR MEGA PACKET
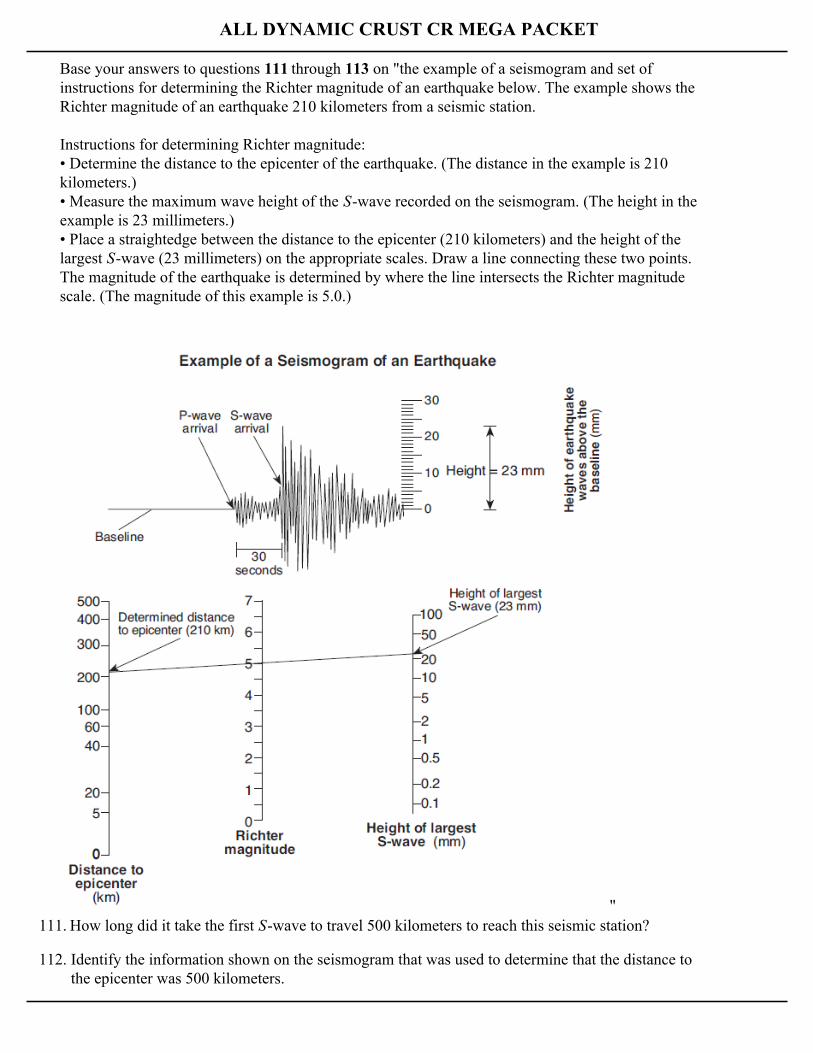
Base your answers to questions 111 through 113 on "the example of a seismogram and set ofinstructions for determining the Richter magnitude of an earthquake below. The example shows theRichter magnitude of an earthquake 210 kilometers from a seismic station.
Instructions for determining Richter magnitude:• Determine the distance to the epicenter of the earthquake. (The distance in the example is 210kilometers.)• Measure the maximum wave height of the S-wave recorded on the seismogram. (The height in theexample is 23 millimeters.)• Place a straightedge between the distance to the epicenter (210 kilometers) and the height of thelargest S-wave (23 millimeters) on the appropriate scales. Draw a line connecting these two points.The magnitude of the earthquake is determined by where the line intersects the Richter magnitudescale. (The magnitude of this example is 5.0.)
"111. How long did it take the first S-wave to travel 500 kilometers to reach this seismic station?
112. Identify the information shown on the seismogram that was used to determine that the distance tothe epicenter was 500 kilometers.
ALL DYNAMIC CRUST CR MEGA PACKET
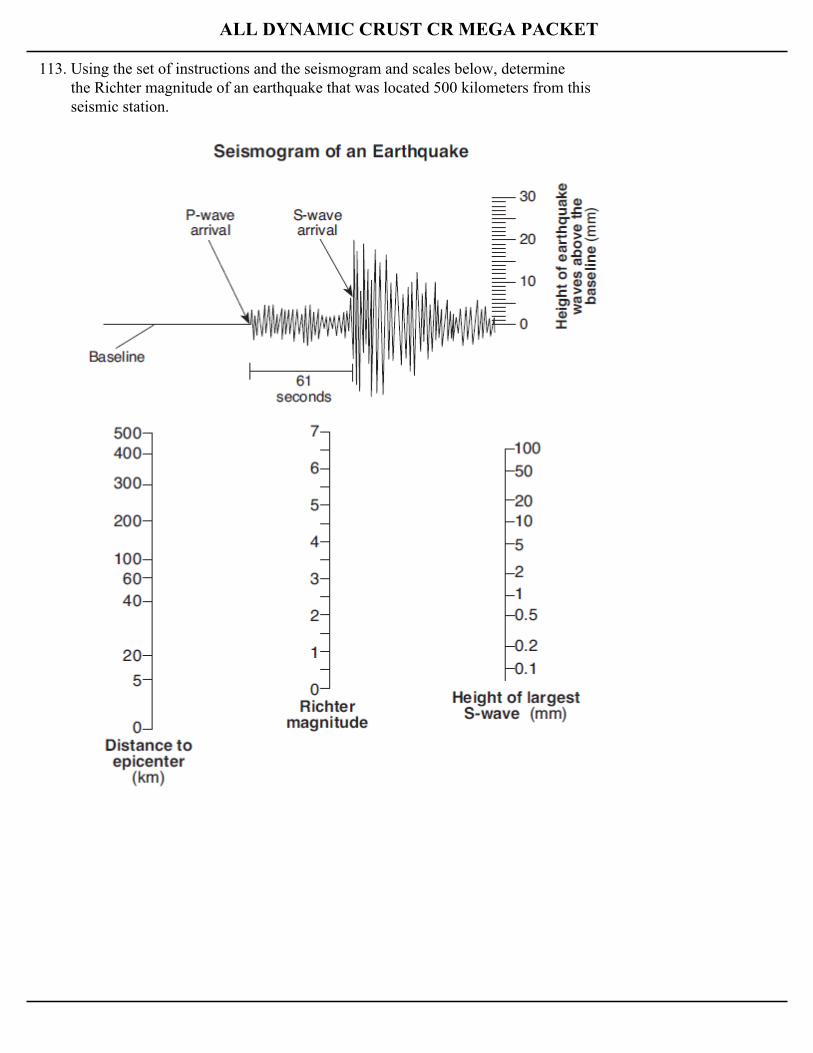
113. Using the set of instructions and the seismogram and scales below, determinethe Richter magnitude of an earthquake that was located 500 kilometers from thisseismic station.
ALL DYNAMIC CRUST CR MEGA PACKET
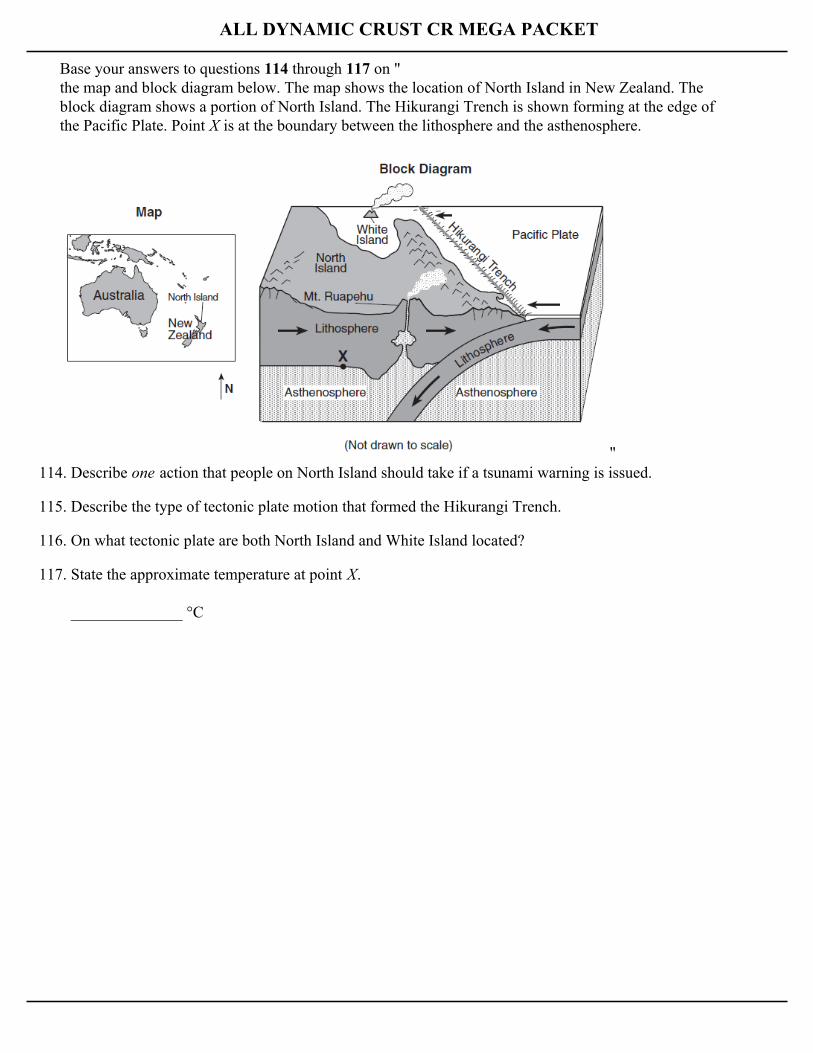
Base your answers to questions 114 through 117 on "the map and block diagram below. The map shows the location of North Island in New Zealand. Theblock diagram shows a portion of North Island. The Hikurangi Trench is shown forming at the edge ofthe Pacific Plate. Point X is at the boundary between the lithosphere and the asthenosphere.
"114. Describe one action that people on North Island should take if a tsunami warning is issued.
115. Describe the type of tectonic plate motion that formed the Hikurangi Trench.
116. On what tectonic plate are both North Island and White Island located?
117. State the approximate temperature at point X.
______________ °C
ALL DYNAMIC CRUST CR MEGA PACKET
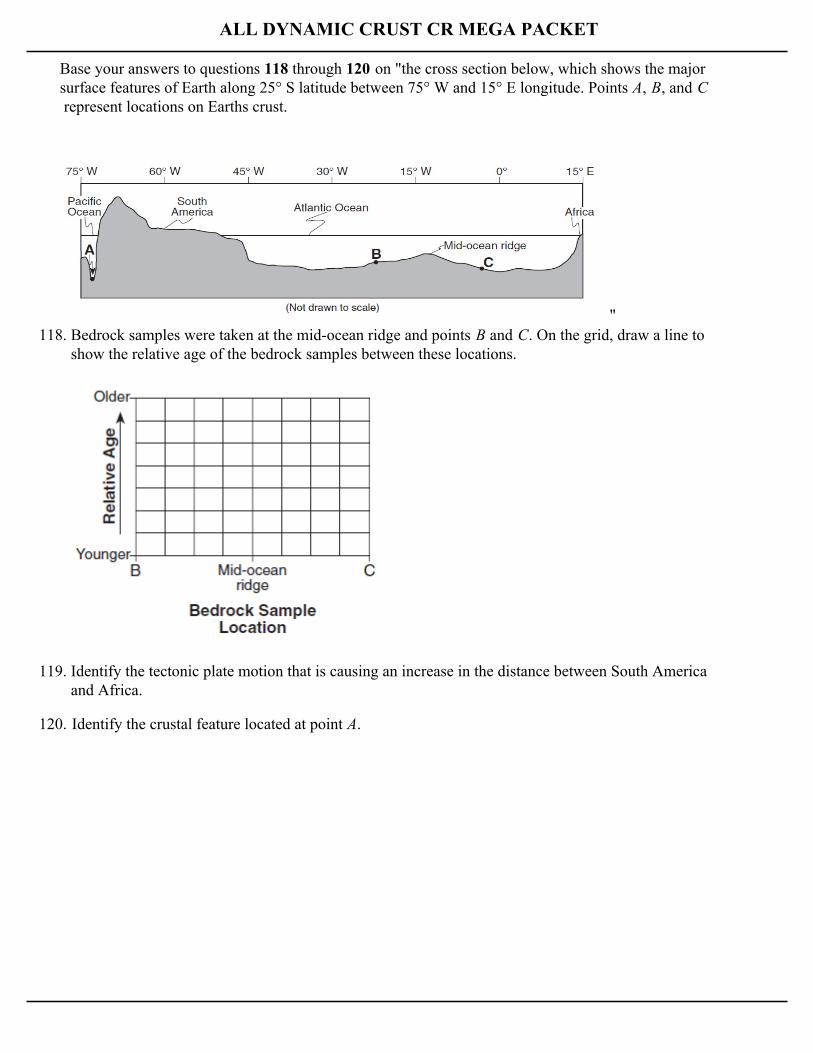
Base your answers to questions 118 through 120 on "the cross section below, which shows the majorsurface features of Earth along 25° S latitude between 75° W and 15° E longitude. Points A, B, and C represent locations on Earths crust.
"118. Bedrock samples were taken at the mid-ocean ridge and points B and C. On the grid, draw a line to
show the relative age of the bedrock samples between these locations.
119. Identify the tectonic plate motion that is causing an increase in the distance between South Americaand Africa.
120. Identify the crustal feature located at point A.
ALL DYNAMIC CRUST CR MEGA PACKET
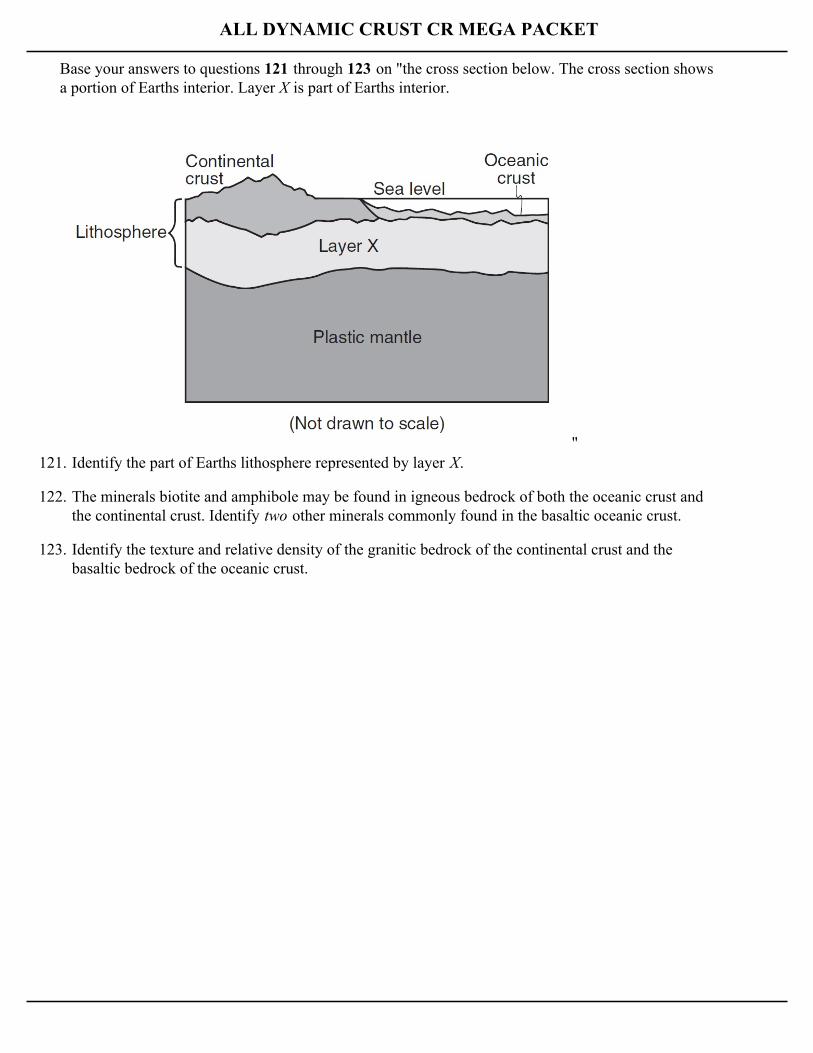
Base your answers to questions 121 through 123 on "the cross section below. The cross section showsa portion of Earths interior. Layer X is part of Earths interior.
"121. Identify the part of Earths lithosphere represented by layer X.
122. The minerals biotite and amphibole may be found in igneous bedrock of both the oceanic crust andthe continental crust. Identify two other minerals commonly found in the basaltic oceanic crust.
123. Identify the texture and relative density of the granitic bedrock of the continental crust and thebasaltic bedrock of the oceanic crust.
ALL DYNAMIC CRUST CR MEGA PACKET
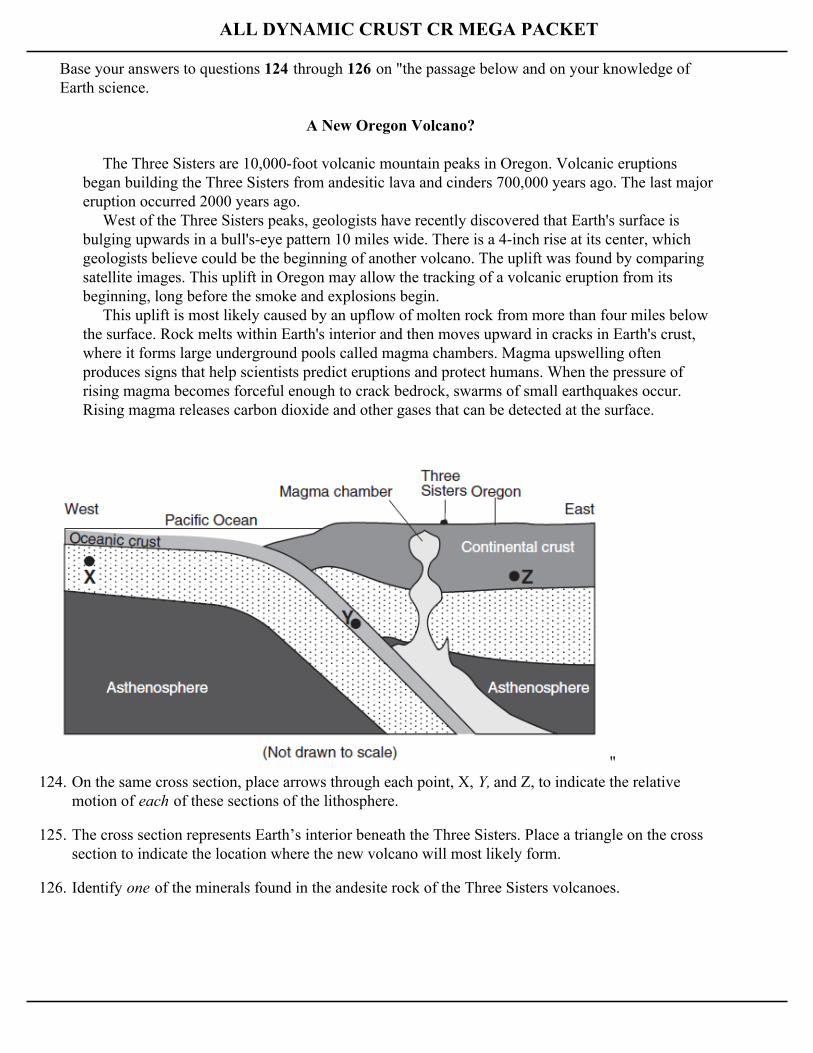
Base your answers to questions 124 through 126 on "the passage below and on your knowledge ofEarth science.
A New Oregon Volcano?
The Three Sisters are 10,000-foot volcanic mountain peaks in Oregon. Volcanic eruptionsbegan building the Three Sisters from andesitic lava and cinders 700,000 years ago. The last majoreruption occurred 2000 years ago. West of the Three Sisters peaks, geologists have recently discovered that Earth's surface isbulging upwards in a bull's-eye pattern 10 miles wide. There is a 4-inch rise at its center, whichgeologists believe could be the beginning of another volcano. The uplift was found by comparingsatellite images. This uplift in Oregon may allow the tracking of a volcanic eruption from itsbeginning, long before the smoke and explosions begin. This uplift is most likely caused by an upflow of molten rock from more than four miles belowthe surface. Rock melts within Earth's interior and then moves upward in cracks in Earth's crust,where it forms large underground pools called magma chambers. Magma upswelling oftenproduces signs that help scientists predict eruptions and protect humans. When the pressure ofrising magma becomes forceful enough to crack bedrock, swarms of small earthquakes occur.Rising magma releases carbon dioxide and other gases that can be detected at the surface.
"124. On the same cross section, place arrows through each point, X, Y, and Z, to indicate the relative
motion of each of these sections of the lithosphere.
125. The cross section represents Earth’s interior beneath the Three Sisters. Place a triangle on the crosssection to indicate the location where the new volcano will most likely form.
126. Identify one of the minerals found in the andesite rock of the Three Sisters volcanoes.
ALL DYNAMIC CRUST CR MEGA PACKET
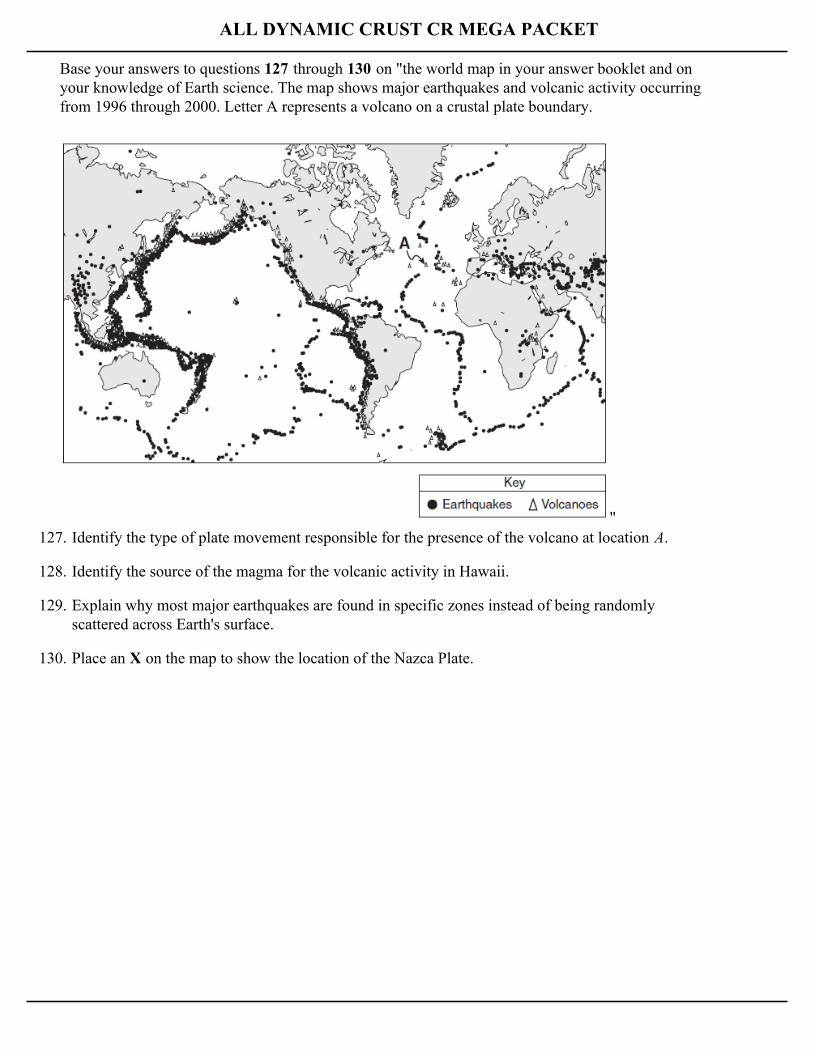
Base your answers to questions 127 through 130 on "the world map in your answer booklet and onyour knowledge of Earth science. The map shows major earthquakes and volcanic activity occurringfrom 1996 through 2000. Letter A represents a volcano on a crustal plate boundary.
"127. Identify the type of plate movement responsible for the presence of the volcano at location A.
128. Identify the source of the magma for the volcanic activity in Hawaii.
129. Explain why most major earthquakes are found in specific zones instead of being randomlyscattered across Earth's surface.
130. Place an X on the map to show the location of the Nazca Plate.
ALL DYNAMIC CRUST CR MEGA PACKET
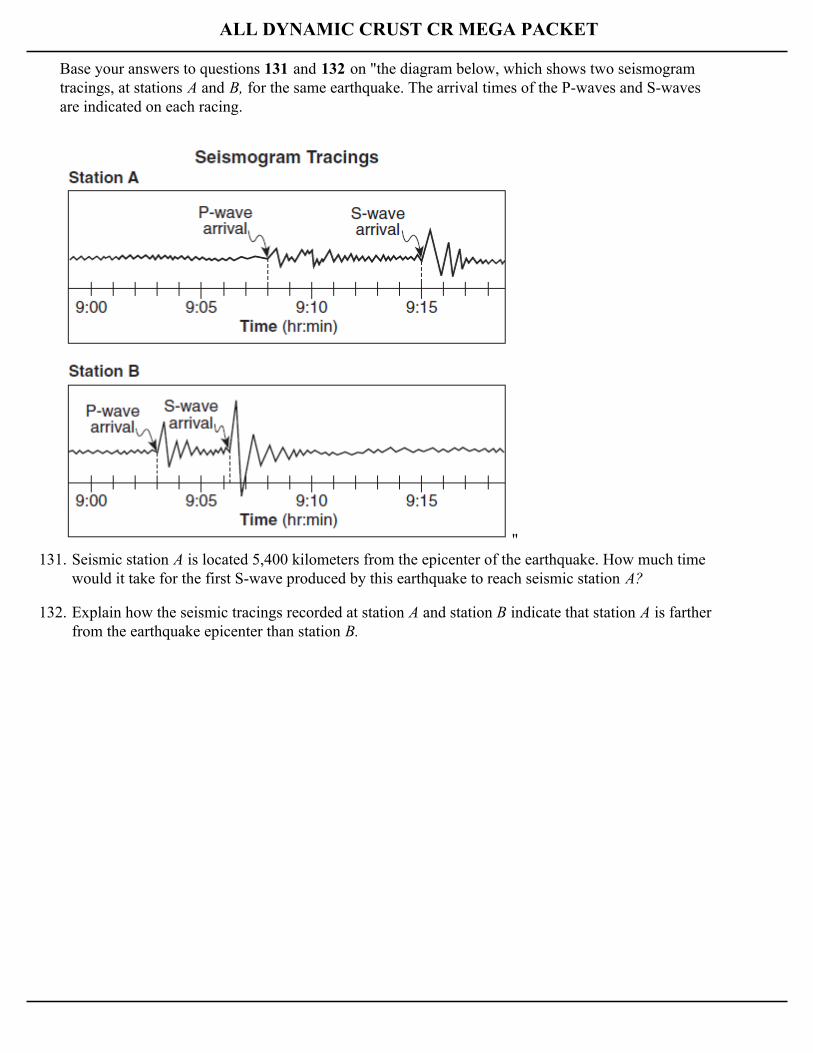
Base your answers to questions 131 and 132 on "the diagram below, which shows two seismogramtracings, at stations A and B, for the same earthquake. The arrival times of the P-waves and S-wavesare indicated on each racing.
"131. Seismic station A is located 5,400 kilometers from the epicenter of the earthquake. How much time
would it take for the first S-wave produced by this earthquake to reach seismic station A?
132. Explain how the seismic tracings recorded at station A and station B indicate that station A is fartherfrom the earthquake epicenter than station B.
ALL DYNAMIC CRUST CR MEGA PACKET
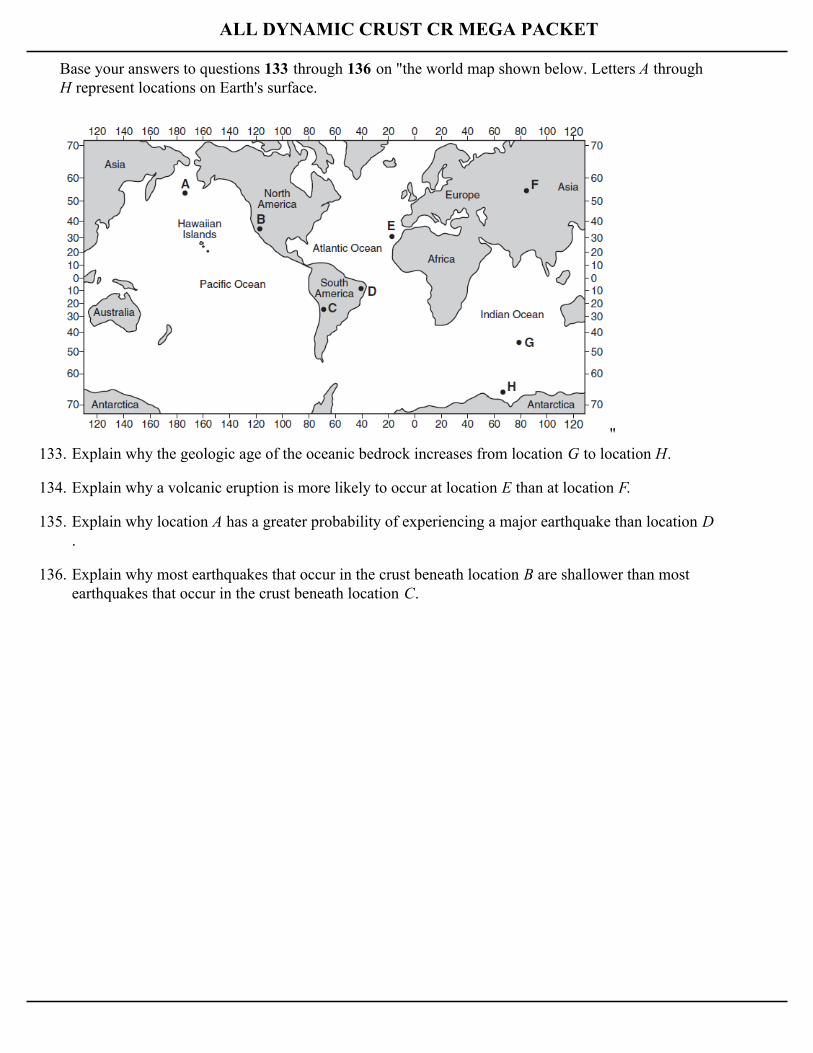
Base your answers to questions 133 through 136 on "the world map shown below. Letters A through H represent locations on Earth's surface.
"133. Explain why the geologic age of the oceanic bedrock increases from location G to location H.
134. Explain why a volcanic eruption is more likely to occur at location E than at location F.
135. Explain why location A has a greater probability of experiencing a major earthquake than location D.
136. Explain why most earthquakes that occur in the crust beneath location B are shallower than mostearthquakes that occur in the crust beneath location C.
ALL DYNAMIC CRUST CR MEGA PACKET
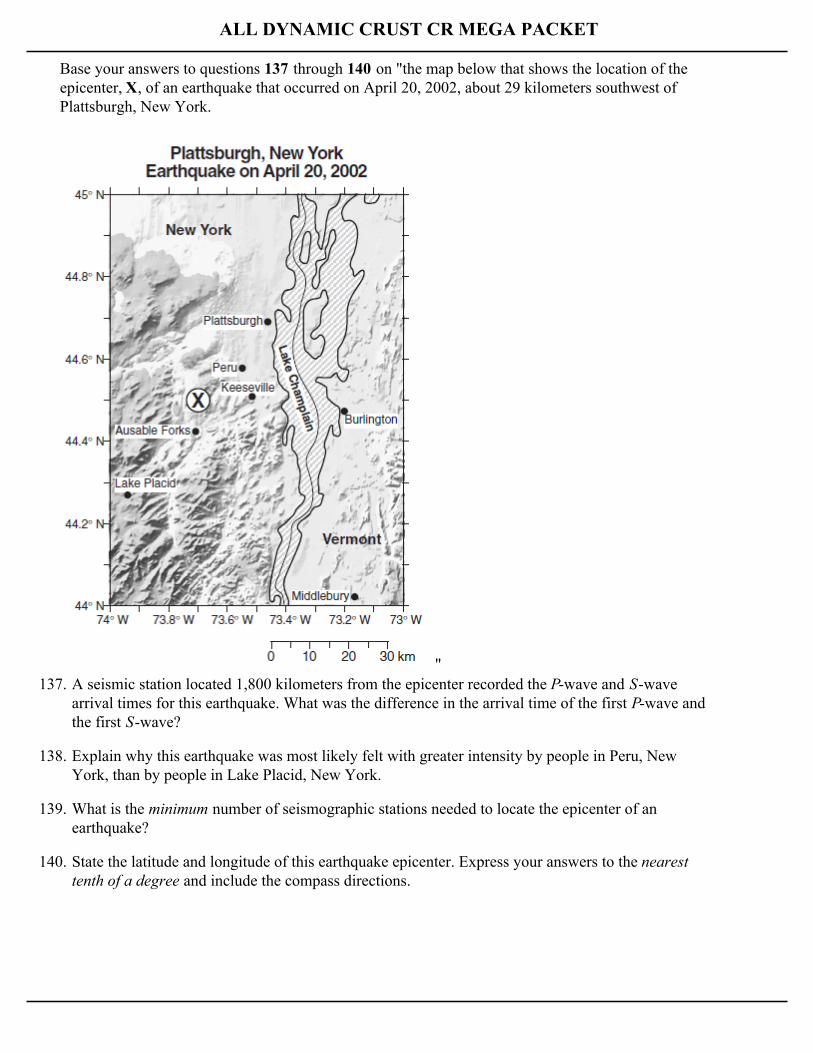
Base your answers to questions 137 through 140 on "the map below that shows the location of theepicenter, X, of an earthquake that occurred on April 20, 2002, about 29 kilometers southwest ofPlattsburgh, New York.
"137. A seismic station located 1,800 kilometers from the epicenter recorded the P-wave and S-wave
arrival times for this earthquake. What was the difference in the arrival time of the first P-wave andthe first S-wave?
138. Explain why this earthquake was most likely felt with greater intensity by people in Peru, NewYork, than by people in Lake Placid, New York.
139. What is the minimum number of seismographic stations needed to locate the epicenter of anearthquake?
140. State the latitude and longitude of this earthquake epicenter. Express your answers to the nearesttenth of a degree and include the compass directions.
ALL DYNAMIC CRUST CR MEGA PACKET
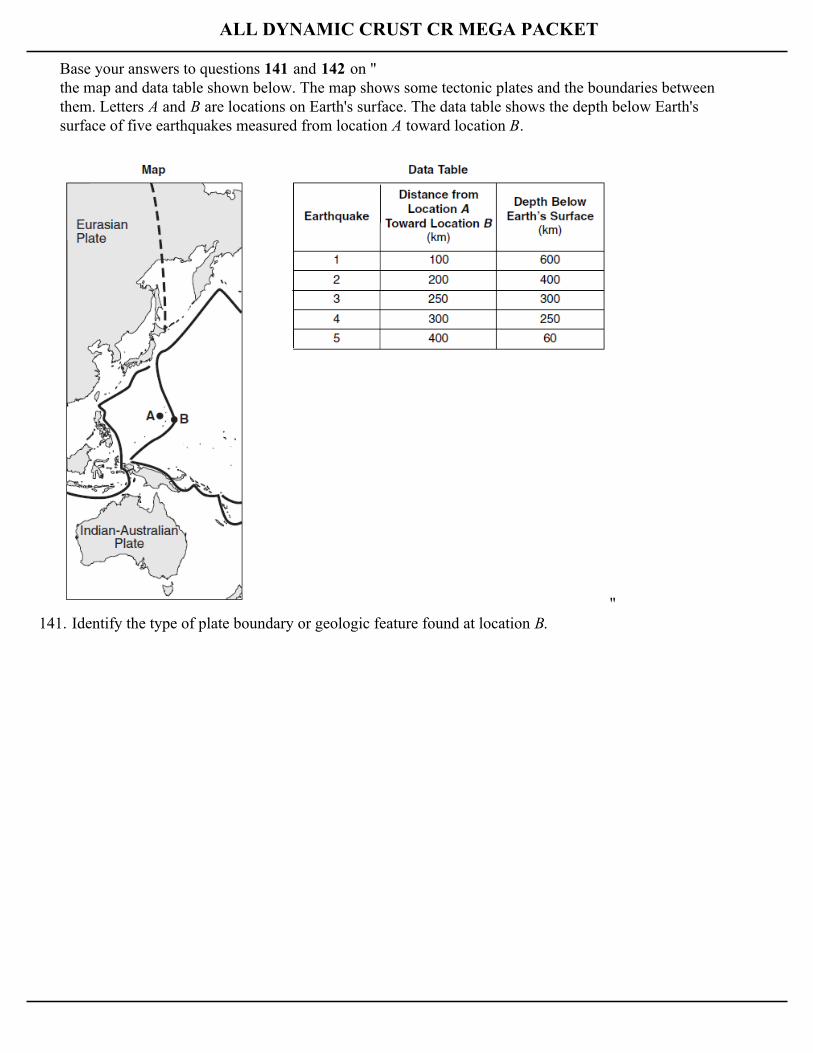
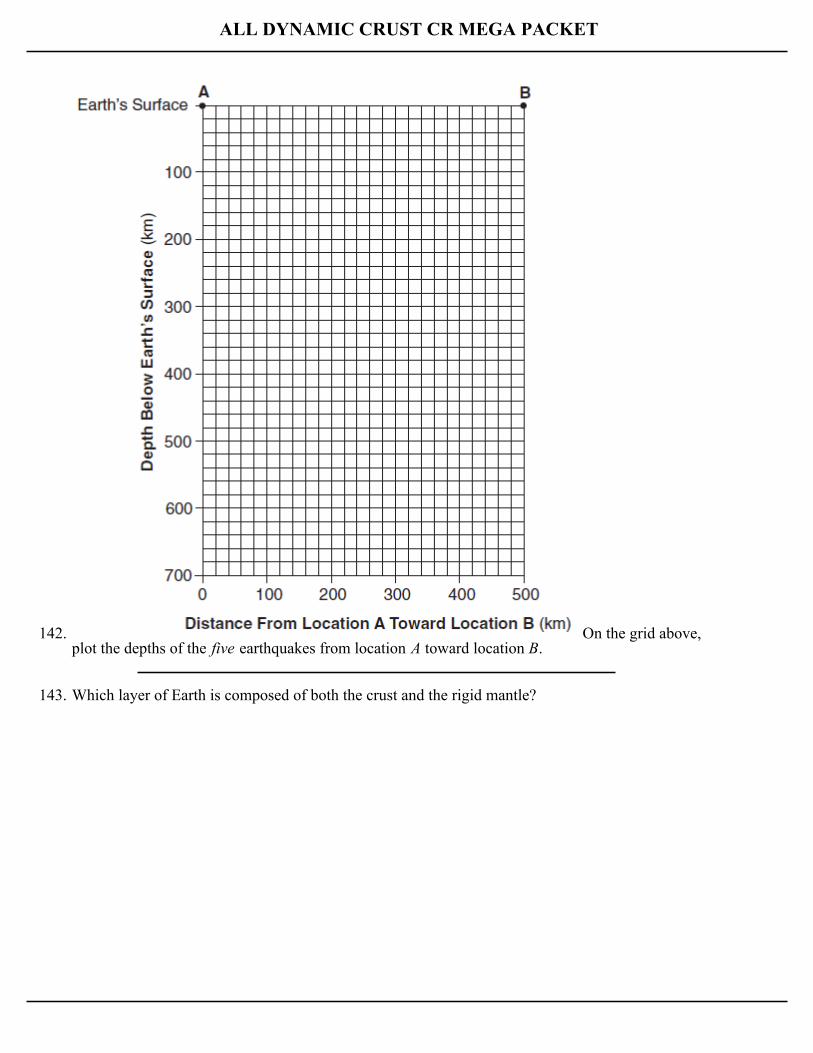
Base your answers to questions 141 and 142 on "the map and data table shown below. The map shows some tectonic plates and the boundaries betweenthem. Letters A and B are locations on Earth's surface. The data table shows the depth below Earth'ssurface of five earthquakes measured from location A toward location B.
"141. Identify the type of plate boundary or geologic feature found at location B.
ALL DYNAMIC CRUST CR MEGA PACKET
142. On the grid above,plot the depths of the five earthquakes from location A toward location B.
143. Which layer of Earth is composed of both the crust and the rigid mantle?
ALL DYNAMIC CRUST CR MEGA PACKET
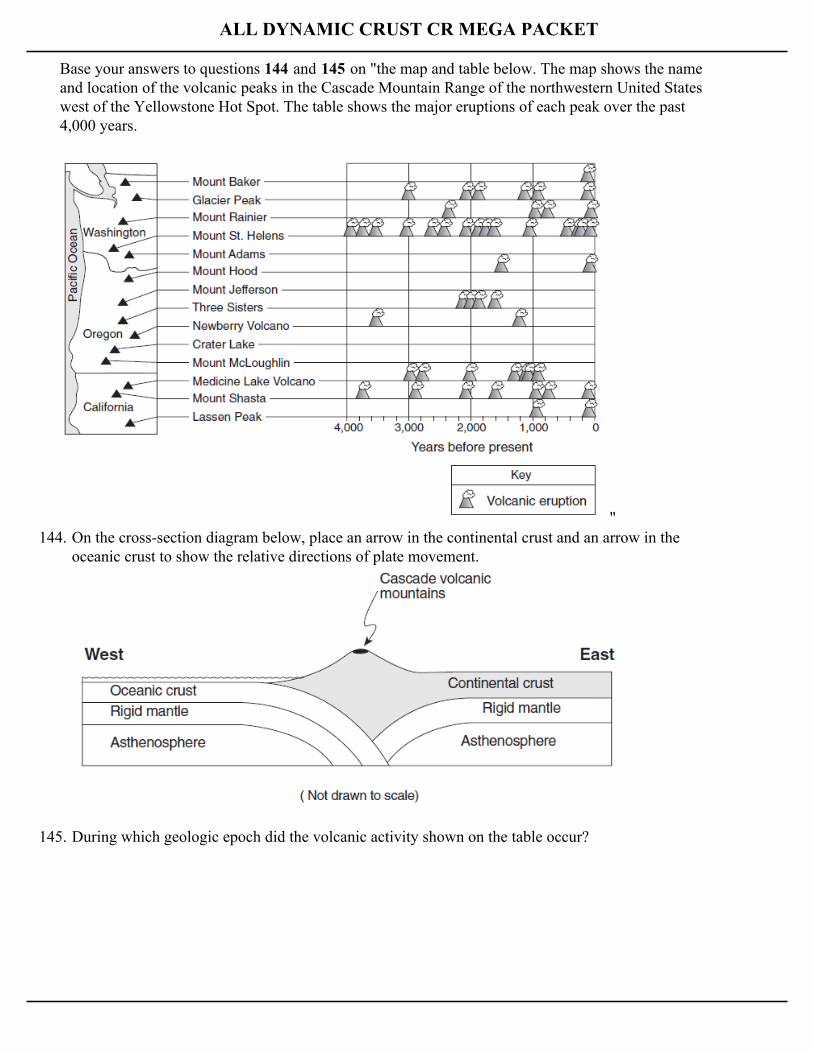
Base your answers to questions 144 and 145 on "the map and table below. The map shows the nameand location of the volcanic peaks in the Cascade Mountain Range of the northwestern United Stateswest of the Yellowstone Hot Spot. The table shows the major eruptions of each peak over the past4,000 years.
"144. On the cross-section diagram below, place an arrow in the continental crust and an arrow in the
oceanic crust to show the relative directions of plate movement.
145. During which geologic epoch did the volcanic activity shown on the table occur?
ALL DYNAMIC CRUST CR MEGA PACKET
Base your answers to questions 146 through 149 on the information below.
In the 1930s, most scientists believed that Earth's crust and interior were solid and motionless.A small group of scientists were talking about "continental drift," which is the idea that Earth'scrust is not stationary, but is constantly shifting and moving. From seismic data, geophysical evidence, and laboratory experiments, scientists now generallyagree that lithospheric plates move at the surface. Both Earth's surface and interior are in motion.Solid rock in the mantle can be softened and shaped when subjected to the heat and pressurewithin Earths interior over millions of years. Subduction processes are believed by many scientists to be the driving force of plate tectonics.At present, this theory cannot be directly observed and confirmed. The lithospheric plates havemoved in the past and are still moving today. The details of why and how they move will continueto challenge scientists.
146. According to the geologic record, during which geologic time period did the lithospheric plates thatmade up Pangea begin to break up?
147. According to the Earth Science Reference Tables, at what inferred depth is mantle rock partiallymelted and slowly moving below the lithospheric plates?
148. The information given suggests that "subduction processes are the driving force of plate tectonics."Identify a specific location of a subduction zone on Earth.
149. Earths crust is described as "constantly shifting and moving." Give one example of geologicevidence that supports the conclusion that continents have drifted apart.
ALL DYNAMIC CRUST CR MEGA PACKET
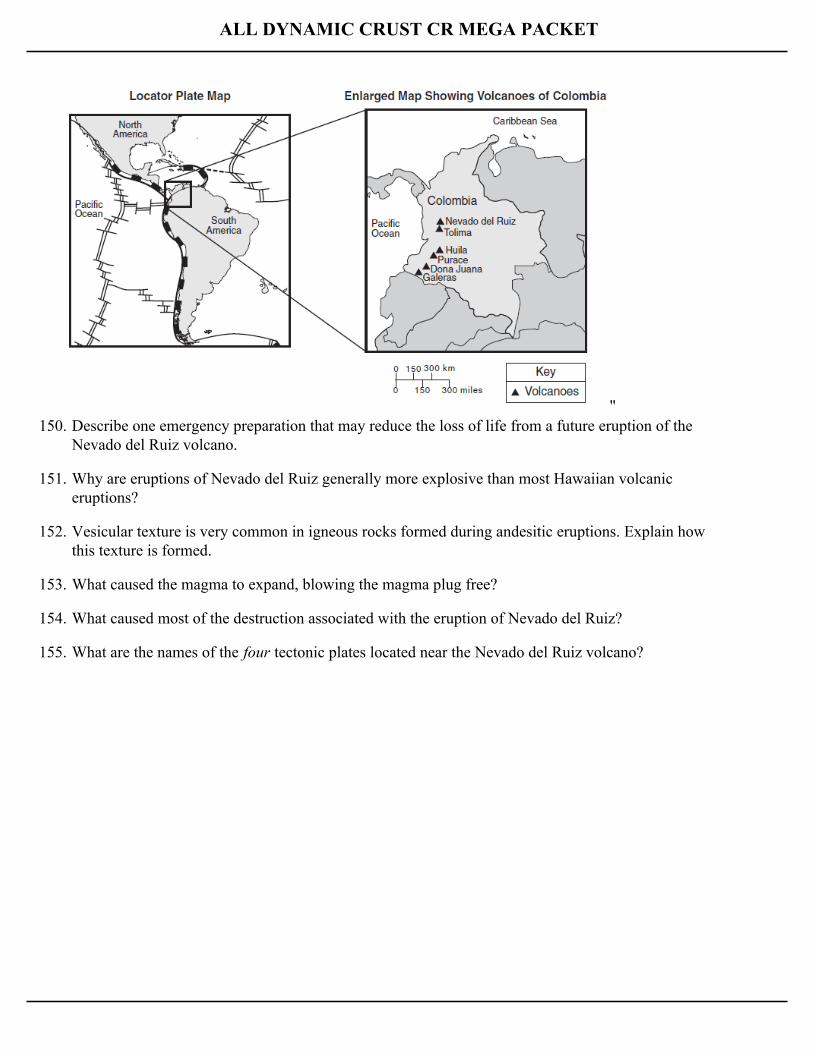
Base your answers to questions 150 through 155 on "the reading passage and maps below. Theenlarged map shows the location of volcanoes in Colombia, South America.
Fire and Ice — and Sluggish Magma
On the night of November 13, 1985, Nevado del Ruiz, a 16,200-foot (4,938 meter)snowcapped volcano in northwestern Colombia, erupted. Snow melted, sending a wall of mud andwater raging through towns as far as 50 kilometers away, and killing 25,000 people. Long before disaster struck, Nevado del Ruiz was marked as a trouble spot. Like Mexico City,where an earthquake killed at least 7,000 people in October 1985, Nevado del Ruiz is locatedalong the Ring of Fire. This ring of islands and the coastal lands along the edge of the Pacific Ocean are prone tovolcanic eruptions and crustal movements. The ring gets its turbulent characteristics from themotion of the tectonic plates under it. The perimeter of the Pacific, unlike that of the Atlantic, islocated above active tectonic plates. Nevado del Ruiz happens to be located near the junction of four plate boundaries. In this areaan enormous amount of heat is created, which melts the rock 100 to 200 kilometers below Earth'ssurface and creates magma. Nevado del Ruiz hadn't had a major eruption for 400 years before thistragedy. The reason: sluggish magma. Unlike the runny, mafic magma that makes up the lavaflows of oceanic volcanoes such as those in Hawaii, the magma at this type of subduction plateboundary tends to be sticky and slow moving, forming the rock andesite when it cools. Thisandesitic magma tends to plug up the opening of the volcano. It sits in a magma chamberunderground with pressure continually building up. Suddenly, tiny cracks develop in Earth's crust,causing the pressure to drop. This causes the steam and other gases dissolved in the magma toviolently expand, blowing the magma plug free. Huge amounts of ash and debris are sent flying,creating what is called an explosive eruption. Oddly enough, the actual eruption of Nevado del Ruiz didn't cause most of the destruction. Itwas caused not by lava but by the towering walls of sliding mud created when large chunks of hotash and pumice mixed with melted snow.
ALL DYNAMIC CRUST CR MEGA PACKET
"150. Describe one emergency preparation that may reduce the loss of life from a future eruption of the
Nevado del Ruiz volcano.
151. Why are eruptions of Nevado del Ruiz generally more explosive than most Hawaiian volcaniceruptions?
152. Vesicular texture is very common in igneous rocks formed during andesitic eruptions. Explain howthis texture is formed.
153. What caused the magma to expand, blowing the magma plug free?
154. What caused most of the destruction associated with the eruption of Nevado del Ruiz?
155. What are the names of the four tectonic plates located near the Nevado del Ruiz volcano?
ALL DYNAMIC CRUST CR MEGA PACKET
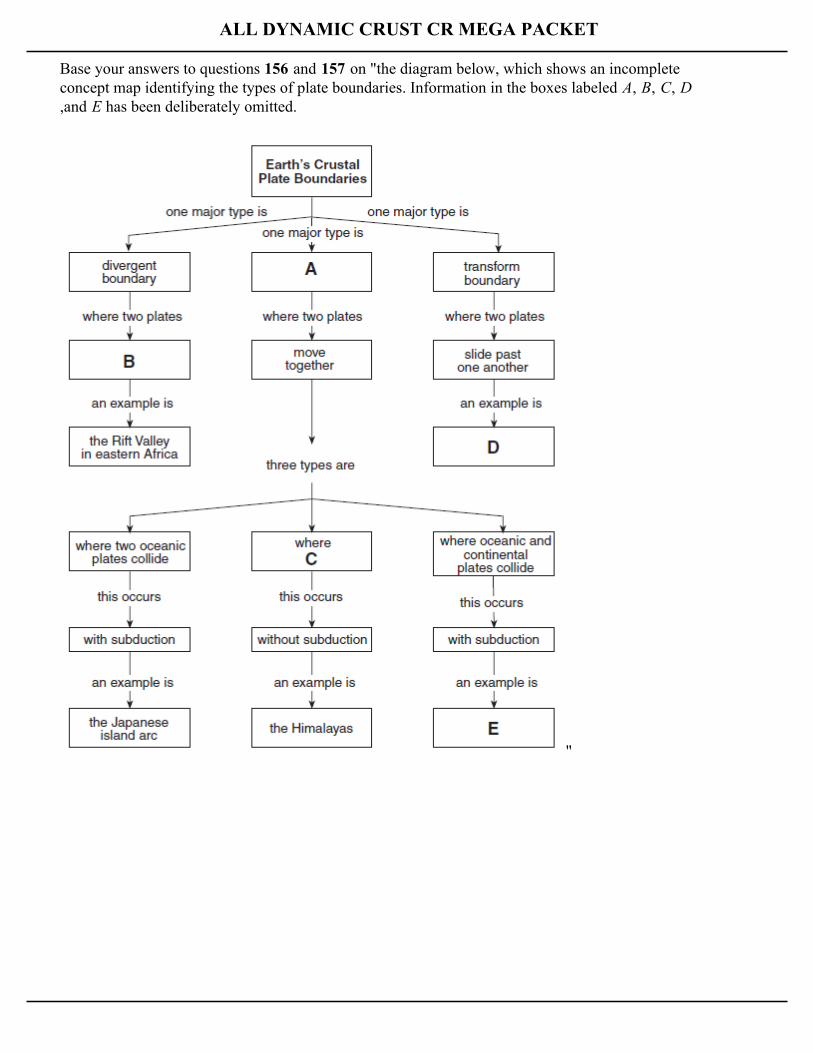
Base your answers to questions 156 and 157 on "the diagram below, which shows an incompleteconcept map identifying the types of plate boundaries. Information in the boxes labeled A, B, C, D,and E has been deliberately omitted.
"
ALL DYNAMIC CRUST CR MEGA PACKET
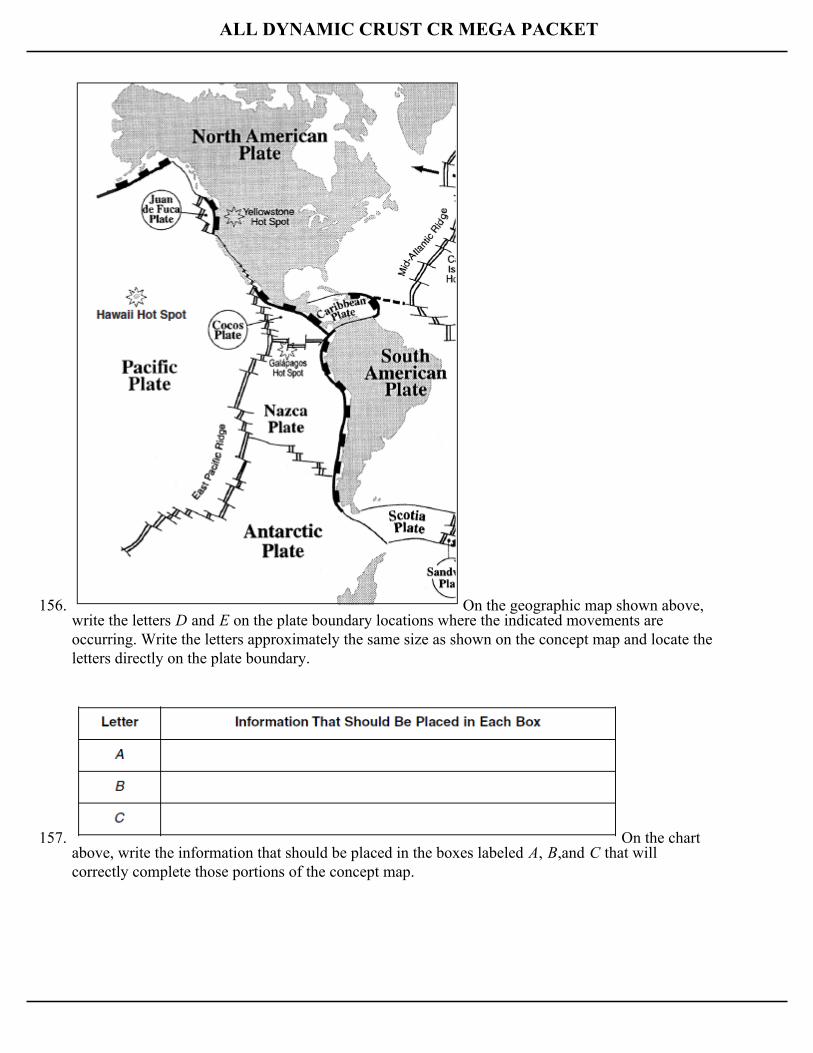
156. On the geographic map shown above,write the letters D and E on the plate boundary locations where the indicated movements areoccurring. Write the letters approximately the same size as shown on the concept map and locate theletters directly on the plate boundary.
157. On the chartabove, write the information that should be placed in the boxes labeled A, B,and C that willcorrectly complete those portions of the concept map.
ALL DYNAMIC CRUST CR MEGA PACKET
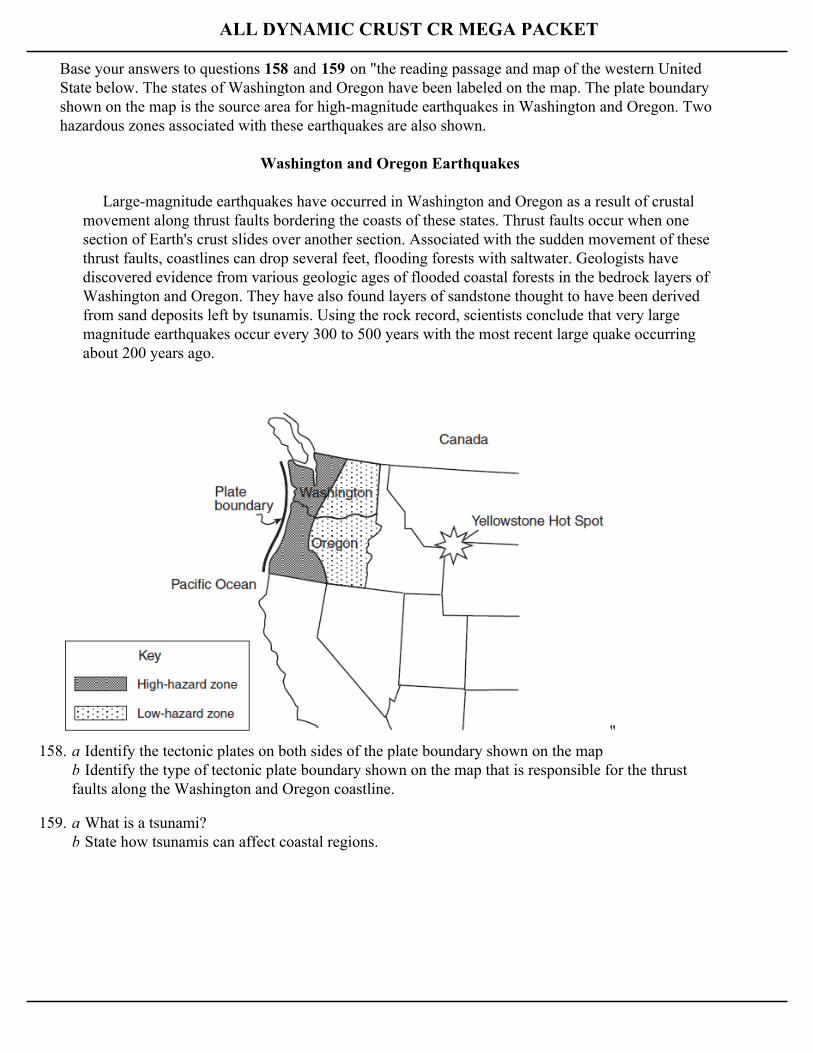
Base your answers to questions 158 and 159 on "the reading passage and map of the western UnitedState below. The states of Washington and Oregon have been labeled on the map. The plate boundaryshown on the map is the source area for high-magnitude earthquakes in Washington and Oregon. Twohazardous zones associated with these earthquakes are also shown.
Washington and Oregon Earthquakes
Large-magnitude earthquakes have occurred in Washington and Oregon as a result of crustalmovement along thrust faults bordering the coasts of these states. Thrust faults occur when onesection of Earth's crust slides over another section. Associated with the sudden movement of thesethrust faults, coastlines can drop several feet, flooding forests with saltwater. Geologists havediscovered evidence from various geologic ages of flooded coastal forests in the bedrock layers ofWashington and Oregon. They have also found layers of sandstone thought to have been derivedfrom sand deposits left by tsunamis. Using the rock record, scientists conclude that very largemagnitude earthquakes occur every 300 to 500 years with the most recent large quake occurringabout 200 years ago.
"158. a Identify the tectonic plates on both sides of the plate boundary shown on the map
b Identify the type of tectonic plate boundary shown on the map that is responsible for the thrustfaults along the Washington and Oregon coastline.
159. a What is a tsunami?b State how tsunamis can affect coastal regions.
ALL DYNAMIC CRUST CR MEGA PACKET
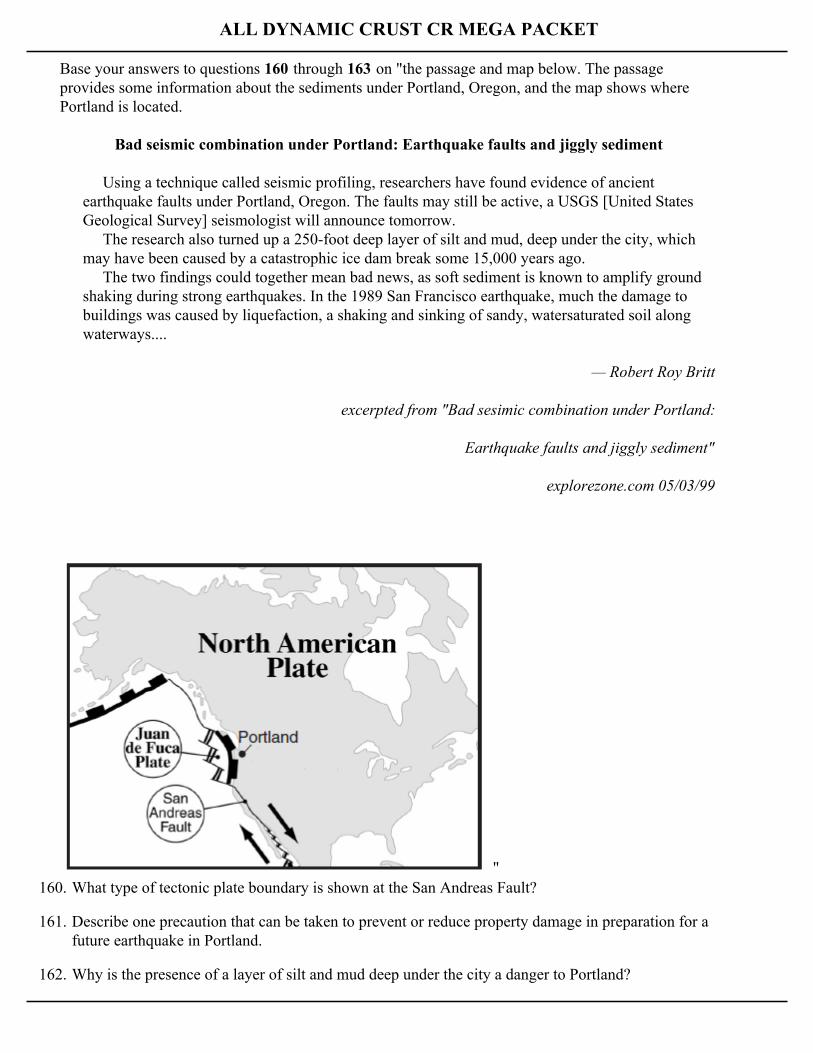
Base your answers to questions 160 through 163 on "the passage and map below. The passageprovides some information about the sediments under Portland, Oregon, and the map shows wherePortland is located.
Bad seismic combination under Portland: Earthquake faults and jiggly sediment
Using a technique called seismic profiling, researchers have found evidence of ancientearthquake faults under Portland, Oregon. The faults may still be active, a USGS [United StatesGeological Survey] seismologist will announce tomorrow. The research also turned up a 250-foot deep layer of silt and mud, deep under the city, whichmay have been caused by a catastrophic ice dam break some 15,000 years ago. The two findings could together mean bad news, as soft sediment is known to amplify groundshaking during strong earthquakes. In the 1989 San Francisco earthquake, much the damage tobuildings was caused by liquefaction, a shaking and sinking of sandy, watersaturated soil alongwaterways....
— Robert Roy Britt
excerpted from "Bad sesimic combination under Portland:
Earthquake faults and jiggly sediment"
explorezone.com 05/03/99
"160. What type of tectonic plate boundary is shown at the San Andreas Fault?
161. Describe one precaution that can be taken to prevent or reduce property damage in preparation for afuture earthquake in Portland.
162. Why is the presence of a layer of silt and mud deep under the city a danger to Portland?
ALL DYNAMIC CRUST CR MEGA PACKET
163. Explain why Portland is likely to experience a major earthquake.
164. Name one region of the United States that is likely to experience a major damaging earthquake.Explain why an earthquake is likely to occur in that region.
Base your answers to questions 165 through 167 on the newspaper article shown below, taken andadapted from the Los Angeles Times.
Volcanic Blast Shaped Earth
Study finds eruption split an ancient continent, creating Atlantic Ocean
The largest volcanic eruption in Earth's history — so powerful it split an ancient supercontinentand created the Atlantic Ocean — spewed millions of square miles of searing lava thatextinguished much of life on ancient Earth. From hundreds of basalt outcrops that rim the Atlantic coasts, scientists have pieced togetherevidence of the titanic eruption 200 million years ago. Researchers said that the eruption set thefractured landmasses adrift and, by wedging them apart, gradually opened the gulf that created theAtlantic — giving the map of the world the form it has today. "This is one of the biggest things that has ever happened in Earth's history. This is a gigantic,igneous event and it all seems to have occurred in an amazingly brief amount of time." To reconstruct the ancient catastrophe, a team of scientists analyzed basalt dikes, sills, andlavas from the New Jersey Palisades, the Brazilian Amazon, Spain, and West Africa. By studying the chemical composition and dating the residual radioisotopes in the basalticrocks, the researchers determined that the rocks all originated from the same eruption. Once theyrealized the outcrops were linked, they were able to determine that, in the distant past, the rocksall had been located together at the center of an immense continent called Pangea that oncestretched, unbroken, from pole to pole.
165. Basaltic outcrops are not the only evidence of this ancient continental splitting. Describe anotherpiece of evidence that supports the idea that the present-day continents were once part of the largeancient continent, Pangea, that split apart.
166. Scientists stated that rocks from the volcanic eruption that separated the continents are basalt. List two observable characteristics that are normally used to identify basaltic rock.
167. Name the geologic time period when this major volcanic eruption initially opened the AtlanticOcean.
ALL DYNAMIC CRUST CR MEGA PACKET
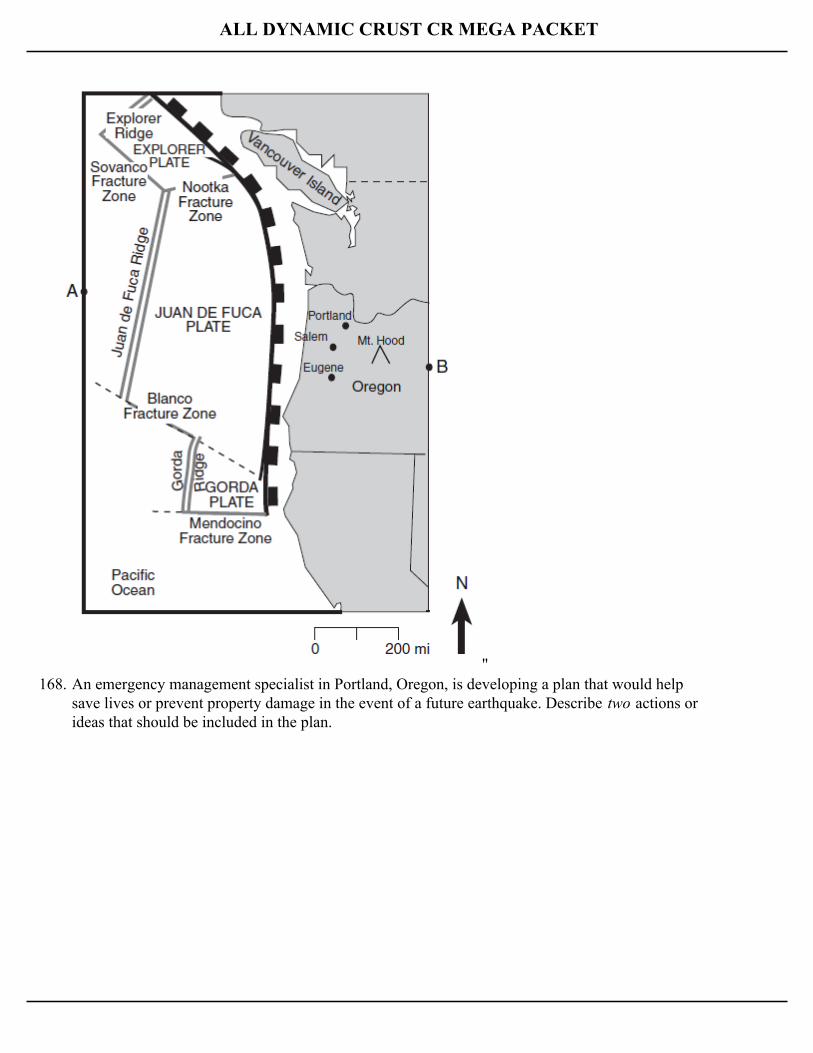
Base your answers to questions 168 and 169 on "the news article and map below. Points A and mapare reference points.
Huge Quake Possible in Oregon Valley
Scientists have warned for years that a magnitude 8 or 9 earthquake could strike about 30 milesoff the Oregon coast, causing huge tsunamis (large ocean waves) and tremendous damage. Now scientists say these earthquakes could be centered much farther inland and cause severedamage to a larger area, including cities in Oregon such as Portland, Salem, and Eugene. Geologic evidence suggests that strong quakes in this area occur about every 400 years, plus orminus 200 years. The last one, believed to be a magnitude 9, occurred 300 years ago. A magnitude 8 quake can cause tremendous damage. The San Francisco quake of 1906 hasbeen estimated at 7.9. The Mexico City quake of 1985 that left thousands dead was measured at8.1.
ALL DYNAMIC CRUST CR MEGA PACKET
"168. An emergency management specialist in Portland, Oregon, is developing a plan that would help
save lives or prevent property damage in the event of a future earthquake. Describe two actions orideas that should be included in the plan.
ALL DYNAMIC CRUST CR MEGA PACKET
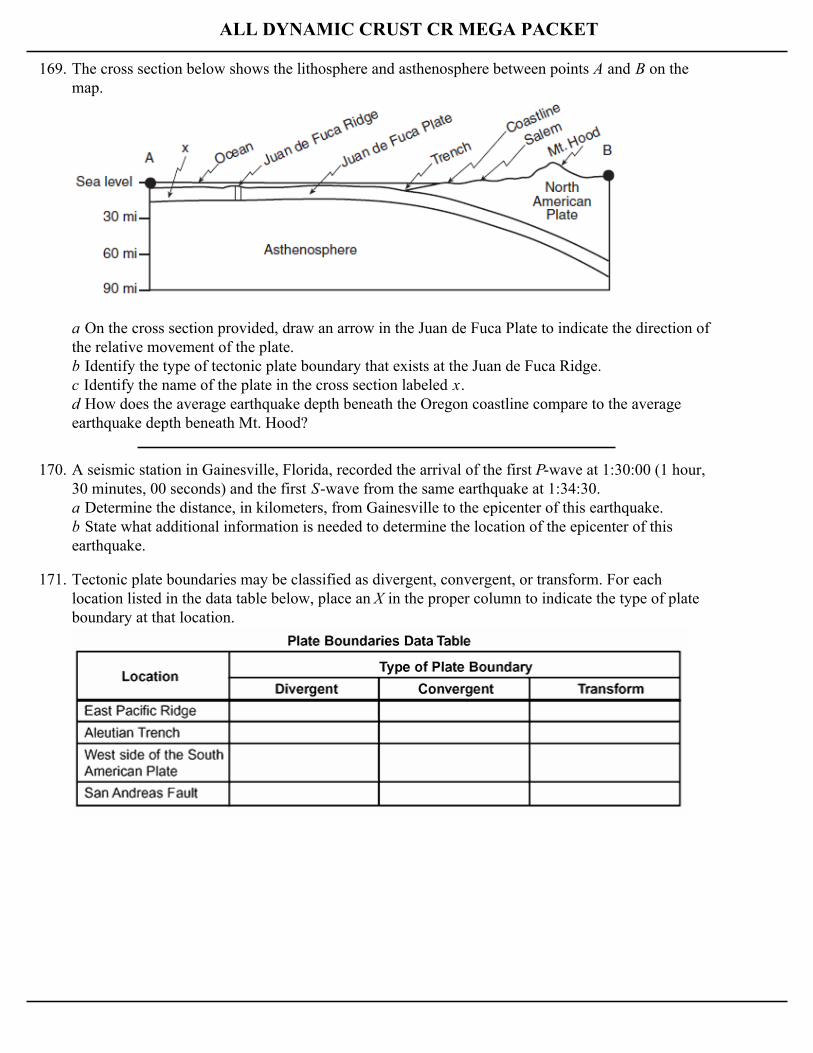
169. The cross section below shows the lithosphere and asthenosphere between points A and B on themap.
a On the cross section provided, draw an arrow in the Juan de Fuca Plate to indicate the direction ofthe relative movement of the plate.b Identify the type of tectonic plate boundary that exists at the Juan de Fuca Ridge.c Identify the name of the plate in the cross section labeled x.d How does the average earthquake depth beneath the Oregon coastline compare to the averageearthquake depth beneath Mt. Hood?
170. A seismic station in Gainesville, Florida, recorded the arrival of the first P-wave at 1:30:00 (1 hour,30 minutes, 00 seconds) and the first S-wave from the same earthquake at 1:34:30.a Determine the distance, in kilometers, from Gainesville to the epicenter of this earthquake.b State what additional information is needed to determine the location of the epicenter of thisearthquake.
171. Tectonic plate boundaries may be classified as divergent, convergent, or transform. For eachlocation listed in the data table below, place an X in the proper column to indicate the type of plateboundary at that location.
ALL DYNAMIC CRUST CR MEGA PACKET
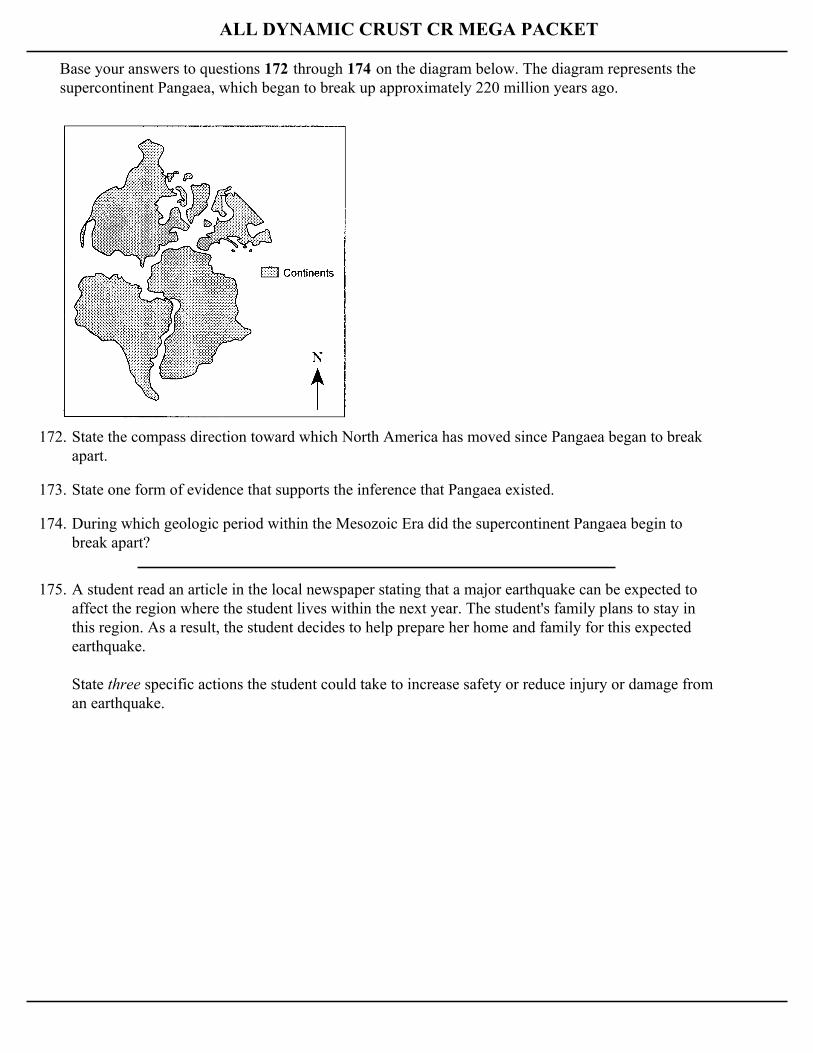
Base your answers to questions 172 through 174 on the diagram below. The diagram represents thesupercontinent Pangaea, which began to break up approximately 220 million years ago.
172. State the compass direction toward which North America has moved since Pangaea began to breakapart.
173. State one form of evidence that supports the inference that Pangaea existed.
174. During which geologic period within the Mesozoic Era did the supercontinent Pangaea begin tobreak apart?
175. A student read an article in the local newspaper stating that a major earthquake can be expected toaffect the region where the student lives within the next year. The student's family plans to stay inthis region. As a result, the student decides to help prepare her home and family for this expectedearthquake.
State three specific actions the student could take to increase safety or reduce injury or damage froman earthquake.
ALL DYNAMIC CRUST CR MEGA PACKET
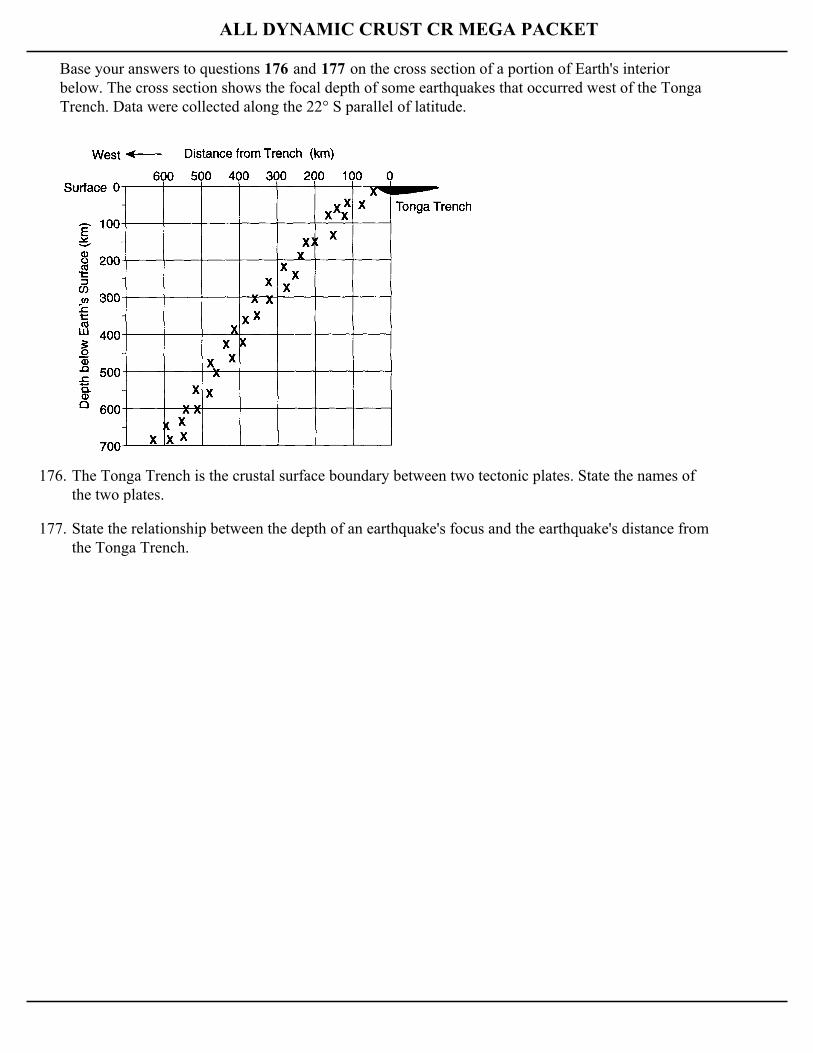
Base your answers to questions 176 and 177 on the cross section of a portion of Earth's interiorbelow. The cross section shows the focal depth of some earthquakes that occurred west of the TongaTrench. Data were collected along the 22° S parallel of latitude.
176. The Tonga Trench is the crustal surface boundary between two tectonic plates. State the names ofthe two plates.
177. State the relationship between the depth of an earthquake's focus and the earthquake's distance fromthe Tonga Trench.
ALL DYNAMIC CRUST CR MEGA PACKET
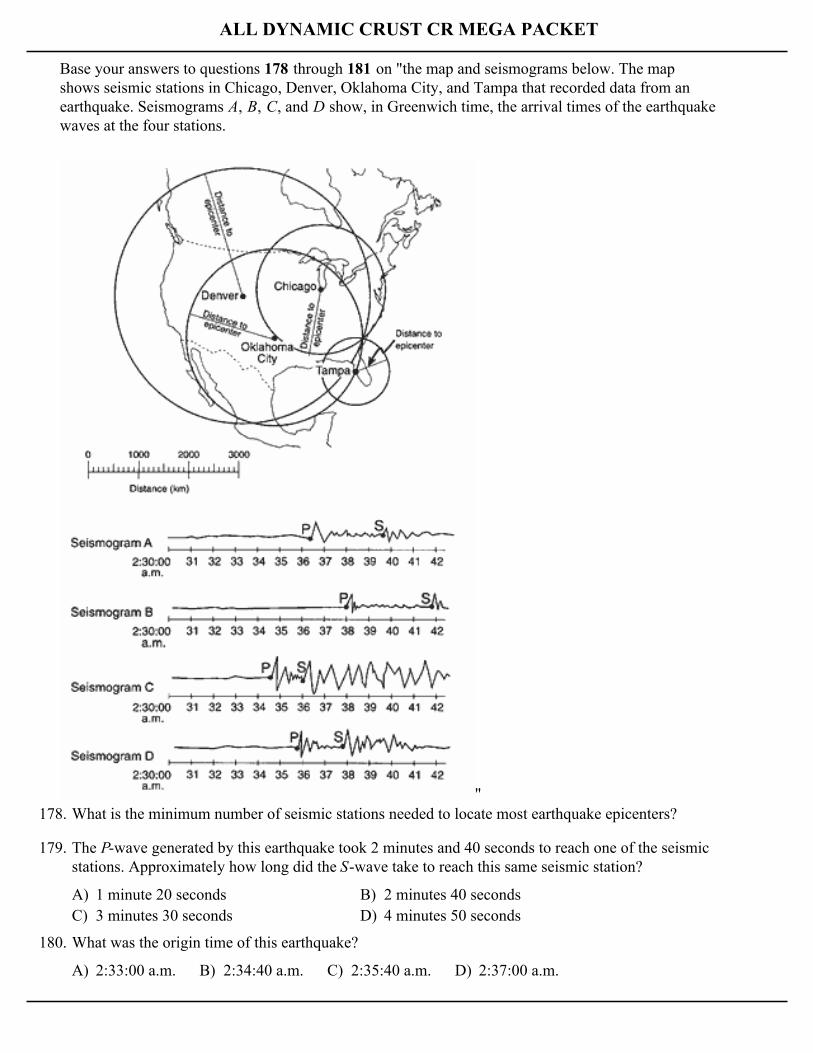
Base your answers to questions 178 through 181 on "the map and seismograms below. The mapshows seismic stations in Chicago, Denver, Oklahoma City, and Tampa that recorded data from anearthquake. Seismograms A, B, C, and D show, in Greenwich time, the arrival times of the earthquakewaves at the four stations.
"178. What is the minimum number of seismic stations needed to locate most earthquake epicenters?
A) 1 minute 20 seconds B) 2 minutes 40 secondsC) 3 minutes 30 seconds D) 4 minutes 50 seconds
179. The P-wave generated by this earthquake took 2 minutes and 40 seconds to reach one of the seismicstations. Approximately how long did the S-wave take to reach this same seismic station?
A) 2:33:00 a.m. B) 2:34:40 a.m. C) 2:35:40 a.m. D) 2:37:00 a.m.
180. What was the origin time of this earthquake?
ALL DYNAMIC CRUST CR MEGA PACKET
A) seismogram A B) seismogram B C) seismogram C D) seismogram D
181. Which seismogram was recorded at Tampa?
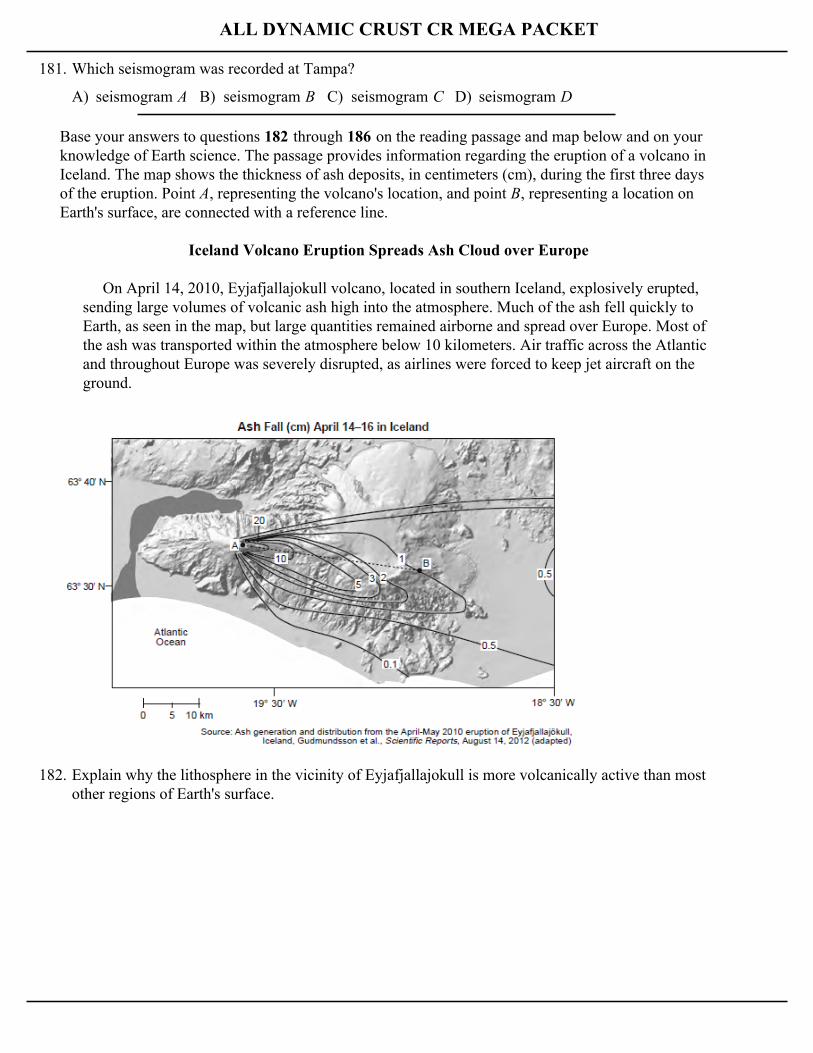
Base your answers to questions 182 through 186 on the reading passage and map below and on yourknowledge of Earth science. The passage provides information regarding the eruption of a volcano inIceland. The map shows the thickness of ash deposits, in centimeters (cm), during the first three daysof the eruption. Point A, representing the volcano's location, and point B, representing a location onEarth's surface, are connected with a reference line.
Iceland Volcano Eruption Spreads Ash Cloud over Europe
On April 14, 2010, Eyjafjallajokull volcano, located in southern Iceland, explosively erupted,sending large volumes of volcanic ash high into the atmosphere. Much of the ash fell quickly toEarth, as seen in the map, but large quantities remained airborne and spread over Europe. Most ofthe ash was transported within the atmosphere below 10 kilometers. Air traffic across the Atlanticand throughout Europe was severely disrupted, as airlines were forced to keep jet aircraft on theground.
182. Explain why the lithosphere in the vicinity of Eyjafjallajokull is more volcanically active than mostother regions of Earth's surface.
ALL DYNAMIC CRUST CR MEGA PACKET
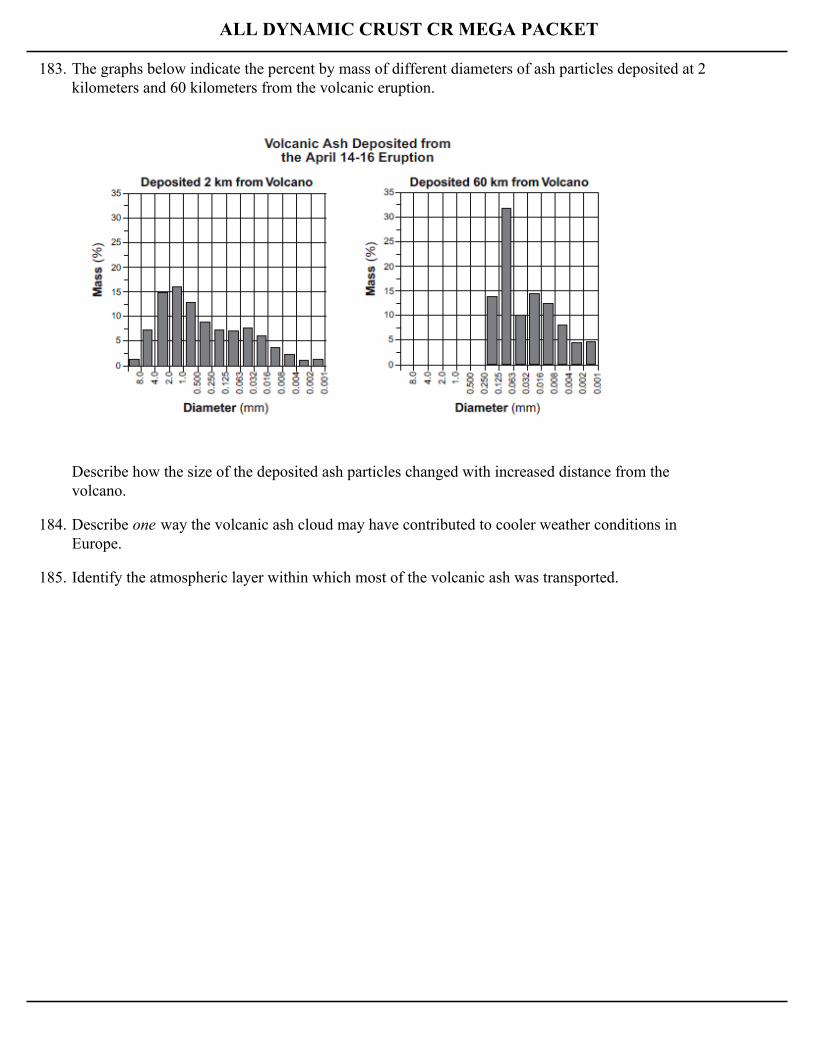
183. The graphs below indicate the percent by mass of different diameters of ash particles deposited at 2kilometers and 60 kilometers from the volcanic eruption.
Describe how the size of the deposited ash particles changed with increased distance from thevolcano.
184. Describe one way the volcanic ash cloud may have contributed to cooler weather conditions inEurope.
185. Identify the atmospheric layer within which most of the volcanic ash was transported.
ALL DYNAMIC CRUST CR MEGA PACKET
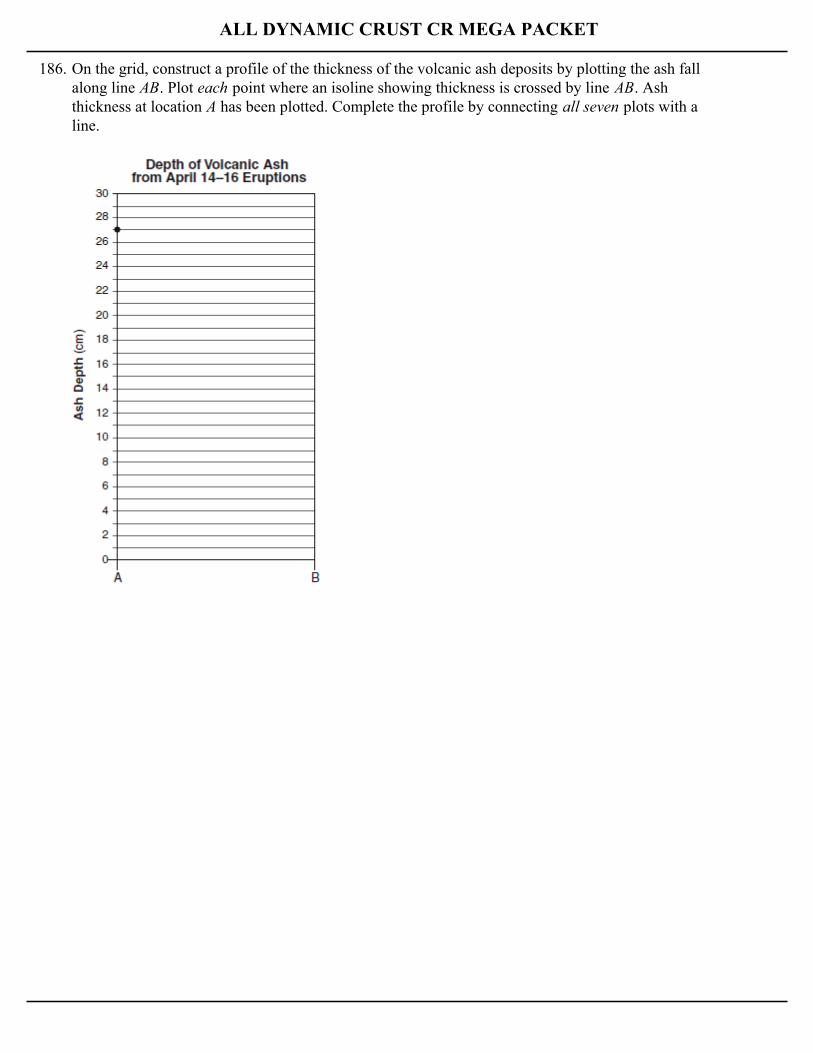
186. On the grid, construct a profile of the thickness of the volcanic ash deposits by plotting the ash fallalong line AB. Plot each point where an isoline showing thickness is crossed by line AB. Ashthickness at location A has been plotted. Complete the profile by connecting all seven plots with aline.
ALL DYNAMIC CRUST CR MEGA PACKET
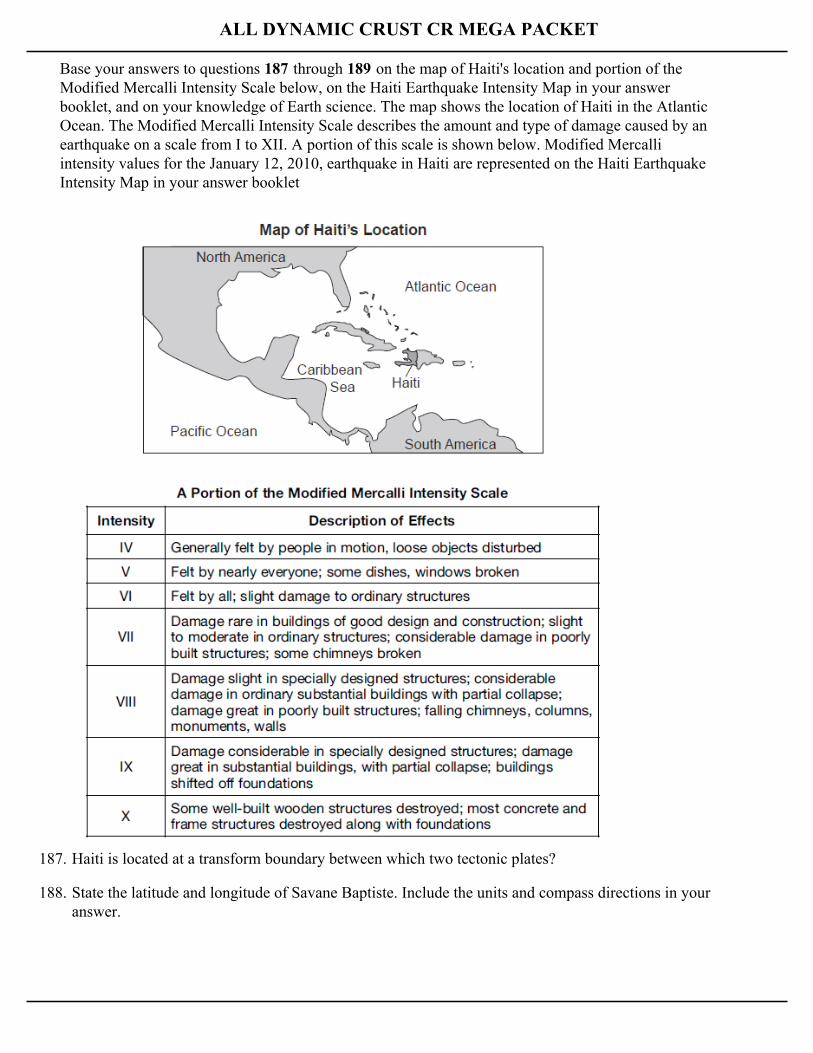
Base your answers to questions 187 through 189 on the map of Haiti's location and portion of theModified Mercalli Intensity Scale below, on the Haiti Earthquake Intensity Map in your answerbooklet, and on your knowledge of Earth science. The map shows the location of Haiti in the AtlanticOcean. The Modified Mercalli Intensity Scale describes the amount and type of damage caused by anearthquake on a scale from I to XII. A portion of this scale is shown below. Modified Mercalliintensity values for the January 12, 2010, earthquake in Haiti are represented on the Haiti EarthquakeIntensity Map in your answer booklet
187. Haiti is located at a transform boundary between which two tectonic plates?
188. State the latitude and longitude of Savane Baptiste. Include the units and compass directions in youranswer.
ALL DYNAMIC CRUST CR MEGA PACKET
189. On the earthquake intensity map, boundary lines have been drawn between the Modified Mercalliintensity values of IV and V. On the map, draw boundary lines between the Modified Mercalliintensity values of V and VI.
Earth Science
Name _________________ Class _________________ Date _________
1.2.3.4.5.6.7.8.9.10.11.12.13.14.15.16.17.18.19.20.21.22.23.24.25.26.27.28.29.30.31.32.33.34.35.
36.37.38.39.40.41.42.43.44.45.46.47.48.49.50.51.52.53.54.55.56.57.58.59.60.61.62.63.64.65.66.67.68.69.70.
71.72.73.74.75.76.77.78.79.80.81.82.83.84.85.86.87.88.89.90.91.92.93.94.95.96.97.98.99.100.101.102.103.104.105.
106.107.108.109.110.111.112.113.114.115.116.117.118.119.120.121.122.123.124.125.126.127.128.129.130.131.132.133.134.135.136.137.138.139.140.
Earth Science
Name _________________ Class _________________ Date _________
141.142.143.144.145.146.147.148.149.150.151.152.153.154.155.156.157.158.159.160.161.162.163.164.165.166.167.168.169.170.171.172.173.174.175.
176.177.178.179.180.181.182.183.184.185.186.187.188.189.