Embed Size (px)
Citation preview

ALK BREAK APART FISH EVALUATION GUIDE For NSCLC Tissue Specimens

Table of Contents
Visualizing FISH Hybridization . . . . . . . . . . . . . . . . . . .3
Slide Evaluation: Summary Procedure . . . . . . . . . . . . .3
Locate Target (Scribed) Area Using 10x–25x Objective . . . . . . . . . . . . . . . . . . . . . . . . . .4
Assess Target Area Using 60x–100x Objective . . . . . . . . . . . . . . . . . . . . . . . . .8
Selecting and Enumerating Cells Within the Selected Target Area . . . . . . . . . . . . . . . . . . 16
Selecting Cells for Enumeration . . . . . . . . . . . . . . . . . . 17
Enumerating Cells . . . . . . . . . . . . . . . . . . . . . . . . . . . . . . . 19
ALK Enumeration (Signal Patterns) . . . . . . . . . . . . . . . 19
ALK Status Determination . . . . . . . . . . . . . . . . . . . . . . . 21
All images property of Abbott Laboratories.
3
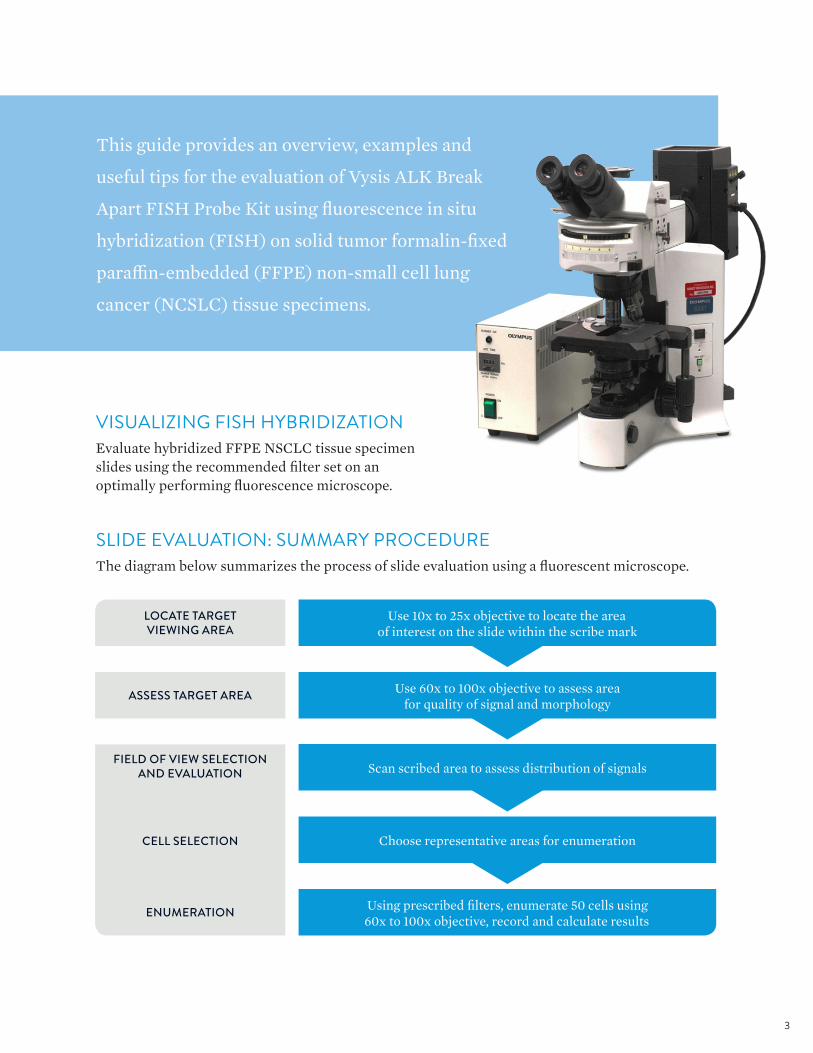
This guide provides an overview, examples and
useful tips for the evaluation of Vysis ALK Break
Apart FISH Probe Kit using fluorescence in situ
hybridization (FISH) on solid tumor formalin-fixed
paraffin-embedded (FFPE) non-small cell lung
cancer (NCSLC) tissue specimens .
VISUALIZING FISH HYBRIDIZATIONEvaluate hybridized FFPE NSCLC tissue specimen slides using the recommended filter set on an optimally performing fluorescence microscope .
SLIDE EVALUATION: SUMMARY PROCEDURE The diagram below summarizes the process of slide evaluation using a fluorescent microscope .
LOCATE TARGET VIEWING AREA
ASSESS TARGET AREA
FIELD OF VIEW SELECTION AND EVALUATION
CELL SELECTION
ENUMERATION
Use 10x to 25x objective to locate the area of interest on the slide within the scribe mark
Use 60x to 100x objective to assess area for quality of signal and morphology
Scan scribed area to assess distribution of signals
Choose representative areas for enumeration
Using prescribed filters, enumerate 50 cells using 60x to 100x objective, record and calculate results

4
LOCATE TARGET (SCRIBED) AREA USING 10x–25x OBJECTIVE Position the objective lens within the scribed area, to assure that only tumor cells are evaluated . If necessary, use the H&E stained slide to confirm the target area prior to viewing the FISH slides .
NOTE: Accurate marking (scribing) of the tumor area is essential to avoid enumeration of adjacent, non-tumor areas.
EXAMPLE 1. H&E stained tumor section: poorly differentiated adenocarcinoma . Figure A, overall low-magnification view; Figure B, magnification of boxes 1 and 2 .
Figure A.
Tumor mark transferred to the unstained slide
Tumor marked on H&E slide
1
2
TUMOR CELLS
NECROSIS
TUMOR STROMA

5
Figure B.
+
2
1
+
+
NECROSIS
TUMOR CELLS
TUMOR CELLS
NECROSIS
TUMOR CELLS
INFLAMMATORY CELLS
TUMOR CELLS
INFLAMMATORY CELLS

6
Use a 10x to 25x objective and the DAPI bandpass filter to locate the hybridized area of interest on the slide within the scribe mark .
Choose areas where tumor cells are readily distinguishable:
• Avoid areas of necrosis and where the nuclear borders are ambiguous (such as areas with excess stroma)
• Skip nuclei with insufficient counterstain to determine the nuclear border
NOTE: Tumor specimens vary in appearance due to the specimen size and tumor biology, such as histolopathologic type, pattern and grade. A 2013 guideline “Molecular Testing Guideline for Selection of Lung Cancer Patients for EGFR and ALK Tyrosine Kinase Inhibitors” published by CAP, IASLC and AMP, recommends users to become familiar with the morphological appearance of the NSCLC specimens including the architectural features of the tumor.2
EXAMPLE 2. Tumor areas acceptable for enumeration, with well-distinguishable tumor cells, are encircled on 2 different tumor specimens . The specimen on the right has acceptable (indicated by a circle) and unacceptable areas (indicated by an arrow) with tumor stroma and only a few interspersed cells .
2 Lindeman N .I . et al . 2013 . Molecular Testing Guideline for Selection of Lung Cancer Patients for EGFR and ALK Tyrosine Kinase Inhibitors . Guideline from the College of American Pathologists, International Association for the Study of Lung Cancer, and Association for Molecular Pathology . Arch . Pathol . Lab Med . 137(6):828–60 .

7
EXAMPLE 3. Tumor areas not acceptable for enumeration .
Area with poorly distinguishable tumor cells, no distinct cell boundaries and clumps of cells observed .
Visible stroma and undigested material between cells (pretreatment or protease digestion may have been insufficient) .

8
ASSESS TARGET AREA USING 60x–100x OBJECTIVE Using a 60x to 100x objective, use the prescribed filters to examine the quality of ALK signals and quality of tissue morphology . Adjust the depth of the focus and become familiar with the size and shape of the target signals and noise (debris) . Verify that background appears dark and relatively free of strong fluorescence that can make enumeration difficult .
EXAMPLE 4. FFPE slides viewed with four filters with the 60x objective .
DAPI
GREEN
DUAL O/G
ORANGE

9
As visible with the DAPI filter, the nuclear boundaries are easily distinguished, nuclei have good integrity and are not overlapping (indicated with an arrow) .
As visible in DAPI/orange/green, the nuclear boundaries are easily distinguished, nuclei have good integrity and are not overlapping (indicated with an arrow) .
ASSESS SLIDE HYBRIDIZATION ADEQUACY USING THE FOLLOWING CRITERIA: • Nuclear morphology: Borders of tumor nuclei observed by DAPI should be distinguishable,
and nuclei should have good integrity .
EXAMPLE 5. Nuclear morphology evaluated with a 60x or 100x objective .
Nuclear morphology acceptable for signal enumeration

10
Nuclear boundaries are not distinguishable as visualized with the DAPI filter . In this example, there is an insufficient DAPI staining, and nuclei are difficult to visualize .
Nuclear boundaries are not distinguishable . In this example, there is a visible undigested material between cells that obscures cell boundaries .
Nuclear boundaries are not distinguishable . In this example, high cell density resulted in overlapping nuclei .
Nuclear morphology not acceptable for signal enumeration

11
Nuclear boundaries are not distinguishable and do not have good integrity . In this example, nuclei appear fragmented, DAPI staining is weak due to tissue damage/loss .
Nuclear boundaries are not distinguishable . DAPI staining is weak . In this example, cellular apoptosis with degradation of nuclear morphology is suspected in the selected area .

12
Signals are bright, compact, and well distinguishable against nuclear background . Intercellular background is dark, without particulates .
Fluorescent haze or glow is noticeable outside of the nuclei, but does not cover the nuclei and does not make enumeration difficult .
• Background: The background should not contain particles that interfere with enumeration .
NOTE: In some cases, fluorescent haze or glow may be noticeable outside of the nuclei, but as long as the fluorescent haze/glow does not cover the nuclei and interfere with the enumeration it is acceptable.
EXAMPLE 6. Fluorescent background
Fluorescent background acceptable for enumeration

13
Bright particulate fluorescent background obscuring specific probe signal (image captured with the dual orange/green filter) .
Hazy fluorescent background obscures the signal (image captured with green, above, and dual orange/green, below, filters) .
Fluorescent background not acceptable for enumeration

14
Bright, distinct, and easily evaluable fluorescent signals viewed with 100x objective with the dual orange/green filter . The signals are compact .
Bright, distinct, and easily evaluable fluorescent signals viewed with 60x objective with the dual orange and green filters . The signals are compact .
• Probe signal intensity: The signals should be bright, distinct, and easily evaluable . Signals should be compact, round or oval shapes . Overly diffuse signals should be avoided .
EXAMPLE 7. Probe signal intensity
Probe signal intensity acceptable for signal enumeration

15
Weak signal intensity as viewed with a triple (DAPI/orange/green) filter to illustrate weak signal within nuclei with distinct nuclear boundaries, possibly due to the inappropriate tissue fixation .
Weak/absent orange probe signal . This specimen also shows indistinct cell boundaries, damaged and irregular cell morphology, possibly due to tissue over-digestion .
Weak/absent green probe signal . This specimen also shows indistinct cell boundaries, damaged and irregular cell morphology, and high nuclear background, possibly due to tissue over-digestion .
Probe signal intensity not acceptable for signal enumeration
The majority of the target viewing areas selection should meet the quality criteria listed above. Additionally, the target viewing areas must contain sufficient number of evaluable tumor cells.

16
SELECTING AND ENUMERATING CELLS WITHIN THE SELECTED TARGET AREA • Select an area of good nuclear distribution (i .e ., where individual nuclei can be distinguished)
and ensure areas chosen for enumeration are representative of the signal distribution observed .
• Using a 60x to 100x objective and prescribed filters, begin analysis of the cells selected for enumeration and record signals in each cell .
• Move to the next representative area (microscope field of view) for enumeration until 50 tumor cells have been enumerated .
• Focus up and down to find all of the signals present in the nucleus . Enumerate the signals within the nuclear boundary of each selected interphase tumor cell .
EXAMPLE 8. Relationship between tumor section, scribed target area, area chosen for enumeration, and fields of view (microscope)
AREA CHOSEN FOR ENUMERATION
MICROSCOPE FIELDS OF VIEW
TUMOR SPECIMEN SECTION
SCRIBE MARK ENCIRCLING TARGET AREA

17
Individual, non-overlapping nuclei with distinct nuclear boundaries are selected in this example (DAPI filter image) .
The selected cells have signals of both colors, are free of fluorescent background that obscures signals (dual orange/green filter) .
Overlapping cells in clumps with no distinguishable nuclear boundaries . Selected “cell” may contain several overlapping cells and should not have been selected .
SELECTING CELLS FOR ENUMERATION EXAMPLE 9. Cell selection
Correct cell selection
Incorrect cell selection

18
Fluorescent particulate background obscuring signal and interfering with enumeration . Cells covered with the particulate background should not have been selected .
Weak signals and high background interfering with enumeration . Signals are diffuse, elongated . In the selected cell, a hazy background obscures probe signals, the signals are diffuse, and nuclear boundaries are not clearly distinguishable .
Cells indicated by circles contain signal of only one color (green or orange), and should not be selected for enumeration . Cells selected for enumeration must have at least one signal of each color .

19
ENUMERATING CELLS • Using a 60x to 100x objective and prescribed filters, begin analysis of the cells selected for
enumeration and record signals in each cell .
• Focus up and down to find all of the signals present in the nucleus . Enumerate the signals within the nuclear boundary of each selected interphase tumor cell according to the enumeration guidelines (see Enumeration section for example images), determining, for each cell, whether it is positive or negative .
ALK ENUMERATION (SIGNAL PATTERNS) EXAMPLE 10. Positive cells
These nuclei contain rearranged or “broken-apart” signals, 2 or more signal diameters apart.
The nucleus indicated by an arrow has one fused signal (adjacent orange and green) and one set of broken apart signal individual green and orange signal .
A nucleus can have a single orange signal (deleted green signal) in addition to fused and/or broken apart signals .
In a nucleus indicated by an arrow there are two fused signals and one single orange signal .
The nucleus indicated by an arrow has more than one set of broken apart signals .

20
This positive cell has two fused signals and two broken-apart signals .
The same nucleus may have fused signals, broken apart signals and/or deletions .
The positive cell indicated by an arrow has one fused signal, one broken-apart signal and one single red signal. The cell to the left has two fused signals (negative cell).
Fused orange and green signals are either overlapping, adjacent or are less than two signal diameters apart . If diffuse signals are adjacent or connected by a fiber, they are recorded as one fused signal .
In this example, a cell contains one yellow fused signal, and adjacent diffuse orange and green signals .
Multiple fused and/or broken apart signals may be observed in a single nucleus . This represents tumor aneuploidy .
In this example, the cell indicated by an arrow contains seven pairs of fused signals . The adjacent cell contains two pairs of fused signals .
EXAMPLE 11. Negative cells

21
A single green signal without a corresponding orange signal in addition to fused signal (overlapping, adjacent, or are less than 2 signal diameters apart) is considered negative .
In this example, the cell with a single green signal in addition to two pairs of fused signals is shown by an arrow .
NOTE: A nucleus with signals of only one color should not be enumerated . The cell shown by an arrow has only orange signals and should not be selected for enumeration .
ALK STATUS DETERMINATION • A sample is considered negative if < 5 cells out of 50 (< 5/50 or < 10%) are positive .
• A sample is considered positive if > 25 cells out of 50 (> 25/50 or > 50%) are positive .
• A sample is considered equivocal if 5 to 25 cells (10 to 50%) are positive . If the sample is equivocal, the slide is evaluated by the second reader who selects additional 50 nuclei
— The first and second cell count readings are added together and a percent is calculated out of 100 cells (average percent of positive cells) .
• If the average percent positive cells is < 15% (< 15/100), the sample is considered negative .
• If the average percent positive cells is ≥ 15% (≥ 15/100), the sample is considered positive .
AMD-00002974