Embed Size (px)
Citation preview
AlgII.10.09.14graph calc(lin.reg).notebook
1
October 09, 2014
AlgII.10.09.14graph calc(lin.reg).notebook
2
October 09, 2014
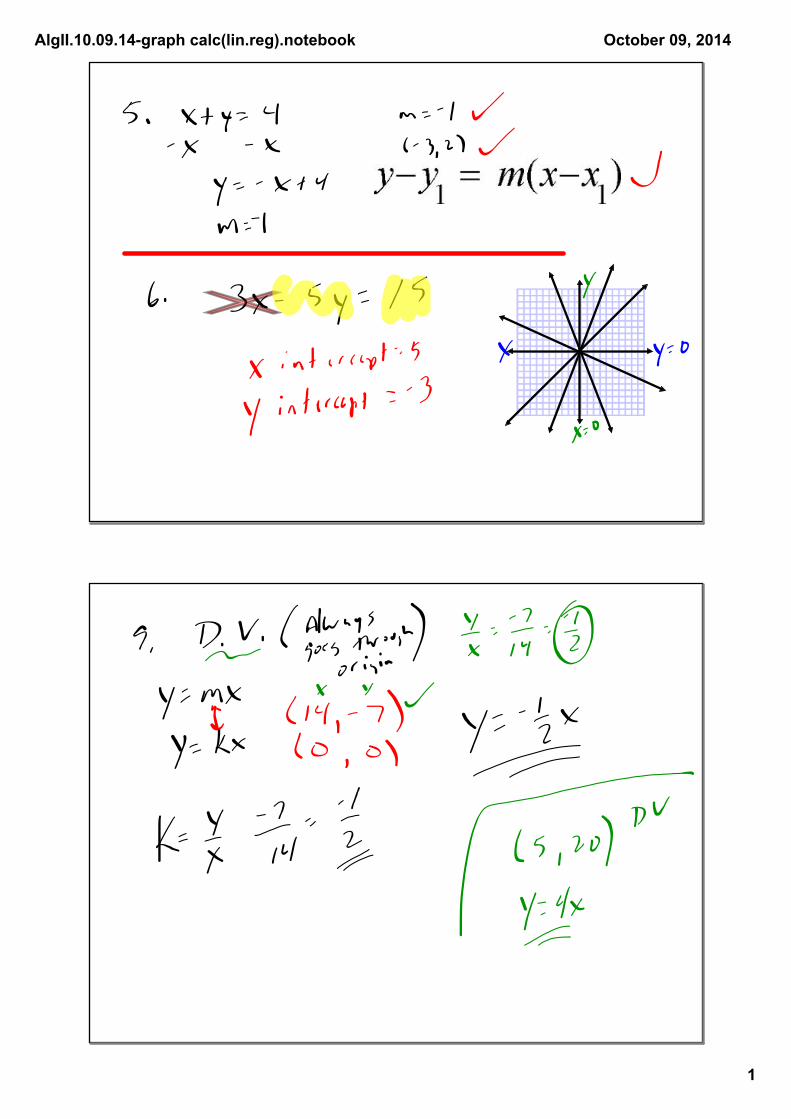
Thursday, 10914, Section 2.5 p. 100
Correlation & Best Fitting LinesGoal: Use a scatter plot to identify the correlation shown by a set of data.
Scatter plot graph used to determine whether there is a relationship between paired data.
negative
correlation
no
correlationpositive
correlation
line of best fit/trend line
AlgII.10.09.14graph calc(lin.reg).notebook
3
October 09, 2014
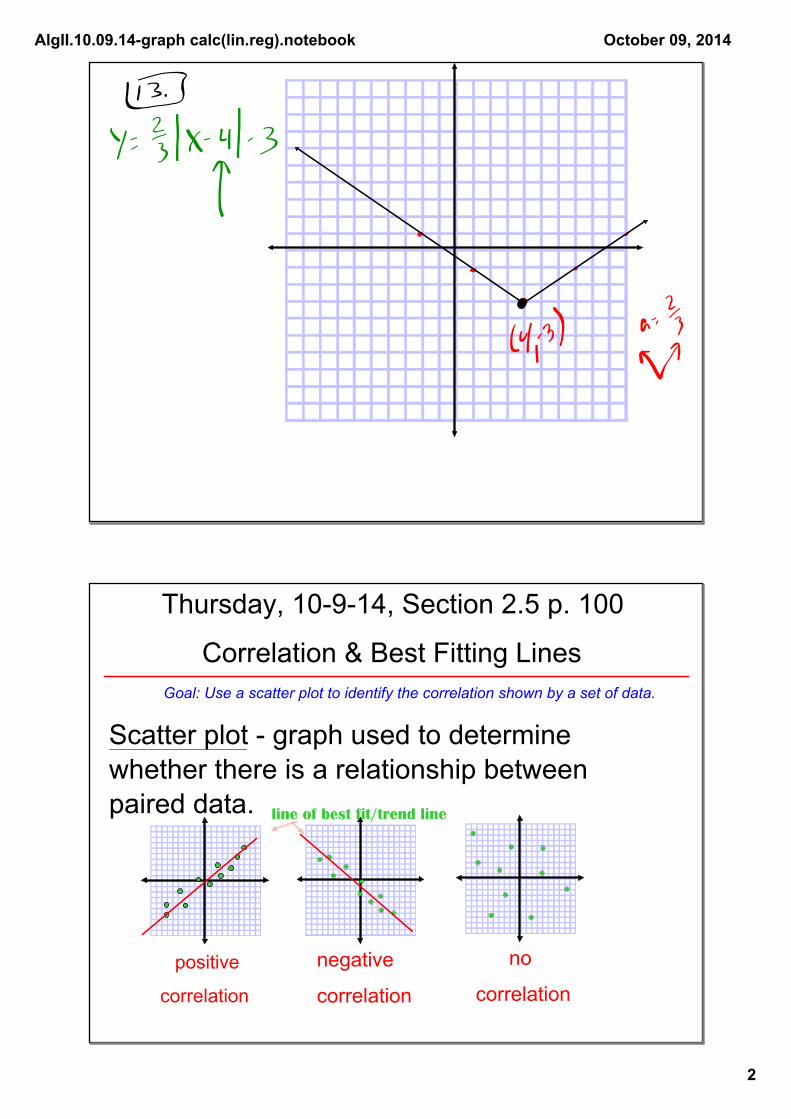
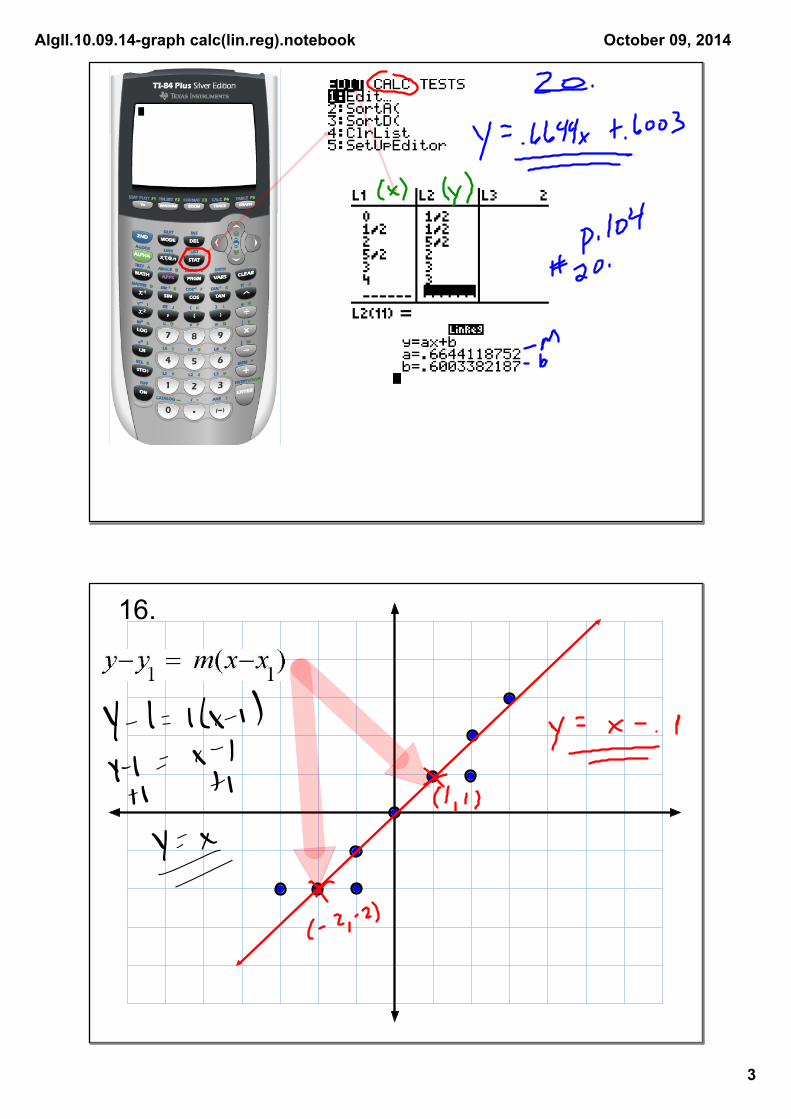
16.
AlgII.10.09.14graph calc(lin.reg).notebook
4
October 09, 2014
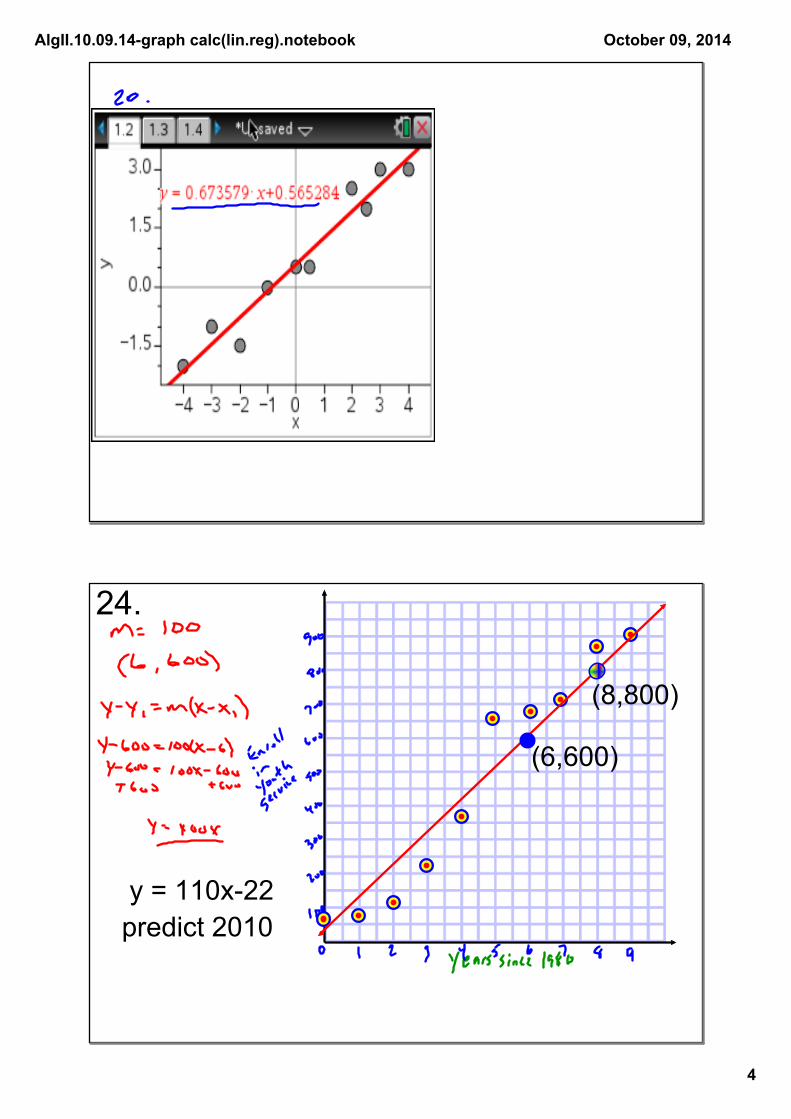
(6,600)
(8,800)
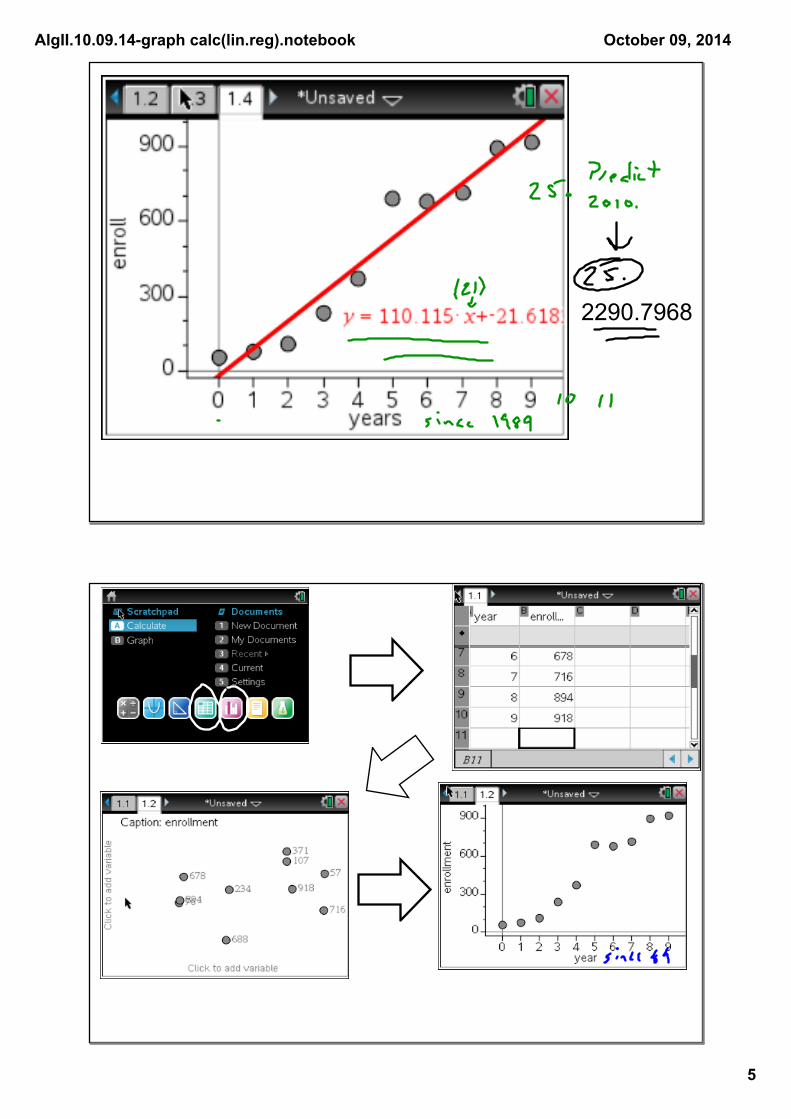
y = 110x22predict 2010
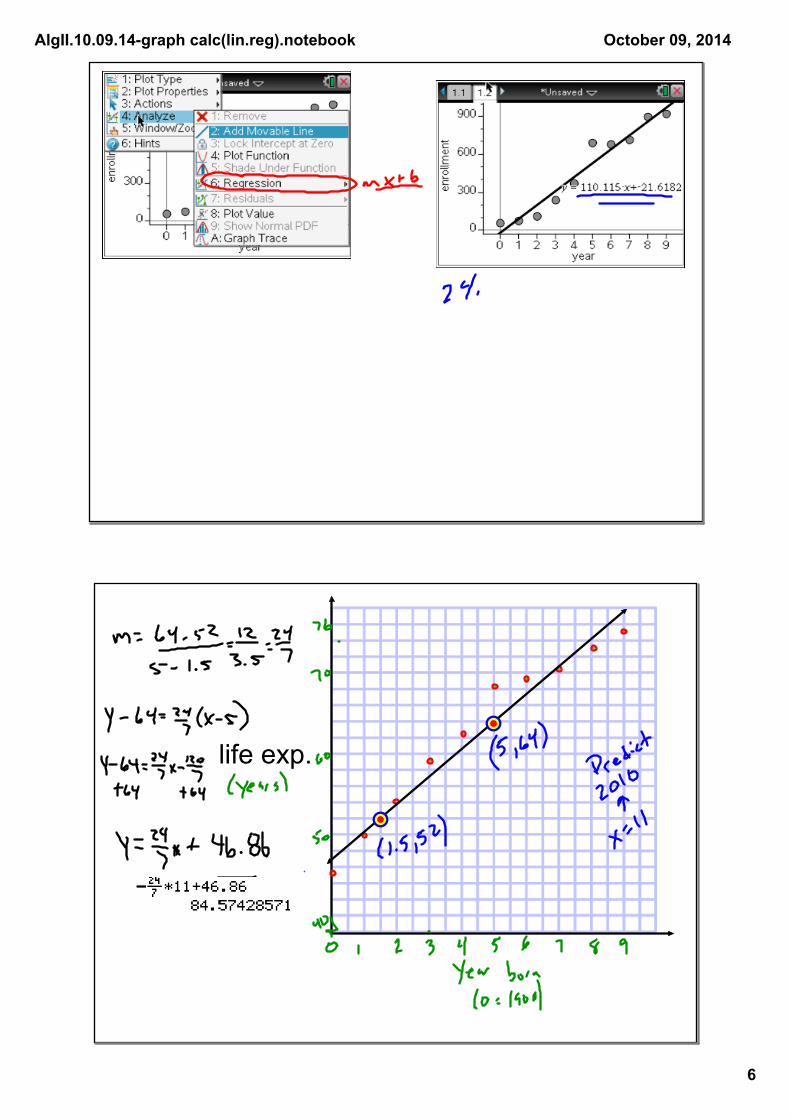
24.
AlgII.10.09.14graph calc(lin.reg).notebook
5
October 09, 2014
2290.7968
AlgII.10.09.14graph calc(lin.reg).notebook
6
October 09, 2014
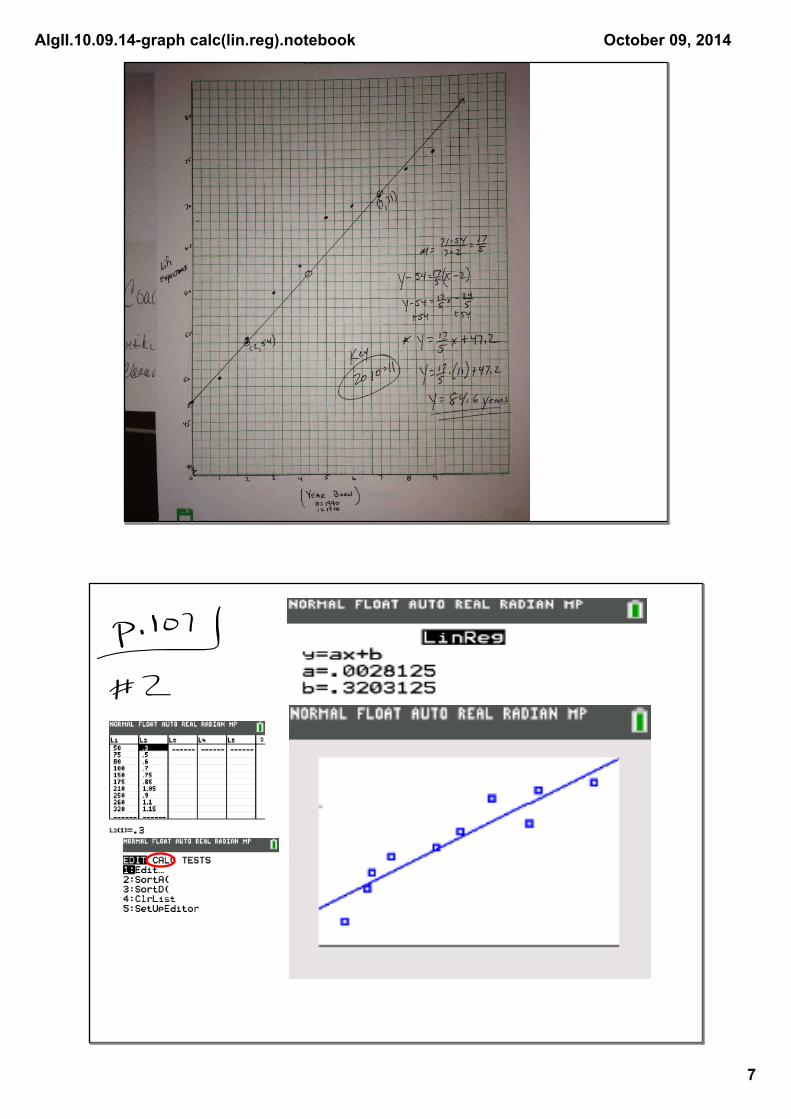
life exp.
AlgII.10.09.14graph calc(lin.reg).notebook
7
October 09, 2014
AlgII.10.09.14graph calc(lin.reg).notebook
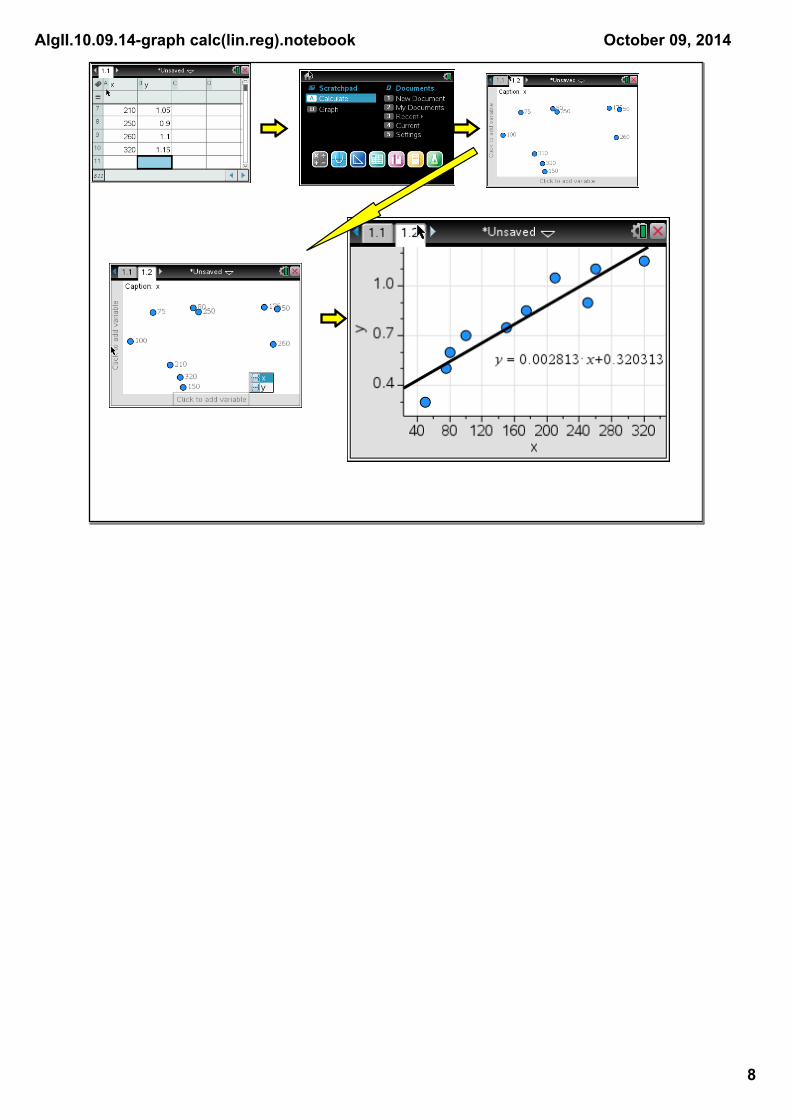
8
October 09, 2014