Embed Size (px)
Citation preview
UNIT 5
TEMPLATE CREATED BY
REGION 1 ESA
UNIT 5
ALGEBRA I
Algebra 1 Math Tool Unit 5
Template created by Region 1 ESA Page 2 of 33
Algebra 1 Unit 5 Overview: Quadratic Functions and Modeling In preparation for work with quadratic relationships students explore distinctions between rational and irrational numbers. They consider quadratic functions, comparing the key characteristics of quadratic functions to those of linear and exponential functions. They select from among these functions to model phenomena. Students learn to anticipate the graph of a quadratic function by interpreting various forms of quadratic expressions. In particular, they identify the real solutions of a quadratic equation as the zeros of a related quadratic function. Students learn that when quadratic equations do not have real solutions the number system must be extended so that solutions exist, analogous to the way in which extending the whole numbers to the negative numbers allows x+1 = 0 to have a solution. Formal work with complex numbers comes in Algebra II. Students expand their experience with functions to include more specialized functions—absolute value, step, and those that are piecewise-defined. Note:
It is important to note that the units (or critical areas) are intended to convey coherent groupings of content. The clusters and standards within units are ordered
as they are in the Common Core State Standards, and are not intended to convey an instructional order. Considerations regarding constraints, extensions, and
connections are found in the instructional notes. The instructional notes are a critical attribute of the courses and should not be overlooked. For example, one
will see that standards such as A.CED.1 and A.CED.2 are repeated in multiple courses, yet their emphases change from one course to the next. These changes are
seen only in the instructional notes, making the notes an indispensable component of the pathways.
(All instructional notes/suggestions will be found in italics throughout this document)
Modeling is best interpreted not as a collection of isolated topics but rather in relation to other standards. Making mathematical models is a Standard for
Mathematical Practice, and specific modeling standards appear throughout the high school standards indicated by a star symbol
Algebra 1 Math Tool Unit 5
Template created by Region 1 ESA Page 3 of 33
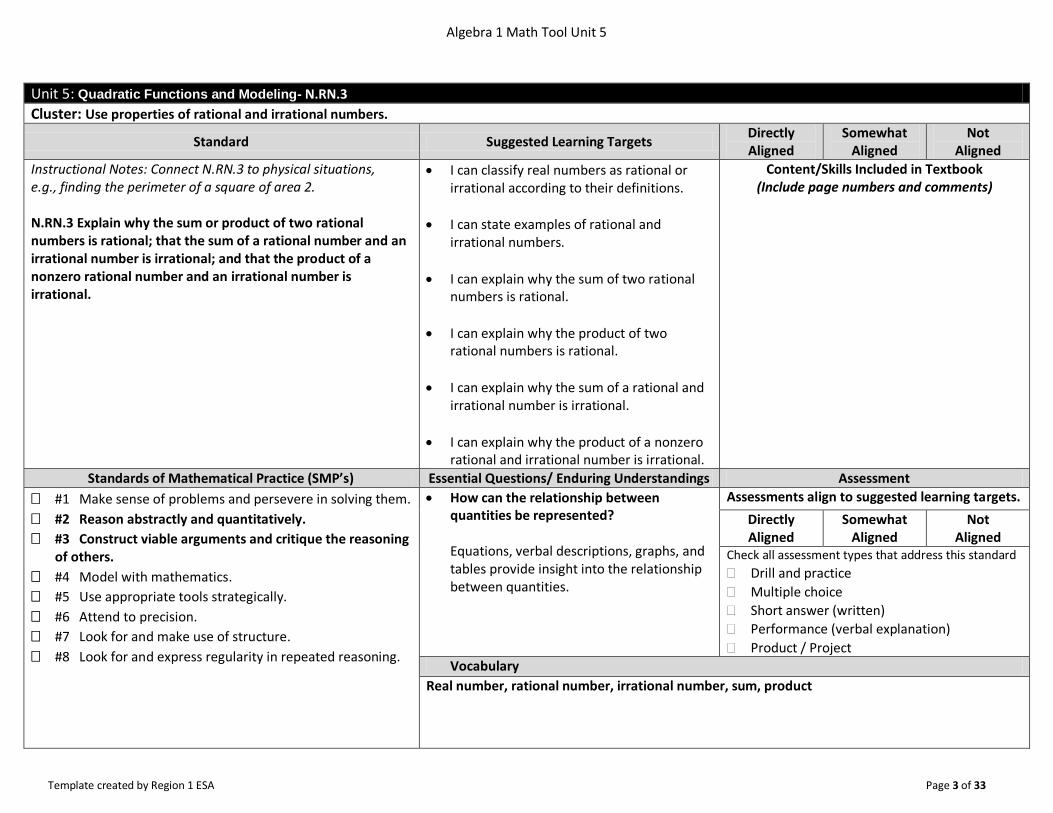
Unit 5: Quadratic Functions and Modeling- N.RN.3
Cluster: Use properties of rational and irrational numbers.
Standard Suggested Learning Targets Directly Aligned
Somewhat Aligned
Not Aligned
Instructional Notes: Connect N.RN.3 to physical situations, e.g., finding the perimeter of a square of area 2. N.RN.3 Explain why the sum or product of two rational numbers is rational; that the sum of a rational number and an irrational number is irrational; and that the product of a nonzero rational number and an irrational number is irrational.
I can classify real numbers as rational or irrational according to their definitions.
I can state examples of rational and irrational numbers.
I can explain why the sum of two rational numbers is rational.
I can explain why the product of two rational numbers is rational.
I can explain why the sum of a rational and irrational number is irrational.
I can explain why the product of a nonzero rational and irrational number is irrational.
Content/Skills Included in Textbook (Include page numbers and comments)
Standards of Mathematical Practice (SMP’s) Essential Questions/ Enduring Understandings Assessment
#1 Make sense of problems and persevere in solving them.
#2 Reason abstractly and quantitatively.
#3 Construct viable arguments and critique the reasoning of others.
#4 Model with mathematics.
#5 Use appropriate tools strategically.
#6 Attend to precision.
#7 Look for and make use of structure.
#8 Look for and express regularity in repeated reasoning.
How can the relationship between quantities be represented? Equations, verbal descriptions, graphs, and tables provide insight into the relationship between quantities.
Assessments align to suggested learning targets.
Directly Aligned
Somewhat Aligned
Not Aligned
Check all assessment types that address this standard
Drill and practice
Multiple choice
Short answer (written)
Performance (verbal explanation)
Product / Project Vocabulary
Real number, rational number, irrational number, sum, product
Algebra 1 Math Tool Unit 5
Template created by Region 1 ESA Page 4 of 33
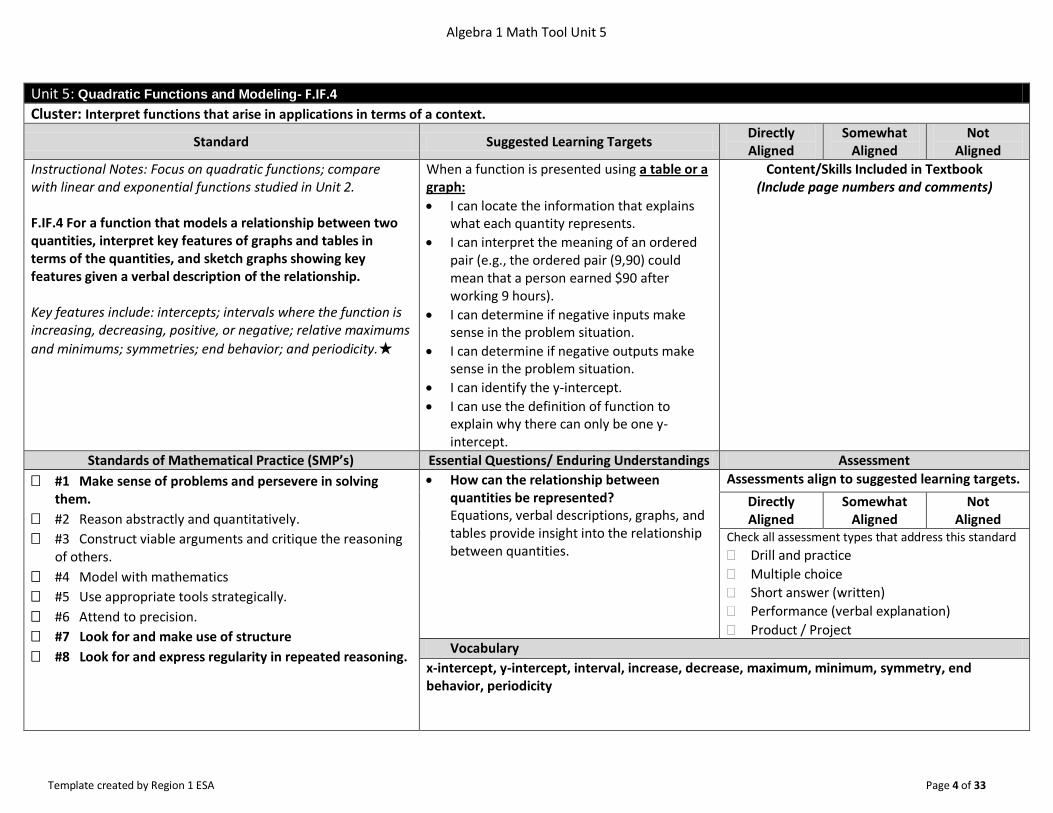
Unit 5: Quadratic Functions and Modeling- F.IF.4
Cluster: Interpret functions that arise in applications in terms of a context.
Standard Suggested Learning Targets Directly Aligned
Somewhat Aligned
Not Aligned
Instructional Notes: Focus on quadratic functions; compare with linear and exponential functions studied in Unit 2. F.IF.4 For a function that models a relationship between two quantities, interpret key features of graphs and tables in terms of the quantities, and sketch graphs showing key features given a verbal description of the relationship. Key features include: intercepts; intervals where the function is increasing, decreasing, positive, or negative; relative maximums
and minimums; symmetries; end behavior; and periodicity.★
When a function is presented using a table or a graph:
I can locate the information that explains what each quantity represents.
I can interpret the meaning of an ordered pair (e.g., the ordered pair (9,90) could mean that a person earned $90 after working 9 hours).
I can determine if negative inputs make sense in the problem situation.
I can determine if negative outputs make sense in the problem situation.
I can identify the y-intercept.
I can use the definition of function to explain why there can only be one y-intercept.
Content/Skills Included in Textbook (Include page numbers and comments)
Standards of Mathematical Practice (SMP’s) Essential Questions/ Enduring Understandings Assessment
#1 Make sense of problems and persevere in solving them.
#2 Reason abstractly and quantitatively.
#3 Construct viable arguments and critique the reasoning of others.
#4 Model with mathematics
#5 Use appropriate tools strategically.
#6 Attend to precision.
#7 Look for and make use of structure
#8 Look for and express regularity in repeated reasoning.
How can the relationship between quantities be represented? Equations, verbal descriptions, graphs, and tables provide insight into the relationship between quantities.
Assessments align to suggested learning targets.
Directly Aligned
Somewhat Aligned
Not Aligned
Check all assessment types that address this standard
Drill and practice
Multiple choice
Short answer (written)
Performance (verbal explanation)
Product / Project Vocabulary
x-intercept, y-intercept, interval, increase, decrease, maximum, minimum, symmetry, end behavior, periodicity
Algebra 1 Math Tool Unit 5
Template created by Region 1 ESA Page 5 of 33
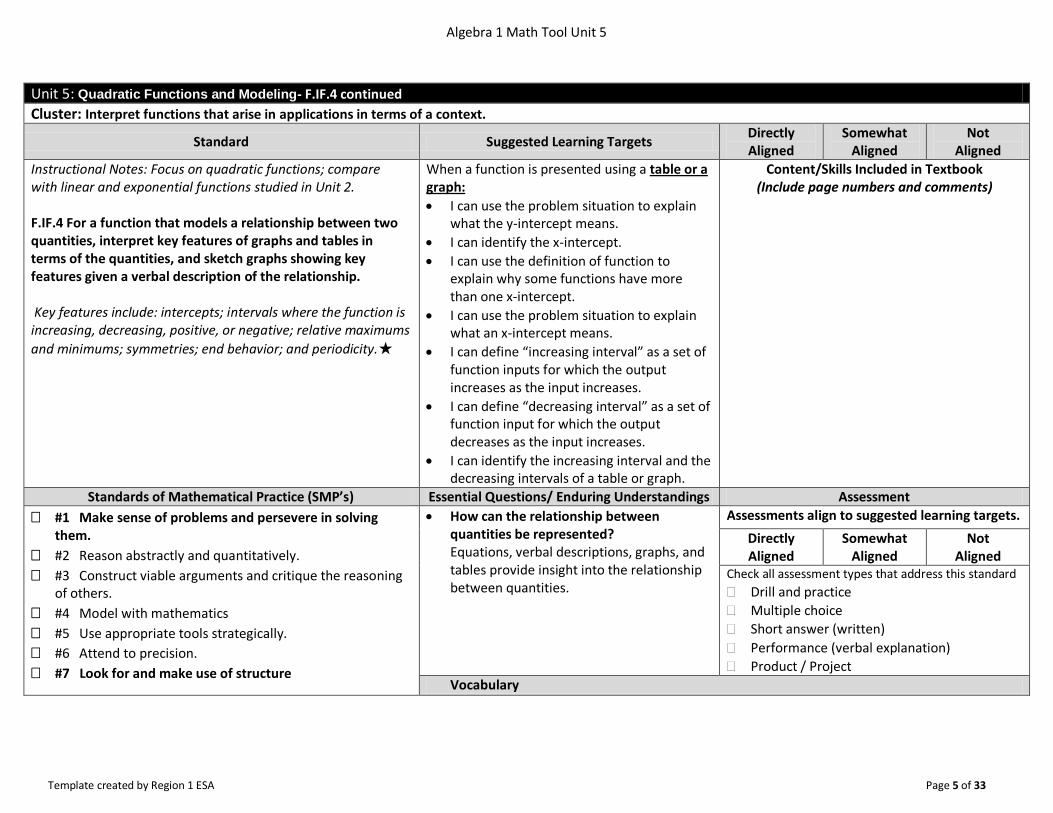
Unit 5: Quadratic Functions and Modeling- F.IF.4 continued
Cluster: Interpret functions that arise in applications in terms of a context.
Standard Suggested Learning Targets Directly Aligned
Somewhat Aligned
Not Aligned
Instructional Notes: Focus on quadratic functions; compare with linear and exponential functions studied in Unit 2. F.IF.4 For a function that models a relationship between two quantities, interpret key features of graphs and tables in terms of the quantities, and sketch graphs showing key features given a verbal description of the relationship. Key features include: intercepts; intervals where the function is increasing, decreasing, positive, or negative; relative maximums
and minimums; symmetries; end behavior; and periodicity.★
When a function is presented using a table or a graph:
I can use the problem situation to explain what the y-intercept means.
I can identify the x-intercept.
I can use the definition of function to explain why some functions have more than one x-intercept.
I can use the problem situation to explain what an x-intercept means.
I can define “increasing interval” as a set of function inputs for which the output increases as the input increases.
I can define “decreasing interval” as a set of function input for which the output decreases as the input increases.
I can identify the increasing interval and the decreasing intervals of a table or graph.
Content/Skills Included in Textbook (Include page numbers and comments)
Standards of Mathematical Practice (SMP’s) Essential Questions/ Enduring Understandings Assessment
#1 Make sense of problems and persevere in solving them.
#2 Reason abstractly and quantitatively.
#3 Construct viable arguments and critique the reasoning of others.
#4 Model with mathematics
#5 Use appropriate tools strategically.
#6 Attend to precision.
#7 Look for and make use of structure
How can the relationship between quantities be represented? Equations, verbal descriptions, graphs, and tables provide insight into the relationship between quantities.
Assessments align to suggested learning targets.
Directly Aligned
Somewhat Aligned
Not Aligned
Check all assessment types that address this standard
Drill and practice
Multiple choice
Short answer (written)
Performance (verbal explanation)
Product / Project
Vocabulary
Algebra 1 Math Tool Unit 5
Template created by Region 1 ESA Page 6 of 33
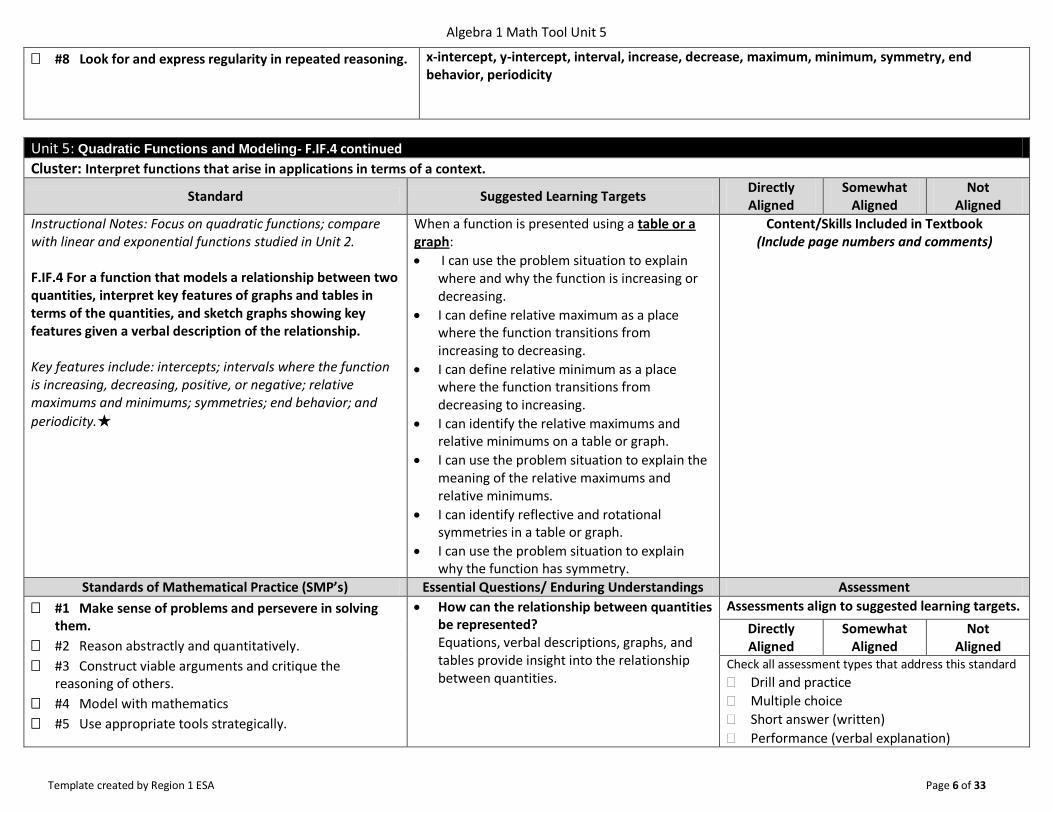
#8 Look for and express regularity in repeated reasoning. x-intercept, y-intercept, interval, increase, decrease, maximum, minimum, symmetry, end behavior, periodicity
Unit 5: Quadratic Functions and Modeling- F.IF.4 continued
Cluster: Interpret functions that arise in applications in terms of a context.
Standard Suggested Learning Targets Directly Aligned
Somewhat Aligned
Not Aligned
Instructional Notes: Focus on quadratic functions; compare with linear and exponential functions studied in Unit 2. F.IF.4 For a function that models a relationship between two quantities, interpret key features of graphs and tables in terms of the quantities, and sketch graphs showing key features given a verbal description of the relationship. Key features include: intercepts; intervals where the function is increasing, decreasing, positive, or negative; relative maximums and minimums; symmetries; end behavior; and
periodicity.★
When a function is presented using a table or a graph:
I can use the problem situation to explain where and why the function is increasing or decreasing.
I can define relative maximum as a place where the function transitions from increasing to decreasing.
I can define relative minimum as a place where the function transitions from decreasing to increasing.
I can identify the relative maximums and relative minimums on a table or graph.
I can use the problem situation to explain the meaning of the relative maximums and relative minimums.
I can identify reflective and rotational symmetries in a table or graph.
I can use the problem situation to explain why the function has symmetry.
Content/Skills Included in Textbook (Include page numbers and comments)
Standards of Mathematical Practice (SMP’s) Essential Questions/ Enduring Understandings Assessment
#1 Make sense of problems and persevere in solving them.
#2 Reason abstractly and quantitatively.
#3 Construct viable arguments and critique the reasoning of others.
#4 Model with mathematics
#5 Use appropriate tools strategically.
How can the relationship between quantities be represented? Equations, verbal descriptions, graphs, and tables provide insight into the relationship between quantities.
Assessments align to suggested learning targets.
Directly Aligned
Somewhat Aligned
Not Aligned
Check all assessment types that address this standard
Drill and practice
Multiple choice
Short answer (written)
Performance (verbal explanation)
Algebra 1 Math Tool Unit 5
Template created by Region 1 ESA Page 7 of 33
#6 Attend to precision.
#7 Look for and make use of structure
#8 Look for and express regularity in repeated reasoning.
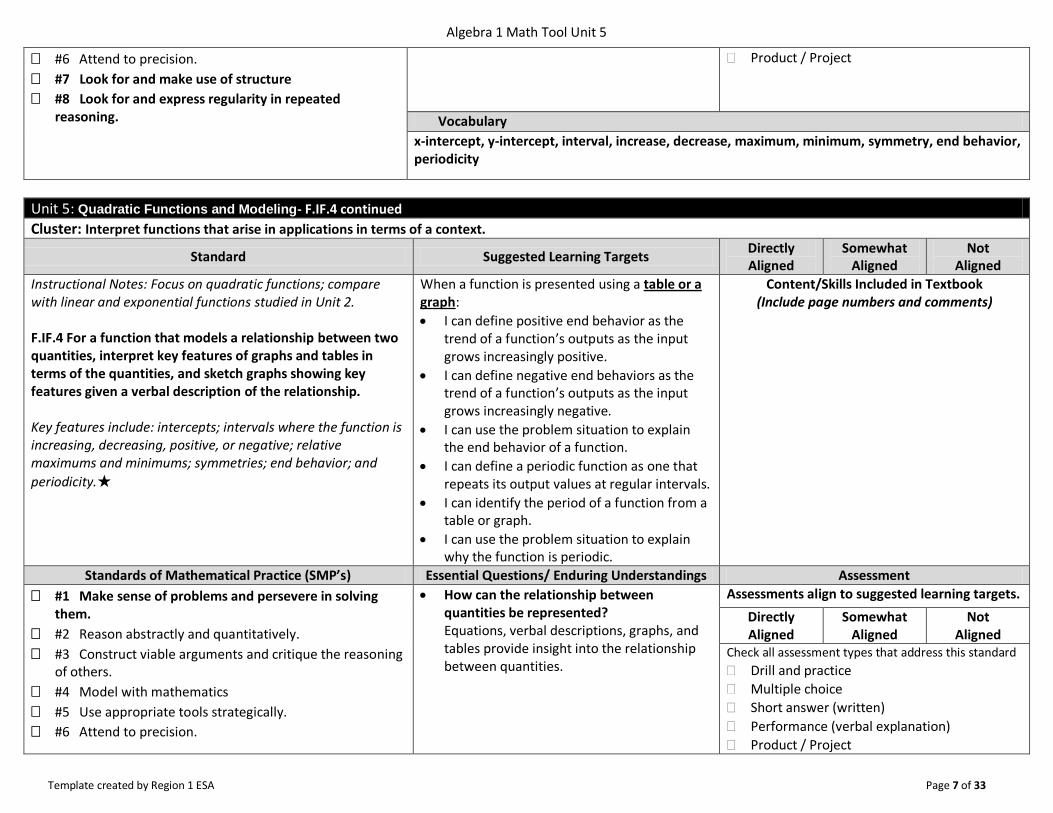
Product / Project
Vocabulary
x-intercept, y-intercept, interval, increase, decrease, maximum, minimum, symmetry, end behavior, periodicity
Unit 5: Quadratic Functions and Modeling- F.IF.4 continued
Cluster: Interpret functions that arise in applications in terms of a context.
Standard Suggested Learning Targets Directly Aligned
Somewhat Aligned
Not Aligned
Instructional Notes: Focus on quadratic functions; compare with linear and exponential functions studied in Unit 2. F.IF.4 For a function that models a relationship between two quantities, interpret key features of graphs and tables in terms of the quantities, and sketch graphs showing key features given a verbal description of the relationship. Key features include: intercepts; intervals where the function is increasing, decreasing, positive, or negative; relative maximums and minimums; symmetries; end behavior; and
periodicity.★
When a function is presented using a table or a graph:
I can define positive end behavior as the trend of a function’s outputs as the input grows increasingly positive.
I can define negative end behaviors as the trend of a function’s outputs as the input grows increasingly negative.
I can use the problem situation to explain the end behavior of a function.
I can define a periodic function as one that repeats its output values at regular intervals.
I can identify the period of a function from a table or graph.
I can use the problem situation to explain why the function is periodic.
Content/Skills Included in Textbook (Include page numbers and comments)
Standards of Mathematical Practice (SMP’s) Essential Questions/ Enduring Understandings Assessment
#1 Make sense of problems and persevere in solving them.
#2 Reason abstractly and quantitatively.
#3 Construct viable arguments and critique the reasoning of others.
#4 Model with mathematics
#5 Use appropriate tools strategically.
#6 Attend to precision.
How can the relationship between quantities be represented? Equations, verbal descriptions, graphs, and tables provide insight into the relationship between quantities.
Assessments align to suggested learning targets.
Directly Aligned
Somewhat Aligned
Not Aligned
Check all assessment types that address this standard
Drill and practice
Multiple choice
Short answer (written)
Performance (verbal explanation)
Product / Project
Algebra 1 Math Tool Unit 5
Template created by Region 1 ESA Page 8 of 33
#7 Look for and make use of structure
#8 Look for and express regularity in repeated reasoning.
Vocabulary
x-intercept, y-intercept, interval, increase, decrease, maximum, minimum, symmetry, end behavior, periodicity
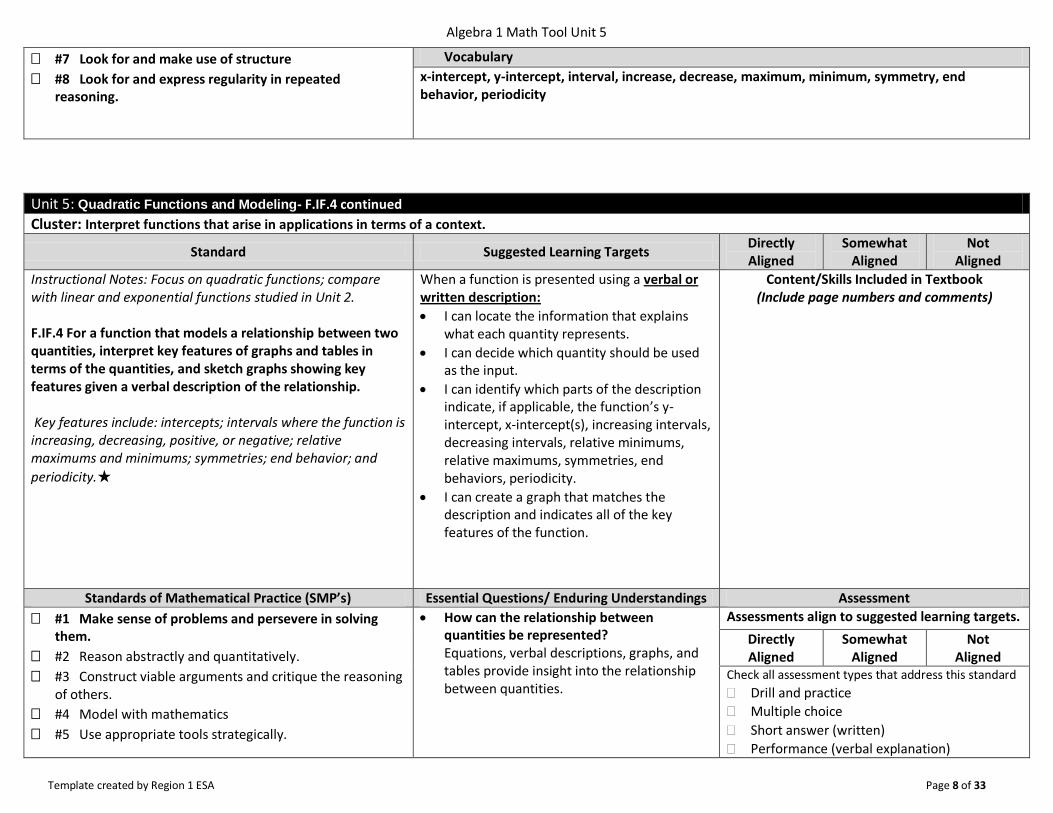
Unit 5: Quadratic Functions and Modeling- F.IF.4 continued
Cluster: Interpret functions that arise in applications in terms of a context.
Standard Suggested Learning Targets Directly Aligned
Somewhat Aligned
Not Aligned
Instructional Notes: Focus on quadratic functions; compare with linear and exponential functions studied in Unit 2. F.IF.4 For a function that models a relationship between two quantities, interpret key features of graphs and tables in terms of the quantities, and sketch graphs showing key features given a verbal description of the relationship. Key features include: intercepts; intervals where the function is increasing, decreasing, positive, or negative; relative maximums and minimums; symmetries; end behavior; and
periodicity.★
When a function is presented using a verbal or written description:
I can locate the information that explains what each quantity represents.
I can decide which quantity should be used as the input.
I can identify which parts of the description indicate, if applicable, the function’s y-intercept, x-intercept(s), increasing intervals, decreasing intervals, relative minimums, relative maximums, symmetries, end behaviors, periodicity.
I can create a graph that matches the description and indicates all of the key features of the function.
Content/Skills Included in Textbook (Include page numbers and comments)
Standards of Mathematical Practice (SMP’s) Essential Questions/ Enduring Understandings Assessment
#1 Make sense of problems and persevere in solving them.
#2 Reason abstractly and quantitatively.
#3 Construct viable arguments and critique the reasoning of others.
#4 Model with mathematics
#5 Use appropriate tools strategically.
How can the relationship between quantities be represented? Equations, verbal descriptions, graphs, and tables provide insight into the relationship between quantities.
Assessments align to suggested learning targets.
Directly Aligned
Somewhat Aligned
Not Aligned
Check all assessment types that address this standard
Drill and practice
Multiple choice
Short answer (written)
Performance (verbal explanation)
Algebra 1 Math Tool Unit 5
Template created by Region 1 ESA Page 9 of 33
#6 Attend to precision.
#7 Look for and make use of structure
#8 Look for and express regularity in repeated reasoning.
Product / Project
Vocabulary
x-intercept, y-intercept, interval, increase, decrease, maximum, minimum, symmetry, end behavior, periodicity
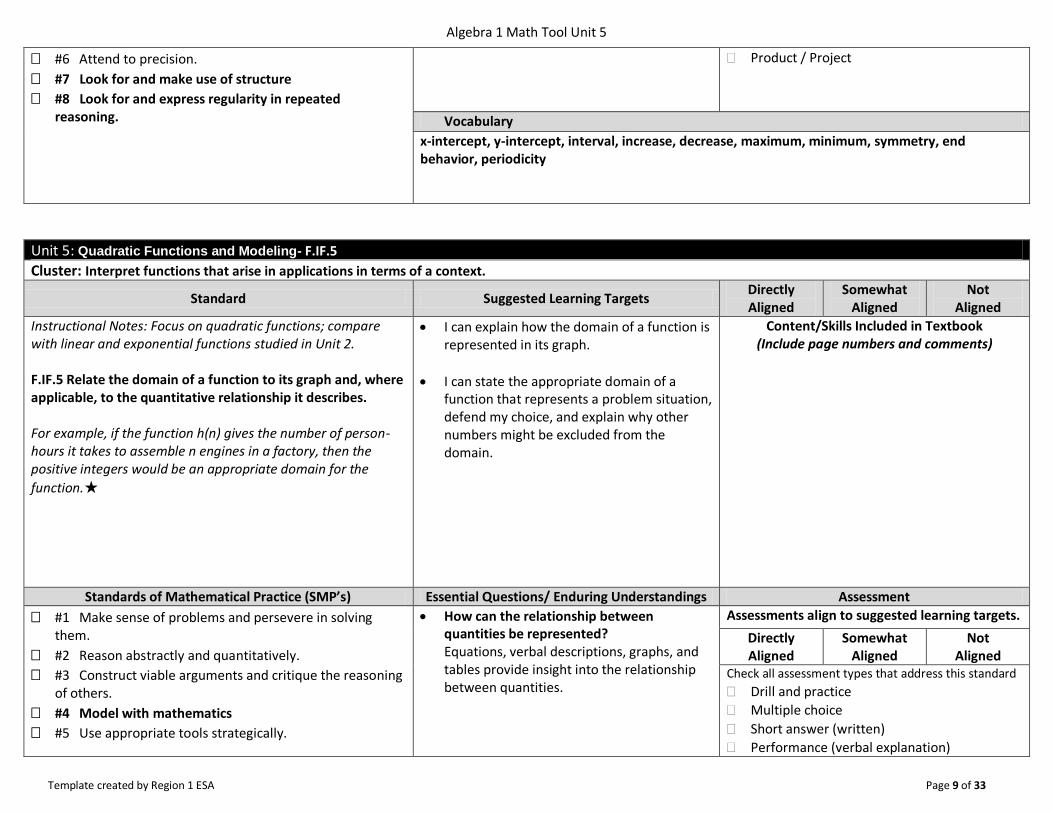
Unit 5: Quadratic Functions and Modeling- F.IF.5
Cluster: Interpret functions that arise in applications in terms of a context.
Standard Suggested Learning Targets Directly Aligned
Somewhat Aligned
Not Aligned
Instructional Notes: Focus on quadratic functions; compare with linear and exponential functions studied in Unit 2. F.IF.5 Relate the domain of a function to its graph and, where applicable, to the quantitative relationship it describes. For example, if the function h(n) gives the number of person-hours it takes to assemble n engines in a factory, then the positive integers would be an appropriate domain for the
function.★
I can explain how the domain of a function is represented in its graph.
I can state the appropriate domain of a function that represents a problem situation, defend my choice, and explain why other numbers might be excluded from the domain.
Content/Skills Included in Textbook (Include page numbers and comments)
Standards of Mathematical Practice (SMP’s) Essential Questions/ Enduring Understandings Assessment
#1 Make sense of problems and persevere in solving them.
#2 Reason abstractly and quantitatively.
#3 Construct viable arguments and critique the reasoning of others.
#4 Model with mathematics
#5 Use appropriate tools strategically.
How can the relationship between quantities be represented? Equations, verbal descriptions, graphs, and tables provide insight into the relationship between quantities.
Assessments align to suggested learning targets.
Directly Aligned
Somewhat Aligned
Not Aligned
Check all assessment types that address this standard
Drill and practice
Multiple choice
Short answer (written)
Performance (verbal explanation)
Algebra 1 Math Tool Unit 5
Template created by Region 1 ESA Page 10 of 33
#6 Attend to precision.
#7 Look for and make use of structure
#8 Look for and express regularity in repeated reasoning.
Product / Project
Vocabulary
Function, domain
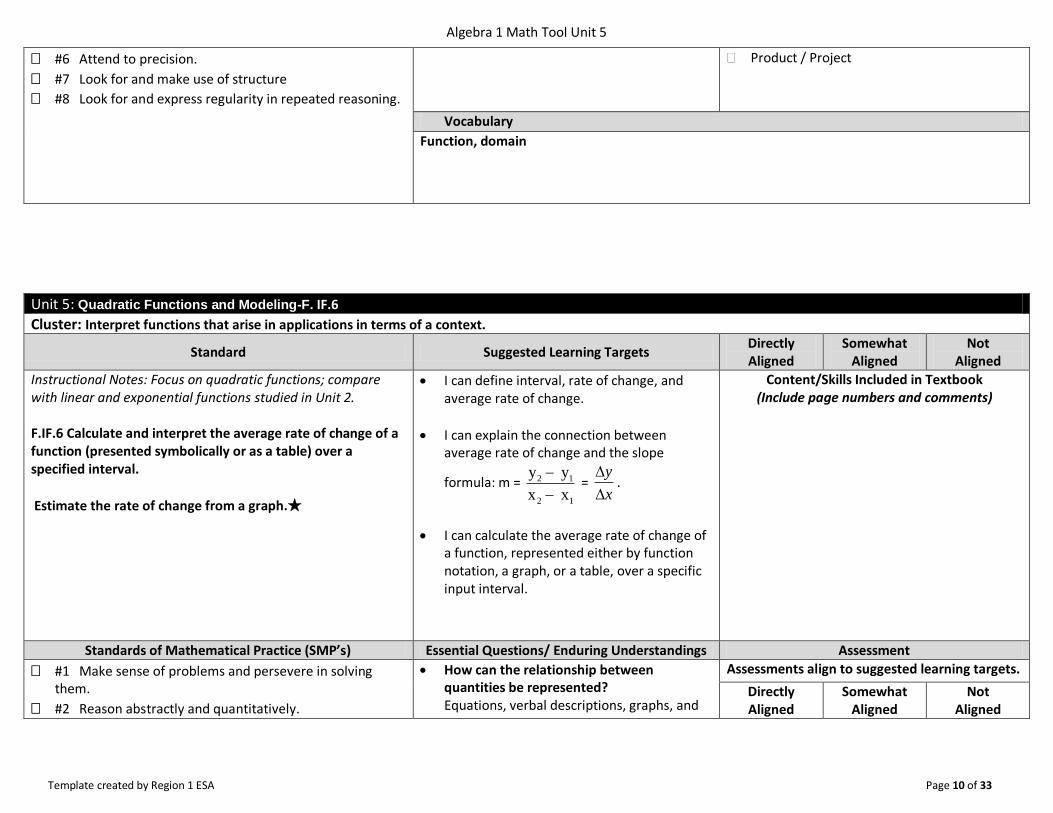
Unit 5: Quadratic Functions and Modeling-F. IF.6
Cluster: Interpret functions that arise in applications in terms of a context.
Standard Suggested Learning Targets Directly Aligned
Somewhat Aligned
Not Aligned
Instructional Notes: Focus on quadratic functions; compare with linear and exponential functions studied in Unit 2. F.IF.6 Calculate and interpret the average rate of change of a function (presented symbolically or as a table) over a specified interval.
Estimate the rate of change from a graph.★
I can define interval, rate of change, and average rate of change.
I can explain the connection between average rate of change and the slope
formula: m = 2 1
2 1
y y
x x
=
y
x
.
I can calculate the average rate of change of a function, represented either by function notation, a graph, or a table, over a specific input interval.
Content/Skills Included in Textbook (Include page numbers and comments)
Standards of Mathematical Practice (SMP’s) Essential Questions/ Enduring Understandings Assessment
#1 Make sense of problems and persevere in solving them.
#2 Reason abstractly and quantitatively.
How can the relationship between quantities be represented? Equations, verbal descriptions, graphs, and
Assessments align to suggested learning targets.
Directly Aligned
Somewhat Aligned
Not Aligned
Algebra 1 Math Tool Unit 5
Template created by Region 1 ESA Page 11 of 33
#3 Construct viable arguments and critique the reasoning of others.
#4 Model with mathematics
#5 Use appropriate tools strategically.
#6 Attend to precision.
#7 Look for and make use of structure
#8 Look for and express regularity in repeated reasoning.
tables provide insight into the relationship between quantities.
Check all assessment types that address this standard
Drill and practice
Multiple choice
Short answer (written)
Performance (verbal explanation)
Product / Project
Vocabulary
Function, rate of change, average rate of change, interval
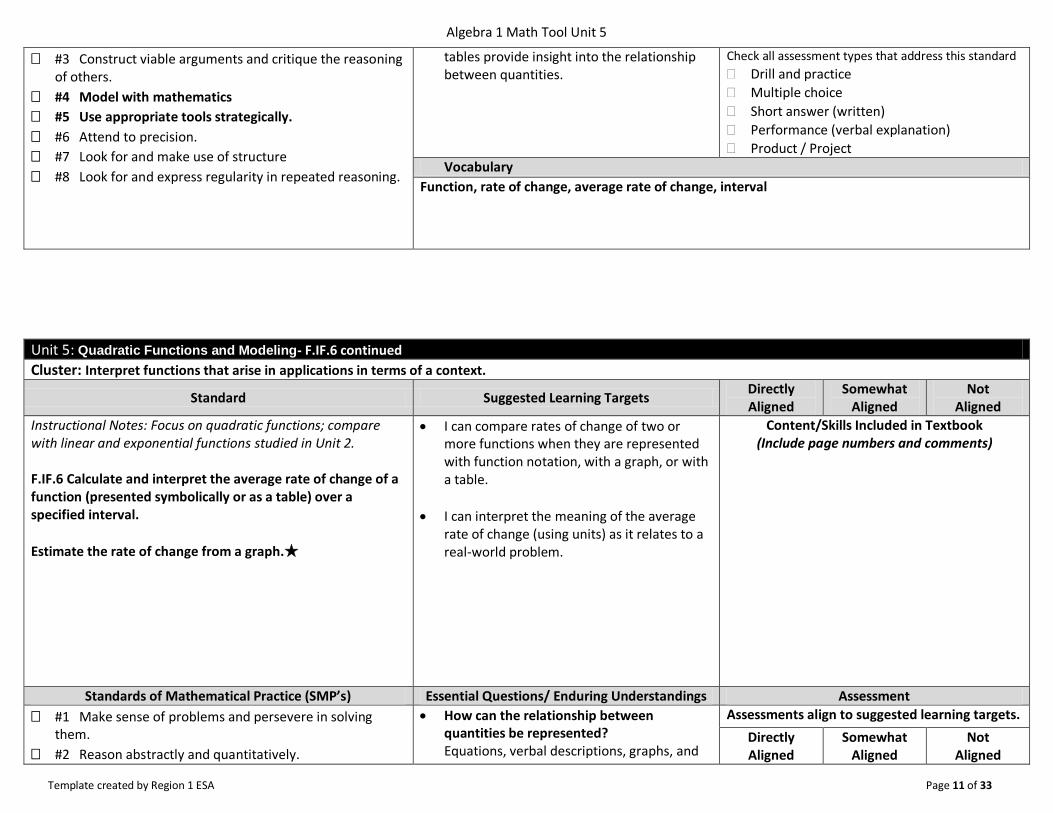
Unit 5: Quadratic Functions and Modeling- F.IF.6 continued
Cluster: Interpret functions that arise in applications in terms of a context.
Standard Suggested Learning Targets Directly Aligned
Somewhat Aligned
Not Aligned
Instructional Notes: Focus on quadratic functions; compare with linear and exponential functions studied in Unit 2. F.IF.6 Calculate and interpret the average rate of change of a function (presented symbolically or as a table) over a specified interval.
Estimate the rate of change from a graph.★
I can compare rates of change of two or more functions when they are represented with function notation, with a graph, or with a table.
I can interpret the meaning of the average rate of change (using units) as it relates to a real-world problem.
Content/Skills Included in Textbook (Include page numbers and comments)
Standards of Mathematical Practice (SMP’s) Essential Questions/ Enduring Understandings Assessment
#1 Make sense of problems and persevere in solving them.
#2 Reason abstractly and quantitatively.
How can the relationship between quantities be represented? Equations, verbal descriptions, graphs, and
Assessments align to suggested learning targets.
Directly Aligned
Somewhat Aligned
Not Aligned
Algebra 1 Math Tool Unit 5
Template created by Region 1 ESA Page 12 of 33
#3 Construct viable arguments and critique the reasoning of others.
#4 Model with mathematics
#5 Use appropriate tools strategically.
#6 Attend to precision.
#7 Look for and make use of structure
#8 Look for and express regularity in repeated reasoning.
tables provide insight into the relationship between quantities.
Check all assessment types that address this standard
Drill and practice
Multiple choice
Short answer (written)
Performance (verbal explanation)
Product / Project
Vocabulary
Function, rate of change, average rate of change, interval
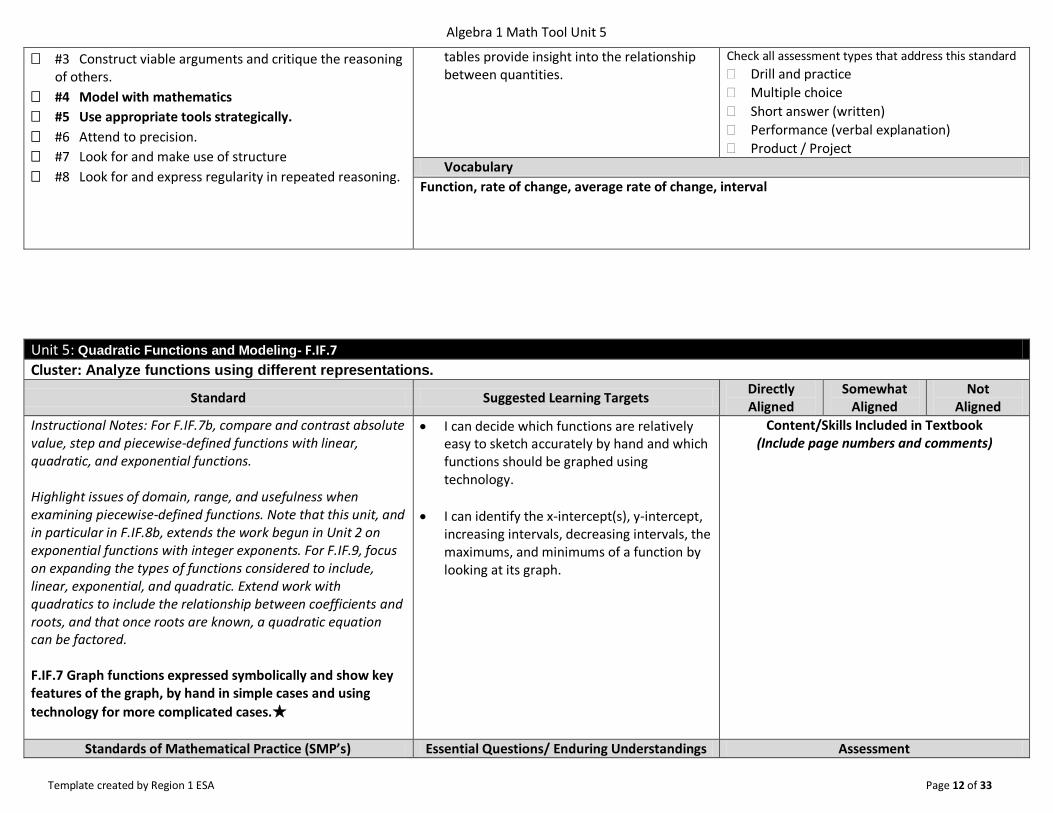
Unit 5: Quadratic Functions and Modeling- F.IF.7
Cluster: Analyze functions using different representations.
Standard Suggested Learning Targets Directly Aligned
Somewhat Aligned
Not Aligned
Instructional Notes: For F.IF.7b, compare and contrast absolute value, step and piecewise-defined functions with linear, quadratic, and exponential functions. Highlight issues of domain, range, and usefulness when examining piecewise-defined functions. Note that this unit, and in particular in F.IF.8b, extends the work begun in Unit 2 on exponential functions with integer exponents. For F.IF.9, focus on expanding the types of functions considered to include, linear, exponential, and quadratic. Extend work with quadratics to include the relationship between coefficients and roots, and that once roots are known, a quadratic equation can be factored. F.IF.7 Graph functions expressed symbolically and show key features of the graph, by hand in simple cases and using
technology for more complicated cases.★
I can decide which functions are relatively easy to sketch accurately by hand and which functions should be graphed using technology.
I can identify the x-intercept(s), y-intercept, increasing intervals, decreasing intervals, the maximums, and minimums of a function by looking at its graph.
Content/Skills Included in Textbook (Include page numbers and comments)
Standards of Mathematical Practice (SMP’s) Essential Questions/ Enduring Understandings Assessment
Algebra 1 Math Tool Unit 5
Template created by Region 1 ESA Page 13 of 33
#1 Make sense of problems and persevere in solving them.
#2 Reason abstractly and quantitatively.
#3 Construct viable arguments and critique the reasoning of others.
#4 Model with mathematics
#5 Use appropriate tools strategically.
#6 Attend to precision.
#7 Look for and make use of structure
#8 Look for and express regularity in repeated reasoning.
How can the relationship between quantities be represented? Equations, verbal descriptions, graphs, and tables provide insight into the relationship between quantities.
Assessments align to suggested learning targets.
Directly Aligned
Somewhat Aligned
Not Aligned
Check all assessment types that address this standard
Drill and practice
Multiple choice
Short answer (written)
Performance (verbal explanation)
Product / Project Vocabulary
x-intercept, y-intercept, increasing intervals, decreasing intervals, maximums, minimums
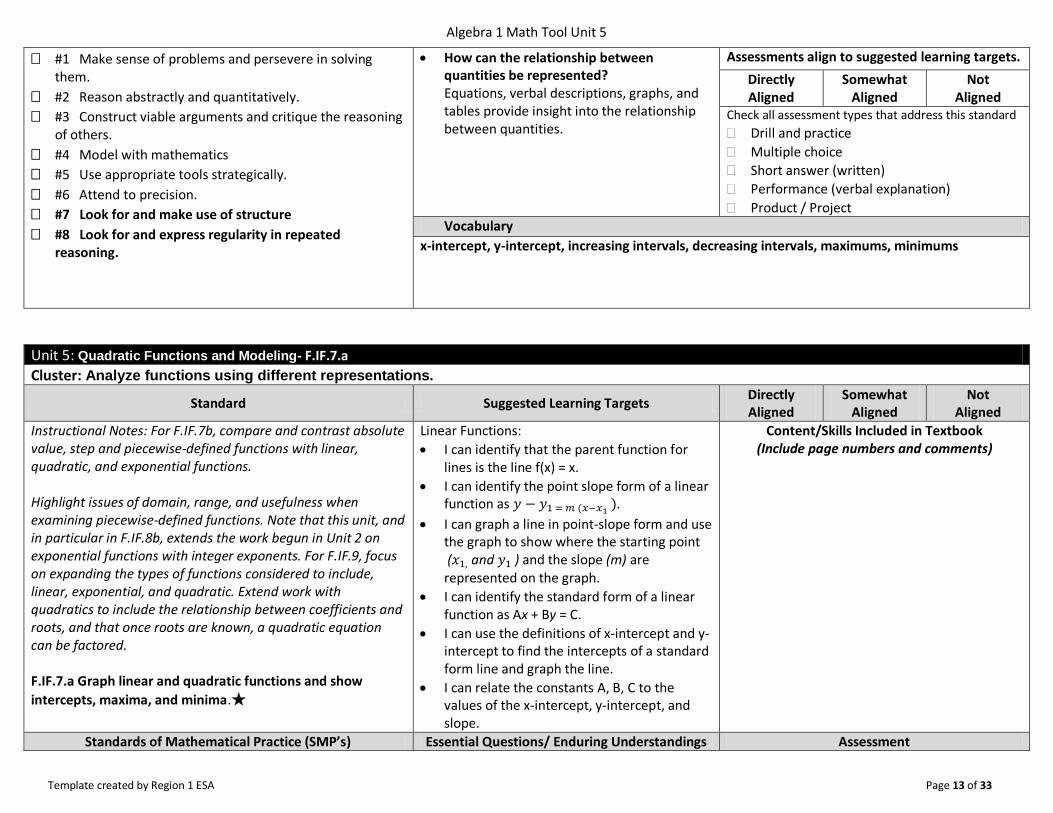
Unit 5: Quadratic Functions and Modeling- F.IF.7.a
Cluster: Analyze functions using different representations.
Standard Suggested Learning Targets Directly Aligned
Somewhat Aligned
Not Aligned
Instructional Notes: For F.IF.7b, compare and contrast absolute value, step and piecewise-defined functions with linear, quadratic, and exponential functions. Highlight issues of domain, range, and usefulness when examining piecewise-defined functions. Note that this unit, and in particular in F.IF.8b, extends the work begun in Unit 2 on exponential functions with integer exponents. For F.IF.9, focus on expanding the types of functions considered to include, linear, exponential, and quadratic. Extend work with quadratics to include the relationship between coefficients and roots, and that once roots are known, a quadratic equation can be factored. F.IF.7.a Graph linear and quadratic functions and show
intercepts, maxima, and minima.★
Linear Functions:
I can identify that the parent function for lines is the line f(x) = x.
I can identify the point slope form of a linear function as
.
I can graph a line in point-slope form and use the graph to show where the starting point ( and ) and the slope (m) are represented on the graph.
I can identify the standard form of a linear function as Ax + By = C.
I can use the definitions of x-intercept and y-intercept to find the intercepts of a standard form line and graph the line.
I can relate the constants A, B, C to the values of the x-intercept, y-intercept, and slope.
Content/Skills Included in Textbook (Include page numbers and comments)
Standards of Mathematical Practice (SMP’s) Essential Questions/ Enduring Understandings Assessment
Algebra 1 Math Tool Unit 5
Template created by Region 1 ESA Page 14 of 33
#1 Make sense of problems and persevere in solving them.
#2 Reason abstractly and quantitatively.
#3 Construct viable arguments and critique the reasoning of others.
#4 Model with mathematics
#5 Use appropriate tools strategically.
#6 Attend to precision.
#7 Look for and make use of structure
#8 Look for and express regularity in repeated reasoning.
How can the relationship between quantities be represented? Equations, verbal descriptions, graphs, and tables provide insight into the relationship between quantities.
Assessments align to suggested learning targets.
Directly Aligned
Somewhat Aligned
Not Aligned
Check all assessment types that address this standard
Drill and practice
Multiple choice
Short answer (written)
Performance (verbal explanation)
Product / Project Vocabulary
Linear functions, parent function, point slope form, standard form, x-intercept, y-intercept, constants, slope
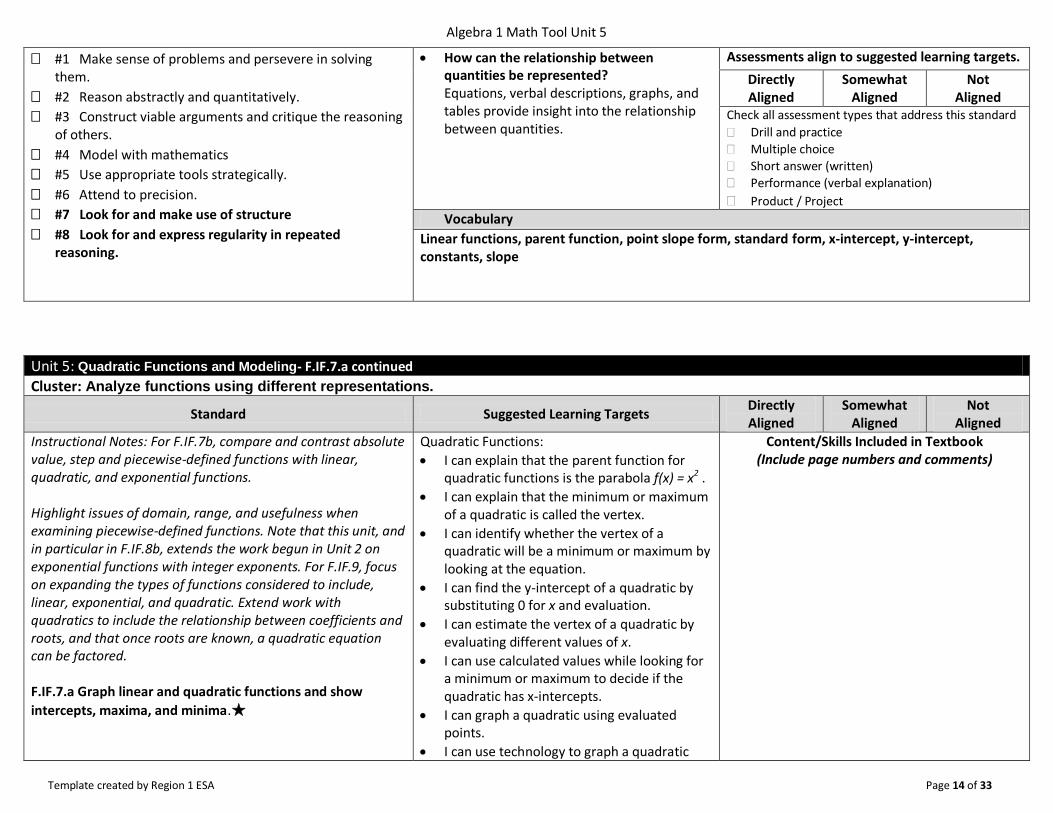
Unit 5: Quadratic Functions and Modeling- F.IF.7.a continued
Cluster: Analyze functions using different representations.
Standard Suggested Learning Targets Directly Aligned
Somewhat Aligned
Not Aligned
Instructional Notes: For F.IF.7b, compare and contrast absolute value, step and piecewise-defined functions with linear, quadratic, and exponential functions. Highlight issues of domain, range, and usefulness when examining piecewise-defined functions. Note that this unit, and in particular in F.IF.8b, extends the work begun in Unit 2 on exponential functions with integer exponents. For F.IF.9, focus on expanding the types of functions considered to include, linear, exponential, and quadratic. Extend work with quadratics to include the relationship between coefficients and roots, and that once roots are known, a quadratic equation can be factored. F.IF.7.a Graph linear and quadratic functions and show
intercepts, maxima, and minima.★
Quadratic Functions:
I can explain that the parent function for quadratic functions is the parabola f(x) = x2 .
I can explain that the minimum or maximum of a quadratic is called the vertex.
I can identify whether the vertex of a quadratic will be a minimum or maximum by looking at the equation.
I can find the y-intercept of a quadratic by substituting 0 for x and evaluation.
I can estimate the vertex of a quadratic by evaluating different values of x.
I can use calculated values while looking for a minimum or maximum to decide if the quadratic has x-intercepts.
I can graph a quadratic using evaluated points.
I can use technology to graph a quadratic
Content/Skills Included in Textbook (Include page numbers and comments)
Algebra 1 Math Tool Unit 5
Template created by Region 1 ESA Page 15 of 33
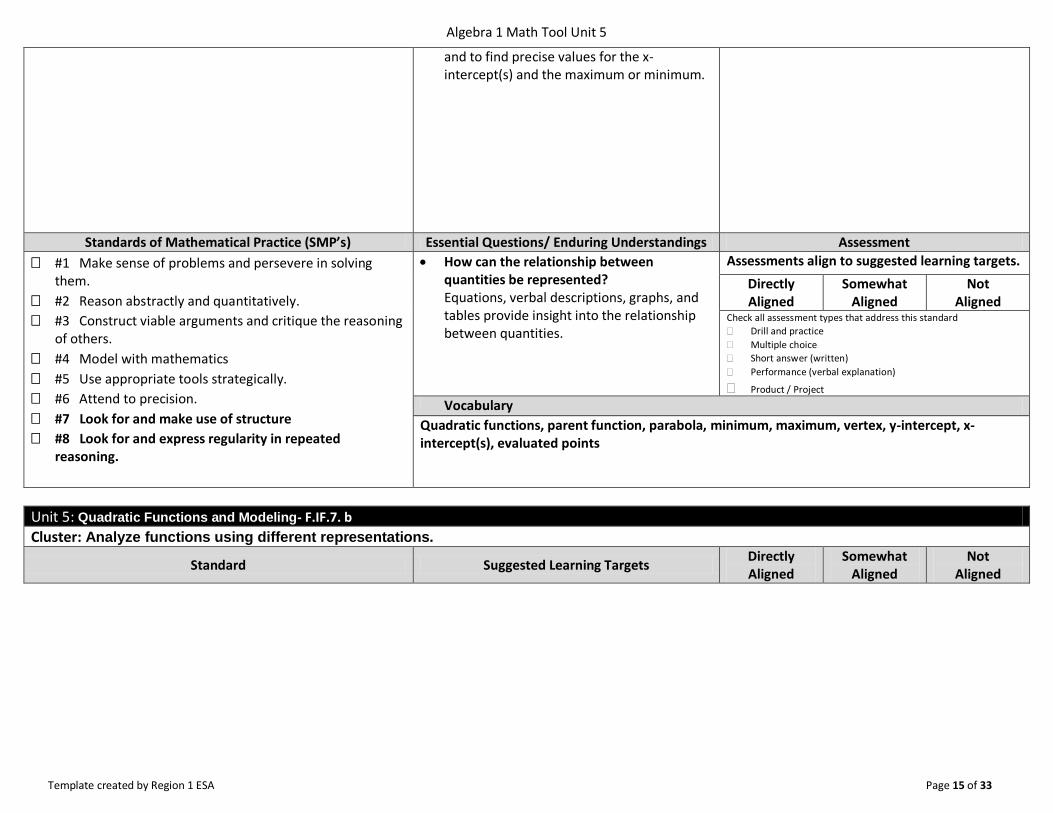
and to find precise values for the x-intercept(s) and the maximum or minimum.
Standards of Mathematical Practice (SMP’s) Essential Questions/ Enduring Understandings Assessment
#1 Make sense of problems and persevere in solving them.
#2 Reason abstractly and quantitatively.
#3 Construct viable arguments and critique the reasoning of others.
#4 Model with mathematics
#5 Use appropriate tools strategically.
#6 Attend to precision.
#7 Look for and make use of structure
#8 Look for and express regularity in repeated reasoning.
How can the relationship between quantities be represented? Equations, verbal descriptions, graphs, and tables provide insight into the relationship between quantities.
Assessments align to suggested learning targets.
Directly Aligned
Somewhat Aligned
Not Aligned
Check all assessment types that address this standard
Drill and practice
Multiple choice
Short answer (written)
Performance (verbal explanation)
Product / Project Vocabulary
Quadratic functions, parent function, parabola, minimum, maximum, vertex, y-intercept, x-intercept(s), evaluated points
Unit 5: Quadratic Functions and Modeling- F.IF.7. b
Cluster: Analyze functions using different representations.
Standard Suggested Learning Targets Directly Aligned
Somewhat Aligned
Not Aligned

Algebra 1 Math Tool Unit 5
Template created by Region 1 ESA Page 16 of 33
Instructional Notes: For F.IF.7b, compare and contrast absolute value, step and piecewise-defined functions with linear, quadratic, and exponential functions. Highlight issues of domain, range, and usefulness when examining piecewise-defined functions. Note that this unit, and in particular in F.IF.8b, extends the work begun in Unit 2 on exponential functions with integer exponents. For F.IF.9, focus on expanding the types of functions considered to include, linear, exponential, and quadratic. Extend work with quadratics to include the relationship between coefficients and roots, and that once roots are known, a quadratic equation can be factored. F.IF.7. b. Graph square root, cube root, and piecewise-defined functions, including step functions and absolute
value functions.★
Square root functions:
I can explain that the parent function for square root functions is the function f(x) = √x .
I can sketch graph a square root function by hand using convenient values of x as inputs.
I can use technology to graph square root functions and find the intercepts.
Content/Skills Included in Textbook (Include page numbers and comments)
Standards of Mathematical Practice (SMP’s) Essential Questions/ Enduring Understandings Assessment
#1 Make sense of problems and persevere in solving them.
#2 Reason abstractly and quantitatively.
#3 Construct viable arguments and critique the reasoning of others.
#4 Model with mathematics
#5 Use appropriate tools strategically.
#6 Attend to precision.
#7 Look for and make use of structure
#8 Look for and express regularity in repeated reasoning.
How can the relationship between quantities be represented? Equations, verbal descriptions, graphs, and tables provide insight into the relationship between quantities.
Assessments align to suggested learning targets.
Directly Aligned
Somewhat Aligned
Not Aligned
Check all assessment types that address this standard
Drill and practice
Multiple choice
Short answer (written)
Performance (verbal explanation)
Product / Project
Vocabulary
Square root functions, parent function, convenient values of x, intercepts
Unit 5: Quadratic Functions and Modeling- F.IF.7. b continued
Cluster: Analyze functions using different representations.
Standard Suggested Learning Targets Directly Aligned
Somewhat Aligned
Not Aligned
Algebra 1 Math Tool Unit 5
Template created by Region 1 ESA Page 17 of 33
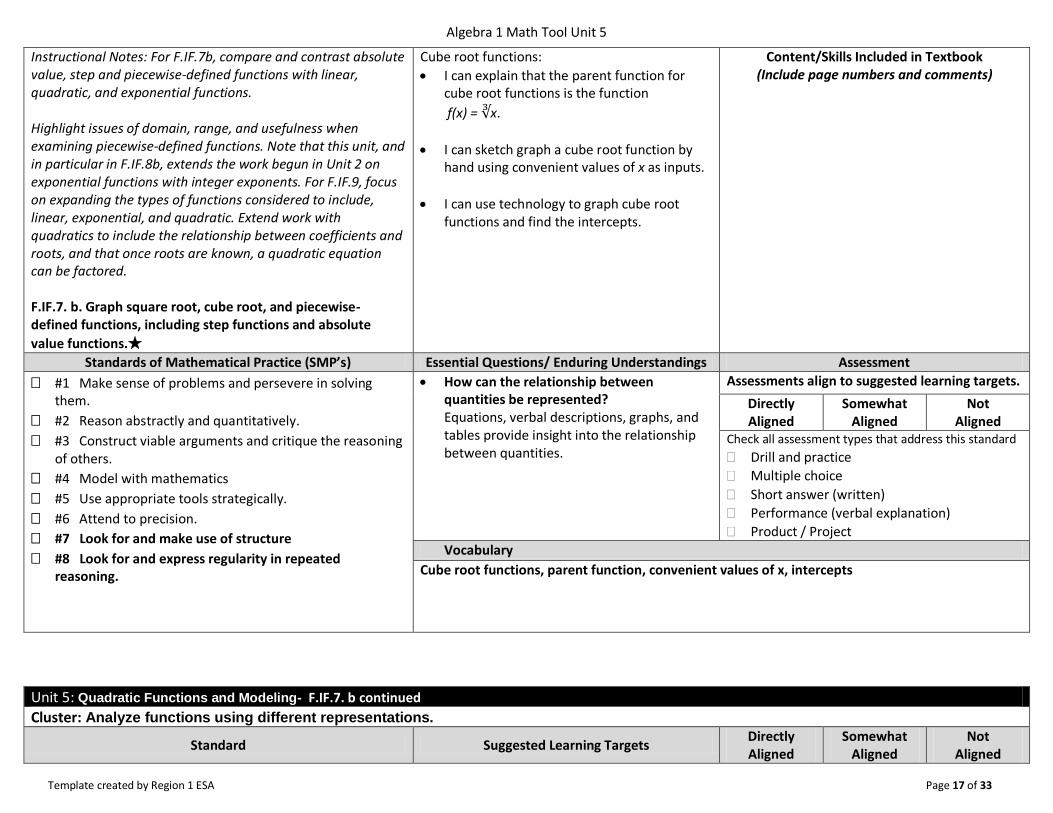
Instructional Notes: For F.IF.7b, compare and contrast absolute value, step and piecewise-defined functions with linear, quadratic, and exponential functions. Highlight issues of domain, range, and usefulness when examining piecewise-defined functions. Note that this unit, and in particular in F.IF.8b, extends the work begun in Unit 2 on exponential functions with integer exponents. For F.IF.9, focus on expanding the types of functions considered to include, linear, exponential, and quadratic. Extend work with quadratics to include the relationship between coefficients and roots, and that once roots are known, a quadratic equation can be factored. F.IF.7. b. Graph square root, cube root, and piecewise-defined functions, including step functions and absolute
value functions.★
Cube root functions:
I can explain that the parent function for cube root functions is the function
f(x) = x.
I can sketch graph a cube root function by hand using convenient values of x as inputs.
I can use technology to graph cube root functions and find the intercepts.
Content/Skills Included in Textbook (Include page numbers and comments)
Standards of Mathematical Practice (SMP’s) Essential Questions/ Enduring Understandings Assessment
#1 Make sense of problems and persevere in solving them.
#2 Reason abstractly and quantitatively.
#3 Construct viable arguments and critique the reasoning of others.
#4 Model with mathematics
#5 Use appropriate tools strategically.
#6 Attend to precision.
#7 Look for and make use of structure
#8 Look for and express regularity in repeated reasoning.
How can the relationship between quantities be represented? Equations, verbal descriptions, graphs, and tables provide insight into the relationship between quantities.
Assessments align to suggested learning targets.
Directly Aligned
Somewhat Aligned
Not Aligned
Check all assessment types that address this standard
Drill and practice
Multiple choice
Short answer (written)
Performance (verbal explanation)
Product / Project
Vocabulary
Cube root functions, parent function, convenient values of x, intercepts
Unit 5: Quadratic Functions and Modeling- F.IF.7. b continued
Cluster: Analyze functions using different representations.
Standard Suggested Learning Targets Directly Aligned
Somewhat Aligned
Not Aligned
Algebra 1 Math Tool Unit 5
Template created by Region 1 ESA Page 18 of 33
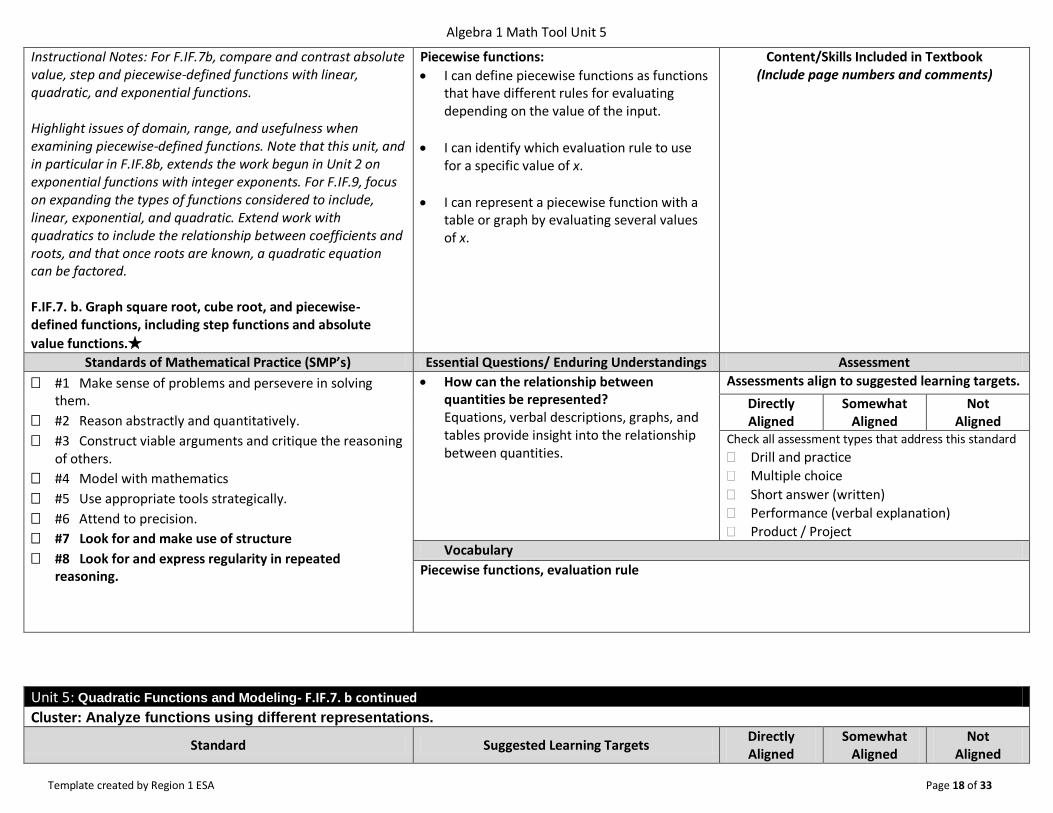
Instructional Notes: For F.IF.7b, compare and contrast absolute value, step and piecewise-defined functions with linear, quadratic, and exponential functions. Highlight issues of domain, range, and usefulness when examining piecewise-defined functions. Note that this unit, and in particular in F.IF.8b, extends the work begun in Unit 2 on exponential functions with integer exponents. For F.IF.9, focus on expanding the types of functions considered to include, linear, exponential, and quadratic. Extend work with quadratics to include the relationship between coefficients and roots, and that once roots are known, a quadratic equation can be factored. F.IF.7. b. Graph square root, cube root, and piecewise-defined functions, including step functions and absolute
value functions.★
Piecewise functions:
I can define piecewise functions as functions that have different rules for evaluating depending on the value of the input.
I can identify which evaluation rule to use for a specific value of x.
I can represent a piecewise function with a table or graph by evaluating several values of x.
Content/Skills Included in Textbook (Include page numbers and comments)
Standards of Mathematical Practice (SMP’s) Essential Questions/ Enduring Understandings Assessment
#1 Make sense of problems and persevere in solving them.
#2 Reason abstractly and quantitatively.
#3 Construct viable arguments and critique the reasoning of others.
#4 Model with mathematics
#5 Use appropriate tools strategically.
#6 Attend to precision.
#7 Look for and make use of structure
#8 Look for and express regularity in repeated reasoning.
How can the relationship between quantities be represented? Equations, verbal descriptions, graphs, and tables provide insight into the relationship between quantities.
Assessments align to suggested learning targets.
Directly Aligned
Somewhat Aligned
Not Aligned
Check all assessment types that address this standard
Drill and practice
Multiple choice
Short answer (written)
Performance (verbal explanation)
Product / Project
Vocabulary
Piecewise functions, evaluation rule
Unit 5: Quadratic Functions and Modeling- F.IF.7. b continued
Cluster: Analyze functions using different representations.
Standard Suggested Learning Targets Directly Aligned
Somewhat Aligned
Not Aligned
Algebra 1 Math Tool Unit 5
Template created by Region 1 ESA Page 19 of 33
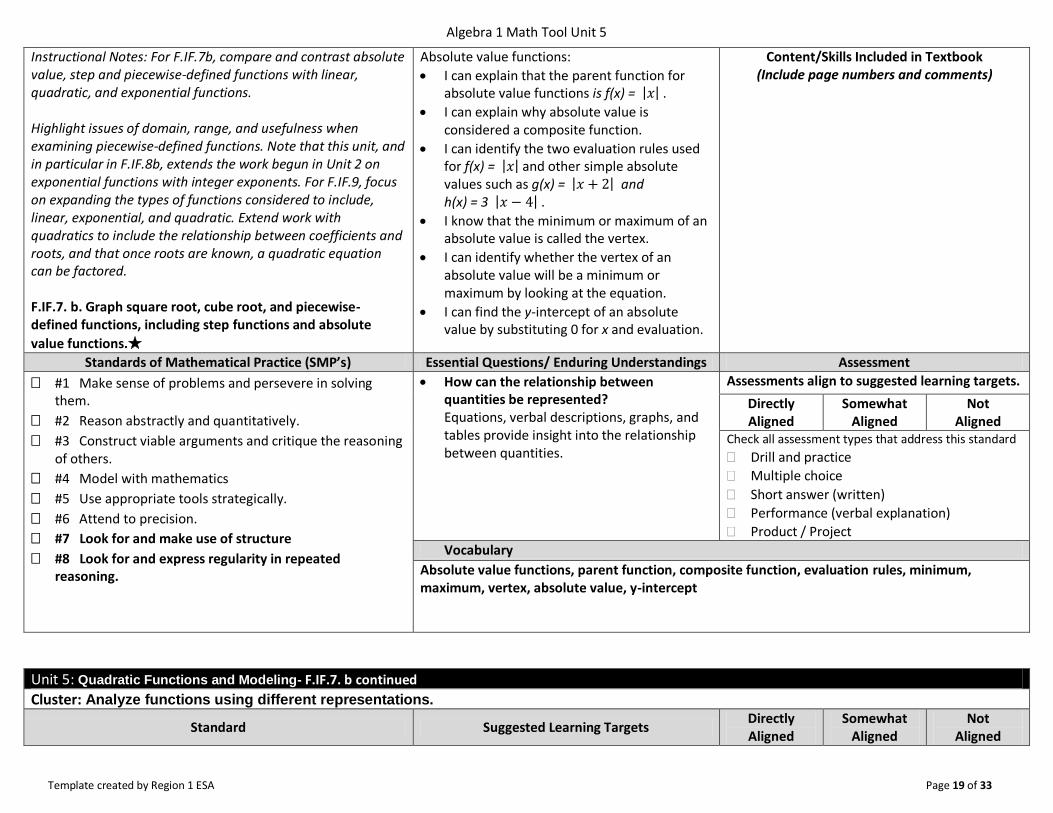
Instructional Notes: For F.IF.7b, compare and contrast absolute value, step and piecewise-defined functions with linear, quadratic, and exponential functions. Highlight issues of domain, range, and usefulness when examining piecewise-defined functions. Note that this unit, and in particular in F.IF.8b, extends the work begun in Unit 2 on exponential functions with integer exponents. For F.IF.9, focus on expanding the types of functions considered to include, linear, exponential, and quadratic. Extend work with quadratics to include the relationship between coefficients and roots, and that once roots are known, a quadratic equation can be factored. F.IF.7. b. Graph square root, cube root, and piecewise-defined functions, including step functions and absolute
value functions.★
Absolute value functions:
I can explain that the parent function for absolute value functions is f(x) = .
I can explain why absolute value is considered a composite function.
I can identify the two evaluation rules used for f(x) = and other simple absolute values such as g(x) = and h(x) = 3 .
I know that the minimum or maximum of an absolute value is called the vertex.
I can identify whether the vertex of an absolute value will be a minimum or maximum by looking at the equation.
I can find the y-intercept of an absolute value by substituting 0 for x and evaluation.
Content/Skills Included in Textbook (Include page numbers and comments)
Standards of Mathematical Practice (SMP’s) Essential Questions/ Enduring Understandings Assessment
#1 Make sense of problems and persevere in solving them.
#2 Reason abstractly and quantitatively.
#3 Construct viable arguments and critique the reasoning of others.
#4 Model with mathematics
#5 Use appropriate tools strategically.
#6 Attend to precision.
#7 Look for and make use of structure
#8 Look for and express regularity in repeated reasoning.
How can the relationship between quantities be represented? Equations, verbal descriptions, graphs, and tables provide insight into the relationship between quantities.
Assessments align to suggested learning targets.
Directly Aligned
Somewhat Aligned
Not Aligned
Check all assessment types that address this standard
Drill and practice
Multiple choice
Short answer (written)
Performance (verbal explanation)
Product / Project
Vocabulary
Absolute value functions, parent function, composite function, evaluation rules, minimum, maximum, vertex, absolute value, y-intercept
Unit 5: Quadratic Functions and Modeling- F.IF.7. b continued
Cluster: Analyze functions using different representations.
Standard Suggested Learning Targets Directly Aligned
Somewhat Aligned
Not Aligned
Algebra 1 Math Tool Unit 5
Template created by Region 1 ESA Page 20 of 33
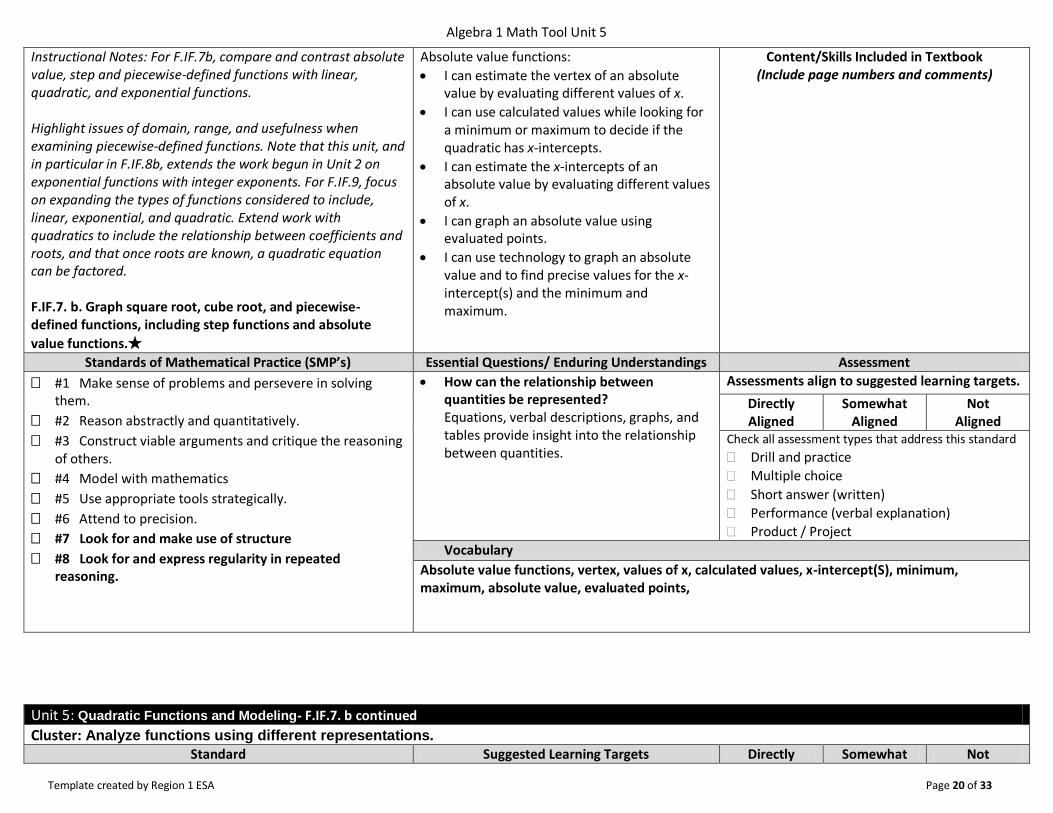
Instructional Notes: For F.IF.7b, compare and contrast absolute value, step and piecewise-defined functions with linear, quadratic, and exponential functions. Highlight issues of domain, range, and usefulness when examining piecewise-defined functions. Note that this unit, and in particular in F.IF.8b, extends the work begun in Unit 2 on exponential functions with integer exponents. For F.IF.9, focus on expanding the types of functions considered to include, linear, exponential, and quadratic. Extend work with quadratics to include the relationship between coefficients and roots, and that once roots are known, a quadratic equation can be factored. F.IF.7. b. Graph square root, cube root, and piecewise-defined functions, including step functions and absolute
value functions.★
Absolute value functions:
I can estimate the vertex of an absolute value by evaluating different values of x.
I can use calculated values while looking for a minimum or maximum to decide if the quadratic has x-intercepts.
I can estimate the x-intercepts of an absolute value by evaluating different values of x.
I can graph an absolute value using evaluated points.
I can use technology to graph an absolute value and to find precise values for the x-intercept(s) and the minimum and maximum.
Content/Skills Included in Textbook (Include page numbers and comments)
Standards of Mathematical Practice (SMP’s) Essential Questions/ Enduring Understandings Assessment
#1 Make sense of problems and persevere in solving them.
#2 Reason abstractly and quantitatively.
#3 Construct viable arguments and critique the reasoning of others.
#4 Model with mathematics
#5 Use appropriate tools strategically.
#6 Attend to precision.
#7 Look for and make use of structure
#8 Look for and express regularity in repeated reasoning.
How can the relationship between quantities be represented? Equations, verbal descriptions, graphs, and tables provide insight into the relationship between quantities.
Assessments align to suggested learning targets.
Directly Aligned
Somewhat Aligned
Not Aligned
Check all assessment types that address this standard
Drill and practice
Multiple choice
Short answer (written)
Performance (verbal explanation)
Product / Project
Vocabulary
Absolute value functions, vertex, values of x, calculated values, x-intercept(S), minimum, maximum, absolute value, evaluated points,
Unit 5: Quadratic Functions and Modeling- F.IF.7. b continued
Cluster: Analyze functions using different representations. Standard Suggested Learning Targets Directly Somewhat Not
Algebra 1 Math Tool Unit 5
Template created by Region 1 ESA Page 21 of 33
Aligned Aligned Aligned
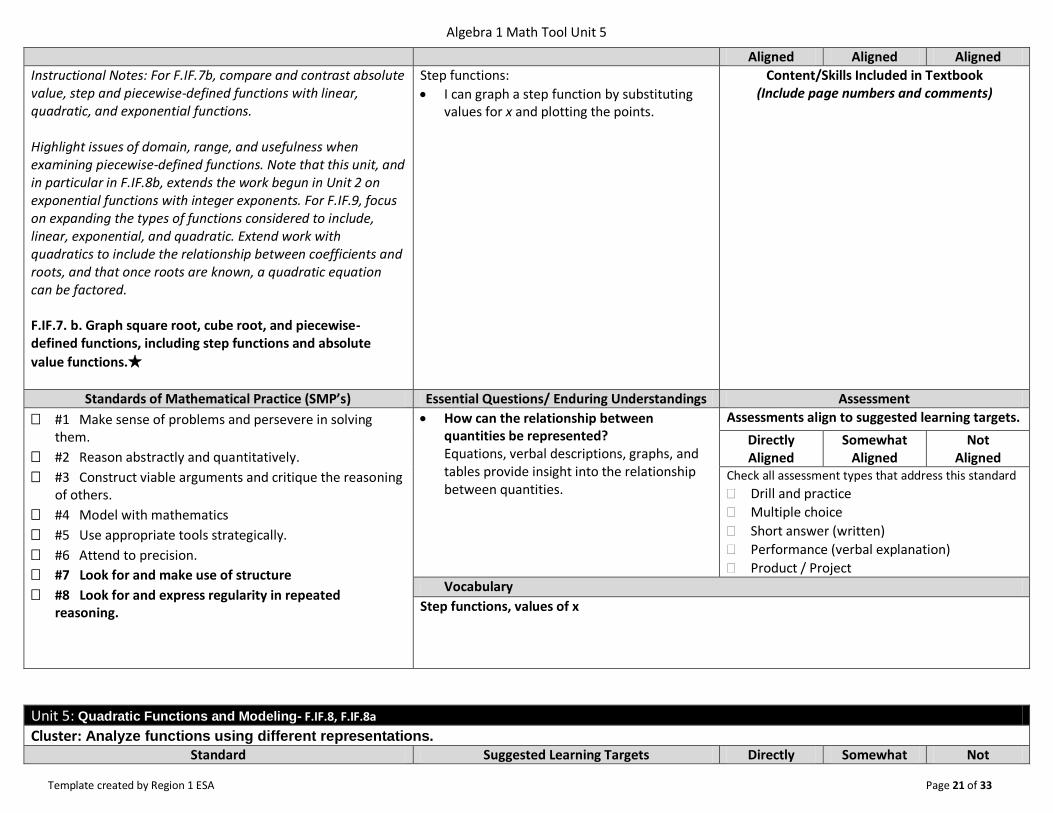
Instructional Notes: For F.IF.7b, compare and contrast absolute value, step and piecewise-defined functions with linear, quadratic, and exponential functions. Highlight issues of domain, range, and usefulness when examining piecewise-defined functions. Note that this unit, and in particular in F.IF.8b, extends the work begun in Unit 2 on exponential functions with integer exponents. For F.IF.9, focus on expanding the types of functions considered to include, linear, exponential, and quadratic. Extend work with quadratics to include the relationship between coefficients and roots, and that once roots are known, a quadratic equation can be factored. F.IF.7. b. Graph square root, cube root, and piecewise-defined functions, including step functions and absolute
value functions.★
Step functions:
I can graph a step function by substituting values for x and plotting the points.
Content/Skills Included in Textbook (Include page numbers and comments)
Standards of Mathematical Practice (SMP’s) Essential Questions/ Enduring Understandings Assessment
#1 Make sense of problems and persevere in solving them.
#2 Reason abstractly and quantitatively.
#3 Construct viable arguments and critique the reasoning of others.
#4 Model with mathematics
#5 Use appropriate tools strategically.
#6 Attend to precision.
#7 Look for and make use of structure
#8 Look for and express regularity in repeated reasoning.
How can the relationship between quantities be represented? Equations, verbal descriptions, graphs, and tables provide insight into the relationship between quantities.
Assessments align to suggested learning targets.
Directly Aligned
Somewhat Aligned
Not Aligned
Check all assessment types that address this standard
Drill and practice
Multiple choice
Short answer (written)
Performance (verbal explanation)
Product / Project
Vocabulary
Step functions, values of x
Unit 5: Quadratic Functions and Modeling- F.IF.8, F.IF.8a
Cluster: Analyze functions using different representations. Standard Suggested Learning Targets Directly Somewhat Not
Algebra 1 Math Tool Unit 5
Template created by Region 1 ESA Page 22 of 33
Aligned Aligned Aligned
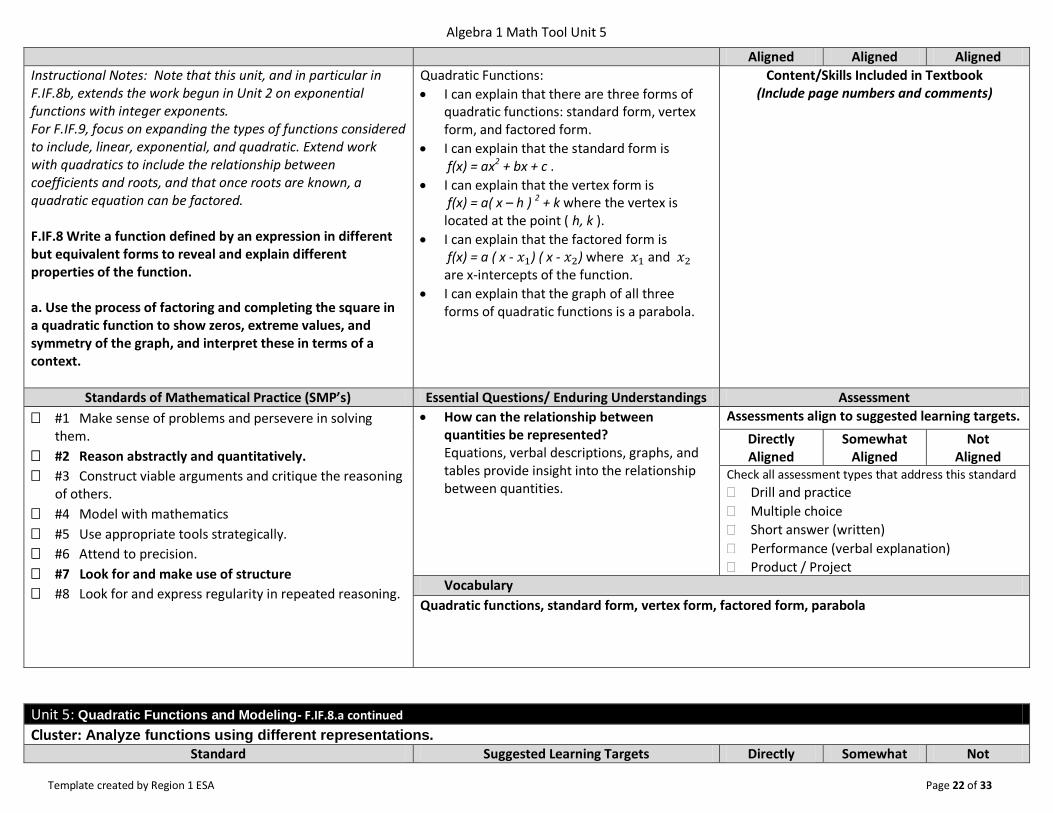
Instructional Notes: Note that this unit, and in particular in F.IF.8b, extends the work begun in Unit 2 on exponential functions with integer exponents. For F.IF.9, focus on expanding the types of functions considered to include, linear, exponential, and quadratic. Extend work with quadratics to include the relationship between coefficients and roots, and that once roots are known, a quadratic equation can be factored. F.IF.8 Write a function defined by an expression in different but equivalent forms to reveal and explain different properties of the function. a. Use the process of factoring and completing the square in a quadratic function to show zeros, extreme values, and symmetry of the graph, and interpret these in terms of a context.
Quadratic Functions:
I can explain that there are three forms of quadratic functions: standard form, vertex form, and factored form.
I can explain that the standard form is f(x) = ax2 + bx + c .
I can explain that the vertex form is f(x) = a( x – h ) 2 + k where the vertex is located at the point ( h, k ).
I can explain that the factored form is f(x) = a ( x - ) ( x - ) where and are x-intercepts of the function.
I can explain that the graph of all three forms of quadratic functions is a parabola.
Content/Skills Included in Textbook (Include page numbers and comments)
Standards of Mathematical Practice (SMP’s) Essential Questions/ Enduring Understandings Assessment
#1 Make sense of problems and persevere in solving them.
#2 Reason abstractly and quantitatively.
#3 Construct viable arguments and critique the reasoning of others.
#4 Model with mathematics
#5 Use appropriate tools strategically.
#6 Attend to precision.
#7 Look for and make use of structure
#8 Look for and express regularity in repeated reasoning.
How can the relationship between quantities be represented? Equations, verbal descriptions, graphs, and tables provide insight into the relationship between quantities.
Assessments align to suggested learning targets.
Directly Aligned
Somewhat Aligned
Not Aligned
Check all assessment types that address this standard
Drill and practice
Multiple choice
Short answer (written)
Performance (verbal explanation)
Product / Project Vocabulary
Quadratic functions, standard form, vertex form, factored form, parabola
Unit 5: Quadratic Functions and Modeling- F.IF.8.a continued
Cluster: Analyze functions using different representations. Standard Suggested Learning Targets Directly Somewhat Not
Algebra 1 Math Tool Unit 5
Template created by Region 1 ESA Page 23 of 33
Aligned Aligned Aligned
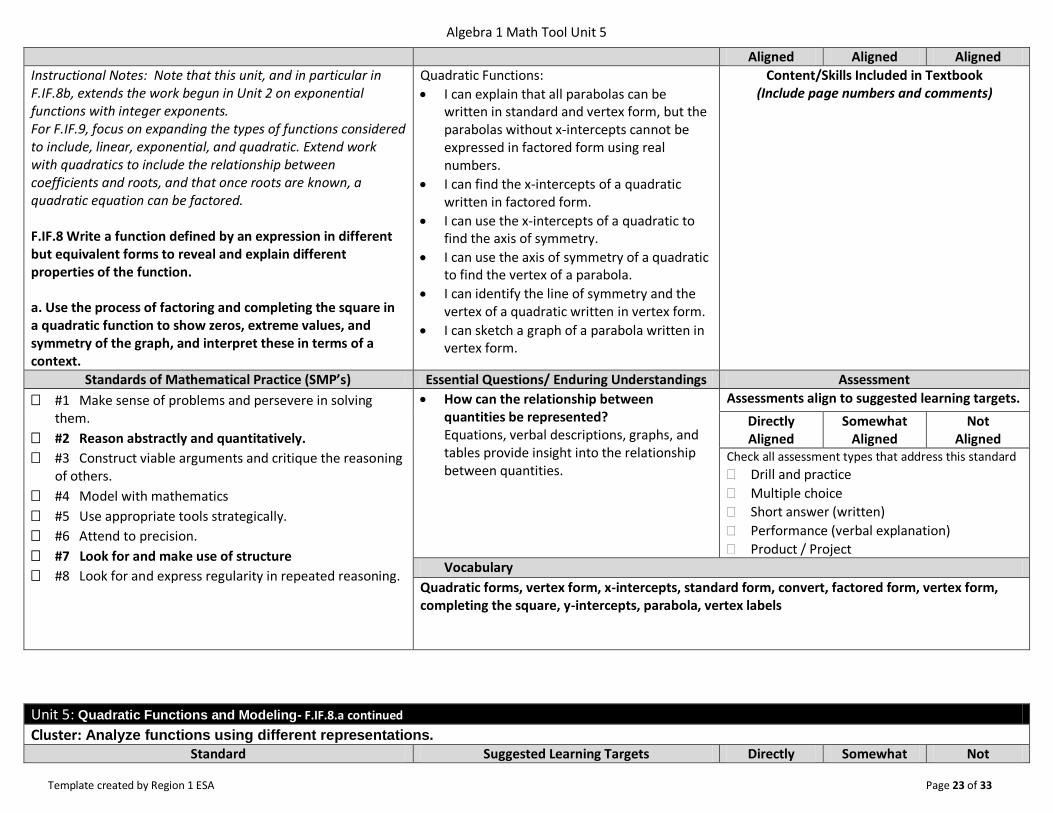
Instructional Notes: Note that this unit, and in particular in F.IF.8b, extends the work begun in Unit 2 on exponential functions with integer exponents. For F.IF.9, focus on expanding the types of functions considered to include, linear, exponential, and quadratic. Extend work with quadratics to include the relationship between coefficients and roots, and that once roots are known, a quadratic equation can be factored. F.IF.8 Write a function defined by an expression in different but equivalent forms to reveal and explain different properties of the function. a. Use the process of factoring and completing the square in a quadratic function to show zeros, extreme values, and symmetry of the graph, and interpret these in terms of a context.
Quadratic Functions:
I can explain that all parabolas can be written in standard and vertex form, but the parabolas without x-intercepts cannot be expressed in factored form using real numbers.
I can find the x-intercepts of a quadratic written in factored form.
I can use the x-intercepts of a quadratic to find the axis of symmetry.
I can use the axis of symmetry of a quadratic to find the vertex of a parabola.
I can identify the line of symmetry and the vertex of a quadratic written in vertex form.
I can sketch a graph of a parabola written in vertex form.
Content/Skills Included in Textbook (Include page numbers and comments)
Standards of Mathematical Practice (SMP’s) Essential Questions/ Enduring Understandings Assessment
#1 Make sense of problems and persevere in solving them.
#2 Reason abstractly and quantitatively.
#3 Construct viable arguments and critique the reasoning of others.
#4 Model with mathematics
#5 Use appropriate tools strategically.
#6 Attend to precision.
#7 Look for and make use of structure
#8 Look for and express regularity in repeated reasoning.
How can the relationship between quantities be represented? Equations, verbal descriptions, graphs, and tables provide insight into the relationship between quantities.
Assessments align to suggested learning targets.
Directly Aligned
Somewhat Aligned
Not Aligned
Check all assessment types that address this standard
Drill and practice
Multiple choice
Short answer (written)
Performance (verbal explanation)
Product / Project Vocabulary
Quadratic forms, vertex form, x-intercepts, standard form, convert, factored form, vertex form, completing the square, y-intercepts, parabola, vertex labels
Unit 5: Quadratic Functions and Modeling- F.IF.8.a continued
Cluster: Analyze functions using different representations. Standard Suggested Learning Targets Directly Somewhat Not
Algebra 1 Math Tool Unit 5
Template created by Region 1 ESA Page 24 of 33
Aligned Aligned Aligned
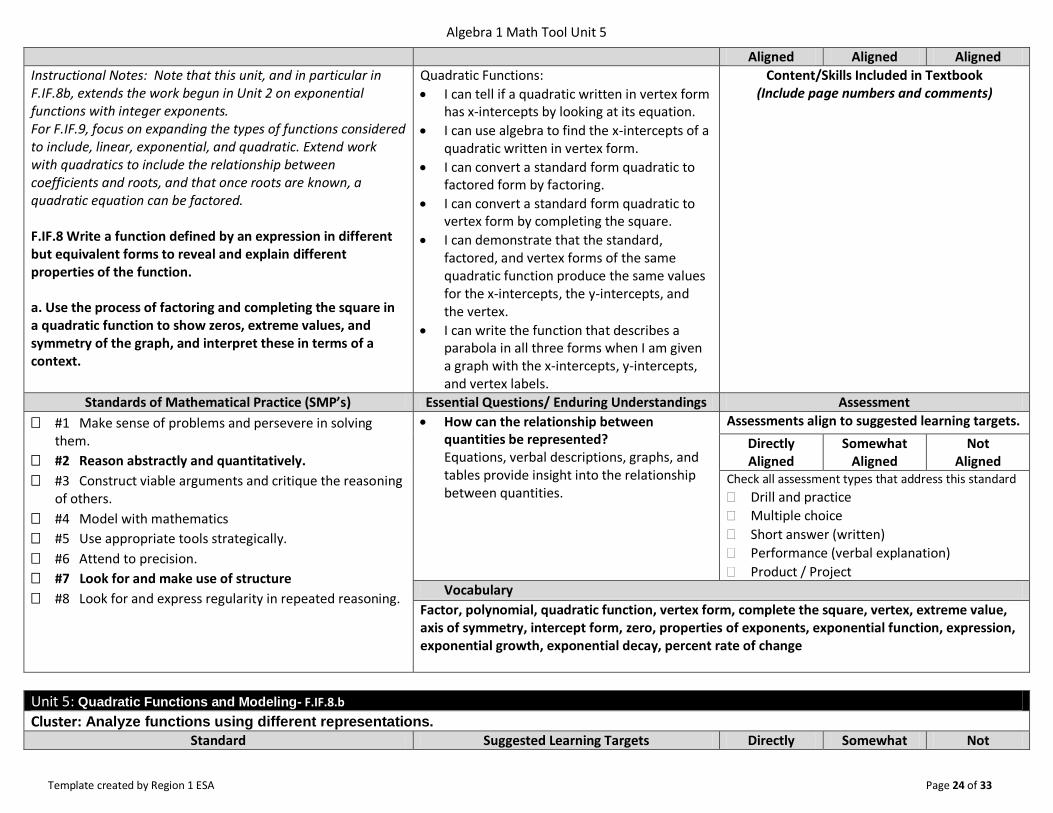
Instructional Notes: Note that this unit, and in particular in F.IF.8b, extends the work begun in Unit 2 on exponential functions with integer exponents. For F.IF.9, focus on expanding the types of functions considered to include, linear, exponential, and quadratic. Extend work with quadratics to include the relationship between coefficients and roots, and that once roots are known, a quadratic equation can be factored. F.IF.8 Write a function defined by an expression in different but equivalent forms to reveal and explain different properties of the function. a. Use the process of factoring and completing the square in a quadratic function to show zeros, extreme values, and symmetry of the graph, and interpret these in terms of a context.
Quadratic Functions:
I can tell if a quadratic written in vertex form has x-intercepts by looking at its equation.
I can use algebra to find the x-intercepts of a quadratic written in vertex form.
I can convert a standard form quadratic to factored form by factoring.
I can convert a standard form quadratic to vertex form by completing the square.
I can demonstrate that the standard, factored, and vertex forms of the same quadratic function produce the same values for the x-intercepts, the y-intercepts, and the vertex.
I can write the function that describes a parabola in all three forms when I am given a graph with the x-intercepts, y-intercepts, and vertex labels.
Content/Skills Included in Textbook (Include page numbers and comments)
Standards of Mathematical Practice (SMP’s) Essential Questions/ Enduring Understandings Assessment
#1 Make sense of problems and persevere in solving them.
#2 Reason abstractly and quantitatively.
#3 Construct viable arguments and critique the reasoning of others.
#4 Model with mathematics
#5 Use appropriate tools strategically.
#6 Attend to precision.
#7 Look for and make use of structure
#8 Look for and express regularity in repeated reasoning.
How can the relationship between quantities be represented? Equations, verbal descriptions, graphs, and tables provide insight into the relationship between quantities.
Assessments align to suggested learning targets.
Directly Aligned
Somewhat Aligned
Not Aligned
Check all assessment types that address this standard
Drill and practice
Multiple choice
Short answer (written)
Performance (verbal explanation)
Product / Project Vocabulary
Factor, polynomial, quadratic function, vertex form, complete the square, vertex, extreme value, axis of symmetry, intercept form, zero, properties of exponents, exponential function, expression, exponential growth, exponential decay, percent rate of change
Unit 5: Quadratic Functions and Modeling- F.IF.8.b
Cluster: Analyze functions using different representations. Standard Suggested Learning Targets Directly Somewhat Not
Algebra 1 Math Tool Unit 5
Template created by Region 1 ESA Page 25 of 33
Aligned Aligned Aligned
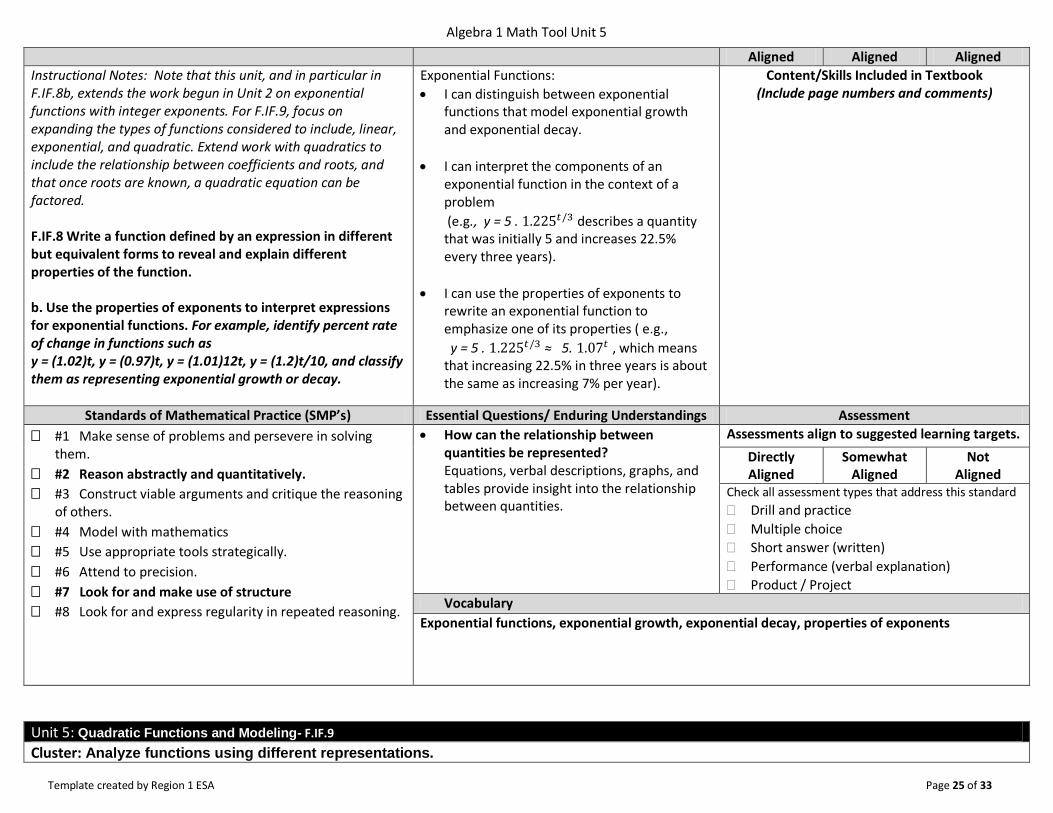
Instructional Notes: Note that this unit, and in particular in F.IF.8b, extends the work begun in Unit 2 on exponential functions with integer exponents. For F.IF.9, focus on expanding the types of functions considered to include, linear, exponential, and quadratic. Extend work with quadratics to include the relationship between coefficients and roots, and that once roots are known, a quadratic equation can be factored. F.IF.8 Write a function defined by an expression in different but equivalent forms to reveal and explain different properties of the function. b. Use the properties of exponents to interpret expressions for exponential functions. For example, identify percent rate of change in functions such as y = (1.02)t, y = (0.97)t, y = (1.01)12t, y = (1.2)t/10, and classify them as representing exponential growth or decay.
Exponential Functions:
I can distinguish between exponential functions that model exponential growth and exponential decay.
I can interpret the components of an exponential function in the context of a problem
(e.g., y = 5 . describes a quantity that was initially 5 and increases 22.5% every three years).
I can use the properties of exponents to rewrite an exponential function to emphasize one of its properties ( e.g.,
y = 5 . ≈ 5. , which means that increasing 22.5% in three years is about the same as increasing 7% per year).
Content/Skills Included in Textbook (Include page numbers and comments)
Standards of Mathematical Practice (SMP’s) Essential Questions/ Enduring Understandings Assessment
#1 Make sense of problems and persevere in solving them.
#2 Reason abstractly and quantitatively.
#3 Construct viable arguments and critique the reasoning of others.
#4 Model with mathematics
#5 Use appropriate tools strategically.
#6 Attend to precision.
#7 Look for and make use of structure
#8 Look for and express regularity in repeated reasoning.
How can the relationship between quantities be represented? Equations, verbal descriptions, graphs, and tables provide insight into the relationship between quantities.
Assessments align to suggested learning targets.
Directly Aligned
Somewhat Aligned
Not Aligned
Check all assessment types that address this standard
Drill and practice
Multiple choice
Short answer (written)
Performance (verbal explanation)
Product / Project Vocabulary
Exponential functions, exponential growth, exponential decay, properties of exponents
Unit 5: Quadratic Functions and Modeling- F.IF.9
Cluster: Analyze functions using different representations.
Algebra 1 Math Tool Unit 5
Template created by Region 1 ESA Page 26 of 33
Standard Suggested Learning Targets Directly Aligned
Somewhat Aligned
Not Aligned
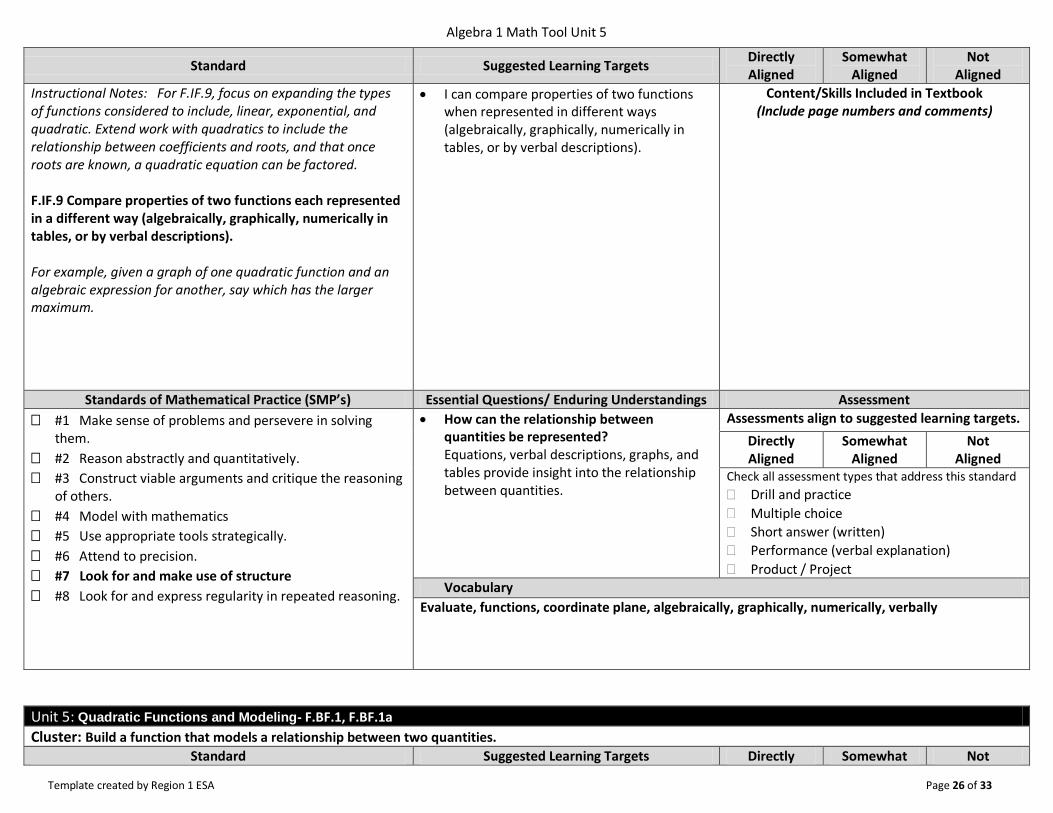
Instructional Notes: For F.IF.9, focus on expanding the types of functions considered to include, linear, exponential, and quadratic. Extend work with quadratics to include the relationship between coefficients and roots, and that once roots are known, a quadratic equation can be factored. F.IF.9 Compare properties of two functions each represented in a different way (algebraically, graphically, numerically in tables, or by verbal descriptions). For example, given a graph of one quadratic function and an algebraic expression for another, say which has the larger maximum.
I can compare properties of two functions when represented in different ways (algebraically, graphically, numerically in tables, or by verbal descriptions).
Content/Skills Included in Textbook (Include page numbers and comments)
Standards of Mathematical Practice (SMP’s) Essential Questions/ Enduring Understandings Assessment
#1 Make sense of problems and persevere in solving them.
#2 Reason abstractly and quantitatively.
#3 Construct viable arguments and critique the reasoning of others.
#4 Model with mathematics
#5 Use appropriate tools strategically.
#6 Attend to precision.
#7 Look for and make use of structure
#8 Look for and express regularity in repeated reasoning.
How can the relationship between quantities be represented? Equations, verbal descriptions, graphs, and tables provide insight into the relationship between quantities.
Assessments align to suggested learning targets.
Directly Aligned
Somewhat Aligned
Not Aligned
Check all assessment types that address this standard
Drill and practice
Multiple choice
Short answer (written)
Performance (verbal explanation)
Product / Project Vocabulary
Evaluate, functions, coordinate plane, algebraically, graphically, numerically, verbally
Unit 5: Quadratic Functions and Modeling- F.BF.1, F.BF.1a
Cluster: Build a function that models a relationship between two quantities. Standard Suggested Learning Targets Directly Somewhat Not
Algebra 1 Math Tool Unit 5
Template created by Region 1 ESA Page 27 of 33
Aligned Aligned Aligned
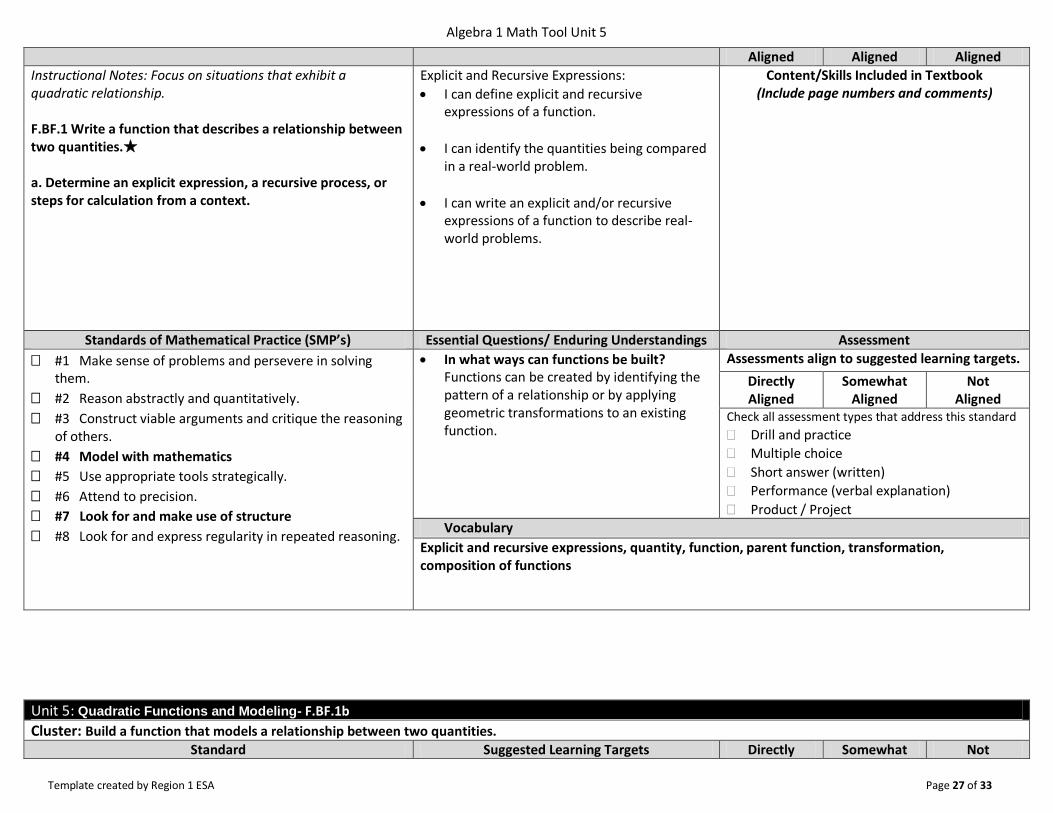
Instructional Notes: Focus on situations that exhibit a quadratic relationship. F.BF.1 Write a function that describes a relationship between two quantities.★ a. Determine an explicit expression, a recursive process, or steps for calculation from a context.
Explicit and Recursive Expressions:
I can define explicit and recursive expressions of a function.
I can identify the quantities being compared in a real-world problem.
I can write an explicit and/or recursive expressions of a function to describe real-world problems.
Content/Skills Included in Textbook (Include page numbers and comments)
Standards of Mathematical Practice (SMP’s) Essential Questions/ Enduring Understandings Assessment
#1 Make sense of problems and persevere in solving them.
#2 Reason abstractly and quantitatively.
#3 Construct viable arguments and critique the reasoning of others.
#4 Model with mathematics
#5 Use appropriate tools strategically.
#6 Attend to precision.
#7 Look for and make use of structure
#8 Look for and express regularity in repeated reasoning.
In what ways can functions be built? Functions can be created by identifying the pattern of a relationship or by applying geometric transformations to an existing function.
Assessments align to suggested learning targets.
Directly Aligned
Somewhat Aligned
Not Aligned
Check all assessment types that address this standard
Drill and practice
Multiple choice
Short answer (written)
Performance (verbal explanation)
Product / Project Vocabulary
Explicit and recursive expressions, quantity, function, parent function, transformation, composition of functions
Unit 5: Quadratic Functions and Modeling- F.BF.1b
Cluster: Build a function that models a relationship between two quantities. Standard Suggested Learning Targets Directly Somewhat Not
Algebra 1 Math Tool Unit 5
Template created by Region 1 ESA Page 28 of 33
Aligned Aligned Aligned
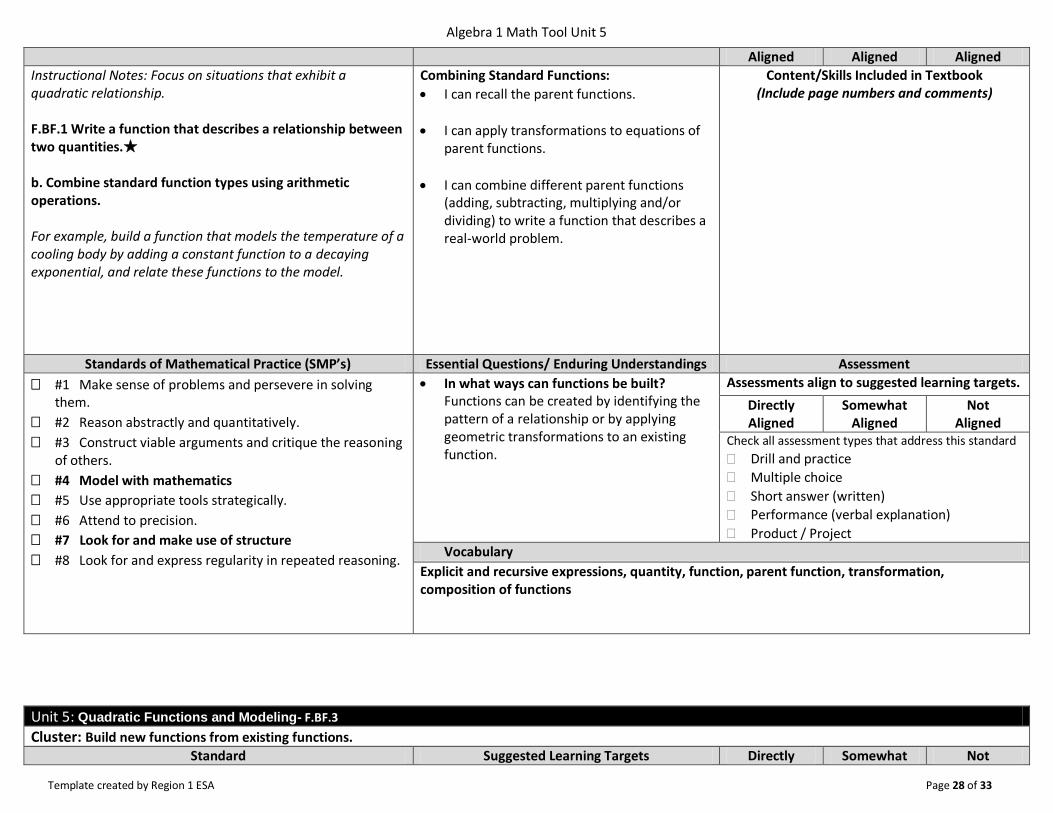
Instructional Notes: Focus on situations that exhibit a quadratic relationship. F.BF.1 Write a function that describes a relationship between two quantities.★ b. Combine standard function types using arithmetic operations. For example, build a function that models the temperature of a cooling body by adding a constant function to a decaying exponential, and relate these functions to the model.
Combining Standard Functions:
I can recall the parent functions.
I can apply transformations to equations of parent functions.
I can combine different parent functions (adding, subtracting, multiplying and/or dividing) to write a function that describes a real-world problem.
Content/Skills Included in Textbook (Include page numbers and comments)
Standards of Mathematical Practice (SMP’s) Essential Questions/ Enduring Understandings Assessment
#1 Make sense of problems and persevere in solving them.
#2 Reason abstractly and quantitatively.
#3 Construct viable arguments and critique the reasoning of others.
#4 Model with mathematics
#5 Use appropriate tools strategically.
#6 Attend to precision.
#7 Look for and make use of structure
#8 Look for and express regularity in repeated reasoning.
In what ways can functions be built? Functions can be created by identifying the pattern of a relationship or by applying geometric transformations to an existing function.
Assessments align to suggested learning targets.
Directly Aligned
Somewhat Aligned
Not Aligned
Check all assessment types that address this standard
Drill and practice
Multiple choice
Short answer (written)
Performance (verbal explanation)
Product / Project Vocabulary
Explicit and recursive expressions, quantity, function, parent function, transformation, composition of functions
Unit 5: Quadratic Functions and Modeling- F.BF.3
Cluster: Build new functions from existing functions. Standard Suggested Learning Targets Directly Somewhat Not
Algebra 1 Math Tool Unit 5
Template created by Region 1 ESA Page 29 of 33
Aligned Aligned Aligned
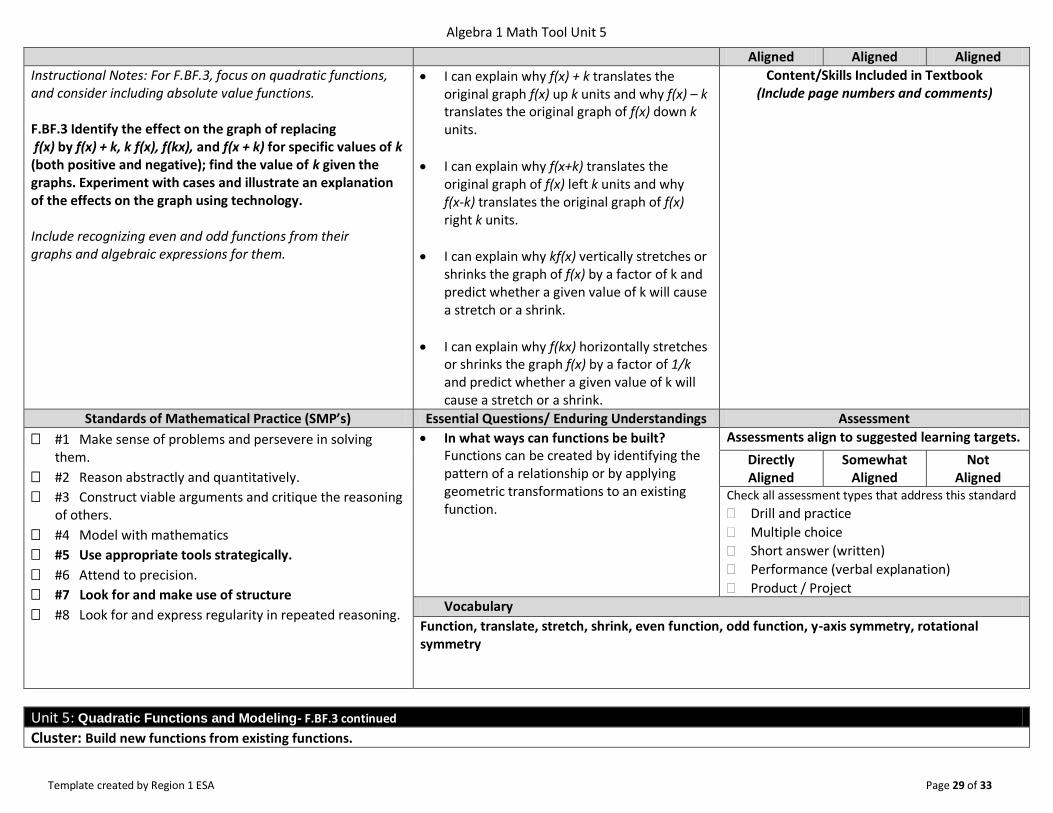
Instructional Notes: For F.BF.3, focus on quadratic functions, and consider including absolute value functions. F.BF.3 Identify the effect on the graph of replacing f(x) by f(x) + k, k f(x), f(kx), and f(x + k) for specific values of k (both positive and negative); find the value of k given the graphs. Experiment with cases and illustrate an explanation of the effects on the graph using technology. Include recognizing even and odd functions from their graphs and algebraic expressions for them.
I can explain why f(x) + k translates the original graph f(x) up k units and why f(x) – k translates the original graph of f(x) down k units.
I can explain why f(x+k) translates the original graph of f(x) left k units and why f(x-k) translates the original graph of f(x) right k units.
I can explain why kf(x) vertically stretches or shrinks the graph of f(x) by a factor of k and predict whether a given value of k will cause a stretch or a shrink.
I can explain why f(kx) horizontally stretches or shrinks the graph f(x) by a factor of 1/k and predict whether a given value of k will cause a stretch or a shrink.
Content/Skills Included in Textbook (Include page numbers and comments)
Standards of Mathematical Practice (SMP’s) Essential Questions/ Enduring Understandings Assessment
#1 Make sense of problems and persevere in solving them.
#2 Reason abstractly and quantitatively.
#3 Construct viable arguments and critique the reasoning of others.
#4 Model with mathematics
#5 Use appropriate tools strategically.
#6 Attend to precision.
#7 Look for and make use of structure
#8 Look for and express regularity in repeated reasoning.
In what ways can functions be built? Functions can be created by identifying the pattern of a relationship or by applying geometric transformations to an existing function.
Assessments align to suggested learning targets.
Directly Aligned
Somewhat Aligned
Not Aligned
Check all assessment types that address this standard
Drill and practice
Multiple choice
Short answer (written)
Performance (verbal explanation)
Product / Project Vocabulary
Function, translate, stretch, shrink, even function, odd function, y-axis symmetry, rotational symmetry
Unit 5: Quadratic Functions and Modeling- F.BF.3 continued
Cluster: Build new functions from existing functions.
Algebra 1 Math Tool Unit 5
Template created by Region 1 ESA Page 30 of 33
Standard Suggested Learning Targets Directly Aligned
Somewhat Aligned
Not Aligned
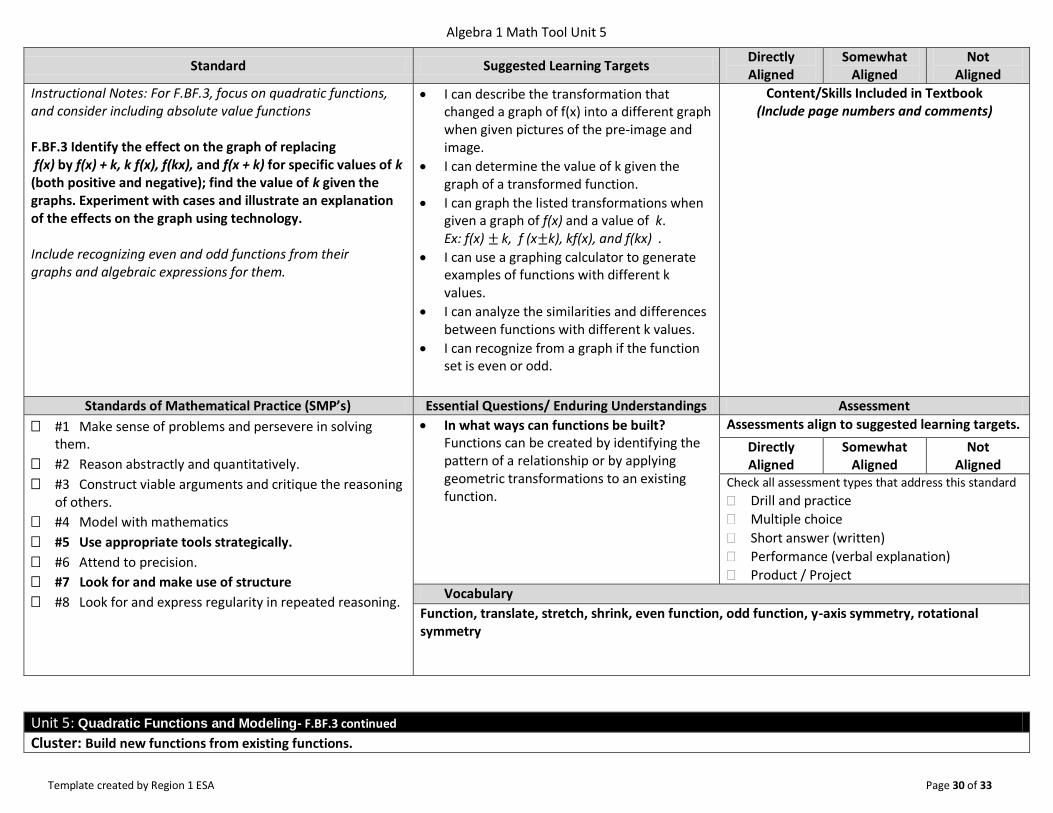
Instructional Notes: For F.BF.3, focus on quadratic functions, and consider including absolute value functions F.BF.3 Identify the effect on the graph of replacing f(x) by f(x) + k, k f(x), f(kx), and f(x + k) for specific values of k (both positive and negative); find the value of k given the graphs. Experiment with cases and illustrate an explanation of the effects on the graph using technology. Include recognizing even and odd functions from their graphs and algebraic expressions for them.
I can describe the transformation that changed a graph of f(x) into a different graph when given pictures of the pre-image and image.
I can determine the value of k given the graph of a transformed function.
I can graph the listed transformations when given a graph of f(x) and a value of k. Ex: f(x) k, f (x k), kf(x), and f(kx) .
I can use a graphing calculator to generate examples of functions with different k values.
I can analyze the similarities and differences between functions with different k values.
I can recognize from a graph if the function set is even or odd.
Content/Skills Included in Textbook (Include page numbers and comments)
Standards of Mathematical Practice (SMP’s) Essential Questions/ Enduring Understandings Assessment
#1 Make sense of problems and persevere in solving them.
#2 Reason abstractly and quantitatively.
#3 Construct viable arguments and critique the reasoning of others.
#4 Model with mathematics
#5 Use appropriate tools strategically.
#6 Attend to precision.
#7 Look for and make use of structure
#8 Look for and express regularity in repeated reasoning.
In what ways can functions be built? Functions can be created by identifying the pattern of a relationship or by applying geometric transformations to an existing function.
Assessments align to suggested learning targets.
Directly Aligned
Somewhat Aligned
Not Aligned
Check all assessment types that address this standard
Drill and practice
Multiple choice
Short answer (written)
Performance (verbal explanation)
Product / Project
Vocabulary
Function, translate, stretch, shrink, even function, odd function, y-axis symmetry, rotational symmetry
Unit 5: Quadratic Functions and Modeling- F.BF.3 continued
Cluster: Build new functions from existing functions.
Algebra 1 Math Tool Unit 5
Template created by Region 1 ESA Page 31 of 33
Standard Suggested Learning Targets Directly Aligned
Somewhat Aligned
Not Aligned
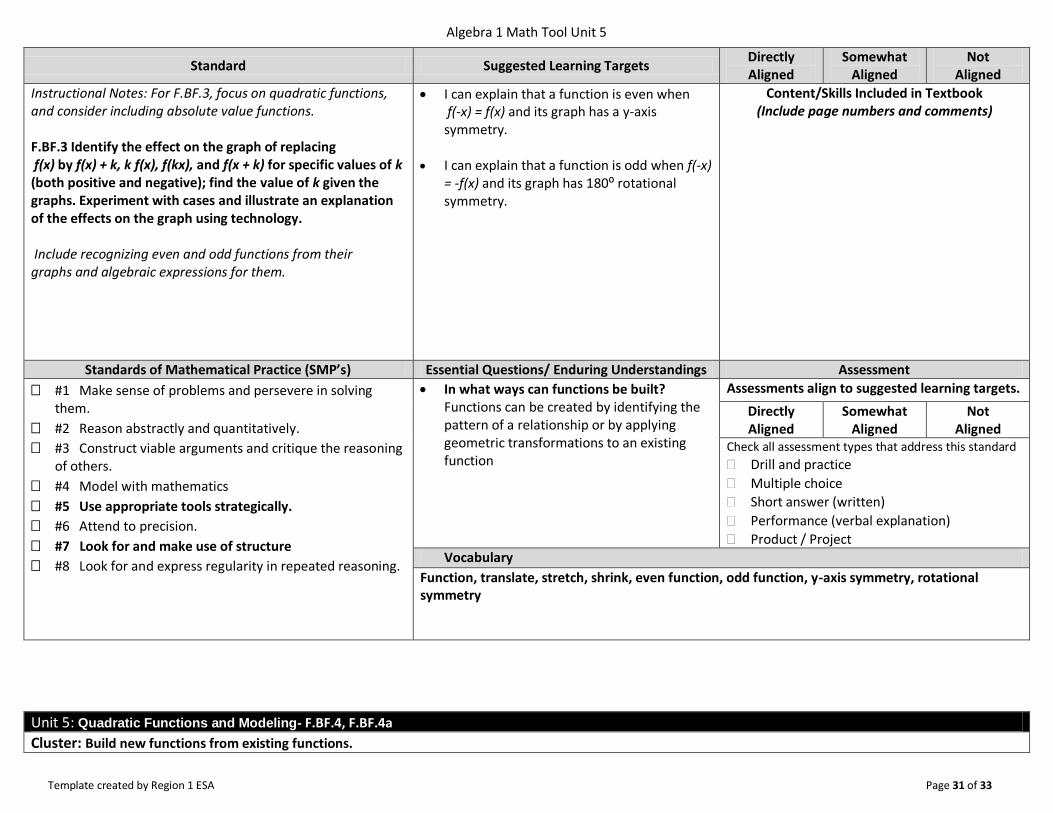
Instructional Notes: For F.BF.3, focus on quadratic functions, and consider including absolute value functions. F.BF.3 Identify the effect on the graph of replacing f(x) by f(x) + k, k f(x), f(kx), and f(x + k) for specific values of k (both positive and negative); find the value of k given the graphs. Experiment with cases and illustrate an explanation of the effects on the graph using technology. Include recognizing even and odd functions from their graphs and algebraic expressions for them.
I can explain that a function is even when f(-x) = f(x) and its graph has a y-axis symmetry.
I can explain that a function is odd when f(-x) = -f(x) and its graph has 180⁰ rotational symmetry.
Content/Skills Included in Textbook (Include page numbers and comments)
Standards of Mathematical Practice (SMP’s) Essential Questions/ Enduring Understandings Assessment
#1 Make sense of problems and persevere in solving them.
#2 Reason abstractly and quantitatively.
#3 Construct viable arguments and critique the reasoning of others.
#4 Model with mathematics
#5 Use appropriate tools strategically.
#6 Attend to precision.
#7 Look for and make use of structure
#8 Look for and express regularity in repeated reasoning.
In what ways can functions be built? Functions can be created by identifying the pattern of a relationship or by applying geometric transformations to an existing function
Assessments align to suggested learning targets.
Directly Aligned
Somewhat Aligned
Not Aligned
Check all assessment types that address this standard
Drill and practice
Multiple choice
Short answer (written)
Performance (verbal explanation)
Product / Project Vocabulary
Function, translate, stretch, shrink, even function, odd function, y-axis symmetry, rotational symmetry
Unit 5: Quadratic Functions and Modeling- F.BF.4, F.BF.4a
Cluster: Build new functions from existing functions.
Algebra 1 Math Tool Unit 5
Template created by Region 1 ESA Page 32 of 33
Standard Suggested Learning Targets Directly Aligned
Somewhat Aligned
Not Aligned
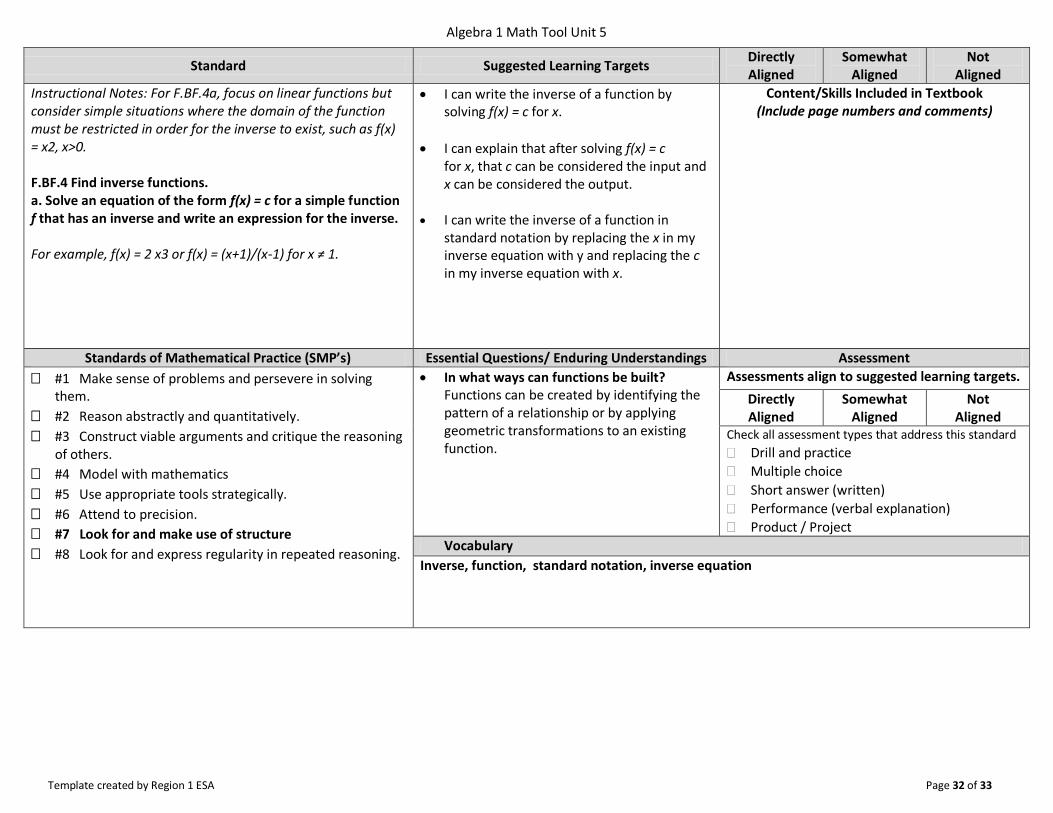
Instructional Notes: For F.BF.4a, focus on linear functions but consider simple situations where the domain of the function must be restricted in order for the inverse to exist, such as f(x) = x2, x>0. F.BF.4 Find inverse functions. a. Solve an equation of the form f(x) = c for a simple function f that has an inverse and write an expression for the inverse. For example, f(x) = 2 x3 or f(x) = (x+1)/(x-1) for x ≠ 1.
I can write the inverse of a function by solving f(x) = c for x.
I can explain that after solving f(x) = c for x, that c can be considered the input and x can be considered the output.
I can write the inverse of a function in standard notation by replacing the x in my inverse equation with y and replacing the c in my inverse equation with x.
Content/Skills Included in Textbook (Include page numbers and comments)
Standards of Mathematical Practice (SMP’s) Essential Questions/ Enduring Understandings Assessment
#1 Make sense of problems and persevere in solving them.
#2 Reason abstractly and quantitatively.
#3 Construct viable arguments and critique the reasoning of others.
#4 Model with mathematics
#5 Use appropriate tools strategically.
#6 Attend to precision.
#7 Look for and make use of structure
#8 Look for and express regularity in repeated reasoning.
In what ways can functions be built? Functions can be created by identifying the pattern of a relationship or by applying geometric transformations to an existing function.
Assessments align to suggested learning targets.
Directly Aligned
Somewhat Aligned
Not Aligned
Check all assessment types that address this standard
Drill and practice
Multiple choice
Short answer (written)
Performance (verbal explanation)
Product / Project
Vocabulary
Inverse, function, standard notation, inverse equation
Algebra 1 Math Tool Unit 5
Template created by Region 1 ESA Page 33 of 33
Unit 5: Quadratic Functions and Modeling- F.LE.3
Cluster: Construct and compare linear, quadratic, and exponential models and solve problems.
Standard Suggested Learning Targets Directly Aligned
Somewhat Aligned
Not Aligned
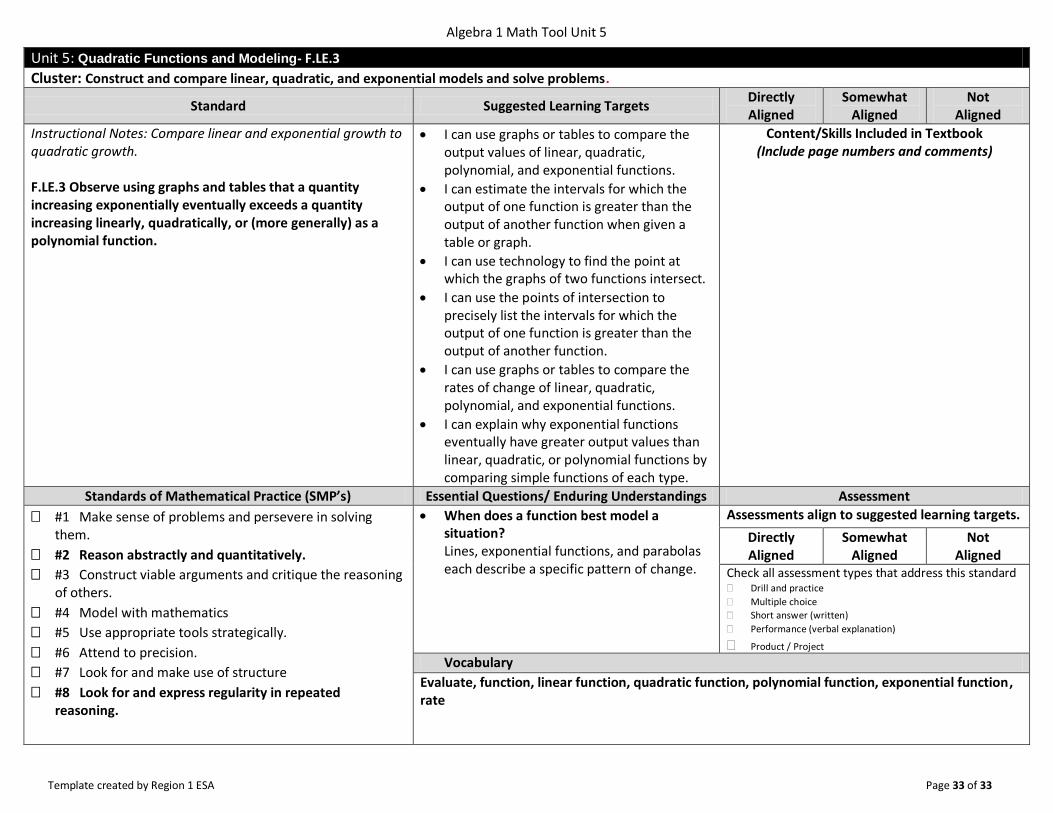
Instructional Notes: Compare linear and exponential growth to quadratic growth. F.LE.3 Observe using graphs and tables that a quantity increasing exponentially eventually exceeds a quantity increasing linearly, quadratically, or (more generally) as a polynomial function.
I can use graphs or tables to compare the output values of linear, quadratic, polynomial, and exponential functions.
I can estimate the intervals for which the output of one function is greater than the output of another function when given a table or graph.
I can use technology to find the point at which the graphs of two functions intersect.
I can use the points of intersection to precisely list the intervals for which the output of one function is greater than the output of another function.
I can use graphs or tables to compare the rates of change of linear, quadratic, polynomial, and exponential functions.
I can explain why exponential functions eventually have greater output values than linear, quadratic, or polynomial functions by comparing simple functions of each type.
Content/Skills Included in Textbook (Include page numbers and comments)
Standards of Mathematical Practice (SMP’s) Essential Questions/ Enduring Understandings Assessment
#1 Make sense of problems and persevere in solving them.
#2 Reason abstractly and quantitatively.
#3 Construct viable arguments and critique the reasoning of others.
#4 Model with mathematics
#5 Use appropriate tools strategically.
#6 Attend to precision.
#7 Look for and make use of structure
#8 Look for and express regularity in repeated reasoning.
When does a function best model a situation? Lines, exponential functions, and parabolas each describe a specific pattern of change.
Assessments align to suggested learning targets.
Directly Aligned
Somewhat Aligned
Not Aligned
Check all assessment types that address this standard Drill and practice
Multiple choice
Short answer (written)
Performance (verbal explanation)
Product / Project Vocabulary
Evaluate, function, linear function, quadratic function, polynomial function, exponential function, rate