Embed Size (px)
Citation preview

Alexion Equity Research
CURIC
Authors MALHOTRA Samya
CHEUNG Austin SUTANTO Levina Athalia
SHAHUL HAMEED Shoaib
2
DISCLAIMER The content and opinions in this report are written by university students from the CityU Student Research & Investment Club, and thus are for reference only. Investors are fully responsible for their investment decisions. CityU Student Research & Investment Club is not responsible for any direct or indirect loss resulting from investments referenced to this report. The opinions in this report constitute the opinion of the CityU Student Research & Investment Club and do not constitute the opinion of the City University of Hong Kong nor any governing or student body or department under the University.

3
ALEXION PHARMACEUTICALS (ALXN)
PHARMACEUTICALS MALHOTRA Samya [email protected] CHEUNG Austin [email protected] SUTANTO Levina Athalia [email protected] SHAHUL HAMEED Shoaib [email protected]
60
80
100
120
140
ALXN
Rating: Overweight Current Share Price: 123. 75 Price Target: 193.83 52-Week Range: $72.67-128.57 Market Cap: $26.99B Enterprise Value: $26.74B
Our analysis of Alexion Pharmaceuticals Inc., hereupon referred to as “Alexion Pharmaceuticals Inc”, “Alexion Pharmaceuticals”, “Alexion”, or “ALXN” has been driven by a number of modelling approaches, including DCF (Discounted Cash Flow) and CCA (Comparable Company Analysis). Our valuations give ‘ALXN’ a fair share value of US$193.83 with a BUY recommendation that has been calculated through the valuation of the 5-year forecast period ranging from the years ending 31st December 2020E to 2024E Alexion Pharmaceuticals is a long-time key player which focuses on developing life-changing therapies for people living with rare disorders. The four main revenue driven products are Soliris, Ultomiris, Strensiq and Kanuma. We view that Ultomiris will be the leader in the next decade for Paroxysmal Nocturnal Hemoglobinuria (PNH) and Atypical Hemolytic Uremic Syndrome (aHUS), two rare blood diseases. Starting from 2019, Alexion is shifting its customer to Ultomiris, the successor of Soliris, as the exclusiveness will expires in March next year. The conversion is smooth so far with Ultomiris having 5x of its net sales in Q2 2020 YoY. Ultomiris currently has multiple phase III programs on different indications. The significantly lengthened interval between injection and lower maintenance fees will make Ultomiris soon take over Soliris and further distance itself from any forms of competition. Alexion has committed to diversifying its pipeline by business development transactions. In the past year, there were a few significant transactions that brought phase III clinical programs to Alexion and there will be 10 potential product launches by 2023. Given the successful experience of finding and expanding the patient base for its own drug, we believe that the new product will be successfully commercialized to the respective patients which will generate significant growth. Our rating for Alexion is buy, with a target price of US$193.83
Dominance of Ultomiris, strong and diverse pipeline sets Alexion for long-term growth

4
Table of Contents
Company Overview…………………………………………………………………...……………...5 Revenue Breakdown ………………………………………………………………….……………...6 Regional Analysis……………...……………...……………...……………...……………...……………................8 Investment Risks and Catalysts……………………………………………………….………….9 Catalysts……………………………………………………….……………...……………...……………9 Intent to diversify with acquisitions……………………………………………………….……………...9 Ultomiris’ Approval……………………………………………………….……………...………………….9
Upcoming pipeline opportunities……………………………………………………….…………….....10 Risks……………………………………………………….…………………………………………………10 Unsatisfactory performance of share price…………………………………………………………10 Overdependence of current label products…………………………………………………………11 Competition and setbacks in pipeline R&D………………………………………………………….11 Valuations………………………………………………………………………………..……………...12 Summary…………………………………………………………………..............................…………….......12 Discounted Cash Flow …………………………………………………………………..........…………….......12 Comparables………………………………………………………………….................................................13
Summary of Financials…………..…………………………………………………………………14

5
1. Company Overview
Alexion Pharmaceuticals is a global biopharmaceutical company focused on developing and commercializing treatments for patients with rare diseases. Alexion has its internal manufacturing facilities in Ireland and contracts with third-party manufacturers to perform filling, packaging, and labelling before selling through Alexion’s commercial organization and third parties in selected regions. The main customers are drug wholesalers and healthcare service providers. Alexion has more than three thousand employees and operations in 18 countries worldwide. In addition to partnership for commercial operation in 29 jurisdictions. Until 2019, Alexion has four revenue-driven products that constitute near US$ 5 billion net product sales.
Alexion’s corporate strategy is to maximize leadership in the rare disease business by executing the Soliris-Ultomiris conversion, making Ultomiris the next market leader for PNH and aHUS, in addition to diversifying the product pipeline. Alexion has 18 planned clinical development programs in 2020 and has ten potential product launches by 2023, in addition to other programs through the acquisition of Achillion Pharmaceuticals, Portola Pharmaceuticals and the minority interest in Caelum Biosciences.
Figure 1. Product Line

6
Figure 2. Current Events
2. Revenue Breakdown
Alexion Pharmaceutical’s total revenue, as in the figure below, has grown from US$ 4,131.2 million in 2018 to US$ 4,991.1 million in 2019, with a total growth of approximately 20.81%. Prior to that, the total revenue of 2018 was increasing by 16.33% from US$ 3,551.1 million in 2017.
50
80
110
140
170
200
14/10/2015 14/10/2016 14/10/2017 14/10/2018 14/10/2019
March 2020: Covid-19 Market Crash
May 2020: Acquired Portola Pharmaceuticals
Oct 2019: Acquired Achillion Pharmaceuticals
Apr 2018: Acquired Wilson Therapeutics
Oct 2015:FDA approved Strensiq for treating HPP
Dec 2018: FDA approved Ultomiris
14/10/2020
Figure 3. Total Revenue Growth
Figure 4. Revenue distribution by product
Figure 5. Product Segment Revenue
7
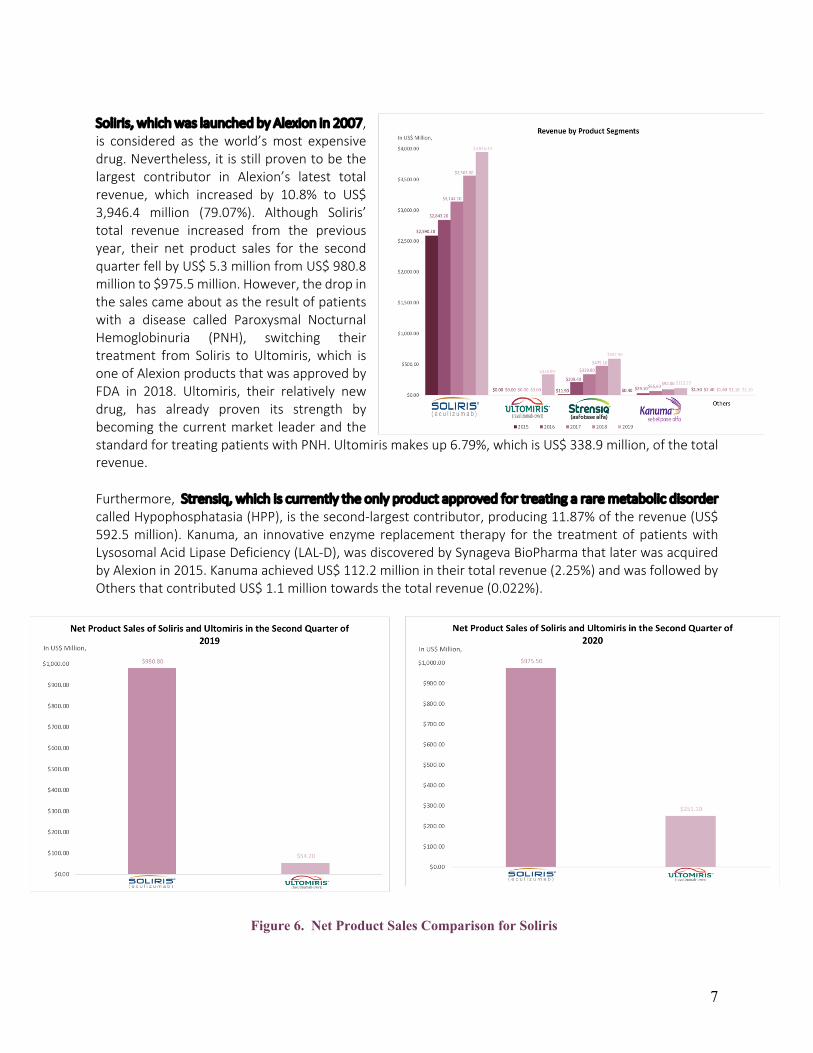
Soliris, which was launched by Alexion in 2007, is considered as the world’s most expensive drug. Nevertheless, it is still proven to be the largest contributor in Alexion’s latest total revenue, which increased by 10.8% to US$ 3,946.4 million (79.07%). Although Soliris’ total revenue increased from the previous year, their net product sales for the second quarter fell by US$ 5.3 million from US$ 980.8 million to $975.5 million. However, the drop in the sales came about as the result of patients with a disease called Paroxysmal Nocturnal Hemoglobinuria (PNH), switching their treatment from Soliris to Ultomiris, which is one of Alexion products that was approved by FDA in 2018. Ultomiris, their relatively new drug, has already proven its strength by becoming the current market leader and the standard for treating patients with PNH. Ultomiris makes up 6.79%, which is US$ 338.9 million, of the total revenue. Furthermore, Strensiq, which is currently the only product approved for treating a rare metabolic disorder called Hypophosphatasia (HPP), is the second-largest contributor, producing 11.87% of the revenue (US$ 592.5 million). Kanuma, an innovative enzyme replacement therapy for the treatment of patients with Lysosomal Acid Lipase Deficiency (LAL-D), was discovered by Synageva BioPharma that later was acquired by Alexion in 2015. Kanuma achieved US$ 112.2 million in their total revenue (2.25%) and was followed by Others that contributed US$ 1.1 million towards the total revenue (0.022%).
Figure 6. Net Product Sales Comparison for Soliris

8
Regional Analysis Alexion’s largest market is the United States with a revenue of US$ 2,762.5 million (55.35% from the total revenue of 2019). Followed by Europe, with an increase of 7.68% from last year’s revenue, US$ 1,120 million, to US$ 1,206.1 million. The Asia Pacific, in which product sales mostly occur to Japan, makes up US$ 528.4 million. Then, the Rest of the World contributes a total of US$ 493 million. The contribution of the other revenue remained stable at US$ 1.1 million.
Figure 7. Revenue Breakdown by Regions

9
3. Investment Catalysts and Risk
3.1 Catalysts 3.1.1 Intent to diversify with acquisitions Since 2018, Alexion has spent nearly US$ 4 billion on mergers and acquisitions of companies which share their goal in combating rare diseases. Some may argue that the efforts from these acquisitions have deterred their own focus on R&D, however the improved and still improving underlying financials strongly support their actions. Their revenue has increased by an average of 21.5% per year. Their most recent acquisition was Portola (California based biotechnology company) through which they intend to further commercialise Portola’s key drug Andexxa into the global market. Andexxa is a drug (protein-based) which is used to reverse the effect caused by a certain few anticoagulant medications which treat blood clots. Commonly, it treats uncontrolled bleeding in patients who have used the anticoagulants Xarelto and Apixaban. Before the acquisitions, Andexxa delivered disappointing sales, but Alexion has a set vision, which may take some time to materialize but is likely to be very successful.
3.1.2 Ultomiris’ Approval Atypical Haemolytic Uremic Syndrome (aHUS) and Paroxysmal Nocturnal Haemoglobinuria (PNH) are 2 rare diseases that affect the working of the red blood cells in humans. Alexion’s champion drug Ultomiris has been crucial in helping patients who suffer from aHUS and PNH. Post the green light from the FDA in 2018 for PNH and 2019 for aHUS, Alexion has been making strides into bringing Ultomiris into a variety of markets. Ultomiris is the successor of Alexion’s champion drug – Soliris. The dosages taken with Ultomiris allows patients to have their treatment further apart whilst Soliris requires patients to undergo a maintenance treatment every 2 weeks. In 2019, Ultomiris was approved by the Ministry of Health in Japan.
Figure 8. Acquisitions Since 2018

10
Having recently gained approval for Ultomiris to be used for treating aHUS* in the EU, Alexion’s efforts put into R&D today could become noteworthy.
3.1.3 Upcoming pipeline opportunities Alexion currently has 7 therapeutic drugs in either “phase 1” or pre-clinical stages under their future pipeline products. Andexxa is also on the list with Alexion making efforts to try and get this drug evaluated to be used under immediate and urgent surgical conditions. 5 out of these 7 products are from a result of collaboration with Affibody and Zealand Pharma ABY-039 for Immunoglobulin G (IgG)-mediated autoimmune diseases is already in progress with phase 1 trials. Under the decided conditions of these deals, Alexion will take the lead in the R&D phases and co-promote the products to ensure that it receives the required approvals. Furthermore, under their Ultomiris label, there are 7 products that aim to be launched in 2023. *ages 10 and below
3.2 Investment Risks
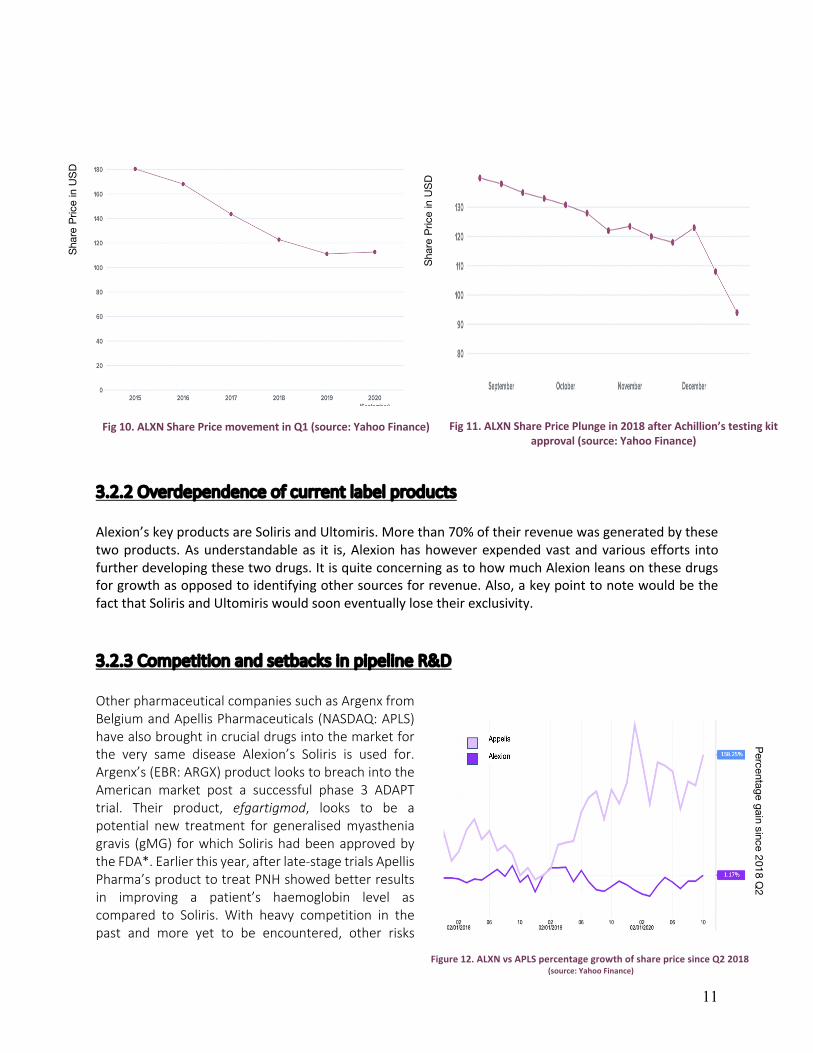
3.2.1 Unsatisfactory performance of share price Considering Alexion’s stock price movement for the past 3 or 5 years, it is easy to notice that the results have been relatively unsatisfactory. Looking at data from 2018, their share price nearly plunged by 30 points. This was due to a move by market peer Achillion Pharmaceuticals (later acquired by Alexion in late 2019) where they had issued a successful launch of a drug testing kit for a key treatment which was anticipated by investors.
Figure 9. Labels under Ultomiris in development
11
3.2.2 Overdependence of current label products Alexion’s key products are Soliris and Ultomiris. More than 70% of their revenue was generated by these two products. As understandable as it is, Alexion has however expended vast and various efforts into further developing these two drugs. It is quite concerning as to how much Alexion leans on these drugs for growth as opposed to identifying other sources for revenue. Also, a key point to note would be the fact that Soliris and Ultomiris would soon eventually lose their exclusivity. 3.2.3 Competition and setbacks in pipeline R&D Other pharmaceutical companies such as Argenx from Belgium and Apellis Pharmaceuticals (NASDAQ: APLS) have also brought in crucial drugs into the market for the very same disease Alexion’s Soliris is used for. Argenx’s (EBR: ARGX) product looks to breach into the American market post a successful phase 3 ADAPT trial. Their product, efgartigmod, looks to be a potential new treatment for generalised myasthenia gravis (gMG) for which Soliris had been approved by the FDA*. Earlier this year, after late-stage trials Apellis Pharma’s product to treat PNH showed better results in improving a patient’s haemoglobin level as compared to Soliris. With heavy competition in the past and more yet to be encountered, other risks
Shar
e Pr
ice
in U
SD
Fig 10. ALXN Share Price movement in Q1 (source: Yahoo Finance) Sh
are
Pric
e in
USD
Fig 11. ALXN Share Price Plunge in 2018 after Achillion’s testing kit
approval (source: Yahoo Finance)
Percentage gain since 2018 Q2
Figure 12. ALXN vs APLS percentage growth of share price since Q2 2018 (source: Yahoo Finance)

12
within Alexion are from the internal side where major or minor setbacks can occur at any instances with regards to R&D. Considering Alexion’s case where they look set to further dive into particular pipelines, the risk could be less harmful, but nonetheless still potent. *AchR antibody-positive patients
4. Valuations
4.1 Summary Our target price is valued at $193.839 as opposed to the current price of $123.75 (10/10/20) is derived from a weighted average of 2 valuations, the Discounted Cash Flow Model (DCF) and the Comparables Model. We obtained a fair share price value of $207.48 from our DCF Valuation and $116.4 from our Comparables Model. The target share price was obtained by accounting 85% to the DCF valuation and 15% to our Comparables analysis. We believe that Alexion, being one of the leading bio-pharmaceutical companies and working towards the commercialization of life-transforming drugs for patients, has an intense growth potential for future.
4.2 Discounted Cash Flow Model (Weightage 85%)
Figure 13. Football Field Graph

13
4.3 Sensitivity Analysis
4.4 Comparables
$209.08 0.9% 1.0% 1.1% 1.2% 1.3% 1.4% 1.5%
6.7% 214.09 217.02 220.06 223.20 226.46 229.84 233.366.8% 209.38 212.18 215.08 218.08 221.19 224.42 227.776.9% 204.84 207.52 210.29 213.16 216.13 219.21 222.407.0% 199.59 202.13 204.76 207.48 210.30 213.21 216.237.1% 196.22 198.68 201.22 203.84 206.56 209.37 212.287.2% 192.14 194.49 196.93 199.44 202.04 204.73 207.517.3% 188.20 190.45 192.78 195.19 197.68 200.25 202.917.4% 184.38 186.55 188.78 191.09 193.47 195.94 198.48
WA
CC
Perpetual Growth Rate
14
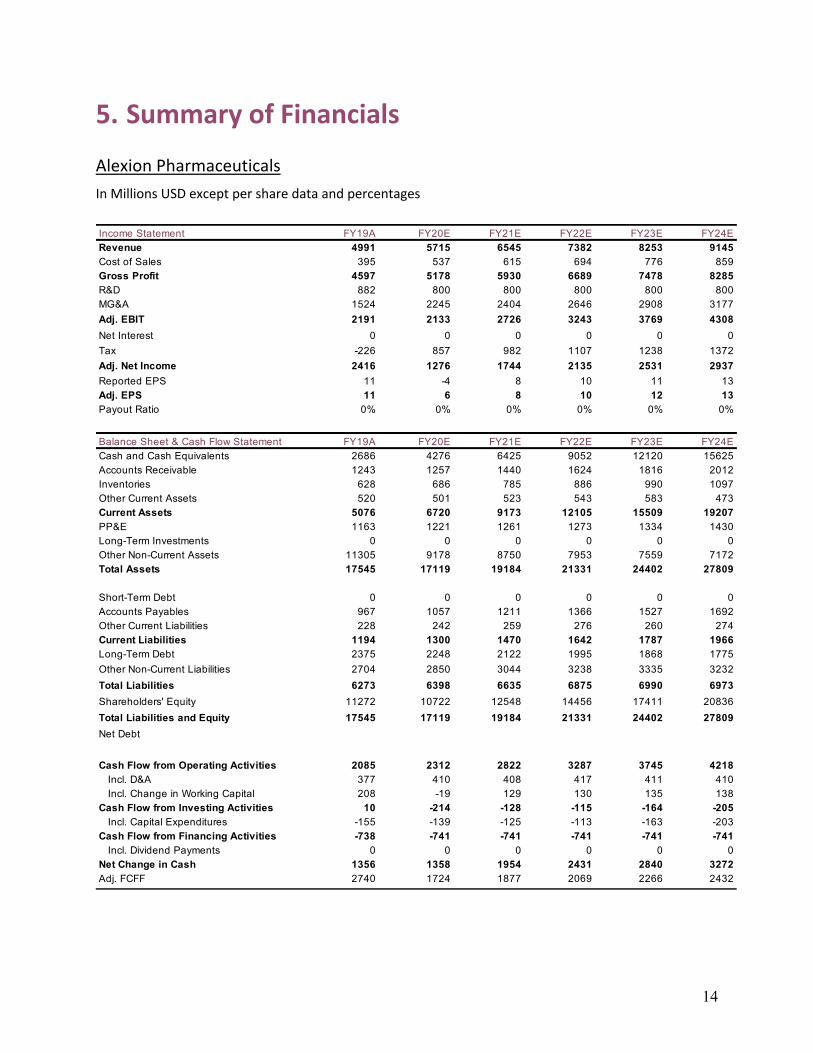
5. Summary of Financials Alexion Pharmaceuticals In Millions USD except per share data and percentages
Income Statement FY19A FY20E FY21E FY22E FY23E FY24ERevenue 4991 5715 6545 7382 8253 9145Cost of Sales 395 537 615 694 776 859Gross Profit 4597 5178 5930 6689 7478 8285R&D 882 800 800 800 800 800MG&A 1524 2245 2404 2646 2908 3177Adj. EBIT 2191 2133 2726 3243 3769 4308Net Interest 0 0 0 0 0 0Tax -226 857 982 1107 1238 1372Adj. Net Income 2416 1276 1744 2135 2531 2937Reported EPS 11 -4 8 10 11 13Adj. EPS 11 6 8 10 12 13Payout Ratio 0% 0% 0% 0% 0% 0%
Balance Sheet & Cash Flow Statement FY19A FY20E FY21E FY22E FY23E FY24ECash and Cash Equivalents 2686 4276 6425 9052 12120 15625Accounts Receivable 1243 1257 1440 1624 1816 2012Inventories 628 686 785 886 990 1097Other Current Assets 520 501 523 543 583 473Current Assets 5076 6720 9173 12105 15509 19207PP&E 1163 1221 1261 1273 1334 1430Long-Term Investments 0 0 0 0 0 0Other Non-Current Assets 11305 9178 8750 7953 7559 7172Total Assets 17545 17119 19184 21331 24402 27809
Short-Term Debt 0 0 0 0 0 0Accounts Payables 967 1057 1211 1366 1527 1692Other Current Liabilities 228 242 259 276 260 274Current Liabilities 1194 1300 1470 1642 1787 1966Long-Term Debt 2375 2248 2122 1995 1868 1775Other Non-Current Liabilities 2704 2850 3044 3238 3335 3232Total Liabilities 6273 6398 6635 6875 6990 6973Shareholders' Equity 11272 10722 12548 14456 17411 20836Total Liabilities and Equity 17545 17119 19184 21331 24402 27809Net Debt
Cash Flow from Operating Activities 2085 2312 2822 3287 3745 4218Incl. D&A 377 410 408 417 411 410Incl. Change in Working Capital 208 -19 129 130 135 138
Cash Flow from Investing Activities 10 -214 -128 -115 -164 -205Incl. Capital Expenditures -155 -139 -125 -113 -163 -203
Cash Flow from Financing Activities -738 -741 -741 -741 -741 -741Incl. Dividend Payments 0 0 0 0 0 0
Net Change in Cash 1356 1358 1954 2431 2840 3272Adj. FCFF 2740 1724 1877 2069 2266 2432