Embed Size (px)
Citation preview
Ocean Plastics: Alternatives to Preserve Health and the Planet
Jose Alex Franco, Marco Lobba, Mariana Rivas and Samantha Schildroth UC Berkeley - Greener Solutions
December 14, 2018
Table of Contents Acknowledgments ........................................................................................................................... i
Abstract .......................................................................................................................................... 1
1. Background ................................................................................................................................ 2
2. Approach .................................................................................................................................... 3
3. Inspiration .................................................................................................................................. 5
4. Technical Performance Overview ............................................................................................ 6
5. Health and Environmental Performance Overview ............................................................. 10
6. Strategies and Alternatives ..................................................................................................... 21
7. Conclusion and Final Recommendations .............................................................................. 40
Appendix ...................................................................................................................................... 41
References .................................................................................................................................... 46
i
Acknowledgments We thank Meg Schwarzman, Billy Hart-Cooper, David Faulkner, and Tom McKeag for their mentorship and expertise that greatly assisted our Greener Solutions project. We are grateful for the support and feedback provided throughout our research process. We are grateful for the opportunity to partner with Method and to contribute to their continuing goals of social and environmental consciousness. Thank you to Kaj Johnson, Michelle Byle and Ryan Williams of Method for their assistance and guidance with this project. Their comments and suggestions throughout the semester were extremely valuable in pointing our team in the right direction.
1
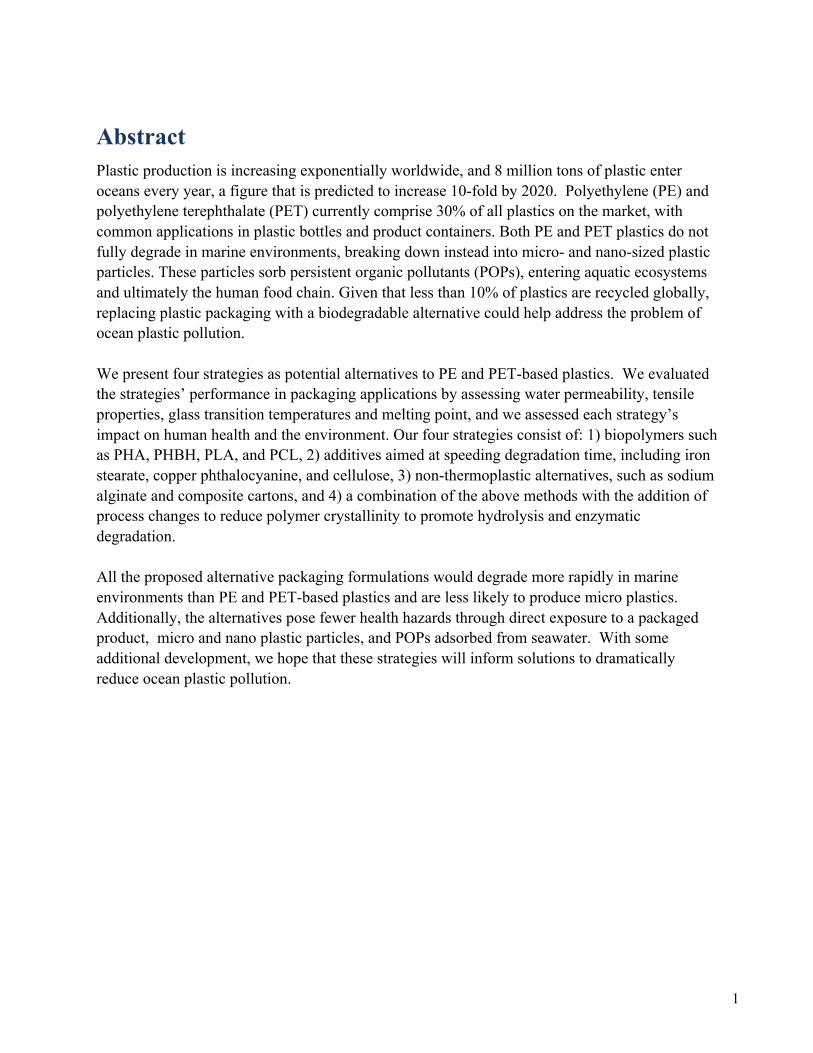
Abstract Plastic production is increasing exponentially worldwide, and 8 million tons of plastic enter oceans every year, a figure that is predicted to increase 10-fold by 2020. Polyethylene (PE) and polyethylene terephthalate (PET) currently comprise 30% of all plastics on the market, with common applications in plastic bottles and product containers. Both PE and PET plastics do not fully degrade in marine environments, breaking down instead into micro- and nano-sized plastic particles. These particles sorb persistent organic pollutants (POPs), entering aquatic ecosystems and ultimately the human food chain. Given that less than 10% of plastics are recycled globally, replacing plastic packaging with a biodegradable alternative could help address the problem of ocean plastic pollution. We present four strategies as potential alternatives to PE and PET-based plastics. We evaluated the strategies’ performance in packaging applications by assessing water permeability, tensile properties, glass transition temperatures and melting point, and we assessed each strategy’s impact on human health and the environment. Our four strategies consist of: 1) biopolymers such as PHA, PHBH, PLA, and PCL, 2) additives aimed at speeding degradation time, including iron stearate, copper phthalocyanine, and cellulose, 3) non-thermoplastic alternatives, such as sodium alginate and composite cartons, and 4) a combination of the above methods with the addition of process changes to reduce polymer crystallinity to promote hydrolysis and enzymatic degradation. All the proposed alternative packaging formulations would degrade more rapidly in marine environments than PE and PET-based plastics and are less likely to produce micro plastics. Additionally, the alternatives pose fewer health hazards through direct exposure to a packaged product, micro and nano plastic particles, and POPs adsorbed from seawater. With some additional development, we hope that these strategies will inform solutions to dramatically reduce ocean plastic pollution.
2
Section 1 Background Plastics are ubiquitous in modern economy and are an essential aspect of packaging consumer products. Especially significant to our project are polyethylene terephthalate (PET) and high-density polyethylene (HDPE), which have largely and effectively replaced metal and glass as the primary packaging for consumer products. Their thermoplasticity, low cost, barrier to moisture, stability to various solvents, and weight to strength ratios make them ideal for large scale use in packaging (Kaiser, 2017). However, although their thermoplasticity and largely established infrastructures make them ideal for recycling chains, less than 10% of the 300 million tons of all plastics produced annually are recycled (EPA, 2018). Currently, 8 million tons of plastic are deposited into the ocean annually and represent 80% of all marine debris. By 2020, there is expected to be a tenfold increase in marine plastic, and by 2050 there will be more plastic in the oceans than there are fish by weight (Earth Day Network, 2018). Various degradation processes, both biotic and abiotic, can lead to breakup but not complete dissolution of plastics in aquatic environments that impair the health of entire ecosystems. This is due largely to the scarcity of mechanisms capable of taking polymers below the micro scale threshold.(Gewert, Plassmann, and MacLeod 2015; Cole et al., 2011b). The initially most rapid forms of marine degradation are a combination of mechanical and thermal forces coupled with brittling due to UV radiation. These forces take plastics from the macroscale to the micron scale, but beyond that point there is little impact from mechanical or shear forces.(Gewert, Plassmann, and MacLeod 2015; Harrison et al., 2018; Cole et al., 2011b) Instead, further degradation is reliant upon a combination of photooxidative and bacterial processes (Gewert, Plassmann, and MacLeod 2015; Cole et al., 2011b). A primary goal of this work is to speed the transition between micro scale plastic particles and individual strands that can be enzymatically degraded. The prevalence of micro plastics is of crucial importance due to their long-lasting nature and potential impact on the marine ecosystem. For example, the likelihood of coral becoming diseased increases from 4% to 89% after coming in contact with marine plastic (Lamb, 2018). It also damages the protective coating of coral, allowing infection. With coral reefs serving as home to over 25% of marine life (EPA, 2018), this threatens the stability of the marine ecosystem. Additionally, ocean plastics, in particular micro and nanoplastics, threaten human health and the environment. Their composition and relatively large surface area make them prone to adsorbing waterborne organic pollutants (DDT, PCBs, phthalates, BPA and PAHs), as well as leaching of toxic compounds (Mattson, 2015). The ingestion and bioaccumulation of these pollutants in marine life introduces toxicants into the food chain, which pose a potential exposure route to humans and aquatic predators (Gallo, 2018). The fate of microplastics in the ocean is elusive and research on human impacts is lacking. It is urgent to replace consumer-use plastics with less toxic, rapidly degrading alternatives.
3
Section 2 Approach We chose to approach this topic from the perspective of mitigation. Since less than 10% of plastics are actually recycled (Geyer et al., 2017) we must make the assumption that a significant portion of recyclable containers will necessarily enter ocean environments. From this perspective, it becomes imperative to ensure that once plastics enter the aquatic environment, they persist for the minimum time possible to prevent harm to marine life. We partnered with Method, a company that incorporates sustainability and believes in using their business power to create positive social and environmental change. Method is a founding b corporation, which aims to create a solution for large problems while meeting comprehensive standards and integrating stakeholders’ interests. Method has already engaged in innovative strategies to redesign their packaging to minimize plastic content with reusable bottles and large, thin-walled containers for their re-fill options. They have also switched to dry formulations for certain products where possible to cut down on packaging. Due to these efforts our team chose not to address formulation or re-design of packaging as a mitigation strategy. Similarly, much effort has already been spent on attempts to increase the rate of recycling across the US and worldwide. Given the significant efforts already underway, this type of social and policy change was deemed beyond the scope of our project. Having Method as a partner is ideal for this project since they spend significant time and resources on packaging design, resulting in greater flexibility in implementing new packaging strategies. Method is further positioned to try new packaging strategies due to the in-house bottle production facility in their Illinois warehouse (Kaj Johnson, personal communication). The combined focus on package design and the easy access to a production facility will allow for rapid testing and implementation of novel packaging materials at a scale beyond the capabilities of many research environments. Our team determined that the best course of action was to pursue strategies to ensure plastic containers that eventually do enter the marine ecosystem degrade as quickly as possible. Our project is dually faceted with the goals of 1) limiting or eliminating the amount of microplastics that enter oceanic ecosystems and 2) limiting humans’ and aquatic ecosystems’ exposure to harmful chemicals exposure of harmful chemicals in plastics to humans and aquatic ecosystems. To achieve this, we want to explore rapidly degrading alternatives that will break down before causing any adverse health and environmental outcomes. In aquatic environments, polymers will most likely degrade due to temperature, mechanical or shear forces, hydrolysis and microbial presence. Our proposed solutions aim to target the range between mechanical and microbial breakdown that is currently the major barrier to degradation (Jenkins and Harrison, 2008; Karamanlioglu, Preziosi, and Robson, 2017). To achieve these goals we pursued 4 main strategies: 1) biodegradable polymers such as PHA, PHBH, PLA, and PCL capable of breaking down in natural aquatic systems, 2) additives aimed at speeding

4
degradation time of existing polymers or biopolymer alternatives including iron stearate, copper phthalocyanine, and cellulose, 3) non-thermoplastic alternatives such as sodium alginate and composite cartons that could be used to replace thermoplastic container, and 4) a combinatorial approach using the above methods with the addition of process changes to reduce polymer crystallinity to promote hydrolysis and enzymatic degradation.
5
Section 3 Inspiration We were inspired by non-plastic polymers in nature such as cellulose or keratin that are durable and have strong structural characteristics but are capable of being degraded by naturally occurring microorganisms in short periods of time given appropriate conditions. Our goal was to find polymers with these same properties- high durability but susceptible to enzymatic degradation- that also maintained thermoplastic capabilities. One of the most important steps in polymer degradation is the separation of individual monomers. We chose to avoid common linkages such as amides or glycosidic bonds due to their generally lower performance as thermoplastics. One linkage found in both nature and commercial thermoplastics is the ester bond, whose susceptibility to hydrolysis can be controlled by substitution or modification of the adjacent carbon atoms (Chmiel, 1956). Depending on the monomers used, there are a variety of naturally occurring enzymes that can further catalyze the rate of ester hydrolysis (Kato, 1987), however they are somewhat less common, which can extend shelf life but will have to be carefully balanced to maintain rapid degradation in the marine environment. Further strategies were motivated by examining natural packaging systems such as fruits and coconuts capable of preserving fluids for extended periods, but also readily degraded in the natural environment. These systems contain polysaccharide-based structural elements, coupled with hydrophobic barriers to preserve their fluid content. In many cases, enzymes on or within the structure initiate polymer degradation, hastened by radiation or ready sources of bacterially available sugars.
6
Section 4 Technical Performance Overview As a consumer product, any container must survive packaging, shipping, temperatures from -10°C to over 40°C (0 to 120°F), a range of pH, and short exposure to UV during transportation, all without discoloration or breakdown. In addition, a successful alternative should meet three main criteria: 1) comparable barrier properties to PE and PET, 2) good mechanical properties, and 3) fast degradation rates in marine environments.
4.1 Barrier and Chemical Properties Since the majority of Method products are water-based detergents, any proposed solution must provide sufficiently high barriers to gases and vapors (comparable to PET and PE) to prevent dehydration and concentration of the product over the 2-year expected shelf life. The permeability of a material of given thickness is defined as the amount of a substance (vapor, gas, liquid, etc.) that permeates per unit area and time. Water vapor and oxygen permeabilities are two of the main barrier properties in packaging applications, because water vapor and oxygen can transfer from inside or the outside of the package, resulting in changes to the quality of a given product and the shelf life (Siracusa et al., 2008).
4.2 Mechanical Properties 4.2.1 Tensile Properties Three tensile properties of our alternatives will be considered in our analysis: strength (MPa), Young’s Modulus (GPa), and elongation at break (%). Values obtained for our alternative polymers can be compared to commercial materials, namely PE and PET, and will provide information about the material’s resistance to break under tension, its flexibility, and its ability to resist changes. These values can predict mechanical properties and stability, and, consequently, possible processes used to make the product (injection, blow molding, film forming, etc.)
4.2.2 Thermal Properties Melting and glass transition temperatures are often used to determine the characteristics of a polymer and its range of mechanical operation. The melting temperature (Tm) is the point at which the polymer becomes more viscous and can be molded into different shapes. The glass transition temperature (Tg) is the point at which the polymer goes from a glassy state to a more rubbery state. This can help determine the rigidity of the polymer at the use temperature and can be an indicator of compatibility with other polymers. The glass transition temperature can also predict biodegradation, especially at temperatures below the glass transition temperature (deep-sea), since glassy polymers will degrade more slowly than rubbery ones.
7
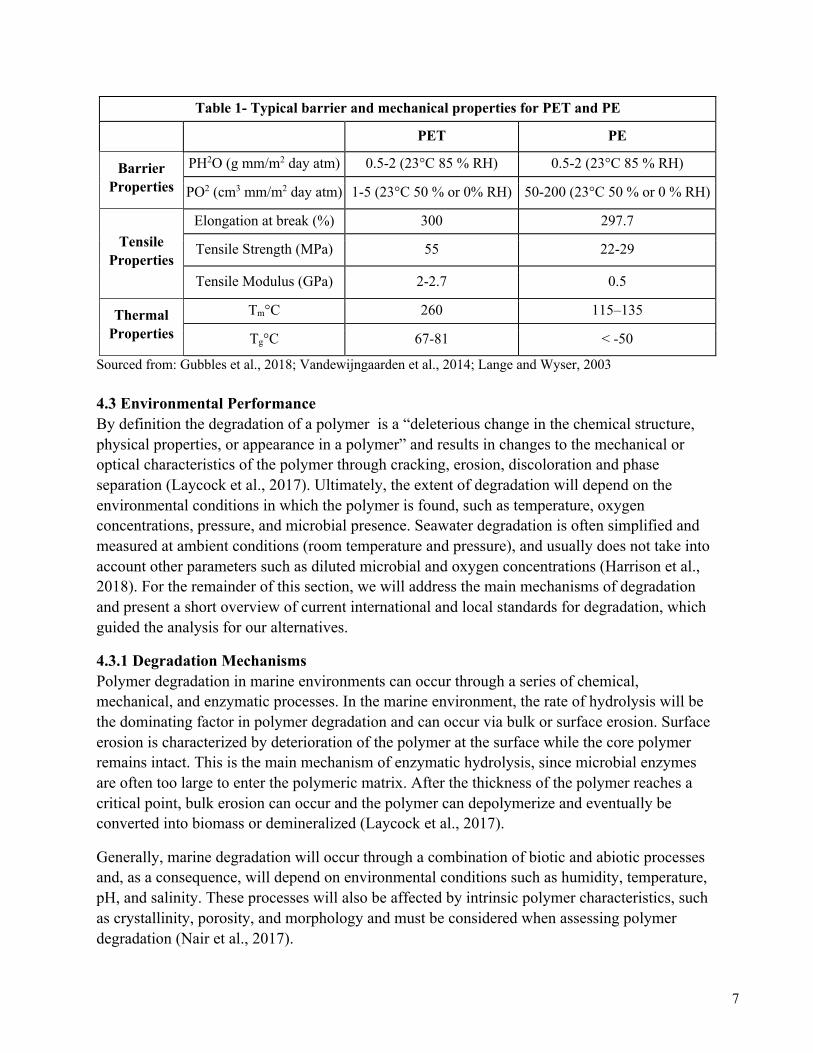
Table 1- Typical barrier and mechanical properties for PET and PE
PET PE
Barrier Properties
PH2O (g mm/m2 day atm) 0.5-2 (23°C 85 % RH) 0.5-2 (23°C 85 % RH)
PO2 (cm3 mm/m2 day atm) 1-5 (23°C 50 % or 0% RH) 50-200 (23°C 50 % or 0 % RH)
Tensile Properties
Elongation at break (%) 300 297.7
Tensile Strength (MPa) 55 22-29
Tensile Modulus (GPa) 2-2.7 0.5
Thermal Properties
Tm°C 260 115–135
Tg°C 67-81 < -50
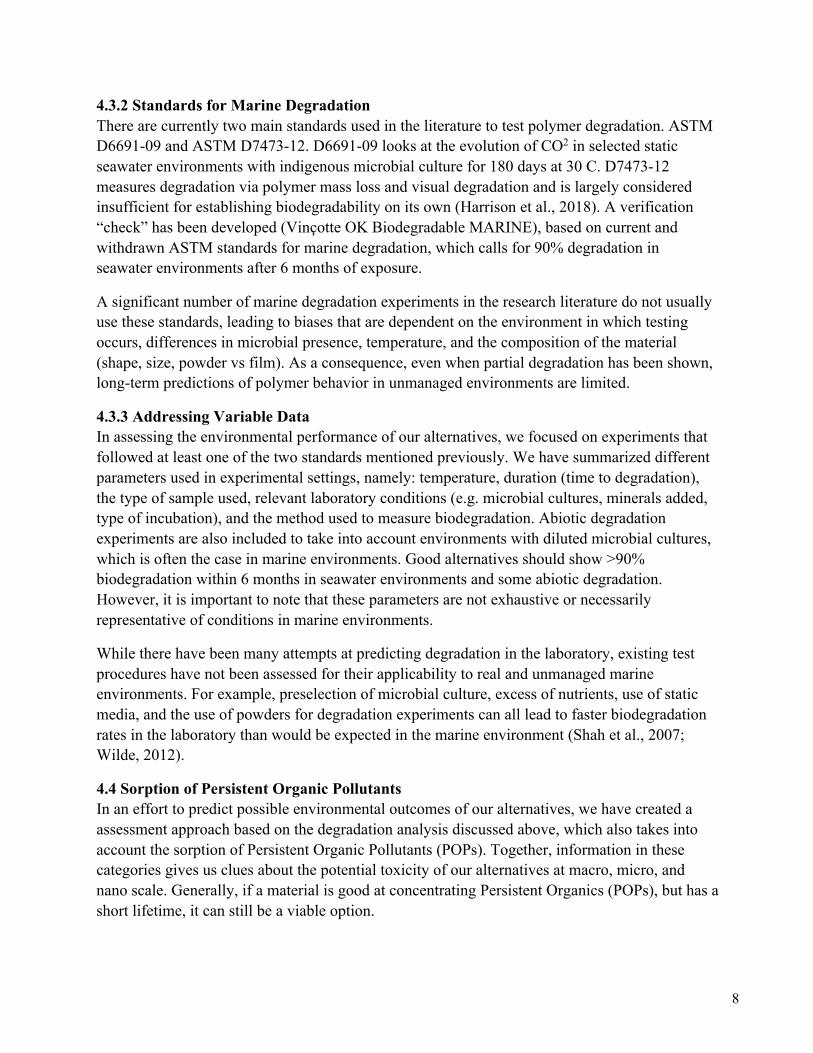
Sourced from: Gubbles et al., 2018; Vandewijngaarden et al., 2014; Lange and Wyser, 2003 4.3 Environmental Performance By definition the degradation of a polymer is a “deleterious change in the chemical structure, physical properties, or appearance in a polymer” and results in changes to the mechanical or optical characteristics of the polymer through cracking, erosion, discoloration and phase separation (Laycock et al., 2017). Ultimately, the extent of degradation will depend on the environmental conditions in which the polymer is found, such as temperature, oxygen concentrations, pressure, and microbial presence. Seawater degradation is often simplified and measured at ambient conditions (room temperature and pressure), and usually does not take into account other parameters such as diluted microbial and oxygen concentrations (Harrison et al., 2018). For the remainder of this section, we will address the main mechanisms of degradation and present a short overview of current international and local standards for degradation, which guided the analysis for our alternatives.
4.3.1 Degradation Mechanisms Polymer degradation in marine environments can occur through a series of chemical, mechanical, and enzymatic processes. In the marine environment, the rate of hydrolysis will be the dominating factor in polymer degradation and can occur via bulk or surface erosion. Surface erosion is characterized by deterioration of the polymer at the surface while the core polymer remains intact. This is the main mechanism of enzymatic hydrolysis, since microbial enzymes are often too large to enter the polymeric matrix. After the thickness of the polymer reaches a critical point, bulk erosion can occur and the polymer can depolymerize and eventually be converted into biomass or demineralized (Laycock et al., 2017).
Generally, marine degradation will occur through a combination of biotic and abiotic processes and, as a consequence, will depend on environmental conditions such as humidity, temperature, pH, and salinity. These processes will also be affected by intrinsic polymer characteristics, such as crystallinity, porosity, and morphology and must be considered when assessing polymer degradation (Nair et al., 2017).
8
4.3.2 Standards for Marine Degradation There are currently two main standards used in the literature to test polymer degradation. ASTM D6691-09 and ASTM D7473-12. D6691-09 looks at the evolution of CO2 in selected static seawater environments with indigenous microbial culture for 180 days at 30 C. D7473-12 measures degradation via polymer mass loss and visual degradation and is largely considered insufficient for establishing biodegradability on its own (Harrison et al., 2018). A verification “check” has been developed (Vinçotte OK Biodegradable MARINE), based on current and withdrawn ASTM standards for marine degradation, which calls for 90% degradation in seawater environments after 6 months of exposure.
A significant number of marine degradation experiments in the research literature do not usually use these standards, leading to biases that are dependent on the environment in which testing occurs, differences in microbial presence, temperature, and the composition of the material (shape, size, powder vs film). As a consequence, even when partial degradation has been shown, long-term predictions of polymer behavior in unmanaged environments are limited.
4.3.3 Addressing Variable Data In assessing the environmental performance of our alternatives, we focused on experiments that followed at least one of the two standards mentioned previously. We have summarized different parameters used in experimental settings, namely: temperature, duration (time to degradation), the type of sample used, relevant laboratory conditions (e.g. microbial cultures, minerals added, type of incubation), and the method used to measure biodegradation. Abiotic degradation experiments are also included to take into account environments with diluted microbial cultures, which is often the case in marine environments. Good alternatives should show >90% biodegradation within 6 months in seawater environments and some abiotic degradation. However, it is important to note that these parameters are not exhaustive or necessarily representative of conditions in marine environments.
While there have been many attempts at predicting degradation in the laboratory, existing test procedures have not been assessed for their applicability to real and unmanaged marine environments. For example, preselection of microbial culture, excess of nutrients, use of static media, and the use of powders for degradation experiments can all lead to faster biodegradation rates in the laboratory than would be expected in the marine environment (Shah et al., 2007; Wilde, 2012).
4.4 Sorption of Persistent Organic Pollutants In an effort to predict possible environmental outcomes of our alternatives, we have created a assessment approach based on the degradation analysis discussed above, which also takes into account the sorption of Persistent Organic Pollutants (POPs). Together, information in these categories gives us clues about the potential toxicity of our alternatives at macro, micro, and nano scale. Generally, if a material is good at concentrating Persistent Organics (POPs), but has a short lifetime, it can still be a viable option.

9
Assessment Degradation time Sorption of POPs
Low Risk <6 months with some hydrolytic <50 ug/g polymer
Moderate Risk 6 months to 1 year 50 to 300 ug/g polymer
High Risk > 1 year >300 ug/g polymer
Unknown Following extensive review of the literature, no significant evidence could be found
Data Gap As determined in a GreenScreen or by an authoritative body Table 2 shows the classification of degradation and sorption by our current plastics and alternatives
10
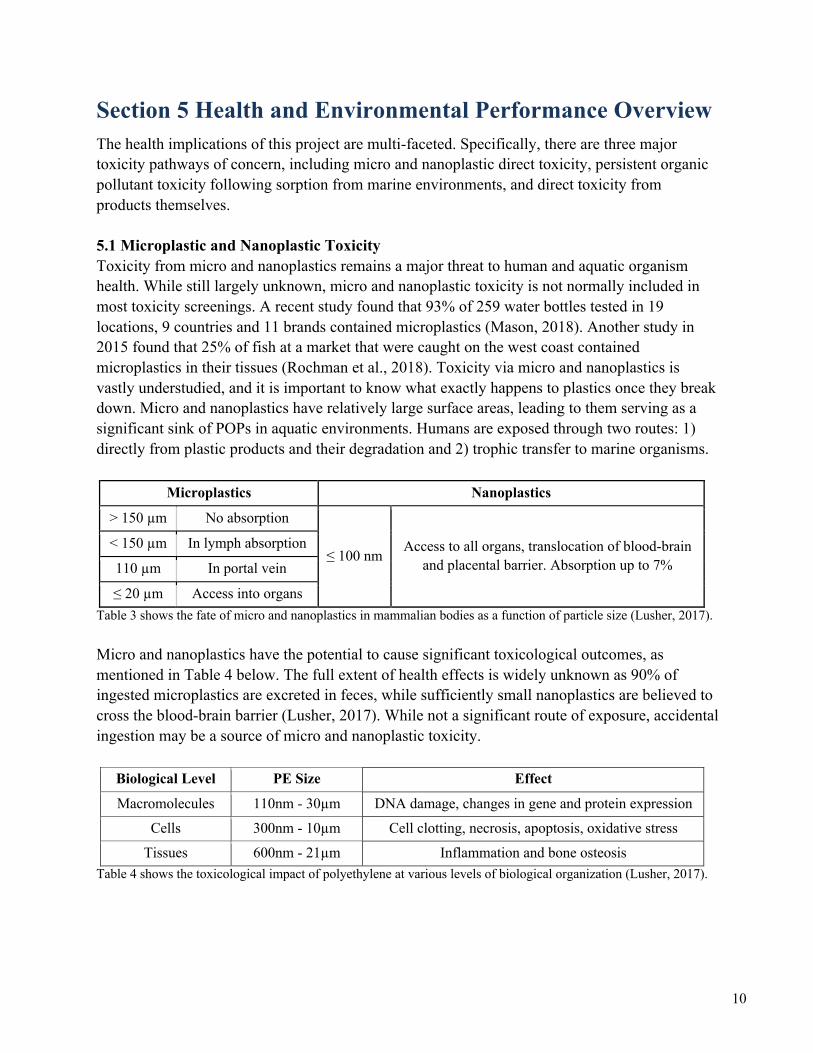
Section 5 Health and Environmental Performance Overview The health implications of this project are multi-faceted. Specifically, there are three major toxicity pathways of concern, including micro and nanoplastic direct toxicity, persistent organic pollutant toxicity following sorption from marine environments, and direct toxicity from products themselves. 5.1 Microplastic and Nanoplastic Toxicity Toxicity from micro and nanoplastics remains a major threat to human and aquatic organism health. While still largely unknown, micro and nanoplastic toxicity is not normally included in most toxicity screenings. A recent study found that 93% of 259 water bottles tested in 19 locations, 9 countries and 11 brands contained microplastics (Mason, 2018). Another study in 2015 found that 25% of fish at a market that were caught on the west coast contained microplastics in their tissues (Rochman et al., 2018). Toxicity via micro and nanoplastics is vastly understudied, and it is important to know what exactly happens to plastics once they break down. Micro and nanoplastics have relatively large surface areas, leading to them serving as a significant sink of POPs in aquatic environments. Humans are exposed through two routes: 1) directly from plastic products and their degradation and 2) trophic transfer to marine organisms.
Microplastics Nanoplastics
> 150 µm No absorption
≤ 100 nm Access to all organs, translocation of blood-brain and placental barrier. Absorption up to 7%
< 150 µm In lymph absorption
110 µm In portal vein
≤ 20 µm Access into organs Table 3 shows the fate of micro and nanoplastics in mammalian bodies as a function of particle size (Lusher, 2017). Micro and nanoplastics have the potential to cause significant toxicological outcomes, as mentioned in Table 4 below. The full extent of health effects is widely unknown as 90% of ingested microplastics are excreted in feces, while sufficiently small nanoplastics are believed to cross the blood-brain barrier (Lusher, 2017). While not a significant route of exposure, accidental ingestion may be a source of micro and nanoplastic toxicity.
Biological Level PE Size Effect
Macromolecules 110nm - 30µm DNA damage, changes in gene and protein expression
Cells 300nm - 10µm Cell clotting, necrosis, apoptosis, oxidative stress
Tissues 600nm - 21µm Inflammation and bone osteosis Table 4 shows the toxicological impact of polyethylene at various levels of biological organization (Lusher, 2017).
11
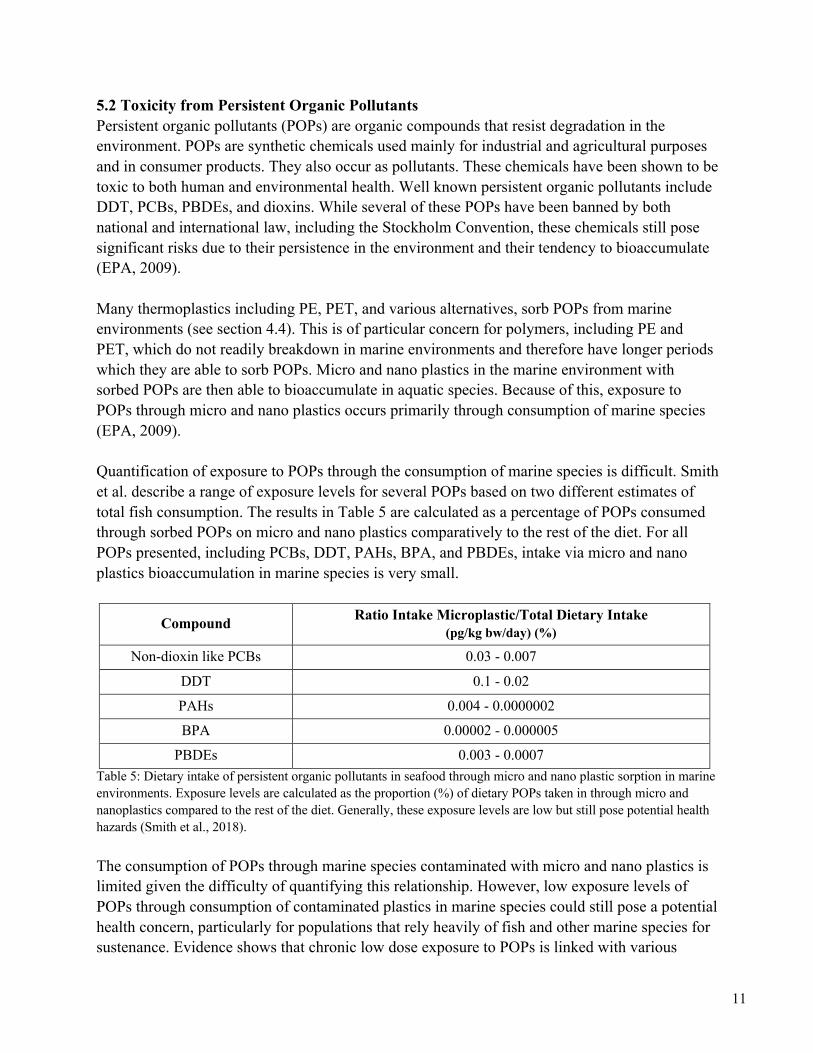
5.2 Toxicity from Persistent Organic Pollutants Persistent organic pollutants (POPs) are organic compounds that resist degradation in the environment. POPs are synthetic chemicals used mainly for industrial and agricultural purposes and in consumer products. They also occur as pollutants. These chemicals have been shown to be toxic to both human and environmental health. Well known persistent organic pollutants include DDT, PCBs, PBDEs, and dioxins. While several of these POPs have been banned by both national and international law, including the Stockholm Convention, these chemicals still pose significant risks due to their persistence in the environment and their tendency to bioaccumulate (EPA, 2009). Many thermoplastics including PE, PET, and various alternatives, sorb POPs from marine environments (see section 4.4). This is of particular concern for polymers, including PE and PET, which do not readily breakdown in marine environments and therefore have longer periods which they are able to sorb POPs. Micro and nano plastics in the marine environment with sorbed POPs are then able to bioaccumulate in aquatic species. Because of this, exposure to POPs through micro and nano plastics occurs primarily through consumption of marine species (EPA, 2009). Quantification of exposure to POPs through the consumption of marine species is difficult. Smith et al. describe a range of exposure levels for several POPs based on two different estimates of total fish consumption. The results in Table 5 are calculated as a percentage of POPs consumed through sorbed POPs on micro and nano plastics comparatively to the rest of the diet. For all POPs presented, including PCBs, DDT, PAHs, BPA, and PBDEs, intake via micro and nano plastics bioaccumulation in marine species is very small.
Compound Ratio Intake Microplastic/Total Dietary Intake (pg/kg bw/day) (%)
Non-dioxin like PCBs 0.03 - 0.007
DDT 0.1 - 0.02
PAHs 0.004 - 0.0000002
BPA 0.00002 - 0.000005
PBDEs 0.003 - 0.0007 Table 5: Dietary intake of persistent organic pollutants in seafood through micro and nano plastic sorption in marine environments. Exposure levels are calculated as the proportion (%) of dietary POPs taken in through micro and nanoplastics compared to the rest of the diet. Generally, these exposure levels are low but still pose potential health hazards (Smith et al., 2018). The consumption of POPs through marine species contaminated with micro and nano plastics is limited given the difficulty of quantifying this relationship. However, low exposure levels of POPs through consumption of contaminated plastics in marine species could still pose a potential health concern, particularly for populations that rely heavily of fish and other marine species for sustenance. Evidence shows that chronic low dose exposure to POPs is linked with various
12
negative health outcomes, including epigenetic alterations such as DNA hypomethylation in humans (Kim et al., 2010), oxidative stress and neurobehavioral alterations in rats (Lahouel et al., 2016), and altered insulin excretion in both humans and rats, which is a risk factor for type II diabetes (Lee et al.). Moreover, there is evidence that POP contaminated micro and nano plastics have significant health consequences such as liver damage in marine species (Rochman et al., 2015). As noted above, the potential for health risks associated with micro and nano plastic-contaminated marine species is related to both the sorption of POPs from the marine environment and the degradation time of the chemical in the environment. Generally, biopolymers have higher sorption of POPs from the marine environment than PE and PET. However, the biopolymers degrade in the environment more quickly and do not persist (Table 2). Therefore, despite higher levels of sorption of POPs from the marine environment, biopolymer alternatives (as well as non-thermoplastics and additive alternatives) likely pose less of a health risk via POP exposure than do PE and PET. 5.3 Direct Toxicity Given that health outcomes related to both micro/nano plastics and persistent organic pollutants in the context of ocean plastics is difficult to quantify and minimally defined in the literature, our assessment of health impacts focuses on direct toxicity from exposure to chemicals in packaging through product use. 5.3.1 Exposure to compounds in products Exposure to chemicals in packaging materials occurs through leaching, as chemical components of packaging material are released into a liquid medium (Vanderbilt, 2018). Plastics made from PE and PET have been shown to leach various compounds into water, including parent compounds (PE and PET), breakdown products (ethylene, phthalic acid, terephthalic acid, and ethylene glycol), and additives (antimony, formaldehyde and acetaldehyde). Exposure to these compounds is significantly higher in water bottled in PE/PET plastics compared to water bottled in other types of containers, such as glass. For example, levels of phthalic acid have been found to be up to 20 times higher in PET bottled water compared to glass containers (Montuori et al., 2008). Increased temperature, carbon dioxide content, and sunlight, for example, increase the mobilization of antimony, acetaldehyde, and formaldehyde from PE and PET bottles into the liquid. (Bach 2013, Bach, 2014) Studies have indicated that water stored in PE/PET plastics has genotoxic and endocrine disrupting effects (Ceretti et al. 2010, Sax, 2010). A further, in depth review of health outcomes related to exposure to PE, PET and alternative chemicals will be presented below. Exposure to leached compounds in the biopolymer alternatives, non-thermoplastic alternatives, and alternative additives is less well understood. However, for the purposes of this report we make the conservative assumption that chemical leaching from our alternative packaging materials would be at least as high as chemical leaching from PE and PET packaging. Given that
13
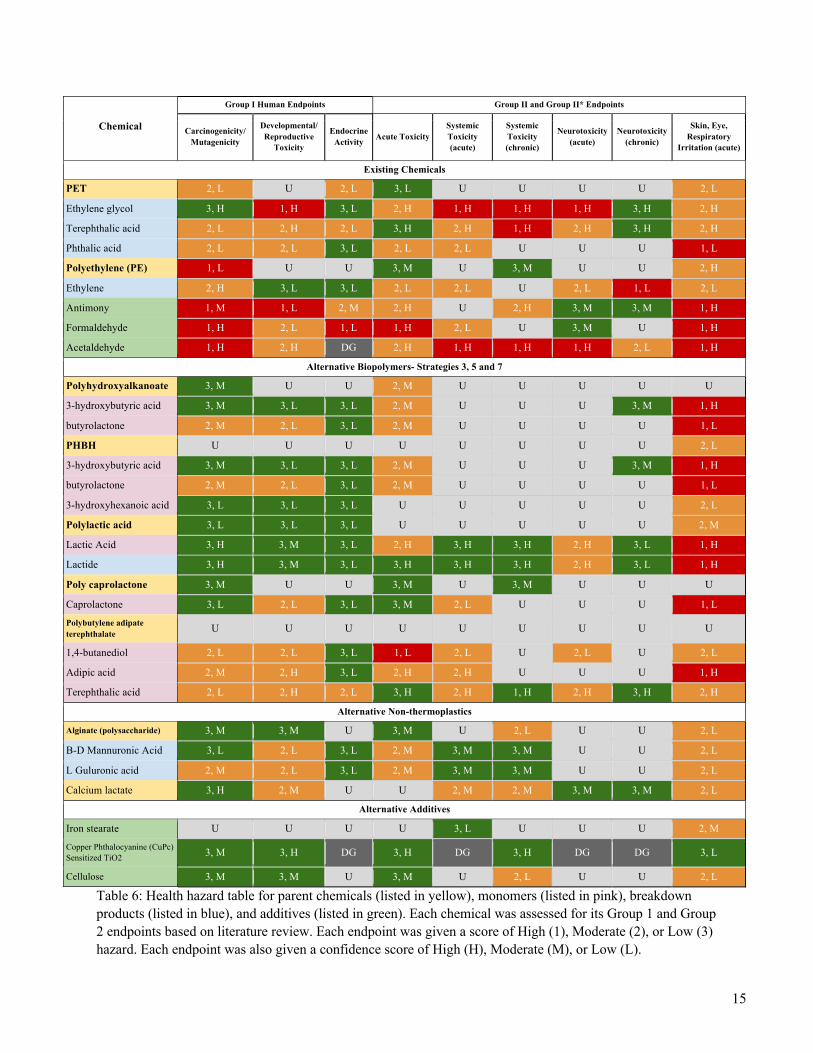
Method products are primarily cleaning supplies, such as hand soaps, the primary route of exposure is through dermal contact. However, there is the potential for inadvertent ingestion of products. The studies that support the health conclusions presented below are based on various routes of exposure, including ingestion, inhalation, dermal, and intraperitoneal injection. Given that dermal exposure generally produces the lowest dose in the body, using other routes of exposure to assess health outcomes is also conservative. 5.3.2 Health Endpoints The health endpoints assessed for direct toxicity, and those that are reflected in the Overall Hazard Scores below, include Group 1 and Group 2 endpoints as defined by the Green Screen for Safer Chemicals (Chemicals, G.F.S GreenScreen for Safer Chemicals). Group 1 endpoints are those that are chronic and/or life threatening, potentially induced at low doses, and have the potential for transgenerational effects. These endpoints include carcinogenicity/mutagenicity, developmental/reproductive toxicity, and endocrine disruption. Group 2 endpoints are those that can typically be mitigated and/or prevented. These endpoints include acute toxicity, acute systemic toxicity, chronic systemic toxicity, acute neurotoxicity, chronic neurotoxicity, and skin/eye/respiratory irritation. Please see Appendix I for specific definitions of each endpoint. (DataCommons) 5.3.3 Methods of Health Evaluation The overall health evaluation of existing and alternative chemicals is based on the human health endpoints discussed previously for parent chemicals, relevant monomers, and relevant breakdown products. We conducted preliminary evaluation of hazards to complete the health hazard table (Table 6). Each parent chemical, monomer, breakdown product and three PE and PET additives were evaluated. Each chemical listed in the health hazard table was evaluated based on its Group 1 and Group 2 endpoints. Assessment for each endpoint followed the following general process:
1. Review of GreenScreen, DataCommons and/or other authoritative lists 2. Literature review 3. Toxicity modeling for monomers and breakdown products
This process was used to establish a toxicity score for each endpoint for each chemical listed in the health hazard table. Each endpoint was designated a score of High (1), Moderate (2), or Low (3). If a chemical was listed in an authoritative list (as detailed in DataCommons), it took on the hazard score denoted by the list. An endpoint was designated as an Unknown if no studies could be found for an endpoint for a chemical. An endpoint was only designated as a Data Gap if DataCommons listed the endpoint as a Data Gap (which is determined by a GreenScreen Assessment). Any chemical that was not listed in an authoritative list, as detailed in DataCommons, underwent a thorough literature review. Chemicals were designated as High risk (1) if they had 2 or more
14
studies showing negative outcomes for the endpoint in the literature, Moderate risk (2) if they had 1 study showing negative outcomes for the endpoint in the literature, and Low risk (3) if they had no positive studies in the literature. We conducted primary literature searches using keywords related to the chemical and endpoint on several databases, including PubMed, Scopus, and Google Scholar. Further literature searches were conducted using a new tool on DataCommons that links to PubMed search results for specific endpoints relevant to each chemical. We evaluated monomers and breakdown products that were missing data for specific endpoints using the toxicity modeling software VEGA. The VEGA platform accesses several quantitative-structure activity relationship (QSAR) models that provides predictions on various endpoints for the chemical. QSAR models predict the toxicity for health endpoints based on the chemical’s structure. In addition to the hazard score, we assigned each chemical a confidence rating. The confidence rating reflects both the weight of the evidence and the source of the evidence. We developed a decision tree for assigning a confidence score to the data for each endpoint (Figure 1). Confidence levels were denoted as High (H), Moderate (M) or Low (L). As with the hazard score, a chemical listed in an authoritative list under DataCommons or GreenScreen was designated the confidence listed in DataCommons or GreenScreen. For endpoints that required literature searches, a High confidence level was designated to endpoints with 2+ positive studies, a Moderate confidence level was designated for endpoints with less than 2 positive studies, and a Low confidence level was designated for endpoints that were predicted using modeling on the VEGA software. Endpoints that were predicted using modeling on the VEGA software and with a positive study (assuming consistent evidence between the predicted outcomes and study outcomes) were given a Moderate confidence level.
15
Chemical
Group I Human Endpoints Group II and Group II* Endpoints
Carcinogenicity/ Mutagenicity
Developmental/ Reproductive
Toxicity
Endocrine Activity Acute Toxicity
Systemic Toxicity (acute)
Systemic Toxicity (chronic)
Neurotoxicity (acute)
Neurotoxicity (chronic)
Skin, Eye, Respiratory
Irritation (acute)
Existing Chemicals
PET 2, L U 2, L 3, L U U U U 2, L
Ethylene glycol 3, H 1, H 3, L 2, H 1, H 1, H 1, H 3, H 2, H
Terephthalic acid 2, L 2, H 2, L 3, H 2, H 1, H 2, H 3, H 2, H
Phthalic acid 2, L 2, L 3, L 2, L 2, L U U U 1, L
Polyethylene (PE) 1, L U U 3, M U 3, M U U 2, H
Ethylene 2, H 3, L 3, L 2, L 2, L U 2, L 1, L 2, L
Antimony 1, M 1, L 2, M 2, H U 2, H 3, M 3, M 1, H
Formaldehyde 1, H 2, L 1, L 1, H 2, L U 3, M U 1, H
Acetaldehyde 1, H 2, H DG 2, H 1, H 1, H 1, H 2, L 1, H
Alternative Biopolymers- Strategies 3, 5 and 7
Polyhydroxyalkanoate 3, M U U 2, M U U U U U
3-hydroxybutyric acid 3, M 3, L 3, L 2, M U U U 3, M 1, H
butyrolactone 2, M 2, L 3, L 2, M U U U U 1, L
PHBH U U U U U U U U 2, L
3-hydroxybutyric acid 3, M 3, L 3, L 2, M U U U 3, M 1, H
butyrolactone 2, M 2, L 3, L 2, M U U U U 1, L
3-hydroxyhexanoic acid 3, L 3, L 3, L U U U U U 2, L
Polylactic acid 3, L 3, L 3, L U U U U U 2, M
Lactic Acid 3, H 3, M 3, L 2, H 3, H 3, H 2, H 3, L 1, H
Lactide 3, H 3, M 3, L 3, H 3, H 3, H 2, H 3, L 1, H
Poly caprolactone 3, M U U 3, M U 3, M U U U
Caprolactone 3, L 2, L 3, L 3, M 2, L U U U 1, L
Polybutylene adipate terephthalate U U U U U U U U U
1,4-butanediol 2, L 2, L 3, L 1, L 2, L U 2, L U 2, L
Adipic acid 2, M 2, H 3, L 2, H 2, H U U U 1, H
Terephthalic acid 2, L 2, H 2, L 3, H 2, H 1, H 2, H 3, H 2, H
Alternative Non-thermoplastics
Alginate (polysaccharide) 3, M 3, M U 3, M U 2, L U U 2, L
B-D Mannuronic Acid 3, L 2, L 3, L 2, M 3, M 3, M U U 2, L
L Guluronic acid 2, M 2, L 3, L 2, M 3, M 3, M U U 2, L
Calcium lactate 3, H 2, M U U 2, M 2, M 3, M 3, M 2, L
Alternative Additives
Iron stearate U U U U 3, L U U U 2, M
Copper Phthalocyanine (CuPc) Sensitized TiO2 3, M 3, H DG 3, H DG 3, H DG DG 3, L
Cellulose 3, M 3, M U 3, M U 2, L U U 2, L
Table 6: Health hazard table for parent chemicals (listed in yellow), monomers (listed in pink), breakdown products (listed in blue), and additives (listed in green). Each chemical was assessed for its Group 1 and Group 2 endpoints based on literature review. Each endpoint was given a score of High (1), Moderate (2), or Low (3) hazard. Each endpoint was also given a confidence score of High (H), Moderate (M), or Low (L).
16
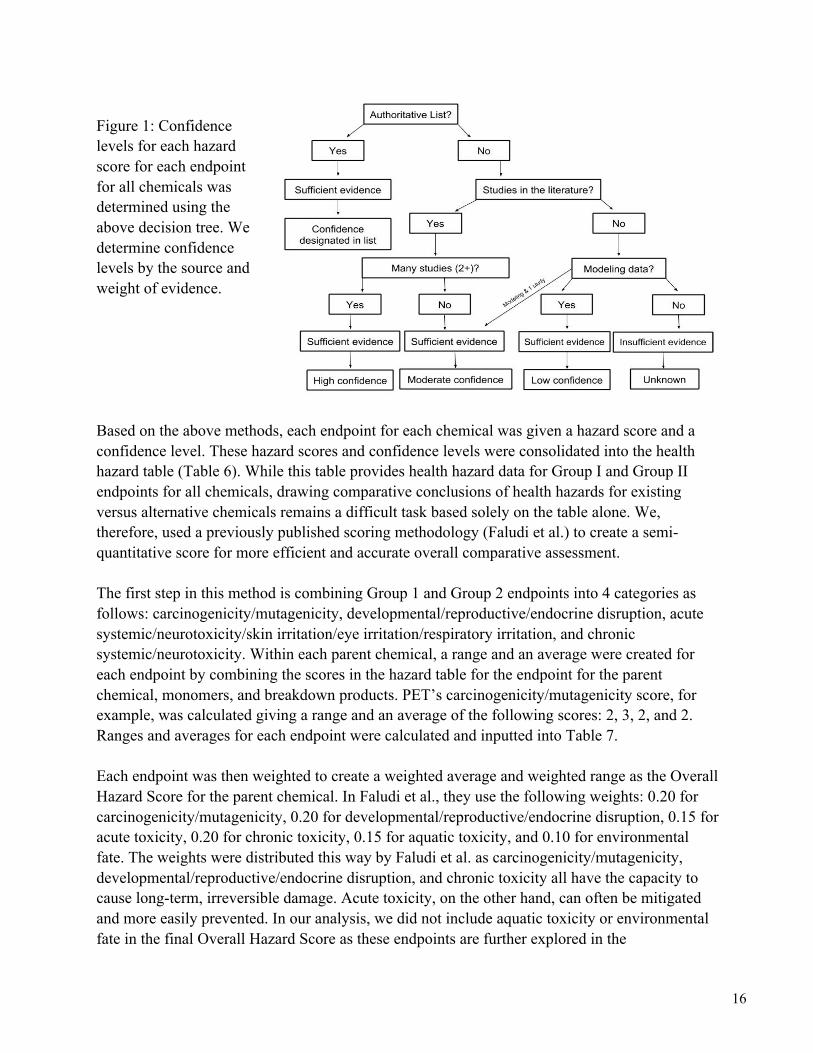
Figure 1: Confidence levels for each hazard score for each endpoint for all chemicals was determined using the above decision tree. We determine confidence levels by the source and weight of evidence. Based on the above methods, each endpoint for each chemical was given a hazard score and a confidence level. These hazard scores and confidence levels were consolidated into the health hazard table (Table 6). While this table provides health hazard data for Group I and Group II endpoints for all chemicals, drawing comparative conclusions of health hazards for existing versus alternative chemicals remains a difficult task based solely on the table alone. We, therefore, used a previously published scoring methodology (Faludi et al.) to create a semi-quantitative score for more efficient and accurate overall comparative assessment. The first step in this method is combining Group 1 and Group 2 endpoints into 4 categories as follows: carcinogenicity/mutagenicity, developmental/reproductive/endocrine disruption, acute systemic/neurotoxicity/skin irritation/eye irritation/respiratory irritation, and chronic systemic/neurotoxicity. Within each parent chemical, a range and an average were created for each endpoint by combining the scores in the hazard table for the endpoint for the parent chemical, monomers, and breakdown products. PET’s carcinogenicity/mutagenicity score, for example, was calculated giving a range and an average of the following scores: 2, 3, 2, and 2. Ranges and averages for each endpoint were calculated and inputted into Table 7. Each endpoint was then weighted to create a weighted average and weighted range as the Overall Hazard Score for the parent chemical. In Faludi et al., they use the following weights: 0.20 for carcinogenicity/mutagenicity, 0.20 for developmental/reproductive/endocrine disruption, 0.15 for acute toxicity, 0.20 for chronic toxicity, 0.15 for aquatic toxicity, and 0.10 for environmental fate. The weights were distributed this way by Faludi et al. as carcinogenicity/mutagenicity, developmental/reproductive/endocrine disruption, and chronic toxicity all have the capacity to cause long-term, irreversible damage. Acute toxicity, on the other hand, can often be mitigated and more easily prevented. In our analysis, we did not include aquatic toxicity or environmental fate in the final Overall Hazard Score as these endpoints are further explored in the
17
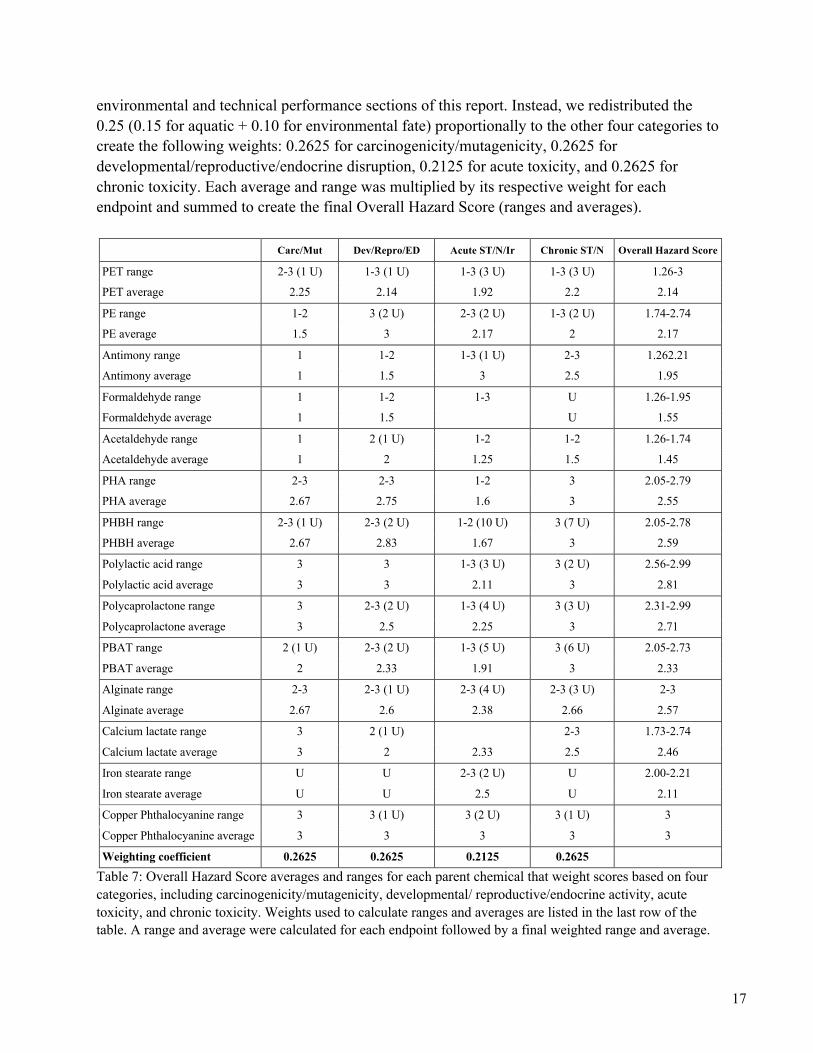
environmental and technical performance sections of this report. Instead, we redistributed the 0.25 (0.15 for aquatic + 0.10 for environmental fate) proportionally to the other four categories to create the following weights: 0.2625 for carcinogenicity/mutagenicity, 0.2625 for developmental/reproductive/endocrine disruption, 0.2125 for acute toxicity, and 0.2625 for chronic toxicity. Each average and range was multiplied by its respective weight for each endpoint and summed to create the final Overall Hazard Score (ranges and averages). Carc/Mut Dev/Repro/ED Acute ST/N/Ir Chronic ST/N Overall Hazard Score
PET range 2-3 (1 U) 1-3 (1 U) 1-3 (3 U) 1-3 (3 U) 1.26-3
PET average 2.25 2.14 1.92 2.2 2.14
PE range 1-2 3 (2 U) 2-3 (2 U) 1-3 (2 U) 1.74-2.74
PE average 1.5 3 2.17 2 2.17
Antimony range 1 1-2 1-3 (1 U) 2-3 1.262.21
Antimony average 1 1.5 3 2.5 1.95
Formaldehyde range 1 1-2 1-3 U 1.26-1.95
Formaldehyde average 1 1.5 U 1.55
Acetaldehyde range 1 2 (1 U) 1-2 1-2 1.26-1.74
Acetaldehyde average 1 2 1.25 1.5 1.45
PHA range 2-3 2-3 1-2 3 2.05-2.79
PHA average 2.67 2.75 1.6 3 2.55
PHBH range 2-3 (1 U) 2-3 (2 U) 1-2 (10 U) 3 (7 U) 2.05-2.78
PHBH average 2.67 2.83 1.67 3 2.59
Polylactic acid range 3 3 1-3 (3 U) 3 (2 U) 2.56-2.99
Polylactic acid average 3 3 2.11 3 2.81
Polycaprolactone range 3 2-3 (2 U) 1-3 (4 U) 3 (3 U) 2.31-2.99
Polycaprolactone average 3 2.5 2.25 3 2.71
PBAT range 2 (1 U) 2-3 (2 U) 1-3 (5 U) 3 (6 U) 2.05-2.73
PBAT average 2 2.33 1.91 3 2.33
Alginate range 2-3 2-3 (1 U) 2-3 (4 U) 2-3 (3 U) 2-3
Alginate average 2.67 2.6 2.38 2.66 2.57
Calcium lactate range 3 2 (1 U) 2-3 1.73-2.74
Calcium lactate average 3 2 2.33 2.5 2.46
Iron stearate range U U 2-3 (2 U) U 2.00-2.21
Iron stearate average U U 2.5 U 2.11
Copper Phthalocyanine range 3 3 (1 U) 3 (2 U) 3 (1 U) 3
Copper Phthalocyanine average 3 3 3 3 3
Weighting coefficient 0.2625 0.2625 0.2125 0.2625
Table 7: Overall Hazard Score averages and ranges for each parent chemical that weight scores based on four categories, including carcinogenicity/mutagenicity, developmental/ reproductive/endocrine activity, acute toxicity, and chronic toxicity. Weights used to calculate ranges and averages are listed in the last row of the table. A range and average were calculated for each endpoint followed by a final weighted range and average.
18
Using the Faludi et al. method creates easier to interpret Overall Hazard Scores that are based on the parent chemical and all of the relevant monomers and breakdown products, as well as all of the Group 1 and Group 2 health endpoints. However, this method has several assumptions and limitations. Namely, this scoring method is inherently reliant on the availability of data for each parent chemical, monomer, and breakdown product. Therefore, the averages and ranges are impacted by the current research and the completeness and success of the literature search. The score relies on the number of monomers/breakdown products included for each parent chemical in the parent chemical evaluations. Variations in the number of monomers/breakdown products per chemical could potentially alter the weighted range and weighted average. Furthermore, this method assumes that exposure to the monomers/breakdown products is as significant as the parent compound in the calculation as each score within an endpoint for a parent compound vs. a monomer/breakdown product is weighted equally. This assumption may or may not hold true, and it is difficult to assess based on the limited literature. The results of this method also rely on the assumptions made to create each weight. I.e., that each endpoint should have their designated weighted coefficients. Our adoption of this method borrowed on the reasoning that Faludi et al. explained for each weight (discussed above). Faludi et al.’s reasoning to give carcinogenicity/mutagenicity, developmental/reproductive/ endocrine disruption, and acute toxicity higher weights is a valid choice, however, it remains an assumption that, depending on redistribution of weights, could impact Overall Hazard Scores. Lastly, the scores are highly impacted by the absence of data. Data gaps can lead to average and ranges that are potentially skewed. Moreover, in some cases, there were too many data gaps to create a range or an average for a certain endpoint (see iron stearate in Table 6). In this case, Table 6 has a “U” under that endpoint. In order to still calculate a weighted Overall Score range and average, we had to choose a value for these unknowns. We chose a median value of 2 (Moderate risk) for every endpoint with an unknown in Table 6. Choosing a value of 1 (High risk) would produce more conservative results. However, the majority of the data gaps exist for alternative chemicals. Therefore, using a value of 1 would systematically bias the alternative scores towards a higher hazard score when, given the available data, we expect the alternatives to be less hazardous than the parent chemicals. Therefore, we made the assumption that a value of 2 would more closely represent the actual hazards for these chemicals while still providing a conservative hazard estimate. Final Overall Hazard Score ranges and averages are listed for each chemical in Table 8.
19
Chemical Overall Hazard Score Range Overall Score Average
Existing Chemicals & Additives
PET 1.26-3 2.14
PE 1.74-2.74 2.17
Antimony 1.26-2.21 1.95
Formaldehyde 1.26-1.95 1.55
Acetaldehyde 1.26-1.74 1.45
Biopolymer Alternatives
PHA 2.05-2.79 2.55
PHBH 2.05-2.78 2.59
PLA 2.56-2.99 2.81
PCL 2.31-2.99 2.71
PBAT 2.05-2.73 2.33
Non-thermoplastic Alternatives
Alginate 2.00-3.00 2.57
Calcium lactate 1.73-2.74 2.46
Alternative Additives
Iron stearate 2.00-2.21 2.11
Copper Phthalocyanine 3 3
Cellulose 2.00-3.00 2.57
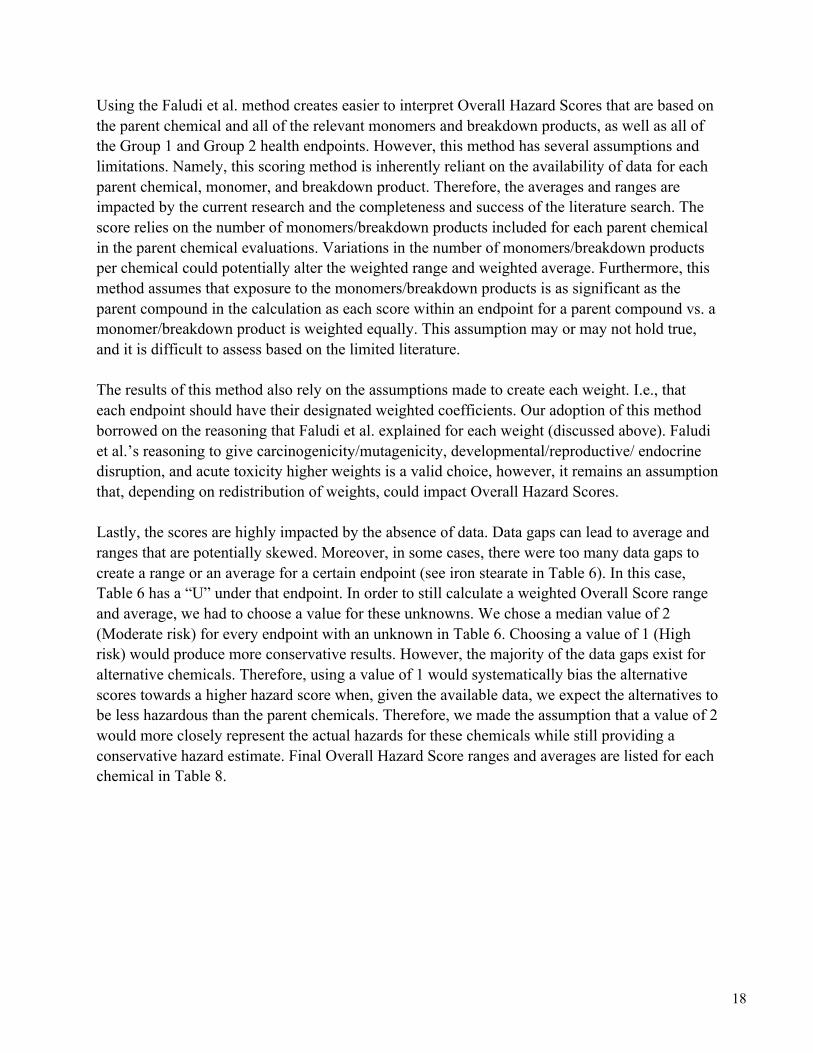
Table 8: Final Overall Health Hazard averages and ranges for all parent chemicals and additives.
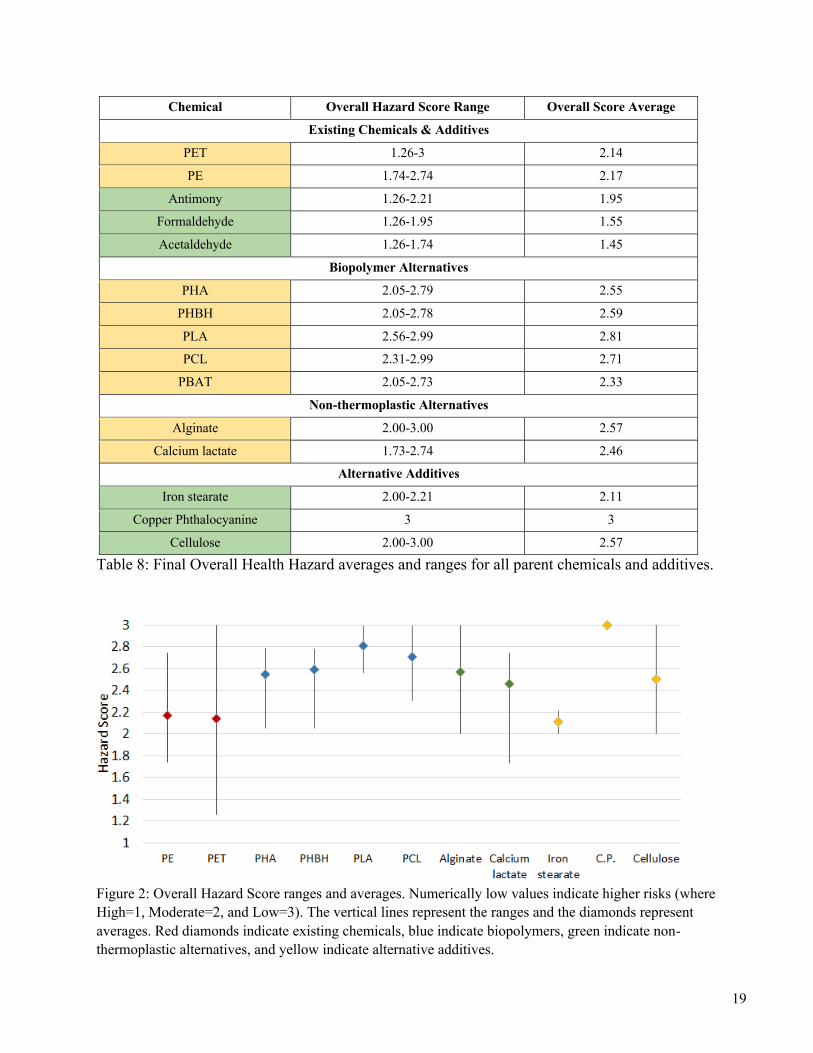
Figure 2: Overall Hazard Score ranges and averages. Numerically low values indicate higher risks (where High=1, Moderate=2, and Low=3). The vertical lines represent the ranges and the diamonds represent averages. Red diamonds indicate existing chemicals, blue indicate biopolymers, green indicate non-thermoplastic alternatives, and yellow indicate alternative additives.
20
Finally, we created graphical representations of the hazard ranges and scores for each chemical (Figure 2). Note that lower numerical values indicate a higher hazard (where 1=High risk, 2=Moderate risk) and 3=Low risk). Overall, all alternatives, except for iron stearate, have higher hazard score than PE and PET indicated a lower direct toxicity. These hazard scores will be discussed more in depth in conjunction with each individual strategy below.
21
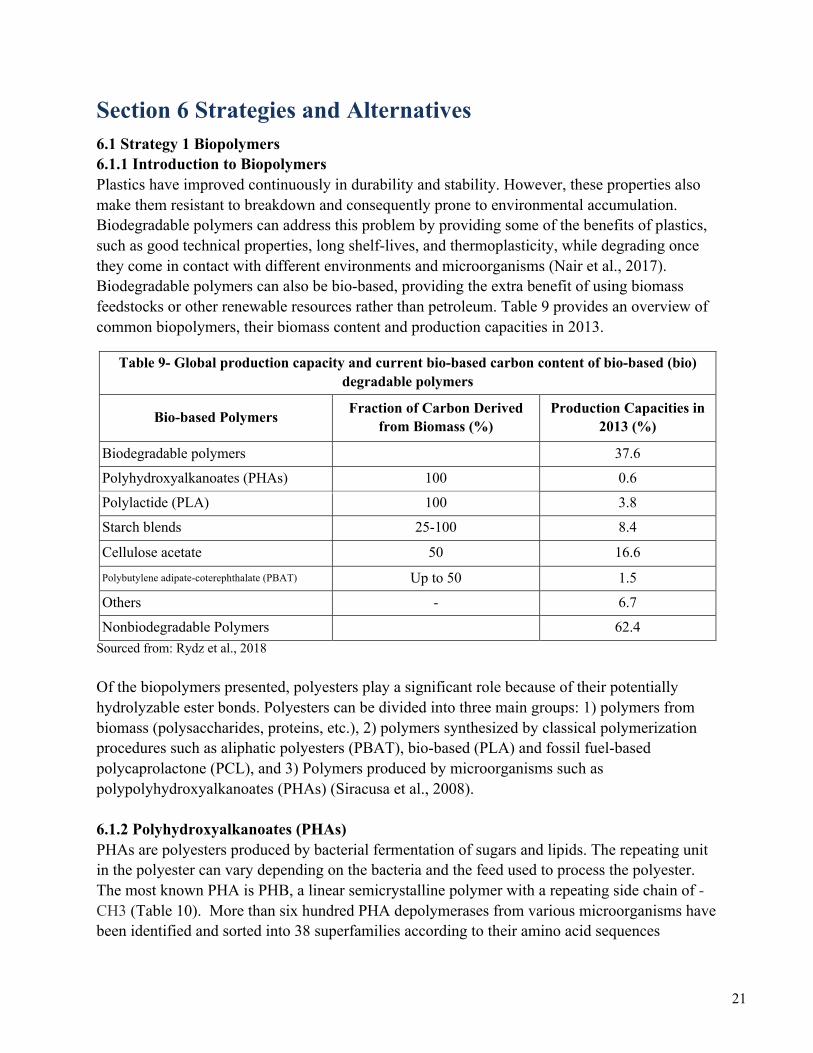
Section 6 Strategies and Alternatives 6.1 Strategy 1 Biopolymers 6.1.1 Introduction to Biopolymers Plastics have improved continuously in durability and stability. However, these properties also make them resistant to breakdown and consequently prone to environmental accumulation. Biodegradable polymers can address this problem by providing some of the benefits of plastics, such as good technical properties, long shelf-lives, and thermoplasticity, while degrading once they come in contact with different environments and microorganisms (Nair et al., 2017). Biodegradable polymers can also be bio-based, providing the extra benefit of using biomass feedstocks or other renewable resources rather than petroleum. Table 9 provides an overview of common biopolymers, their biomass content and production capacities in 2013.
Table 9- Global production capacity and current bio-based carbon content of bio-based (bio) degradable polymers
Bio-based Polymers Fraction of Carbon Derived from Biomass (%)
Production Capacities in 2013 (%)
Biodegradable polymers 37.6
Polyhydroxyalkanoates (PHAs) 100 0.6
Polylactide (PLA) 100 3.8
Starch blends 25-100 8.4
Cellulose acetate 50 16.6 Polybutylene adipate-coterephthalate (PBAT) Up to 50 1.5
Others - 6.7
Nonbiodegradable Polymers 62.4 Sourced from: Rydz et al., 2018 Of the biopolymers presented, polyesters play a significant role because of their potentially hydrolyzable ester bonds. Polyesters can be divided into three main groups: 1) polymers from biomass (polysaccharides, proteins, etc.), 2) polymers synthesized by classical polymerization procedures such as aliphatic polyesters (PBAT), bio-based (PLA) and fossil fuel-based polycaprolactone (PCL), and 3) Polymers produced by microorganisms such as polypolyhydroxyalkanoates (PHAs) (Siracusa et al., 2008). 6.1.2 Polyhydroxyalkanoates (PHAs) PHAs are polyesters produced by bacterial fermentation of sugars and lipids. The repeating unit in the polyester can vary depending on the bacteria and the feed used to process the polyester. The most known PHA is PHB, a linear semicrystalline polymer with a repeating side chain of -CH3 (Table 10). More than six hundred PHA depolymerases from various microorganisms have been identified and sorted into 38 superfamilies according to their amino acid sequences
22
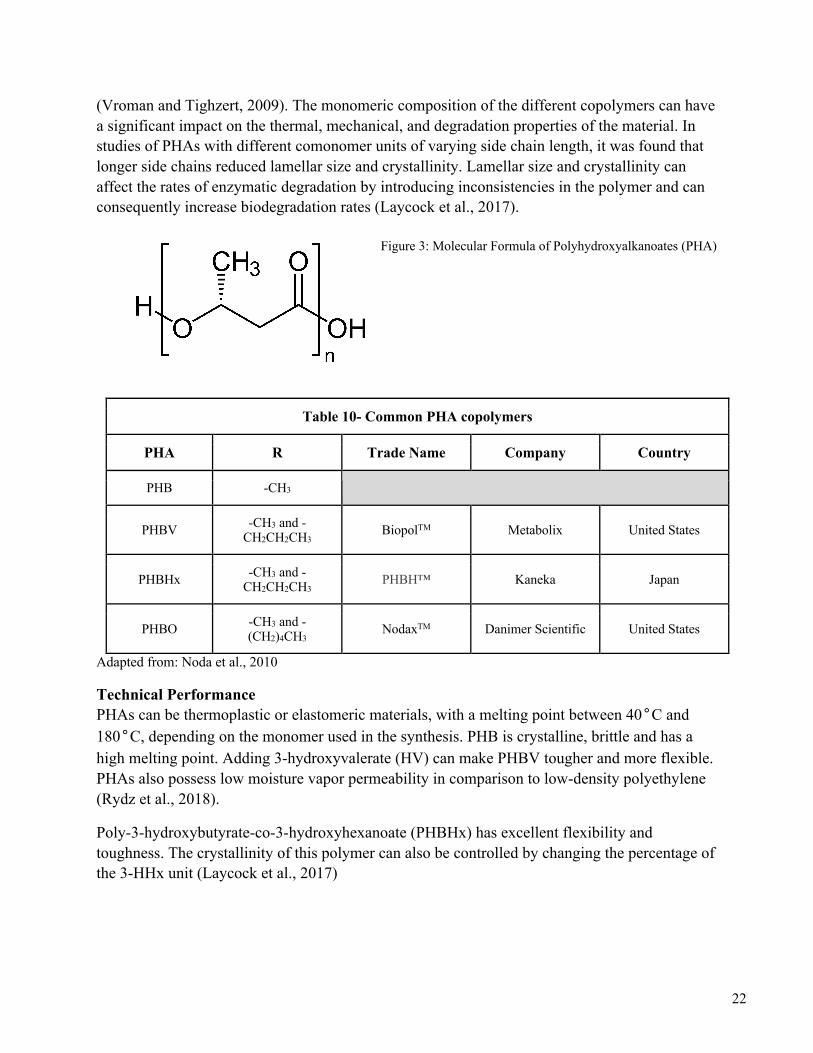
(Vroman and Tighzert, 2009). The monomeric composition of the different copolymers can have a significant impact on the thermal, mechanical, and degradation properties of the material. In studies of PHAs with different comonomer units of varying side chain length, it was found that longer side chains reduced lamellar size and crystallinity. Lamellar size and crystallinity can affect the rates of enzymatic degradation by introducing inconsistencies in the polymer and can consequently increase biodegradation rates (Laycock et al., 2017).
Figure 3: Molecular Formula of Polyhydroxyalkanoates (PHA)
Table 10- Common PHA copolymers
PHA R Trade Name Company Country
PHB -CH3
PHBV -CH3 and -CH2CH2CH3 BiopolTM Metabolix United States
PHBHx -CH3 and -CH2CH2CH3 PHBH™ Kaneka Japan
PHBO -CH3 and -(CH2)4CH3 NodaxTM Danimer Scientific United States
Adapted from: Noda et al., 2010
Technical Performance PHAs can be thermoplastic or elastomeric materials, with a melting point between 40°C and 180°C, depending on the monomer used in the synthesis. PHB is crystalline, brittle and has a high melting point. Adding 3-hydroxyvalerate (HV) can make PHBV tougher and more flexible. PHAs also possess low moisture vapor permeability in comparison to low-density polyethylene (Rydz et al., 2018).
Poly-3-hydroxybutyrate-co-3-hydroxyhexanoate (PHBHx) has excellent flexibility and toughness. The crystallinity of this polymer can also be controlled by changing the percentage of the 3-HHx unit (Laycock et al., 2017)
23
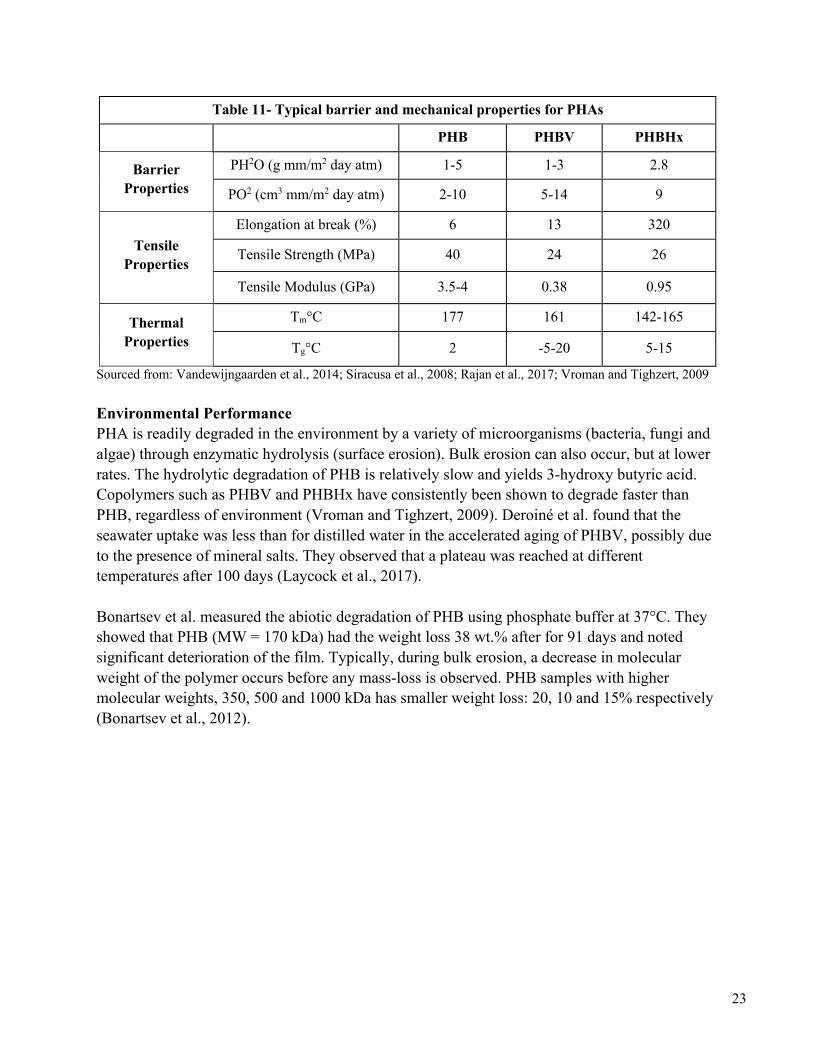
Table 11- Typical barrier and mechanical properties for PHAs
PHB PHBV PHBHx
Barrier Properties
PH2O (g mm/m2 day atm) 1-5 1-3 2.8
PO2 (cm3 mm/m2 day atm) 2-10 5-14 9
Tensile Properties
Elongation at break (%) 6 13 320
Tensile Strength (MPa) 40 24 26
Tensile Modulus (GPa) 3.5-4 0.38 0.95
Thermal Properties
Tm°C 177 161 142-165
Tg°C 2 -5-20 5-15
Sourced from: Vandewijngaarden et al., 2014; Siracusa et al., 2008; Rajan et al., 2017; Vroman and Tighzert, 2009 Environmental Performance PHA is readily degraded in the environment by a variety of microorganisms (bacteria, fungi and algae) through enzymatic hydrolysis (surface erosion). Bulk erosion can also occur, but at lower rates. The hydrolytic degradation of PHB is relatively slow and yields 3-hydroxy butyric acid. Copolymers such as PHBV and PHBHx have consistently been shown to degrade faster than PHB, regardless of environment (Vroman and Tighzert, 2009). Deroiné et al. found that the seawater uptake was less than for distilled water in the accelerated aging of PHBV, possibly due to the presence of mineral salts. They observed that a plateau was reached at different temperatures after 100 days (Laycock et al., 2017). Bonartsev et al. measured the abiotic degradation of PHB using phosphate buffer at 37°C. They showed that PHB (MW = 170 kDa) had the weight loss 38 wt.% after for 91 days and noted significant deterioration of the film. Typically, during bulk erosion, a decrease in molecular weight of the polymer occurs before any mass-loss is observed. PHB samples with higher molecular weights, 350, 500 and 1000 kDa has smaller weight loss: 20, 10 and 15% respectively (Bonartsev et al., 2012).
24
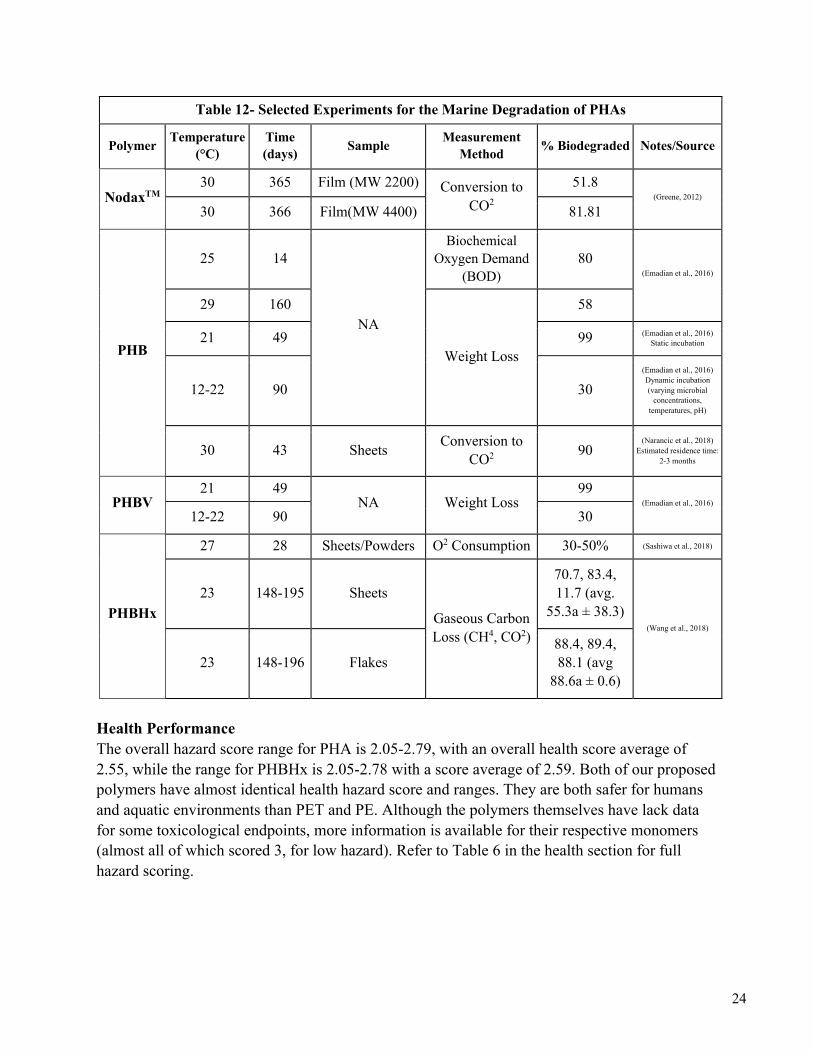
Table 12- Selected Experiments for the Marine Degradation of PHAs
Polymer Temperature (°C)
Time (days) Sample Measurement
Method % Biodegraded Notes/Source
NodaxTM 30 365 Film (MW 2200) Conversion to
CO2 51.8
(Greene, 2012)
30 366 Film(MW 4400) 81.81
PHB
25 14
NA
Biochemical Oxygen Demand
(BOD) 80
(Emadian et al., 2016)
29 160
Weight Loss
58
21 49 99 (Emadian et al., 2016) Static incubation
12-22 90 30 (Emadian et al., 2016) Dynamic incubation (varying microbial
concentrations, temperatures, pH)
30 43 Sheets Conversion to
CO2 90
(Narancic et al., 2018) Estimated residence time:
2-3 months
PHBV 21 49
NA Weight Loss 99
(Emadian et al., 2016)
12-22 90 30
PHBHx
27 28 Sheets/Powders O2 Consumption 30-50% (Sashiwa et al., 2018)
23 148-195 Sheets
Gaseous Carbon Loss (CH4, CO2)
70.7, 83.4, 11.7 (avg.
55.3a ± 38.3) (Wang et al., 2018)
23 148-196 Flakes 88.4, 89.4, 88.1 (avg
88.6a ± 0.6)
Health Performance The overall hazard score range for PHA is 2.05-2.79, with an overall health score average of 2.55, while the range for PHBHx is 2.05-2.78 with a score average of 2.59. Both of our proposed polymers have almost identical health hazard score and ranges. They are both safer for humans and aquatic environments than PET and PE. Although the polymers themselves have lack data for some toxicological endpoints, more information is available for their respective monomers (almost all of which scored 3, for low hazard). Refer to Table 6 in the health section for full hazard scoring.
25
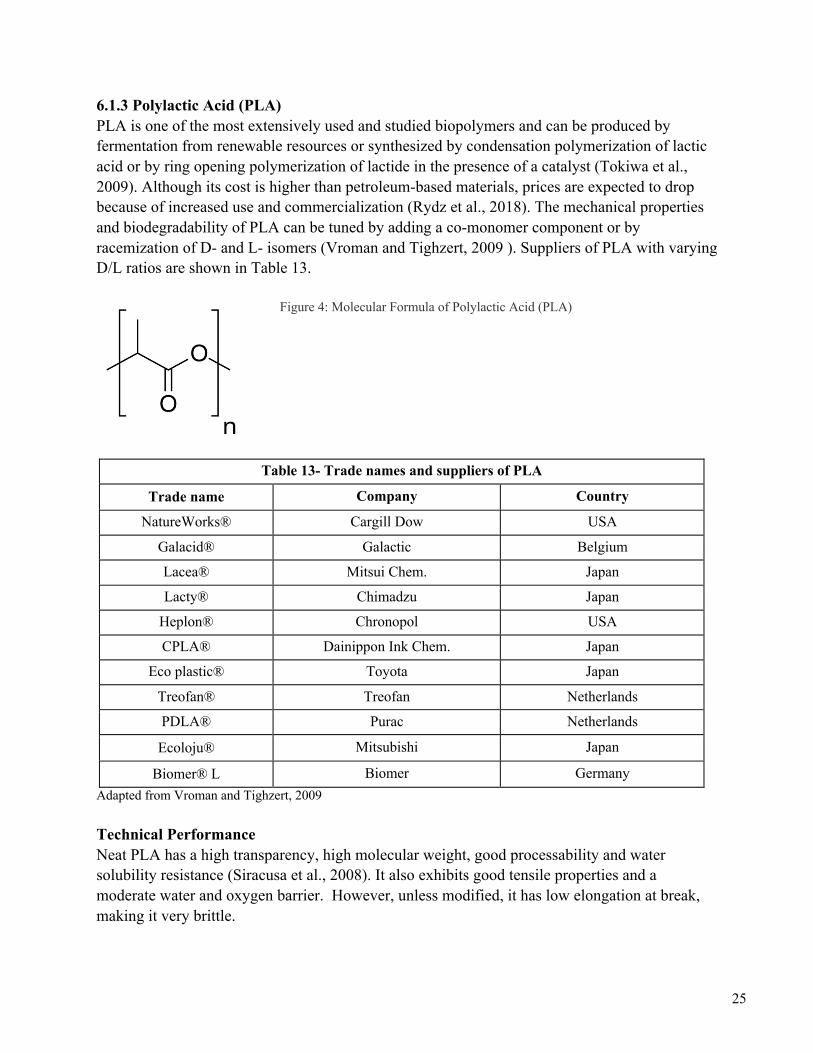
6.1.3 Polylactic Acid (PLA) PLA is one of the most extensively used and studied biopolymers and can be produced by fermentation from renewable resources or synthesized by condensation polymerization of lactic acid or by ring opening polymerization of lactide in the presence of a catalyst (Tokiwa et al., 2009). Although its cost is higher than petroleum-based materials, prices are expected to drop because of increased use and commercialization (Rydz et al., 2018). The mechanical properties and biodegradability of PLA can be tuned by adding a co-monomer component or by racemization of D- and L- isomers (Vroman and Tighzert, 2009 ). Suppliers of PLA with varying D/L ratios are shown in Table 13.
Figure 4: Molecular Formula of Polylactic Acid (PLA)
Table 13- Trade names and suppliers of PLA
Trade name Company Country
NatureWorks® Cargill Dow USA
Galacid® Galactic Belgium
Lacea® Mitsui Chem. Japan
Lacty® Chimadzu Japan
Heplon® Chronopol USA
CPLA® Dainippon Ink Chem. Japan
Eco plastic® Toyota Japan
Treofan® Treofan Netherlands
PDLA® Purac Netherlands
Ecoloju® Mitsubishi Japan
Biomer® L Biomer Germany Adapted from Vroman and Tighzert, 2009 Technical Performance Neat PLA has a high transparency, high molecular weight, good processability and water solubility resistance (Siracusa et al., 2008). It also exhibits good tensile properties and a moderate water and oxygen barrier. However, unless modified, it has low elongation at break, making it very brittle.
26
Table 14- Typical barrier and mechanical properties for PLA
PLA
Barrier Properties PH2O (g mm/m2 day atm) 5-7, (23°C 85 % RH)
PO2 (cm3 mm/m2 day atm) 3.5-15 (23°C 50 % or 0% RH)
Tensile Properties
Elongation at break (%) 2.4-5.2
Tensile Strength (MPa) 49.6–61.6
Tensile Modulus (GPa) 0.35–3.5
Thermal Properties TmC 130-180
Tg°C 45-60
Sourced from: Vandewijngaarden et al., 2014; Avérous and Pollet, 2012); Farah et al., 2016 Environmental Performance PLA is degradable in industrial composting conditions at temperatures exceeding 50 C through abiotic hydrolysis (Lambert and Wagner, 2017). However, hydrolysis through PLA backbone ester groups is slow in ambient conditions and can take several years.
Table 15- Selected Experiments for the Marine Degradation of PLA
Polymer Temperature (°C)
Time (days) Sample
Measurement Method
% Biodegraded
Sources
PLA
25°C NA Film Erosion rates None (Tokiwa et al., 2009)
30°C 366 days Bottle Conversion to CO2 5.73% (Greene, 2012)
30°C 56 days Sheets Conversion to CO2 <10% (Narancic et al., 2018)
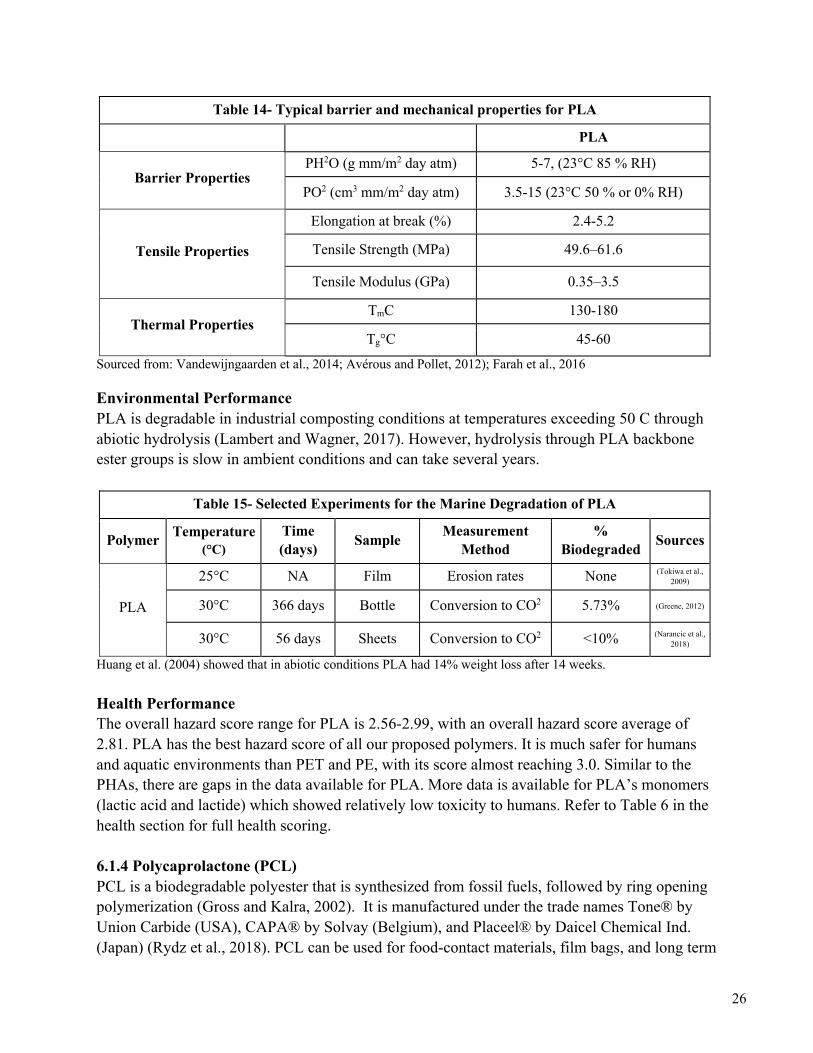
Huang et al. (2004) showed that in abiotic conditions PLA had 14% weight loss after 14 weeks. Health Performance The overall hazard score range for PLA is 2.56-2.99, with an overall hazard score average of 2.81. PLA has the best hazard score of all our proposed polymers. It is much safer for humans and aquatic environments than PET and PE, with its score almost reaching 3.0. Similar to the PHAs, there are gaps in the data available for PLA. More data is available for PLA’s monomers (lactic acid and lactide) which showed relatively low toxicity to humans. Refer to Table 6 in the health section for full health scoring. 6.1.4 Polycaprolactone (PCL) PCL is a biodegradable polyester that is synthesized from fossil fuels, followed by ring opening polymerization (Gross and Kalra, 2002). It is manufactured under the trade names Tone® by Union Carbide (USA), CAPA® by Solvay (Belgium), and Placeel® by Daicel Chemical Ind. (Japan) (Rydz et al., 2018). PCL can be used for food-contact materials, film bags, and long term
27
applications such as slow release systems for drugs (Shah et al., 2008). However, PCL is generally considered too expensive to be widely used in packaging applications.
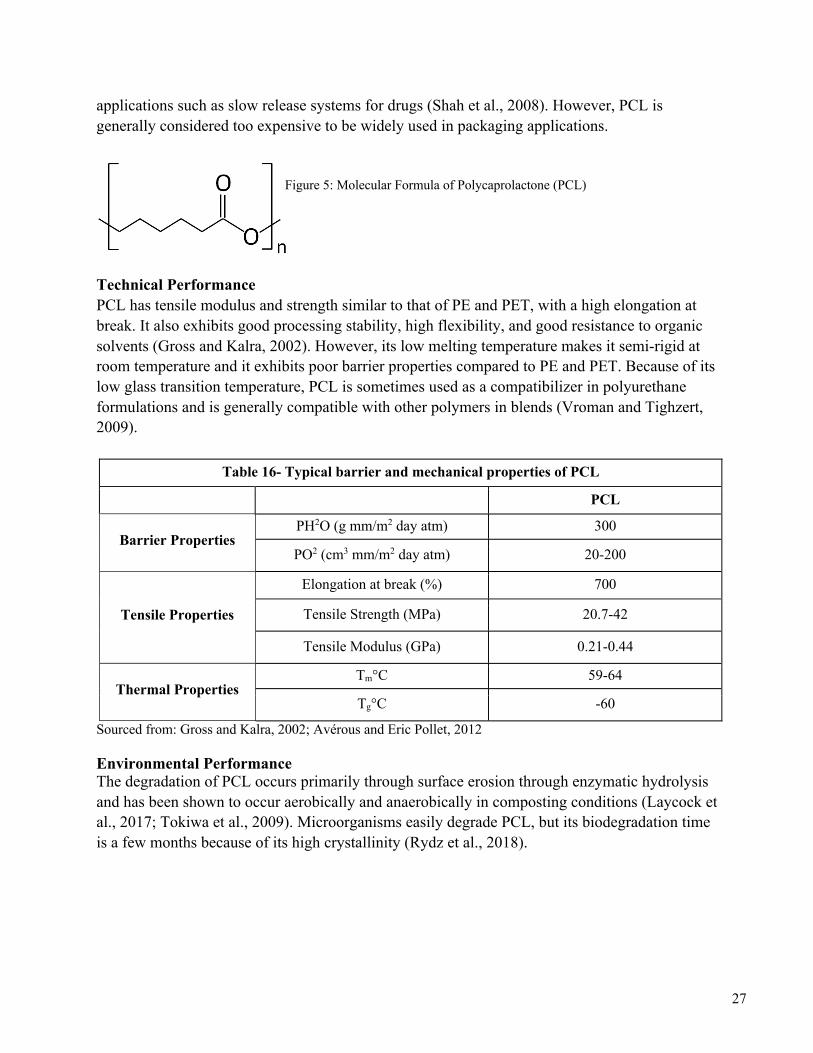
Figure 5: Molecular Formula of Polycaprolactone (PCL)
Technical Performance PCL has tensile modulus and strength similar to that of PE and PET, with a high elongation at break. It also exhibits good processing stability, high flexibility, and good resistance to organic solvents (Gross and Kalra, 2002). However, its low melting temperature makes it semi-rigid at room temperature and it exhibits poor barrier properties compared to PE and PET. Because of its low glass transition temperature, PCL is sometimes used as a compatibilizer in polyurethane formulations and is generally compatible with other polymers in blends (Vroman and Tighzert, 2009).
Table 16- Typical barrier and mechanical properties of PCL
PCL
Barrier Properties PH2O (g mm/m2 day atm) 300
PO2 (cm3 mm/m2 day atm) 20-200
Tensile Properties
Elongation at break (%) 700
Tensile Strength (MPa) 20.7-42
Tensile Modulus (GPa) 0.21-0.44
Thermal Properties Tm°C 59-64
Tg°C -60
Sourced from: Gross and Kalra, 2002; Avérous and Eric Pollet, 2012 Environmental Performance The degradation of PCL occurs primarily through surface erosion through enzymatic hydrolysis and has been shown to occur aerobically and anaerobically in composting conditions (Laycock et al., 2017; Tokiwa et al., 2009). Microorganisms easily degrade PCL, but its biodegradation time is a few months because of its high crystallinity (Rydz et al., 2018).
28
Table 17- Selected Experiments for the Marine Degradation of PCL
Polymer Temperature
(°C) Time (days) Sample
Measurement Method
% Biodegraded Notes
PCL
17.6-20°C 6 weeks Film Weight Loss "PCL samples
completely destroyed" (Heimowska et al.,
2017)
25°C NA Sheets Erosion rates 0.2 micro m/week (Tokiwa et al., 2009)
30°C 56 days Sheets Conversion to
CO2 80%
(Narancic et al., 2018)Estimated
residence time: 10 months
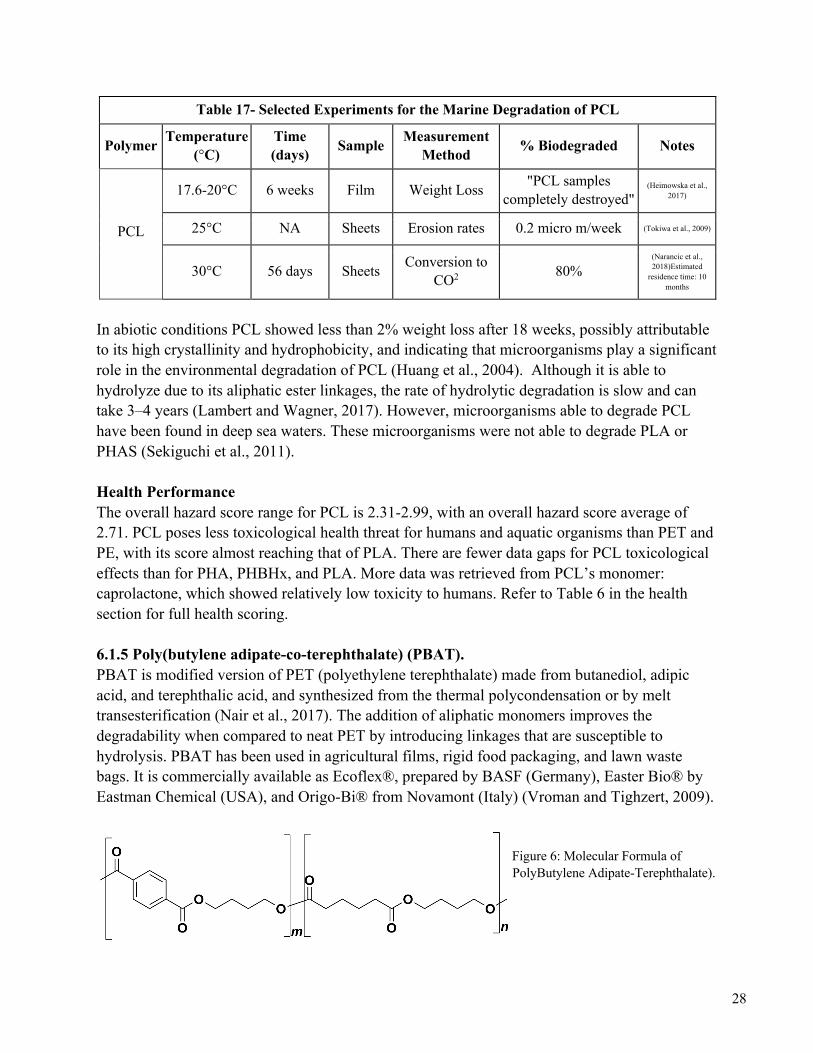
In abiotic conditions PCL showed less than 2% weight loss after 18 weeks, possibly attributable to its high crystallinity and hydrophobicity, and indicating that microorganisms play a significant role in the environmental degradation of PCL (Huang et al., 2004). Although it is able to hydrolyze due to its aliphatic ester linkages, the rate of hydrolytic degradation is slow and can take 3–4 years (Lambert and Wagner, 2017). However, microorganisms able to degrade PCL have been found in deep sea waters. These microorganisms were not able to degrade PLA or PHAS (Sekiguchi et al., 2011). Health Performance The overall hazard score range for PCL is 2.31-2.99, with an overall hazard score average of 2.71. PCL poses less toxicological health threat for humans and aquatic organisms than PET and PE, with its score almost reaching that of PLA. There are fewer data gaps for PCL toxicological effects than for PHA, PHBHx, and PLA. More data was retrieved from PCL’s monomer: caprolactone, which showed relatively low toxicity to humans. Refer to Table 6 in the health section for full health scoring. 6.1.5 Poly(butylene adipate-co-terephthalate) (PBAT). PBAT is modified version of PET (polyethylene terephthalate) made from butanediol, adipic acid, and terephthalic acid, and synthesized from the thermal polycondensation or by melt transesterification (Nair et al., 2017). The addition of aliphatic monomers improves the degradability when compared to neat PET by introducing linkages that are susceptible to hydrolysis. PBAT has been used in agricultural films, rigid food packaging, and lawn waste bags. It is commercially available as Ecoflex®, prepared by BASF (Germany), Easter Bio® by Eastman Chemical (USA), and Origo-Bi® from Novamont (Italy) (Vroman and Tighzert, 2009).
Figure 6: Molecular Formula of PolyButylene Adipate-Terephthalate).

29
Technical Performance PBAT has tensile strength and modulus that are comparable to those of PET. It exhibits a relatively larger elongation at break, which makes the polymer soft and flexible. These properties allow PBAT to be used in films, filaments, thermoformed and injection molded products, blown bottles, and packaging materials (Rydz et al., 2018).
Table 18- Typical barrier and mechanical properties of PBAT
PBAT
Barrier Properties PH2O (g mm/m2 day atm) 25
PO2 (cm3 mm/m2 day atm) 40
Tensile Properties
Elongation at break (%) 544%
Tensile Strength (MPa) 58
Tensile Modulus (GPa) 0.13
Thermal Properties Tm°C 115-120
Tg°C -30
Sourced from: Pinheiro et al., 2017; Vroman and Tighzert, 2009 The thermal and mechanical properties of PBAT can be improved by increasing the terephthalic acid content. However, this increase in aromatic units makes the polymer less biodegradable by making it more resistant to microbial attack (Rydz et al., 2018). Environmental Performance PBAT can be degraded in composting environments. However, biodegradation is strongly dependent on the incubation temperature which largely affects the hydrolysis rate. This effect of temperature on degradation rate suggests that PBAT must be hydrolyzed before microorganisms can use it as a nutrient source (Nair et al., 2017). In accordance with these observations, the marine biodegradation of PBAT measured was less than 2% weight loss after 56 weeks (Wang et al., 2018). Health Performance The overall hazard score range for PBAT is 2.05-2.73, with an overall hazard score average of 2.33. PBATs scores were only slightly better than PET and PE. PBAT has several data gaps, with most information coming from its monomers: 1,4-butanediol, adipic acid and terephthalic acid. PBAT was not included in the final presentation as its health scores were similar to those of PET and PE. For all PBAT information, refer to Table 6 in the health section for full health scoring.
30
6.1.6 Biodegradable polymer blends Polymer blends can be used to improve the tensile and thermal properties of a given polymer. For example, PLA/PCL blends show increased percent elongation and impact toughness when compared to neat PLA and PHBV/PCL blends can improve the thermal stability of PHBV (Matta et al., 2014; Mofokeng and Luyt, 2015). PCL/starch blends have been used as a way to improve the mechanical properties of starch and reduce the cost of PCL to make plastic bags (Muthuraj et al., 2018). However, since our primary goal is to explore alternatives to plastics that degrade in marine environments, we will focus on polymer blends which increase degradability, with the secondary goal of improving mechanical properties.
Sashiwa et al. (2018) studied the effects of blending PHBHHx with two non-biodegradable polymers: PBAT and PLA. Biodegradation of the polymer blends was measured using a Biochemical Oxygen Demand (BOD) tester in seawater samples for 28 days. For PHBHHx/PBAT blends they observed that degradability decreased rapidly with increasing PBAT content. Conversely, PHBHHx/PLA blends showed less dependence on PLA ratio. However, sheets that were more covered with the PLA component showed slower biodegradation.
Naranci et al. (2018) investigated the biodegradability of PLA, PCL, and PHB and their blends for 140-190 days in seawater. Although they observed an increase in the biodegradability for the PLA/PHB, PLA/PCL, and PHB/PCL blends, they note that all of these blends failed to meet international standards for biodegradability in marine environments (ISO and ASTM standards). Studies exploring the biodegradability of polymer blends often note that degradation is largely attributable to the biodegradable component only (Muthuraj et al., 2018). For example, in a study by Wang et al. (2018) they showed that in PBAT/starch strips, starch was the only contributor to mass loss, and consequently degradation depended largely on type and number of microorganisms present. Furthermore, even though increased water absorption was a prerequisite for degradation it did not necessarily increase degradation. 6.1.7 Recycling Possible fates of biopolymers include landfilling, composting, energy recovery through incineration, and recycling. Recycling is more energetically favorable than landfilling and composting as a way to close the loop to the original materials, given that there is no downcycling (Yates and Barlow, 2013). There are two existing types of recycling for polymers: mechanical and chemical recycling. Mechanical recycling involves reducing the size of the polymer resulting in granulate, and reprocessing by conventional polymer processing technologies. In chemical recycling polymers are converted back to their monomers or partially depolymerized so that they can be reprocessed into the original or a related product (Ragaert et al., 2017). For the case of the biopolymers, mechanical recovery is preferred, since chemical recovery could be more expensive and environmentally harmful than obtaining them from their respective renewable feedstocks (Haider et al., 2018).
31
Resch-Fauster et al. (2017) showed that mechanical recycling of PHBV/PBAT blends induced hydrolytic degradation and resulted in rapid decrease of the mechanical properties of the polymer. It has been suggested that the mechanical recycling of PHBV/PLA blends can be affordable relative to PHBV recycling (Badia et al., 2017). However, Haider et al. (2018) notes that PLA is particularly susceptible to downcycling during mechanical recycling and can result in decreased film properties and polymer yellowing. The effect of successive injection on and extrusion cycles has been tested on PHAs, showing a decrease in the molecular weight and mechanical properties of the polymer. Studies on PCL have shown that PCL waste can be used as an additive to neat polymers (Badia et al., 2017).
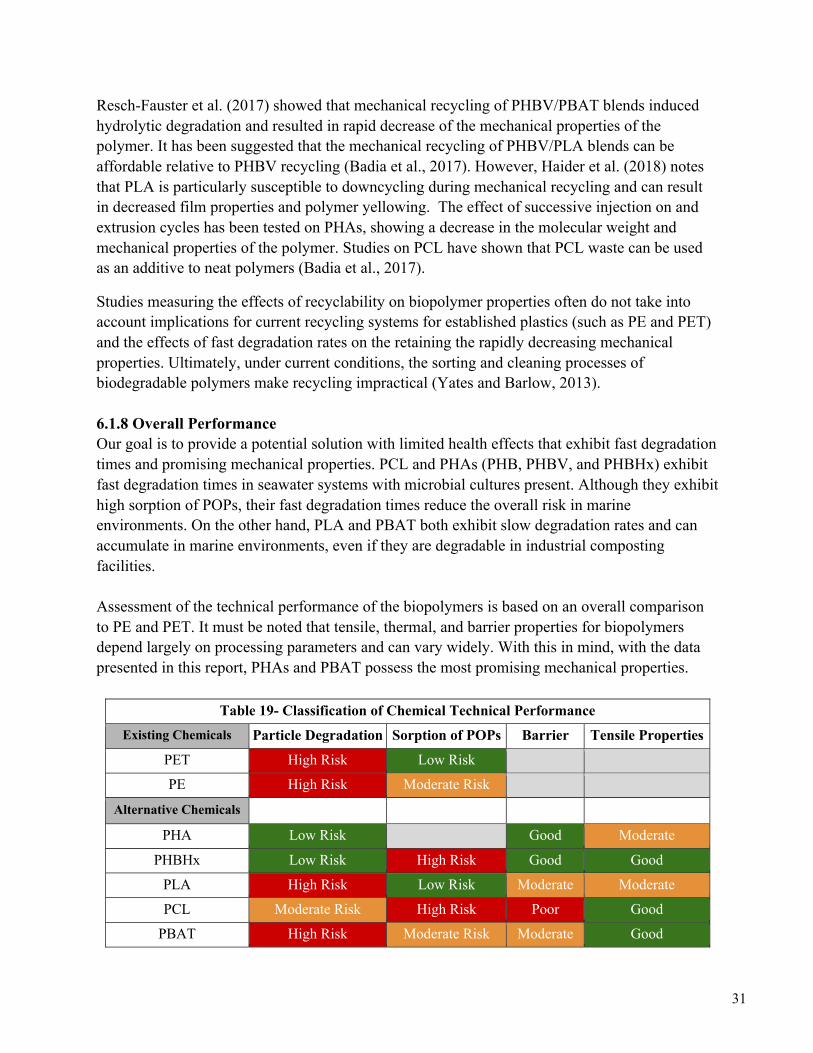
Studies measuring the effects of recyclability on biopolymer properties often do not take into account implications for current recycling systems for established plastics (such as PE and PET) and the effects of fast degradation rates on the retaining the rapidly decreasing mechanical properties. Ultimately, under current conditions, the sorting and cleaning processes of biodegradable polymers make recycling impractical (Yates and Barlow, 2013). 6.1.8 Overall Performance Our goal is to provide a potential solution with limited health effects that exhibit fast degradation times and promising mechanical properties. PCL and PHAs (PHB, PHBV, and PHBHx) exhibit fast degradation times in seawater systems with microbial cultures present. Although they exhibit high sorption of POPs, their fast degradation times reduce the overall risk in marine environments. On the other hand, PLA and PBAT both exhibit slow degradation rates and can accumulate in marine environments, even if they are degradable in industrial composting facilities. Assessment of the technical performance of the biopolymers is based on an overall comparison to PE and PET. It must be noted that tensile, thermal, and barrier properties for biopolymers depend largely on processing parameters and can vary widely. With this in mind, with the data presented in this report, PHAs and PBAT possess the most promising mechanical properties.
Table 19- Classification of Chemical Technical Performance Existing Chemicals Particle Degradation Sorption of POPs Barrier Tensile Properties
PET High Risk Low Risk
PE High Risk Moderate Risk
Alternative Chemicals
PHA Low Risk Good Moderate
PHBHx Low Risk High Risk Good Good
PLA High Risk Low Risk Moderate Moderate
PCL Moderate Risk High Risk Poor Good
PBAT High Risk Moderate Risk Moderate Good
32
6.2 Strategy 2 Alternative Additives 6.2.1 Intro Plastics already incorporate a variety of additives including nucleating agents, crosslinkers, fibers, and more (Scheirs, 2004). Historically, additives have been incorporated during manufacturing to help extend the life of these polymers by helping to scavenge or repair partial breakdown products, or by reinforcing the toughness of the material (Scheirs, 2004; Cinelli et al., 2003). Since many additives are incorporated at up to 20% by weight in PE and PET, it is reasonable to envision additives that could lead to faster polymer breakdown, thereby improving degradation. We identified additives that increase the rate of radical breakdown of the polymer backbone, and sacrificial polymers that serve as a ready source of processable energy for bacteria. While it would be desirable to evaluate each of these strategies for the biopolymers discussed above, the majority of studies on degradation-promoting additives focus on their impact on traditional thermoplastics such as PE and PET. It is reasonable to expect that biopolymers, which share the ester linkage found in PET, would experience similar rates of breakdown. In the case of PE, the difficulty of degrading the carbon-carbon backbone suggests that any additive that improves PE breakdown would also have a positive impact on more readily degraded polymers. 6.2.2 Technical Performance Overview For this section we are primarily concerned with changing the physical properties of the polymer as minimally as possible, while incorporating additives that decrease the time to degradation. Thus, we will evaluate the degradation impact of each additive, with a minor focus on ensuring that addition rates do not impact polymer properties.
Radical breakdown promoters As mentioned previously, one of the primary hurdles in generating a biologically degradable polymer is ensuring that the polymer passes from the micron scale where biotic degradation has minimal impact, to the nanoscale where bacterial enzymes can begin to efficiently process the polymer (Gewert, Plassmann, and MacLeod, 2015; Cole et al., 2011a). Specifically, polymers need to degrade below the 10,000 MW limit, as most enzymes work from exposed polymer ends, leading to very slow processing of larger polymer chains (Cole et al., 2011a; Abrusci et al., 2011). The most efficient method to reduce polymer chain size is direct radical cleavage (Gewert, Plassmann, and MacLeod, 2015; Abrusci et al., 2011; Pablos et al., 2010). We investigated the radical breakdown promoter Iron Stearate, a complex of Fe (III) with three fatty acid chains surrounding it. But we also identified multiple metal complexes, including calcium, cobalt, and copper. In particular, copper phthalocyanine appears to act as a biologically safe form of copper for these purposes (Osawa, 1988; Saron et al., 2006). In the presence of light, these complexes generate singlet oxygen species capable of cleaving the polymer backbone and leading to molecular weight decrease (Abrusci et al., 2011; Pablos et al., 2010). In the research available a variety of polymers were studied but the majority of studies focused on applications in polyethylene films. Table 20 summarizes the findings from these papers.
33
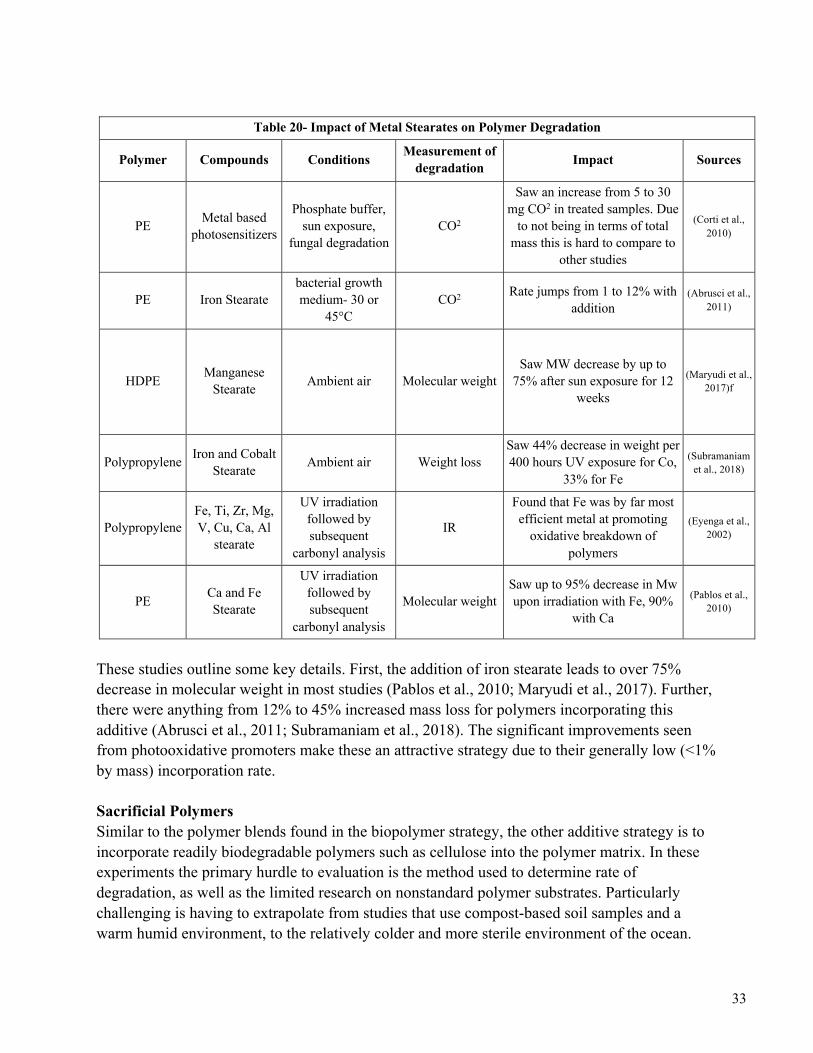
Table 20- Impact of Metal Stearates on Polymer Degradation
Polymer Compounds Conditions Measurement of degradation Impact Sources
PE Metal based photosensitizers
Phosphate buffer, sun exposure,
fungal degradation CO2
Saw an increase from 5 to 30 mg CO2 in treated samples. Due
to not being in terms of total mass this is hard to compare to
other studies
(Corti et al., 2010)
PE Iron Stearate bacterial growth medium- 30 or
45°C CO2 Rate jumps from 1 to 12% with
addition (Abrusci et al.,
2011)
HDPE Manganese Stearate Ambient air Molecular weight
Saw MW decrease by up to 75% after sun exposure for 12
weeks
(Maryudi et al., 2017)f
Polypropylene Iron and Cobalt Stearate Ambient air Weight loss
Saw 44% decrease in weight per 400 hours UV exposure for Co,
33% for Fe
(Subramaniam et al., 2018)
Polypropylene Fe, Ti, Zr, Mg, V, Cu, Ca, Al
stearate
UV irradiation followed by subsequent
carbonyl analysis
IR
Found that Fe was by far most efficient metal at promoting
oxidative breakdown of polymers
(Eyenga et al., 2002)
PE Ca and Fe Stearate
UV irradiation followed by subsequent
carbonyl analysis
Molecular weight Saw up to 95% decrease in Mw upon irradiation with Fe, 90%
with Ca
(Pablos et al., 2010)
These studies outline some key details. First, the addition of iron stearate leads to over 75% decrease in molecular weight in most studies (Pablos et al., 2010; Maryudi et al., 2017). Further, there were anything from 12% to 45% increased mass loss for polymers incorporating this additive (Abrusci et al., 2011; Subramaniam et al., 2018). The significant improvements seen from photooxidative promoters make these an attractive strategy due to their generally low (<1% by mass) incorporation rate. Sacrificial Polymers Similar to the polymer blends found in the biopolymer strategy, the other additive strategy is to incorporate readily biodegradable polymers such as cellulose into the polymer matrix. In these experiments the primary hurdle to evaluation is the method used to determine rate of degradation, as well as the limited research on nonstandard polymer substrates. Particularly challenging is having to extrapolate from studies that use compost-based soil samples and a warm humid environment, to the relatively colder and more sterile environment of the ocean.
34
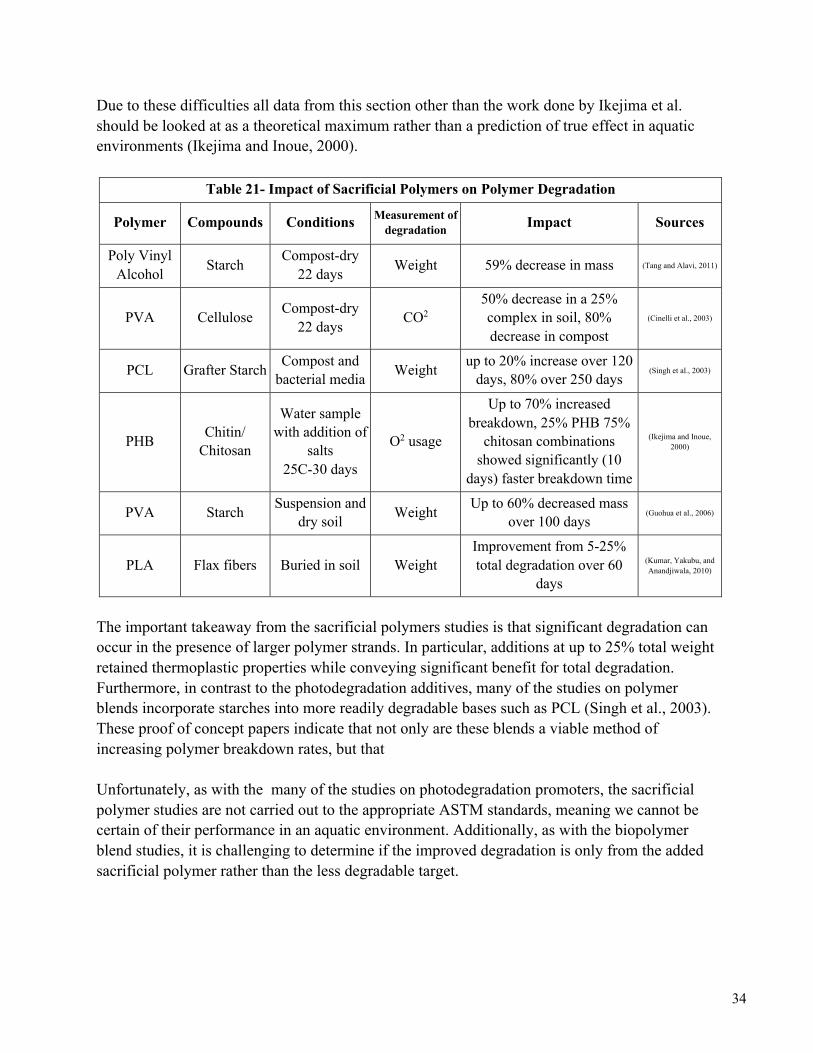
Due to these difficulties all data from this section other than the work done by Ikejima et al. should be looked at as a theoretical maximum rather than a prediction of true effect in aquatic environments (Ikejima and Inoue, 2000).
Table 21- Impact of Sacrificial Polymers on Polymer Degradation
Polymer Compounds Conditions Measurement of degradation Impact Sources
Poly Vinyl Alcohol Starch Compost-dry
22 days Weight 59% decrease in mass (Tang and Alavi, 2011)
PVA Cellulose Compost-dry 22 days CO2
50% decrease in a 25% complex in soil, 80% decrease in compost
(Cinelli et al., 2003)
PCL Grafter Starch Compost and bacterial media Weight up to 20% increase over 120
days, 80% over 250 days (Singh et al., 2003)
PHB Chitin/ Chitosan
Water sample with addition of
salts 25C-30 days
O2 usage
Up to 70% increased breakdown, 25% PHB 75%
chitosan combinations showed significantly (10
days) faster breakdown time
(Ikejima and Inoue, 2000)
PVA Starch Suspension and dry soil Weight Up to 60% decreased mass
over 100 days (Guohua et al., 2006)
PLA Flax fibers Buried in soil Weight Improvement from 5-25% total degradation over 60
days
(Kumar, Yakubu, and Anandjiwala, 2010)
The important takeaway from the sacrificial polymers studies is that significant degradation can occur in the presence of larger polymer strands. In particular, additions at up to 25% total weight retained thermoplastic properties while conveying significant benefit for total degradation. Furthermore, in contrast to the photodegradation additives, many of the studies on polymer blends incorporate starches into more readily degradable bases such as PCL (Singh et al., 2003). These proof of concept papers indicate that not only are these blends a viable method of increasing polymer breakdown rates, but that
Unfortunately, as with the many of the studies on photodegradation promoters, the sacrificial polymer studies are not carried out to the appropriate ASTM standards, meaning we cannot be certain of their performance in an aquatic environment. Additionally, as with the biopolymer blend studies, it is challenging to determine if the improved degradation is only from the added sacrificial polymer rather than the less degradable target.
35
Health Performance The overall hazard score range for iron stearate is 2.00-2.21, with an overall hazard score average of 2.11. The overall hazard score range for copper phthalocyanine is 3.00-3.00 with an average of 3.00. The range for cellulose is 2.00-3.00 with an average of 2.57. Comparatively, PE has a range of 1.74-2.74 and an average of 2.17 and PET has a range of 1.26-3.00 an average of 2.14. Copper phthalocyanine and cellulose therefore have lower hazard scores than PE and PET while iron stearate is comparable to PE and PET in terms of direct toxicity. 6.3 Strategy 3 Non-thermoplastic Alternatives 6.3.1 Intro While thermoplastic alternatives fit easily into modern packaging styles, our team also investigated options that deviate from these plastic packaging systems. In this regard we drew inspiration from the packaging for aqueous solutions found in nature, namely coconuts and tomatoes. Tomatoes are characterized by a thin hydrophobic membrane surrounding a liquid interior and supported by polysaccharide based structural components (Crookes and Grierson, 1983). We sought a system with similar properties that might be consumed more like a tomato than a plastic package for liquid soap. The two cases of similar existing commercial products are the Alginate based Ooho (Padiyar and Maheshwari, 2018) and the recent release of a cyanobacterium based polysaccharide (EPS) produced by HelioBioSys and found to be soluble in neutral pH water, but insoluble in alkaline conditions such as soap (Mirsiaghi et al., 2018). Alginate is a polysaccharide composed of the monosaccharides Mannuronic acid and Guluronic acid (Fig. 7). It is derived from seaweed or algae in high yield and is fairly inexpensive due to the ready biological supply, but its most interesting property is the ability to form a hydrogel in the presence of calcium salts (P. Lee and Rogers, 2012). The common procedure is to saturate a liquid of interest with soluble alginate, then submerge either droplets of frozen spheres in solutions of calcium salts. This procedure results in the rapid formation of a shell around a liquid core whose thickness can be modulated by increasing the time submerged in the calcium solution (P. Lee and Rogers, 2012). One benefit of Alginate hydrogels is that they dissolve at low pH, allowing them to be consumed in food and then liquified during the digestive process. Due to the nature of the polysaccharide bonds, Alginate is not readily digested but is instead excreted with other indigestible (K. Y. Lee and Mooney, 2012). These spheres have many uses, but have been found most notably in cases such as Ooho, a consumable water container, drug delivery vehicles for implantation, and in modernist cuisine where the Alginate spherification process is frequently employed to convey unique flavors in a caviar-like package (P. Lee and Rogers, 2012; K. Y. Lee and Mooney, 2012; Padiyar and Maheshwari, 2018). In this application we envision encapsulating detergents or other products in the Alginate or EPS matrix for use in a home or commercial setting.
Figure 7: Chemical structure of one subunit of calcium
alginate, indicating the minor structural differences between Mannuronic and Guluronic acid.
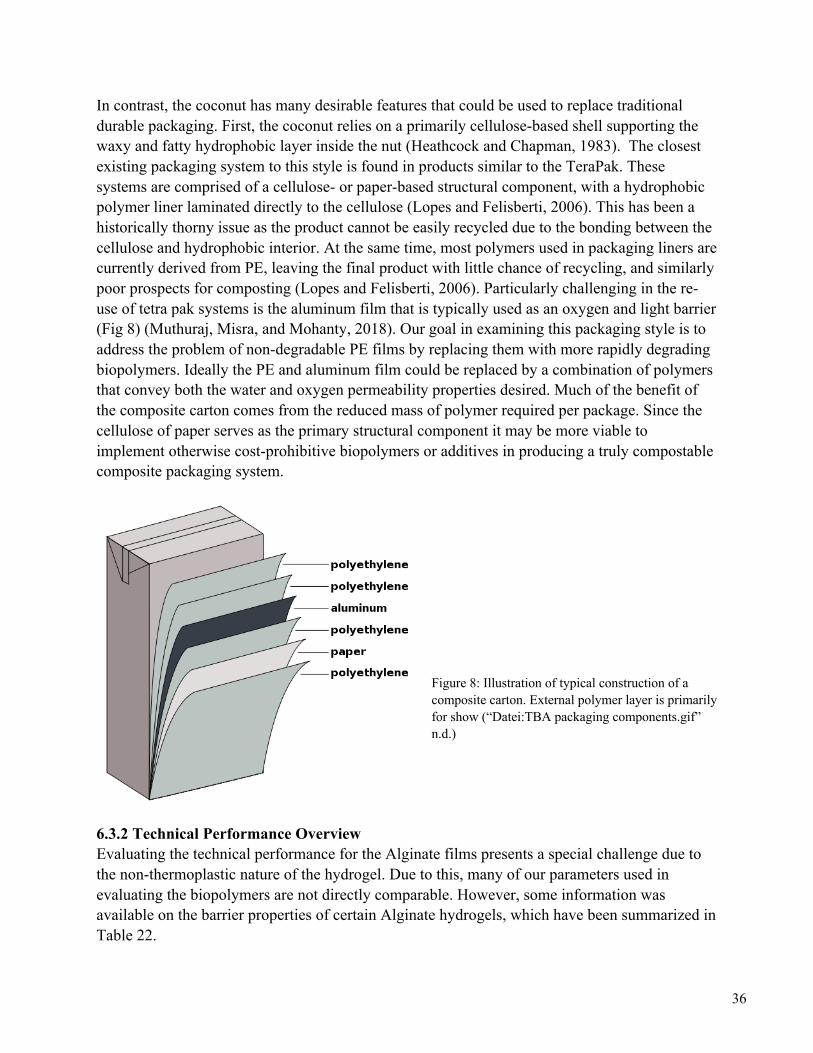
36
In contrast, the coconut has many desirable features that could be used to replace traditional durable packaging. First, the coconut relies on a primarily cellulose-based shell supporting the waxy and fatty hydrophobic layer inside the nut (Heathcock and Chapman, 1983). The closest existing packaging system to this style is found in products similar to the TeraPak. These systems are comprised of a cellulose- or paper-based structural component, with a hydrophobic polymer liner laminated directly to the cellulose (Lopes and Felisberti, 2006). This has been a historically thorny issue as the product cannot be easily recycled due to the bonding between the cellulose and hydrophobic interior. At the same time, most polymers used in packaging liners are currently derived from PE, leaving the final product with little chance of recycling, and similarly poor prospects for composting (Lopes and Felisberti, 2006). Particularly challenging in the re-use of tetra pak systems is the aluminum film that is typically used as an oxygen and light barrier (Fig 8) (Muthuraj, Misra, and Mohanty, 2018). Our goal in examining this packaging style is to address the problem of non-degradable PE films by replacing them with more rapidly degrading biopolymers. Ideally the PE and aluminum film could be replaced by a combination of polymers that convey both the water and oxygen permeability properties desired. Much of the benefit of the composite carton comes from the reduced mass of polymer required per package. Since the cellulose of paper serves as the primary structural component it may be more viable to implement otherwise cost-prohibitive biopolymers or additives in producing a truly compostable composite packaging system.
Figure 8: Illustration of typical construction of a composite carton. External polymer layer is primarily for show (“Datei:TBA packaging components.gif” n.d.)
6.3.2 Technical Performance Overview Evaluating the technical performance for the Alginate films presents a special challenge due to the non-thermoplastic nature of the hydrogel. Due to this, many of our parameters used in evaluating the biopolymers are not directly comparable. However, some information was available on the barrier properties of certain Alginate hydrogels, which have been summarized in Table 22.
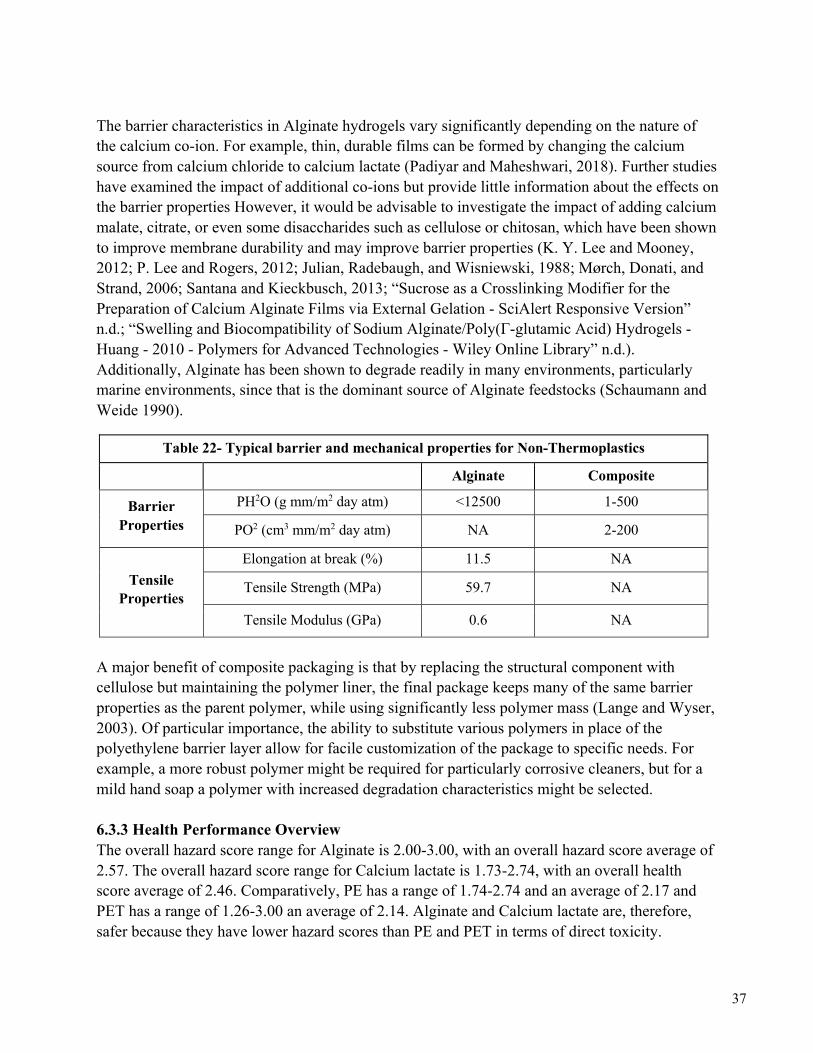
37
The barrier characteristics in Alginate hydrogels vary significantly depending on the nature of the calcium co-ion. For example, thin, durable films can be formed by changing the calcium source from calcium chloride to calcium lactate (Padiyar and Maheshwari, 2018). Further studies have examined the impact of additional co-ions but provide little information about the effects on the barrier properties However, it would be advisable to investigate the impact of adding calcium malate, citrate, or even some disaccharides such as cellulose or chitosan, which have been shown to improve membrane durability and may improve barrier properties (K. Y. Lee and Mooney, 2012; P. Lee and Rogers, 2012; Julian, Radebaugh, and Wisniewski, 1988; Mørch, Donati, and Strand, 2006; Santana and Kieckbusch, 2013; “Sucrose as a Crosslinking Modifier for the Preparation of Calcium Alginate Films via External Gelation - SciAlert Responsive Version” n.d.; “Swelling and Biocompatibility of Sodium Alginate/Poly(Γ‐glutamic Acid) Hydrogels - Huang - 2010 - Polymers for Advanced Technologies - Wiley Online Library” n.d.). Additionally, Alginate has been shown to degrade readily in many environments, particularly marine environments, since that is the dominant source of Alginate feedstocks (Schaumann and Weide 1990).
Table 22- Typical barrier and mechanical properties for Non-Thermoplastics
Alginate Composite
Barrier Properties
PH2O (g mm/m2 day atm) <12500 1-500
PO2 (cm3 mm/m2 day atm) NA 2-200
Tensile Properties
Elongation at break (%) 11.5 NA
Tensile Strength (MPa) 59.7 NA
Tensile Modulus (GPa) 0.6 NA
A major benefit of composite packaging is that by replacing the structural component with cellulose but maintaining the polymer liner, the final package keeps many of the same barrier properties as the parent polymer, while using significantly less polymer mass (Lange and Wyser, 2003). Of particular importance, the ability to substitute various polymers in place of the polyethylene barrier layer allow for facile customization of the package to specific needs. For example, a more robust polymer might be required for particularly corrosive cleaners, but for a mild hand soap a polymer with increased degradation characteristics might be selected. 6.3.3 Health Performance Overview The overall hazard score range for Alginate is 2.00-3.00, with an overall hazard score average of 2.57. The overall hazard score range for Calcium lactate is 1.73-2.74, with an overall health score average of 2.46. Comparatively, PE has a range of 1.74-2.74 and an average of 2.17 and PET has a range of 1.26-3.00 an average of 2.14. Alginate and Calcium lactate are, therefore, safer because they have lower hazard scores than PE and PET in terms of direct toxicity.
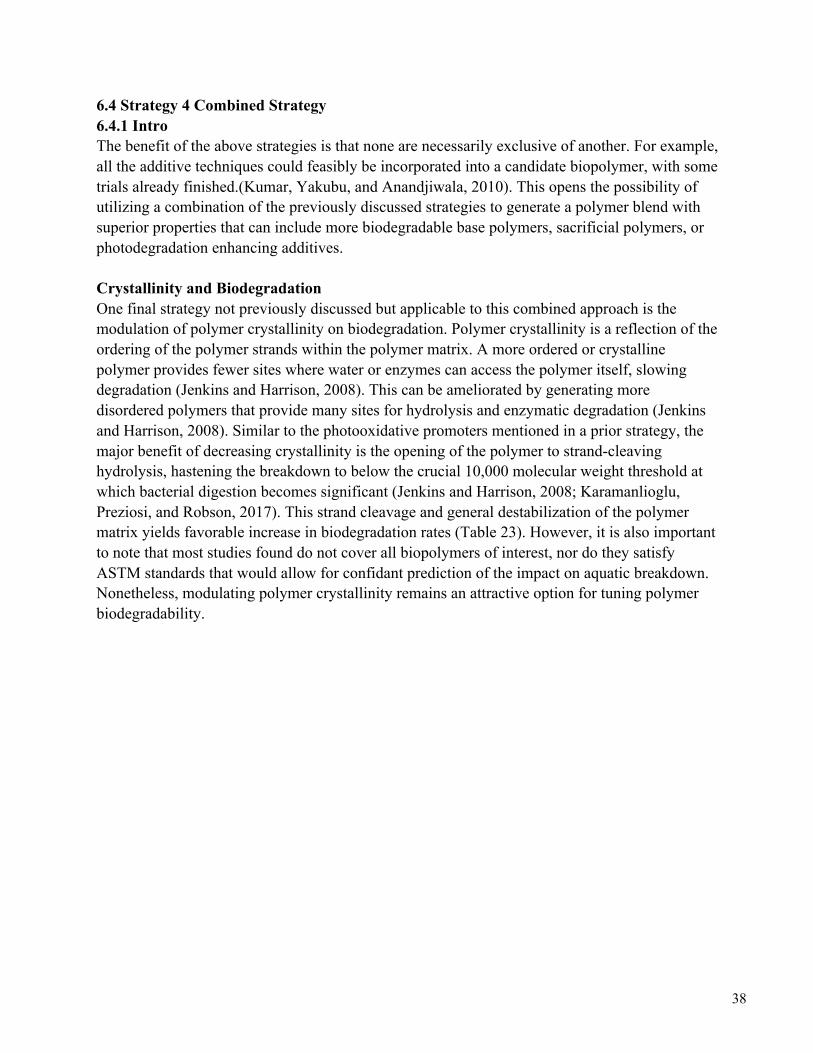
38
6.4 Strategy 4 Combined Strategy 6.4.1 Intro The benefit of the above strategies is that none are necessarily exclusive of another. For example, all the additive techniques could feasibly be incorporated into a candidate biopolymer, with some trials already finished.(Kumar, Yakubu, and Anandjiwala, 2010). This opens the possibility of utilizing a combination of the previously discussed strategies to generate a polymer blend with superior properties that can include more biodegradable base polymers, sacrificial polymers, or photodegradation enhancing additives. Crystallinity and Biodegradation One final strategy not previously discussed but applicable to this combined approach is the modulation of polymer crystallinity on biodegradation. Polymer crystallinity is a reflection of the ordering of the polymer strands within the polymer matrix. A more ordered or crystalline polymer provides fewer sites where water or enzymes can access the polymer itself, slowing degradation (Jenkins and Harrison, 2008). This can be ameliorated by generating more disordered polymers that provide many sites for hydrolysis and enzymatic degradation (Jenkins and Harrison, 2008). Similar to the photooxidative promoters mentioned in a prior strategy, the major benefit of decreasing crystallinity is the opening of the polymer to strand-cleaving hydrolysis, hastening the breakdown to below the crucial 10,000 molecular weight threshold at which bacterial digestion becomes significant (Jenkins and Harrison, 2008; Karamanlioglu, Preziosi, and Robson, 2017). This strand cleavage and general destabilization of the polymer matrix yields favorable increase in biodegradation rates (Table 23). However, it is also important to note that most studies found do not cover all biopolymers of interest, nor do they satisfy ASTM standards that would allow for confidant prediction of the impact on aquatic breakdown. Nonetheless, modulating polymer crystallinity remains an attractive option for tuning polymer biodegradability.
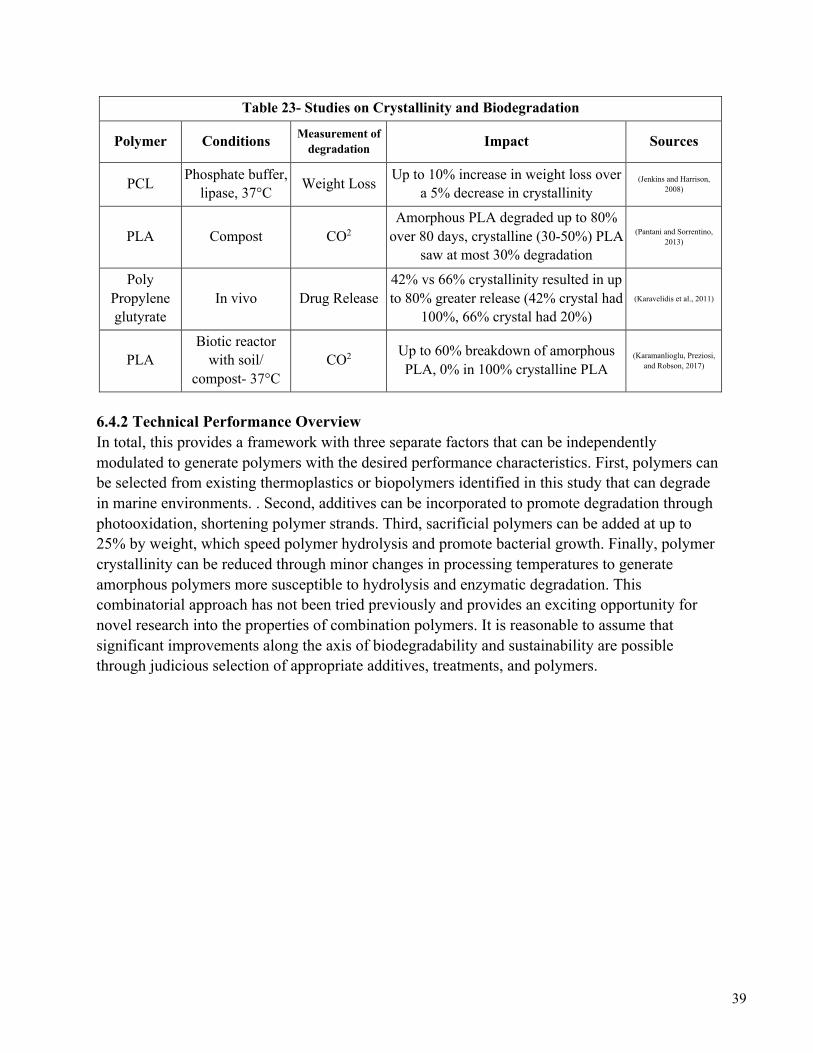
39
Table 23- Studies on Crystallinity and Biodegradation
Polymer Conditions Measurement of degradation Impact Sources
PCL Phosphate buffer, lipase, 37°C Weight Loss Up to 10% increase in weight loss over
a 5% decrease in crystallinity (Jenkins and Harrison,
2008)
PLA Compost CO2 Amorphous PLA degraded up to 80%
over 80 days, crystalline (30-50%) PLA saw at most 30% degradation
(Pantani and Sorrentino, 2013)
Poly Propylene glutyrate
In vivo Drug Release 42% vs 66% crystallinity resulted in up to 80% greater release (42% crystal had
100%, 66% crystal had 20%) (Karavelidis et al., 2011)
PLA Biotic reactor
with soil/ compost- 37°C
CO2 Up to 60% breakdown of amorphous PLA, 0% in 100% crystalline PLA
(Karamanlioglu, Preziosi, and Robson, 2017)
6.4.2 Technical Performance Overview In total, this provides a framework with three separate factors that can be independently modulated to generate polymers with the desired performance characteristics. First, polymers can be selected from existing thermoplastics or biopolymers identified in this study that can degrade in marine environments. . Second, additives can be incorporated to promote degradation through photooxidation, shortening polymer strands. Third, sacrificial polymers can be added at up to 25% by weight, which speed polymer hydrolysis and promote bacterial growth. Finally, polymer crystallinity can be reduced through minor changes in processing temperatures to generate amorphous polymers more susceptible to hydrolysis and enzymatic degradation. This combinatorial approach has not been tried previously and provides an exciting opportunity for novel research into the properties of combination polymers. It is reasonable to assume that significant improvements along the axis of biodegradability and sustainability are possible through judicious selection of appropriate additives, treatments, and polymers.
40
Section 7 Conclusion and Final Recommendations We aimed to design plastic packaging that will rapidly degrade to harmless components in aquatic ecosystems. Our four alternatives: 1) biopolymers, 2) additives aimed at speeding degradation time, 3) non-thermoplastic alternatives, and 4) combinatorial addition of the above methods provide solutions aimed at solving the ocean plastic crisis. These solutions improve on technical and environmental performance by:
1. Accelerating degradation which leads to little accumulation 2. Bypassing the recycling barrier by creating degradable and compostable products 3. Making renewable feedstocks available for most polymers
Our four alternatives also provide improvements on health safety by:
1. Decreasing direct toxicity compared to PET and PE 2. Decreasing nano, micro and macroplastic exposure 3. Minimizing POP exposure due to shorter degradation time
Though the proposed solutions address many failings of modern packaging systems, several important areas warrant further examination. First, quantitative evaluation of our proposed solutions requires further study into the impacts of particle size on polymer degradation, as well as the impacts of particle size on aquatic systems and ultimately human health outcomes. In particular, a standard for evaluating polymer breakdown from the macro to nano scale would be particularly useful in comparing our proposed solutions. Additionally, though some studies attempted comparison of two parameters in promoting polymer degradation, no research evaluates the impact of combining a multitude of strategies as we have suggested in this report. Significant testing will be required to find optimal conditions for the various additives and polymer alternatives proposed. Gratifyingly, initial attempts need not replace all thermoplastics but can instead target packaging for dry concentrates or other easily managed product where performance requirements are lower. Beyond performance metrics, the impacts polymer bound photo-oxidants on aquatic systems should also be carefully examined. There is an urgent need for a solution to the rising levels of ocean plastics. As plastic production is expected to rise in the future, the harmful consequences to the environment and health can be expected to worsen. Our proposed packaging alternatives would degrade more rapidly in marine environments than current thermoplastics. With further research and development, our alternatives can provide a framework to replace existing problematic packaging and reduce ocean plastic pollution.
41
Appendix Appendix Section 1: Endpoint Definitions Group 1 Endpoint Definitions:
● Carcinogenicity- a substance that induces cancer or increases its incidence. Any substance that induces benign or malignant tumors in humans or animals is considered to be a potential human carcinogen.
● Mutagenicity- chemicals that may cause mutations in the germ cells of human that can be transmitted to progeny.
● Developmental toxicity- chemicals that may cause adverse effects on development of the offspring. This can be before or after birth, with exposure occurring in the parent, prenatally, or postnatally.
● Reproductive toxicity- chemicals that interfere with sexual function of fertility, including pregnancy outcomes, female and male reproductive system, and adverse effects of the onset of puberty.
● Endocrine disruption- a chemical that interferes with hormone communication between cells, which can impact metabolism, growth, development, reproduction and behavior.
Group 2 Endpoint Definitions:
● Acute toxicity- a chemical causing toxicity following a single dose or multiple doses within 24 hours upon dermal or oral exposure (inhalation after 4 hours).
● Acute systemic toxicity- a chemical that may cause organ toxicity following a single exposure.
● Chronic systemic toxicity- a chemical that may cause organ toxicity following repeated exposures.
● Acute neurotoxicity- a chemical that may cause damage to the nervous system or brain following a single exposure.
● Chronic neurotoxicity- a chemical that may cause damage to the nervous system or brain following repeated exposures.
● Skin/eye/respiratory irritation- a chemical that may cause reversible skin/eye/respiratory irritation
All definitions adapted from endpoint definitions in DataCommons. Appendix Section 2: Community-Based Social Marketing Approach Community-based social marketing is a framework used to promote targeted behaviors. Based in social psychology, this framework has been implemented in various ways to promote environmentally sustainable behaviors. Overall, the framework has five steps: selecting behaviors, identifying barriers and benefits, developing strategies, piloting, and broad scale implementation. This report will focus mainly on describing potential strategies that could be implemented specifically for Method products. Identifying barriers and benefits, piloting, and broad scale implementation within the framework are not discussed in depth given the limited team knowledge of Method’s internal infrastructure and resources.
42
Specific strategies within the community-based social marketing approach include commitment, social norms, prompts, communication, incentives, and convenience. Each of these strategies with be defined and potential activities described in the context of the targeted behavior, as described below (Mackenzie-Mohr, 2010). A.2.1 Target behavior A target behavior is one in which the framework is promoting through the use of various strategies. Target behaviors should embody several principles, including high sustainability impact, ease of adoption, and simplicity. As is the case for this entire report, the community-based social market approach will operate under the assumption that Method products will not be recycled given the low rates of recycling in the United States and in developing economies. Therefore, the target behavior of this approach is altering consumer patterns to purchase biodegradable products in lieu of non-biodegradable products (Mackenzie-Mohr, 2010). This target behavior is more environmentally sustainable as is promotes the use of plastic materials that pose less hazard for both the health of the environment and for humans. Moreover, this behavior is simple (the purchase of a product which is single-faceted) and east to adopt because it only requires the shift of buying a sustainable Method product over another. However, benefits and barriers will need to be assessed in depth to ensure high efficacy of adoption. The primary barrier will be economic cost. This barrier may be of limited impact, however, given that Method products are typically targeted for consumers that are eco-friendly and usually of higher socioeconomic status. A.2.2 Strategies As noted above, the strategies in the community-based social marketing approach are commitment, social norms, prompts, communication, incentives, and convenience. These strategies are utilized to encourage the adoption of a targeted behavior by promoting benefits and helping to overcome barriers. In the context of the target behavior related to Method products, the strategies presented below are intended to promote the purchase of biodegradable products with the primary benefit being the protection of marine environments and human health. Each strategy listed above can be defined as follows:
● Commitment- Commitment borrows on Self-Perception theory where a small act of commitment, such as a signing a petition, makes an individual more likely to follow through with a particular behavior. Self-Perception Theory states that this is the case as individuals want to perceive themselves as people who “do the right thing.” Moveover, consistency is a character trait that is highly valued in society; those that are not consistent are considered to be untrustworthy. Therefore, individuals subliminally feel the necessity of behaving in the manner in which they committed to. Generally, commitments are more effective if they are written and made publicly.
● Social norms- social norms guide everyday behavior, consciously and unconsciously. A sustainable behavior is more likely to be followed if it becomes a social norm. Several
43
studies have shown this to be the case, including studies that show littering decreases when is becomes a taboo behavior in society. There are two types of norms: injunctive, which provide information on what behavior is/is not acceptable, and descriptive, which indicate what behaviors others typically engage in.
● Prompts- a prompt is a visual or audio aid that reminds people to act with a certain behavior. These “reminders” are very effective for promoting sustainable behaviors. Several studies have shown the efficacy of prompts, including a study in the Netherlands where prompts for recycling decreased litter by 50%. Effective prompts are noticeable, self-explanatory, and usually close in proximity to the desired behaviors.
● Communication- communication in this context is used to persuade individuals to act on the target behavior. Effective communication is vivid, which both captures the audience’s attention and makes them more likely to remember the information, and thus act on it, at a later time.
● Incentives- incentives generally refer to financial incentives and are generally used as motivation for people who are already engaging in the behavior to engage in it more effectively. Incentives have an excellent record in promoting sustainable behaviors, particularly for waste reduction. Effective incentives are closely paired with the behavior, are visible, and reward positive behavior.
● Convenience- convenience states that the target behavior should be easy to adopt; i.e., it should not be unpleasant, time consuming or have other significant barriers that would limit its adoption. Convenience has been shown to be effective in promoting sustainable behaviors. For example, cities that have effective curbside composting generally have higher rates of composting and less waste because the act of composting has been made easy and convenient.
These strategies are often used in conjunction with each other. This is the case for several strategies used for Method products. The following sections will describe several potential ways in which to utilize these strategies to promote the purchase of biodegradable products. (Mackenzie-Mohr) A.2.2.1 Creating a social media campaign The easiest, and perhaps most effective, option to promote the behavior of purchasing biodegradable products is tapping into Method’s social media outlets. Method has been incredibly effective at using both Instagram and Facebook to reach their consumer base. Other projects, such as Creative Growth, has drawn attention to important issues that Method cares about. The Creative Growth project used short videos on Facebook/Instagram that linked back to a website page that offered more information on Creative Growth and artists with disabilities. This type of strategy could be adopted for reducing ocean plastics. Ocean plastics are an environmental issue that has high media attention. Consumer are, therefore, aware and most likely willing to act to help protect marine environments. Creating an effective social media
44
campaign would tap into several community-based social marketing strategies, including communication, prompts, social norms, and commitment. Similar to the Creative Growth project, biodegradable bottles should contain a visually appealing label that draws attention to the ocean plastics problem. Typically, megafauna, such as sea turtles, sharks, dolphins, or whales, are very effective in promoting environmentally friendly messages. Turtles, in particular, would be effective in communication as videos of turtles with implanted straws regularly surface on social media. Like Creative Growth, ocean plastics should also have a website page that can be listed on the bottle and on social media outlets. The website page offers a secondary mode of communication. In this regard, the website design should be colorful, engaging, and informative. Proposed features of the website should include the following:
● An interactive map showing where plastics are most prevalent in oceans ● Basic statistics (see Background section) at the top of the page that makes that problem
tangible ● A news section that contains various updates on ocean plastics. Stories of people
engaging in other behaviors to reduce plastic waste would be optimal as it promotes the social norm of using plastic alternatives.
● Information on Method’s products, i.e., how they degrade in the environment and how using Method products reduces ocean plastics
● A space for videos and photos of commitments others have made to reduce their plastic consumption by using Method products (see below)
The main social media aspect of this strategy surrounds commitments. As noted above, commitments are more effective when they are written and made in public. Public commitments also serve as prompts for others, as well as creating sustainable social norms. For ocean plastics, individuals should be recruited to make commitments on Method and personal social media pages. These commitments should be visual: photos for Instagram and videos for Facebook. For Instagram, photos of individuals holding signs stating their commitments should be posted with links back to the website page. Generally, these signs, which act as commitments, prompts, communication and social norms, should be visually appealing with catchy phrases. Using photos or drawings of mega fauna would also be effective in these signs. Similarly, videos of individuals holding signs and discussing their rationale for buying Method biodegradable products should be posted to Facebook. Resources permitting, a longer video with experts should be created to post on Facebook that clearly outlines the issue and how Method products help to reduce ocean plastics. All social media posts should link back to the website page where viewers can see full length videos. Moreover, this offers a unique opportunity to promote further commitment and social norm diffusion. Namely, the website page can contain an option for individuals that view the website to make online commitments where they sign their names onto a pledge that states they
45
will help reduce ocean plastics by using biodegradable products. These commitments should be displayed online where there is a list of individuals who have taken the pledge; this makes the commitment more effective for each individual as it is public and also facilitates that notion that purchasing biodegradable plastics is the social norm. Those that take the pledge should also have the option of sharing their commitment on their own social media outlets, which makes that pledge public to their own network and facilitates social diffusion of the commitment. A strategic social media campaign has the capacity to facilitate the target behavior through various strategies. Of important note is the necessity to frame the communication and promotion of these strategies to fit the target audience. For instance, older generations are more likely to use Facebook than Instagram, so these messages should target this portion of the consumer base. Generally, videos will be more effective on Facebook while short snippets and photos should be utilized on Instagram. A.2.2.2 Creating a monthly newsletter Once individuals have made the commitment, it’s imperative to consistently remind these consumers to act on their commitments. A short, monthly newsletter is a relatively easy and inexpensive way to do this. The newsletter should contain updates on the status of Method biodegradable products. It should also have news updates on ocean plastics. Furthermore, the newsletter should contain a “case story” of a new member who took the commitment and their reasoning for doing so. This not only prompts individuals, it also continually builds the social norm purchasing biodegradable plastics. Newsletters should link back to the website and have the option for individuals to share across their networks to facilitate more commitments. A.2.2.3 Creating incentives One further strategy for promoting the purchase of biodegradable plastics is to offer positive incentives. This can be done in the form of coupons; i.e., if you buy ten Method products you get one free. Positive incentives can also be linked back to the online commitments, where those who take the pledge receive a coupon for a free Method product. Offering this financial incentive can get individuals to commit that may not have otherwise, and once they do, they are more likely to follow the target behavior. A.2.2.4 Conclusion Community-based social marketing offers a unique framework in which to promote sustainable behaviors to help reduce ocean plastics. Strategies discussed above utilize principles of social marketing, including communication, incentives, prompts, commitments and social norms. Note that, according to the framework, piloting should be carried out before broad scale implementation. These strategies serve as guiding suggestions for Method to implement as Method begins to utilize biodegradable plastics.
46
References 1. Abrusci, C. et al. Biodegradation of photo-degraded mulching films based on polyethylenes and stearates of calcium and iron as pro-oxidant additives. International Biodeterioration & Biodegradation 65, 451–459 (2011). 2. Environmental silicate nano-biocomposites. (Springer, 2012). 3. Bach, C. et al. Effect of temperature on the release of intentionally and non-intentionally added substances from polyethylene terephthalate (PET) bottles into water: Chemical analysis and potential toxicity. Food Chemistry 139, 672–680 (2013). 4. Bach, C. et al. Effect of sunlight exposure on the release of intentionally and/or non-intentionally added substances from polyethylene terephthalate (PET) bottles into water: Chemical analysis and in vitro toxicity. Food Chemistry 162, 63–71 (2014). 5. Badia, J. D., Gil-Castell, O. & Ribes-Greus, A. Long-term properties and end-of-life of polymers from renewable resources. Polymer Degradation and Stability 137, 35–57 (2017). 6. Marine anthropogenic litter. (Springer, 2015). 7. Bonartsev, A. P. et al. Hydrolytic Degradation of Poly(3-hydroxybutyrate), Polylactide and their Derivatives: Kinetics, Crystallinity, and Surface Morphology. Molecular Crystals and Liquid Crystals 556, 288–300 (2012). 8. Bouwmeester, H., Hollman, P. C. H. & Peters, R. J. B. Potential Health Impact of Environmentally Released Micro- and Nanoplastics in the Human Food Production Chain: Experiences from Nanotoxicology. Environmental Science & Technology 49, 8932–8947 (2015). 9. Ceretti, E. et al. Comparative assessment of genotoxicity of mineral water packed in polyethylene terephthalate (PET) and glass bottles. Water Research 44, 1462–1470 (2010). 10. Chenoweth, M. B. The Toxicity of Sodium Alginate in Cats. Ann Surg 127, 1173–1181 (1948). 11. Chmiel, C. T. & Long, F. A. The Hydrolysis of Esters of Some Substituted Benzoic Acids in Strongly Acid Aqueous Solutions1. J. Am. Chem. Soc. 78, 3326–3330 (1956). 12. Chmiel-Perzyńska, I., Kloc, R., Perzyński, A., Rudzki, S. & Urbańska, E. M. Novel aspect of ketone action: β-hydroxybutyrate increases brain synthesis of kynurenic acid in vitro. Neurotox Res 20, 40–50 (2011). 13. Cinelli, P., Chiellini, E., Gordon, S. H. & Imam, S. H. Characteristics and degradation of hybrid composite films prepared from PVA, starch and lignocellulosics. Macromolecular Symposia 197, 143–156 (2003). 14. Cole, M., Lindeque, P., Halsband, C. & Galloway, T. S. Microplastics as contaminants in the marine environment: A review. Marine Pollution Bulletin 62, 2588–2597 (2011). 15. Corti, A., Muniyasamy, S., Vitali, M., Imam, S. H. & Chiellini, E. Oxidation and biodegradation of polyethylene films containing pro-oxidant additives: Synergistic effects of sunlight exposure, thermal aging and fungal biodegradation. Polymer Degradation and Stability 95, 1106–1114 (2010). 16. Crookes, P. R. & Grierson, D. Ultrastructure of Tomato Fruit Ripening and the Role of Polygalacturonase Isoenzymes in Cell Wall Degradation. Plant Physiology 72, 1088–1093 (1983). 17. De Wilde, B. Biodegradation Testing Protocols. in Degradable Polymers and Materials: Principles and Practice (2nd Edition) (eds. Khemani, K. & Scholz, C.) 1114, 33–43 (American Chemical Society, 2012).
47
18. EFSA Panel on Food Additives and Nutrient Sources added to Food (ANS) et al. Re‐evaluation of propane‐1,2‐diol alginate (E 405) as a food additive. EFSA Journal 16, (2018). 19. Emadian, S. M., Onay, T. T. & Demirel, B. Biodegradation of bioplastics in natural environments. Waste Management 59, 526–536 (2017). 20. Eyenga, I. I., Focke, W. W., Prinsloo, L. C. & Tolmay, A. T. Photodegradation: a solution for the shopping bag “visual pollution” problem? Macromolecular Symposia 178, 139–152 (2002). 21. Farah, S., Anderson, D. G. & Langer, R. Physical and mechanical properties of PLA, and their functions in widespread applications — A comprehensive review. Advanced Drug Delivery Reviews 107, 367–392 (2016). 22. Fattahi, M. J. et al. Preclinical assessment of β-d-mannuronic acid (M2000) as a non-steroidal anti-inflammatory drug. Immunopharmacology and Immunotoxicology 37, 535–540 (2015). 23. Gallo, F. et al. Marine litter plastics and microplastics and their toxic chemicals components: the need for urgent preventive measures. Environmental Sciences Europe 30, (2018). 24. Geyer, R., Jambeck, J. R. & Law, K. L. Production, use, and fate of all plastics ever made. Science Advances 3, e1700782 (2017). 25. Gross, R. A. Biodegradable Polymers for the Environment. Science 297, 803–807 (2002). 26. Gubbels, E. et al. Polyesters. in Ullmann’s Encyclopedia of Industrial Chemistry 1–30 (Wiley-VCH Verlag GmbH & Co. KGaA, 2018). doi:10.1002/14356007.a21_227.pub2 27. Guohua, Z. et al. Water resistance, mechanical properties and biodegradability of methylated-cornstarch/poly(vinyl alcohol) blend film. Polymer Degradation and Stability 91, 703–711 (2006). 28. Haider, T. P., Völker, C., Kramm, J., Landfester, K. & Wurm, F. R. Plastics of the Future? The Impact of Biodegradable Polymers on the Environment and on Society. Angewandte Chemie International Edition (2018). doi:10.1002/anie.201805766 29. Harrison, J. P., Boardman, C., O’Callaghan, K., Delort, A.-M. & Song, J. Biodegradability standards for carrier bags and plastic films in aquatic environments: a critical review. Open Science 5, 171792 (2018). 30. Heathcock, J. & Chapman, J. The Structure of Fresh Desiccated Coconut. Food Structure 2, (1983). 31. Heimowska, A., Krasowska, K. & Rutkowska, M. Degradability of Different Packaging Polymeric Materials in Sea Water. 11 32. Heimowska, A., Morawska, M. & Bocho-Janiszewska, A. Biodegradation of poly(ε-caprolactone) in natural water environments. Polish Journal of Chemical Technology 19, 120–126 (2017). 33. Higgins, T. F. & Borron, S. W. Coma and respiratory arrest after exposure to butyrolactone. J Emerg Med 14, 435–437 (1996). 34. Huang, M.-H., Li, S. & Vert, M. Synthesis and degradation of PLA–PCL–PLA triblock copolymer prepared by successive polymerization of ε-caprolactone and dl-lactide. Polymer 45, 8675–8681 (2004). 35. Huang, Y. et al. Acute toxicity and genotoxicity studies on poly(ɛ-caprolactone)-poly(ethylene glycol)-poly(ɛ-caprolactone) nanomaterials. Mutation Research/Genetic Toxicology and Environmental Mutagenesis 696, 101–106 (2010).
48
36. Ikejima, T. & Inoue, Y. Crystallization behavior and environmental biodegradability of the blend films of poly(3-hydroxybutyric acid) with chitin and chitosan. Carbohydrate Polymers 41, 351–356 (2000). 37. Jenkins, M. J. & Harrison, K. L. The effect of crystalline morphology on the degradation of polycaprolactone in a solution of phosphate buffer and lipase. Polymers for Advanced Technologies 19, 1901–1906 (2008). 38. Julian, T. N., Radebaugh, G. W. & Wisniewski, S. J. Permeability characteristics of calcium alginate films. Journal of Controlled Release 7, 165–169 (1988). 39. Karamanlioglu, M., Preziosi, R. & Robson, G. D. Abiotic and biotic environmental degradation of the bioplastic polymer poly(lactic acid): A review. Polymer Degradation and Stability 137, 122–130 (2017). 40. Karavelidis, V., Karavas, E., Giliopoulos, D., Papadimitriou, S. & Bikiaris, D. Evaluating the effects of crystallinity in new biocompatible polyester nanocarriers on drug release behavior. Int J Nanomedicine 6, 3021–3032 (2011). 41. Kato, Y., Ohta, H. & Tsuchihashi, G. Enzyme-mediated asymmetric hydrolysis of α-benzyloxycarboxylic esters. Tetrahedron Letters 28, 1303–1306 (1987). 42. Kedzierski, M. et al. Threat of plastic ageing in marine environment. Adsorption/desorption of micropollutants. Marine Pollution Bulletin 127, 684–694 (2018). 43. Kershaw, P. J. Biodegradable plastics & marine litter: misconceptions, concerns and impacts on marine environments. (United Nations Environment Programme, 2015). 44. Kim, K.-Y. et al. Association of Low-Dose Exposure to Persistent Organic Pollutants with Global DNA Hypomethylation in Healthy Koreans. Environ Health Perspect 118, 370–374 (2010). 45. Kumar, R., Yakubu, M. K. & Anandjiwala, R. D. Biodegradation of flax fiber reinforced poly lactic acid. (2010). 46. Lahouel, A. et al. Neurobehavioral deficits and brain oxidative stress induced by chronic low dose exposure of persistent organic pollutants mixture in adult female rat. Environ Sci Pollut Res Int 23, 19030–19040 (2016). 47. Lambert, S. & Wagner, M. Environmental performance of bio-based and biodegradable plastics: the road ahead. Chemical Society Reviews 46, 6855–6871 (2017). 48. Lange, J. & Wyser, Y. Recent innovations in barrier technologies for plastic packaging—a review. Packaging Technology and Science 16, 149–158 (2003). 49. Lange, J. & Wyser, Y. Recent innovations in barrier technologies for plastic packaging?a review. Packaging Technology and Science 16, 149–158 (2003). 50. Laycock, B. et al. Lifetime prediction of biodegradable polymers. Progress in Polymer Science 71, 144–189 (2017). 51. Lee, P. & Rogers, M. A. Effect of calcium source and exposure-time on basic caviar spherification using sodium alginate. International Journal of Gastronomy and Food Science 1, 96–100 (2012). 52. Lei, L. et al. Microplastic particles cause intestinal damage and other adverse effects in zebrafish Danio rerio and nematode Caenorhabditis elegans. Science of The Total Environment 619–620, 1–8 (2018). 53. Lithner, D., Larsson, Å. & Dave, G. Environmental and health hazard ranking and assessment of plastic polymers based on chemical composition. Science of The Total Environment 409, 3309–3324 (2011).
49
54. Lopes, C. M. A. & Felisberti, M. I. Composite of low-density polyethylene and aluminum obtained from the recycling of postconsumer aseptic packaging. Journal of Applied Polymer Science 101, 3183–3191 (2006). 55. Maryudi, M., Dewayanto, N., Beg, M. D. H. & Yunus, R. M. COMPARISON OF MANGANESE LAURATE, MANGANESE PALMITATE AND MANGANESE STEARATE ON ACCELERATING DEGRADATION OF HDPE DURING NATURAL WEATHERING. Jurnal Teknologi 79, (2017). 56. Matsushima, Y. et al. [Subchronic oral toxicity study of calcium lactate in F344 rats]. Eisei Shikenjo Hokoku 78–83 (1989). 57. Matta, A. K., Rao, R. U., Suman, K. N. S. & Rambabu, V. Preparation and Characterization of Biodegradable PLA/PCL Polymeric Blends. Procedia Materials Science 6, 1266–1270 (2014). 58. Mirsiaghi, M. et al. Novel Method to Produce a Polysaccharide Gel. (2018). 59. Montuori, P., Jover, E., Morgantini, M., Bayona, J. M. & Triassi, M. Assessing human exposure to phthalic acid and phthalate esters from mineral water stored in polyethylene terephthalate and glass bottles. Food Additives & Contaminants: Part A 25, 511–518 (2008). 60. Mørch, Ý. A., Donati, I. & Strand, B. L. Effect of Ca2+, Ba2+, and Sr2+ on Alginate Microbeads. Biomacromolecules 7, 1471–1480 (2006). 61. Morohoshi, T., Ogata, K., Okura, T. & Sato, S. Molecular Characterization of the Bacterial Community in Biofilms for Degradation of Poly(3-Hydroxybutyrate-co-3-Hydroxyhexanoate) Films in Seawater. Microbes and Environments 33, 19–25 (2018). 62. Mrowiec, B. Plastic pollutants in water environment. Ochrona Srodowiska i Zasobów Naturalnych 28, (2017). 63. Muthuraj, R., Misra, M. & Mohanty, A. K. Biodegradable compatibilized polymer blends for packaging applications: A literature review. Journal of Applied Polymer Science 135, 45726 (2018). 64. Nair, N. R., Sekhar, V. C., Nampoothiri, K. M. & Pandey, A. Biodegradation of Biopolymers. in Current Developments in Biotechnology and Bioengineering 739–755 (Elsevier, 2017). doi:10.1016/B978-0-444-63662-1.00032-4 65. Narancic, T. et al. Biodegradable Plastic Blends Create New Possibilities for End-of-Life Management of Plastics but They Are Not a Panacea for Plastic Pollution. Environmental Science & Technology 52, 10441–10452 (2018). 66. Nazeri, S. et al. Preclinical and pharmacotoxicology evaluation of α-l-guluronic acid (G2013) as a non-steroidal anti-inflammatory drug with immunomodulatory property. Immunopharmacol Immunotoxicol 39, 59–65 (2017). 67. Otterlei, M., Espevik, T., Skjak-Braek, G. & Smidsrod, O. Guluronic acid polymers and use of same for inhibition of cytokine production. (1992). 68. Pablos, J. L. et al. Photodegradation of polyethylenes: Comparative effect of Fe and Ca-stearates as pro-oxidant additives. Polymer Degradation and Stability 95, 2057–2064 (2010). 69. Padiyar, A. & Maheshwari, R. K. NOVEL PHARMACEUTICAL DOSAGE FORM. 1 8, 1–2 (2018). 70. Pantani, R. & Sorrentino, A. Influence of crystallinity on the biodegradation rate of injection-molded poly(lactic acid) samples in controlled composting conditions. Polymer Degradation and Stability 98, 1089–1096 (2013).
50
71. Peng, S.-W. et al. An assessment of the risks of carcinogenicity associated with polyhydroxyalkanoates through an analysis of DNA aneuploid and telomerase activity. Biomaterials 32, 2546–2555 (2011). 72. Posen, I. D., Jaramillo, P., Landis, A. E. & Griffin, W. M. Greenhouse gas mitigation for U.S. plastics production: energy first, feedstocks later. Environ. Res. Lett. 12, 034024 (2017). 73. Pubchem. Ethane-1,2-diol;terephthalic acid. Available at: https://pubchem.ncbi.nlm.nih.gov/compound/16212789. (Accessed: 22nd October 2018) 74. Pubchem. Lactic acid. Available at: https://pubchem.ncbi.nlm.nih.gov/compound/612. (Accessed: 22nd October 2018) 75. Pubchem. Lactide, L-. Available at: https://pubchem.ncbi.nlm.nih.gov/compound/107983. (Accessed: 22nd October 2018) 76. Ragaert, K., Delva, L. & Van Geem, K. Mechanical and chemical recycling of solid plastic waste. Waste Management 69, 24–58 (2017). 77. Rajan, K. P., Thomas, S. P., Gopanna, A. & Chavali, M. Polyhydroxybutyrate (PHB): A Standout Biopolymer for Environmental Sustainability. in Handbook of Ecomaterials (eds. Martínez, L. M. T., Kharissova, O. V. & Kharisov, B. I.) 1–23 (Springer International Publishing, 2018). doi:10.1007/978-3-319-48281-1_92-1 78. Revel, M., Châtel, A. & Mouneyrac, C. Micro(nano)plastics: A threat to human health? Current Opinion in Environmental Science & Health 1, 17–23 (2018). 79. Rochman, C. M., Hoh, E., Hentschel, B. T. & Kaye, S. Long-Term Field Measurement of Sorption of Organic Contaminants to Five Types of Plastic Pellets: Implications for Plastic Marine Debris. Environ. Sci. Technol. 47, 1646–1654 (2013). 80. Rochman, C. M. et al. Anthropogenic debris in seafood: Plastic debris and fibers from textiles in fish and bivalves sold for human consumption. Scientific Reports 5, (2015). 81. Roulin, A. & Jaccoud, M. B. Packaging laminate with gas and aroma barrier properties. (1996). 82. Rydz, J. Chapter 14 - Present and Future of Biodegradable Polymers for Food Packaging Applications. 37 83. Saad, B. et al. Characterization of the cell response of cultured macrophages and fibroblasts to particles of short-chain poly[(R)-3-hydroxybutyric acid]. J. Biomed. Mater. Res. 30, 429–429 (1996). 84. Santana, A. A. & Kieckbusch, T. G. Physical evaluation of biodegradable films of calcium alginate plasticized with polyols. Brazilian Journal of Chemical Engineering 30, 835–845 (2013). 85. Sashiwa, H., Fukuda, R., Okura, T., Sato, S. & Nakayama, A. Microbial Degradation Behavior in Seawater of Polyester Blends Containing Poly(3-hydroxybutyrate-co-3-hydroxyhexanoate) (PHBHHx). Marine Drugs 16, 34 (2018). 86. Sax, L. Polyethylene Terephthalate May Yield Endocrine Disruptors. Environmental Health Perspectives 118, 445–448 (2010). 87. Scheirs, J. Additives for the Modification of Poly(Ethylene Terephthalate) to Produce Engineering-Grade Polymers. in Modern Polyesters: Chemistry and Technology of Polyesters and Copolyesters 495–540 (John Wiley & Sons, Ltd, 2004). doi:10.1002/0470090685.ch14 88. Segale, L., Giovannelli, L., Mannina, P. & Pattarino, F. Calcium Alginate and Calcium Alginate-Chitosan Beads Containing Celecoxib Solubilized in a Self-Emulsifying Phase. Scientifica (2016). doi:10.1155/2016/5062706
51
89. Sekiguchi, T. et al. Biodegradation of aliphatic polyesters soaked in deep seawaters and isolation of poly(ɛ-caprolactone)-degrading bacteria. Polymer Degradation and Stability 96, 1397–1403 (2011). 90. Shah, A. A., Hasan, F., Hameed, A. & Ahmed, S. Biological degradation of plastics: A comprehensive review. Biotechnology Advances 26, 246–265 (2008). 91. Singh, R. P., Pandey, J. K., Rutot, D., Degée, P. & Dubois, P. Biodegradation of poly(ε-caprolactone)/starch blends and composites in composting and culture environments: the effect of compatibilization on the inherent biodegradability of the host polymer. Carbohydrate Research 338, 1759–1769 (2003). 92. Siracusa, V., Rocculi, P., Romani, S. & Rosa, M. D. Biodegradable polymers for food packaging: a review. Trends in Food Science & Technology 19, 634–643 (2008). 93. Smith, M. et al. Microplastics in seafood and implications for human health. Current Environmental Health Reports 5, 375-386 (2018). 94. Subramaniam, M., Sharma, S., Gupta, A. & Abdullah, N. Enhanced degradation properties of polypropylene integrated with iron and cobalt stearates and its synthetic application. Journal of Applied Polymer Science 135, 46028 (2018). 95. Tang, X.-Q. et al. A Novel Mechanism of Formaldehyde Neurotoxicity: Inhibition of Hydrogen Sulfide Generation by Promoting Overproduction of Nitric Oxide. PLoS ONE 8, e54829 (2013). 96. Tang, X. & Alavi, S. Recent advances in starch, polyvinyl alcohol based polymer blends, nanocomposites and their biodegradability. Carbohydrate Polymers 85, 7–16 (2011). 97. Tanjore, D. et al. Analysis and fermentation base-lining to validate cyanobacterial-based polysaccharide production as a viable feedstock for bio-product development.: (2017). 98. Tholstrup, T. Influence of stearic acid on hemostatic risk factors in humans. Lipids 40, 1229–1235 (2005). 99. Tokiwa, Y., Calabia, B., Ugwu, C. & Aiba, S. Biodegradability of Plastics. International Journal of Molecular Sciences 10, 3722–3742 (2009). 100. Tokiwa, Y. & Jarerat, A. Microbial degradation of aliphatic polyesters. Macromolecular Symposia 201, 283–290 (2003). 101. US EPA, O. Persistent Organic Pollutants: A Global Issue, A Global Response. US EPA (2014). Available at: https://www.epa.gov/international-cooperation/persistent-organic-pollutants-global-issue-global-response. (Accessed: 12th December 2018) 102. Vandewijngaarden, J. et al. Gas Permeability Properties of Poly(3-hydroxybutyrate-co-3-hydroxyhexanoate). Journal of Polymers and the Environment 22, 501–507 (2014). 103. Wang, S. et al. Biodegradation of Poly(3-hydroxybutyrate- co -3-hydroxyhexanoate) Plastic under Anaerobic Sludge and Aerobic Seawater Conditions: Gas Evolution and Microbial Diversity. Environmental Science & Technology 52, 5700–5709 (2018). 104. Wang, X.-W. et al. Degradability comparison of poly(butylene adipate terephthalate) and its composites filled with starch and calcium carbonate in different aquatic environments. Journal of Applied Polymer Science 136, 46916 (2019). 105. Wang, X.-L., Yang, K.-K. & Wang, Y.-Z. Properties of Starch Blends with Biodegradable Polymers. Journal of Macromolecular Science, Part C: Polymer Reviews 43, 385–409 (2003).
52
106. Weber, A., Scherer, C., Brennholt, N., Reifferscheid, G. & Wagner, M. PET microplastics do not negatively affect the survival, development, metabolism and feeding activity of the freshwater invertebrate Gammarus pulex. Environmental Pollution 234, 181–189 (2018). 107. Whiteley, M. J. & Pan, W.-P. A study of the flammability of chlorinated polyethylene under pyrolysis conditions. Thermochimica Acta 166, 27–39 (1990). 108. Yates, M. R. & Barlow, C. Y. Life cycle assessments of biodegradable, commercial biopolymers—A critical review. Resources, Conservation and Recycling 78, 54–66 (2013). 109. Yeh, S.-P., Chang, C.-A., Chang, C.-Y., Liu, C.-H. & Cheng, W. Dietary sodium alginate administration affects fingerling growth and resistance to Streptococcus sp. and iridovirus, and juvenile non-specific immune responses of the orange-spotted grouper, Epinephelus coioides. Fish & Shellfish Immunology 25, 19–27 (2008). 110. Fact Sheet: Plastics in the Ocean. Earth Day Network (2018). 111. EPA: U.S. plastics recycling rate declines. Plastics Recycling Update (2018). 112. Untitled document. Google Docs (2018). Available at: https://docs.google.com/document/u/1/d/1r97jYBBBQPTIgSkMA5gFqUBmsKA_1kMQNhcJxgvcNWw/edit?usp=embed_facebook. (Accessed: 10th December 2018) 113. (3) (PDF) The effect of beverage storage packets (Tetra Pak ) waste on mechanical properties of wood-plastic composites. ResearchGate Available at: https://www.researchgate.net/publication/286512347_The_effect_of_beverage_storage_packets_Tetra_Pak_waste_on_mechanical_properties_of_wood-plastic_composites. (Accessed: 13th December 2018) 114. Alimentary Experiments: How Science Got into Our Kitchens | Journal of Management and Innovation. 115. Animal Feeding Operations | NRCS. Available at: https://www.nrcs.usda.gov/wps/portal/nrcs/main/national/plantsanimals/livestock/afo/. (Accessed: 15th November 2018) 116. CALCIUM ALGINATE - National Library of Medicine HSDB Database. Available at: https://toxnet.nlm.nih.gov/cgi-bin/sis/search/a?dbs+hsdb:@term+@DOCNO+1911. (Accessed: 22nd October 2018) 117. CBSM/public/world.lasso. Available at: http://www.cbsm.com/public/world.lasso. (Accessed: 12th December 2018) 118. Chondrogenic differentiation of adipose-derived adult stem cells in agarose, alginate, and gelatin scaffolds - ScienceDirect. Available at: https://www.sciencedirect.com/science/article/pii/S0142961203008834. (Accessed: 22nd October 2018) 119. Datei:TBA packaging components.gif. Wikipedia 120. Evaluation of Biodegradation-Promoting Additives for Plastics - Environmental Science & Technology (ACS Publications). Available at: https://pubs.acs.org/doi/full/10.1021/es504258u?src=recsys. (Accessed: 5th September 2018) 121. Leaching Process | LEAF | Vanderbilt University. Available at: https://www.vanderbilt.edu/leaching/leaching-process/. (Accessed: 13th December 2018) 122. Persistent Organic Pollutants: A Global Issue, A Global Response | International Cooperation | US EPA. Available at: https://www.epa.gov/international-cooperation/persistent-organic-pollutants-global-issue-global-response. (Accessed: 13th December 2018)
53
123. PLA and PHA Biodegradation in the Marine Environment. 38 124. SiOx and SiOxCzHw mono- and multi-layer deposits for improved polymer oxygen and water vapor barrier properties - ScienceDirect. Available at: https://www.sciencedirect.com/science/article/pii/S0376738815303409. (Accessed: 6th September 2018) 125. Sucrose as a Crosslinking Modifier for the Preparation of Calcium Alginate Films via External Gelation - SciAlert Responsive Version. doi:10.3923/jas.2012.727.735 126. Swelling and biocompatibility of sodium alginate/poly(γ‐glutamic acid) hydrogels - Huang - 2010 - Polymers for Advanced Technologies - Wiley Online Library. Available at: https://onlinelibrary.wiley.com/doi/pdf/10.1002/pat.1466. (Accessed: 3rd December 2018) 127. TOXNET. Available at: https://toxnet.nlm.nih.gov/cgi-bin/sis/search2/f?./temp/~jsCIch:1. (Accessed: 22nd October 2018) 128. COSMOS database. Available from: http://www.cosmostox.eu/what/databases/. 129. Vega Hub. Available from: https://www.vegahub.eu/about-vegahub/ 130. Chemicals, G. F. S. GreenScreen® For Safer Chemicals | GreenScreen For Safer Chemicals®….
Available at: https://www.greenscreenchemicals.org. (Accessed: 4th November 2018).