Embed Size (px)
Citation preview
Modeling Concurrent Engineering to Improve Product Development Performance
ALEMU MOGES BELAY
ACTA WASAENSIA 289INDUSTRIAL MANAGEMENT 31
A System Dynamic Approach
Reviewers Professor Roger Jianxin Jiao The Woodruff School of Mechanical Engineering Georgia Institute of Technology 813 Ferst Drive, NW Atlanta, Georgia 30332–0405 USA Professor Daniel Braha University of Massachusetts Dartmouth Charlton College of Business 285 Old Westport Road North Dartmouth, MA 02747–2300 USA
III
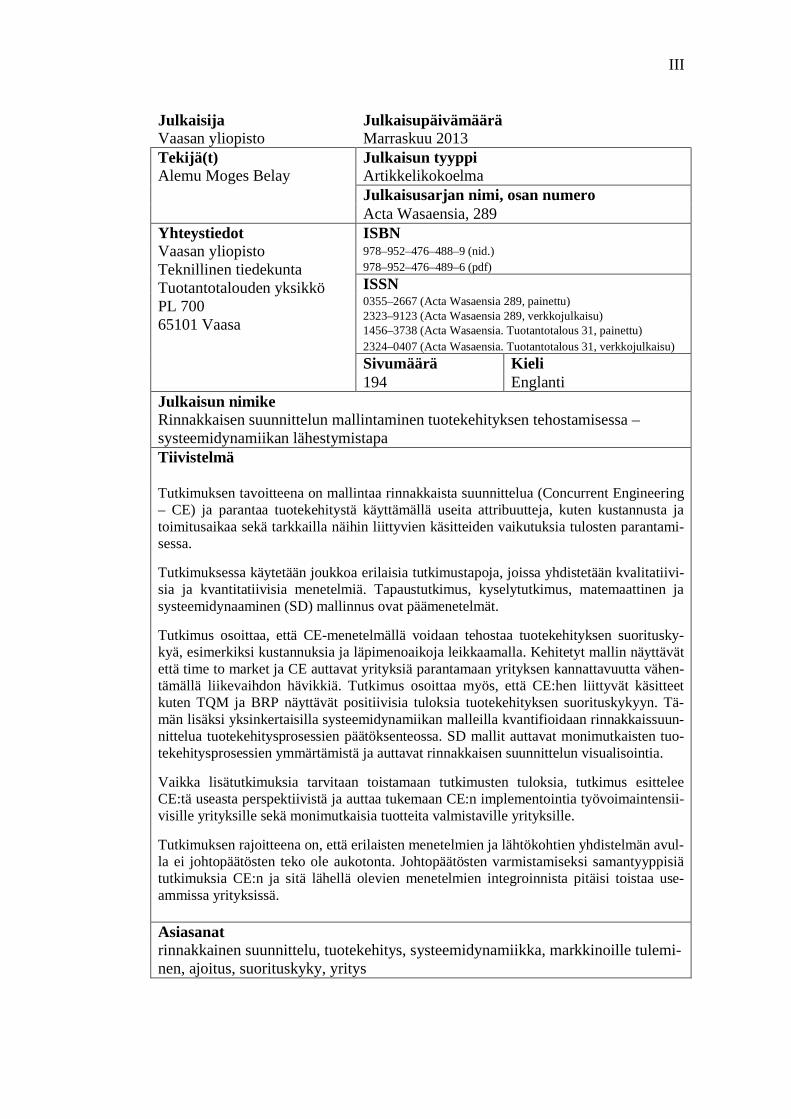
Julkaisija Julkaisupäivämäärä Vaasan yliopisto Marraskuu 2013 Tekijä(t) Julkaisun tyyppi Alemu Moges Belay Artikkelikokoelma
Julkaisusarjan nimi, osan numero Acta Wasaensia, 289
Yhteystiedot ISBN Vaasan yliopisto Teknillinen tiedekunta Tuotantotalouden yksikkö PL 700 65101 Vaasa
978–952–476–488–9 (nid.) 978–952–476–489–6 (pdf) ISSN 0355–2667 (Acta Wasaensia 289, painettu) 2323–9123 (Acta Wasaensia 289, verkkojulkaisu) 1456–3738 (Acta Wasaensia. Tuotantotalous 31, painettu) 2324–0407 (Acta Wasaensia. Tuotantotalous 31, verkkojulkaisu) Sivumäärä Kieli 194 Englanti
Julkaisun nimike Rinnakkaisen suunnittelun mallintaminen tuotekehityksen tehostamisessa – systeemidynamiikan lähestymistapa Tiivistelmä Tutkimuksen tavoitteena on mallintaa rinnakkaista suunnittelua (Concurrent Engineering – CE) ja parantaa tuotekehitystä käyttämällä useita attribuutteja, kuten kustannusta ja toimitusaikaa sekä tarkkailla näihin liittyvien käsitteiden vaikutuksia tulosten parantami-sessa. Tutkimuksessa käytetään joukkoa erilaisia tutkimustapoja, joissa yhdistetään kvalitatiivi-sia ja kvantitatiivisia menetelmiä. Tapaustutkimus, kyselytutkimus, matemaattinen ja systeemidynaaminen (SD) mallinnus ovat päämenetelmät. Tutkimus osoittaa, että CE-menetelmällä voidaan tehostaa tuotekehityksen suoritusky-kyä, esimerkiksi kustannuksia ja läpimenoaikoja leikkaamalla. Kehitetyt mallin näyttävät että time to market ja CE auttavat yrityksiä parantamaan yrityksen kannattavuutta vähen-tämällä liikevaihdon hävikkiä. Tutkimus osoittaa myös, että CE:hen liittyvät käsitteet kuten TQM ja BRP näyttävät positiivisia tuloksia tuotekehityksen suorituskykyyn. Tä-män lisäksi yksinkertaisilla systeemidynamiikan malleilla kvantifioidaan rinnakkaissuun-nittelua tuotekehitysprosessien päätöksenteossa. SD mallit auttavat monimutkaisten tuo-tekehitysprosessien ymmärtämistä ja auttavat rinnakkaisen suunnittelun visualisointia. Vaikka lisätutkimuksia tarvitaan toistamaan tutkimusten tuloksia, tutkimus esittelee CE:tä useasta perspektiivistä ja auttaa tukemaan CE:n implementointia työvoimaintensii-visille yrityksille sekä monimutkaisia tuotteita valmistaville yrityksille. Tutkimuksen rajoitteena on, että erilaisten menetelmien ja lähtökohtien yhdistelmän avul-la ei johtopäätösten teko ole aukotonta. Johtopäätösten varmistamiseksi samantyyppisiä tutkimuksia CE:n ja sitä lähellä olevien menetelmien integroinnista pitäisi toistaa use-ammissa yrityksissä. Asiasanat rinnakkainen suunnittelu, tuotekehitys, systeemidynamiikka, markkinoille tulemi-nen, ajoitus, suorituskyky, yritys

V
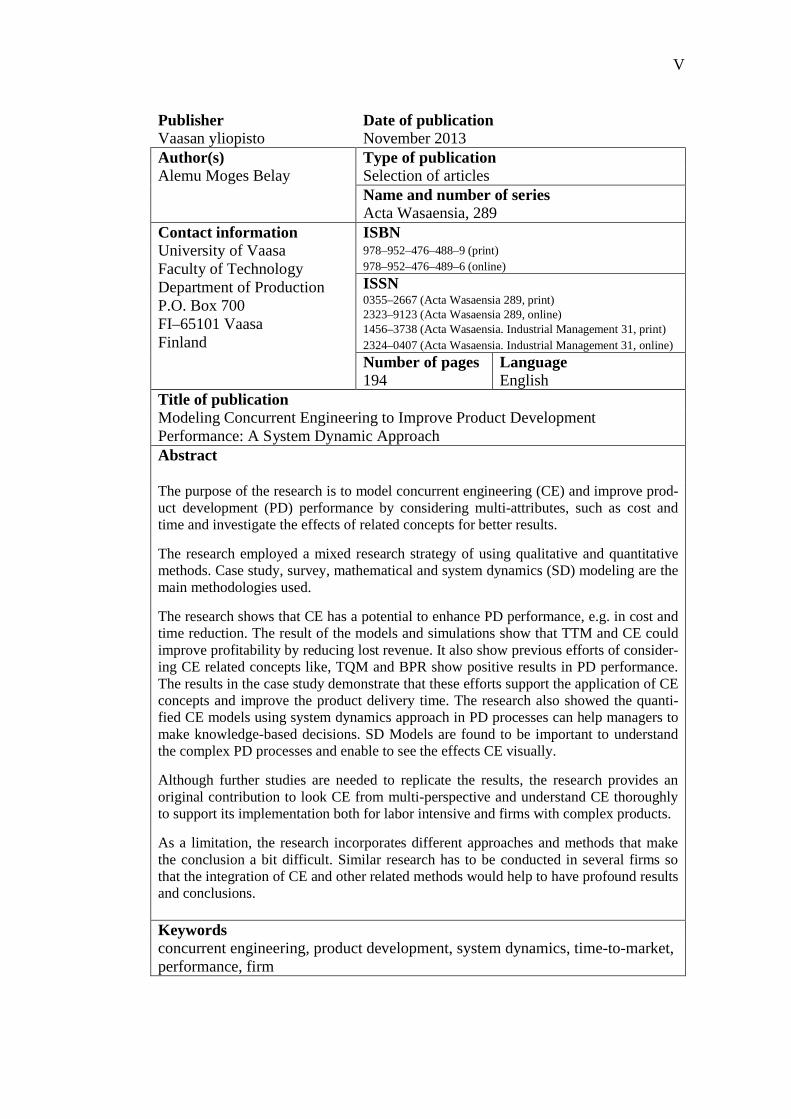
Publisher Date of publication Vaasan yliopisto November 2013 Author(s) Type of publication Alemu Moges Belay Selection of articles
Name and number of series Acta Wasaensia, 289
Contact information ISBN University of Vaasa Faculty of Technology Department of Production P.O. Box 700 FI–65101 Vaasa Finland
978–952–476–488–9 (print) 978–952–476–489–6 (online) ISSN 0355–2667 (Acta Wasaensia 289, print) 2323–9123 (Acta Wasaensia 289, online) 1456–3738 (Acta Wasaensia. Industrial Management 31, print) 2324–0407 (Acta Wasaensia. Industrial Management 31, online) Number of pages Language 194 English
Title of publication Modeling Concurrent Engineering to Improve Product Development Performance: A System Dynamic Approach Abstract The purpose of the research is to model concurrent engineering (CE) and improve prod-uct development (PD) performance by considering multi-attributes, such as cost and time and investigate the effects of related concepts for better results. The research employed a mixed research strategy of using qualitative and quantitative methods. Case study, survey, mathematical and system dynamics (SD) modeling are the main methodologies used. The research shows that CE has a potential to enhance PD performance, e.g. in cost and time reduction. The result of the models and simulations show that TTM and CE could improve profitability by reducing lost revenue. It also show previous efforts of consider-ing CE related concepts like, TQM and BPR show positive results in PD performance. The results in the case study demonstrate that these efforts support the application of CE concepts and improve the product delivery time. The research also showed the quanti-fied CE models using system dynamics approach in PD processes can help managers to make knowledge-based decisions. SD Models are found to be important to understand the complex PD processes and enable to see the effects CE visually. Although further studies are needed to replicate the results, the research provides an original contribution to look CE from multi-perspective and understand CE thoroughly to support its implementation both for labor intensive and firms with complex products. As a limitation, the research incorporates different approaches and methods that make the conclusion a bit difficult. Similar research has to be conducted in several firms so that the integration of CE and other related methods would help to have profound results and conclusions. Keywords concurrent engineering, product development, system dynamics, time-to-market, performance, firm

VII
ACKNOWLEDGEMENT
I am grateful to many people who contributed to this dissertation in innumerable ways. It is my pleasure to thank all of them.
First and foremost, I would like to thank my supervisors Prof. Petri Helo and Prof. Josu Takala for your unreserved support, encouragement, constructive criti-cisms during my PhD study. I appreciate the generosity with your time, financial support, advice, providing data, and references, to name a few of your contribu-tions. Without your support, this dissertation would not have been possible.
My deepest gratitude also goes to Prof. Tauno Kekäle who gave me this oppor-tunity to join the postgraduate program under his supervision. When I came first to University of Vaasa, your hospitality, support, and advice were excellent. You opened up my eyes how to do good research and write scientific articles. It is my privilege to say that nothing is impossible with you and thank you so much.
I would like to thank all department staff and researchers; Prof. Jussi Kantola, Prof. Tarja Ketola, Adjunct Prof. Marja Naaranoja, Dr. Päivi Haapalainen, Dr. Yohanes Kristianto, Dr. Ahm Shamsuzzoha, Dr. Mikeal Ehrs, Harri Jaskari, An-na-Maija Wörlin; Ulla Laakkonen, Tarja Salo, for your support and interesting discussions in different issues for the last few years.
Indeed, I gratefully acknowledge the funding sources that made my Ph.D. work possible. I was funded by the University of Vaasa foundation for three years. My work was also supported by different projects in the department. Hereby, I would like to thank again my supervisors and all the department staff for facilitating and writing a recommendation to get such competitive grant.
I would like to appreciate and thank all companies, institutions and employees who involved in this dissertation in one way or another. I am honoured to thank Norwegian University of Science and Technology (NTNU) for allowing me to conduct my research partially and took advanced courses in an exchange pro-gram. Special thank for Prof. Bjorn Andersen, Prof. Torgeir Welo and Prof. As-bjorn Rolstadas. Thank you all my friends who make my stay enjoyable in Trondheim, Norway. Thank you all ABB Motors managers and employees (Mr. Mikko Helinko, Sinikka Sauna-aho) for allowing to work and research.
My PhD fellows have contributed immensely to my personal and professional career and time at University of Vaasa. Industrial management group in general has been a source of friendships as well as good advice and collaboration. I am especially grateful for Rayko Toshev, Richard Addo-Tenkorang, Anna Ry-maszewska, Maria Tuuri, Emmanuel Ndziba, Liangdong Zhu, Nelson Abila, Ba-
VIII
da Hakeem, Alireza Aslani, Mikko Suorsa, Max Finne (Alto University), among others. Thank you for your friendship and good discussions that we have had.
My time at University of Vaasa was made enjoyable in large part due to many friends and groups that became a part of my life. I am grateful for the time spent with some social and sport groups, Ethio-Vaasa, Vaasa international football club, and FINOY. I would like to extend my heartfelt thanks for few good and blessed people I met in Vaasa, Arja Sigfrids (Ethiopians mam in Vaasa, Finland) and Helen Nurmulahti, thank you for your friendships and assistance.
All my co-authors deserve appreciation for your valuable inputs to complete my dissertation. Mr. Fentahun Moges, your help in all aspects was great and the in-formation and data you provided was relevant, thanks a lot.
Lastly, special thanks for my parents and relatives who raised me with love and support in all my careers. I am honored to dedicate this dissertation for my father Moges Belay and uncle Yilma Belay who were my inspiration all the time to join higher education. Thank you so much and I have kept my promise at the moment and hope my younger brothers and sisters will learn from this. I also extend my deepest heartfelt thanks to Zelalem Zewdu and his lovely family for your marvel-ous friendships and brotherhood.
Special Acknowledgments:
For publishers: I would like to acknowledge all publishers which are included in this dissertation. List of publishers without regular order are: inderscience pub-lishers, IEEE explore, Springler London, Product development and management association (PDMA) and The Canadian Center of Science and Education (CCSE). All original publications are listed with full details in the appendix.
For reviewers: I would like to extend my gratitude for all reviewers involved in this research process. Special thank for Prof. Dan Braha from (University of Massachusetts Dartmouth, New England Complex Systems Institute, and USA) and Prof. Roger J. Jiao, Georgia Institute of Technology, department of Mechani-cal Engineering, USA for their excellent recommendation and comments.
THANK YOU GOD!
Kiitos!
Alemu Moges Belay
Vaasa, 2013
IX
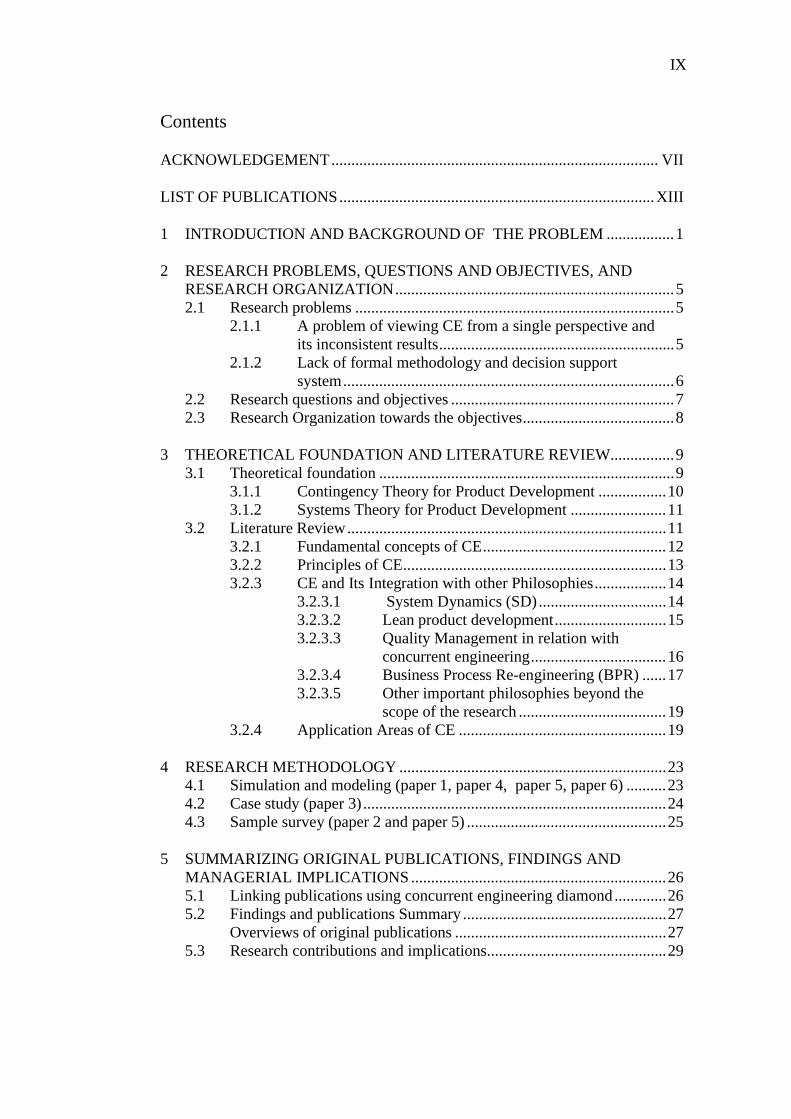
Contents
ACKNOWLEDGEMENT .................................................................................. VII
LIST OF PUBLICATIONS ............................................................................... XIII
1 INTRODUCTION AND BACKGROUND OF THE PROBLEM ................. 1
2 RESEARCH PROBLEMS, QUESTIONS AND OBJECTIVES, AND RESEARCH ORGANIZATION ...................................................................... 5 2.1 Research problems ................................................................................ 5
2.1.1 A problem of viewing CE from a single perspective and its inconsistent results ........................................................... 5
2.1.2 Lack of formal methodology and decision support system ................................................................................... 6
2.2 Research questions and objectives ........................................................ 7 2.3 Research Organization towards the objectives ...................................... 8
3 THEORETICAL FOUNDATION AND LITERATURE REVIEW................ 9 3.1 Theoretical foundation .......................................................................... 9
3.1.1 Contingency Theory for Product Development ................. 10 3.1.2 Systems Theory for Product Development ........................ 11
3.2 Literature Review ................................................................................ 11 3.2.1 Fundamental concepts of CE .............................................. 12 3.2.2 Principles of CE .................................................................. 13 3.2.3 CE and Its Integration with other Philosophies .................. 14
3.2.3.1 System Dynamics (SD) ................................ 14 3.2.3.2 Lean product development ............................ 15 3.2.3.3 Quality Management in relation with
concurrent engineering .................................. 16 3.2.3.4 Business Process Re-engineering (BPR) ...... 17 3.2.3.5 Other important philosophies beyond the
scope of the research ..................................... 19 3.2.4 Application Areas of CE .................................................... 19
4 RESEARCH METHODOLOGY ................................................................... 23 4.1 Simulation and modeling (paper 1, paper 4, paper 5, paper 6) .......... 23 4.2 Case study (paper 3) ............................................................................ 24 4.3 Sample survey (paper 2 and paper 5) .................................................. 25
5 SUMMARIZING ORIGINAL PUBLICATIONS, FINDINGS AND MANAGERIAL IMPLICATIONS ................................................................ 26 5.1 Linking publications using concurrent engineering diamond ............. 26 5.2 Findings and publications Summary ................................................... 27
Overviews of original publications ..................................................... 27 5.3 Research contributions and implications ............................................. 29
X
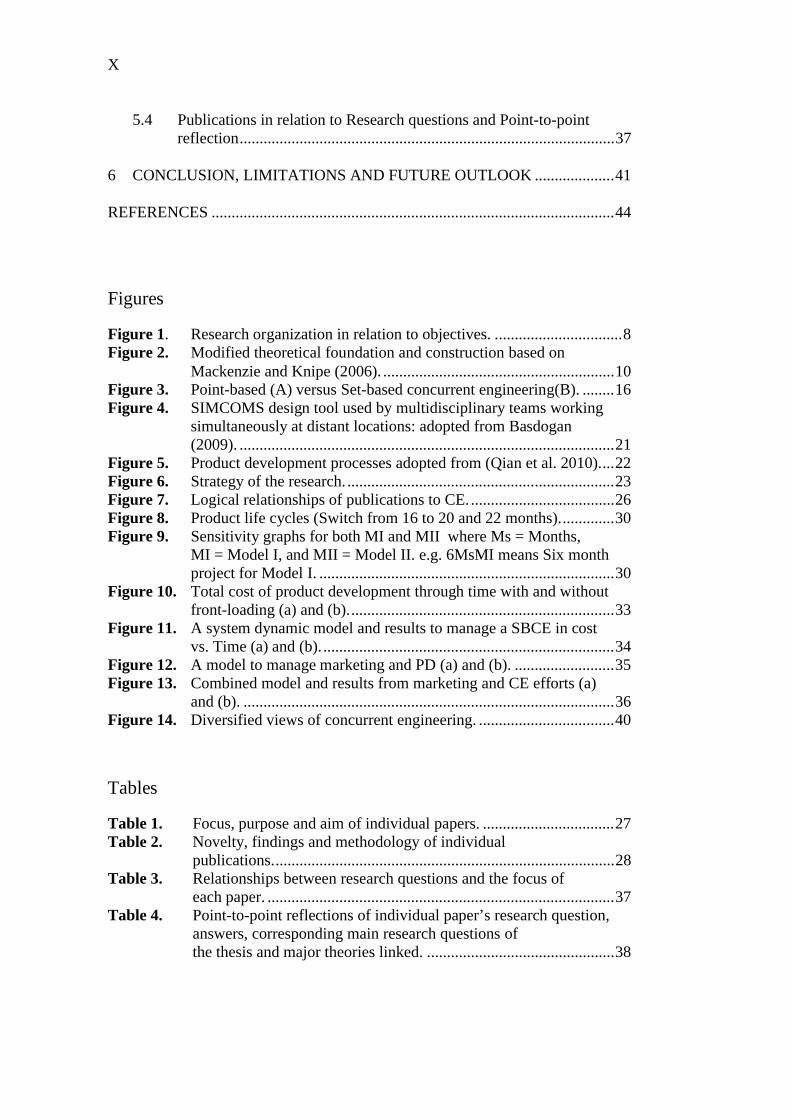
5.4 Publications in relation to Research questions and Point-to-point reflection .............................................................................................. 37
6 CONCLUSION, LIMITATIONS AND FUTURE OUTLOOK .................... 41
REFERENCES ..................................................................................................... 44
Figures
Figure 1. Research organization in relation to objectives. ................................ 8 Figure 2. Modified theoretical foundation and construction based on
Mackenzie and Knipe (2006). .......................................................... 10 Figure 3. Point-based (A) versus Set-based concurrent engineering(B). ........ 16 Figure 4. SIMCOMS design tool used by multidisciplinary teams working
simultaneously at distant locations: adopted from Basdogan (2009). .............................................................................................. 21
Figure 5. Product development processes adopted from (Qian et al. 2010). ... 22 Figure 6. Strategy of the research. ................................................................... 23 Figure 7. Logical relationships of publications to CE. .................................... 26 Figure 8. Product life cycles (Switch from 16 to 20 and 22 months). ............. 30 Figure 9. Sensitivity graphs for both MI and MII where Ms = Months,
MI = Model I, and MII = Model II. e.g. 6MsMI means Six month project for Model I. .......................................................................... 30
Figure 10. Total cost of product development through time with and without front-loading (a) and (b). .................................................................. 33
Figure 11. A system dynamic model and results to manage a SBCE in cost vs. Time (a) and (b). ......................................................................... 34
Figure 12. A model to manage marketing and PD (a) and (b). ......................... 35 Figure 13. Combined model and results from marketing and CE efforts (a)
and (b). ............................................................................................. 36 Figure 14. Diversified views of concurrent engineering. .................................. 40
Tables
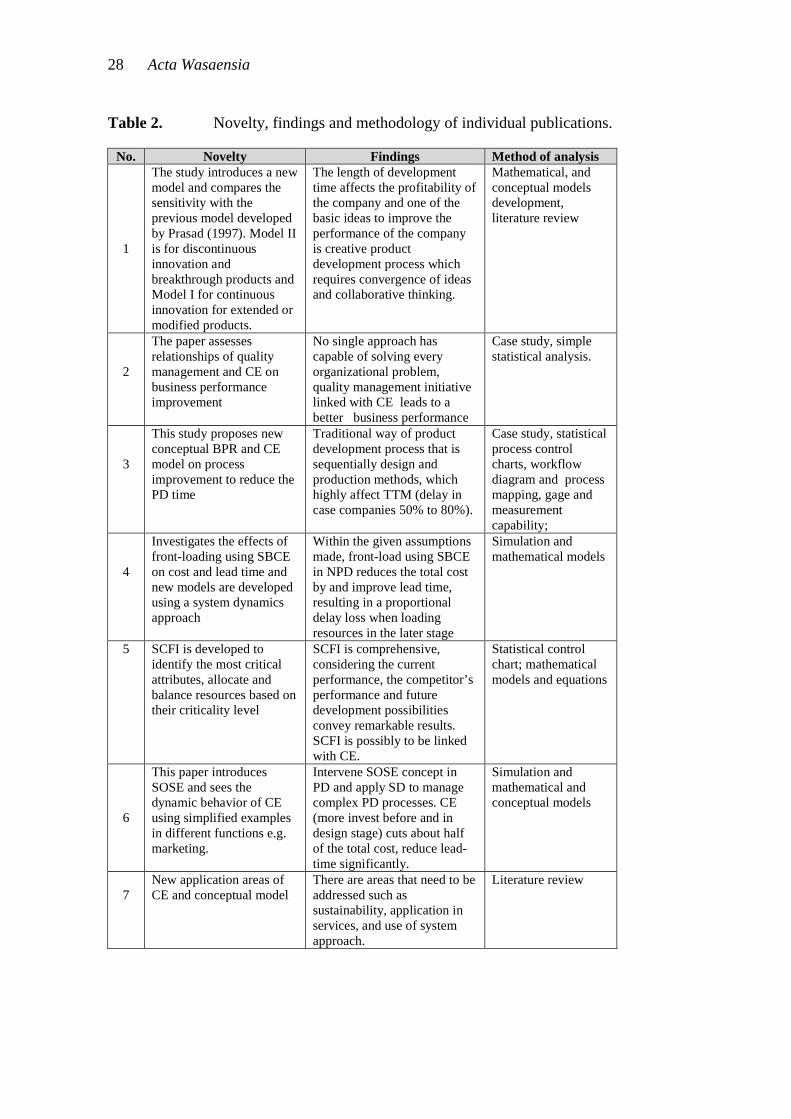
Table 1. Focus, purpose and aim of individual papers. ................................. 27 Table 2. Novelty, findings and methodology of individual
publications. ..................................................................................... 28 Table 3. Relationships between research questions and the focus of
each paper. ....................................................................................... 37 Table 4. Point-to-point reflections of individual paper’s research question,
answers, corresponding main research questions of the thesis and major theories linked. ............................................... 38
XI
Abbreviations BPR Business process re-engineering CE Concurrent engineering LPD Lean product development NPD New product development PD Product development SCFI Scaled critical factor index QFD Quality function deployment Ql. Qualitative Qn. Quantitative SD System dynamics SOSE Systems of system engineering TQM Total quality management TTM Time-to-market

XIII
LIST OF PUBLICATIONS 1. Belay, Alemu Moges, Kekäle, Tauno & Helo, Petri (2011). Time-to-market
and concurrent engineering in product development processes. International Journal of Innovation and Learning 10:1, 60–84. ......................................... 53
2. Belay, Alemu Moges, Takala, Josu, Helo, Petri & Kasie, Fentahun Moges
(2011). Effects of quality management practices and concurrent engineering in business performance. International Journal of Business and Management 6:3. ................................................................................................................. 79
3. Belay, Alemu Moges, Helo, Petri, Takala, Josu & Welo, Torgeir (2013).
Considering BPR and CE for faster product delivery: A case study in manu-facturing firms. International Journal of Productivity and Quality Manage-ment (accepted and forthcoming). ................................................................. 99
4. Belay, Alemu Moges, Welo, Torgeir & Helo, Petri (2012). Improving Prod-
uct Development Performance by Front-loading: A System Dynamics Ap-proach. 36th Product Innovation Management Conference, Research Forum PDMA, Florida, October 20–24, 2012, USA. ............................................. 127
5. Belay, Alemu Moges, Takala, Josu, Toshev, Rayko & Andersen, Bjørn
(2013). Scaled critical factor index for optimal resource allocation in service and lean construction. Industrial Journal of Sustainable Economy 5:3. ..... 143
6. Belay, Alemu Moges, Helo, Petri & Welo, Torgeir (2012). Systems of System
Thinking in Product Development: A System Dynamics Approach. IEEE SOSE 2012 7th International Conference on System of Systems Engineering Italy Genoa, 16–19 July. ............................................................................. 165
7. Belay, Alemu Moges, Helo, Petri & Kasie, Fentahun Moges (2011). Con-
current Engineering Yesterday, Today and Tomorrow. The 18th ISPE Inter-national Conference on Concurrent Engineering, CE2011 Boston, MIT, USA. ............................................................................................................ 173
Publications 1, 3 and 5 reprinted with kind permission of Inderscience Enter-prises Ltd. Publication 6 © 2012 IEEE. Reprinted with kind permission of IEEE.

1 INTRODUCTION AND BACKGROUND OF THE PROBLEM
The challenges in today’s product development (PD) business are ever changing customers’ needs, higher product complexity, enhanced global competition, re-duced product life cycle, technological advancement and larger numbers of activi-ties and amounts of information to coordinate shortage of skilled personnel, etc. Some of the key concepts are studied by several researchers for e.g. Browning et al. (2006) studied concepts that are attributed to concurrent engineering (CE) and integrated product and process development.
To tackle the aforementioned challenges, several approaches such as, lean, CE, TQM, BPR, Six-sigma, etc., have been introduced few decades ago. The general objectives of these improvement methods are to satisfy customers in their prod-ucts with several performance dimensions, such as, high degree of quality, flexi-bility, and low-cost and short delivery times. However, these approaches have their own failure and success stories in real world industrial practices. Irrespective of their differences in their principles, these methods have still potential to im-prove firms’ product development performance. For instance, recently, an Indian two wheeler automotive companies realized the benefits of CE and obtained a positive impact on design, development and introduction of new product (Ramana 2012), automotive industry reduced cycle time from 5-8 years to 3 years and less (Landeghem 2000). CIGNA Corporation successfully completed a number of BPR projects (Caron et al. 1994, and Ozcelik 2010) and Black and Revere (2006) showed how six-sigma improves quality and considers it as a powerful expansion of TQM.
On the other hand, there are several critics and failed records while implementing those product development performance improvement methods. For instance, Kleiner (2000), and Grover and Kettinger (2000) showed 70% of BPR initiatives actually failed and products delivered less than it had been promised. Recently, Ozcelik, (2010) found that functionally focused BPR projects have positive rela-tionship with firm performance than those with a cross-functional, unlike CE. This shows potential failure risk of BPR projects beyond a certain level of scope. When we look in to CE, in spite of its successes in some firms, there are proven difficulties for many (Ford and Sterman 2003; Moffat 1998; Wheelwright and Clark 1992). The failure arises partially due to cycle time reduction through con-current development that increases process and organizational complexity (Krish-nan et al. 1997). Sebastianelli and Tamimi (2003) studied the obstacles associated with managing the TQM transformation and they identified inadequate resources as the main factor.
2 Acta Wasaensia
Having understood these improvement methods with their successes and failures, it is important to overcome the challenges by developing a better approach that would help firms to be profitable, competitive and sustain in their performances. To do this, using or combining more than one process improvement approaches may require. According to Najmi and Ip-Shing (2002), the process approach at the heart of TQM is fundamental to embedding CE in new product development and application of CE through TQM is illustrated practically in industries. The empirical research by Sun and Zhoa (2010) show an improvement signals by link-ing CE into TQM initiatives and they obtained a positive relationship between TQM and fast NPD. CE and BPR can be effective in improving the performance of a company, particularly for those that rely on time and responsiveness (Brooks, 1996). This shows that there is no single universal solution for every organization or company while managing the product development processes. It is obvious that combining different approaches may require additional resources and bring its own challenges. Therefore, it is significant to use a systematic approach to gain the better result from individual improvement methods so that firms can achieve time-to-market.
Many industries have been working to change the balance of competition by time-based strategies and able to improve time-to-market through new product man-agement systems and practices. The changing market conditions and international competitiveness are making the time-to-market a fast shrinking target (Prasad 1997). Innovative capability is influenced by efforts done on new technology de-velopment. In environments where technologies change frequently and rapidly, firms need to make innovations in order to sustain their performance (Akman and Yilmaz 2008). However, it is so far unclear what type of innovation for what types of products fits. Even though the complexity of the products increases, the time to produce and introduction to market become short. Companies which im-plement successfully time-to-market strategy reduce the waste of development and improve the success of new product by targeting to customer needs. Custom-er needs and requirements could be understood and be incorporated in new prod-ucts by integrating all functions from the beginning of PD process.
Koskela (2007) lists some of the literature with different views on CE, e.g. team work, computerizing, special approach to engineering, set of methods and tools, western attempt to understand Japanese product development practices, etc. Pre-vious study by Prasad (1996) discussed some definitions of CE that show little agreements on having a single definition of CE. However, in this dissertation, approaches related to the product development and its interdependencies with different functions and activities can be summarized under the expression CE. ’’Concurrent Engineering is a systematic approach to integrated development of a
Acta Wasaensia 3
product, and its related processes that emphasizes response to customer expecta-tions and embodies team values of cooperation, trust, and sharing in such a man-ner that decision making proceeds with large intervals of parallel working by all life-cycle perspectives, synchronized by comparatively brief exchanges to pro-duce consensus“ (Cleetus 92). Its goal is to optimize and distribute the resources in early design stage and during the development process. By doing this, product development process efficiency and effectiveness improved while industrial wastes reduced. However, identifying the most critical activities which consume more resources is still vague in resource allocation process. Fast, reliable and comprehensive decision making method like CFI is required (Belay and Takala 2011; Ranta and Takala 2007).
Indeed, in product development, wastes are inevitable and should be minimized as much as possible to have sound profit and sustain product development per-formance. Most of these wastes are time and process dependent and can be ex-pressed in terms of costs, lead time, rework, defect rate and etc. To be successful in dynamic business environment, products managers require know-how to organ-ize and how the products are developed and produced. Lean product development is a way to organize product development according to a set of principles (Mor-gan and Liker 2006). Lean product development in this dissertation context, con-stitutes several engineering methods and techniques, one is CE. However, rela-tively limited quantitative research has been carried out on lean product develop-ment, especially to compare the effects of point-based and set-based CE.
In NPD, analysing interdependent activities with several factors are challenging and more difficult to quantify the effects of various parameters. There is an urgent call by (Hoppmann et al. 2011; Liker and Morgan 2011) to view product devel-opment in system perspective to overcome this challenge. In this dissertation, product development is seen as a complex system and treated using system dy-namics (SD). The assumption is because; SD is a well-developed theory applica-ble to consider complex systems, non-linearity, and several feedback loops of information in a system (Sterman, 2000). One of the tools that help to understand the trade-offs in the product development stage is dynamic simulation models.
Tucker and Hackney (2000) underlined that the main reasons for the failure of CE projects are the lack of formal methodologies to assist organizations with the pro-cesses required to move from sequential to concurrent product development phas-es. According to Smith (1997) CE can be seen as a summary of best practice in product development, rather than the adoption of a radically new set of ideas. In 1990s “better, faster, cheaper” first promoted at NASA and in defense establish-ment (Murman et al. 2001). However, a number of failures of major space sys-

4 Acta Wasaensia
tems have occurred and the investigation of the failure by Young (2000) revealed excessive focus on cost reductions at the expense of other factors, for example, neglecting to apply Systems Engineering practices. In other terms, “cheaper and faster” was possible at the expense of the “better” and was believed that it is pos-sible to have any two but not all simultaneously. This means, cheaper and faster products do not have better quality, however, few recent research show that faster speed to market is positively related to better quality and lower costs; it is not necessary to sacrifice one of these outcomes (Stanko et al. 2012)
Acta Wasaensia 5
2 RESEARCH PROBLEMS, QUESTIONS AND OBJECTIVES, AND RESEARCH ORGANIZATION
Since the research problem is the foundation and the main focus of the research that makes explicit what I am looking into investigate; first the research would like to point out the main research problems and discuss the research gap while studying CE body of knowledge. Next, research questions, objectives and organi-zations will be discussed respectively.
2.1 Research problems
Two major research problems are identified to serve as a basis for the research.
2.1.1 A Problem of Viewing CE from a Single Perspective and Its Inconsistent Results
Regardless of some success while implementing CE as explained in the introduc-tion section, there are also recorded results that show failure in applying CE. Al-most all literature discusses CE from design improvement perspective which is operational level and its challenge (longer development time) emanated from do-ing things sequentially. Consequently, researchers put huge efforts to overcome those problems and apply limited improvement methods. For example, Yassine and Braha (2003) identified four critical problems that challenge management while implementing CE in complex product development (PD) projects. These problems are iteration, parallelism, decomposition and stability. Iteration encap-sulates an inherent, iterative nature to the design process, parallelism deals how to exploits the possibility of achieving shorter development times by performing in parallel or with some overlap, decomposition is concerned about how to decom-pose the overall product development system into smaller subsystems that can be controlled and managed, and stability considers the understanding of the dynam-ics of decomposed product development.
Majority of research articles from CE research application also focus on CAD/CAM applications. However, the question is; does focusing and improving only design and related activities bring a significant improvement on the overall product development performance? Enormous research of CE has been carried out for the last two decades but the results are still inconsistent. What makes these results inconsistent while using similar and pioneer principle of doing design pro-cess in parallel?
6 Acta Wasaensia
In line with this dissertation, to date, very limited research is carried out to view CE beyond the narrow view focusing on design improvement view think holisti-cally with several dimensions to enhance PD performance by large. For example, Brookes and Backhouse (1997) viewed CE in three spectrums, tactical, strategic and objective. When CE is viewed at a tactical level it contains a series of tools and techniques; the strategic level focuses on the parallel consideration of all as-pects of the development process; the objectives perspective emphasizes on the whole product introduction process to improve the overall business performance which is similar to BPR (Mäkinen 2011). However, these research are conceptual and theoretical in which the results need to be quantified, tested and seen visually to understand the true CE trade-offs.
2.1.2 Lack of Formal Methodology and Decision Support System
The second problem statement of the study is lack of formal methodology (quan-tified models of CE and decision support systems) to manage CE that constitutes several parameters that accommodate different functions. The dissertation at-tempts to respond to the recent call by several researchers to view product devel-opment in system perspectives (e.g. Hoppmann et al. 2011; Liker and Morgan, J. 2011). According to Veryzer and De-mozota (2005) the relationships among de-sign, marketing, and other disciplines involved in NPD are complex, and how these functions are integrated in new product development have a significant ef-fect on the product. Thus, the product’s subsequent success or failure depends on how we better integrate and see the overall effects by considering product devel-opment as a system and involved functions as sub-system. So, how we can ap-proach the complex PD process with several functions and support the decision support system? Hence, this research needs to quantify and develop ddifferent system dynamic models to show in what way we can use system thinking in PD so that it support decision making and see the effects of different parameters on lead time and cost. Furthermore, the dissertation gives insight how to manage and analyze complex PD process at systems of system level.
Besides to the above problems, studying some CE supportive ideas which are useful for its success is compulsory to tackle CE challenges, e.g. developing tools and methods that help to resource allocation (e.g. apply SCFI by avoiding its shortcomings). This makes the dissertation in line with Hoedemaker et al. (1999) who claim that successful implementation of CE depends on the nature of new product and resource limitations, e.g. the number of teams and developers.
The dissertation mainly focuses on overcoming the above problems by looking CE in multi-dimensions and attempts to show how we can achieve better PD per-
Acta Wasaensia 7
formance by understanding from its challenges. Unlike the previous research, it wants to look the overall challenges of CE and bridge them to both operational and strategic level strategies so that firms could able to improve their PD perfor-mance. Based on the above facts, CE challenges and views, the dissertation point-ed out research questions with subsequent objectives.
2.2 Research questions and objectives
The study aims to answer three main research questions and each question is an-swered by one or more original publication(s). Although the seven publications are considered and categorized into the closest research questions, each publica-tion research questions and their answers are provided in the point-to-point reflec-tion section (Table 5). The three main research questions are:
Q1. Do time-to-market (TTM) and CE make firms profitable and have similar effect on different situations, such as, product types or innovations?
Q2. Are there any missed concepts or related product development performance improvement methods that could be combined and use?
a) Related to quality management practices. b) Related to previous BPR efforts
Q3. From application of advanced methodology and improving decision support system perspective, in what way firms can use system thinking to enhance their PD performance?
a) From frontloading (using resources upfront) perspective b) From managing complex PD systems perspective.
The general objective of the thesis is to tackle the aforementioned three main re-search questions and lay a foundation to understand and model CE from different perspectives; so that firms could use as a guidance to implement and enhance product development performance. Specifically, the dissertation aims to:
1. Quantify and investigate the effect of TTM and CE in product devel-opment and see whether companies should always follow learning curve for all types of innovation and products or not.
2. Assess the relationship among quality management practices, BPR and CE; and model to incorporate the necessary attributes.
8 Acta Wasaensia
3. Systematically approach CE in such a way that firms could improve their PD performances and productivity by sustaining their resources. Moreover, the research wants to tackle some of the shortcomings of SCFI so that it could support CE to identify the critical factors and allo-cate resources.
2.3 Research Organization towards the objectives
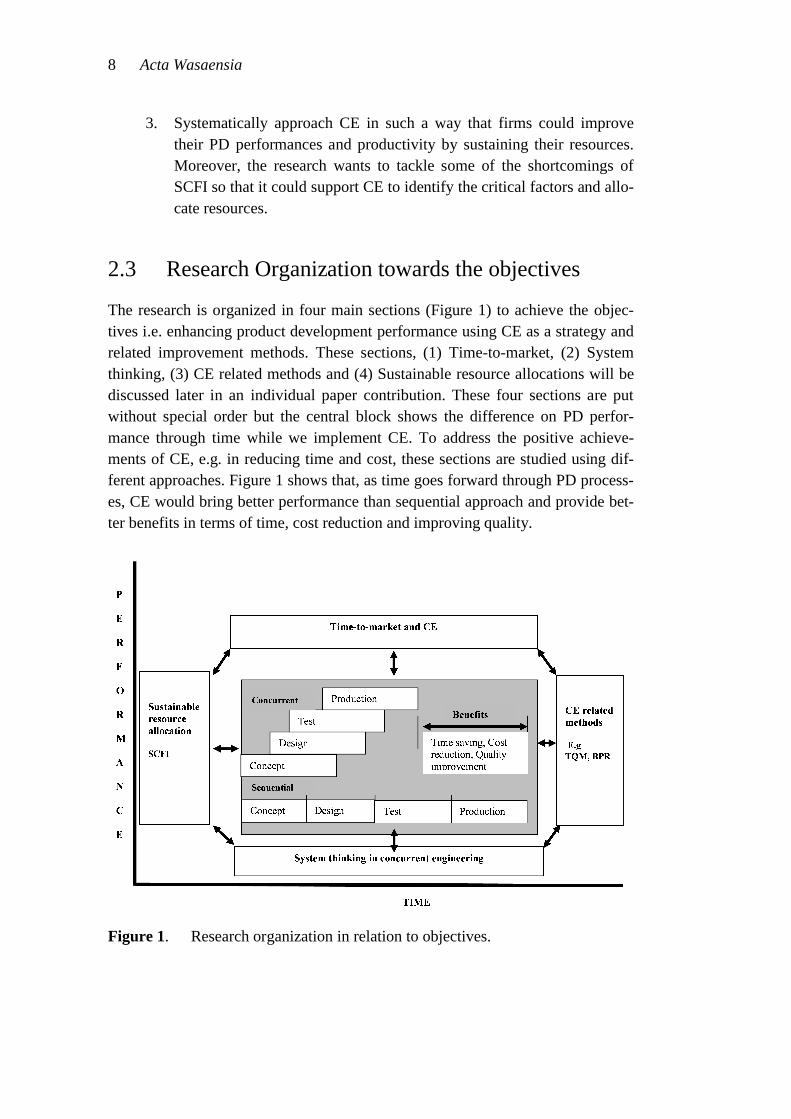
The research is organized in four main sections (Figure 1) to achieve the objec-tives i.e. enhancing product development performance using CE as a strategy and related improvement methods. These sections, (1) Time-to-market, (2) System thinking, (3) CE related methods and (4) Sustainable resource allocations will be discussed later in an individual paper contribution. These four sections are put without special order but the central block shows the difference on PD perfor-mance through time while we implement CE. To address the positive achieve-ments of CE, e.g. in reducing time and cost, these sections are studied using dif-ferent approaches. Figure 1 shows that, as time goes forward through PD process-es, CE would bring better performance than sequential approach and provide bet-ter benefits in terms of time, cost reduction and improving quality.
Figure 1. Research organization in relation to objectives.
Acta Wasaensia 9
3 THEORETICAL FOUNDATION AND LITERATURE REVIEW
Theories give the research credibility and serve as a fundament to understand the product development body of knowledge.
3.1 Theoretical foundation
According to Bryman (2008), characterizing the nature of the link between theory and research is by no means straight forward matter and therefore, in this section the research would like to discuss the scope of the theories used. As White (2009) indicated, theory is a contested term and while many people write about it, they are not always referring to exactly the same thing. For better understanding, visu-alization and characterization, this research summarizes the general classifications of different theories and approaches based on different segments and try to match with the research findings. After a thorough study of different theories in the liter-ature, this research is conducted based on contingency and system theory.
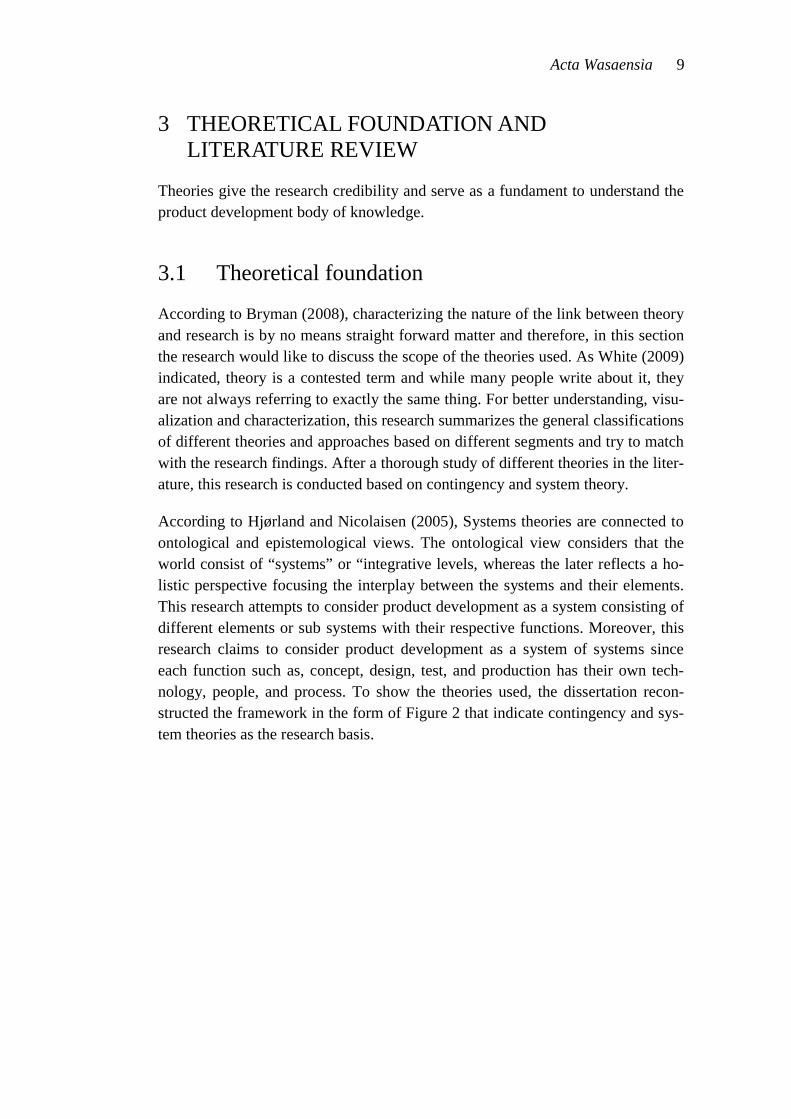
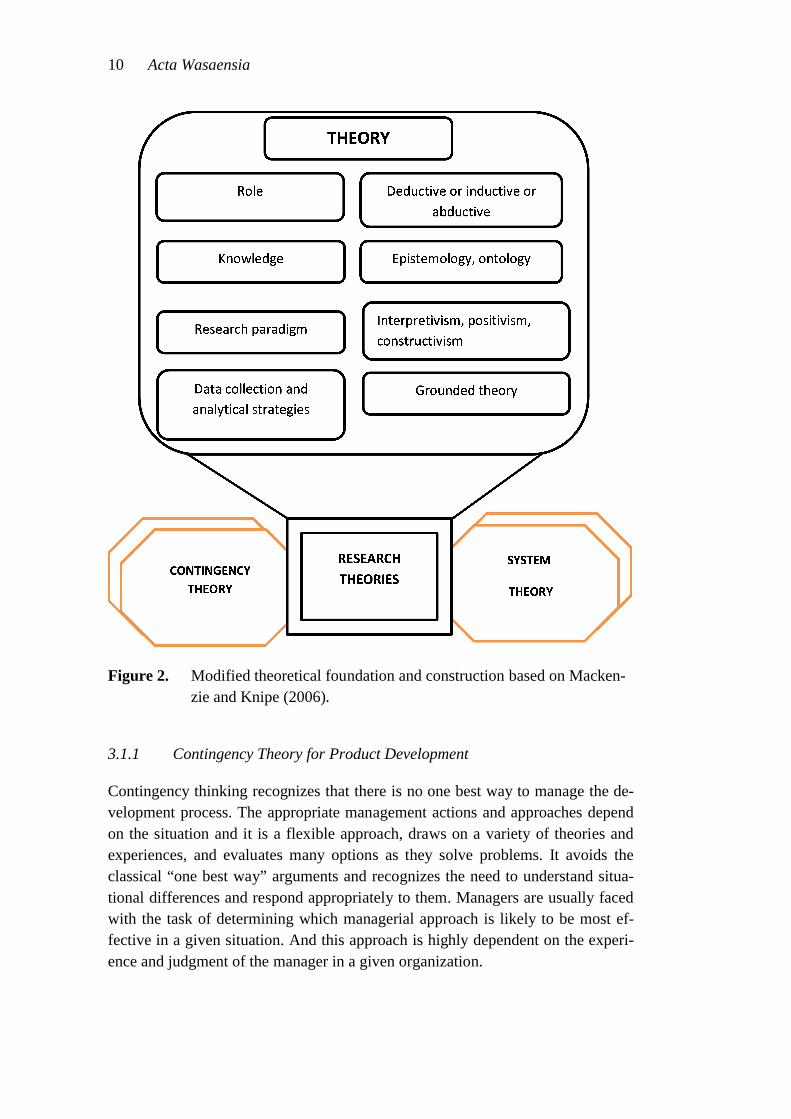
According to Hjørland and Nicolaisen (2005), Systems theories are connected to ontological and epistemological views. The ontological view considers that the world consist of “systems” or “integrative levels, whereas the later reflects a ho-listic perspective focusing the interplay between the systems and their elements. This research attempts to consider product development as a system consisting of different elements or sub systems with their respective functions. Moreover, this research claims to consider product development as a system of systems since each function such as, concept, design, test, and production has their own tech-nology, people, and process. To show the theories used, the dissertation recon-structed the framework in the form of Figure 2 that indicate contingency and sys-tem theories as the research basis.
10 Acta Wasaensia
Figure 2. Modified theoretical foundation and construction based on Macken-zie and Knipe (2006)
3.1.1 Contingency Theory for Product Development
Contingency thinking recognizes that there is no one best way to manage the de-velopment process. The appropriate management actions and approaches depend on the situation and it is a flexible approach, draws on a variety of theories and experiences, and evaluates many options as they solve problems. It avoids the classical “one best way” arguments and recognizes the need to understand situa-tional differences and respond appropriately to them. Managers are usually faced with the task of determining which managerial approach is likely to be most ef-fective in a given situation. And this approach is highly dependent on the experi-ence and judgment of the manager in a given organization.
Acta Wasaensia 11
Nowadays, to achieve a significant business performance improvement in the existing dynamic market, using or combining more than one process improve-ment approaches is essential. This is because a single approach cannot be ex-pected to bring a significant effect on every dimension while measuring organiza-tional performance (Walker and Ruekert 1987). This forces many firms to opera-tionalize organizational performance in to different segments of measurements like sales growth, return on assets, new product success, market share and overall performance (Slater and Narver 1994; Jaworski and Kohli 1993). This part mainly focuses on combined applications of CE and other approaches to enhance busi-ness performance.
3.1.2 Systems Theory for Product Development
The systems theory encourages managers to look at the complex organization from a broader perspective. A system is an interrelated set of elements function-ing as a whole. An organization as a system is composed of four elements such inputs, transformation processes, outputs, and feedback. Inputs incorporate re-sources such as raw materials, money, technologies, and people. These inputs go through a transformation process where they are planned, organized, motivated, and controlled to ultimately meet the organization’s goals. The outputs are the products or services designed to enhance the quality of life or productivity for customers. Feedback includes comments from customers using the products.
Depending upon customer feedbacks, it is important to make products more flexi-ble and analyze systematically the complex transformation process and to find optimized and successful products. At the time of new product development (NPD), analyzing interdependent activities with several internal and external fac-tors are challenging and even more difficult to quantify the effects of various pa-rameters on product development performance. To overcome this challenge, it can be considered NPD as a system and propose using a system dynamic ap-proach. The assumption is because system dynamics (SD) is a well-developed theory applicable to consider complex systems, non-linearity, and several feed-back loops of information in a system (Sterman 2000).
3.2 Literature Review
Literature review gives a possibility to see and understand what has been done, show the previous challenges, study the remedial action that have been taken and give a clue to see the research gap for those problems that are not solved yet.
12 Acta Wasaensia
3.2.1 Fundamental Concepts of CE
CE appeared in the 80’s as a concept of parallel performing engineering design activities and integrating all related processes. This concept is based on general assumption that different components of product life cycle considered together and relatively early in the development process. Substantive advantages can be achieved by adopting CE strategies and methodologies. They need to use different methods and tools supporting their engineering and development activities (Chou et al. 2009). The CE concept as practiced by manufacturing organizations implies the almost simultaneous design of a product, its development, and preparation for production, whether one-of-a-kind (e.g. ships) or volume (e.g. automobiles) (Anumba et al., 2000).
According to Willaert et al. (1998) the goals of CE are lower product costs through its life, better product quality, and shorter TTM. Haque et al. (2000) listed some of the benefits of CE, e.g. reducing lead times; removing weak func-tions or links; a move towards a flatter organization; Improving performance of functions, links, process and organization. CE is a strategy which aims to increase market share, customer satisfaction, and reduces product lead-time (Abdalla 1999). The idea of CE is to satisfy important issues simultaneously, such as: func-tionality, reliability, produceability, and marketability concerns, reduction of the product development time (i.e. lead time) and cost, achieving higher product qual-ity and value (Ranky 1994).
Some of the definitions of CE have similarities in content but there are also dif-ferent ways of looking and defining CE. Here are some examples on the defini-tions of CE by different researchers:
Concurrent Engineering as defined by Winner et al. (1988) is a systematic ap-proach to the integrated, concurrent design of products and their related process-es, including manufacture and support. In other words CE encompasses team work, company competitiveness, communication, commitment, culture, customer satisfaction, and early attention to manufacturing, test and support issues.
“Concurrent engineering is a systematic approach to the integrated, concurrent design of products and their related processes, including manufacture and sup-port. This approach is intended to cause the developers, from the outset, to con-sider all elements of the product life-cycle from conception through disposal, in-cluding quality, cost, schedule, and user requirements”, (Herder and Weijnen 2000).
Acta Wasaensia 13
“Concurrent engineering (CE) is an engineering management philosophy and a set of operating principles that guide a product development process through an accelerated successful completion. The overall CE philosophy rests on a single, but powerful, principle that promotes the incorporation of downstream concerns into the upstream phases of a development process. This would lead to shorter development time, improved product quality, and lower development and produc-tion costs”, (Yassine and Braha 2003).
“Concurrent engineering (CE) is a process which can integrate all the steps in the process of product development including the design stages and manufactur-ing process and it can put them in a form in which we can observe and consider them concurrently. It unifies the processes involved in systematizing product de-sign. Multiple domain integration is the most outstanding characteristic of con-current engineering. Concurrent engineering is an optimized operating model” (Luh et al. 2009).
3.2.2 Principles of CE
According to Haque el al. (2000) New Product Development (NPD), is an inter-disciplinary activity requiring contributions from nearly all the functions of a firm, whether it is an upgrade/improvement of an existing product or a new con-cept either to the company or the market. NPD is a system encompassing the dy-namic interaction between internal and external factors (Harmancioglu et al, 2007). Anumba et al. (2007) also discusses the two key principles of CE: integra-tion and concurrency. Integration here is in relation to the process and content of information and knowledge, between and within project stages, and of all tech-nologies and tools used in the product development process. Integrated concurrent design also involves upfront requirements analysis by multidisciplinary teams and early consideration of all lifecycle issues affecting a product.
Product design in a CE focuses on an interdisciplinary approach that utilizes methods, procedures, and rules to plan, analyze, select, and optimize the design of products (Dowlatshahi 1995). CE implies the co-ordination of the whole product introduction process; the near-simultaneous design of a product, its development, and preparation for regular volume production (Anumba et al. 2000). According to Abdalla (1999), a key step towards implementing CE is effective cross-functional teams, which integrate the development process using both organiza-tional and information management methods. This idea was supported by Kouft-eros et al. (2001) while pointing out the three basic elements of CE, Namely, con-current workflow, early involvement of all participants and groups contributing to product development and team work.
14 Acta Wasaensia
Several efforts have been done to understand the identifying components of CE by different researchers at different times. The research conducted by Valle and Va´zquez-Bustelo (2009) describes the basic elements of CE as concurrent work-flow, early involvement of different functions, and teamwork. However, previ-ously Jarvis (1999) summarized the key components of CE. He argue that CE requires a clear understanding of customer needs, stability in the product specifi-cation, a structured systematic approach , ability to build and support effective teams, availability of resources early involvement of all team members, appropri-ate technological support to minimize time, design re-use and standardization to minimize the design content. Following several key components, Tucker and Hackney (2000) described CE as it can offer a different approach to new product introduction in which the requirements of all stake holders, especially customers are discussed and at the conceptual design stage that ensures lead times and costs reduction which cannot be obtained from sequential engineering.
3.2.3 CE and Its Integration with other Philosophies
To achieve a significant result on business performance improvement in the exist-ing dynamic market, using or combining more than one process improvement approaches for the betterment of the company’s business performance may re-quire. A single approach cannot be expected to bring a significant effect on every dimension while measuring organizational performance (Walker and Ruekert 1987). This forces many firms to operationalized organizational performance in to different segments of measurements like sales growth, return on assets, new product success, market share and overall performance (Slater and Narver 1994; Jaworski and Kohli 1993).
3.2.3.1 System Dynamics (SD)
Forrester in 1961 developed the idea of System Dynamics (SD) and (Sterman 2000), developed a theory to approach complex systems, non-linearity, and with several feedback loops of information in a system. One of the tools that help to understand the trade-offs in the product development stage is dynamic simulation models. Several researchers applied system dynamics in different areas of study. Marujo, LG (2009) applied on rework impacts evaluation in overlapped product development Schedule and its aim was to reduce the lead-time of activities. He provided general model to estimate the extended design time, strictly related to the necessary rework fraction, considering over-lapped activities using system dynamics. Sterman also indicated the dynamic behavior of product development with an involvement of multiple feedbacks, complex framework and has several
Acta Wasaensia 15
interdependent activities. The whole process of product development should be seen as a system including analyzing of time-to-market.
3.2.3.2 Lean Product Development
The industrial revolution in 1970’s brought the emergence of lean thinking in operations management. However, it has been applied in manufacturing and mainly on high volume products. Although lean business management and pro-duction strategy is considered as a major and successful Toyota’s production sys-tem, its principles have been broken down and applied in to several detailed oper-ational practices and applications. Nowadays, it is common to see lean as a prefix to different fields and operations: lean six-sigma, lean supply chain, lean con-struction, lean project management, lean product development, etc. Almost all focus on eliminating wastes that are exactly emanated from the basic single per-spective of lean that is “waste elimination”. Pettersen (2009) argues there is no agreed upon definition of lean and the formulations of the overall purpose of the concepts are instead going divergent. Some researchers link waste elimination to values that are added for customers (Dennis 2002; Bicheno 2004).
In this dissertation, lean is viewed from frontloading and set-based CE perspec-tive. Radeka and Sutton (2007) claim that the hallmarks of Toyota’s PD process include frontloading which is mainly the effort on the early stages of develop-ment. Recently, Raudberget (2011) discusses frontloading from set-based CE per-spective and his case show that set-based approach has positive effects on devel-opment performance, especially on the level of innovation, product cost and per-formance. Although the basic concepts and principles of set-based CE are dis-cussed in appendix (paper 4), the research summarizes the basic differences be-tween set-based and point passed CE in Figure 3.
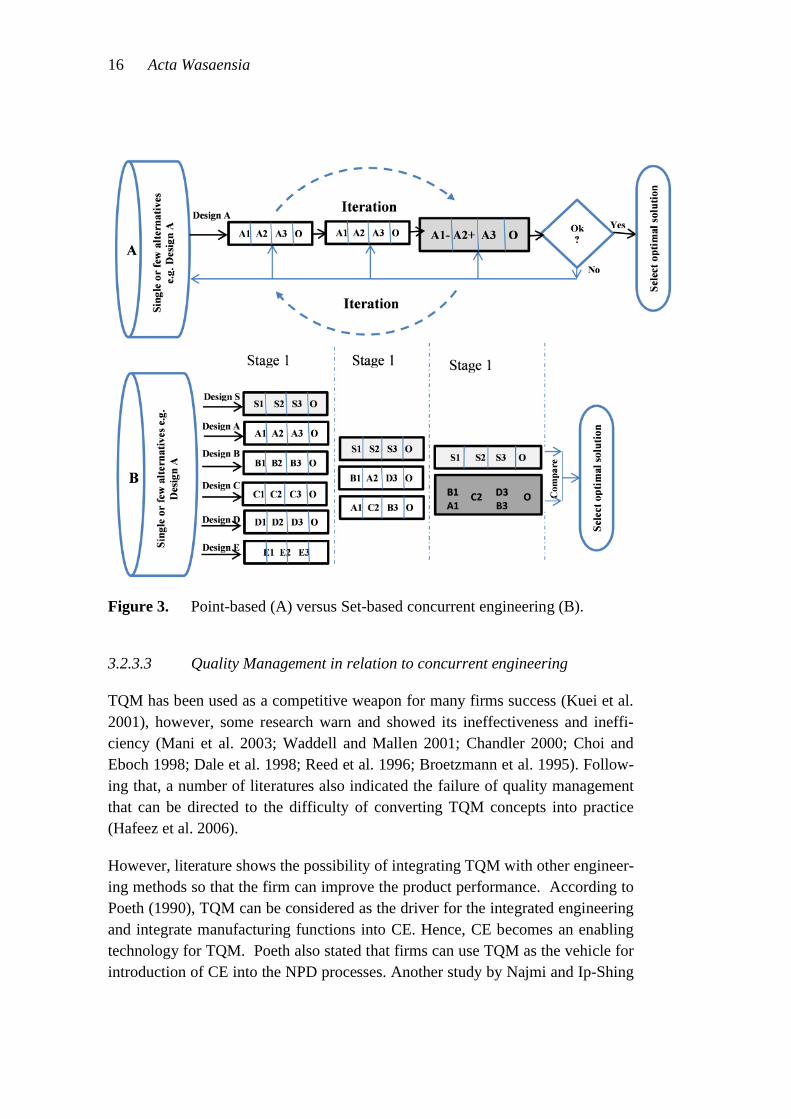
16 Acta Wasaensia
Figure 3. Point-based (A) versus Set-based concurrent engineering (B).
3.2.3.3 Quality Management in relation to concurrent engineering
TQM has been used as a competitive weapon for many firms success (Kuei et al. 2001), however, some research warn and showed its ineffectiveness and ineffi-ciency (Mani et al. 2003; Waddell and Mallen 2001; Chandler 2000; Choi and Eboch 1998; Dale et al. 1998; Reed et al. 1996; Broetzmann et al. 1995). Follow-ing that, a number of literatures also indicated the failure of quality management that can be directed to the difficulty of converting TQM concepts into practice (Hafeez et al. 2006).
However, literature shows the possibility of integrating TQM with other engineer-ing methods so that the firm can improve the product performance. According to Poeth (1990), TQM can be considered as the driver for the integrated engineering and integrate manufacturing functions into CE. Hence, CE becomes an enabling technology for TQM. Poeth also stated that firms can use TQM as the vehicle for introduction of CE into the NPD processes. Another study by Najmi and Ip-Shing
Acta Wasaensia 17
(2002) showed that the process approach at the heart of TQM is fundamental to embedding CE in new product development and application of CE through TQM is illustrated practically in industries.
Sun et al. (2009) studied the influence of quality management on the speed of NPD and showed that CE and TQM have several common attributes. For instance value analysis, QFD and team work are some, among others that have direct rela-tionship between CE and TQM. According to Sun and Zhoa (2010) companies which have implemented TQM and other quality tools will have a better basis for implementing new NPD approaches, such as, CE and DFMA). For instance, Najmi and Ip-Shing (2002) stated the possibility of CE characteristics to be in-corporated in TQM approach, e.g. ISO9000:2000 standard. Martin Marietta’s Space System’s programs have used the TQM and CE concepts like, vendor in-volvement, product teams, and continuous product improvement while building and designing structural subsystems. Karbhari et al. (1994) stated team or team building is the first necessary ingredient to good CE solutions.
Several efforts have been done to enhance product development performance by linking CE and quality management practices. This is by developing and applying different frameworks and tools which can support CE and TQM. For example, Gunasekaran (1998) developed an integrated product development-quality man-agement (IPD-QM) framework to support manufacturing organizations to im-prove product development and production processes. Its goal is to deploy effec-tive management principles of TQM and CE to develop products and manage upstream and downstream operations concurrently. Harding, et al. (1999) showed quality function deployment (QFD) and CE can be brought together to provide an extended design team with valuable, shared information throughout the design process, and thus, it fits ideally as a “front-end” process to CE (Jarvis, 1999). More recently, Sun and Zhao (2010) depicts that TQM, teamwork, value analysis (VA) and quality function deployment (QFD) are all positively correlated with the speed of NPD, which means quality management practices and tools have a positive impact on the speed of NPD. This implies that companies which have implemented TQM and other quality tools will have a better basis for implement-ing new NPD approaches like CE and design for manufacturing and assembly.
3.2.3.4 Business Process Re-engineering (BPR)
Kodak’s re-engineering of its black-and-white film manufacturing process cut the firm’s response time to new orders in half (Hindle 2008). Hammer (1990), Dav-enport and Short (1990) studied that the organizations have used business process re-engineering to seek improvements in their business performance. A number of
18 Acta Wasaensia
writers (example, Davenport 1993, Hammer and Champy 1993) have defined business processes: “The fundamental rethinking and radical redesign of business processes to achieve dramatic improvements in critical contemporary measures of performance, such as cost, quality, services and speed.” Laakso (1997) adds to his definition the necessary resources needed and states that the link between compe-tence and business processes is inseparable. The targets of BPR are based on the strategic capabilities which are classified (Treacy and Wiersema 1993, Hannus 1993) Customer focused, Product service leader and superiority in operations which is linked to cost efficiency and lead time of business processes and better R&D compared with competitors.
Tennant and Wu (2005) indicated that the main triggers for initiating BPR are a competitive pressure, intense need to reduce costs, acquisitions, and managing change. Besides, they have in sighted the organizational benefit and the returns on the implementation of BPR. On the other management philosophy, CE takes into consideration all factors that are related to shortening product life cycle, improv-ing cost and quality. Similarly, BPR also seeks to achieve these objectives on improving cost, quality and lead time. These shows, there is no single universal solution for every organization or company while managing the product devel-opment process.
BPR and CE are management philosophies that are used to bring about change, revitalize companies and make them more competitive. CE and BPR can be effec-tive in improving the performance of a company, particularly for those that rely on time and responsiveness (Brooks 1996, and Bovey 1994) Depicts that BPR in a CE environment covers all dimensions of product, personal and technology, experts and decision-makers from all of a business's functional groups and also indicate successful program should achieve typical performance improvements of 20 to 30%. According to Bovey (1994) Business process re-engineering can be applied to new product introduction in a CE context. He described that BPR in a CE environment covers all these dimensions-product, personal and technology, and experts and decision-makers from all of a business's functional groups need to be brought together. CE and business process re-engineering (BPR) are two of the tools that are used to bring about change, revitalize companies and make them more competitive. When correctly applied, CE and BPR can be very effective in improving the performance of a company, especially for those aspects that rely on time and responsiveness (Brooks 1996).
Acta Wasaensia 19
3.2.3.5 Other Important Philosophies Beyond the Scope of the Research
Supply chain: There is a direct, logical link between the consideration of the sup-ply chain and the design roles within the organization (Anumba et al., 2000). Quesada et al. (2006) indicates an integrative approach to examining relationships between supplier involvement, CE and supplier performance. Increased supplier involvement improves both the CE practices and supplier performance. Accord-ing to (Maffin and Braiden 2001; Willaert et al. 1998) one of the vital dimensions of CE is involvement of suppliers. Tan and Tracey (2007) also claim that the in-volvement of suppliers, customers, and manufacturing bring a long-term benefits. Well-designed and efficiently managed supplier integration is a huge competitive advantage and supplier integration may range from component design and manu-facture to full responsibility for the design of complex distributed systems (Lind-quist et al. 2008). Vital key elements for success in CE are effective communica-tion, a systematic involvement of customers, suppliers; distributors, powerful in-formation infrastructure, and effective use of modern technology (Abdalla 1999).
Information Technology: The information that flows from different functions re-sults multiple feedbacks, closer coordination amongst the different process phases is crucial and elimination of information gaps is required (Valle and Va´zquez-Bustelo 2009). In relation to CE, Abdalla (1999) argues about the need of effec-tive cross-functional teams, which integrate the development process using organ-izational and information management methods. One example of IT application is, a product data management (PDM) system, which is a tool that helps to man-age both data and the product development processes, and hence support a CE framework in a company (Kumar and Midha 2001). The key element in the de-sign process is the information structure that effectively supports decision-making. Nowadays computer performance and manufacturing technology have improved and companies have integrated their design strategy from computer-aided design (CAD), CIM to CE to enhance the efficiency. The design for assem-bly (DFA) concept is also widely used (Harrison et al. 2007). CE can be support-ed on tools that facilitate it. CAD/CAE/CAM and MRP products need a restruc-turing of the engineering organization to take advantage of the new functionalities offered by these products (Gascoigne 1995).
3.2.4 Application Areas of CE
Global manufacturing: Abdalla (1999) focused on synthesis the best practices of CE in a number of industrial sectors including automotive, aerospace, telecom-munication, shipbuilding, and information technology.
20 Acta Wasaensia
Casting Process: Bernard et al. (2007) studied the development and deployment of numerical engineering solutions, particularly on concurrent cost engineering. This research indicated how to understand the economic factors, their place with-in the industrial processes and to propose methodological solutions for a full cost engineering integration in the steel sand casting process, from negotiations to cus-tomer delivery.
Intelligent Design Planner: the research performed by Jiao et al. (2004) presented a prototype intelligent concurrent design task planner, which combines the strength of genetic algorithm (GA) and an iterative design analyzer for the sched-uling of a complex design process of a manufacturing system. The prototype planner comprises three modules, namely design process modeling, configuration, and scheduling. The design process modeling module adopts the design structure matrix (DSM) to capture iteration through information analysis according to the information provided by designers. The configuration /module offer an interface for the project manager to specify the managerial objective, resource constraints and the GA parameters for scheduling.
Aircraft: A self-adaptive collaborative design method of aircraft tooling based on a natural neuron-endocrine-immunity system, multi-agent and product data man-agement (PDM) technologies has been developed by Li et al. (2009). A research conducted by Melin et al. (2006) discussed how industry concepts of CE enhance aircraft design education. One evolutionary direction in design education that has recently emerged is analogous to the modern era of aircraft product development where integrated product development teams (IPDT) of an aircraft integrator col-laborate with suppliers or risk-sharing partners.
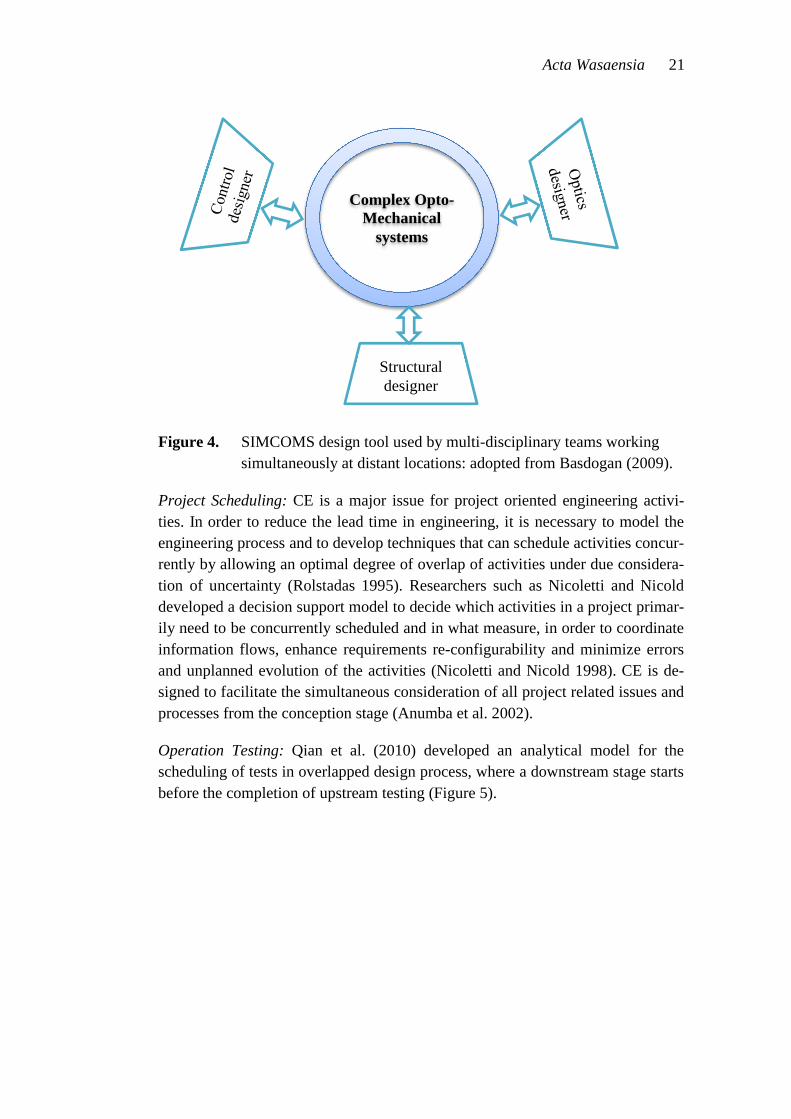
Complex Optic-Mechanical System: The study carried out by Basdogan (2009) proposed a concurrent design methodology that employs physics-based high fi-delity computational models together with analysis methods to predict the per-formance of complex opto-mechanical systems (Figure 4). For this purpose, the researcher developed a web-based collaborative design and modeling environ-ment for the simulation of complex opto-mechanical systems (SIMCOMS).
Acta Wasaensia 21
Figure 4. SIMCOMS design tool used by multi-disciplinary teams working simultaneously at distant locations: adopted from Basdogan (2009).
Project Scheduling: CE is a major issue for project oriented engineering activi-ties. In order to reduce the lead time in engineering, it is necessary to model the engineering process and to develop techniques that can schedule activities concur-rently by allowing an optimal degree of overlap of activities under due considera-tion of uncertainty (Rolstadas 1995). Researchers such as Nicoletti and Nicold developed a decision support model to decide which activities in a project primar-ily need to be concurrently scheduled and in what measure, in order to coordinate information flows, enhance requirements re-configurability and minimize errors and unplanned evolution of the activities (Nicoletti and Nicold 1998). CE is de-signed to facilitate the simultaneous consideration of all project related issues and processes from the conception stage (Anumba et al. 2002).
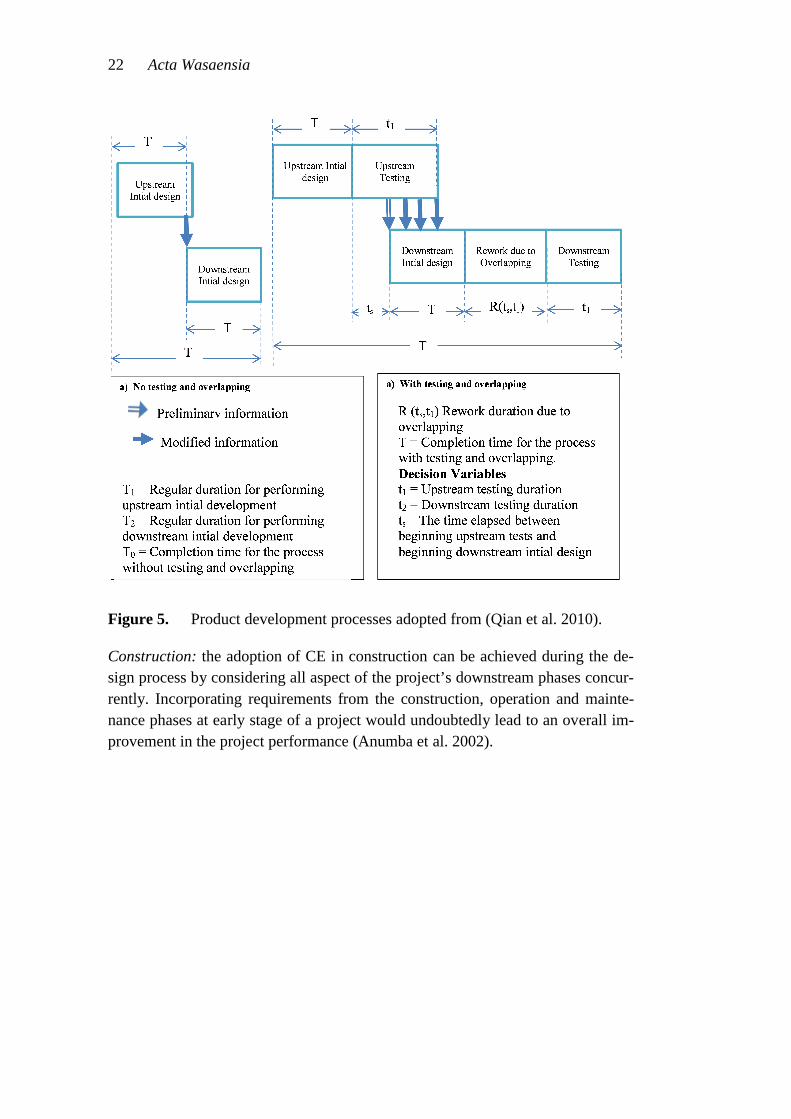
Operation Testing: Qian et al. (2010) developed an analytical model for the scheduling of tests in overlapped design process, where a downstream stage starts before the completion of upstream testing (Figure 5).
Complex Opto-Mechanical
systems
Structural designer
22 Acta Wasaensia
Figure 5. Product development processes adopted from (Qian et al. 2010).
Construction: the adoption of CE in construction can be achieved during the de-sign process by considering all aspect of the project’s downstream phases concur-rently. Incorporating requirements from the construction, operation and mainte-nance phases at early stage of a project would undoubtedly lead to an overall im-provement in the project performance (Anumba et al. 2002).
Acta Wasaensia 23
4 RESEARCH METHODOLOGY
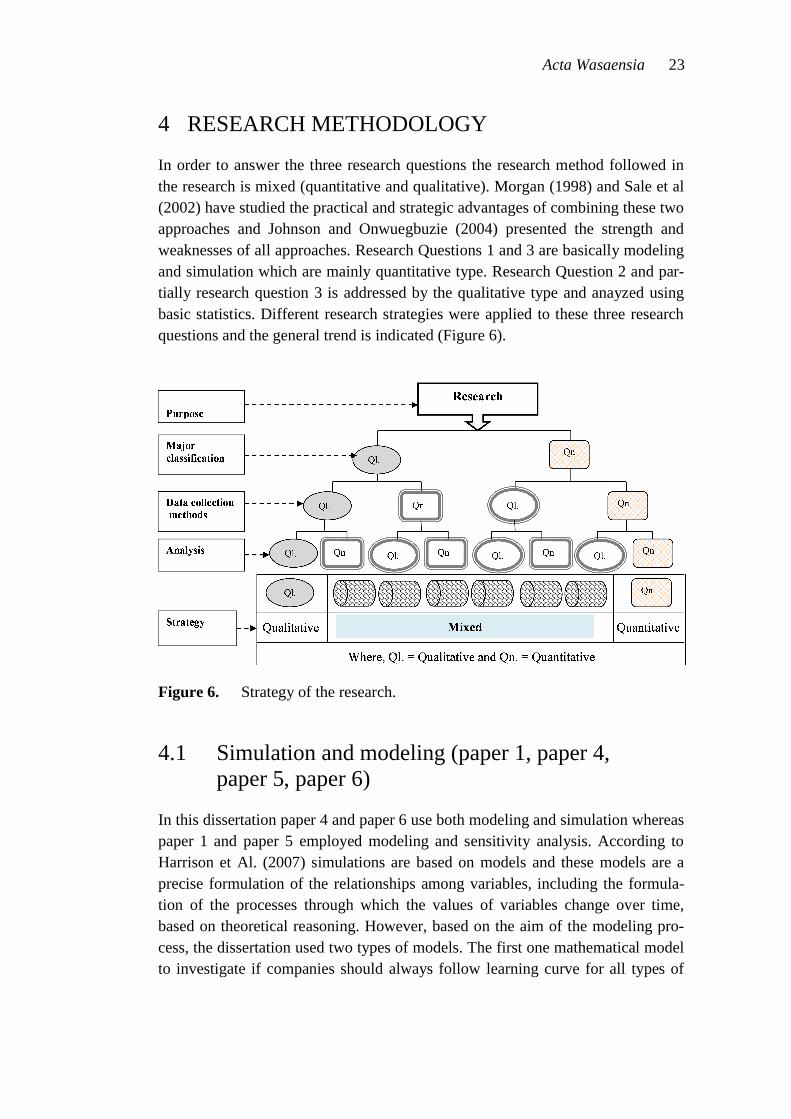
In order to answer the three research questions the research method followed in the research is mixed (quantitative and qualitative). Morgan (1998) and Sale et al (2002) have studied the practical and strategic advantages of combining these two approaches and Johnson and Onwuegbuzie (2004) presented the strength and weaknesses of all approaches. Research Questions 1 and 3 are basically modeling and simulation which are mainly quantitative type. Research Question 2 and par-tially research question 3 is addressed by the qualitative type and anayzed using basic statistics. Different research strategies were applied to these three research questions and the general trend is indicated (Figure 6).
Figure 6. Strategy of the research.
4.1 Simulation and modeling (paper 1, paper 4, paper 5, paper 6)
In this dissertation paper 4 and paper 6 use both modeling and simulation whereas paper 1 and paper 5 employed modeling and sensitivity analysis. According to Harrison et Al. (2007) simulations are based on models and these models are a precise formulation of the relationships among variables, including the formula-tion of the processes through which the values of variables change over time, based on theoretical reasoning. However, based on the aim of the modeling pro-cess, the dissertation used two types of models. The first one mathematical model to investigate if companies should always follow learning curve for all types of
24 Acta Wasaensia
innovation and products or not and see its sensitivity. To compare the results, new TTM model has been developed and compared with previous model by Prasad (1997). The new model gives a clue for the decision of what type of innovation to follow and products to produce. The second one is models that are linked with different applications of system dynamics and simulation to enhance product de-velopment processes. For example, paper 4 and 6 are mainly about system think-ing and system dynamics. Other mathematical and conceptual models have also been developed to complete this research, for instance paper 5. The detailed re-search types of each publication that are included in this dissertation will be pre-sented on the novelty and contribution section of the dissertation later.
4.2 Case study (paper 3)
Case study research strategy has gained popularity among researchers developing best practices or processes to improve productivity (Kumar et al. 2010; Dawson, 2010; Laureani and Antony 2010, Kumar et al. 2009). This method is particularly important when research is focused on addressing how and why questions (Yin, 2003). Case study is considered for research question 2 i.e. to investigate the combined effects BPR and CE on PD performance. To investigate the combined effects BPR and CE on performance, two case companies were considered. In this research mainly statistical process control methods are employed starting from the identification of root causes up to the stage of the proposed solution in combining BPR and CE engineering. Some of the methods are:
– Ishikawa diagram: to find out the root causes of delay on the BP and in particular the causes of product delivery delay. Pareto analysis which is a statistical technique in decision making to identify the vital few from trivial many is used following the result of interviews and historical records.
– Process mapping: All activities involved in the processes, responsibili-ties, completion time and the final result impact has been done to see the ultimate process improvements.
– Gage and measurement system capability: to measure the level of pro-cess performance improvement of the companies based on the imple-mentation of BPR and CE. Repeatability and reproducibility are ana-lyzed.
Acta Wasaensia 25
4.3 Sample survey (paper 2 and paper 5)
In the first case, qualitative and quantitative methods were used and a formal data collection technique is employed to evaluate existing business performances and quality management practices. The qualitative approach used to perform open interviews and to make some subjective decisions when necessary with responsi-ble personnel. The entire data were collected in two phases. The first phase was carried out during 2006/07 and the second one was performed during 2009/10. Its aim was to understand in depth the effect of TQM and CE before and after their partial implementation. Data were collected from records and documentation, structured and unstructured interviews.
Sample survey is conducted to find the primary data using a questionnaire survey for the purpose of determining the critical factors in considered firms. This ques-tionnaire survey was managed using specific designed data collection instrument. This is because of its simplicity to manage the surveying process. Relevant attrib-utes was extracted from the previous efforts of the firm and about 160 question-naires distributed. Response rates all together are about 48% and incomplete re-sponses are not considered. This is done to develop and apply an improved model of Critical Factor Index (CFI) on customer satisfaction in a service providing company in Finland. Efforts have been to apply SCFI on construction project in Norway with different attributes that are linked with CE. However the sample size was not as bigger as the case of Finland. However, significant effort has been done on literature review which is a basis for all publications. Moreover, it’s supported by a separate publication which is paper 7 to see what is added to the body of knowledge from past and what is left to future.
26 Acta Wasaensia
5 SUMMARIZING ORIGINAL PUBLICATIONS, FINDINGS AND MANAGERIAL IMPLICATIONS
5.1 Linking publications using concurrent engineering diamond
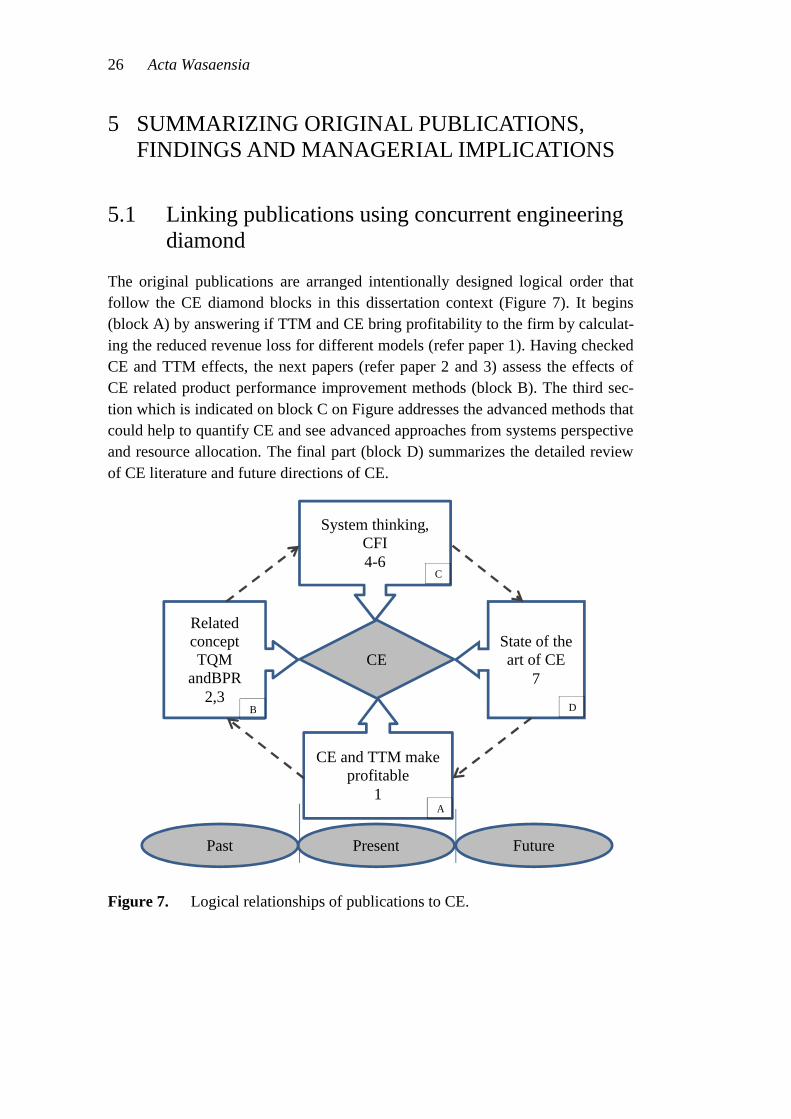
The original publications are arranged intentionally designed logical order that follow the CE diamond blocks in this dissertation context (Figure 7). It begins (block A) by answering if TTM and CE bring profitability to the firm by calculat-ing the reduced revenue loss for different models (refer paper 1). Having checked CE and TTM effects, the next papers (refer paper 2 and 3) assess the effects of CE related product performance improvement methods (block B). The third sec-tion which is indicated on block C on Figure addresses the advanced methods that could help to quantify CE and see advanced approaches from systems perspective and resource allocation. The final part (block D) summarizes the detailed review of CE literature and future directions of CE.
Figure 7. Logical relationships of publications to CE.
CE
Related concept TQM
andBPR 2,3
System thinking, CFI 4-6
CE and TTM make profitable
1
State of the art of CE
7
Present Future Past
A
D B
C
Acta Wasaensia 27
5.2 Findings and publications Summary
Overviews of Original Publications
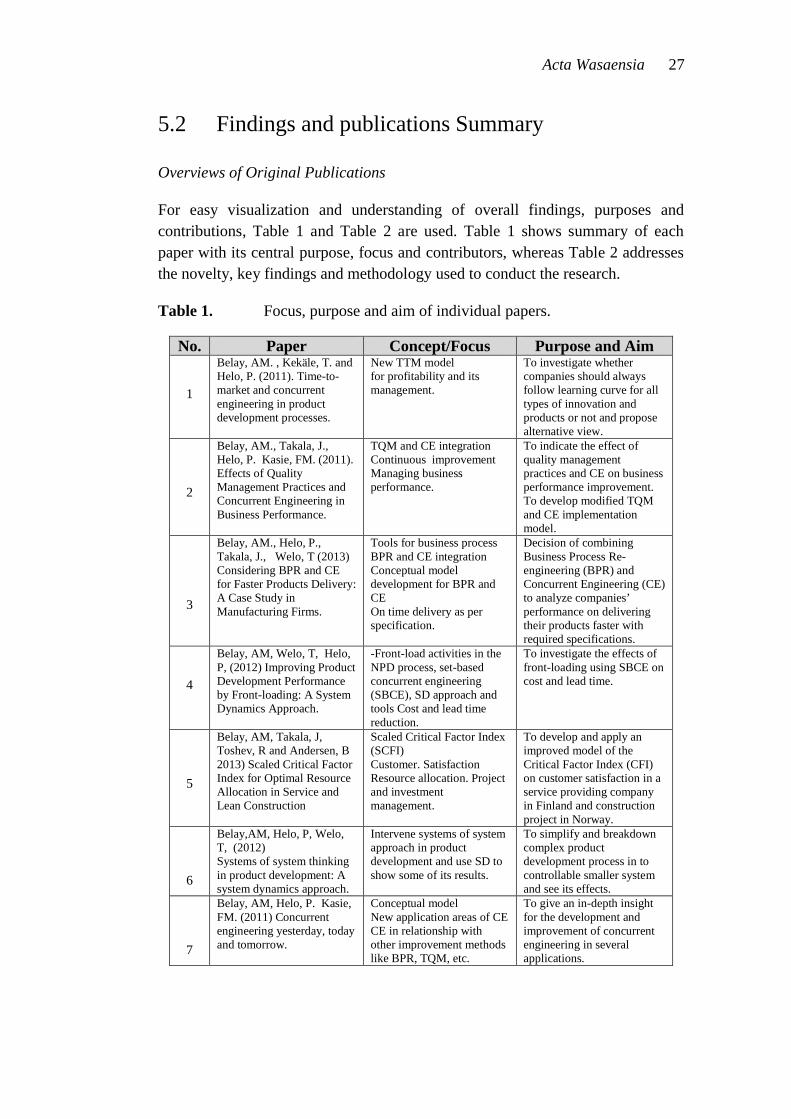
For easy visualization and understanding of overall findings, purposes and contributions, Table 1 and Table 2 are used. Table 1 shows summary of each paper with its central purpose, focus and contributors, whereas Table 2 addresses the novelty, key findings and methodology used to conduct the research.
Table 1. Focus, purpose and aim of individual papers.
No. Paper Concept/Focus Purpose and Aim
1
Belay, AM. , Kekäle, T. and Helo, P. (2011). Time-to-market and concurrent engineering in product development processes.
New TTM model for profitability and its management.
To investigate whether companies should always follow learning curve for all types of innovation and products or not and propose alternative view.
2
Belay, AM., Takala, J., Helo, P. Kasie, FM. (2011). Effects of Quality Management Practices and Concurrent Engineering in Business Performance.
TQM and CE integration Continuous improvement Managing business performance.
To indicate the effect of quality management practices and CE on business performance improvement. To develop modified TQM and CE implementation model.
3
Belay, AM., Helo, P., Takala, J., Welo, T (2013) Considering BPR and CE for Faster Products Delivery: A Case Study in Manufacturing Firms.
Tools for business process BPR and CE integration Conceptual model development for BPR and CE On time delivery as per specification.
Decision of combining Business Process Re-engineering (BPR) and Concurrent Engineering (CE) to analyze companies’ performance on delivering their products faster with required specifications.
4
Belay, AM, Welo, T, Helo, P, (2012) Improving Product Development Performance by Front-loading: A System Dynamics Approach.
-Front-load activities in the NPD process, set-based concurrent engineering (SBCE), SD approach and tools Cost and lead time reduction.
To investigate the effects of front-loading using SBCE on cost and lead time.
5
Belay, AM, Takala, J, Toshev, R and Andersen, B 2013) Scaled Critical Factor Index for Optimal Resource Allocation in Service and Lean Construction
Scaled Critical Factor Index (SCFI) Customer. Satisfaction Resource allocation. Project and investment management.
To develop and apply an improved model of the Critical Factor Index (CFI) on customer satisfaction in a service providing company in Finland and construction project in Norway.
6
Belay,AM, Helo, P, Welo, T, (2012) Systems of system thinking in product development: A system dynamics approach.
Intervene systems of system approach in product development and use SD to show some of its results.
To simplify and breakdown complex product development process in to controllable smaller system and see its effects.
7
Belay, AM, Helo, P. Kasie, FM. (2011) Concurrent engineering yesterday, today and tomorrow.
Conceptual model New application areas of CE CE in relationship with other improvement methods like BPR, TQM, etc.
To give an in-depth insight for the development and improvement of concurrent engineering in several applications.
28 Acta Wasaensia
Table 2. Novelty, findings and methodology of individual publications.
No. Novelty Findings Method of analysis
1
The study introduces a new model and compares the sensitivity with the previous model developed by Prasad (1997). Model II is for discontinuous innovation and breakthrough products and Model I for continuous innovation for extended or modified products.
The length of development time affects the profitability of the company and one of the basic ideas to improve the performance of the company is creative product development process which requires convergence of ideas and collaborative thinking.
Mathematical, and conceptual models development, literature review
2
The paper assesses relationships of quality management and CE on business performance improvement
No single approach has capable of solving every organizational problem, quality management initiative linked with CE leads to a better business performance
Case study, simple statistical analysis.
3
This study proposes new conceptual BPR and CE model on process improvement to reduce the PD time
Traditional way of product development process that is sequentially design and production methods, which highly affect TTM (delay in case companies 50% to 80%).
Case study, statistical process control charts, workflow diagram and process mapping, gage and measurement capability;
4
Investigates the effects of front-loading using SBCE on cost and lead time and new models are developed using a system dynamics approach
Within the given assumptions made, front-load using SBCE in NPD reduces the total cost by and improve lead time, resulting in a proportional delay loss when loading resources in the later stage
Simulation and mathematical models
5 SCFI is developed to identify the most critical attributes, allocate and balance resources based on their criticality level
SCFI is comprehensive, considering the current performance, the competitor’s performance and future development possibilities convey remarkable results. SCFI is possibly to be linked with CE.
Statistical control chart; mathematical models and equations
6
This paper introduces SOSE and sees the dynamic behavior of CE using simplified examples in different functions e.g. marketing.
Intervene SOSE concept in PD and apply SD to manage complex PD processes. CE (more invest before and in design stage) cuts about half of the total cost, reduce lead-time significantly.
Simulation and mathematical and conceptual models
7
New application areas of CE and conceptual model
There are areas that need to be addressed such as sustainability, application in services, and use of system approach.
Literature review
Acta Wasaensia 29
5.3 Research contributions and implications
Indeed, every scientific research has to have implications to solve the real world problems and challenges and therefore, this section wants to discuss the dissertation’s managerial implications.
Managerial Contributions with Respect to Research Question 1 Research question 1: Do time-to-market (TTM) and CE make firms profitable and have similar effect on different situations, such as, product types or innovations?
Research question 1 is directed towards to the results presented in papers 1. According to this paper, time based strategy has become a competitive weapon for many industries. I believe the challenge that manager’s face in dynamic market is to get different views and alternative performance improvement methods that fits with the required situation and time. For example, learning curve has been used for long but does it work all the time and with all situations? Taking in to account this and related questions, managers would need to have different approaches to solve their challenges while managing their organizations. This paper investigates whether companies should always follow learning curve for all types of innovation and products or not. The study has also provided some insights for time based strategy (time-to-market) for product development processes. It presents a new model and compares the sensitivity with the previous model developed by Prasad (1997). From this paper it is found that short term projects for development process gets higher slope but lesser percentage of revenue loss as compared to long term ones. This comparison helps project and product managers to prepare well in advance to take on time decision, e.g. related with resource balancing and re-allocation. The results also give a clue for managers to decide what type of innovation to follow and types of products to produce. The paper proposes Model II for discontinuous innovation and breakthrough products and Model I for continuous innovation for extended or modified products (Figure 8 and Figure 9).
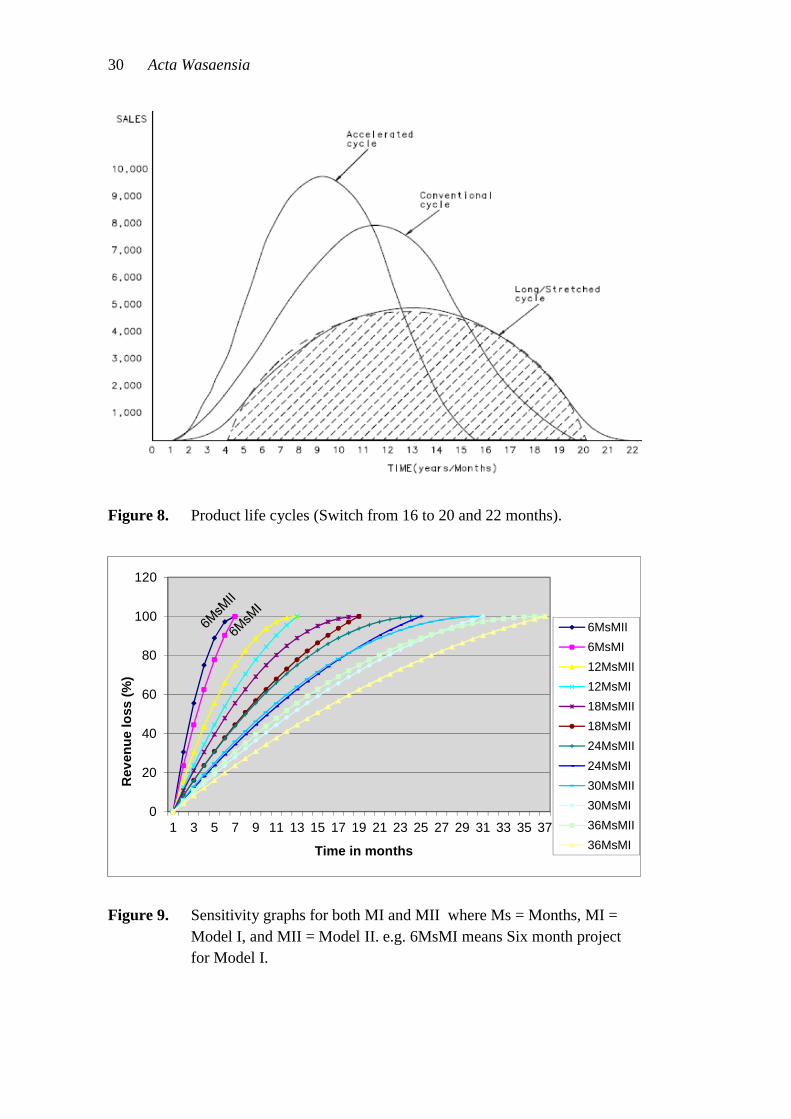
30 Acta Wasaensia
Figure 8. Product life cycles (Switch from 16 to 20 and 22 months).
Figure 9. Sensitivity graphs for both MI and MII where Ms = Months, MI = Model I, and MII = Model II. e.g. 6MsMI means Six month project for Model I.
0
20
40
60
80
100
120
1 3 5 7 9 11 13 15 17 19 21 23 25 27 29 31 33 35 37
Rev
enue
loss
(%)
Time in months
6MsMII6MsMI12MsMII12MsMI18MsMII18MsMI24MsMII24MsMI30MsMII30MsMI36MsMII36MsMI
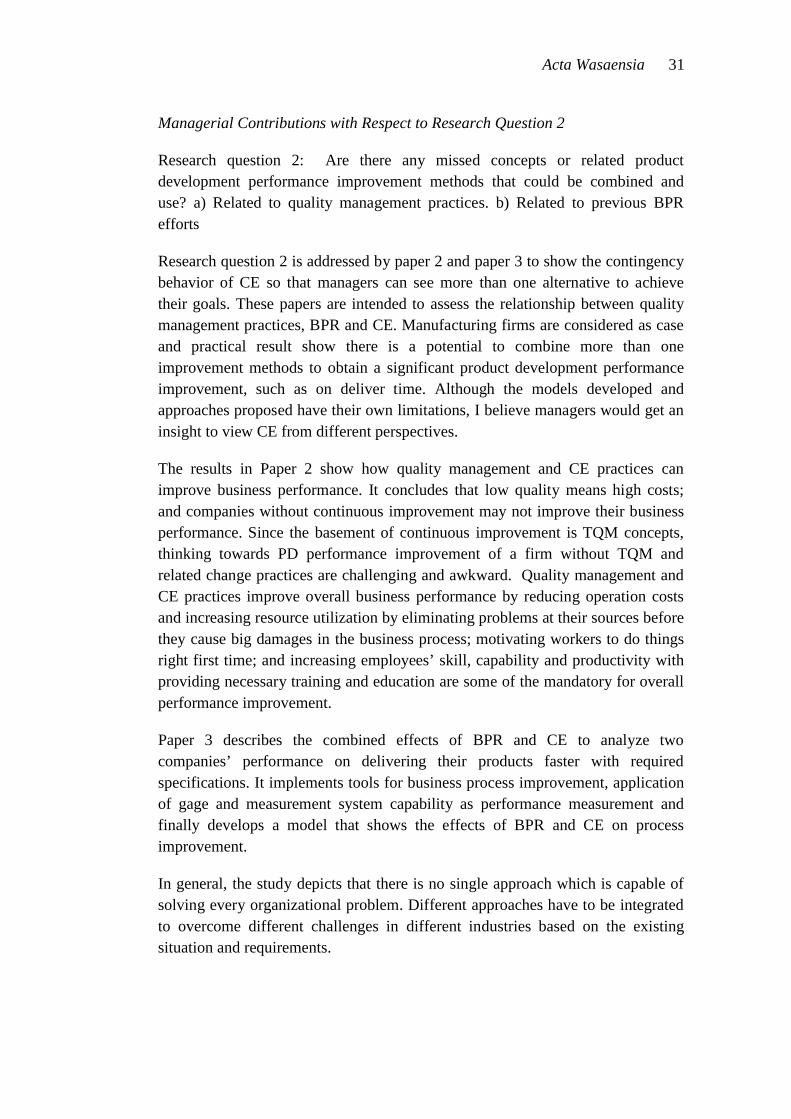
Acta Wasaensia 31
Managerial Contributions with Respect to Research Question 2
Research question 2: Are there any missed concepts or related product development performance improvement methods that could be combined and use? a) Related to quality management practices. b) Related to previous BPR efforts
Research question 2 is addressed by paper 2 and paper 3 to show the contingency behavior of CE so that managers can see more than one alternative to achieve their goals. These papers are intended to assess the relationship between quality management practices, BPR and CE. Manufacturing firms are considered as case and practical result show there is a potential to combine more than one improvement methods to obtain a significant product development performance improvement, such as on deliver time. Although the models developed and approaches proposed have their own limitations, I believe managers would get an insight to view CE from different perspectives.
The results in Paper 2 show how quality management and CE practices can improve business performance. It concludes that low quality means high costs; and companies without continuous improvement may not improve their business performance. Since the basement of continuous improvement is TQM concepts, thinking towards PD performance improvement of a firm without TQM and related change practices are challenging and awkward. Quality management and CE practices improve overall business performance by reducing operation costs and increasing resource utilization by eliminating problems at their sources before they cause big damages in the business process; motivating workers to do things right first time; and increasing employees’ skill, capability and productivity with providing necessary training and education are some of the mandatory for overall performance improvement.
Paper 3 describes the combined effects of BPR and CE to analyze two companies’ performance on delivering their products faster with required specifications. It implements tools for business process improvement, application of gage and measurement system capability as performance measurement and finally develops a model that shows the effects of BPR and CE on process improvement.
In general, the study depicts that there is no single approach which is capable of solving every organizational problem. Different approaches have to be integrated to overcome different challenges in different industries based on the existing situation and requirements.
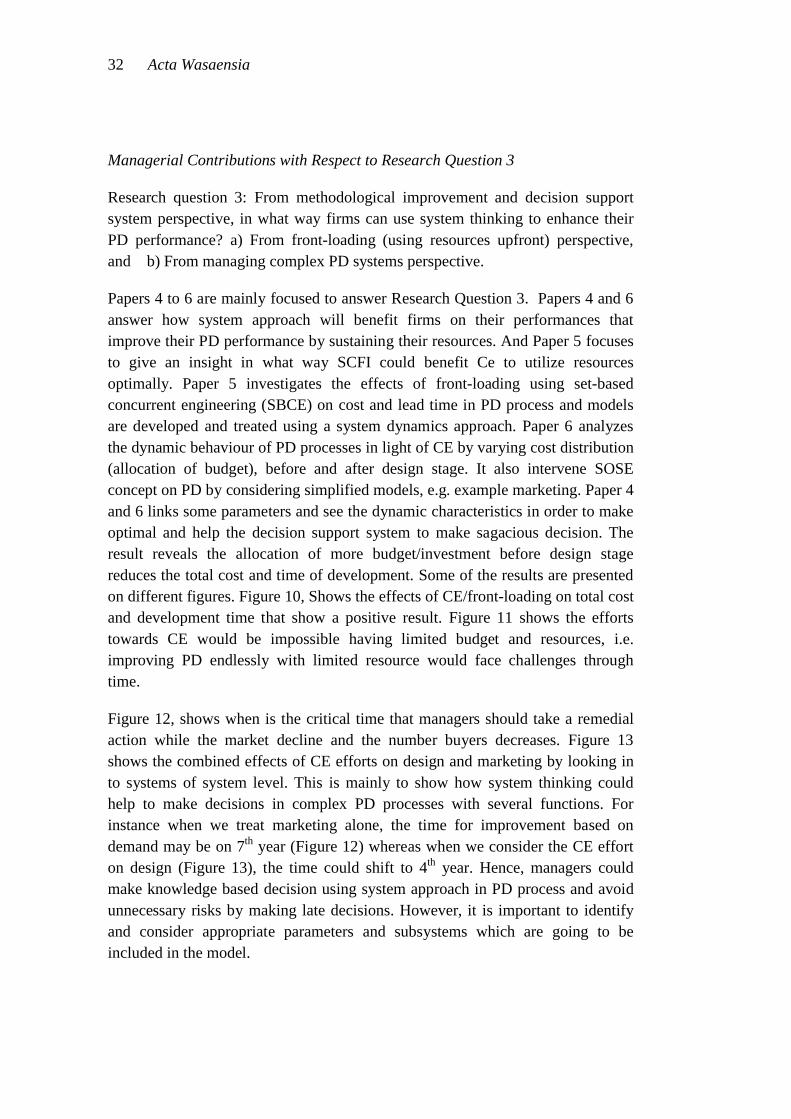
32 Acta Wasaensia
Managerial Contributions with Respect to Research Question 3
Research question 3: From methodological improvement and decision support system perspective, in what way firms can use system thinking to enhance their PD performance? a) From front-loading (using resources upfront) perspective, and b) From managing complex PD systems perspective.
Papers 4 to 6 are mainly focused to answer Research Question 3. Papers 4 and 6 answer how system approach will benefit firms on their performances that improve their PD performance by sustaining their resources. And Paper 5 focuses to give an insight in what way SCFI could benefit Ce to utilize resources optimally. Paper 5 investigates the effects of front-loading using set-based concurrent engineering (SBCE) on cost and lead time in PD process and models are developed and treated using a system dynamics approach. Paper 6 analyzes the dynamic behaviour of PD processes in light of CE by varying cost distribution (allocation of budget), before and after design stage. It also intervene SOSE concept on PD by considering simplified models, e.g. example marketing. Paper 4 and 6 links some parameters and see the dynamic characteristics in order to make optimal and help the decision support system to make sagacious decision. The result reveals the allocation of more budget/investment before design stage reduces the total cost and time of development. Some of the results are presented on different figures. Figure 10, Shows the effects of CE/front-loading on total cost and development time that show a positive result. Figure 11 shows the efforts towards CE would be impossible having limited budget and resources, i.e. improving PD endlessly with limited resource would face challenges through time.
Figure 12, shows when is the critical time that managers should take a remedial action while the market decline and the number buyers decreases. Figure 13 shows the combined effects of CE efforts on design and marketing by looking in to systems of system level. This is mainly to show how system thinking could help to make decisions in complex PD processes with several functions. For instance when we treat marketing alone, the time for improvement based on demand may be on 7th year (Figure 12) whereas when we consider the CE effort on design (Figure 13), the time could shift to 4th year. Hence, managers could make knowledge based decision using system approach in PD process and avoid unnecessary risks by making late decisions. However, it is important to identify and consider appropriate parameters and subsystems which are going to be included in the model.
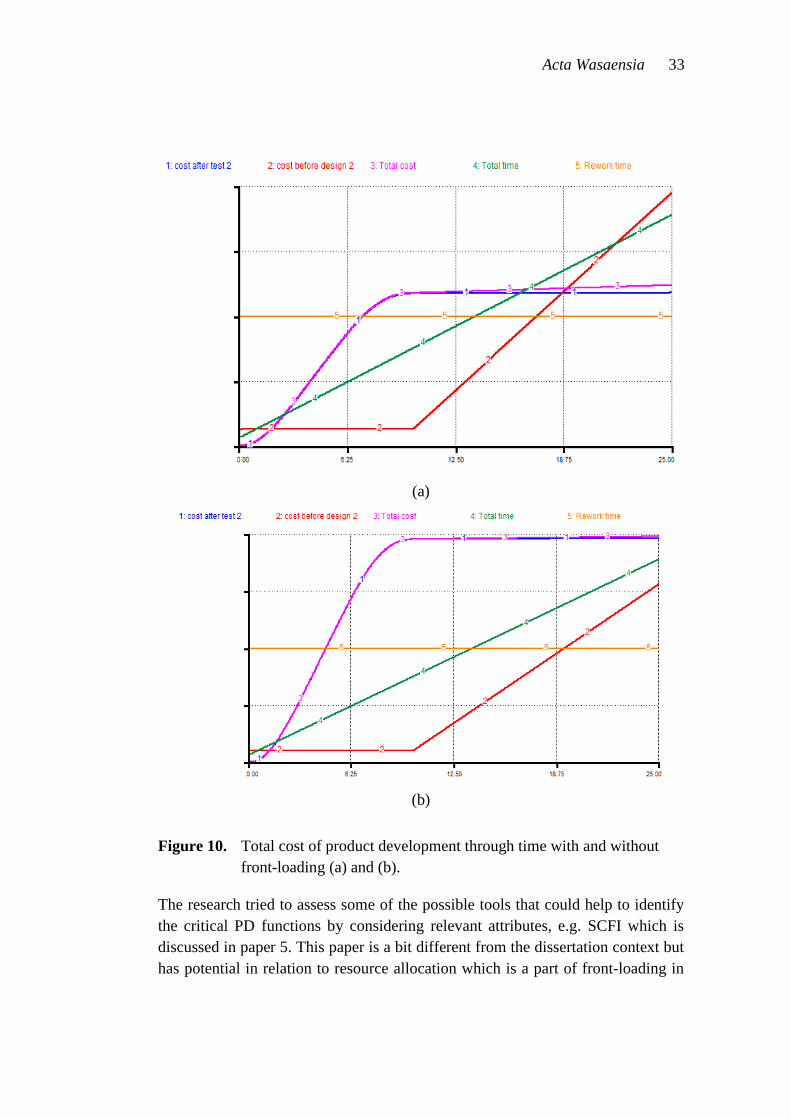
Acta Wasaensia 33
(a)
(b)
Figure 10. Total cost of product development through time with and without front-loading (a) and (b).
The research tried to assess some of the possible tools that could help to identify the critical PD functions by considering relevant attributes, e.g. SCFI which is discussed in paper 5. This paper is a bit different from the dissertation context but has potential in relation to resource allocation which is a part of front-loading in
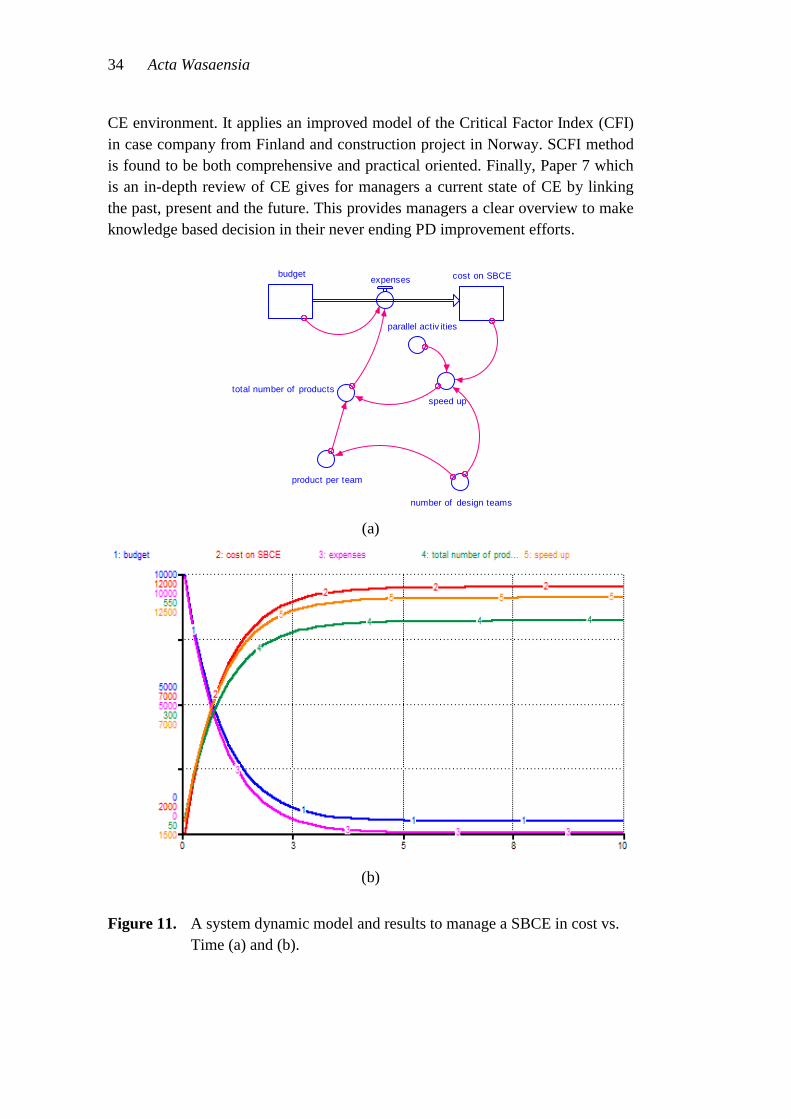
34 Acta Wasaensia
CE environment. It applies an improved model of the Critical Factor Index (CFI) in case company from Finland and construction project in Norway. SCFI method is found to be both comprehensive and practical oriented. Finally, Paper 7 which is an in-depth review of CE gives for managers a current state of CE by linking the past, present and the future. This provides managers a clear overview to make knowledge based decision in their never ending PD improvement efforts.
(a)
(b)
Figure 11. A system dynamic model and results to manage a SBCE in cost vs. Time (a) and (b).
budget cost on SBCEexpenses
speed uptotal number of products
parallel activ ities
number of design teams
product per team
Acta Wasaensia 35
(a)
(b)
Figure 12. A model to manage marketing and PD (a) and (b).
Av ailble market
customers
buy ing
Total product f rom the adv ert and satisf ied
demand
satisf ied customers
number of products per adv ertisement
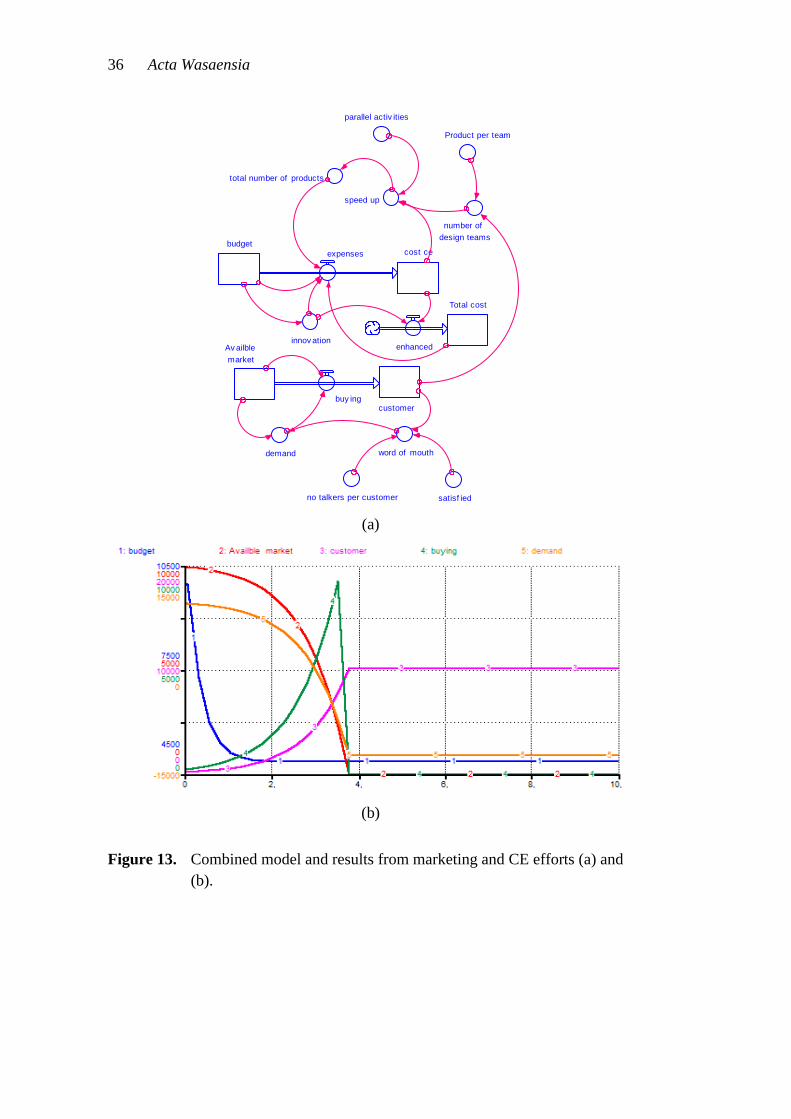
36 Acta Wasaensia
(a)
(b)
Figure 13. Combined model and results from marketing and CE efforts (a) and (b).
Av ailble market
customerbuy ing
word of mouthdemand
satisf iedno talkers per customer
budgetcost ceexpenses
speed up
total number of products
parallel activ ities
number of design teams
Total cost
enhanced
Product per team
innov ation
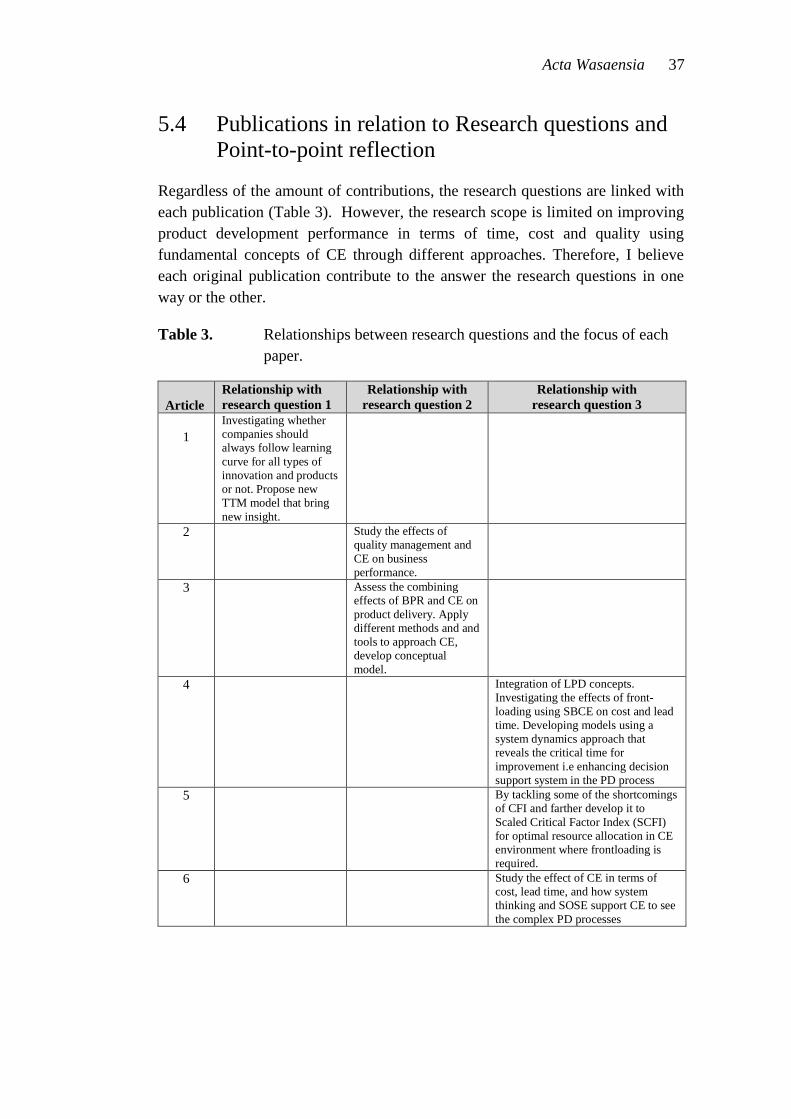
Acta Wasaensia 37
5.4 Publications in relation to Research questions and Point-to-point reflection
Regardless of the amount of contributions, the research questions are linked with each publication (Table 3). However, the research scope is limited on improving product development performance in terms of time, cost and quality using fundamental concepts of CE through different approaches. Therefore, I believe each original publication contribute to the answer the research questions in one way or the other.
Table 3. Relationships between research questions and the focus of each paper.
Article Relationship with research question 1
Relationship with research question 2
Relationship with research question 3
1 Investigating whether companies should always follow learning curve for all types of innovation and products or not. Propose new TTM model that bring new insight.
2 Study the effects of quality management and CE on business performance.
3 Assess the combining effects of BPR and CE on product delivery. Apply different methods and and tools to approach CE, develop conceptual model.
4 Integration of LPD concepts. Investigating the effects of front-loading using SBCE on cost and lead time. Developing models using a system dynamics approach that reveals the critical time for improvement i.e enhancing decision support system in the PD process
5 By tackling some of the shortcomings of CFI and farther develop it to Scaled Critical Factor Index (SCFI) for optimal resource allocation in CE environment where frontloading is required.
6 Study the effect of CE in terms of cost, lead time, and how system thinking and SOSE support CE to see the complex PD processes
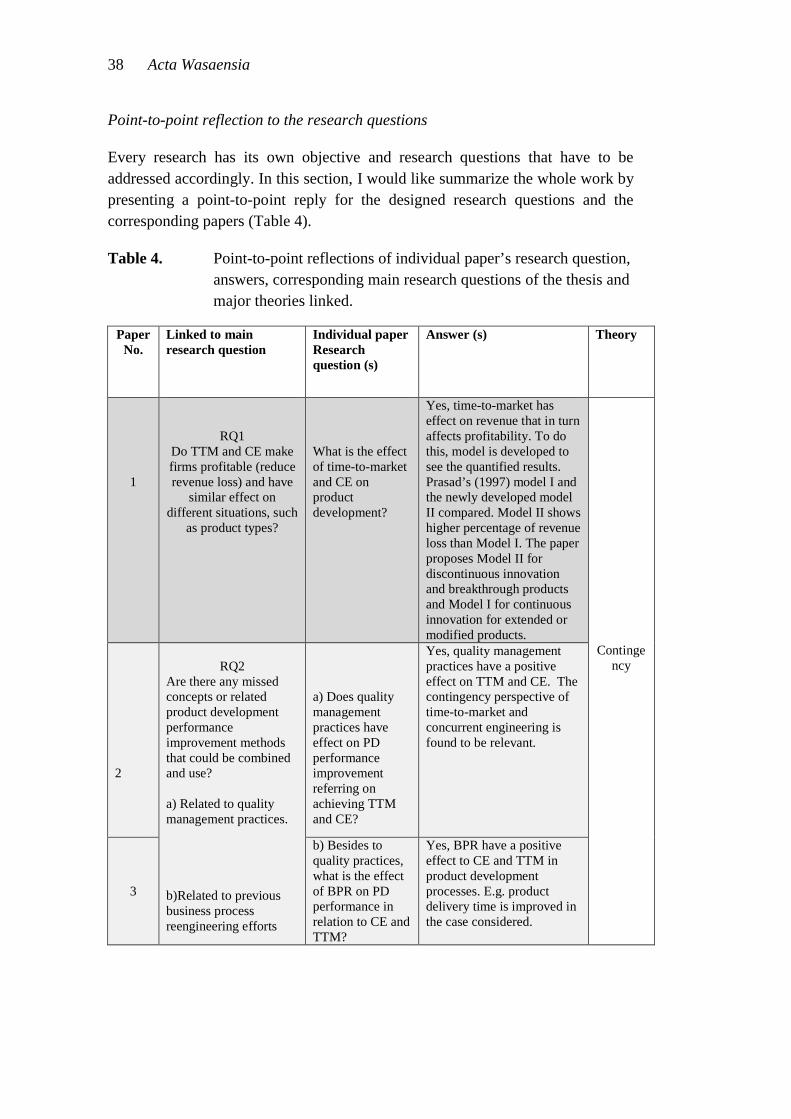
38 Acta Wasaensia
Point-to-point reflection to the research questions
Every research has its own objective and research questions that have to be addressed accordingly. In this section, I would like summarize the whole work by presenting a point-to-point reply for the designed research questions and the corresponding papers (Table 4).
Table 4. Point-to-point reflections of individual paper’s research question, answers, corresponding main research questions of the thesis and major theories linked.
Paper No.
Linked to main research question
Individual paper Research question (s)
Answer (s) Theory
1
RQ1 Do TTM and CE make firms profitable (reduce revenue loss) and have
similar effect on different situations, such
as product types?
What is the effect of time-to-market and CE on product development?
Yes, time-to-market has effect on revenue that in turn affects profitability. To do this, model is developed to see the quantified results. Prasad’s (1997) model I and the newly developed model II compared. Model II shows higher percentage of revenue loss than Model I. The paper proposes Model II for discontinuous innovation and breakthrough products and Model I for continuous innovation for extended or modified products.
Contingency
2
RQ2
Are there any missed concepts or related product development performance improvement methods that could be combined and use? a) Related to quality management practices. b)Related to previous business process reengineering efforts
a) Does quality management practices have effect on PD performance improvement referring on achieving TTM and CE?
Yes, quality management practices have a positive effect on TTM and CE. The contingency perspective of time-to-market and concurrent engineering is found to be relevant.
3
b) Besides to quality practices, what is the effect of BPR on PD performance in relation to CE and TTM?
Yes, BPR have a positive effect to CE and TTM in product development processes. E.g. product delivery time is improved in the case considered.
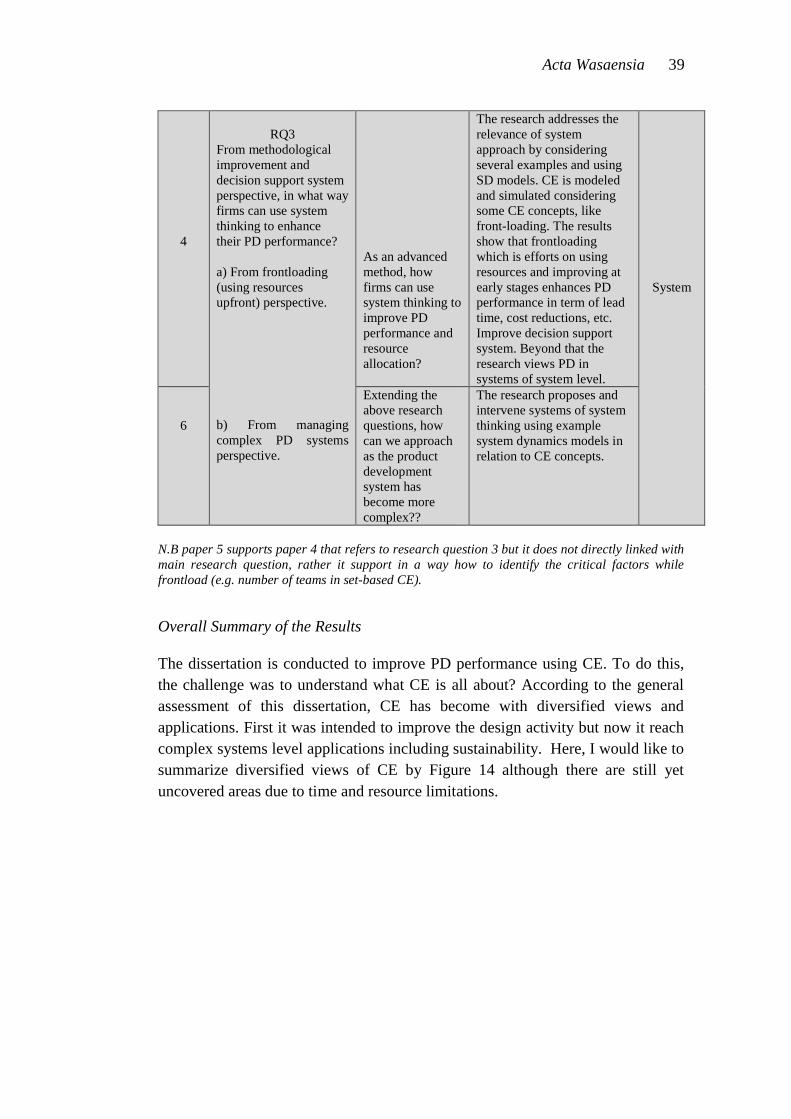
Acta Wasaensia 39
4
RQ3
From methodological improvement and decision support system perspective, in what way firms can use system thinking to enhance their PD performance? a) From frontloading (using resources upfront) perspective. b) From managing complex PD systems perspective.
As an advanced method, how firms can use system thinking to improve PD performance and resource allocation?
The research addresses the relevance of system approach by considering several examples and using SD models. CE is modeled and simulated considering some CE concepts, like front-loading. The results show that frontloading which is efforts on using resources and improving at early stages enhances PD performance in term of lead time, cost reductions, etc. Improve decision support system. Beyond that the research views PD in systems of system level.
System
6
Extending the above research questions, how can we approach as the product development system has become more complex??
The research proposes and intervene systems of system thinking using example system dynamics models in relation to CE concepts.
N.B paper 5 supports paper 4 that refers to research question 3 but it does not directly linked with main research question, rather it support in a way how to identify the critical factors while frontload (e.g. number of teams in set-based CE).
Overall Summary of the Results
The dissertation is conducted to improve PD performance using CE. To do this, the challenge was to understand what CE is all about? According to the general assessment of this dissertation, CE has become with diversified views and applications. First it was intended to improve the design activity but now it reach complex systems level applications including sustainability. Here, I would like to summarize diversified views of CE by Figure 14 although there are still yet uncovered areas due to time and resource limitations.
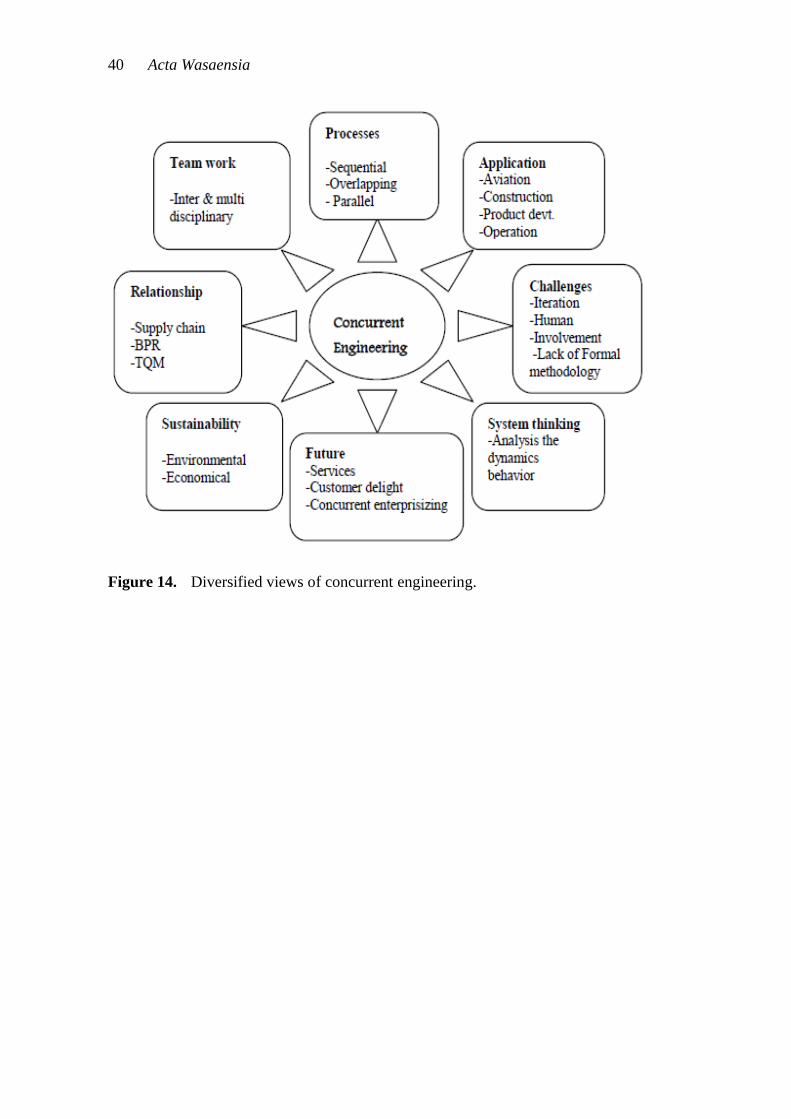
40 Acta Wasaensia
Figure 14. Diversified views of concurrent engineering.
Acta Wasaensia 41
6 CONCLUSION, LIMITATIONS AND FUTURE OUTLOOK
The research serves to gain insight how to enhance product development performances using CE and look CE in different perspectives. The study has three main sections which help to minimize product development time, improve quality and reduce cost. The first one is time-to-market to show its benefit to reduce the revenue loss by using the right innovation for the right product. Second, investigate the effects of CE related methods, such as, quality practices and business process re-engineering. Third, make a quantified study on CE how to use system thinking using system dynamic modeling, systems of system approach, to improve decision support system in a way manager could clearly see the product development performance. The overall research is grounded on the two management theories, namely, system and contingency theories. These theories have a contribution in one way or the other to individual papers which are included in this dissertation.
The research is conducted using mixed research methodology, i.e. both qualitative and quantitative methods. The current and previous body of relevant literature was reviewed to build the conceptual research framework, mathematical modeling, system dynamics and simulations are used to quantify some of CE efforts, semi-structured and unstructured interviews were conducted in the case companies based on some pre-defined frameworks.
The results show that, the multi-dimensional views of CE help to improve product development and business performance in terms of several dimensions, such as, time, quality and cost. To begin with from the outcomes of time perspective, e.g. the time-to-market model which is developed in this re-search provides a new perspective for managers to make decisions for which type of product what type of innovation to use so that they can minimize the total revenue loss. The result of the new model compared with the previous one which is developed by Prasad (1997). It is found that the new model would be appropriate for discontinuous innovation and breakthrough products, whereas Prasad’s model for continuous innovation for extended or modified products. From quality and related approaches (e.g. TQM and BPR) perspective, CE has positive relationship. That is firms who have been implemented some quality management practices and business process re-engineering showed better results on product development performances, e.g. shorten development time and improve delivery time. The third perspective, which this research found is, that the significance of look in to product development using system approach. Attempts are made to quantify CE using system dynamics models and introducing systems of system approach. The
42 Acta Wasaensia
simulation result showed that using more resources in the upfront product devel-development stage (front-loading) reduces the total cost and development time significantly. Furthermore, the research intervene systems of system approach to show how product managers can treat complex systems by breaking down in to smaller systems. For example, in this research, product development is considered as systems of systems level and individual functions like marketing as system. Since resource allocation is important in CE, especially while front-loading, SCFI is proposed to this research. The conceptual and mathematical models included in this dissertation contribute to the body of knowledge for time based competition in general and to broadened CE in particular.
The dissertation’s findings have both theoretical and practical implications. Be-sides to the theories, qualitative and quantitative data are used to support managerial implications. The theoretical perspective encompasses the research that ex-tended TTM model and compare with the results of previous model, develop different system dynamic models in relation with CE and decision making, and apply some theories to build conceptual models. From practical perspective, this study discussed some product performance improvement methods, such as, quality practices, BPR, SCFI in manufacturing and construction firms. The results showed a positive outcome from combining and using different approaches together given that with limited parameters.
However, the practical implications give managers to view CE in different perspective and use it in combination with related management approaches, such as BPR, etc. The proposed conceptual and system dynamics models are developed based on theoretical facts (e.g. marketing theories), and therefore, managers could use as a guidance for advanced managerial decisions by incorporating some parameters which are not included in this research.
Limitations of the Research
It is eminent to have some limitations while doing such multi-perspective research. In this section, few words of caution and limitations are in order. The multi-view and holistic approach of CE to enhance product development performance may not work in all situations. Although some positive results are registered with limited parameters, it may require extraordinary efforts on each of the product development processes and all involved stakeholders. Few limitations while con-ducting these are:
Limited numbers of manufacturing firms are considered so that it is difficult to generalize and conclude in the overall efforts to improve
Acta Wasaensia 43
product development performance using CE. For example, some nega-tive result may come out while combining BPR and CE in other cases. So, additional and consistent research may be required.
The models both system dynamics and conceptual models may need some additional practical test by incorporating relevant parameters.
This research is focused primarily on methodological and performance improve-ment by viewing CE from different angles. I believe and previous research de-picts supply chain, information technology and other related functions play a sig-nificant role in CE. However, this are intentionally left delimitations of this re-search for simplicity and therefore, parameters that are linked with these issues are not included in this research and perhaps this could serve as the future space for further research in CE.
Future Outlook
The research attempted to show different perspectives of CE. As literature de-picts, CE has becomes more diversified in its spectrum. It is believed and some recorded results reveal that looking CE in different views brings significant ad-vantages but may also have its own challenges. Hence, it is important to approach systematically to get the best result out of it. To do this, system thinking and sys-tems of system would help in a way by breaking the bigger complex systems of product development processes in to small controllable and manageable subsys-tems. There are some crucial points, like sustainability (Epinger, 2011), infor-mation technology, etc. that need to be addressed to have a better all-rounded product development processes and its performance improvement. Therefore, the future research in relation to CE would be linking these crucial attributes which are not covered in this dissertation.
44 Acta Wasaensia
REFERENCES
Abdalla, H.S. (1999). Concurrent engineering for global manufacturing. Interna-tional Journal of Production Economics 60–61:1, 251–260.
Akman, G. & Yilmaz, C. (2008). Innovative capability, innovation strategy and market orientation: an empirical analysis in Turkish software industry. Interna-tional Journal of Innovation Management 12:1, 69–111.
Anumba C.J., Baugh, C. & Khalfan, M.A. (2002). Organizational structures to-support concurrent engineering. Industrial Management and Data Systems 102:5, 260–270.
Anumba, C.J., Kamara, J.M. & Cutting-Decelle, A.F. (2007). Concurrent Engi-neering in Construction Projects. New York: Taylor and Francis.
Anumba, C.J., Siemieniuch, C.E. & Sinclair, M.A. (2000). Supply chain implica-tions of concurrent engineering. International Journal of Physical Distribution and Logistics Management 30:7/8, 566–597.
Basdogan, Ipek (2009). Collaborative design and modeling of complex optome-chanical systems. Concurrent Engineering Research and Applications 17:1, 73–87.
Belay, A.M. & Takala, J. (2011). Application of Improved CFI Model on Attrib-utes of Customer Satisfaction, Technology Innovation and Industrial Manage-ment conference, 28–30 June, 2011, Oulu, Finland.
Bernard, A., Perry, N. & Delplace, J.C. (2007). Concurrent cost engineering for decisional and operational process enhancement in a foundry. International Jour-nal of Production Economics 109:1–2, 2–11.
Bicheno, J. (2004). The New Lean Toolbox: Towards Fast, Flexible Flow. 3rd ed.. Buckingham: PICSIE Books.
Black, K. & Revere, L. (2006). Six Sigma arises from the ashes of TQM with a twist. International Journal of Health Care Quality Assurance 19:3, 259–266.
Bovey, C. (1994). Business process re-engineering: Concurrent engineering pro-cess. IEEE, pp. 10/1–10/9.
Brookes, N.J. & Backhouse, C.J. (1997). Variety and concurrent engineering. Manufacturing Engineer 76:2, 72–75.
Brooks, B. (1996). Realizing the benefit of concurrent engineering through BPR. IEEE Computing and Control Journal 7:2 (April), 63–68.
Acta Wasaensia 45
Browning T.R., Fricke E. & Negele H. (2006). Key concepts in modeling product development processes. Systems Engineering 9:2, 104–128.
Bryman, A. (2008). Social Research Methods. 3rd Ed. Oxford: Oxford University Press.
Caron, J.R., Järvenpää, S.L. & Stoddard, D.B. (1994). Business reengineering at Cigna Corporation: Experiences and lessons learned from the first five years. MIS Quarterly 18, 233–250.
Choi, T.Y. & Eboch, K. (1998). The TQM paradox: Relations among TQM prac-tices, plant performance, and customer satisfaction. Journal of Operations Man-agement 17, 59–75.
Chou, S., Trappey, A., Pokojski, J. & Smith, S. (2009). Global Perspective for Competitive Enterprise, Economy and Ecology. Proceedings of the 16th ISPE International Conference on Concurrent Engineering 20–24 July 2009, Taiwan.
Cleetus, K.J. (1992). Definitions of Concurrent Engineering, CERT Technical Report Series, Research Note, CERC-TR-RN-92-003, Concurrent Engineering Research Centre, West Virginia University, Mortgantown, USA, pp. 1–5.
Davenport, T.H. (1993). Process Innovation – Reengineering Work Through In-formation Technology. Ernest and Young, Harvard Business School Press.
Davenport, T.H. & Short, J.E. (1990). The new industrial engineering: Infor-mation technology and business process redesign. Sloan Management Review 31:4, 11–27.
Dawson, A. (2010). A case study of impact measurement in a third sector umbrel-la organization. International Journal of Productivity and Performance Manage-ment 59:6, 519–533.
Dowlatshahi, S. (1995). An integrated manufacturing system design: an applied approach. International Journal of Production Economics 42:2, 187–199.
Dennis, P. (2002). Lean Production Simplified: A Plain Language Guide to the World's Most Powerful Production System. New York: Productivity Press.
Eppinger, S. (2011). The fundamental challenge of product design. Journal of Product Innovation and Management 28, 399–400.
Ford, D.N. & Sterman, J.D. (2003). Overcoming the 90% Syndrome: Iteration Management in Concurrent Development Projects. Concurrent Engineering: Re-search and Applications 11, 177–186.
Gascoigne, B. (1995). PDM: the essential technology for concurrent engineerin. World Class Design to Manufacture 2:1, 38–42.
46 Acta Wasaensia
Grover, V. & Kettinger, W. (2000). Process Think: Winning Perspectives for Business Change in the Information Age. Harrisburg, PA: Idea Group.
Gunasekaran, A. (1998). An integrated product development-quality management system formanufacturing. The TQM Magazine 10:2, 115–123.
Hammer, M. (1990). Re-engineering work: Don’t automate, obliterate. Harvard Business Review 68:4, 104–112.
Hammer, M. & Champy, J. (1993). Re-engineering the Corporation – A Manifes-to for Business Revolution. New York: Harper Business.
Hafeez, K., Malak, N. & Abdelmeguid, H. (2006). A framework for TQM to achieve business excellence. Total Quality Management 17:9, 1213–1229.
Hannus, J. (1993). Process Management: Core Processes Re-engineering and Corporate Performance. Espoo, Finland: HM &V Research.
Haque, B., Pawar, K.S. & Barson, R.J. (2000). Analyzing organizational issues in concurrent new product development. International Journal of Production Eco-nomics 67, 169–182.
Harding, J.A., Omar, A.R. & Popplewell, K. (1999). Applications of QFD within a concurrent engineering environment. International Journal of Agile Manage-ment Systems 1:2, 88–98.
Harmancioglu, N., McNally, R.C., Calantone, R.J. & Durmusoglu, S.S. (2007). Your new product development (NPD) is only as good as your process: an ex-ploratory analysis of new NPD process design and implementation. R&D Man-agement 37, 339–424.
Harrison, J.R., Lin, Z., Carroll, G.R. & Carley, K.M. (2007). Simulation modeling in organizational and management research. Academy of Management Review 32, 1229–1245.
Herder, P.M. & Weijnen, M.P.C. (2000). A concurrent engineering approach to chemical process design. International Journal of Production Economics 64, 311–318.
Hindle, T. (2008). Guide to Management Ideas and Gurus. The economist in as-sociation with Profile Books Ltd.
Hjorland, B. & Nicolaisen, J. (2005). The Epistemological Lifeboat. Copenhagen: Royal School of Library and Information Science. Retrieved November 15, 2012 http://www.iva.dk/jni/lifeboat_old/Positions/Systems%20theory.htm.
Hoedemaker, G.M., Blackburn, J.D. & Van Wassenhove, L.N. (1999). Limits of concurrency. Decision Sciences 30, 1–18.
Acta Wasaensia 47
Hoppmann, J., Rebentisch, E., Dombrowski, U. & Zahn, T. (2011). A framework for organization lean product development. Engineering Management Journal 23:1, 3–15.
Jarvis, M. (1999). Concurrent engineering. Work Study 48, 88–91.
Jaworski, B.J. & Kohli, A.K. (1993). Market orientation: antecedents and conse-quences. Journal of Marketing 57, 53–70.
Jiao, L.M., Khoo, L.P. & Chen, C.H. (2004). An intelligent concurrent design task planner for manufacturing systems. Int J Adv Manuf Technol 23:9–10, 672–681.
Johnson, R.B. & Onwuegbuzie, A.J. (2004). Mixed Methods research: a research paradigm whose time has come. Educational Researcher 33:7, 14–26.
Karbhari, V.M. et.al. (1994). Total quality design: An approach for customer sat-isfaction in critical advanced technologies. Benchmarking for Quality Manage-ment and Technology 1:1, 65–88.
Kleiner, A. (2000). Revisiting reengineering. Strategy and Business 20, 27–31.
Koskela, L.J. (2007). Foundations of concurrent engineering. In: Concurrent En-gineering in Construction Projects. Oxford: Taylor and Francis. 12–29.
Koufteros, X.A., Vonderembse, M. & Doll, W. (2001). Concurrent engineering and its consequences. Journal of Operations Management 19:1, 97–115.
Krishnan, V., Eppinger, S.D. & Whitney, D.E. (1997). A model-based framework to overlap product development activities. Management Science 43:3, 437–451.
Kuei, C., Madu, C.N. & Lin, C. (2001). The relationship between supply chain quality management practices and organizational performance. International Journal of Quality and Reliability Management 16:8, 864–872.
Kumar, R. & Midha, P.S. (2001). A QFD based methodology for evaluating a company’s PDM requirements for collaborative product development. Industrial Management and Data Systems 101:3, 126–131.
Laakso, T. (1997). Performance Evaluation and Process Intervention – A Method for Business Process Development. Espoo: Helsinki University of Technology.
Landeghem, R.V. (2000). Experiences with a concurrent engineering self-assess-ment tool. International Journal of Production Economics 64, 295–309.
Laureani, A. and Antony, J. (2010). Reducing employees’ turnover in transac-tional services: a Lean Six Sigma case study. International Journal of Productivi-ty and Performance Management 59:7, 688–700.
48 Acta Wasaensia
Li, Y., Jian, J., Yan, R. & Liao, W. (2009). Aircraft tooling collaborative D sign based on multi-agent and PDM. Concurrent Engineering: Research and Applica-tions 7:2, 139–146.
Liker, J.K. & Morgan, J. (2011). Lean product development as a system: A case study of body stamping development at Ford. Engineering Management Journal 23:1, 16–28.
Lindquist, A., Berglund, F. & Johannesson, H. (2008). Supplier Integration and Communication Strategies in Collaborative Platform Development. Concurrent Engineering Research and Application 16:1, 23–35.
Luh, D.B., Ko, Y.T. & Ma, C.H. (2009). A dynamic planning approach for new product development. Concurrent Engineering: Research and Applications 17:1, 43–59.
Mackenzie, N. & Knipe, S. (2006). Research Dilemas: Paradigms, Methods and Methodology. Issues in Educational Research 16:2, 193–205.
Maffin, D. & Braiden, P. (2001). Manufacturing and supplier roles in product development. Intl. J. Production Economics 69:2, 205–213.
Mäkinen, J.T. (2011). Concurrent Engineering Approach to Plastic Optics De-sign. PhD dissertation. Faculty of Technology of the University of Oulu, Finland.
Mani, T.P., Murugan, N. & Rajendran, C. (2003). TQM is a must for success, but not sufficient for survival: a conceptual framework as contemplated in ancient Tamil literature in India. Total Quality Management 14:4, 395–405.
Marujo, L.G. (2009). Rework impacts evaluation through system dynamics ap-proach in overlapped product development schedule. Journal of Technology Management and Innovation 4:2, 90–101.
Melin, T., Isikveren, A.T., Rizzi, A., Stamblewski, C. & Anders, H.V. (2007). How industry concepts of concurrent engineering enhance aircraft design educa-tion. J. Aerospace Engineering Proc. IMechE 221,Part G.
Moffat, L.K. (1998). Tools and teams: Competing models of integrated product development project performance. Journal of Engineering Technology and Man-agement 15, 55–85.
Morgan, D.L. (1998). Practical strategies for combining qualitative and quantita-tive methods: applications to health research. Qualitative Health Research 8:3, 362–376.
Morgan, J.M. & Liker, J.K. (2006). The Toyota Product Development System: Integrating People, Process and Technology. New York: Productivity Press.
Acta Wasaensia 49
Murman, E.M., Walton, M. & Rebentisch, E. (2000). Challenges in the better, faster, cheaper era of aeronautical design, engineering, and manufacturing. Aero-nautical Journal 104:1040, 481–489 (October).
Najmi M. & Ip-Shing F. (2002). Concurrent Engineering in Total Quality Man-agement Environment. 8th International Conference on Concurrent Enterprising, Rome, Italy.
Nicoletti, S. & Nicolo, F.A. (1998). Concurrent engineering decision model: Management of the project activities information flows. Int. J. Production Eco-nomics 54:2, 115–127.
Ozcelik, Y. (2010). Do business process reengineering projects payoff? Evidence from the United States. International Journal of Project Management 28:3, 7–13.
Pettersen, J. (2009). Defining Lean production: some conceptual and practical issues. Journal of TQM 21, 127–142.
Poeth, D.F. (1990). Concurrent Engineering – Key to Cost-Effective Product Re-liability, Maintainability, and Manufacturability. Proceedings R&M and CAE in Concurrent Engineering Workshop, 9–11 Oct. 1990 Leesburg, USA.
Prasad, B. (1997). Analysis of pricing strategies for new product introduction. Journal of Product and Brand Management 5:4, 132–141.
Prasad, B. (1996). Concurrent Engineering Fundamentals: Integrated Product and Process Organization. USA: Prentice Hall.
Qian, Y., Xie, M., Goh, T.N. & Lin, J. (2010). Decision support optimal testing strategies in overlapped design process. European Journal of Operational Re-search 206:1, 131–143.
Quesada, G., Syamil, A. & Doll, W.J. (2006). OEM new product development practices: The case of the automotive industry. Journal of Supply Chain Man-agement 42:3, 30–40.
Ranky, P.G. (1994). Features concurrent engineering and enterprise modeling. Assembly Automation 14:3, 14–21.
Ranta, J.M. & Takala, J. (2007). A holistic method for finding out critical features of industry maintenance services. International Journal of Services and Standards 3: 3, 312–325.
Raudberget, D. (2010). Practical applications of set-based concurrent engineering in industry Strojniški vestnik. Journal of Mechanical Engineering 56:11, 685–695.
50 Acta Wasaensia
Radeka, K. & Sutton, T. (2007). What is “lean” about product development? An Overview of Lean Product Development PDMA ,Visions, June 2007,Vol. XXXI, No. 2, pp. 11–15.
Rolstadas, A. (1995). Planning and control of concurrent engineering projects. International Journal of Production Economics 38:1, 3–13.
Sale, J.E.M., Lohfield, L. & Brazil, K. (2002). Revisiting the quantitative-qualitative debate: implications for mixed-methods research. Quality and Quanti-ty 36:1, 43–53.
Sebastianelli, R. & Tamimi, N. (2003). Understanding the obstacles to TQM suc-cess. The Quality Management Journal 10:3, 45–56.
Slater, S.F. & Narver, J.C. (1994). Does competitive environment moderate the market orientation performance relationship? Journal of Marketing 58, 46–55.
Smith, R.P. (1997). The historical roots of concurrent engineering fundamentals. IEEETrans Eng Management 44:1, 67–78.
Stanko, M.A., Molina-Castillo, .F.-J. & Munuera-Aleman, J.-L. (2012). Speed to market for innovative products: blessing or curse? The Journal of Product Inno-vation Management 29:5, 751–765.
Sterman, J.D. (2000). Business Dynamics: Systems Thinking and Modeling for a Complex World. New York: Irwin McGraw-Hill.
Sun, H. & Zhoa, Y. (2010). The empirical relationship between quality manage-ment and the speed of new product development. Total Quality Management 21:4, 351–361.
Sun, H., Zhao, Y. & Hon Keung Yau, H.K. (2009). The relationship between quality management and the speed of new product development. The TQM Jour-nal 21, 576–588.
Tan, C.L. & Tracey, M. (2007). Collaborative new product development envi-ronments: implications for supply chain management. The Journal of Supply Chain Management 43:3, 2–15.
Tennant, C. & Wu, Y.C. (2005). The application of business process reengineer-ing in the UK. The TQM Magazine 17:6, 537–545.
Treacy, M. & Weirsema, F. (1993). Customer Intimacy and other value disci-plines. Harvard Business Review 71:1, 84–93.
Tucker, D. & Hackney, R. (2000). Towards the integration of concurrent engi-neering environments within organizational strategy. Journal of management de-velopment 19:3, 179–189.
Acta Wasaensia 51
Valle, S. & Va´zquez-Bustelo, D. (2009). Concurrent engineering performance: Incremental versus radical innovation. International Journal of Production Eco-nomics 119, 136–148.
Veryzer, R.W. & De-mozota, B.B. (2005). The impact of user oriented design on new product development: An examination of fundamental relationships. Journal of Product Innovation Management 22, 128–143.
Waddell, D. & Mallen, D. (2001). Quality mangers: beyond 2000? Total Quality Management 12, 373–384.
Walker, O.C. & Ruekert, R.W. (1987). Marketing’s role in the implementation of business strategies: a critical review and conceptual framework. Journal of Mar-keting 51, 15–33.
Wheelwright, S.C. & Clark, K.B. (1992). Revolutionizing Product Development, Quantum Leaps in Speed, Efficiency, and Quality. New York: The Free Press.
White (2009). Developing Research Questions: Aguide for Social Scientists. Ba-singstoke: Palgrave Macmillan.
Willaert, S.S.A., De-graaf, R. & Minderhoud, S. (1998). Collaborative engineer-ing: A case study of concurrent engineering in a wider context. Journal of Engi-neering Technology Management 15, 87–109.
Winner, R.I., Pennell, J.P., Bertrand, H.E. & Slusarezuk, M.M.G. (1988). The role of concurrent engineering in weapon systems acquisition. Institute for De-fense Analysis, IDA Report R-338, Alexandria, VA, USA.
Young, M. (2000). Engineering Idle Time Metrics. Presented at the LAI Product Development Winter 2000 Workshop, January 26–28, 2000, Fulsom, CA.
Yassine, A. & Braha, D. (2003). Four complex problems in concurrent engineer-ing and the design structure matrix method. Concurrent Engineering Research and Applications 11:3, 165–176.

Acta Wasaensia 53
60 Int. J. Innovation and Learning, Vol. 10, No. 1, 2011
Copyright © 2011 Inderscience Enterprises Ltd.
Time-to-market and concurrent engineering in product development processes
Alemu Moges Belay*, Tauno Kekäle and Petri Helo Department of Production, University of Vaasa, PO Box 700, FI-65101,Vaasa, Finland E-mail: [email protected] E-mail: [email protected] E-mail: [email protected] E-mail: [email protected] *Corresponding author
Abstract: Nowadays time based strategy has become a competitive weapon for many industries. This article investigates whether companies should always follow learning curve for all types of innovation and products or not. New time to market model is proposed and compared with previous model by Prasad (1997). Products of 6 to 36 months market window time are considered and the results of revenue loss from these two models are different. This gives an insight for managers to take appropriate decision on which for what. From the result, Model I would be appropriate for continuous innovation and modified or extended products whereas Model II for discontinuous innovation and breakthrough products.
Keywords: time to market; concurrent engineering; CE; product development; discontinuous innovation; continuous innovation.
Reference to this paper should be made as follows: Belay, A.M., Kekale, T. and Helo, P. (2011) ‘Time-to-market and concurrent engineering in product development processes’, Int. J. Innovation and Learning, Vol. 10, No. 1, pp.60–84.
Biographical notes: Alemu Moges Belay is a PhD student at University of Vaasa, Finland and has few years experience in companies. His research interest is concurrent engineering, collaborative product development, sustainable product development innovation and statistical quality control.
Tauno Kekäle is a Research Professor in Department of Production, University of Vaasa. His research interest is product development, TQM, innovation and knowledge management. His papers have been published in several international journals.
Petri Helo is a Research Professor in Department of Production, University of Vaasa. His research interests are in the area of technology management and production/operations management. His papers have been published in several international journals.
54 Acta Wasaensia
Time-to-market and concurrent engineering 61
1 Introduction
Many industries has been working to change the balance of competition by time-based strategies and able to improve time to market through new product management systems and practices. As a result, impressive gain has been found in the development productivity for the last few decades. The changing market conditions (such as global manufacturing, economy, and new innovation), and international competitiveness are making the time-to-market a fast shrinking target (Prasad, 1997). Innovative capability is influenced by efforts done on new technology development. In environments where technologies change frequently and rapidly, firms need to make innovations in order to sustain their performance (Akman and Yilmaz, 2008). Even though the complexity of the products increases, the time to produce and introduction to market become short. A good example is the automotive industry. Automobiles which are produced at present are more complex than previously produced but take less time to be manufactured and introduced to market. On average, most companies reduced their time to market by 40 to 60% across all new products. In some industries such as Pharmaceuticals, development cycle were reduced by less than that, but were still reduced by two to three years (McGrath, 2004). Codex division of Motorola cut its average product development time by 46% over a two year period. Similarly Bolt, Bernake and Newman dramatically reduced time-to-market by 50–60% for the first product developed with its new process. Project costs could be reduced by properly managed time to market implementation. The time reduced during the product development process may bring short resource assignments. For instance, a 36 month completed project may cost more than 18 months project depending on the additional resources which is needed for a short time.
Companies which implement successful time to market strategy reduce the waste of development and improve the success of new product by targeting to customer needs. Customer needs and requirements could be understood and be incorporated in new products by integrating all functions from the beginning during the process of product development. Due to its superb performance improvements, quality function deployment (QFD) has been successfully used in a wide variety of organisations (Menon et al., 1994). QFD is used as a tool for incorporating customer requirements and makes the development process fast in many companies. According to Politis (2005) QFD is seen as a pointed way of listening to customers to learn exactly what they want, and then using a logical system (i.e., vehicle) to determine how best to fulfil those needs with available resources.
Collaborative innovation focuses on project portfolios that have multiple goals such as strategic objectives and performance indicators that act as a constraint on their funnel (Lawrence and David, 2007). Strategic advantage is one of the benefits of companies which follow time to market philosophy. Companies introducing more new products, reacting faster to market and technology changes, and developing superior products are winning the battle over competitors. (Kotler, 1988) pioneered that failure to respond to competitive new product introductions (NPI) with required speed results in late market entry, may lead to a permanent loss of market share and dissipated profits. If we talk about early introduction or time based strategy, the first thing that comes in to our mind is how to reduce the time to enter early to the market. Concurrent engineering (CE) provides a way to bring the product in to the market place early (CE fundamentals Volume 1). CE, sometimes called simultaneous engineering or parallel engineering, has
Acta Wasaensia 55
62 A.M. Belay et al.
been defined in several ways by different authors. The most popular one is that by Winner et al., (1988), who state that CE is a systematic approach to the integrated, concurrent design of products and their related processes, including manufacture and support. This approach is intended to cause the developers, from the outset, to consider all elements of the product life cycle from conception through disposal, including quality, cost, schedule, and user requirements. Thus CE is about team work, company competitiveness, communication, commitment, culture, customer satisfaction, and early attention to manufacturing, test and support issues.
According to Von Braun (1990), reducing product life cycle endlessly is impossible, difficult to maintain and even care should be taken on replacing the old product by new ones in life cycle shrinking processes. (Smith and Reinersten, 1998) claimed that time to market is not a universal solution and the benefit may vary form project to project or company to company depending on different factors. Improving the process of time to market enables minimise labour resources, more predictable schedules, and increase flexibility to make changes midstream without disruption. But some literatures indicate some projects failed to improve time to market by using CE. For instance, one of the main reasons of failure according to Tucker and Hackney (2000) is lack of formal methodology. We consider product cycle as one of the important factor in the formal methodology and analyse it with different time frame. This paper would like to extend Smith and Reinersten idea and see the effect of time to market between projects specifically on product development with short and long cycle time. What would be the result and effect of Biren Prasad time to market representation model, if we apply for extended or longer cycle time products? It is believed that the output of this comparison gives managers a clue for decision making with better approximation of the revenue loss or gain in product development processes.
The first section of the paper discusses about the effect of development time on profitability and the requirement of convergence of ideas to get well engineered products and clearly defined processes of marketing and manufacturing. The second part of the paper illustrates about the role of project management on time to market and the importance of collaboration to reduce product development time. Next to that the paper explains about integrated product strategy and a method of minimising development time by comparing CE versus linear model. Finally model development, discussions and conclusions are made.
2 The effect of development time on profitability
Lifecycle of a product, which limits the duration of OEMs can make profit, has been reduced due to the existing strong competition and varying customer requirements (Echtelt, 2004). Understanding the relationship between product volume and expenditure during product development is an important factor for product profitability that helps to win the market share. According to (Prasad, 1997), one weakness of NPI is the elapsed time required to bring the product to market and early introduction tends to have a very positive effect on the resulting sales-volume and profit of the company. At the beginning, no revenue is generated and income would be negative and shows positive after the production unit start to ship. Profit is calculated from the difference between cost of production and the income earned assuming that cost of production includes cost of marketing, sales and administration and etc. Factors like price, volume, time affects the
56 Acta Wasaensia
Time-to-market and concurrent engineering 63
return of new product expenditure which would be improved by short product development cycles. Due to the design delay, the production delivery may not meet schedule. During the product development, financial metrics are highly affected by lateness. This Phenomenon has four effects:
1 cost of development increase because of extended time and also customers are not attracted (other competitive solutions may be emerged)
2 the volume of the unit will not be enough
3 because of increased price competition, the net profit is reduced
4 return on investment shows negative (initial investment is greater than profit).
Time will be the main variable for primary mode of competitiveness in the next decade’s product development processes. Overlapping product development activities is important components of concurrent product development that can help firms develop products faster (Krishinan et al., 1997). Good design department is differentiated by the ability of developing products faster. Products which were developed by twenty months will need to be developed in ten months and those which took twelve months may need four months depending on technology, strategy, organisational capacity and requirements.
2.1 Convergence of ideas for creative product development process
Creativity is clearly identified with the generation of ideas whereas innovation implies the transformation of these ideas into a new product or service for someone to buy or use (Alves et al., 2009). Creative ideas must actually be implemented and turned into actual innovations in order to be of any real organisational use (Mathisen and Einarsen, 2004).
One of the important part and fundamental thought of simultaneous engineering is the concept of convergence in which the large scale collaboration thinking leads to understanding of the market, ideas for innovation, process and product knowledge. (Bergman, 2005; Leonard and Sensiper, 1998) claim that, as a result of search, exploration and synthesis of divergent knowledge, a common understanding can be aggregated and created over the innovation process, and finally the process converges into solutions and innovative ideas. The outputs of convergence are well engineered products and organised (clearly defined) processes of marketing and manufacturing. Products as well as processes are changed rapidly from one stage to another during the product development process and learning is factored until a distinct set of processes and products emerged that can produce a highly competitive result. Convergence should not be too fast or slow in one area and should be managed properly otherwise the result would be very limiting.
As Cooper (1997) and Leonard and Sensiper (1998) said, well-managed innovation process makes it possible to channel the knowledge into new ideas and products or services. For example many concept and ideas required during the development cycle. Making the detailed design during development stage may be damaging because it may discourage the creativity of the team and restrict many ideas prior to proper process analysis and customer research have made. This leads the team throwing away some of the results if new process or information has come during the development cycle. Most of the time resistance may come from organisation and individuals since it has been taking investment of money as well as personal creativity. Such types of resets can be resolved
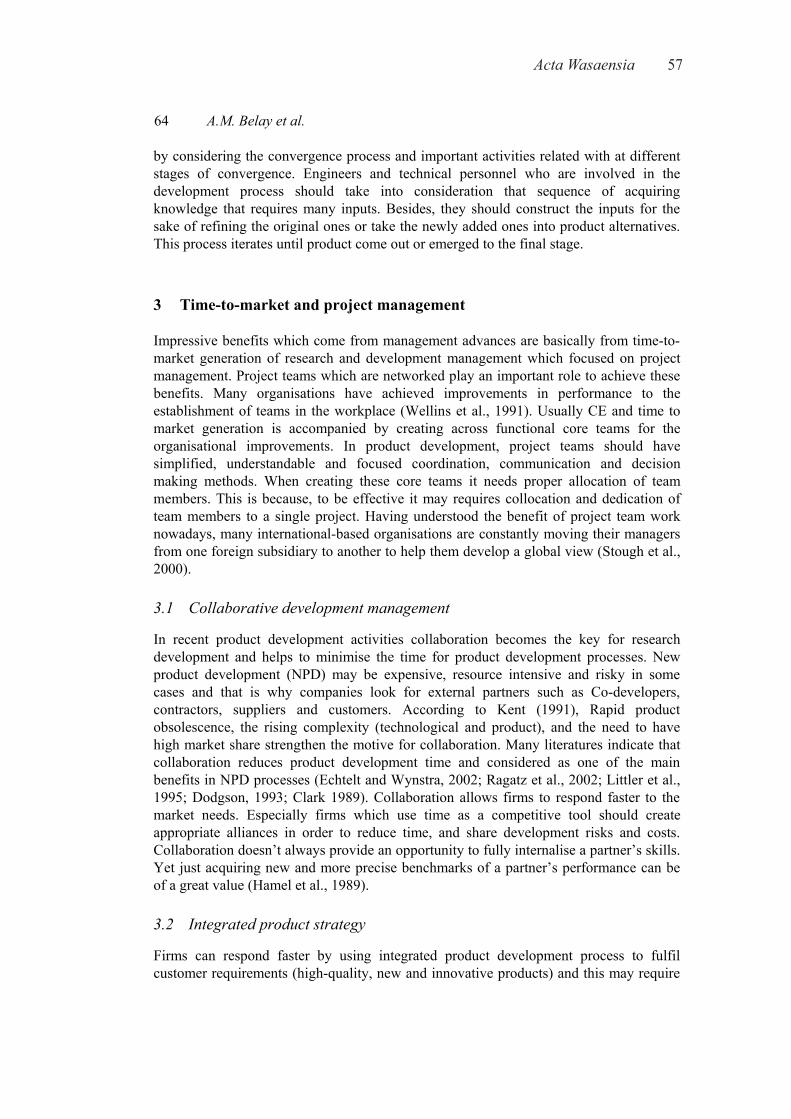
Acta Wasaensia 57
64 A.M. Belay et al.
by considering the convergence process and important activities related with at different stages of convergence. Engineers and technical personnel who are involved in the development process should take into consideration that sequence of acquiring knowledge that requires many inputs. Besides, they should construct the inputs for the sake of refining the original ones or take the newly added ones into product alternatives. This process iterates until product come out or emerged to the final stage.
3 Time-to-market and project management
Impressive benefits which come from management advances are basically from time-to-market generation of research and development management which focused on project management. Project teams which are networked play an important role to achieve these benefits. Many organisations have achieved improvements in performance to the establishment of teams in the workplace (Wellins et al., 1991). Usually CE and time to market generation is accompanied by creating across functional core teams for the organisational improvements. In product development, project teams should have simplified, understandable and focused coordination, communication and decision making methods. When creating these core teams it needs proper allocation of team members. This is because, to be effective it may requires collocation and dedication of team members to a single project. Having understood the benefit of project team work nowadays, many international-based organisations are constantly moving their managers from one foreign subsidiary to another to help them develop a global view (Stough et al., 2000).
3.1 Collaborative development management
In recent product development activities collaboration becomes the key for research development and helps to minimise the time for product development processes. New product development (NPD) may be expensive, resource intensive and risky in some cases and that is why companies look for external partners such as Co-developers, contractors, suppliers and customers. According to Kent (1991), Rapid product obsolescence, the rising complexity (technological and product), and the need to have high market share strengthen the motive for collaboration. Many literatures indicate that collaboration reduces product development time and considered as one of the main benefits in NPD processes (Echtelt and Wynstra, 2002; Ragatz et al., 2002; Littler et al., 1995; Dodgson, 1993; Clark 1989). Collaboration allows firms to respond faster to the market needs. Especially firms which use time as a competitive tool should create appropriate alliances in order to reduce time, and share development risks and costs. Collaboration doesn’t always provide an opportunity to fully internalise a partner’s skills. Yet just acquiring new and more precise benchmarks of a partner’s performance can be of a great value (Hamel et al., 1989).
3.2 Integrated product strategy
Firms can respond faster by using integrated product development process to fulfil customer requirements (high-quality, new and innovative products) and this may require
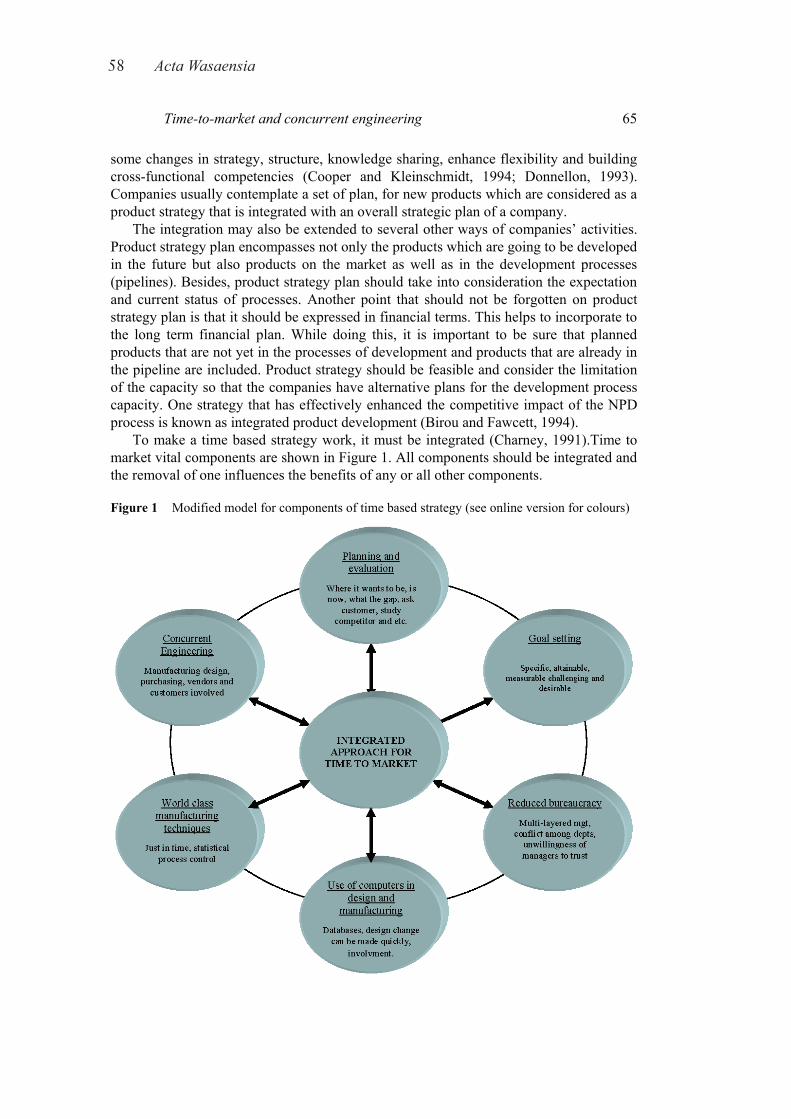
58 Acta Wasaensia
Time-to-market and concurrent engineering 65
some changes in strategy, structure, knowledge sharing, enhance flexibility and building cross-functional competencies (Cooper and Kleinschmidt, 1994; Donnellon, 1993). Companies usually contemplate a set of plan, for new products which are considered as a product strategy that is integrated with an overall strategic plan of a company.
The integration may also be extended to several other ways of companies’ activities. Product strategy plan encompasses not only the products which are going to be developed in the future but also products on the market as well as in the development processes (pipelines). Besides, product strategy plan should take into consideration the expectation and current status of processes. Another point that should not be forgotten on product strategy plan is that it should be expressed in financial terms. This helps to incorporate to the long term financial plan. While doing this, it is important to be sure that planned products that are not yet in the processes of development and products that are already in the pipeline are included. Product strategy should be feasible and consider the limitation of the capacity so that the companies have alternative plans for the development process capacity. One strategy that has effectively enhanced the competitive impact of the NPD process is known as integrated product development (Birou and Fawcett, 1994).
To make a time based strategy work, it must be integrated (Charney, 1991).Time to market vital components are shown in Figure 1. All components should be integrated and the removal of one influences the benefits of any or all other components.
Figure 1 Modified model for components of time based strategy (see online version for colours)
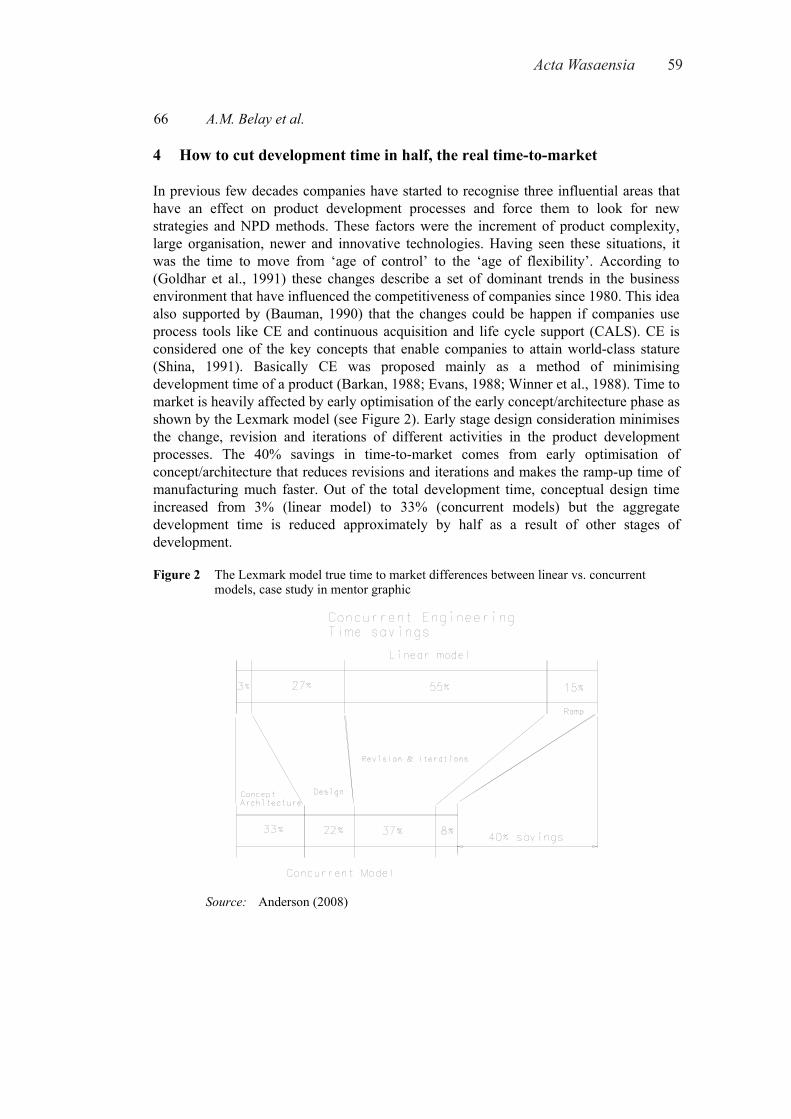
Acta Wasaensia 59
66 A.M. Belay et al.
4 How to cut development time in half, the real time-to-market
In previous few decades companies have started to recognise three influential areas that have an effect on product development processes and force them to look for new strategies and NPD methods. These factors were the increment of product complexity, large organisation, newer and innovative technologies. Having seen these situations, it was the time to move from ‘age of control’ to the ‘age of flexibility’. According to (Goldhar et al., 1991) these changes describe a set of dominant trends in the business environment that have influenced the competitiveness of companies since 1980. This idea also supported by (Bauman, 1990) that the changes could be happen if companies use process tools like CE and continuous acquisition and life cycle support (CALS). CE is considered one of the key concepts that enable companies to attain world-class stature (Shina, 1991). Basically CE was proposed mainly as a method of minimising development time of a product (Barkan, 1988; Evans, 1988; Winner et al., 1988). Time to market is heavily affected by early optimisation of the early concept/architecture phase as shown by the Lexmark model (see Figure 2). Early stage design consideration minimises the change, revision and iterations of different activities in the product development processes. The 40% savings in time-to-market comes from early optimisation of concept/architecture that reduces revisions and iterations and makes the ramp-up time of manufacturing much faster. Out of the total development time, conceptual design time increased from 3% (linear model) to 33% (concurrent models) but the aggregate development time is reduced approximately by half as a result of other stages of development.
Figure 2 The Lexmark model true time to market differences between linear vs. concurrent models, case study in mentor graphic
Source: Anderson (2008)
60 Acta Wasaensia
Time-to-market and concurrent engineering 67
4.1 Many companies have achieved double speed
Some companies have achieved to reduce product development time by half as compared to the previous few years. Indeed, it is challenging and some times difficult to bring exact comparison between companies. There are two basic reasons for that:
1 Every project is different: If companies produce variety of products, it may not have a possibility to develop product again. In this case it is difficult to measure and compare unless we know the exact differences between the development processes of same products. Some times products may be the same but the projects would not be and same problem arise to compare. Another point is some projects luckily may have better motivated and capable people than other have. This could be seen from outside as differences in order to make fast development processes but still it is difficult from project to project comparisons.
2 When and when: The second point that makes comparison difficult especially between companies is, there are no well established standards when the clock to start and when to stop. Different companies may have different way of measuring time. Many managers follow their own way of measuring time that really suit their way of making business. But, it is very important to ask how the customer would measure the development time. Though the measurement is difficult, it is not important impediments as compared to the benefits and large opportunities available for cutting product development cycle time. Doubling of speed for development process become significant even though impressive performance improvement have been achieved. That is why companies are striving to do even better than what they have got awesome result in the past.
4.2 Why develop products faster?
Different companies have different motive for rapid product development. Before accelerating the development process they should know why it is important to do things fast. This helps companies to identify and determine which tools and techniques to use and how to apply them. Accelerating development processes should not be carried out only when the current processes is out of control as many companies do. These companies try to keep the delivery schedule by repairing temporarily the problem which makes the processes out of control. Developing products faster should not be seen as a quick fix but it rather would be considered as part of a strategy which brings a lot of benefits. Some of the benefits are summarised in the following table.
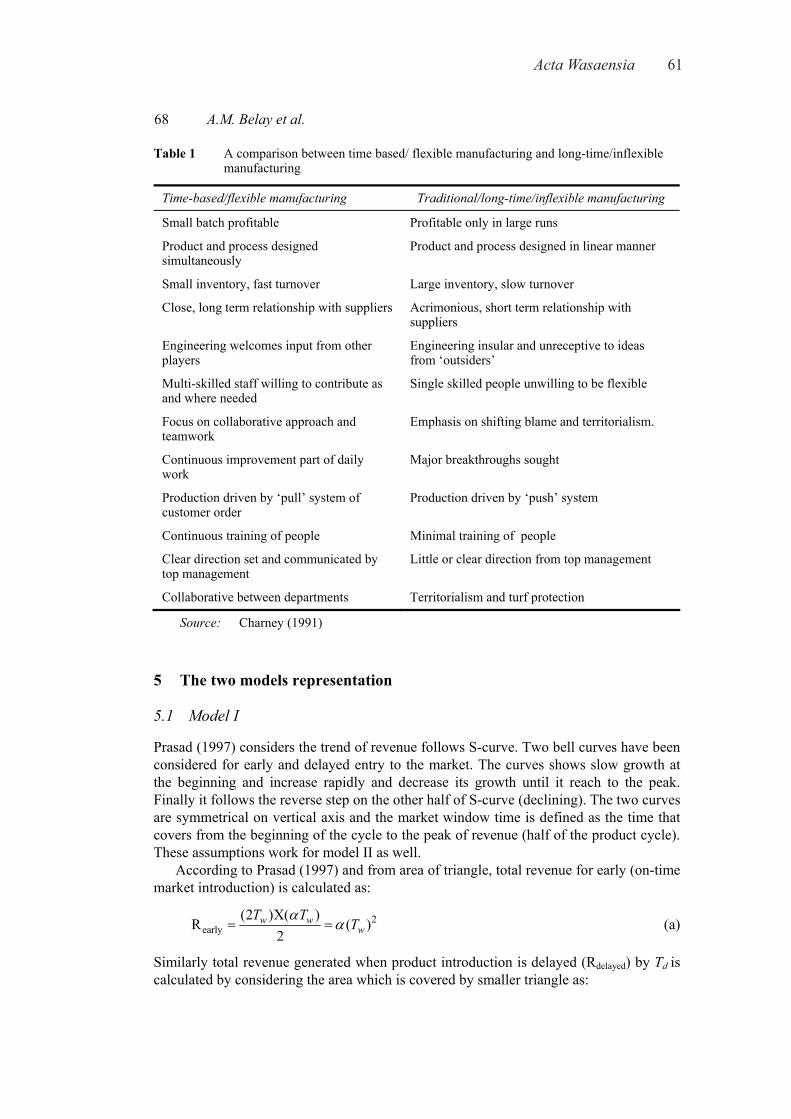
Acta Wasaensia 61
68 A.M. Belay et al.
Table 1 A comparison between time based/ flexible manufacturing and long-time/inflexible manufacturing
Time-based/flexible manufacturing Traditional/long-time/inflexible manufacturing
Small batch profitable Profitable only in large runs
Product and process designed simultaneously
Product and process designed in linear manner
Small inventory, fast turnover Large inventory, slow turnover
Close, long term relationship with suppliers Acrimonious, short term relationship with suppliers
Engineering welcomes input from other players
Engineering insular and unreceptive to ideas from ‘outsiders’
Multi-skilled staff willing to contribute as and where needed
Single skilled people unwilling to be flexible
Focus on collaborative approach and teamwork
Emphasis on shifting blame and territorialism.
Continuous improvement part of daily work
Major breakthroughs sought
Production driven by ‘pull’ system of customer order
Production driven by ‘push’ system
Continuous training of people Minimal training of people
Clear direction set and communicated by top management
Little or clear direction from top management
Collaborative between departments Territorialism and turf protection
Source: Charney (1991)
5 The two models representation
5.1 Model I
Prasad (1997) considers the trend of revenue follows S-curve. Two bell curves have been considered for early and delayed entry to the market. The curves shows slow growth at the beginning and increase rapidly and decrease its growth until it reach to the peak. Finally it follows the reverse step on the other half of S-curve (declining). The two curves are symmetrical on vertical axis and the market window time is defined as the time that covers from the beginning of the cycle to the peak of revenue (half of the product cycle). These assumptions work for model II as well.
According to Prasad (1997) and from area of triangle, total revenue for early (on-time market introduction) is calculated as:
2early
(2 )X( )R ( )
2α
α= =w ww
T TT (a)
Similarly total revenue generated when product introduction is delayed (Rdelayed) by Td is calculated by considering the area which is covered by smaller triangle as:
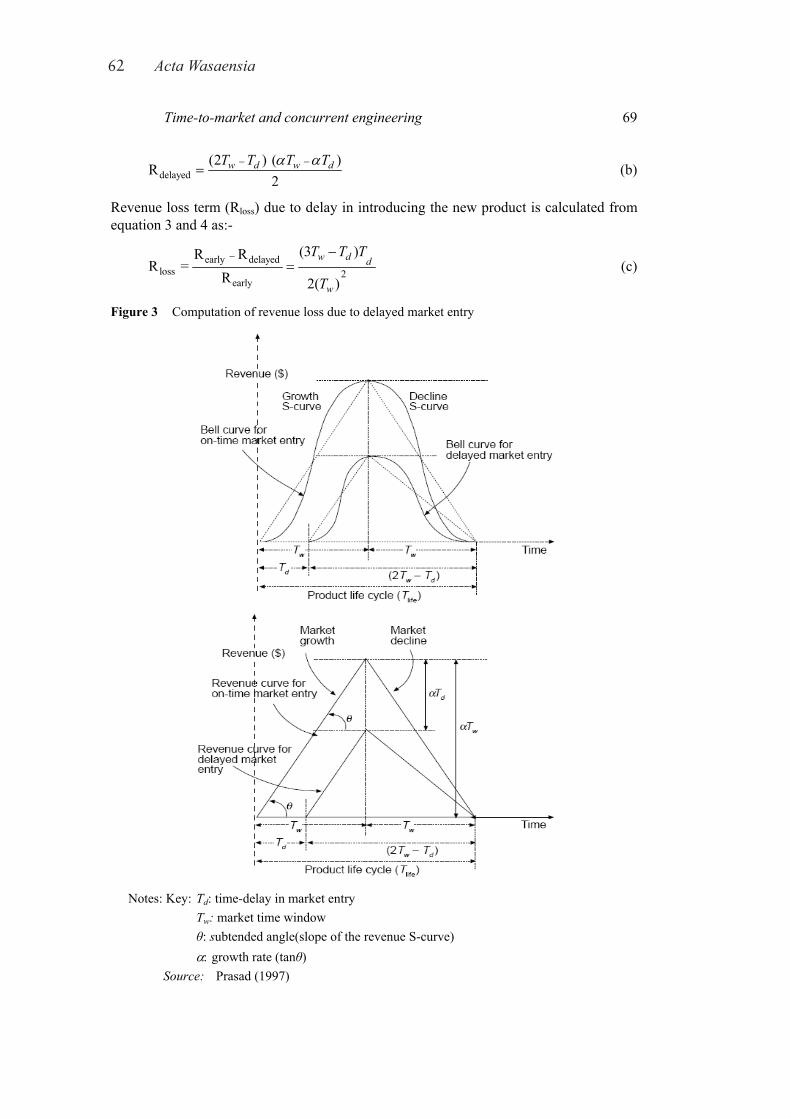
62 Acta Wasaensia
Time-to-market and concurrent engineering 69
delayed(2 ) ( )
R2
w d w dT T T Tα α− −= (b)
Revenue loss term (Rloss) due to delay in introducing the new product is calculated from equation 3 and 4 as:-
early delayedloss 2
early
(3 )R RR =
R 2( )
w d d
w
T T T
T
− −=
(c)
Figure 3 Computation of revenue loss due to delayed market entry
Notes: Key: Td: time-delay in market entry Tw: market time window θ: subtended angle(slope of the revenue S-curve) α: growth rate (tanθ)
Source: Prasad (1997)
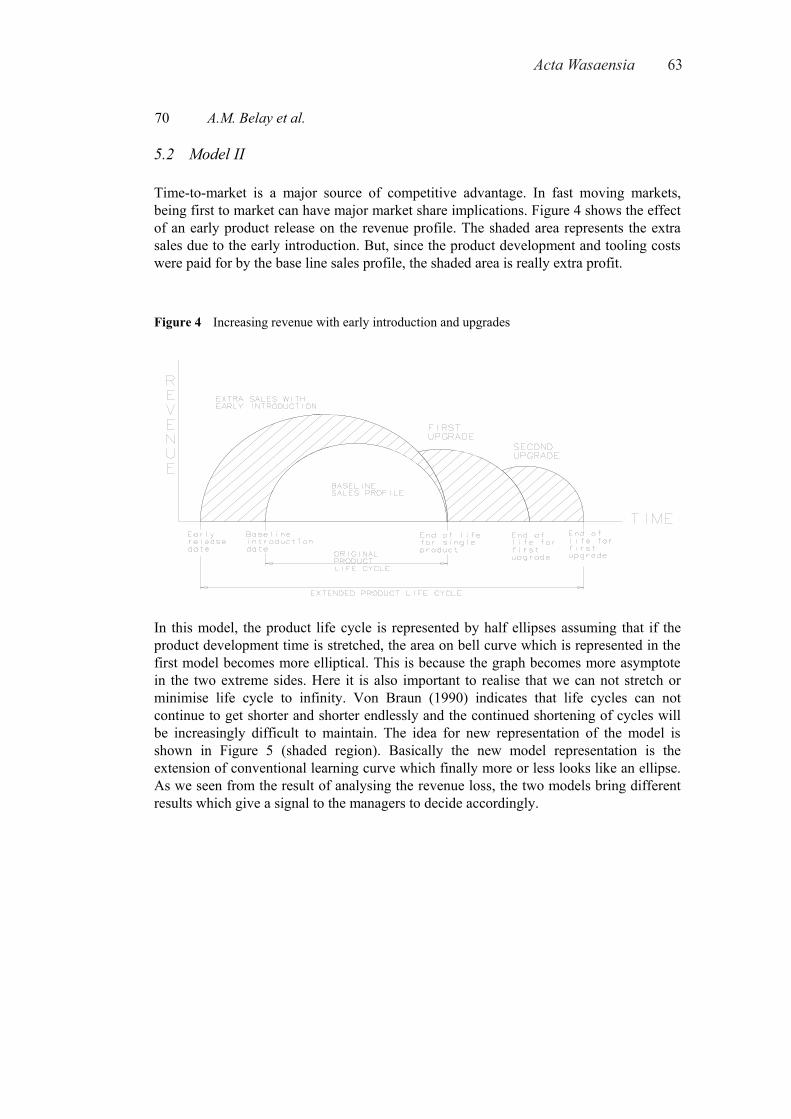
Acta Wasaensia 63
70 A.M. Belay et al.
5.2 Model II
Time-to-market is a major source of competitive advantage. In fast moving markets, being first to market can have major market share implications. Figure 4 shows the effect of an early product release on the revenue profile. The shaded area represents the extra sales due to the early introduction. But, since the product development and tooling costs were paid for by the base line sales profile, the shaded area is really extra profit.
Figure 4 Increasing revenue with early introduction and upgrades
In this model, the product life cycle is represented by half ellipses assuming that if the product development time is stretched, the area on bell curve which is represented in the first model becomes more elliptical. This is because the graph becomes more asymptote in the two extreme sides. Here it is also important to realise that we can not stretch or minimise life cycle to infinity. Von Braun (1990) indicates that life cycles can not continue to get shorter and shorter endlessly and the continued shortening of cycles will be increasingly difficult to maintain. The idea for new representation of the model is shown in Figure 5 (shaded region). Basically the new model representation is the extension of conventional learning curve which finally more or less looks like an ellipse. As we seen from the result of analysing the revenue loss, the two models bring different results which give a signal to the managers to decide accordingly.
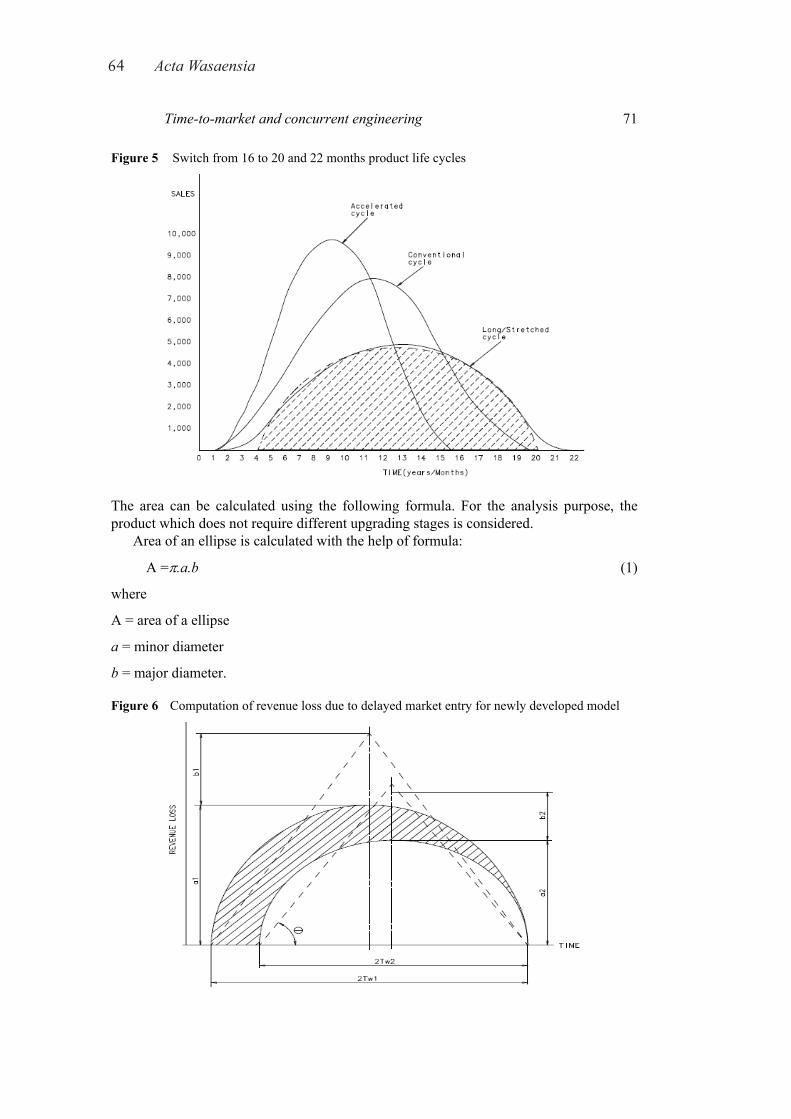
64 Acta Wasaensia
Time-to-market and concurrent engineering 71
Figure 5 Switch from 16 to 20 and 22 months product life cycles
The area can be calculated using the following formula. For the analysis purpose, the product which does not require different upgrading stages is considered.
Area of an ellipse is calculated with the help of formula:
A =π.a.b (1)
where
A = area of a ellipse
a = minor diameter
b = major diameter.
Figure 6 Computation of revenue loss due to delayed market entry for newly developed model
Acta Wasaensia 65
72 A.M. Belay et al.
Area of Ellipse = π*a*c where a = minor radius, 22wc T= = major radius
ASe = Area of half smaller ellipse = 222
* *2* *
2w
wa T
a Tπ
π= (2)
ASt = Area of smaller triangle = 22
2 22 2
( )*2 ( )*
2w
wa b T
a b T+
= + (3)
Equating equations (1) and (2),
b2 = a2 (π–1) (4)
Considering half of the smaller triangle with θ: Subtended angle,
22 2 tanwa b T θ+ = (5)
Substituting b2 from equation (3),
22
tan wT
aθ
π= similarly a1= 1
tanwT θ
π (6)
Revenue loss term (Rloss) due to delay in introducing the new product is calculated from equations
early delayedloss
early
R RR
R−
=
where Rearly is the bigger half ellipse and Rdelayed is for smaller one.
By substituting and simplifying
1 1 2 2
loss1 1 1 1
* tan * * tan *
2 2%R* tan * * tan *
2 2
Tw Tw Tw Tw
Tw Tw Tw Tw
θ π θ ππ π
θ π θ ππ π
⎛ ⎞ ⎛ ⎞⎜ ⎟ ⎜ ⎟⎜ ⎟ ⎜ ⎟⎜ ⎟ ⎜ ⎟= −⎜ ⎟ ⎜ ⎟⎜ ⎟ ⎜ ⎟⎜ ⎟ ⎜ ⎟⎝ ⎠ ⎝ ⎠
(7)
1 2
1
2 2
losss 2%R w w
w
T T
T
−= (8)
6 Discussion
To see the effect of time on introduction of a product to the market, different window periods are considered. For instance, a six month (window time) project means a one year product life cycle (six month for growth and six month for decline). According to Smith (1990) different manufacturers [GM, Hewlett-Packard, Honey well, IBM, Warner electric, Xerox with different products (Buick, computer printer, Thermostat, Clutch-break, and 9900 Copier respectively)] cut their development cycles by roughly 50% and he has used products with a maximum of 60 Months cycle time or 30 months window time. Griffin, (1997) considered products with cycle time 0.25 to 72 months (36
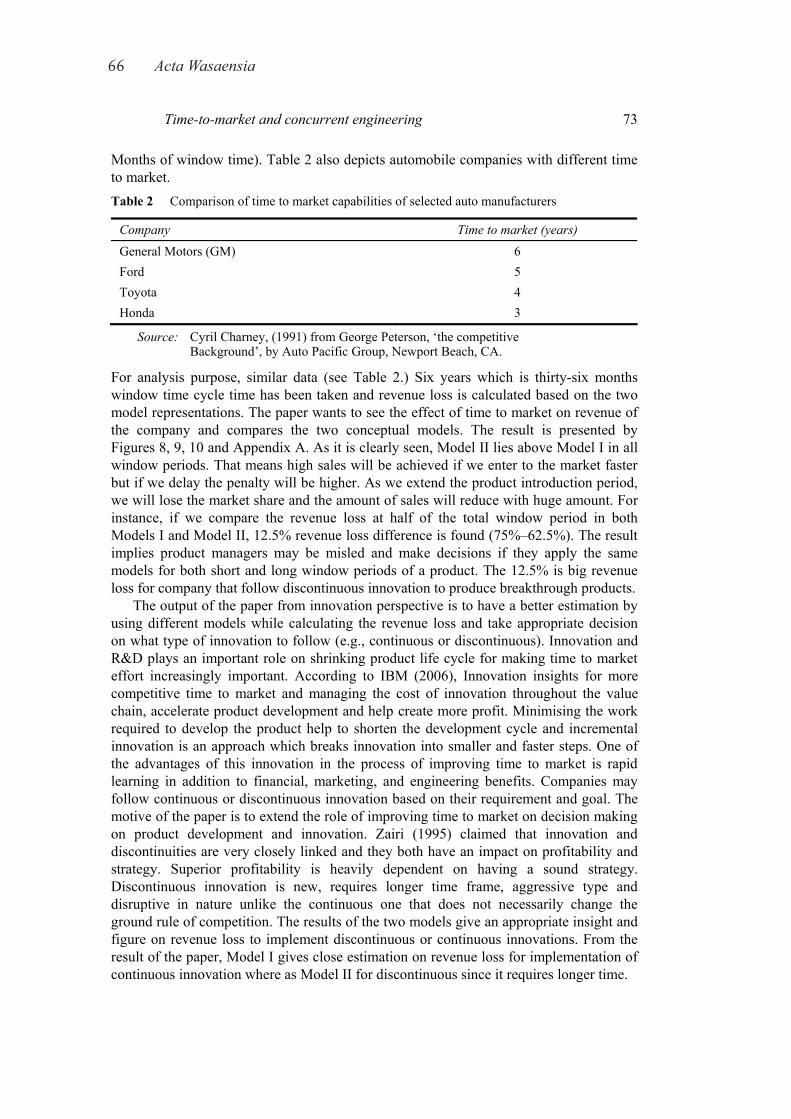
66 Acta Wasaensia
Time-to-market and concurrent engineering 73
Months of window time). Table 2 also depicts automobile companies with different time to market. Table 2 Comparison of time to market capabilities of selected auto manufacturers
Company Time to market (years)
General Motors (GM) 6 Ford 5 Toyota 4 Honda 3
Source: Cyril Charney, (1991) from George Peterson, ‘the competitive Background’, by Auto Pacific Group, Newport Beach, CA.
For analysis purpose, similar data (see Table 2.) Six years which is thirty-six months window time cycle time has been taken and revenue loss is calculated based on the two model representations. The paper wants to see the effect of time to market on revenue of the company and compares the two conceptual models. The result is presented by Figures 8, 9, 10 and Appendix A. As it is clearly seen, Model II lies above Model I in all window periods. That means high sales will be achieved if we enter to the market faster but if we delay the penalty will be higher. As we extend the product introduction period, we will lose the market share and the amount of sales will reduce with huge amount. For instance, if we compare the revenue loss at half of the total window period in both Models I and Model II, 12.5% revenue loss difference is found (75%–62.5%). The result implies product managers may be misled and make decisions if they apply the same models for both short and long window periods of a product. The 12.5% is big revenue loss for company that follow discontinuous innovation to produce breakthrough products.
The output of the paper from innovation perspective is to have a better estimation by using different models while calculating the revenue loss and take appropriate decision on what type of innovation to follow (e.g., continuous or discontinuous). Innovation and R&D plays an important role on shrinking product life cycle for making time to market effort increasingly important. According to IBM (2006), Innovation insights for more competitive time to market and managing the cost of innovation throughout the value chain, accelerate product development and help create more profit. Minimising the work required to develop the product help to shorten the development cycle and incremental innovation is an approach which breaks innovation into smaller and faster steps. One of the advantages of this innovation in the process of improving time to market is rapid learning in addition to financial, marketing, and engineering benefits. Companies may follow continuous or discontinuous innovation based on their requirement and goal. The motive of the paper is to extend the role of improving time to market on decision making on product development and innovation. Zairi (1995) claimed that innovation and discontinuities are very closely linked and they both have an impact on profitability and strategy. Superior profitability is heavily dependent on having a sound strategy. Discontinuous innovation is new, requires longer time frame, aggressive type and disruptive in nature unlike the continuous one that does not necessarily change the ground rule of competition. The results of the two models give an appropriate insight and figure on revenue loss to implement discontinuous or continuous innovations. From the result of the paper, Model I gives close estimation on revenue loss for implementation of continuous innovation where as Model II for discontinuous since it requires longer time.
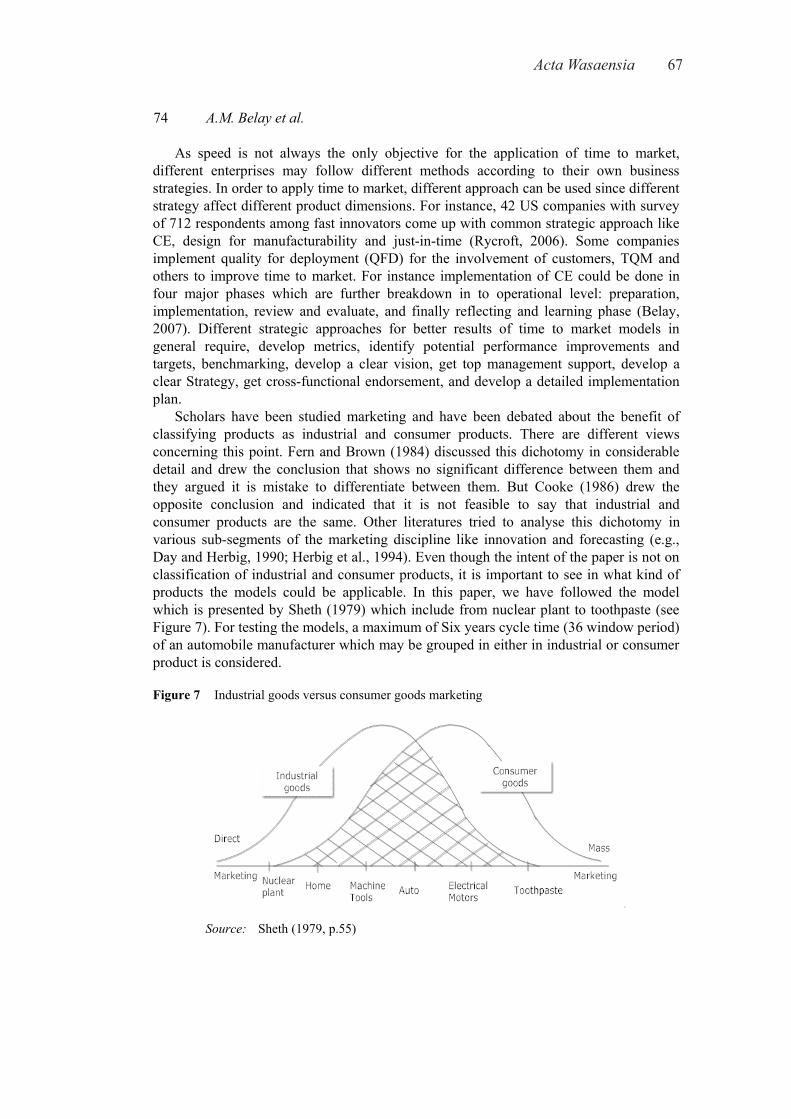
Acta Wasaensia 67
74 A.M. Belay et al.
As speed is not always the only objective for the application of time to market, different enterprises may follow different methods according to their own business strategies. In order to apply time to market, different approach can be used since different strategy affect different product dimensions. For instance, 42 US companies with survey of 712 respondents among fast innovators come up with common strategic approach like CE, design for manufacturability and just-in-time (Rycroft, 2006). Some companies implement quality for deployment (QFD) for the involvement of customers, TQM and others to improve time to market. For instance implementation of CE could be done in four major phases which are further breakdown in to operational level: preparation, implementation, review and evaluate, and finally reflecting and learning phase (Belay, 2007). Different strategic approaches for better results of time to market models in general require, develop metrics, identify potential performance improvements and targets, benchmarking, develop a clear vision, get top management support, develop a clear Strategy, get cross-functional endorsement, and develop a detailed implementation plan.
Scholars have been studied marketing and have been debated about the benefit of classifying products as industrial and consumer products. There are different views concerning this point. Fern and Brown (1984) discussed this dichotomy in considerable detail and drew the conclusion that shows no significant difference between them and they argued it is mistake to differentiate between them. But Cooke (1986) drew the opposite conclusion and indicated that it is not feasible to say that industrial and consumer products are the same. Other literatures tried to analyse this dichotomy in various sub-segments of the marketing discipline like innovation and forecasting (e.g., Day and Herbig, 1990; Herbig et al., 1994). Even though the intent of the paper is not on classification of industrial and consumer products, it is important to see in what kind of products the models could be applicable. In this paper, we have followed the model which is presented by Sheth (1979) which include from nuclear plant to toothpaste (see Figure 7). For testing the models, a maximum of Six years cycle time (36 window period) of an automobile manufacturer which may be grouped in either in industrial or consumer product is considered.
Figure 7 Industrial goods versus consumer goods marketing
Source: Sheth (1979, p.55)
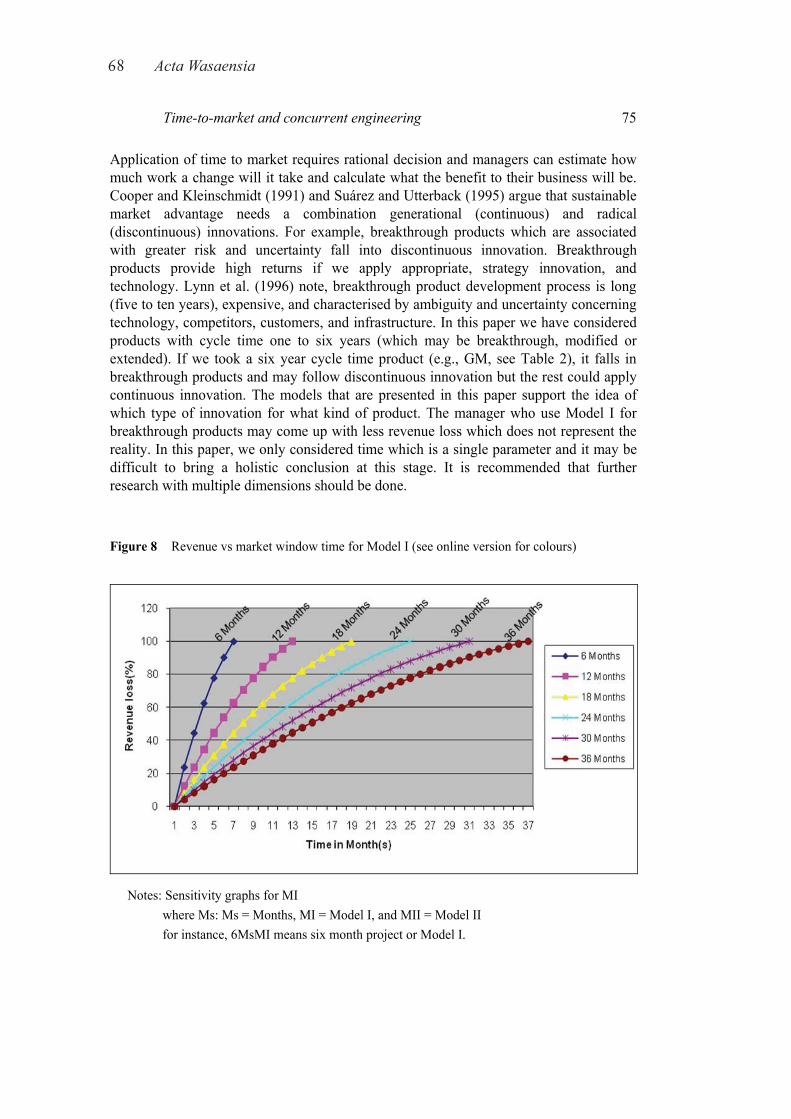
68 Acta Wasaensia
Time-to-market and concurrent engineering 75
Application of time to market requires rational decision and managers can estimate how much work a change will it take and calculate what the benefit to their business will be. Cooper and Kleinschmidt (1991) and Suárez and Utterback (1995) argue that sustainable market advantage needs a combination generational (continuous) and radical (discontinuous) innovations. For example, breakthrough products which are associated with greater risk and uncertainty fall into discontinuous innovation. Breakthrough products provide high returns if we apply appropriate, strategy innovation, and technology. Lynn et al. (1996) note, breakthrough product development process is long (five to ten years), expensive, and characterised by ambiguity and uncertainty concerning technology, competitors, customers, and infrastructure. In this paper we have considered products with cycle time one to six years (which may be breakthrough, modified or extended). If we took a six year cycle time product (e.g., GM, see Table 2), it falls in breakthrough products and may follow discontinuous innovation but the rest could apply continuous innovation. The models that are presented in this paper support the idea of which type of innovation for what kind of product. The manager who use Model I for breakthrough products may come up with less revenue loss which does not represent the reality. In this paper, we only considered time which is a single parameter and it may be difficult to bring a holistic conclusion at this stage. It is recommended that further research with multiple dimensions should be done.
Figure 8 Revenue vs market window time for Model I (see online version for colours)
Notes: Sensitivity graphs for MI where Ms: Ms = Months, MI = Model I, and MII = Model II for instance, 6MsMI means six month project or Model I.
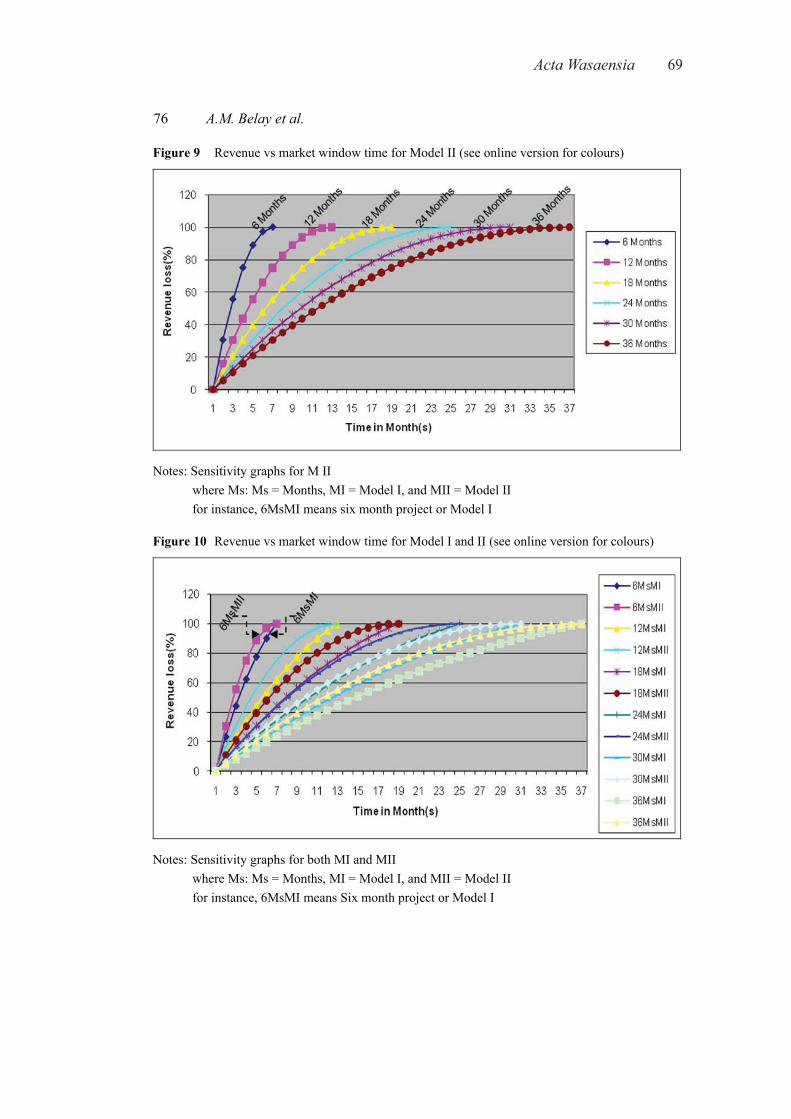
Acta Wasaensia 69
76 A.M. Belay et al.
Figure 9 Revenue vs market window time for Model II (see online version for colours)
Notes: Sensitivity graphs for M II where Ms: Ms = Months, MI = Model I, and MII = Model II for instance, 6MsMI means six month project or Model I
Figure 10 Revenue vs market window time for Model I and II (see online version for colours)
Notes: Sensitivity graphs for both MI and MII where Ms: Ms = Months, MI = Model I, and MII = Model II for instance, 6MsMI means Six month project or Model I
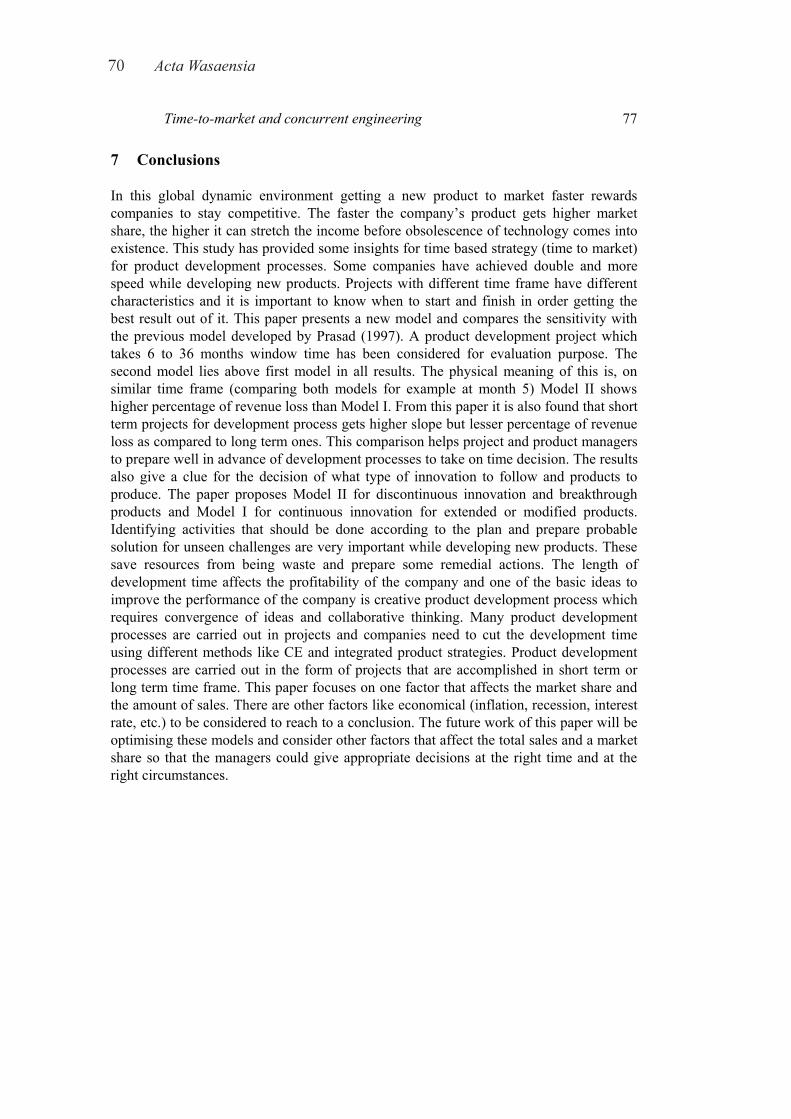
70 Acta Wasaensia
Time-to-market and concurrent engineering 77
7 Conclusions
In this global dynamic environment getting a new product to market faster rewards companies to stay competitive. The faster the company’s product gets higher market share, the higher it can stretch the income before obsolescence of technology comes into existence. This study has provided some insights for time based strategy (time to market) for product development processes. Some companies have achieved double and more speed while developing new products. Projects with different time frame have different characteristics and it is important to know when to start and finish in order getting the best result out of it. This paper presents a new model and compares the sensitivity with the previous model developed by Prasad (1997). A product development project which takes 6 to 36 months window time has been considered for evaluation purpose. The second model lies above first model in all results. The physical meaning of this is, on similar time frame (comparing both models for example at month 5) Model II shows higher percentage of revenue loss than Model I. From this paper it is also found that short term projects for development process gets higher slope but lesser percentage of revenue loss as compared to long term ones. This comparison helps project and product managers to prepare well in advance of development processes to take on time decision. The results also give a clue for the decision of what type of innovation to follow and products to produce. The paper proposes Model II for discontinuous innovation and breakthrough products and Model I for continuous innovation for extended or modified products. Identifying activities that should be done according to the plan and prepare probable solution for unseen challenges are very important while developing new products. These save resources from being waste and prepare some remedial actions. The length of development time affects the profitability of the company and one of the basic ideas to improve the performance of the company is creative product development process which requires convergence of ideas and collaborative thinking. Many product development processes are carried out in projects and companies need to cut the development time using different methods like CE and integrated product strategies. Product development processes are carried out in the form of projects that are accomplished in short term or long term time frame. This paper focuses on one factor that affects the market share and the amount of sales. There are other factors like economical (inflation, recession, interest rate, etc.) to be considered to reach to a conclusion. The future work of this paper will be optimising these models and consider other factors that affect the total sales and a market share so that the managers could give appropriate decisions at the right time and at the right circumstances.
Acta Wasaensia 71
78 A.M. Belay et al.
References Akman, G. and Yilmaz, C. (2008) ‘Innovative capability, innovation strategy and market
orientation: an empirical analysis in Turkish software industry’, International Journal of Innovation Management, Vol. 12, No. 1, p.69–111.
Alves, J.A. et al. (2009) ‘Building creative ideas for successful new product development’, available at http://www.casadofuturo.ua.pt/Papers/Building%20creative%20ideas%2030Junh05.pdf (accessed on 30 November 2009).
Anderson, D.M. (2008) ‘How to design for low cost, design in high quality, design for lean manufacture, and design quickly for fast production’, Design for Manufacturability & Concurrent Engineering, CIM Press, Cambria, California.
Barkan, P. (1988) ‘Simultaneous engineering: AI helps balance production and bottom lines’, Design News, March, Vol. 44, No. 5, p.A30.
Bauman, R. (1990) ‘CALS and concurrent engineering: business strategy or tool survival?’, Aviation Week and Space Technology, July, Vol. 133, pp.S1–12.
Belay, A.M. (2007) ‘Concurrent engineering and implementation: case study in Addis Engineering center’, Libraries Electronics Thesis and Dissertation AAU-ETD, Addis Ababa University.
Bergman, J.P. (2005) ‘Supporting knowledge creation and sharing in the early phases of the strategic innovation processes’, PhD Dissertation, Lappeenranta University of Technology, Finland.
Birou, L.M. and Fawcett, S.E. (1994) ‘Supplier involvement in integrated product development strategies: a comparison of U.S. and European practices’, International Journal of Physical Distribution and Logistics Management, Vol. 24, No. 5, p.4–14.
Charney, C.Y. (1991) ‘Time to Market: Reducing Product Lead Time’ Society of Manufacturing Engineers, Dearborn, Michigan 48121.
Clark, K.B. (1989) ‘Project scope and project performance: the effects of parts strategy and supplier involvement on product development’, Management Science, Vol. 35, No. 10, pp.1247–1263.
Cooke, E. (1986) ‘What is business and industrial marketing?’, Journal of Business and Industrial Marketing, Vol. 1, No.1, pp.9–17.
Cooper, R.G. (1997) Winning at New Products. Accelerating the Process from Idea to Launch, Addison-Wesley, Reading, MA.
Cooper, R.G. and Kleinschmidt, E.J. (1991) ‘New product processes at leading industrial firms’, Industrial Marketing Management, Vol. 20, No. 2, pp.137–47.
Cooper, R.G. and Kleinschmidt, E.J. (1994) ‘Determinants of timeliness in product development’, Journal of Product Innovation Management, Vol. 11, pp.381–996.
Day, R. and Herbig, P. (1990) ‘How the diffusion of industrial innovations is different from new retail products’, Industrial Marketing Management, Vol. 19, No.3, pp.261–266.
Dodgson, M. (1993) ‘Learning, trust and technological collaboration’, Human Relations, Vol. 46, No. 1, pp.77–95.
Donnellon, A. (1993) ‘Cross-functional teams in product development: accommodating the structure to the process’, Journal of Product Innovation Management, Vol. 10, pp.377–392.
Echtelt, van F. and Wynstra, F. (2002) ‘Managing supplier integration into product development: a literature review and conceptual model’, Working Paper 02.03, Department of Technology Management Technische Universiteit Eindhoven, The Netherlands.
Echtelt, van F.E.A. (2004) ‘New product development: shifting suppliers into gear’, PhD Dissertation, Technische Universiteit Eindhoven, the Netherlands.
Evans, B. (1988) Simultaneous Engineering, Mechanical Engineering, Vol. 110, No. 2, pp.38–39. Fern, E.F. and Brown, J.R. (1984) ‘The industrial/consumer marketing dichotomy: a case of
insufficient justification’, Journal of Marketing, Vol. 48, No.2, pp.68–77.
72 Acta Wasaensia
Time-to-market and concurrent engineering 79
Goldhar, J.D., Jelinek, M. and Schlie, T.W. (1991) ‘Flexibility and competitive advantage – manufacturing becomes a service business’, Special Issue on Manufacturing Strategy, International Journal of Technology Management, Vol. 6, Nos. 3–4, pp.243–259.
Griffin, A. (1997) ‘The effect of project and process characteristics on product development cycle time’, Journal of Marketing Research, Vol. 34, No. 1, pp.24–35.
Hamel, G., Doz, Y. and Prahalad, C.K., (1989) ‘Collaborative with your competitor-and win’, Harvard Review, Vol. 67, No. 1, pp.33–39.
Herbig, P., Golden, E.J. and Dunphy, A. (1994) ‘The relationship of structure to entrepreneurial and innovative success’, Marketing Intelligence & Planning, Vol. 12, No. 9, pp.37–48.
IBM Global Business Service (2006) ‘Innovation insights for more competitive time to market’, available at http://www-935.ibm.com/services/us/gbs/bus/pdf/gb510-3688-innovation-insights-for-more-competitive-time-to-market.pdf (accessed on 20 January 2010).
Kent, D (1991) ‘Joint venture vs. non-joint ventures: an empirical investigation’, Strategic Management Journal, No. 12, pp.383–393.
Kotler, P. (1988) ‘Analysis, planning, implementation and control’, Marketing Management, 6th ed., Prentice-Hall, Englewood Cliffs, New Jersey.
Krishinan, V., Eppinger, S.D. and Whitney, D.E. (1997) ‘A model-based framework to overlap product development activities’, Management Science, Vol. 43, No. 4, p.437.
Lawrence, D. and David, O. (2007) ‘Managing within distributed innovation networks’, International Journal of Innovation Management, September 2007, Vol. 11, No. 3, p.397–416.
Leonard, D. and Sensiper, S. (1998) ‘The role of tacit knowledge in group innovation’, California Management Review, Vol. 40, No. 3, pp.112–132.
Littler, D., Leverick, F. and Bruce, M. (1995) ‘Factors affecting the process of collaborative product development: a study of UK manufacturers of information and communications technology products’, Journal of Product Innovation Management, Vol. 12, pp.16–32.
Lynn, G.S., Morone, J.G. and Paulson, A.S. (1996) ‘Marketing and discontinuous innovation: the probe and learn process’, California Management Review, Vol. 38, No. 3, pp.8–37.
Mathisen, G.E. and Einarsen, S. (2004) ‘A review of instruments assessing creative and innovative environments within organisations’, Creativity Research Journal, Vol. 16, No. 1, pp.119–140.
McGrath, M.E. (2004) Next Generation Product Development: How to Increase Productivity Cut Costs and Reduce Cycle Times, McGraw-Hill.
Menon, U., O’Grady, P.J., Gu, J.Z. and Young, R.E. (1994) ‘Quality function deployment: an overview’, in D.E. Syanx and U. Menon (Eds.): Concurrent Engineering: Concepts, Implementation and Practice, pp.91–99, Chapman and Hall, London.
Politis, J.D. (2005) ‘QFD, organisational creativity and productivity’, International Journal of Quality and Reliability Management, Vol. 22, No. 1, pp.59–71.
Prasad, B. (1997) ‘Analysis of pricing strategies for new product introduction’, Journal of Product & Brand Management, Vol. 5, No. 4, pp.132–141.
Ragatz, G.L., Handfield, R.B. and Petersen, K.J (2002) ‘Benefits associated with supplier integration into new product development under conditions of technology uncertainty’, Journal of Business Research, Vol. 55, pp.389–400.
Rycroft, R.W. (2006) ‘Time and technological innovation: implications for public policy’, Technology in Society, Vol. 28, No. 3, pp.281–301.
Sheth, J.N. (1979) ‘The surpluses and shortages in consumer behavior theory and research’, Journal of the Academy of Marketing Science, Vol. 7, No. 4, pp.414–427.
Shina, S.G. (1991) Concurrent Engineering and Design for Manufacture of Electronic Products, Van Nostrand Reinhold, New York.
Smith, P.G. (1990) ‘Fast-cycle product development’, Engineering Management Journal, Vol. 2, No. 2, pp.11–16.
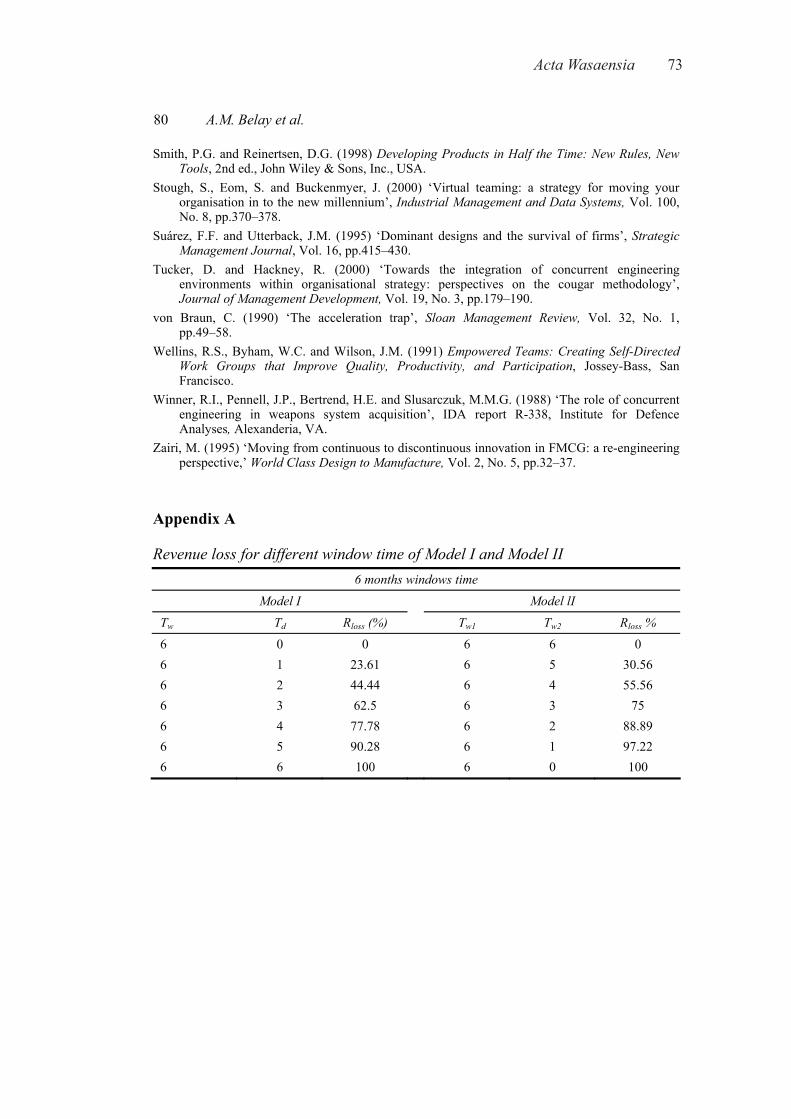
Acta Wasaensia 73
80 A.M. Belay et al.
Smith, P.G. and Reinertsen, D.G. (1998) Developing Products in Half the Time: New Rules, New Tools, 2nd ed., John Wiley & Sons, Inc., USA.
Stough, S., Eom, S. and Buckenmyer, J. (2000) ‘Virtual teaming: a strategy for moving your organisation in to the new millennium’, Industrial Management and Data Systems, Vol. 100, No. 8, pp.370–378.
Suárez, F.F. and Utterback, J.M. (1995) ‘Dominant designs and the survival of firms’, Strategic Management Journal, Vol. 16, pp.415–430.
Tucker, D. and Hackney, R. (2000) ‘Towards the integration of concurrent engineering environments within organisational strategy: perspectives on the cougar methodology’, Journal of Management Development, Vol. 19, No. 3, pp.179–190.
von Braun, C. (1990) ‘The acceleration trap’, Sloan Management Review, Vol. 32, No. 1, pp.49–58.
Wellins, R.S., Byham, W.C. and Wilson, J.M. (1991) Empowered Teams: Creating Self-Directed Work Groups that Improve Quality, Productivity, and Participation, Jossey-Bass, San Francisco.
Winner, R.I., Pennell, J.P., Bertrend, H.E. and Slusarczuk, M.M.G. (1988) ‘The role of concurrent engineering in weapons system acquisition’, IDA report R-338, Institute for Defence Analyses, Alexanderia, VA.
Zairi, M. (1995) ‘Moving from continuous to discontinuous innovation in FMCG: a re-engineering perspective,’ World Class Design to Manufacture, Vol. 2, No. 5, pp.32–37.
Appendix A
Revenue loss for different window time of Model I and Model II 6 months windows time
Model I Model lI
Tw Td Rloss (%) Tw1 Tw2 Rloss % 6 0 0 6 6 0 6 1 23.61 6 5 30.56 6 2 44.44 6 4 55.56 6 3 62.5 6 3 75 6 4 77.78 6 2 88.89 6 5 90.28 6 1 97.22 6 6 100 6 0 100
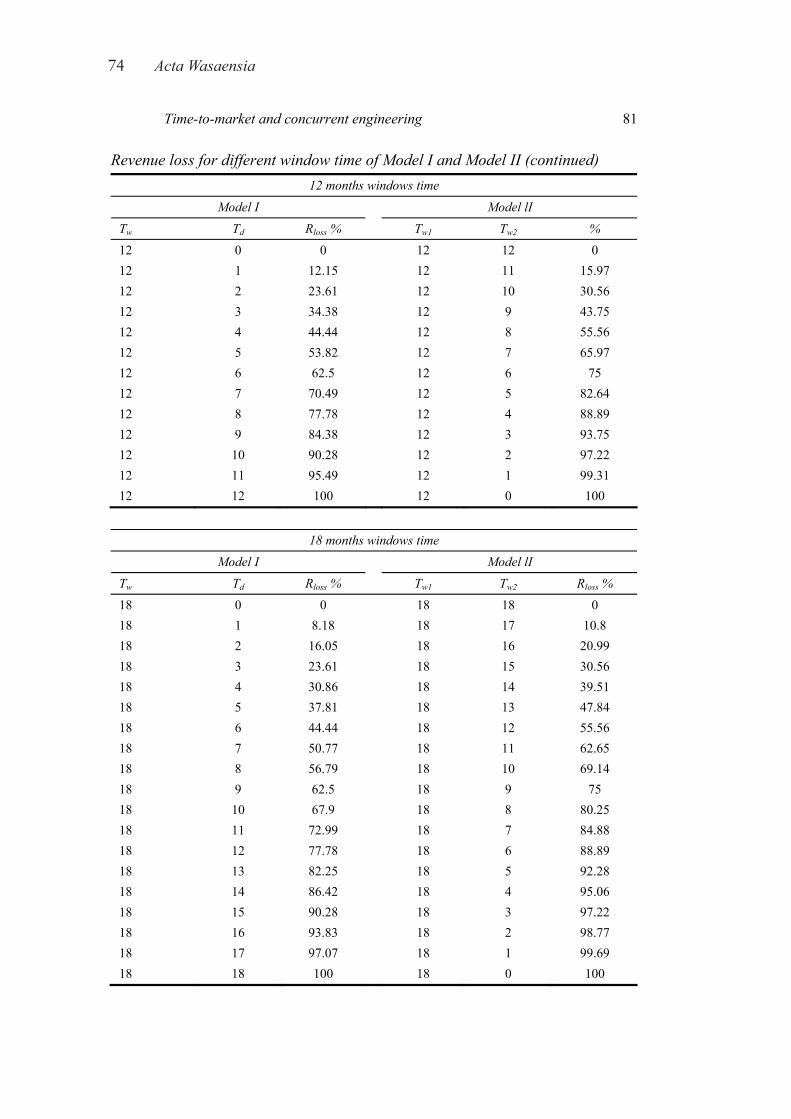
74 Acta Wasaensia
Time-to-market and concurrent engineering 81
Revenue loss for different window time of Model I and Model II (continued) 12 months windows time
Model I Model lI
Tw Td Rloss % Tw1 Tw2 % 12 0 0 12 12 0 12 1 12.15 12 11 15.97 12 2 23.61 12 10 30.56 12 3 34.38 12 9 43.75 12 4 44.44 12 8 55.56 12 5 53.82 12 7 65.97 12 6 62.5 12 6 75 12 7 70.49 12 5 82.64 12 8 77.78 12 4 88.89 12 9 84.38 12 3 93.75 12 10 90.28 12 2 97.22 12 11 95.49 12 1 99.31 12 12 100 12 0 100
18 months windows time Model I Model lI
Tw Td Rloss % Tw1 Tw2 Rloss % 18 0 0 18 18 0 18 1 8.18 18 17 10.8 18 2 16.05 18 16 20.99 18 3 23.61 18 15 30.56 18 4 30.86 18 14 39.51 18 5 37.81 18 13 47.84 18 6 44.44 18 12 55.56 18 7 50.77 18 11 62.65 18 8 56.79 18 10 69.14 18 9 62.5 18 9 75 18 10 67.9 18 8 80.25 18 11 72.99 18 7 84.88 18 12 77.78 18 6 88.89 18 13 82.25 18 5 92.28 18 14 86.42 18 4 95.06 18 15 90.28 18 3 97.22 18 16 93.83 18 2 98.77 18 17 97.07 18 1 99.69 18 18 100 18 0 100
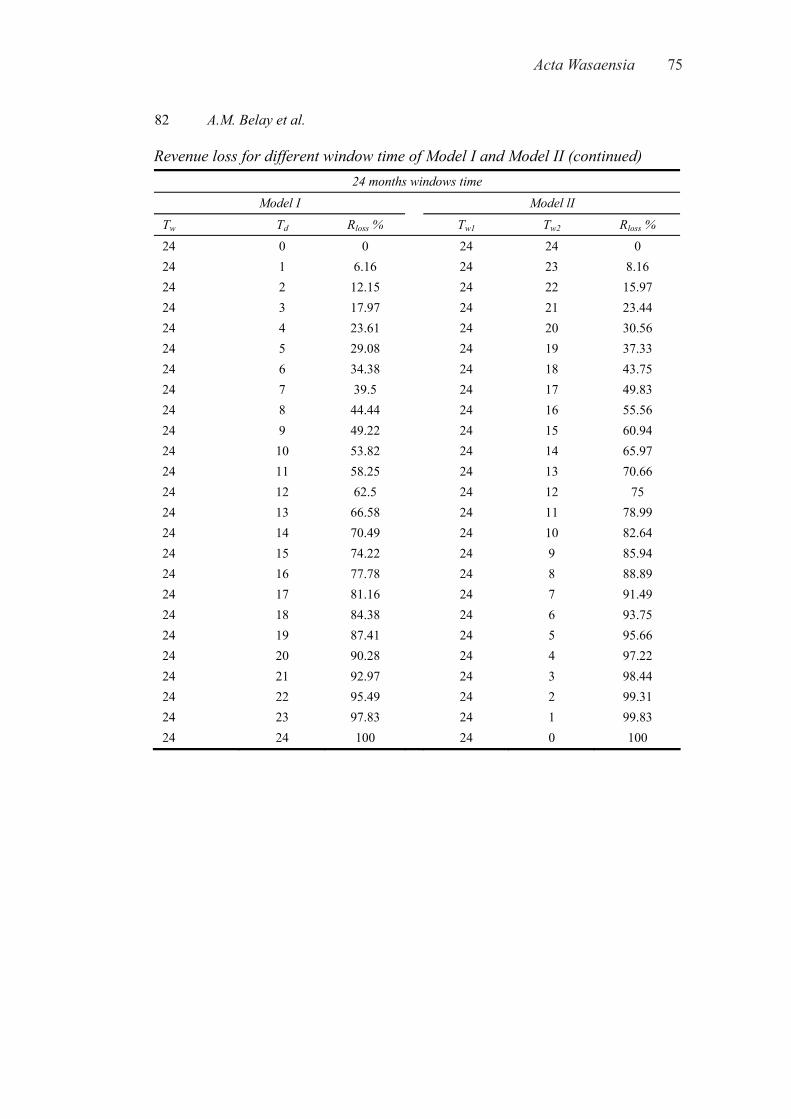
Acta Wasaensia 75
82 A.M. Belay et al.
Revenue loss for different window time of Model I and Model II (continued) 24 months windows time
Model I Model lI Tw Td Rloss % Tw1 Tw2 Rloss % 24 0 0 24 24 0 24 1 6.16 24 23 8.16 24 2 12.15 24 22 15.97 24 3 17.97 24 21 23.44 24 4 23.61 24 20 30.56 24 5 29.08 24 19 37.33 24 6 34.38 24 18 43.75 24 7 39.5 24 17 49.83 24 8 44.44 24 16 55.56 24 9 49.22 24 15 60.94 24 10 53.82 24 14 65.97 24 11 58.25 24 13 70.66 24 12 62.5 24 12 75 24 13 66.58 24 11 78.99 24 14 70.49 24 10 82.64 24 15 74.22 24 9 85.94 24 16 77.78 24 8 88.89 24 17 81.16 24 7 91.49 24 18 84.38 24 6 93.75 24 19 87.41 24 5 95.66 24 20 90.28 24 4 97.22 24 21 92.97 24 3 98.44 24 22 95.49 24 2 99.31 24 23 97.83 24 1 99.83 24 24 100 24 0 100
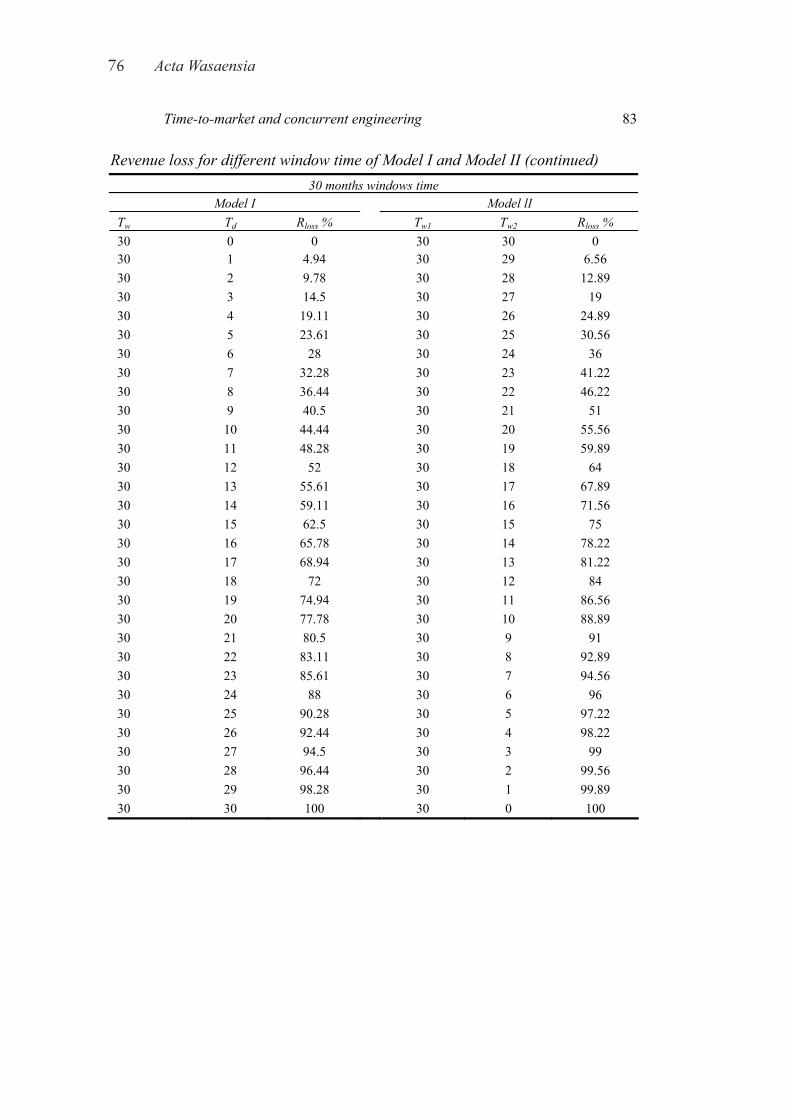
76 Acta Wasaensia
Time-to-market and concurrent engineering 83
Revenue loss for different window time of Model I and Model II (continued) 30 months windows time
Model I Model lI Tw Td Rloss % Tw1 Tw2 Rloss % 30 0 0 30 30 0 30 1 4.94 30 29 6.56 30 2 9.78 30 28 12.89 30 3 14.5 30 27 19 30 4 19.11 30 26 24.89 30 5 23.61 30 25 30.56 30 6 28 30 24 36 30 7 32.28 30 23 41.22 30 8 36.44 30 22 46.22 30 9 40.5 30 21 51 30 10 44.44 30 20 55.56 30 11 48.28 30 19 59.89 30 12 52 30 18 64 30 13 55.61 30 17 67.89 30 14 59.11 30 16 71.56 30 15 62.5 30 15 75 30 16 65.78 30 14 78.22 30 17 68.94 30 13 81.22 30 18 72 30 12 84 30 19 74.94 30 11 86.56 30 20 77.78 30 10 88.89 30 21 80.5 30 9 91 30 22 83.11 30 8 92.89 30 23 85.61 30 7 94.56 30 24 88 30 6 96 30 25 90.28 30 5 97.22 30 26 92.44 30 4 98.22 30 27 94.5 30 3 99 30 28 96.44 30 2 99.56 30 29 98.28 30 1 99.89 30 30 100 30 0 100
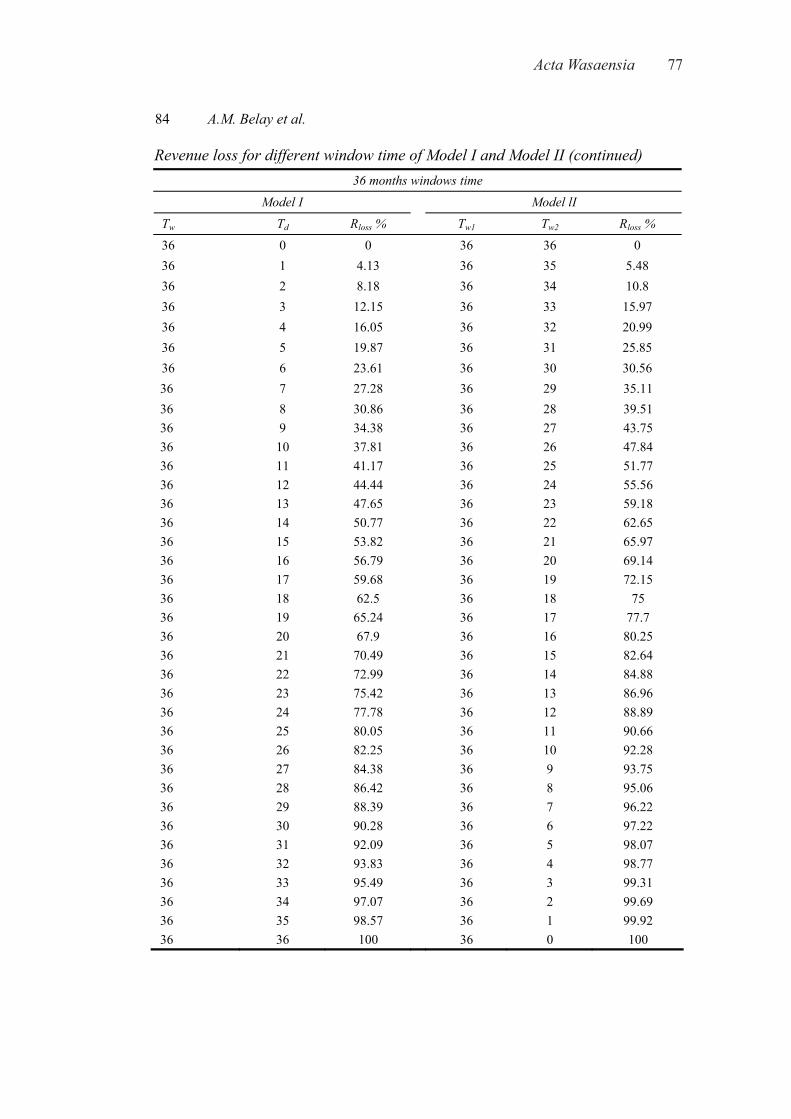
Acta Wasaensia 77
84 A.M. Belay et al.
Revenue loss for different window time of Model I and Model II (continued) 36 months windows time
Model I Model lI Tw Td Rloss % Tw1 Tw2 Rloss %
36 0 0 36 36 0 36 1 4.13 36 35 5.48 36 2 8.18 36 34 10.8 36 3 12.15 36 33 15.97 36 4 16.05 36 32 20.99 36 5 19.87 36 31 25.85 36 6 23.61 36 30 30.56 36 7 27.28 36 29 35.11 36 8 30.86 36 28 39.51 36 9 34.38 36 27 43.75 36 10 37.81 36 26 47.84 36 11 41.17 36 25 51.77 36 12 44.44 36 24 55.56 36 13 47.65 36 23 59.18 36 14 50.77 36 22 62.65 36 15 53.82 36 21 65.97 36 16 56.79 36 20 69.14 36 17 59.68 36 19 72.15 36 18 62.5 36 18 75 36 19 65.24 36 17 77.7 36 20 67.9 36 16 80.25 36 21 70.49 36 15 82.64 36 22 72.99 36 14 84.88 36 23 75.42 36 13 86.96 36 24 77.78 36 12 88.89 36 25 80.05 36 11 90.66 36 26 82.25 36 10 92.28 36 27 84.38 36 9 93.75 36 28 86.42 36 8 95.06 36 29 88.39 36 7 96.22 36 30 90.28 36 6 97.22 36 31 92.09 36 5 98.07 36 32 93.83 36 4 98.77 36 33 95.49 36 3 99.31 36 34 97.07 36 2 99.69 36 35 98.57 36 1 99.92 36 36 100 36 0 100

Acta Wasaensia 79
Effects of Quality Management Practices and Concurrent Engineering in Business Performance
Alemu Moges Belay ([email protected]) (corresponding author)
Josu Takala ([email protected]) Petri Helo ([email protected])
Department of production, University of Vaasa, P.O. Box 700, FI–65101, Vaasa, Finland
Fentahun Moges Kasie ([email protected])
Department of mechanical & Industrial Engineering, Institute of technology, Hawassa University Ethiopia
Email ([email protected])
Abstract
The main focus of this paper is to indicate the effect of quality management practices and concur-rent engineering on business performance improvement. The research has been done by taking one of Brewery Company (XYZ) as a case study. Practical secondary data have been collected and analyzed to understand what it seems the actual company’s business results growth rate in terms of annual sales, profit before income tax, production volume and costs of production. These re-sults are compared to the ideal continuous improvement organization business results. Primary data are also analyzed to test quality practice levels of the company. The results of these discus-sions approve that there exists a direct relationship between TQM & CE, and company’s business performance improvement. Finally, proposed business improvement model and modified TQM & CE implementation models are presented.
Keywords: Total quality management; TQM, Concurrent engineering; CE, Business perfor-mance, performance improvement
1. Introduction
The quality concept has developed over the last few decades to become a broad management tool as opposed to its initial role of control. Total Quality Management (TQM) and productivity have become major concerns of business managers seeking to maintain or increase competitive ad-vantage. At present dynamic manufacturing environment, where quality is vital to success, manu-facturers use TQM as a tool to substantially improve productivity and customer satisfaction. Based on an extensive study of previous research on TQM, six core values of TQM were identi-fied as critical for successful TQM implementation. These values of TQM are functioning as lit-mus paper to test the current quality status of the firms. These values are top management com-mitment, everybody’s commitment, continuous improvement, focus on customer, focus on pro-cess, and using a scientific approach for decision making.
The core values of TQM that have been listed above represent how to encourage and motivate the employees to the best way to improve their capabilities, skilled, commitment and productive by giving them relevant information, power, knowledge, and rewards. So logically, the significant expected effect of the TQM principles will be on the firm’s overall business results. Besides, most of the previous studies point out that productivity is one of the measure business performances directly affected by application of the TQM principles (Morris, 1993). This means that the adop-tion of TQM concepts leads to inspiring employees to succeed and grow, then improving their performance and productivity (Oakland, 1993). Most of developing countries’ enterprises like brewery, textile, sugar, flour, & other Agro–processing industries are very low in their productivi-
80 Acta Wasaensia
ty as compared to other developing & developed nations as mentioned on UNIDO, Vienna, 2004. There should be a change, representing nothing short of breakthrough for those organizations to halt productivity decline. Such a change can be brought through management styles like TQM and CE.
To achieve a significant result on business performance improvement in the existing dynamic market, using or combining more than one process improvement approaches for the betterment of the company’s business performance may require. According to Najmi M., and Ip-Shing F., (2002), the process approach at the heart of TQM is fundamental to embedding CE in new prod-uct development and application of CE through TQM is illustrated practically in industries. This paper presents the improvement signals in the case company by linking CE into TQM initiatives that support the recent empirical research by Sun,H. and Zhoa, Y.,(2010) that show a positive relationship between TQM and fast NPD.
This study is organized in the following order. The second section will briefly explains the litera-ture reviews and asses related researches and theories. The third section dealt with the methodolo-gies used while doing this research and followed by explanation of the commonality between TQM and concurrent engineering in the fourth section. The Fifth part comes with data, result discussions and proposed model for the implementation of TQM that is linked with CE and finally the conclusion and recommendations are presented on the sixth section.
2. Literature
TQM has been widely considered as management tool for business stability, growth and prosperi-ty (Issac et al., 2004), as a tool to keep competitive advantage (Kuei et al., (2001), and Eng and Yusof (2003)). Many literatures show that different quality practices enhance firms’ performance in many aspects like on early design involvement (concurrent engineering), reduction costs, focus-ing on prevention techniques and improving management (Crosby, 1979, 1984; Deming, 1982, 1986; Garvin, 1984, 1988; Juran, 1982, 1989). Kanji et al., (1992) indicated that quality as a core variable for strategic advantage in the operations function and on the competitiveness of the firm. Garvin (1996) specifically showed the relationship between quality improvement and profitability with consistency on production and marketing.
For last two decades, quality has been considered as one of important factor in manufacturing, service and purchasing to increase sales and profits this is supported by several literatures (Aaker and Jacobson (1994), Anderson et al. (1994), Buzzell et al. (1975), Capon et al. (1990), Craig and Douglas (1982), Farris and Reibstein (1979), Jacobson and Aaker (1987), McGuire et al. (1990) and Phillips et al. (1983). TQM also has been seen as a method of reducing costs (Crosby 1987 and Dale and Plunkett 1995). Substantial studies dealt with the relationship between companies’ performance and quality improvement, Adam (1994), Adam et al. (1997) , Flynn et al. (1995), Forker (1997), Ittner and Larcker (1997). Empirical study has been done by Madu et al. (1996) on the linkage between organizational performance and quality management, and they presented the measures as pro tability, sales growth, competitiveness, productivity, pro t growth, cost and market share. The direct relationship between TQM and organizational performance also further studied by (Huarng and Chen, 2002; Li and Collier, 2000; Wilson and Collier, 2000; Madu, 2000; Sun, 2000; Terziovski and Samson, 1999)
TQM and its financial effect has been studied by several authors, Hendricks and Singhal (1996, 1997, 2001a, 2001b), and also the general performance improvement after implementation of TQM studied by Easton and Jarrell (1998). Schafferand Thompson (1992), Opara (1996), and Agus and Hassan (2000) have indicated that the positive relationship between Total Quality Man-agement and financial performance & overall performance. According to (Corbett et al., 2005) careful design and implementation of consistent and documented quality management systems can contribute significantly to superior financial performance
Acta Wasaensia 81
A single approach cannot be expected to bring a significant effect on every dimension while measuring organizational performance (Walker and Ruekert, 1987). This forces many firms to operationalized organizational performance in to different segments of measurements like sales growth, return on assets, new product success , market share and overall performance ( Slater and Narver (1994), Narver and Slater, (1990), (Jaworski and Kohli, 1993). Since the 1980s TQM has been used as a competitive weapon for many firms success (Kuei et al., 2001), but some authors warn and show its ineffectiveness and inefficiency (Mani et al., (2003);Waddell andMallen (2001); Choi and Eboch (1998); Chandler, (2000); Dale et al., (1998), Lemak et al., (1997); Reed et al., (1996); Broetzmann et al., (1995); Neal and Tromley, 1995). Following that, a number of literature also indicate the failure of quality management that can be directed to the difficulty of converting TQM concepts into practice (Hafeez, Malak, & Abdelmeguid, 2006)
TQM can be considered as the driver for the integration engineering and manufacturing functions into CE and CE becomes an enabling technology for TQM. Further, disciplines such as Reliabil-ity, Maintainability, and CAD become the enabling technologies for CE (Poeth, D.F 1990). He also stated that firms can use TQM as the vehicle for introduction of CE into the NPD processes. The overall philosophy of concurrent engineering is single, but powerful, principle that enhances the incorporation of downstream issues into the upstream phases of a development process. Con-sequently it shortens product development times, improved product quality, and lower develop-ment– production costs (Yassine, A & Braha, D., (2003)). Hongyi Sun, Yangyang Zhao and Hon Keung Yau (2009) investigated the in uence of quality management on the speed of NPD and compared concurrent engineering (CE) and TQM that leads to several common principles. For instance value analysis, QFD and team work are some of the common items that have direct rela-tionship between CE and TQM. Karbhari, V.M, et.al (1994) stated as team or team building is the first necessary ingredient to good concurrent engineering solutions. Parallelization, standardiza-tion and integration are the three main characteristics of a CE-oriented product development pro-cess, Bullinger and Warschat (1995). According to Sun, H. and Zhoa, Y., (2010) companies which have implemented TQM and other quality tools will have a better basis for implementing new NPD approaches (CE and DFMA). Najmi M., and Ip-Shing F., (2002) stated the possibility of CE characteristics to be incorporated in TQM approach and particularly ISO9000:2000 standard. Martin Marietta’s Space System’s programs have used the TQM concepts like CE, vendor in-volvement, product teams, and continuous product improvement while building and designing structural subsystems.
3. Methodology
This paper has been done using both quantitative and qualitative research approaches. Quantitative methods were formal data collection techniques about the existing business performances and total quality management practices in the company. The qualitative approaches were also used to per-form open interviews & to make some other subjective decisions with concerned persons. The entire data were collected in two phases. The first phase was carried out during 2006/07 and the second one was performed during 2009/10. Its aim was to understand in depth the effect of TQM & CE before & after their partial implementation. Data were collected with various data collection methods to obtain relevant information concerning company’s overall business results and TQM practices. These data gathering methods were:
(1) Records and documentation: secondary data were collected from company’s documenta-tion & historical records. The past eight-years’ business performances were obtained from company’s accomplishment reports.
(2) Questionnaire survey: it was done by preparing questionnaires and distributing them to concerned personnel to assess the existing situations regarding to quality practices within the firm using Crosby’s quality management maturity matrix. It was distributed to 35 employees at supervisory level and above. The purpose of this standard questionnaire survey was to indicate the company’s quality maturity level on five quality dimensions
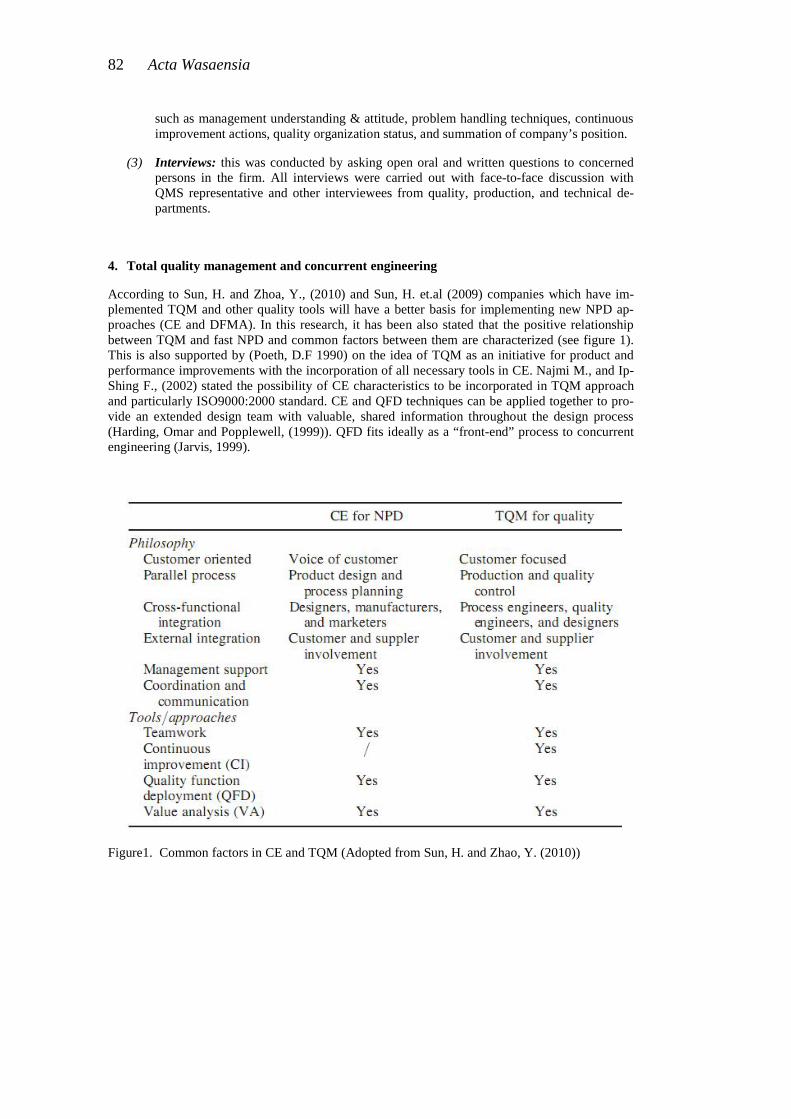
82 Acta Wasaensia
such as management understanding & attitude, problem handling techniques, continuous improvement actions, quality organization status, and summation of company’s position.
(3) Interviews: this was conducted by asking open oral and written questions to concerned persons in the firm. All interviews were carried out with face-to-face discussion with QMS representative and other interviewees from quality, production, and technical de-partments.
4. Total quality management and concurrent engineering
According to Sun, H. and Zhoa, Y., (2010) and Sun, H. et.al (2009) companies which have im-plemented TQM and other quality tools will have a better basis for implementing new NPD ap-proaches (CE and DFMA). In this research, it has been also stated that the positive relationship between TQM and fast NPD and common factors between them are characterized (see figure 1). This is also supported by (Poeth, D.F 1990) on the idea of TQM as an initiative for product and performance improvements with the incorporation of all necessary tools in CE. Najmi M., and Ip-Shing F., (2002) stated the possibility of CE characteristics to be incorporated in TQM approach and particularly ISO9000:2000 standard. CE and QFD techniques can be applied together to pro-vide an extended design team with valuable, shared information throughout the design process (Harding, Omar and Popplewell, (1999)). QFD fits ideally as a “front-end” process to concurrent engineering (Jarvis, 1999).
Figure1. Common factors in CE and TQM (Adopted from Sun, H. and Zhao, Y. (2010))
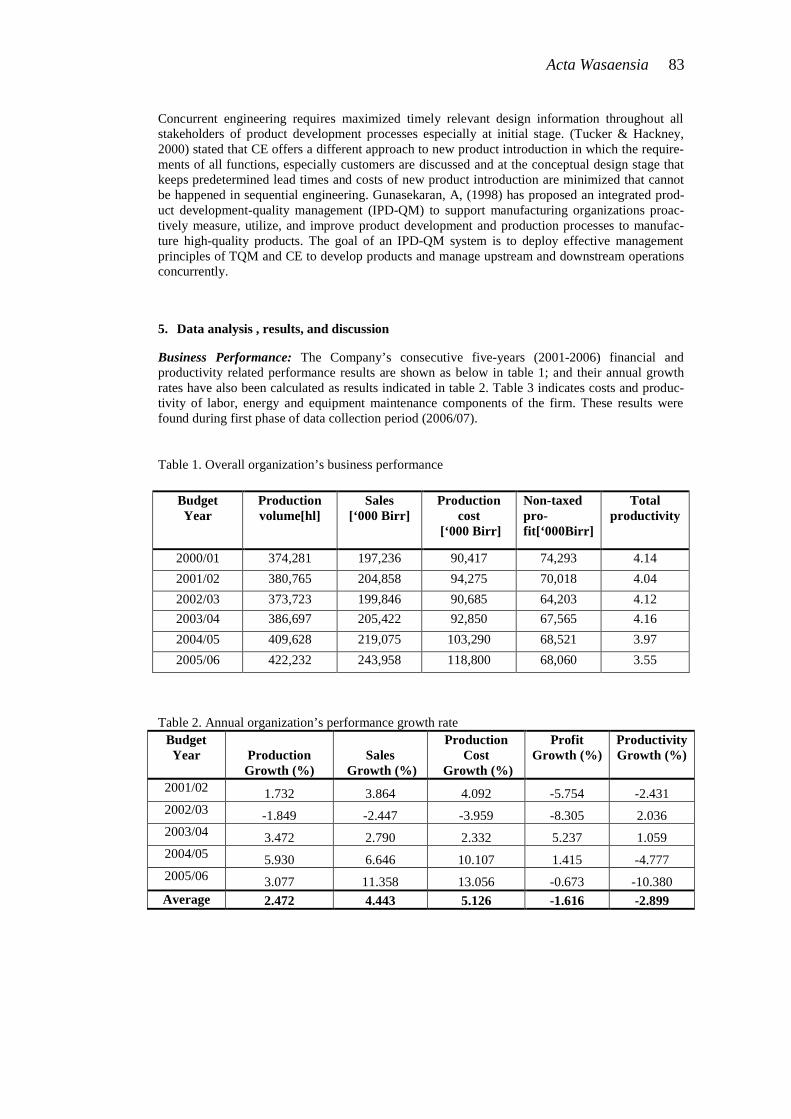
Acta Wasaensia 83
Concurrent engineering requires maximized timely relevant design information throughout all stakeholders of product development processes especially at initial stage. (Tucker & Hackney, 2000) stated that CE offers a different approach to new product introduction in which the require-ments of all functions, especially customers are discussed and at the conceptual design stage that keeps predetermined lead times and costs of new product introduction are minimized that cannot be happened in sequential engineering. Gunasekaran, A, (1998) has proposed an integrated prod-uct development-quality management (IPD-QM) to support manufacturing organizations proac-tively measure, utilize, and improve product development and production processes to manufac-ture high-quality products. The goal of an IPD-QM system is to deploy effective management principles of TQM and CE to develop products and manage upstream and downstream operations concurrently.
5. Data analysis , results, and discussion
Business Performance: The Company’s consecutive five-years (2001-2006) financial and productivity related performance results are shown as below in table 1; and their annual growth rates have also been calculated as results indicated in table 2. Table 3 indicates costs and produc-tivity of labor, energy and equipment maintenance components of the firm. These results were found during first phase of data collection period (2006/07).
Table 1. Overall organization’s business performance
Budget Year
Production volume[hl]
Sales [‘000 Birr]
Production cost
[‘000 Birr]
Non-taxed pro-fit[‘000Birr]
Total productivity
2000/01 374,281 197,236 90,417 74,293 4.14 2001/02 380,765 204,858 94,275 70,018 4.04 2002/03 373,723 199,846 90,685 64,203 4.12 2003/04 386,697 205,422 92,850 67,565 4.16 2004/05 409,628 219,075 103,290 68,521 3.97 2005/06 422,232 243,958 118,800 68,060 3.55
Table 2. Annual organization’s performance growth rate Budget Year Production
Growth (%) Sales
Growth (%)
Production Cost
Growth (%)
Profit Growth (%)
Productivity Growth (%)
2001/02 1.732 3.864 4.092 -5.754 -2.431 2002/03 -1.849 -2.447 -3.959 -8.305 2.036 2003/04 3.472 2.790 2.332 5.237 1.059 2004/05 5.930 6.646 10.107 1.415 -4.777 2005/06 3.077 11.358 13.056 -0.673 -10.380 Average 2.472 4.443 5.126 -1.616 -2.899
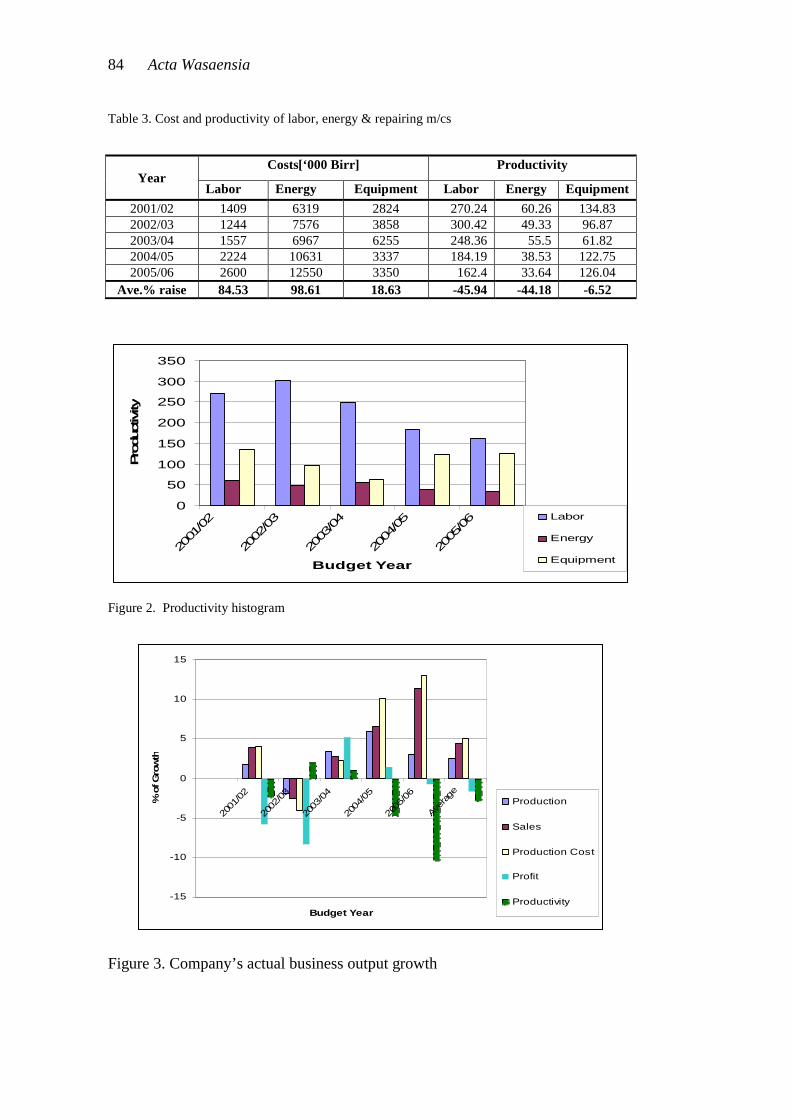
84 Acta Wasaensia
Table 3. Cost and productivity of labor, energy & repairing m/cs
Year Costs[‘000 Birr] Productivity
Labor Energy Equipment Labor Energy Equipment 2001/02 1409 6319 2824 270.24 60.26 134.83 2002/03 1244 7576 3858 300.42 49.33 96.87 2003/04 1557 6967 6255 248.36 55.5 61.82 2004/05 2224 10631 3337 184.19 38.53 122.75 2005/06 2600 12550 3350 162.4 33.64 126.04
Ave.% raise 84.53 98.61 18.63 -45.94 -44.18 -6.52
Figure 2. Productivity histogram
Figure 3. Company’s actual business output growth
0
50
100
150
200
250
300
350
2001
/02
2002
/03
2003
/04
2004
/05
2005
/06
Budget Year
Prod
uctiv
ity
Labor
Energy
Equipment
-15
-10
-5
0
5
10
15
2001
/02
2002
/03
2003
/04
2004
/05
2005
/06
Aver
age
Budget Year
% o
f Gro
wth
Production
Sales
Production Cost
Profit
Productivity
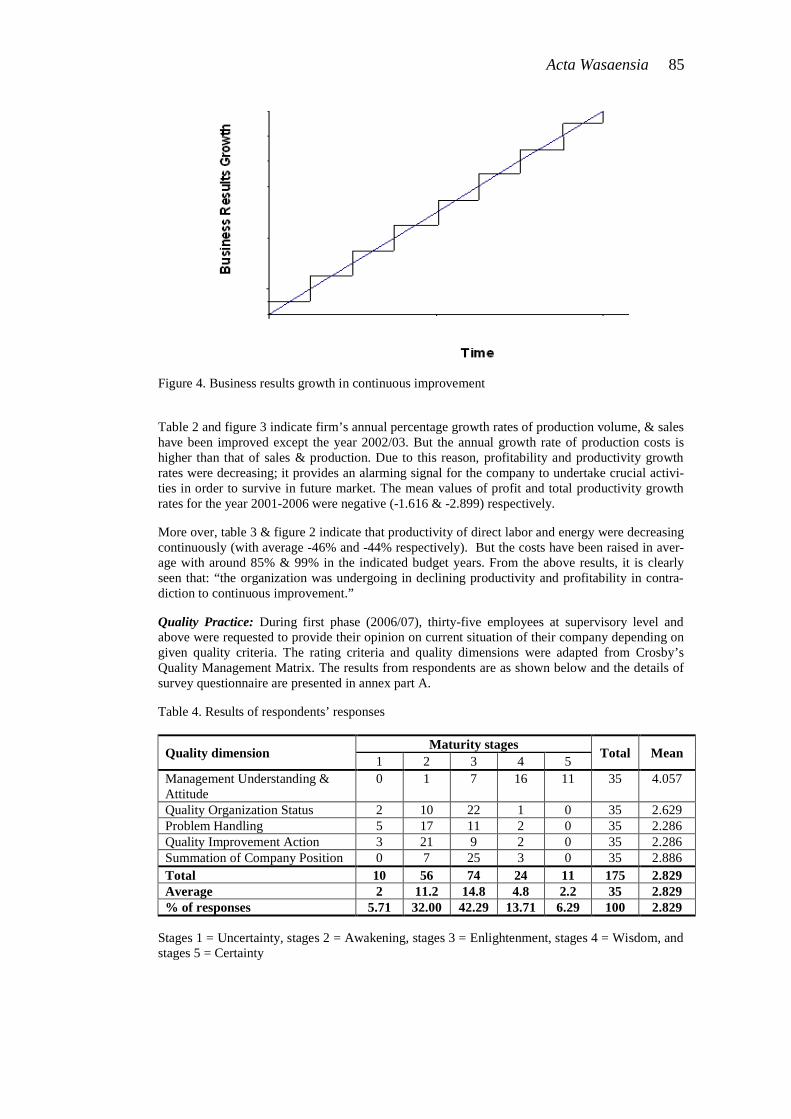
Acta Wasaensia 85
Figure 4. Business results growth in continuous improvement
Table 2 and figure 3 indicate firm’s annual percentage growth rates of production volume, & sales have been improved except the year 2002/03. But the annual growth rate of production costs is higher than that of sales & production. Due to this reason, profitability and productivity growth rates were decreasing; it provides an alarming signal for the company to undertake crucial activi-ties in order to survive in future market. The mean values of profit and total productivity growth rates for the year 2001-2006 were negative (-1.616 & -2.899) respectively.
More over, table 3 & figure 2 indicate that productivity of direct labor and energy were decreasing continuously (with average -46% and -44% respectively). But the costs have been raised in aver-age with around 85% & 99% in the indicated budget years. From the above results, it is clearly seen that: “the organization was undergoing in declining productivity and profitability in contra-diction to continuous improvement.”
Quality Practice: During first phase (2006/07), thirty-five employees at supervisory level and above were requested to provide their opinion on current situation of their company depending on given quality criteria. The rating criteria and quality dimensions were adapted from Crosby’s Quality Management Matrix. The results from respondents are as shown below and the details of survey questionnaire are presented in annex part A.
Table 4. Results of respondents’ responses
Quality dimension Maturity stages Total Mean 1 2 3 4 5 Management Understanding & Attitude
0 1 7 16 11 35 4.057
Quality Organization Status 2 10 22 1 0 35 2.629 Problem Handling 5 17 11 2 0 35 2.286 Quality Improvement Action 3 21 9 2 0 35 2.286 Summation of Company Position 0 7 25 3 0 35 2.886 Total 10 56 74 24 11 175 2.829 Average 2 11.2 14.8 4.8 2.2 35 2.829 % of responses 5.71 32.00 42.29 13.71 6.29 100 2.829
Stages 1 = Uncertainty, stages 2 = Awakening, stages 3 = Enlightenment, stages 4 = Wisdom, and stages 5 = Certainty
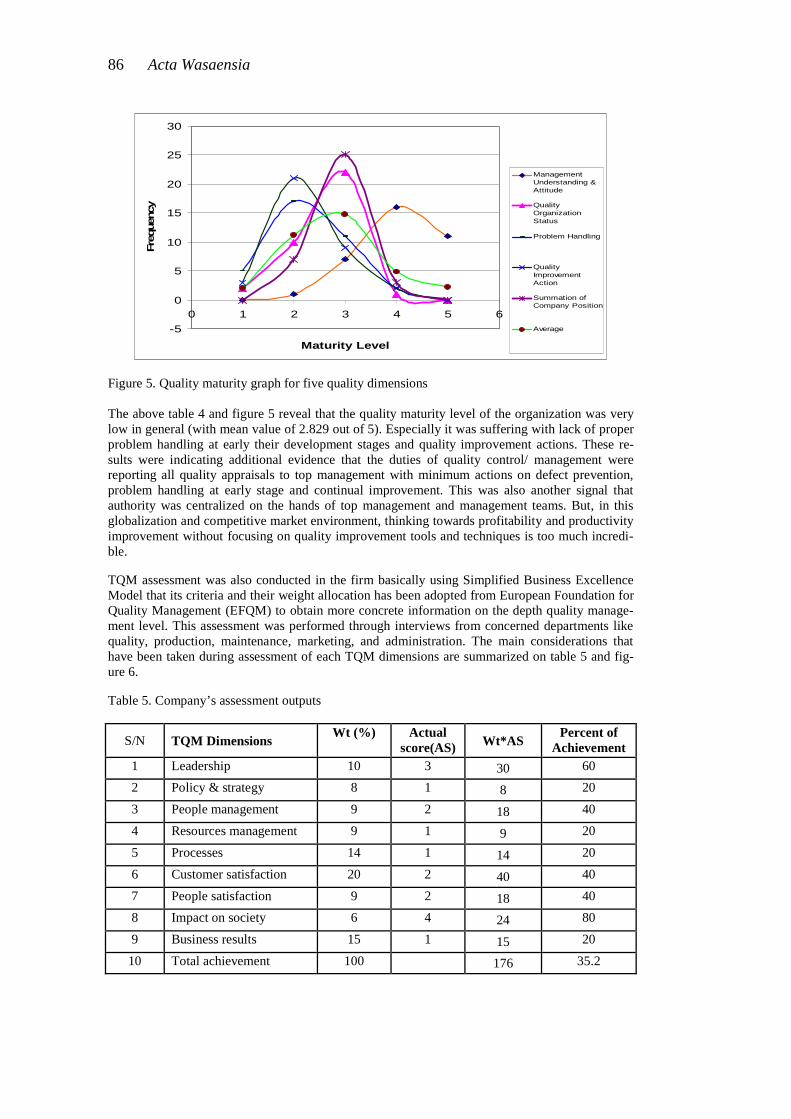
86 Acta Wasaensia
Figure 5. Quality maturity graph for five quality dimensions The above table 4 and figure 5 reveal that the quality maturity level of the organization was very low in general (with mean value of 2.829 out of 5). Especially it was suffering with lack of proper problem handling at early their development stages and quality improvement actions. These re-sults were indicating additional evidence that the duties of quality control/ management were reporting all quality appraisals to top management with minimum actions on defect prevention, problem handling at early stage and continual improvement. This was also another signal that authority was centralized on the hands of top management and management teams. But, in this globalization and competitive market environment, thinking towards profitability and productivity improvement without focusing on quality improvement tools and techniques is too much incredi-ble.
TQM assessment was also conducted in the firm basically using Simplified Business Excellence Model that its criteria and their weight allocation has been adopted from European Foundation for Quality Management (EFQM) to obtain more concrete information on the depth quality manage-ment level. This assessment was performed through interviews from concerned departments like quality, production, maintenance, marketing, and administration. The main considerations that have been taken during assessment of each TQM dimensions are summarized on table 5 and fig-ure 6.
Table 5. Company’s assessment outputs
S/N TQM Dimensions Wt (%) Actual score(AS) Wt*AS Percent of
Achievement 1 Leadership 10 3 30 60 2 Policy & strategy 8 1 8 20 3 People management 9 2 18 40 4 Resources management 9 1 9 20 5 Processes 14 1 14 20 6 Customer satisfaction 20 2 40 40 7 People satisfaction 9 2 18 40 8 Impact on society 6 4 24 80 9 Business results 15 1 15 20
10 Total achievement 100 176 35.2
-5
0
5
10
15
20
25
30
0 1 2 3 4 5 6
Maturity Level
Freq
uenc
y
ManagementUnderstanding &Attitude
QualityOrganizationStatus
Problem Handling
QualityImprovementAction
Summation ofCompany Position
Average
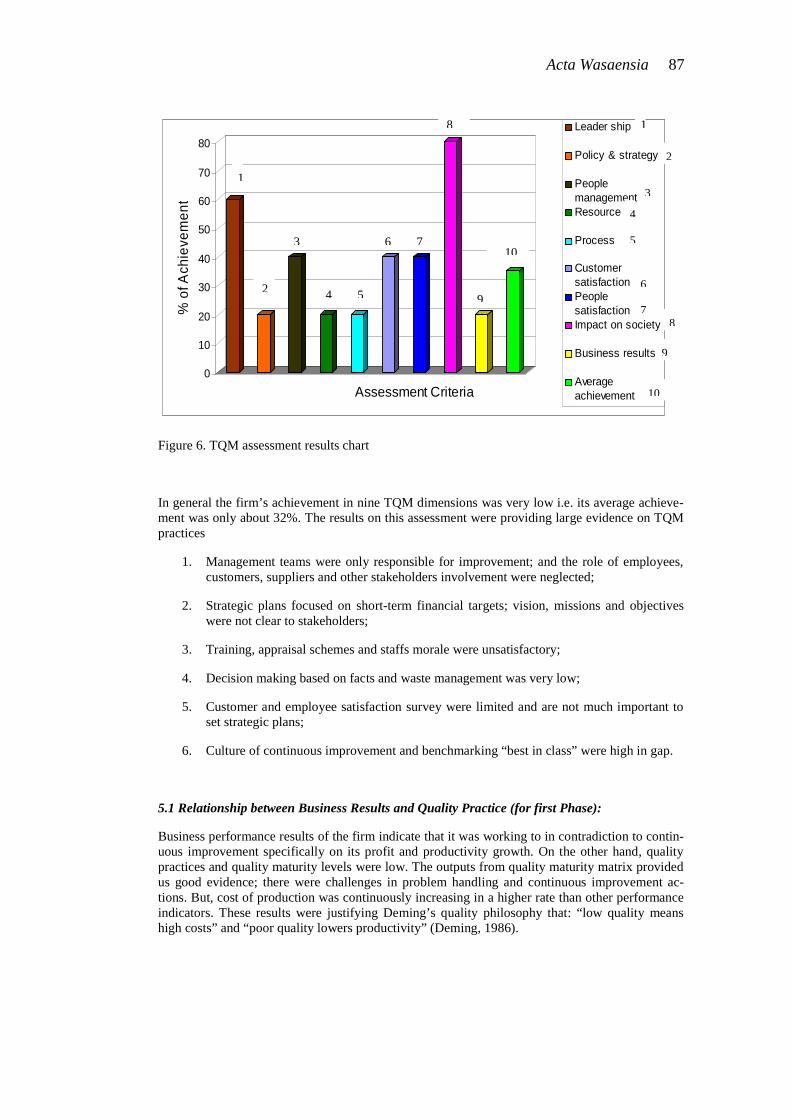
Acta Wasaensia 87
Figure 6. TQM assessment results chart
In general the firm’s achievement in nine TQM dimensions was very low i.e. its average achieve-ment was only about 32%. The results on this assessment were providing large evidence on TQM practices
1. Management teams were only responsible for improvement; and the role of employees, customers, suppliers and other stakeholders involvement were neglected;
2. Strategic plans focused on short-term financial targets; vision, missions and objectives were not clear to stakeholders;
3. Training, appraisal schemes and staffs morale were unsatisfactory;
4. Decision making based on facts and waste management was very low;
5. Customer and employee satisfaction survey were limited and are not much important to set strategic plans;
6. Culture of continuous improvement and benchmarking “best in class” were high in gap.
5.1 Relationship between Business Results and Quality Practice (for first Phase):
Business performance results of the firm indicate that it was working to in contradiction to contin-uous improvement specifically on its profit and productivity growth. On the other hand, quality practices and quality maturity levels were low. The outputs from quality maturity matrix provided us good evidence; there were challenges in problem handling and continuous improvement ac-tions. But, cost of production was continuously increasing in a higher rate than other performance indicators. These results were justifying Deming’s quality philosophy that: “low quality means high costs” and “poor quality lowers productivity” (Deming, 1986).
0
10
20
30
40
50
60
70
80
% o
f Ach
ieve
men
t
Leader ship
Policy & strategy
PeoplemanagementResource
Process
Customersatisfaction Peoplesatisfaction Impact on society
Business results
Averageachievement Assessment Criteria
1
2
3
1
2
3
4
5
6
7 8
9
10
4 5
6 7
8
9
10
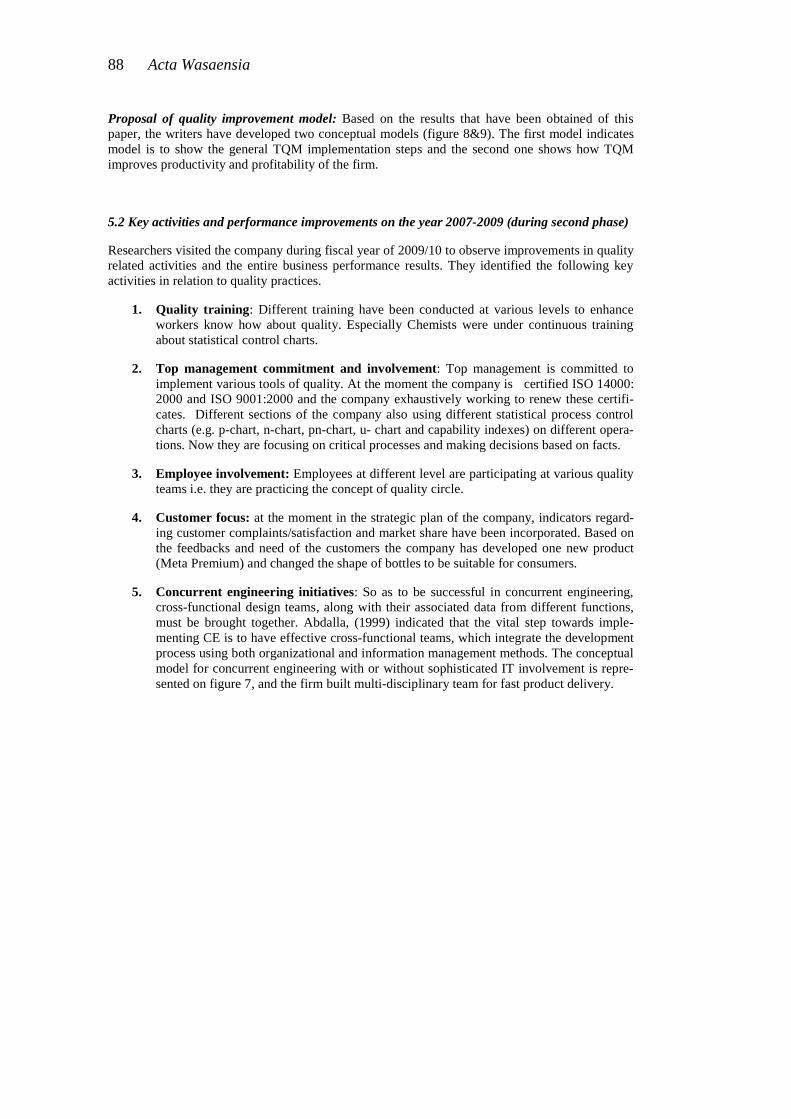
88 Acta Wasaensia
Proposal of quality improvement model: Based on the results that have been obtained of this paper, the writers have developed two conceptual models (figure 8&9). The first model indicates model is to show the general TQM implementation steps and the second one shows how TQM improves productivity and profitability of the firm.
5.2 Key activities and performance improvements on the year 2007-2009 (during second phase)
Researchers visited the company during fiscal year of 2009/10 to observe improvements in quality related activities and the entire business performance results. They identified the following key activities in relation to quality practices.
1. Quality training: Different training have been conducted at various levels to enhance workers know how about quality. Especially Chemists were under continuous training about statistical control charts.
2. Top management commitment and involvement: Top management is committed to implement various tools of quality. At the moment the company is certified ISO 14000: 2000 and ISO 9001:2000 and the company exhaustively working to renew these certifi-cates. Different sections of the company also using different statistical process control charts (e.g. p-chart, n-chart, pn-chart, u- chart and capability indexes) on different opera-tions. Now they are focusing on critical processes and making decisions based on facts.
3. Employee involvement: Employees at different level are participating at various quality teams i.e. they are practicing the concept of quality circle.
4. Customer focus: at the moment in the strategic plan of the company, indicators regard-ing customer complaints/satisfaction and market share have been incorporated. Based on the feedbacks and need of the customers the company has developed one new product (Meta Premium) and changed the shape of bottles to be suitable for consumers.
5. Concurrent engineering initiatives: So as to be successful in concurrent engineering, cross-functional design teams, along with their associated data from different functions, must be brought together. Abdalla, (1999) indicated that the vital step towards imple-menting CE is to have effective cross-functional teams, which integrate the development process using both organizational and information management methods. The conceptual model for concurrent engineering with or without sophisticated IT involvement is repre-sented on figure 7, and the firm built multi-disciplinary team for fast product delivery.
Acta Wasaensia 89
Figure 7. Concurrent Engineering/cross functional team information flow
Though consistence and progressive performance improvement is challenging in the existing dy-namic market, the general trend from the result of quality management practices and concurrent engineering practice of the case company shows a positive relationship with business performance improvement.
Table 6. Summarized results of business performance improvement Budget Year
Production Growth [%]
Sales Growth [%]
Return on Total Asset ROA [%]
Gross Profit Growth [%]
Productivity Growth [%]
2006/07 11.32 9.25 15.73 6.38 3.51
2007/08 20.23 21.11 18.14 8.64 2.87
2008/09 23.53 20.81 17.06 8.92 5.63
The modified models for TQM implementation which is linked with concurrent engineering is presented on Figure 8 and the proposed business improvement model on figure 9.
Concurrent Engineer-ing team
Customer
Suppliers
Quality control & inspection
Design en-gineers
Manufacturing & process planner
Marketing & cost engineers
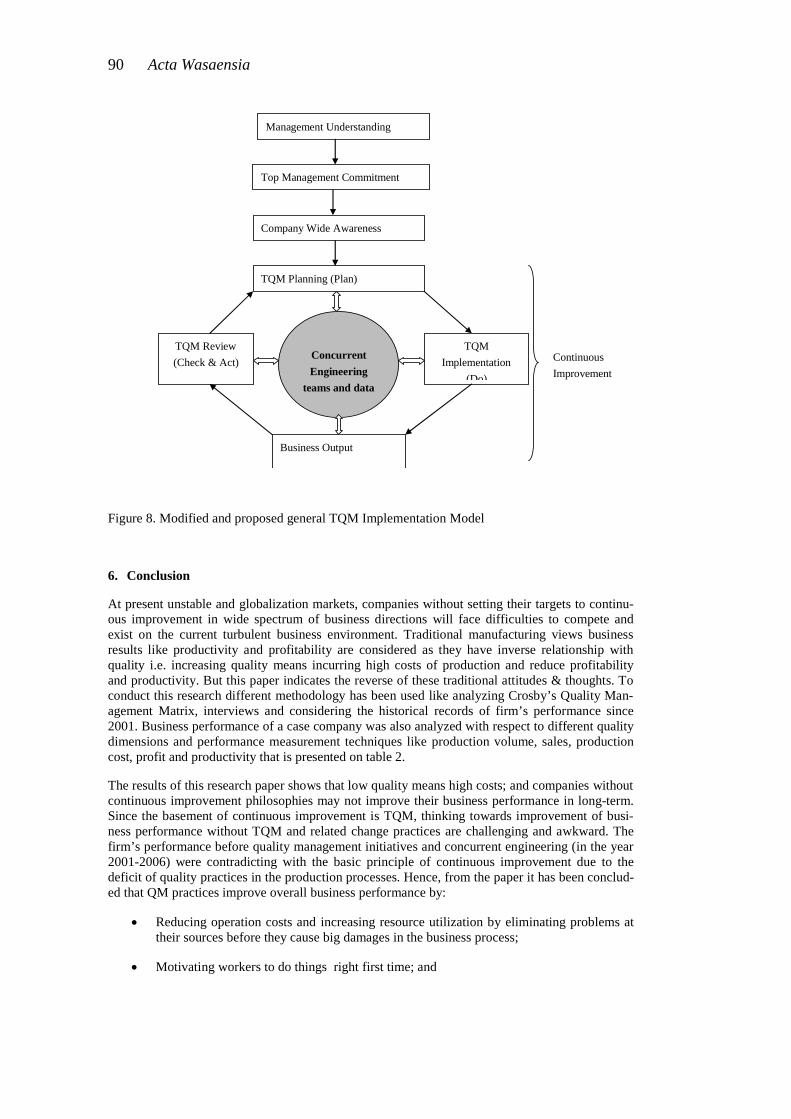
90 Acta Wasaensia
Figure 8. Modified and proposed general TQM Implementation Model
6. Conclusion
At present unstable and globalization markets, companies without setting their targets to continu-ous improvement in wide spectrum of business directions will face difficulties to compete and exist on the current turbulent business environment. Traditional manufacturing views business results like productivity and profitability are considered as they have inverse relationship with quality i.e. increasing quality means incurring high costs of production and reduce profitability and productivity. But this paper indicates the reverse of these traditional attitudes & thoughts. To conduct this research different methodology has been used like analyzing Crosby’s Quality Man-agement Matrix, interviews and considering the historical records of firm’s performance since 2001. Business performance of a case company was also analyzed with respect to different quality dimensions and performance measurement techniques like production volume, sales, production cost, profit and productivity that is presented on table 2.
The results of this research paper shows that low quality means high costs; and companies without continuous improvement philosophies may not improve their business performance in long-term. Since the basement of continuous improvement is TQM, thinking towards improvement of busi-ness performance without TQM and related change practices are challenging and awkward. The firm’s performance before quality management initiatives and concurrent engineering (in the year 2001-2006) were contradicting with the basic principle of continuous improvement due to the deficit of quality practices in the production processes. Hence, from the paper it has been conclud-ed that QM practices improve overall business performance by:
Reducing operation costs and increasing resource utilization by eliminating problems at their sources before they cause big damages in the business process;
Motivating workers to do things right first time; and
Continuous Improvement
Management Understanding
Top Management Commitment
Company Wide Awareness
TQM Planning (Plan)
TQM Review (Check & Act)
TQM Implementation
(Do)
Business Output
Concurrent Engineering
teams and data bases
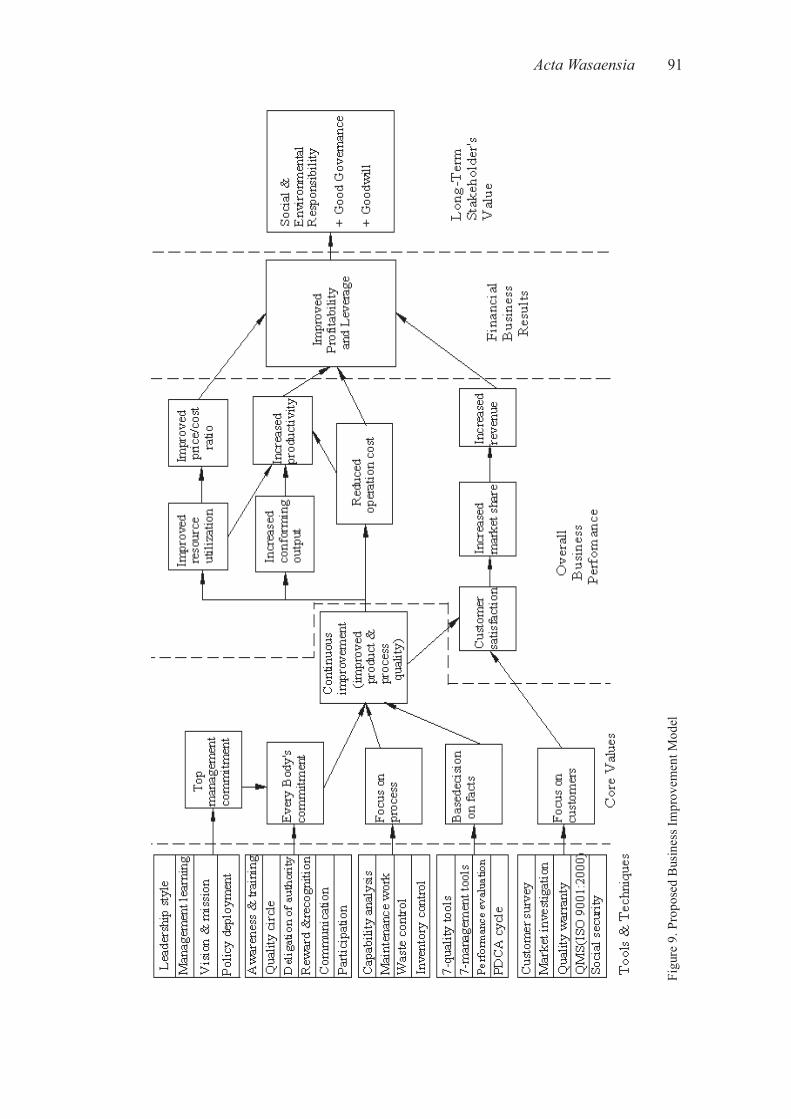
Acta Wasaensia 91
Figu
re 9
. Pro
pose
d B
usin
ess I
mpr
ovem
ent M
odel
92 Acta Wasaensia
Increasing employees’ skill, capability and productivity with providing necessary training & education.
As ReVelle, J.B., (2004) indicated, no single approach has capable of solving every organizational problem. The positive performance change which is achieved from year 2007-2009 indicate that if the quality management initiative is linked by concurrent engineering (CE), it leads to a better result in general (see table 6.). This in turn leads to further improvements of business performance with related approaches (e.g. BPR & etc.). Some challenges that probably hinder the improvement processes have been observed from the case study. For instance waiting the quality problems until they reach the final stage (testing inspections); commitment on delegation to encourage decision making (taking action rather than reporting appraisals) training and fair motivational skim and widening continuous improvement horizon throughout the company for consistent long term bene-fit.
References
Aaker, D. and Jacobson, R., (1994), The financial information content of perceived quality, Jour-nal of Marketing Research, 31(2), 191-201.
Adam, E. E. JR., (1994), Alternative quality improvement practices and organization performance, Journal of Operations Management, 12(1), 27 44.
Adam, E. E. JR., Corbett, L. M., FloresS, B. E., Harrison, N. J., Lee, T. S., Rho, B.,Ribera, J., Samson, D. and Westbrook, R., (1997), An international study of quality improvement approach and firm performance, International Journal of Operations and Production Management, 17(9), 842 873.
Anderson, E.W., Fornell, C. and Lehmann, D. R., (1994), Customer satisfaction, market share, and profitability: findings from Sweden, Journal of Marketing, 58(3), 53-66.
Agus A., and Za’faran H., (2000), Exploring the Relationship between the Length of TQM Adop-tion and Financial Performance: An Empirical Study in Malaysi, International Journal of Man-agement, September, Vol 17 No 3, pp 323-333
Bergman, B., & Klefsjö, B. (2003). Quality from Customer Needs to Customer Satisfaction, (2nd Ed.), Lund: Studentlitteratur.
Brocka , Bruce and M. Suzanne(1992). Quality Management: implementing the best ideas of the masters, New York: McGraw Hill.
Broetzmann, S.M., Kemp, J., Rossano, M. & Marwaha, J. (1995),Customer satisfaction- lip ser-vice or management tool?, Managing Service Quality, 5, pp. 13–18.
Buzzell, R. D., Gale, B. T. and Sultan, R. G.M., 1975, Market share a key to profitability, Harvard Business Review, 53(1), 97-106.
Capon, N., Farley, J. U. and Hoeing, S., 1990, Determinants of financial performance: a meta-analysis, Management Science, 36(10), 1143-1159.
Chandler, G.N. (2000) Human resource management, TQM and rm performance in small and medium-size enterprises, Entrepreneurship: Theory & Practice, 25(1), pp. 43–57.
Choi, T.Y. & Eboch, K. (1998) The TQM paradox: Relations among TQM practices, plant per-formance, and customer satisfaction, Journal of Operations Management, 17, pp. 59–75.
Corbett, C.J., Montes-Sancho, M.J. & Kirsch, D.K. (2005) The financial impact of ISO 9000 certification in the United States: an empirical analysis, Management Science, 51(7), pp. 1046-1059.
Craig,C.S. and Douglass,S.P.,(1982),Strategic factors associated with market and financial per-formance. Quarterly Review of Economics and Business, 22(2),101-112.
Acta Wasaensia 93
Crosby, P. B., 1987, ‘‘Quality Is Free. The Art of Making Quality Certain’’, (New York:McGraw-Hill).
Crosby, P.B. (1979) ‘‘Quality is Free’’, New York, New American Library).
Crosby, P.B. (1984) Quality without Tears’’ (New York, McGraw-Hill).
Dahlgaard, J. J., Kristensen, K., & Kanji, G. K. (1998). Fundamentals of Total Quality Manage-ment: Process Analysis and Improvement, London: Chapman &Hall.
Dale, B., Boaden, R., Wilcox, R. & McQuarter, W. (1998) The use of quality management tech-niques and tools: an examination of some key issues, International Journal of Technology Man-agement, 16, pp. 305-325.
Dale, B.G. (2003). ‘‘Managing Quality’’ (4th Ed.).Malden: Blackwell.
Dale, B.G. and Plunkett, J. J., 1995, ‘‘Quality Costing ‘’London: Chapman & Hall.
Deming, W. E. (1994). The New Economics for Industry, Government, Education, 2nd Ed.. Cam-bridge: Massachusetts Institute of Technology Center for Advanced Engineering Study.
Deming, W.E. (1982) Quality, Productivity and Competitive Position, Cambridge, MA, Massa-chusetts Institute of Technology.
Deming, W.E. (1986) ‘‘Out of the Crisis, Cambridge, MA, Center for Advanced Engineering Study.
Eng, E.Q. & Yusof, S.M. (2003) A survey of TQM practices in the Malaysian electrical and elec-tronic industry, Total Quality Management, 14(1), pp. 63-77.
Farris,P.W. and Reibstein, D.J., 1979, How prices, ad expenditures, and profits are linked, Har-vard Business Review, 57(6), 173-184.
Flynn, B. B., Schroeder, R.G. and Sakakibara,S. (1994), A framework for quality management research and an associated measurement instrument. Journal of Operations Management, 11, 339-366 ; 1995, The impact of quality management practices on performance and competitive ad-vantage, Decision Sciences, 26(5), 659-691.
Forker, L. B., (1997), Factors affecting supplier quality performance, Journal of Operations Man-agement, 15(4), 243 269.
Garvin, D.A. (1984) What does product quality really mean?, Sloan Management, Fall.
Garvin, D.A. (1988) ‘‘Managing Quality’’, New York, The Free Press.
Garvin, David A.( 1986) Quality Problems, Policies, and Attitudes in the U.S. and Japan: An Ex-ploratory Study, Academy of Management Journal .
Goetsch, D.L, and Davis, S.B. (1997) , Introduction to Total Quality: Quality Management for Production, Processing, and Services’’, 2nd Ed.. New Jersey, USA: Prentice-Hall Int., Inc.
Gunasekaran, A. (1998), An integrated product development-quality management system for manufacturing, The TQM Magazine, Volume 10 · Number 2 · 1998· pp. 115–123
Hafeez, K., Malak, N., & Abdelmeguid, H. (2006). A framework for TQM to achieve business excellence’’, Total Quality Management, 17(9), 1213–1229.
Harding, J.A., Omar, A.R.,and Popplewell, K. (1999) "Applications of QFD within a concurrent engineering environment, International Journal of Agile Management Systems, Vol. 1 Iss: 2, pp.88 - 98
Hellsten, U., & Klefsjö, B. (2000). TQM as a Management System Consisting Of Values, Tech-niques and Tools, the TQM Magazine, 12(4), 238-244.
Huarng, F. & Chen, Y.T. (2002) , Relationships of TQM philosophy, methods and performance: a survey in Taiwan, Industrial Management & Data Systems, 102(4), pp. 226–234.
94 Acta Wasaensia
Issac, G., Rajendran, C. & Anantharaman, R.N. (2004), A conceptual framework for total quality management in software organizations, Total Quality Management, 15(3), pp. 307-344.
Ittner, C. D. and Larcker, D., 1997, The performance effects of process management techniques, Management Science, 43(4), 522-534.
Jacobson, R. and Aaker, D. A., 1987, The strategic role of product quality, Journal of Marketing, 51(4), 31-44.
Jarvis, M, ‘‘Concurrent Engineering’’, Work Study, Vol. 48, No. 3, 1999, pp 88-91.
Jaworski, B.J. & Kohli, A.K. (1993) Market orientation: antecedents and consequences, Journal of Marketing, 57, pp. 53–70.
Juran, J.M. (1982) Juran on Quality Improvement, New York, Juran Institute.
Juran, J.M. (1989), Juran on Leadership for Quality, New York, Juran Institute.
Kanji I, G.K., Kristensen, K.K. & Dahlgaard, J.J. (1992), Total quality management as a strategic variable,,Total Quality Management, 3, pp. 3-8.
Karbhari, V.M, et.al (1994) Total Quality Design: An Approach for Customer Satisfaction in Critical Advanced Technologies, Benchmarking for Quality Management & Technology, Vol. 1, No. 1, 1994, pp. 65-88.
Kotter, J. P. (1996). Leading Change. Boston, Harvard Business School Press.
Kuei, C., Madu, C. N. & Lin, C. (2001) The relationship between supply chain quality manage-ment practices and organizational performance, International Journal of Quality & Reliability Management, 16(8), pp. 864-872.
Kuei, C., Madu, C.N. & Lin, C. (2001) The relationship between supply chain quality manage-ment practices and organizational performance, International Journal of Quality & Reliability Management, 16(8), pp. 864–872.
Lemak, D.J., Reed, R. & Satish, P.K. (1997),Commitment to total quality management: is there a relationship with rm performance?, Journal of Quality Management, 2(1), pp. 67–86.
Li, L.X. & Collier, D.A. (2000), The role of technology and quality on hospital Financial perfor-mance – an exploratory analysis, International Journal of Service Industry Management, 11(3), pp. 202–224.
Madu, C.N. (2000) ‘‘House of Quality (QFD) in A Minute’’, Fair eld, CT: Chi Publishers.
Madu, C.N., Kuei, C. & Jacob, R. (1996) An empirical assessment of the in uence of quality dimensions on organizational performance, International Journal of Production Research, 34(7), pp. 1943–1962.
Mani, T.P., Murugan, N. & Rajendran, C. (2003) TQM is a must for success, but not suf cient for survival: a conceptual framework as contemplated in ancient Tamil literature in India, Total Quality Management, 14(4), pp. 395–405.
Martin, L. L. (1993). Total Quality Management in Human Service Organizations, Newbury Park, Calif: Sage.
Mcguire, J.B., Schneeweis, T. and Branch, B., 1990, Perceptions of firm quality: a cause or result of firm performance, Journal of Management, 16(1), 167 180.
Morris, L. (1993). TQM Improves Productivity, Training & Development, 47 (10) pp. 74-75
Najmi M., and Ip-Shing F., (2002), Concurrent Engineering in Total Quality Management Envi-ronmen, 8th International Conference on Concurrent Enterprising, Rome, Italy
Narver, J.C. & Slater, S.F. (1990) The effect of a market orientation on business pro tability, Journal of Marketing, 54, pp. 20–35.
Acta Wasaensia 95
Neal, J.A. & Tromley, C.L. (1995) From incremental change to retro t: creating high-performance work systems, Academic Management Executive, 9, pp. 42–54.
Neely, A., (1998). Performance Measurement: Why, What and How , Economist Books, London.
Oakland, J.S. (1993). Total Quality Management: The Route to Improving Performance, 2nd Ed, Oxford, UK: Butter Worth– Heinemann Ltd.
Opara Emmanuel Uzoma, 1996.The Empirical Test of Total Quality Management: AnApplication of TQM at Chevron and Its Impact on Productivit, Quality Management Journal. Vol 4 No 1, p 10.
Phillips, L.W.,Chang, D.R. and Buzzell, R.D., 1983, Product quality, cost position and business performance: a test of some key hypotheses, Journal of Marketing, 47(2), 26-43.
Poeth,D.F (1990), Concurrent Engineering - Key to Cost-Effective Product Reliability, Main-tainability, and Manufacturability , Proceedings R&M & CAE in Concurrent Engineering Work-shop.
Reed, R., Lemak, D.J. & Montgomery, J.C. (1996) beyond process: TQM content and rm per-formance, Academy of Management Review, 21(1), pp. 173–202.
ReVelle, J.B., (2004), Quality Essentials: A Reference Guide from A to Z.’ASQ-Quality Press. Milwaukee, WI.
Schaffer RH and H Thompson, 1992, Successful Change Programs Begin with Result, Harvard Business Review, September/October, pp 80–89.
Slater, S.F. & Narver, J.C. (1994) Does competitive environment moderate the market orientation performance relationship?, Journal of Marketing, 58, pp. 46–55.
Sun, H. (2000) Total quality management, ISO 9000 certi cation and performance improvement, International’’, Journal of Quality & Reliability Management, 17(2), pp. 168–179
Sun, H., Zhao, Y., and Hon Keung Yau, H.K., (2009), the relationship between quality manage-ment and the speed of new product development, The TQM Journal, Vol. 21 No. 6, 2009 pp. 576-588
Sun,H. and Zhoa, Y.,(2010), The empirical relationship between quality management and the speed of new product development, Total Quality Management, Vol. 21, No. 4, April 2010, 351–361
Terziovski, M. & Samson, D. (1999), the link between total quality management practice and organizational performance, International Journal of Quality & Reliability Management, 16(3), pp. 226-237.
Tucker, D., & Hackney, R, Towards the integration of concurrent engineering environments with-in organizational strategy, Journal of management development, Vol. 19, No 3, 2000, p. 179-189
Waddell, D. & Mallen, D. (2001) Quality mangers: beyond 2000?, Total Quality Management, 12, pp. 373–384.
Walker, O.C. & Ruekert, R.W. (1987) Marketing’s role in the implementation of business strate-gies: a critical review and conceptual framework, Journal of Marketing, 51, pp. 15–33
Wilson, D.D. & Collier, D.A. (2000), an empirical investigation of the Malcolm Baldrige National Quality Award causal model, Decision Science, 31(2), pp. 361–390
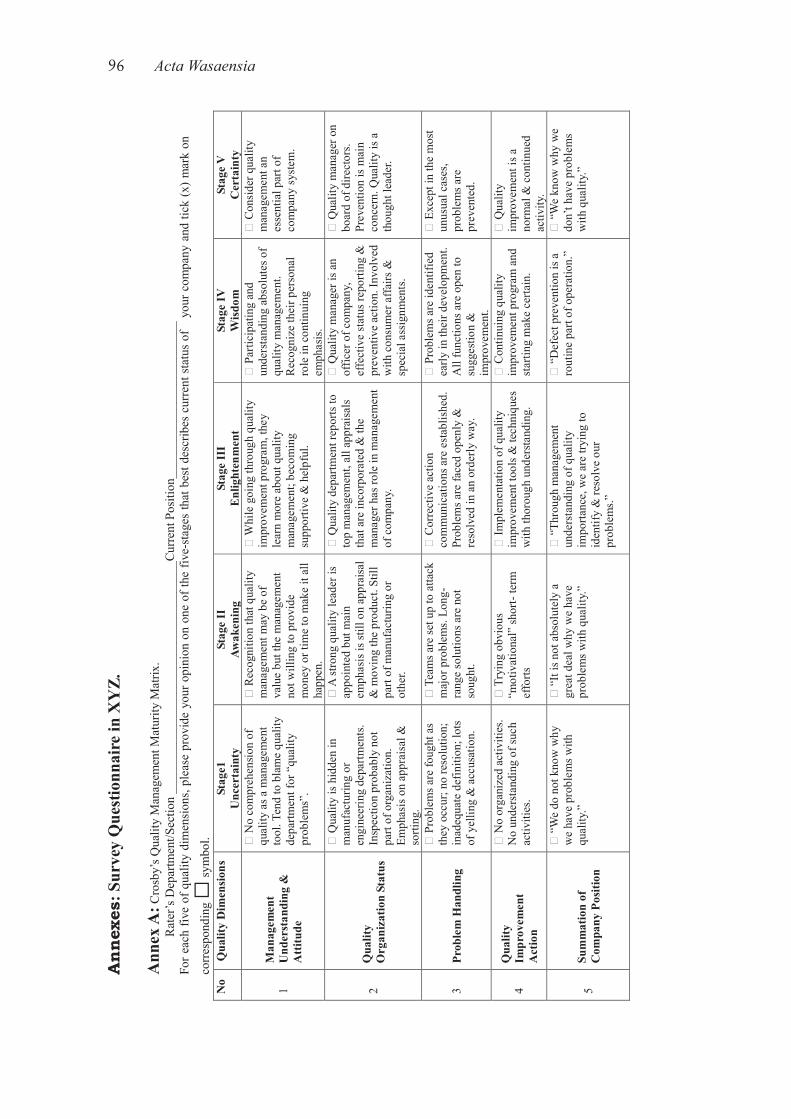
96 Acta Wasaensia
Ann
exes
: Sur
vey
Que
stio
nnai
re in
XY
Z.
Ann
ex A
: Cro
sby’
s Qua
lity
Man
agem
ent M
atur
ity M
atrix
.
Rat
er’s
Dep
artm
ent/S
ectio
n __
____
____
____
____
____
____
____
____
___C
urre
nt P
ositi
on__
____
____
____
____
____
___
For e
ach
five
of q
ualit
y di
men
sion
s, pl
ease
pro
vide
you
r opi
nion
on
one
of th
e fiv
e-st
ages
that
bes
t des
crib
es c
urre
nt s
tatu
s of
yo
ur c
ompa
ny a
nd ti
ck (x
) mar
k on
co
rres
pond
ing
sym
bol.
No
Qua
lity
Dim
ensi
ons
Stag
e1
Unc
erta
inty
St
age
II
Awak
enin
g St
age
III
Enl
ight
enm
ent
Stag
e IV
W
isdo
m
Stag
e V
C
erta
inty
1M
anag
emen
t U
nder
stan
ding
&
Att
itude
No
com
preh
ensio
n of
qu
ality
as a
man
agem
ent
tool
. Ten
d to
bla
me
qual
ity
depa
rtmen
t for
“qu
ality
pr
oble
ms”
.
Rec
ogni
tion
that
qua
lity
man
agem
ent m
ay b
e of
va
lue
but t
he m
anag
emen
t no
t will
ing
to p
rovi
de
mon
ey o
r tim
e to
mak
e it
all
happ
en.
Whi
le g
oing
thro
ugh
qual
ity
impr
ovem
ent p
rogr
am, t
hey
lear
n m
ore
abou
t qua
lity
man
agem
ent;
beco
min
g su
ppor
tive
& h
elpf
ul.
Par
ticip
atin
g an
d un
ders
tand
ing
abso
lute
s of
qual
ity m
anag
emen
t. R
ecog
nize
thei
r per
sona
l ro
le in
con
tinui
ng
emph
asis
.
Con
side
r qua
lity
man
agem
ent a
n es
sent
ial p
art o
f co
mpa
ny sy
stem
.
2Q
ualit
y O
rgan
izat
ion
Stat
us
Qua
lity
is h
idde
n in
m
anuf
actu
ring
or
engi
neer
ing
depa
rtmen
ts.
Insp
ectio
n pr
obab
ly n
ot
part
of o
rgan
izat
ion.
Em
phas
is o
n ap
prai
sal &
so
rting
.
A st
rong
qua
lity
lead
er is
ap
poin
ted
but m
ain
emph
asis
is st
ill o
n ap
prai
sal
& m
ovin
g th
e pr
oduc
t. St
ill
part
of m
anuf
actu
ring
or
othe
r.
Qua
lity
depa
rtmen
t rep
orts
to
top
man
agem
ent,
all a
ppra
isal
s th
at a
re in
corp
orat
ed &
the
man
ager
has
role
in m
anag
emen
t of
com
pany
.
Qua
lity
man
ager
is a
n of
ficer
of c
ompa
ny,
effe
ctiv
e st
atus
repo
rting
&
prev
entiv
e ac
tion.
Invo
lved
w
ith c
onsu
mer
affa
irs &
sp
ecia
l ass
ignm
ents
.
Qua
lity
man
ager
on
boar
d of
dire
ctor
s. Pr
even
tion
is m
ain
conc
ern.
Qua
lity
is a
th
ough
t lea
der.
3Pr
oble
m H
andl
ing
Pro
blem
s are
foug
ht a
s th
ey o
ccur
; no
reso
lutio
n;
inad
equa
te d
efin
ition
; lot
s of
yel
ling
& a
ccus
atio
n.
Tea
ms a
re se
t up
to a
ttack
m
ajor
pro
blem
s. Lo
ng-
rang
e so
lutio
ns a
re n
ot
soug
ht.
Cor
rect
ive
actio
n co
mm
unic
atio
ns a
re e
stab
lishe
d.
Prob
lem
s are
face
d op
enly
&
reso
lved
in a
n or
derly
way
.
Pro
blem
s are
iden
tifie
d ea
rly in
thei
r dev
elop
men
t. A
ll fu
nctio
ns a
re o
pen
to
sugg
estio
n &
im
prov
emen
t.
Exc
ept i
n th
e m
ost
unus
ual c
ases
, pr
oble
ms a
re
prev
ente
d.
4Q
ualit
y Im
prov
emen
t A
ctio
n
No
orga
nize
d ac
tiviti
es.
No
unde
rsta
ndin
g of
such
ac
tiviti
es.
Try
ing
obvi
ous
“mot
ivat
iona
l” sh
ort-
term
ef
forts
Impl
emen
tatio
n of
qua
lity
impr
ovem
ent t
ools
& te
chni
ques
w
ith th
orou
gh u
nder
stand
ing.
Con
tinui
ng q
ualit
y im
prov
emen
t pro
gram
and
st
artin
g m
ake
certa
in.
Qua
lity
impr
ovem
ent i
s a
norm
al &
con
tinue
d ac
tivity
.
5Su
mm
atio
n of
C
ompa
ny P
ositi
on
“W
e do
not
kno
w w
hy
we
have
pro
blem
s with
qu
ality
.”
“It
is n
ot a
bsol
utel
y a
grea
t dea
l why
we
have
pr
oble
ms w
ith q
ualit
y.”
“Th
roug
h m
anag
emen
t un
ders
tand
ing
of q
ualit
y im
porta
nce,
we
are
tryin
g to
id
entif
y &
reso
lve
our
prob
lem
s.”
“D
efec
t pre
vent
ion
is a
ro
utin
e pa
rt of
ope
ratio
n.”
“W
e kn
ow w
hy w
e do
n’t h
ave
prob
lem
s w
ith q
ualit
y.”
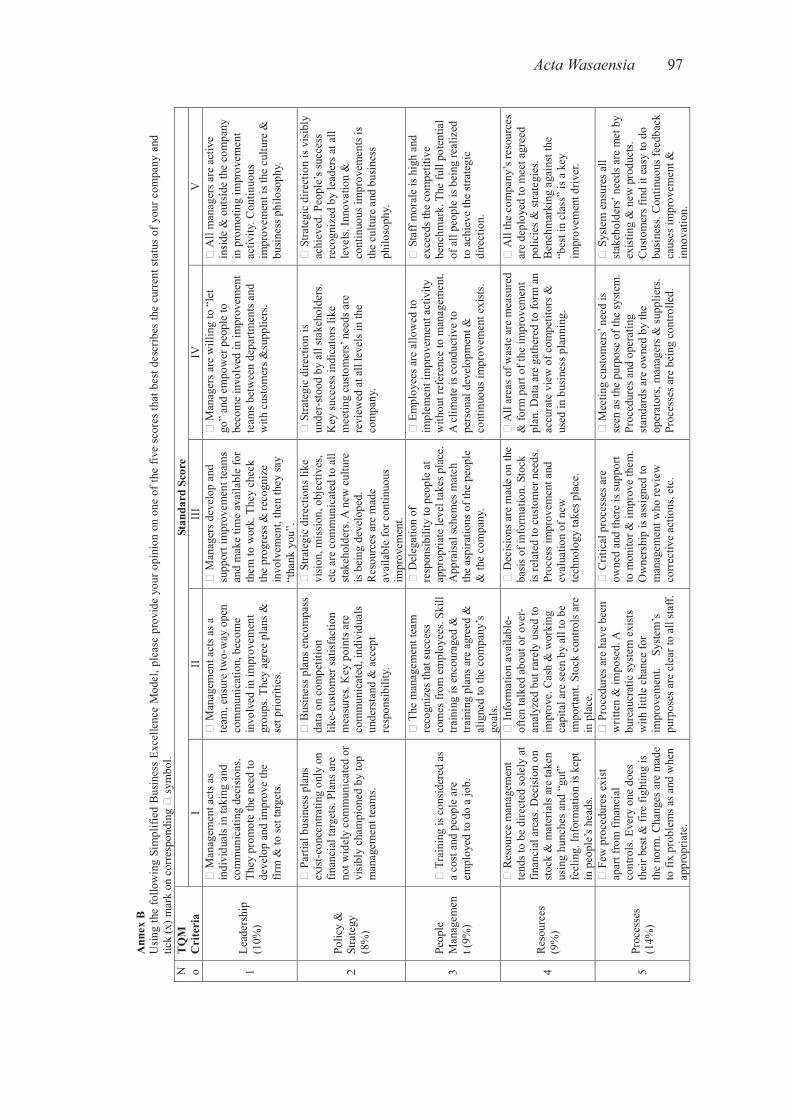
Acta Wasaensia 97
Ann
ex B
U
sing
the
follo
win
g Si
mpl
ified
Bus
ines
s Ex
celle
nce
Mod
el, p
leas
e pr
ovid
e yo
ur o
pini
on o
n on
e of
the
five
scor
es th
at b
est d
escr
ibes
the
curr
ent s
tatu
s of
you
r com
pany
and
tic
k (x
) mar
k on
cor
resp
ondi
ng
sym
bol.
N oT
QM
C
rite
ria
Stan
dard
Sco
reI
IIII
IIV
V
1Le
ader
ship
(1
0%)
Man
agem
ent a
cts a
s in
divi
dual
s in
taki
ng a
nd
com
mun
icat
ing
deci
sions
. Th
ey p
rom
ote
the
need
to
deve
lop
and
impr
ove
the
firm
& to
set t
arge
ts.
Man
agem
ent a
cts a
s a
team
, ens
ure
two-
way
ope
n co
mm
unic
atio
n, b
ecom
e in
volv
ed in
impr
ovem
ent
grou
ps. T
hey
agre
e pl
ans
&
set p
riorit
ies.
Man
ager
s dev
elop
and
su
ppor
t im
prov
emen
t tea
ms
and
mak
e tim
e av
aila
ble
for
them
to w
ork.
The
y ch
eck
the
prog
ress
& re
cogn
ize
invo
lvem
ent,
then
they
say
“tha
nk y
ou”.
Man
ager
s are
will
ing
to “
let
go”
and
empo
wer
peo
ple
to
beco
me
invo
lved
in im
prov
emen
t te
ams b
etw
een
depa
rtmen
ts a
nd
with
cus
tom
ers &
supp
liers
.
All
man
ager
s are
act
ive
insi
de &
out
side
the
com
pany
in
pro
mot
ing
impr
ovem
ent
activ
ity. C
ontin
uous
im
prov
emen
t is t
he c
ultu
re &
bu
sine
ss p
hilo
soph
y.
2Po
licy
&
Stra
tegy
(8
%)
Par
tial b
usin
ess p
lans
ex
ist-c
once
ntra
ting
only
on
finan
cial
targ
ets.
Plan
s are
no
t wid
ely
com
mun
icat
ed o
r vi
sibl
y ch
ampi
oned
by
top
man
agem
ent t
eam
s.
Bus
ines
s pla
ns e
ncom
pass
da
ta o
n co
mpe
titio
n lik
e-cu
stom
er sa
tisfa
ctio
n m
easu
res.
Key
poi
nts a
re
com
mun
icat
ed, i
ndiv
idua
ls
unde
rsta
nd &
acc
ept
resp
onsi
bilit
y.
Stra
tegi
c di
rect
ions
like
vi
sion
, mis
sion
, obj
ectiv
es,
etc
are
com
mun
icat
ed to
all
stak
ehol
ders
. A n
ew c
ultu
re
is b
eing
dev
elop
ed.
Res
ourc
es a
re m
ade
avai
labl
e fo
r con
tinuo
us
impr
ovem
ent.
Stra
tegi
c di
rect
ion
is
unde
r-sto
od b
y al
l sta
keho
lder
s. K
ey su
cces
s ind
icat
ors l
ike
mee
ting
cust
omer
s’ n
eeds
are
re
view
ed a
t all
leve
ls in
the
com
pany
.
Stra
tegi
c di
rect
ion
is v
isib
ly
achi
eved
. Peo
ple’
s suc
cess
re
cogn
ized
by
lead
ers a
t all
leve
ls. In
nova
tion
&
cont
inuo
us im
prov
emen
ts is
th
e cu
lture
and
bus
ines
s ph
iloso
phy.
3Pe
ople
Man
agem
ent (
9%)
Tra
inin
g is
con
side
red
as
a co
st a
nd p
eopl
e ar
e em
ploy
ed to
do
a jo
b.
The
man
agem
ent t
eam
re
cogn
izes
that
succ
ess
com
es fr
om e
mpl
oyee
s. Sk
ill
train
ing
is e
ncou
rage
d &
tra
inin
g pl
ans a
re a
gree
d &
al
igne
d to
the
com
pany
’s
goal
s.
Del
egat
ion
of
resp
onsi
bilit
y to
peo
ple
at
appr
opria
te le
vel t
akes
pla
ce.
App
raisa
l sch
emes
mat
ch
the
aspi
ratio
ns o
f the
peo
ple
& th
e co
mpa
ny.
Em
ploy
ees a
re a
llow
ed to
im
plem
ent i
mpr
ovem
ent a
ctiv
ity
with
out r
efer
ence
to m
anag
emen
t. A
clim
ate
is c
ondu
ctiv
e to
pe
rson
al d
evel
opm
ent &
co
ntin
uous
impr
ovem
ent e
xist
s.
Sta
ff m
oral
e is
high
and
ex
ceed
s the
com
petit
ive
benc
hmar
k. T
he fu
ll po
tent
ial
of a
ll pe
ople
is b
eing
real
ized
to
ach
ieve
the
stra
tegi
c di
rect
ion.
4R
esou
rces
(9
%)
Res
ourc
e m
anag
emen
tte
nds t
o be
dire
cted
sole
ly a
t fin
anci
al a
reas
. Dec
isio
n on
st
ock
& m
ater
ials
are
take
n us
ing
hunc
hes a
nd “
gut”
fe
elin
g. In
form
atio
n is
kep
t in
peo
ple’
s hea
ds.
Info
rmat
ion
avai
labl
e-of
ten
talk
ed a
bout
or o
ver-
anal
yzed
but
rare
ly u
sed
to
impr
ove.
Cas
h &
wor
king
ca
pita
l are
seen
by
all t
o be
im
porta
nt. S
tock
con
trols
are
in
pla
ce.
Dec
isio
ns a
re m
ade
on th
e ba
sis o
f inf
orm
atio
n. S
tock
is
rela
ted
to c
usto
mer
nee
ds.
Proc
ess i
mpr
ovem
ent a
nd
eval
uatio
n of
new
te
chno
logy
take
s pla
ce.
All
area
s of w
aste
are
mea
sure
d &
form
par
t of t
he im
prov
emen
t pl
an. D
ata
are
gath
ered
to fo
rm a
n ac
cura
te v
iew
of c
ompe
titor
s &
us
ed in
bus
ines
s pla
nnin
g.
All
the
com
pany
’s re
sour
ces
are
depl
oyed
to m
eet a
gree
d po
licie
s & st
rate
gies
. B
ench
mar
king
aga
inst
the
“bes
t in
clas
s” is
a k
ey
impr
ovem
ent d
river
.
5Pr
oces
ses
(14%
)
Few
pro
cedu
res e
xist
ap
art f
rom
fina
ncia
l co
ntro
ls. E
very
one
doe
s th
eir b
est &
fire
figh
ting
is
the
norm
. Cha
nges
are
mad
e to
fix
prob
lem
s as a
nd w
hen
appr
opria
te.
Pro
cedu
res a
re h
ave
been
w
ritte
n &
impo
sed.
A
bure
aucr
atic
sys
tem
exi
sts
with
littl
e ch
ance
for
impr
ovem
ent.
Sys
tem
’s
purp
oses
are
cle
ar to
all
staf
f.
Crit
ical
pro
cess
es a
re
owne
d an
d th
ere
is su
ppor
t to
mon
itor &
impr
ove
them
. O
wne
rshi
p is
assi
gned
to
man
agem
ent w
ho re
view
co
rrec
tive
actio
ns, e
tc.
Mee
ting
cust
omer
s’ n
eed
is
seen
as t
he p
urpo
se o
f the
syste
m.
Proc
edur
es a
nd o
pera
ting
stan
dard
s are
ow
ned
by th
e op
erat
ors,
man
ager
s & su
pplie
rs.
Proc
esse
s are
bei
ng c
ontro
lled.
Sys
tem
ens
ures
all
stak
ehol
ders
’ nee
ds a
re m
et b
y ex
istin
g &
new
pro
duct
s. C
usto
mer
s fin
d it
easy
to d
o bu
sine
ss. C
ontin
uous
feed
back
ca
uses
impr
ovem
ent &
in
nova
tion.
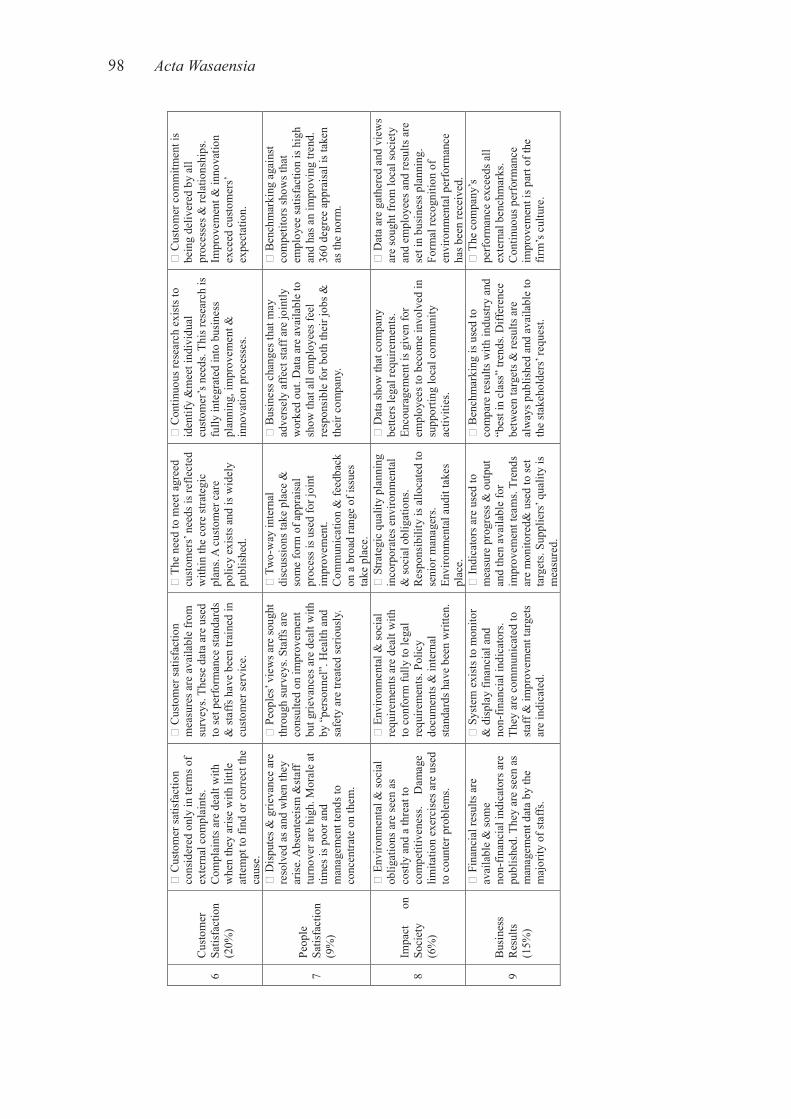
98 Acta Wasaensia
6C
usto
mer
Sa
tisfa
ctio
n(2
0%)
Cus
tom
er sa
tisfa
ctio
n co
nsid
ered
onl
y in
term
s of
exte
rnal
com
plai
nts.
Com
plai
nts a
re d
ealt
with
w
hen
they
aris
e w
ith li
ttle
atte
mpt
to fi
nd o
r cor
rect
the
caus
e.
Cus
tom
er sa
tisfa
ctio
n m
easu
res a
re a
vaila
ble
from
su
rvey
s. Th
ese
data
are
use
d to
set p
erfo
rman
ce st
anda
rds
& st
affs
hav
e be
en tr
aine
d in
cu
stom
er se
rvic
e.
The
nee
d to
mee
t agr
eed
cust
omer
s’ n
eeds
is re
flect
ed
with
in th
e co
re st
rate
gic
plan
s. A
cust
omer
car
e po
licy
exis
ts a
nd is
wid
ely
publ
ishe
d.
Con
tinuo
us re
sear
ch e
xist
s to
iden
tify
&m
eet i
ndiv
idua
l cu
stom
er’s
need
s. Th
is re
sear
ch is
fu
lly in
tegr
ated
into
bus
ines
s pl
anni
ng, i
mpr
ovem
ent &
in
nova
tion
proc
esse
s.
Cus
tom
er c
omm
itmen
t is
bein
g de
liver
ed b
y al
l pr
oces
ses &
rela
tions
hips
. Im
prov
emen
t & in
nova
tion
exce
ed c
usto
mer
s’
expe
ctat
ion.
7Pe
ople
Satis
fact
ion
(9%
)
Dis
pute
s & g
rieva
nce
are
reso
lved
as a
nd w
hen
they
ar
ise.
Abs
ente
eism
&st
aff
turn
over
are
hig
h. M
oral
e at
tim
es is
poo
r and
m
anag
emen
t ten
ds to
co
ncen
trate
on
them
.
Peo
ples
’ vie
ws a
re so
ught
th
roug
h su
rvey
s. St
affs
are
co
nsul
ted
on im
prov
emen
t bu
t grie
vanc
es a
re d
ealt
with
by
“pe
rson
nel”
. Hea
lth a
nd
safe
ty a
re tr
eate
d se
rious
ly.
Tw
o-w
ay in
tern
al
disc
ussi
ons t
ake
plac
e &
so
me
form
of a
ppra
isal
pr
oces
s is u
sed
for j
oint
im
prov
emen
t. C
omm
unic
atio
n &
feed
back
on
a b
road
rang
e of
issu
es
take
pla
ce.
Bus
ines
s cha
nges
that
may
ad
vers
ely
affe
ct st
aff a
re jo
intly
w
orke
d ou
t. D
ata
are
avai
labl
e to
sh
ow th
at a
ll em
ploy
ees f
eel
resp
onsi
ble
for b
oth
thei
r job
s &
thei
r com
pany
.
Ben
chm
arki
ng a
gain
st co
mpe
titor
s sho
ws t
hat
empl
oyee
satis
fact
ion
is h
igh
and
has a
n im
prov
ing
trend
. 36
0 de
gree
app
rais
al is
take
n as
the
norm
.
8Im
pact
on
So
ciet
y(6
%)
Env
ironm
enta
l & so
cial
ob
ligat
ions
are
seen
as
cost
ly a
nd a
thre
at to
co
mpe
titiv
enes
s. D
amag
e lim
itatio
n ex
erci
ses a
re u
sed
to c
ount
er p
robl
ems.
Env
ironm
enta
l & so
cial
re
quire
men
ts a
re d
ealt
with
to
con
form
fully
to le
gal
requ
irem
ents
. Pol
icy
docu
men
ts &
inte
rnal
sta
ndar
ds h
ave
been
writ
ten.
Stra
tegi
c qu
ality
pla
nnin
g in
corp
orat
es e
nviro
nmen
tal
& so
cial
obl
igat
ions
. R
espo
nsib
ility
is a
lloca
ted
to
seni
or m
anag
ers.
Envi
ronm
enta
l aud
it ta
kes
plac
e.
Dat
a sh
ow th
at c
ompa
ny
bette
rs le
gal r
equi
rem
ents
. En
cour
agem
ent i
s giv
en fo
r em
ploy
ees t
o be
com
e in
volv
ed in
su
ppor
ting
loca
l com
mun
ity
activ
ities
.
Dat
a ar
e ga
ther
ed a
nd v
iew
s ar
e so
ught
from
loca
l soc
iety
an
d em
ploy
ees a
nd re
sults
are
se
t in
busi
ness
pla
nnin
g.
Form
al re
cogn
ition
of
envi
ronm
enta
l per
form
ance
ha
s bee
n re
ceiv
ed.
9B
usin
ess
Res
ults
(15%
)
Fin
anci
al re
sults
are
av
aila
ble
& so
me
non-
finan
cial
indi
cato
rs a
re
publ
ishe
d. T
hey
are
seen
as
man
agem
ent d
ata
by th
e m
ajor
ity o
f sta
ffs.
Sys
tem
exi
sts t
o m
onito
r &
dis
play
fina
ncia
l and
no
n-fin
anci
al in
dica
tors
. Th
ey a
re c
omm
unic
ated
to
staff
& im
prov
emen
t tar
gets
are
indi
cate
d.
Indi
cato
rs a
re u
sed
to
mea
sure
pro
gres
s &
out
put
and
then
ava
ilabl
e fo
r im
prov
emen
t tea
ms.
Tren
ds
are
mon
itore
d& u
sed
to se
t ta
rget
s. Su
pplie
rs’ q
ualit
y is
m
easu
red.
Ben
chm
arki
ng is
use
d to
co
mpa
re re
sults
with
indu
stry
and
“b
est i
n cl
ass”
tren
ds. D
iffer
ence
be
twee
n ta
rget
s & re
sults
are
al
way
s pub
lishe
d an
d av
aila
ble
to
the
stak
ehol
ders
’ req
uest
.
The
com
pany
’s
perf
orm
ance
exc
eeds
all
exte
rnal
ben
chm
arks
. C
ontin
uous
per
form
ance
im
prov
emen
t is p
art o
f the
fir
m’s
cul
ture
.
Acta Wasaensia 99
Int. J. Productivity and Quality Management, Vol. X, No. Y, xxxx 1
Copyright © 200x Inderscience Enterprises Ltd.
Considering BPR and CE for faster product delivery: a case study in manufacturing firms
Alemu Moges Belay* Department of Production Technology, University of Vaasa, P.O. Box 700, FI-65101, Vaasa, Finland E-mail: [email protected] andDepartment of Design Engineering and Materials, Norwegian University of Science and Technology, Richard Birkelands vei 2b, P.O. Box 7491, Trondheim, Norway E-mail: [email protected] *Corresponding author
Petri Helo and Josu Takala Department of Production Technology, University of Vaasa, P.O. Box 700, FI-65101, Vaasa, Finland E-mail: [email protected] E-mail: [email protected]
Torgeir Welo Department of Design Engineering and Materials, Norwegian University of Science and Technology, Richard Birkelands vei 2b, P.O. Box 7491, Trondheim, Norway E-mail: [email protected]
Abstract: This paper investigates the effects of combining business process reengineering (BPR) and concurrent engineering (CE) on companies’ capability to deliver products faster to the customers. Two medium-sized companies are considered to use primary data; previous performance records and on-site interviews. The study uses tools for business process improvement, ternary plot and statistical process control tools. The study showed that 50% to 80% of the products were not delivered to customers on schedule, mainly due to the case companies who were using sequential product development methods. By using cross-functional teams, and combining BPR and CE, the work-flow steps and product development times are reduced significantly. A conceptual model is proposed to show the benefits of combining the aforementioned methodology, which is in line with contingency theory.
100 Acta Wasaensia
2 A.M. Belay et al.
Keywords: business process reengineering; BPR; concurrent engineering; CE; process mapping; ternary plot; gage measurement system capability; decision making.
Reference to this paper should be made as follows: Belay, A.M., Helo, P., Takala, J. and Welo, T. (xxxx) ‘Considering BPR and CE for faster product delivery: a case study in manufacturing firms’, Int. J. Productivity and Quality Management, Vol. X, No. Y, pp.000–000.
Biographical notes: Alemu Moges Belay is a PhD student/researcher at the University of Vaasa and NTNU, Finland and Norway. He has industrial experiences and published peer reviewed international journals and conferences proceedings. He reviewed several peer reviewed international journals and conference papers. He is an exchange researcher at Norwegian University of Science and Technology (NTNU). His research areas cover concurrent engineering, lean product development, system dynamics and product life cycle, decision making, performance measurement, statistical process control, technology management, sustainable development, manufacturing and service engineering.
Petri Helo is a Research Professor at the Department of Production, University of Vaasa. His research interest covers: management of logistics processes in supply demand networks, which take place in electronics, machine building and food industries, production management, reverse logistics, production management, system dynamics, and software development and simulation. He edited and published several peer-reviewed international journals and conferences proceedings. He has been involved to EU projects.
Josu Takala is a Professor of Industrial Management (IM) and has been a Research Professor at University of Vaasa and Academy of Finland. He recently is conducting a research on global manufacturing strategies. He graduated at Tampere University of Technology in Dr.Tech, worked in ABB (R&D and QA in Automation), Adjunct Professor of IM in several universities (Aalto, Jyväskylä Oulu and National Defence) in Finland, and a Visiting Professor in Slovakia, Thailand, Malaysia and China. He worked for several scientific forums and global businesses. He has been Chairman of international society productivity and quality research and published about 500 scientific articles and some books.
Torgeir Welo is a Professor of Design and Manufacturing at Norwegian University of Science and Technology. He worked in sintef production engineering, materials technology, and hydro-automotive structures in the USA and EU. His research interests include lean product development, metal forming – bending of aluminum profiles. He was heading and coaching product development teams developing light weight solutions in the automotive industry, e.g., aluminium space frames, sub-frames, cockpit frames, engine cradles, seat frames, seat tracks, bump and front end structures; crush cans, etc. for European and US car models and platforms. He has published several peer-reviewed international journals and conferences proceedings.
Acta Wasaensia 101
Considering BPR and CE for faster product delivery 3
1 Introduction
Swink et al. (2006) studied faster, better, cheaper approach of NPD project efficiency and performance tradeoffs and found out the importance of project management, balanced management commitment, and cross-functional integration in achieving high levels of NPD project efficiency. Singholi et al. (2012) also insight that industries throughout the world are under great pressure to manufacture customised product with delivery on time along with required quality and competitive cost. Therefore, to sustain in the global scenario, the focus is to develop a manufacturing system that can fulfil the demand of market within due dates, and it should be flexible to handle different situations. Also, due to globalisation of markets, the technological advances and the changing needs and demands of consumers have forced the nature of competitive paradigms to change continuously (Singh et al., 2010). According to Singh and Ahuja (2012) competitiveness of a firm refers to management of capabilities to use wisely its resources, competencies and knowledge, and also manage the change with the overall objectives of adapting better and faster than competition. Obviously, superior manufacturing performance of a firm leads to competitiveness. Enormous efforts have been done to enhance manufacturing performance in different aspects. Consequently, different approaches and proposals have been made to reduce the life cycle, reduce delivery time, and improve the cost. BPR and concurrent engineering are the two among others improvement methods.
Goksoy and Ozsoy (2012), Fithri and Yahaya (2011), Hammer (1990), Davenport and Short (1990) studied organisations which used business process reengineering (BPR) to seek improvements in their business performance. Several researchers (e.g., Davenport, 1993; Hammer and Champy, 1993) have defined BPR as: the fundamental rethinking and radical redesign of business processes to achieve significant improvements in cost, quality, services and speed. Laakso (1997) adds to the main definition, the necessary resources needed, and stating that the link between competence and business process is inseparable. The targets of BPR are based on the strategic capabilities which are characterised as (Treacy and Wiersema, 1993) customer focused, product service leader and superiority in operations, which is linked to cost efficiency and lead time of business processes, as well as better R&D compared to competitors. However, whether we consider as strategic or operational level it needs proper analysis and measurement. According to Ahsan and Marufuzzaman (2012) measuring the success of a new product is an important issue by which the prospect of the organisation can be predicted.
According to Kleiner (2000), Grover and Kettinger (2000), regardless of its positive outcomes, BPR has been failed in some projects. There have also been some critical comments concerning BPR. For example, Stoddard et al. (1996) criticise, “what was implemented in the regions differed from the design and was not as radical as planned”. Tikkanen (1998) state that the discussion related to BPR efforts and the processes organisation is still at a quite premature stage. Tikkanen (1998) also suggested that the major concepts and methodology related to process improvement need to be further developed and refined. Tennant and Wu (2005) indicate that the main triggers for initiating BPR are competitive pressure, intense need to reduce costs and lead time, acquisitions, and managing change. Moreover, it is also discussed about the organisational benefits and the returns on the implementation of BPR. The other management philosophy, CE, takes into consideration factors that are related to shortening product life cycle, improving cost and quality. BPR also seeks to achieve these objectives (improving cost, quality, and lead time) but also including other benefits
102 Acta Wasaensia
4 A.M. Belay et al.
discussed by Yahaya et al. (2012) in their research of an enhanced workflow reengineering methodology for SMEs. This paper will attempt to figure out some of the overlapping benefits from the improved effort of combining BPR and CE. Our theoretical foundation relies on contingency theory which states that, there is no one single best solution for every organisation while managing the complex product development process.
The motivation of this paper is to investigate some of the product performance improvement methods (e.g., BPR and CE, and related efforts) and see the combined effects of BPR and CE. In addition, apply some practical process improvement tools for the betterment and comparison of the case company’s performance. Nagarajan et al. (2012) supports similar idea from knowledge management perspective and showed that organisations realised that their products and services are manifestations of collective knowledge which drives all other competencies and capabilities.
The study considers previous BPR efforts of two medium sized manufacturing firms as an input and trigger with the benefits from CE so that the firms could obtain better business performances (e.g., faster product delivery) from these two well-known business management approaches. This study provides practical evidence for the better outcomes of combining BPR and CE which was theoretically discussed in limited researches.
2 Literature
According to Chen (2010) new product development (NPD) speed is a key component of time-based strategy and it has become increasingly important for management of innovation in organisations. This is due to continuous reduction in the product life cycle time and increase in competition. Although the reason for success and failure rates of NPD is debatable and vary from project to project, Cooper and Edgett (2003) showed that the success rate of NPD projects is about 60%. However, companies and researchers still strive to improve methods and practices to enhance product performance and stay competitive in the dynamic global market. There are three distinct goals of improving process management in product development processes. These are companies’ interest to have shorter NPD times, superior products, and efficient developments. However, achieving these objectives is not easy as it requires careful analysis and implementation of new process improvement methods, reorganisation of all stakeholders who are involved in the process, and critical decision making. For instance, one of the mostly advised methods is the transformation from doing product development activities sequentially to parallel, which is known as concurrent engineering. According to Abdalla (1999), a key step towards implementing CE is effective cross-functional teams, which integrate the development process using both organisational and information management methods. This idea was supported by Koufteros et al. (2001) while pointing out the three basic elements of CE; concurrent workflow, early involvement of all participants, and groups contributing to product development and team work. Hartley (1992) also referred to CE as early involvement of a cross-functional team to simultaneously plan the product, process and manufacturing activities.
Another well-known improvement method that we want to discuss in this research is BPR. BPR has been studied by several researchers and been implemented in several companies for the last few decades with its success and failure. Recently, Goksoy and Ozsoy (2012) studied BPR as a strategic tool for managing organisational change by
Acta Wasaensia 103
Considering BPR and CE for faster product delivery 5
improving performances, enhance efficiencies and gain a competitive advantage. According to Fithri and Yahaya (2012) BPR is not just for improving business processes, but it is more than that and can improve the operations of the whole business process. Ozcelik (2010, 2008) argues that BPR is a process improvement method that improves firms’ performance by analysing a comprehensive data set, and many organisations obtained benefits from this method. Browning (2010) highlighted in large and complex projects, managers cannot see the entire territory between project start and completion, and hence, they must rely on process models or maps to support planning and decisions. Bowling et al. (2012) took initiative to develop a mapping methodology on system-of-systems level to maximise the individual capabilities in such a way that maximise the capability of the system as a whole.
Nonetheless, regardless of several successful projects (e.g., CIGNA Corporation that obtained savings of $100 million), research showed many unsuccessful projects that did not meet the expectations from BPR (Kleiner, 2000; Grover and Kettinger, 2000). Such failure could be attributed to several factors. According to Ozcelik (2010), functionally focused BPR projects showed a more positive relationship with firm performance than cross-functional ones. In our study, we would like to fill this research gap by combining CE that follows cross-functional approach to that of BPR to improve product development performance and measure with structured process measurement tools.
Process measurement is one of the key governance activities in BPR and CE. Morgan (2004) described how to define and select performance measures, and Korherr and List (2007) considered integration of performance measurement to business process modelling languages. There are many performance measurement techniques, including balanced score card (BSC), AHP data envelopment analysis (DEA), etc. Some researchers used a combination of two approaches: Sharma and Bhagwat (2007) used BSC and AHP, and Frei and Harker (1999) use DEA and AHP techniques for measuring aggregate process performance used for comparing the efficiency of different organisations. The use of performance measures for business process, in practice, is generally targeted for a single criterion such as the mean completion time of a process which may not reflect the process’s overall contribution. Vincent (2009) suggested evaluation of a business process with more than one measurement, stressing what to measure while comparing performances of the old and new process. Since the 1920s at which Shewhart proposed the idea of control charts, many industries in the USA and Japan used different control charts to monitor and control their processes. A vast amount of literature shows various applications of control charts: Chinna et al. (2000), Koshy and Koshy (2004), Sulek (2004), and Scordaki and Psarakis (2005). According to Wheeler and Chambers (1992), usually, minimum 20 data points are required to calculate valuable and reliable control limits.
Bataineh and Al-Dwairi (2009) claim that quality control and improvement at the process level is a vital activity to obtain quality products and services. They also used different statistical process control methods, such as process capability indices X-bar, and exponentially weighted moving average. Another by Prajapati and Singh (2012) used control charts for monitoring the auto-correlated process parameters. Even though there are several approaches for process improvement, change can be perceived by combining different methods and using in an integrated way. For example, Davenport and Stoddard (1994) show that firms may customise their approach to organisational change, combining tools from BPR and TQM while considering quality and reengineering activities. For example, Sharma (2009) merged diverse tools, like, value engineering and
104 Acta Wasaensia
6 A.M. Belay et al.
target costing in to QFD framework with the aim of facilitating cross-functional PDD, integrating both organisational and functional aspects of the development process to maximise value creation. Bhamu et al. (2012) argue that value stream mapping (VSM) is one of the most important tools to identify and reduce all type of wastes in a systematic way and tried to show the effect of VSM on cost of poor quality, lead time, etc. Hilletofth and Eriksson (2011) demonstrated how NPD is related to supply chain management, why these are coordinated and how it should be done. More recently, Perols et al. (2012) made an investigation on the relationship between supplier integration and time-to-market. Caputo and Pelagagge (2008) discussed the effects of product design on assembly lines performances using CE. Bovey (1994) show that BPR in a CE environment covers all dimensions of product performance and involve all stakeholders such as technology, experts and decision-makers from all a business’s functional groups. However, very limited empirical and case studies are carried out on the combining these improvement methods and even the previous studies are mainly focusing on conceptualisation. Hence, this research would serve as practical evidence from methodological perspective and use as an approach for product performance enhancement in manufacturing firms.
3 Case description, purpose and research methodology
3.1 Case description and purpose of the study
AEC and DA are medium sized manufacturing companies which are partly-owned by government. These companies manufacture different types of products and provide services to customers. The customers are different private and public institutions, governmental organisations, such as, air-force and military, tools and spare-parts manufacturers, mechanical assembly firms, etc.
Although the case companies have some strength in some aspects (e.g., have experienced and well trained personnel and good facilities), they could not keep product delivery time. The company assessment before BPR implementation showed that the number of complaints due to late delivery increased from time to time (with an average up to 20%). This was mainly due to the expansion programme of the companies and the increment of customers in number. Especially, air force and military firms complain the most and found to be time sensitive due to their critical missions and this was registered in five years customer complaints record as we observed at the beginning of the study. Having this in mind, the management decided to consider and implement one of the improvement methods (BPR) to satisfy customers at the most (minimise the number of complaints), keep their competitiveness and improve product performance.
Although the management observed some improvement in limited aspect of the development processes (e.g., cost and time reduction by sequencing and scheduling), the change and the solution were not as quick as expected and still costumer complaints did not decline as the management expected. Indeed, BPR needs longer time for completion and require additional capital, which in turn could be another challenge for the case company. So, looking for another approach which is relatively faster and can improve the delivery time was imminent. CE is one method in time-based strategy that has some common objectives with BPR to improve time, cost and quality. Besides to that, from our on-site interview and visit, we observed that the product development process of the case
Acta Wasaensia 105
Considering BPR and CE for faster product delivery 7
companies lack structured methodology and process measurement tools (except using in few areas, such as, human resource and administration).
The purpose of the study is to investigate the effects of combining BPR and CE and propose possible solutions to assess the product development process performance. Some of process improvement and assessment methods such as, ternary plot, repeatability and reproducibility (R&R), process map, etc., are also introduced and applied in this research.
3.2 Research methodology
This research considers previous efforts of product development and improvement methods in the case company. It begins by studying performance records and identifying the major problems. Different methods are employed starting from the identification of the root causes to the proposed solution of combining BPR and CE engineering. Some of the methods used are:
a Pareto and Ishikawa diagram: To find out the root causes of delay on the business processes, particularly the causes of product delivery delay. Pareto analysis, which is a statistical technique used in decision-making to identify the vital few from trivial many, is used following the result of interviews and historical records.
b Ternary plot and process map: All activities involved in the processes, responsibilities, completion time and the final impact has been performed to see the ultimate process improvements. Ternary plot is used to determine which firm produce which products based on their competencies in cost, time and quality.
c Gauge and measurement system capability: to measure the level of process performance improvement of the case companies based on BPR and CE implementation, analysing R&R.
In this research, we used a mixed strategy (quantitative and qualitative research methods). Morgan (1998) and Sale et al. (2002) have studied the practical and strategic advantages of combining these two approaches and Johnson and Onwuegbuzie (2004), and Bryman (2008) a presented the strength and weaknesses of all approaches. Some of the practical methods used to obtain relevant information can be categorised in to two:
• observation, meetings, work practices, semi-structured interviews with key personnel in the case companies involved, collect semi-quantitative data from project participants
• quantitative data analysis using statistical process control tools, e.g., R&R, Ternary plot, process map, Pareto are used.
In general the research considers process map to trace all main activities involved in relation to product development process and identify the root causes of product delivery delay using fishbone and Pareto diagram and then farther discuss and apply the quantitative section.
106 Acta Wasaensia
8 A.M. Belay et al.
4 Important considerations in combining BPR and CE
In this section, we would like to discuss some of vital considerations in our study and followed by key definitions of some terms. The study by Brookes and Backhouse (1997) showed three views of CE: tactical, strategic and objective. When CE is viewed at a tactical level it contains a series of tools and techniques; the strategic level focuses on the parallel consideration of all aspects of the development process; the objectives view emphasises on the whole product introduction process to improve the overall business performance which is similar to BPR (Mäkinen, 2011).
BPR and CE are management philosophies that are used to bring about change, revitalising companies to make them more competitive. CE and BPR can be effective in improving the performance of a company, particularly those who rely on time and responsiveness (Brooks, 1996). Some literature extends also to quality issues, for example (James, 1995) shows BPR and TQM as mutually exclusive; however, when performed concurrently they may complement one another and TQM can be used as a tool to solve problems encountered during BPR implementation and to continuously improve the process. Huang and Mak (1998) showed the challenge of transforming product development process from serial to CE environment. They also propose two of the transformation approaches, namely BPR and design for X (DFX) in relation to CE objectives.
4.1 Key definition of BPR and CE
BPR: Each key word, fundamental, radical and dramatic has special meaning according to Hammer and Champy (1993):
• Fundamental refers to basic questions to be asked, such as ‘Why do we do what we do?’ and ‘Why do we do it the way we do?’
• Radical means, to disregard existing structures, policies, and procedures and to invent new ways of doing work.
• Dramatic means, neither marginal nor incremental improvement, quantum leaps in performance replacing the old with something new.
Concurrent engineering as defined by Winner et al. (1988) is a systematic approach to the integrated, concurrent design of products and their related processes, including manufacture and support. In other words, CE encompasses team work, company competitiveness, communication, commitment, culture, customer satisfaction, and early attention to manufacturing, test and support issues.
4.2 The promoting and constraining forces of BPR
The reengineering gurus Hammer and Champy (1993) discussed that only 30% of the reengineering projects were successful. To be successful, this may require top-down leadership that facilitates reengineering change; and a bottom-up quality management improvement-driven process to see real sustainable, bottom-line results. Hammer and Stanton (1995) indicated the top ten ways to fail at BPR: for example, do not engineer but say that you are, do not focus on processes, ignore people, spend a lot of time analysing,
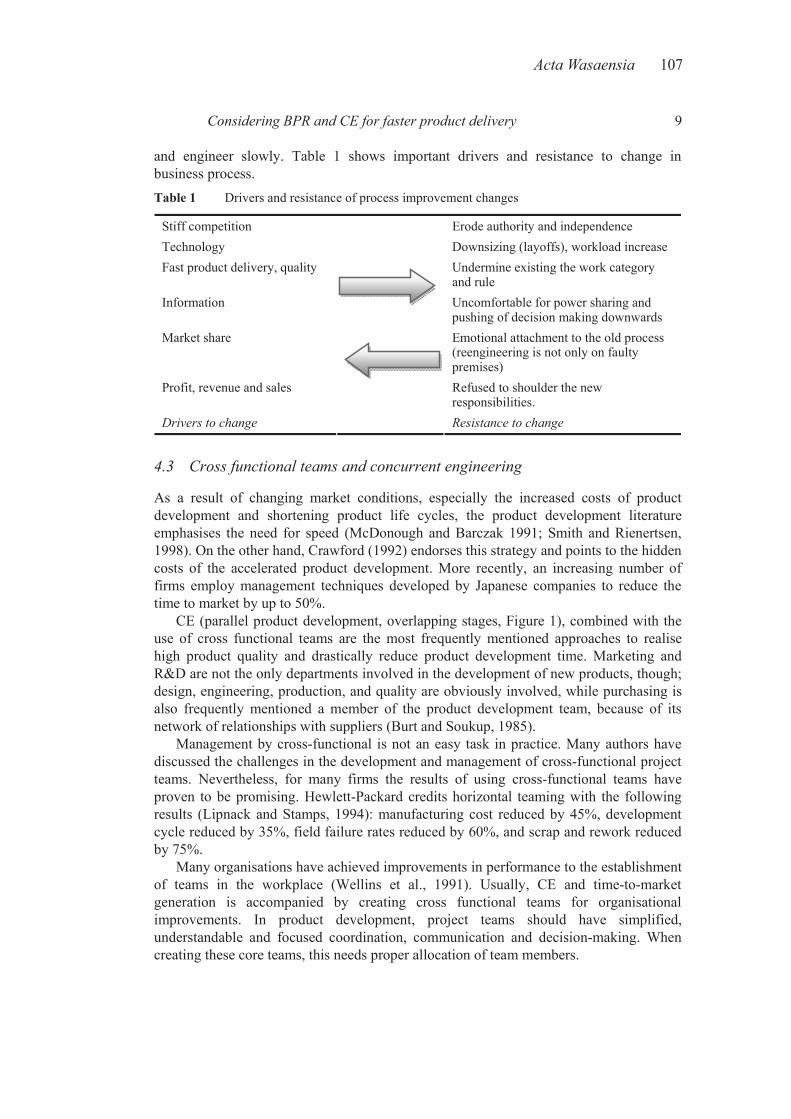
Acta Wasaensia 107
Considering BPR and CE for faster product delivery 9
and engineer slowly. Table 1 shows important drivers and resistance to change in business process. Table 1 Drivers and resistance of process improvement changes
Stiff competition Erode authority and independence Technology Downsizing (layoffs), workload increase Fast product delivery, quality Undermine existing the work category
and rule Information Uncomfortable for power sharing and
pushing of decision making downwards Market share Emotional attachment to the old process
(reengineering is not only on faulty premises)
Profit, revenue and sales Refused to shoulder the new responsibilities.
Drivers to change Resistance to change
4.3 Cross functional teams and concurrent engineering
As a result of changing market conditions, especially the increased costs of product development and shortening product life cycles, the product development literature emphasises the need for speed (McDonough and Barczak 1991; Smith and Rienertsen, 1998). On the other hand, Crawford (1992) endorses this strategy and points to the hidden costs of the accelerated product development. More recently, an increasing number of firms employ management techniques developed by Japanese companies to reduce the time to market by up to 50%.
CE (parallel product development, overlapping stages, Figure 1), combined with the use of cross functional teams are the most frequently mentioned approaches to realise high product quality and drastically reduce product development time. Marketing and R&D are not the only departments involved in the development of new products, though; design, engineering, production, and quality are obviously involved, while purchasing is also frequently mentioned a member of the product development team, because of its network of relationships with suppliers (Burt and Soukup, 1985).
Management by cross-functional is not an easy task in practice. Many authors have discussed the challenges in the development and management of cross-functional project teams. Nevertheless, for many firms the results of using cross-functional teams have proven to be promising. Hewlett-Packard credits horizontal teaming with the following results (Lipnack and Stamps, 1994): manufacturing cost reduced by 45%, development cycle reduced by 35%, field failure rates reduced by 60%, and scrap and rework reduced by 75%.
Many organisations have achieved improvements in performance to the establishment of teams in the workplace (Wellins et al., 1991). Usually, CE and time-to-market generation is accompanied by creating cross functional teams for organisational improvements. In product development, project teams should have simplified, understandable and focused coordination, communication and decision-making. When creating these core teams, this needs proper allocation of team members.
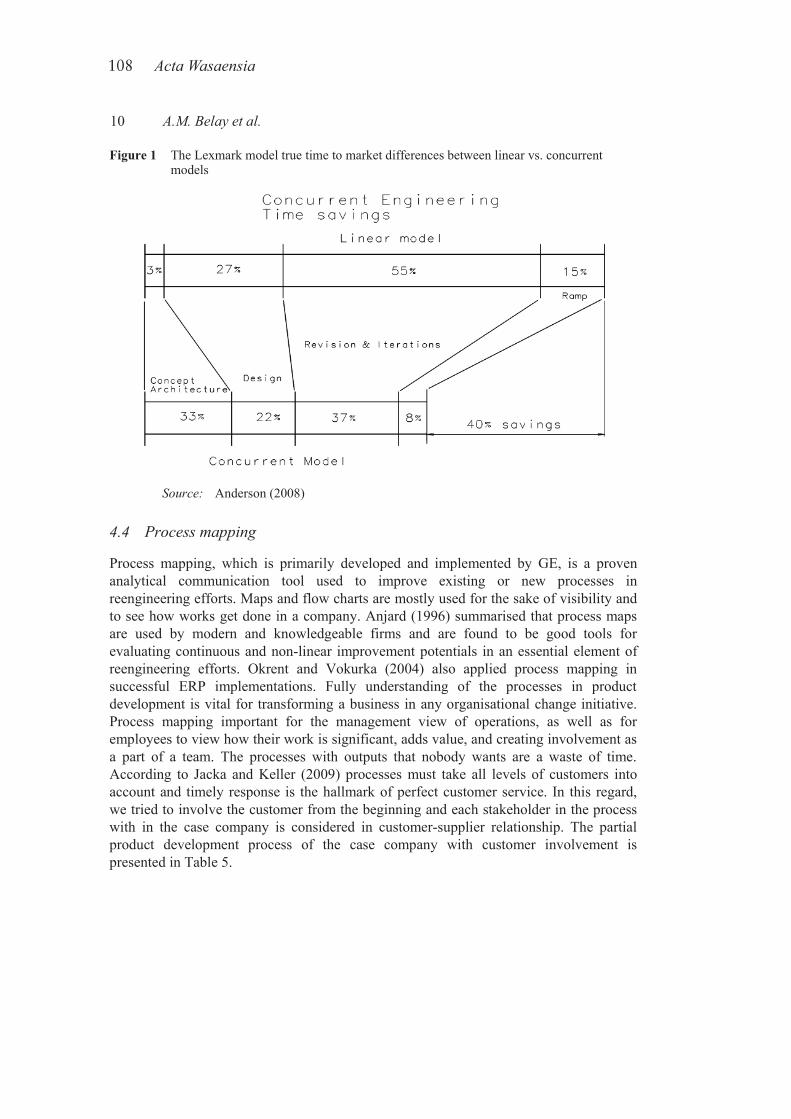
108 Acta Wasaensia
10 A.M. Belay et al.
Figure 1 The Lexmark model true time to market differences between linear vs. concurrent models
Source: Anderson (2008)
4.4 Process mapping
Process mapping, which is primarily developed and implemented by GE, is a proven analytical communication tool used to improve existing or new processes in reengineering efforts. Maps and flow charts are mostly used for the sake of visibility and to see how works get done in a company. Anjard (1996) summarised that process maps are used by modern and knowledgeable firms and are found to be good tools for evaluating continuous and non-linear improvement potentials in an essential element of reengineering efforts. Okrent and Vokurka (2004) also applied process mapping in successful ERP implementations. Fully understanding of the processes in product development is vital for transforming a business in any organisational change initiative. Process mapping important for the management view of operations, as well as for employees to view how their work is significant, adds value, and creating involvement as a part of a team. The processes with outputs that nobody wants are a waste of time. According to Jacka and Keller (2009) processes must take all levels of customers into account and timely response is the hallmark of perfect customer service. In this regard, we tried to involve the customer from the beginning and each stakeholder in the process with in the case company is considered in customer-supplier relationship. The partial product development process of the case company with customer involvement is presented in Table 5.
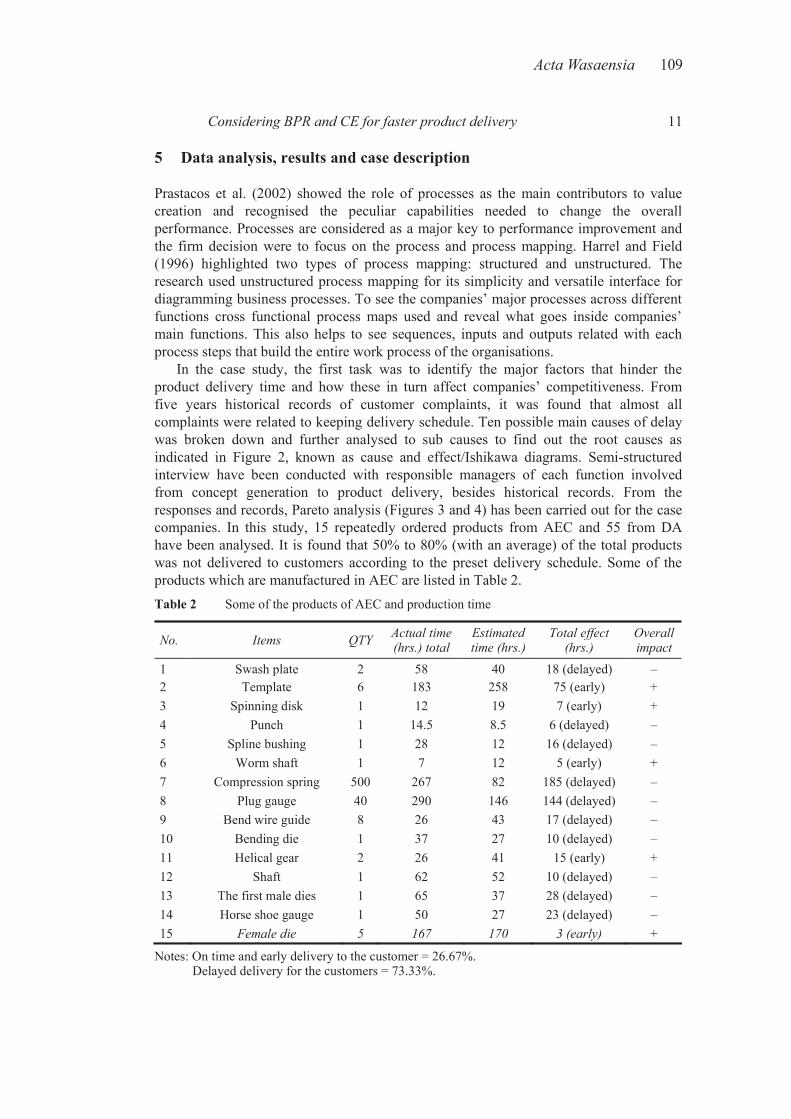
Acta Wasaensia 109
Considering BPR and CE for faster product delivery 11
5 Data analysis, results and case description
Prastacos et al. (2002) showed the role of processes as the main contributors to value creation and recognised the peculiar capabilities needed to change the overall performance. Processes are considered as a major key to performance improvement and the firm decision were to focus on the process and process mapping. Harrel and Field (1996) highlighted two types of process mapping: structured and unstructured. The research used unstructured process mapping for its simplicity and versatile interface for diagramming business processes. To see the companies’ major processes across different functions cross functional process maps used and reveal what goes inside companies’ main functions. This also helps to see sequences, inputs and outputs related with each process steps that build the entire work process of the organisations.
In the case study, the first task was to identify the major factors that hinder the product delivery time and how these in turn affect companies’ competitiveness. From five years historical records of customer complaints, it was found that almost all complaints were related to keeping delivery schedule. Ten possible main causes of delay was broken down and further analysed to sub causes to find out the root causes as indicated in Figure 2, known as cause and effect/Ishikawa diagrams. Semi-structured interview have been conducted with responsible managers of each function involved from concept generation to product delivery, besides historical records. From the responses and records, Pareto analysis (Figures 3 and 4) has been carried out for the case companies. In this study, 15 repeatedly ordered products from AEC and 55 from DA have been analysed. It is found that 50% to 80% (with an average) of the total products was not delivered to customers according to the preset delivery schedule. Some of the products which are manufactured in AEC are listed in Table 2. Table 2 Some of the products of AEC and production time
No. Items QTY Actual time (hrs.) total
Estimated time (hrs.)
Total effect (hrs.)
Overall impact
1 Swash plate 2 58 40 18 (delayed) –2 Template 6 183 258 75 (early) +3 Spinning disk 1 12 19 7 (early) +4 Punch 1 14.5 8.5 6 (delayed) –5 Spline bushing 1 28 12 16 (delayed) –6 Worm shaft 1 7 12 5 (early) +7 Compression spring 500 267 82 185 (delayed) –8 Plug gauge 40 290 146 144 (delayed) –9 Bend wire guide 8 26 43 17 (delayed) –10 Bending die 1 37 27 10 (delayed) –11 Helical gear 2 26 41 15 (early) +12 Shaft 1 62 52 10 (delayed) –13 The first male dies 1 65 37 28 (delayed) –14 Horse shoe gauge 1 50 27 23 (delayed) –15 Female die 5 167 170 3 (early) +
Notes: On time and early delivery to the customer = 26.67%. Delayed delivery for the customers = 73.33%.

110 Acta Wasaensia
12 A.M. Belay et al.
For instance, we traced the delivery schedule in AEC and about 73% of the products are delayed while delivering to the customers. Similarly, 55 components of DA were considered of which 56% delivered late. After knowing that the two sister companies have a problem of keeping the delivery schedule, it was important to have a consensus on the possible reasons of the delay for further analysis.
Figure 2 Fishbone diagram of AEC for delivery delay
Tables 3 and 4 show the common causes of delivery delay in the two companies and used for Pareto analysis. Though the attributes considered for the delay of delivery are same for both companies, the result was different for different reasons to be explained in the interpretation part. Table 3 Causes of delivery delay in AEC
Frequencies S/N Delivery delay causes in AEC
Year 1 Year 2 Year 3Average Cumulative
%
1 Modification of cutters 34 40 38 37.33 22.86 2 Availability of ample raw material 32 28 30 30 41.23 3 Incomplete information from customer 24 20 16 20 53.48 4 Maintenance of machines and
equipments 20 15 13 16 63.28
5 Negligence of operators 16 8 18 14 71.85 6 Manufacture indirect measurement 8 10 18 12 79.2 7 Social factors 10 14 12 12 86.55 8 Special work holding device 12 5 13 10 92.67 9 Heat treatment delay 10 6 8 8 97.57 10 Mismatch of capacity and availability 2 4 6 4 100.00
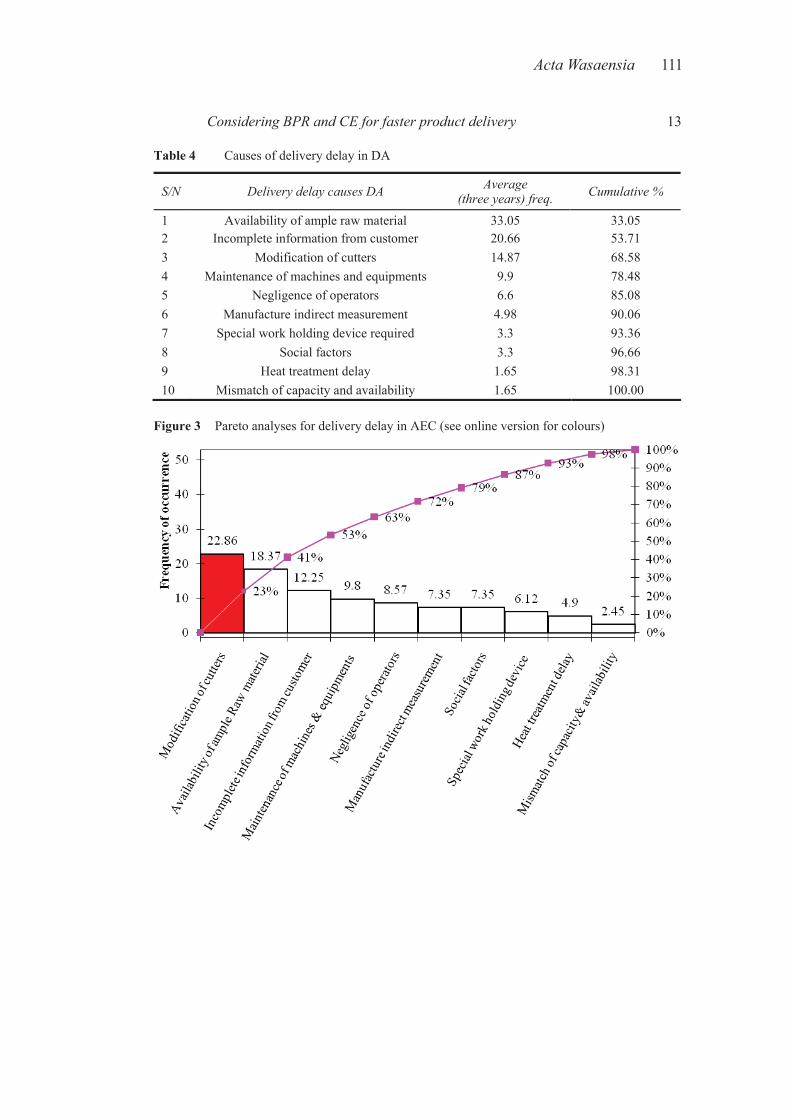
Acta Wasaensia 111
Considering BPR and CE for faster product delivery 13
Table 4 Causes of delivery delay in DA
S/N Delivery delay causes DA Average (three years) freq. Cumulative %
1 Availability of ample raw material 33.05 33.05 2 Incomplete information from customer 20.66 53.71 3 Modification of cutters 14.87 68.58 4 Maintenance of machines and equipments 9.9 78.48 5 Negligence of operators 6.6 85.08 6 Manufacture indirect measurement 4.98 90.06 7 Special work holding device required 3.3 93.36 8 Social factors 3.3 96.66 9 Heat treatment delay 1.65 98.31 10 Mismatch of capacity and availability 1.65 100.00
Figure 3 Pareto analyses for delivery delay in AEC (see online version for colours)
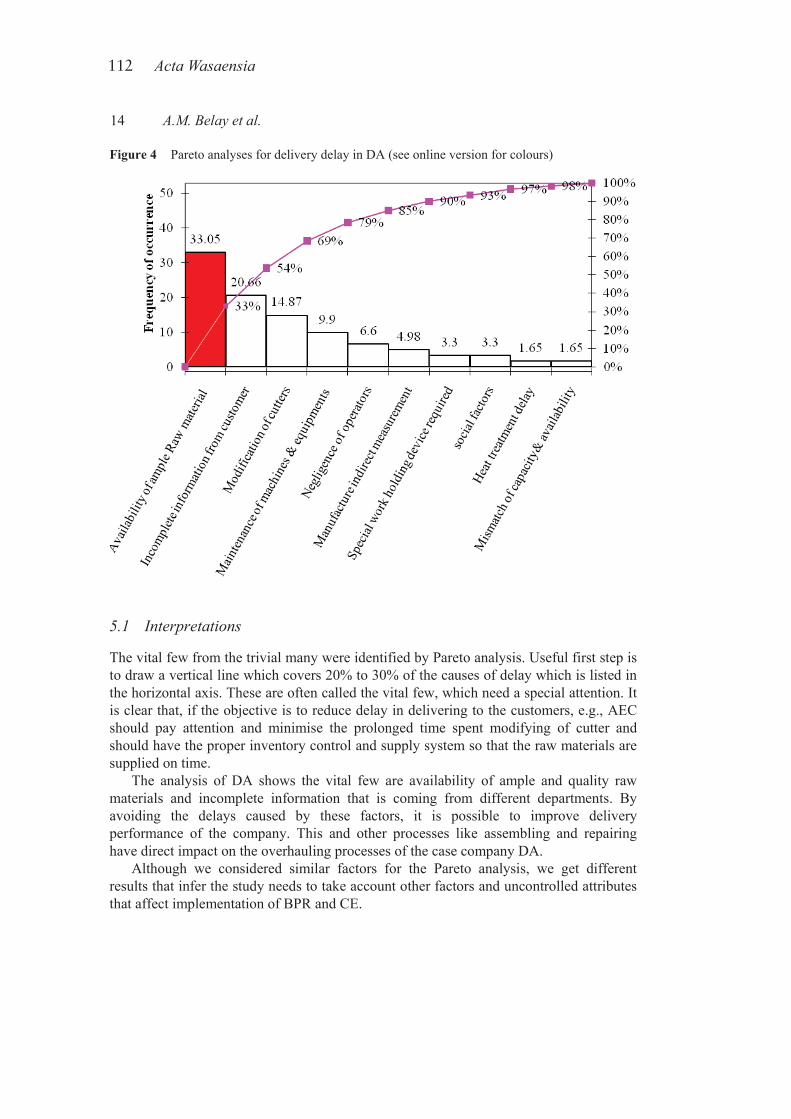
112 Acta Wasaensia
14 A.M. Belay et al.
Figure 4 Pareto analyses for delivery delay in DA (see online version for colours)
5.1 Interpretations
The vital few from the trivial many were identified by Pareto analysis. Useful first step is to draw a vertical line which covers 20% to 30% of the causes of delay which is listed in the horizontal axis. These are often called the vital few, which need a special attention. It is clear that, if the objective is to reduce delay in delivering to the customers, e.g., AEC should pay attention and minimise the prolonged time spent modifying of cutter and should have the proper inventory control and supply system so that the raw materials are supplied on time.
The analysis of DA shows the vital few are availability of ample and quality raw materials and incomplete information that is coming from different departments. By avoiding the delays caused by these factors, it is possible to improve delivery performance of the company. This and other processes like assembling and repairing have direct impact on the overhauling processes of the case company DA.
Although we considered similar factors for the Pareto analysis, we get different results that infer the study needs to take account other factors and uncontrolled attributes that affect implementation of BPR and CE.
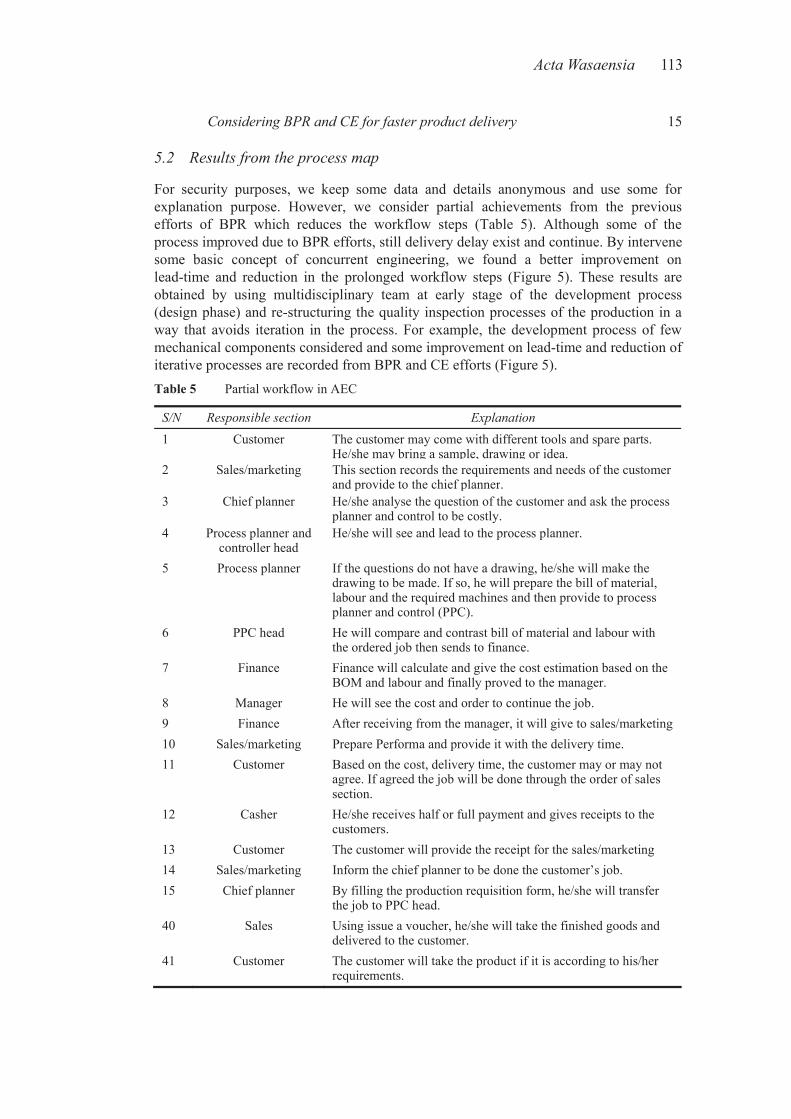
Acta Wasaensia 113
Considering BPR and CE for faster product delivery 15
5.2 Results from the process map
For security purposes, we keep some data and details anonymous and use some for explanation purpose. However, we consider partial achievements from the previous efforts of BPR which reduces the workflow steps (Table 5). Although some of the process improved due to BPR efforts, still delivery delay exist and continue. By intervene some basic concept of concurrent engineering, we found a better improvement on lead-time and reduction in the prolonged workflow steps (Figure 5). These results are obtained by using multidisciplinary team at early stage of the development process (design phase) and re-structuring the quality inspection processes of the production in a way that avoids iteration in the process. For example, the development process of few mechanical components considered and some improvement on lead-time and reduction of iterative processes are recorded from BPR and CE efforts (Figure 5). Table 5 Partial workflow in AEC
S/N Responsible section Explanation
1 Customer The customer may come with different tools and spare parts. He/she may bring a sample, drawing or idea.
2 Sales/marketing This section records the requirements and needs of the customer and provide to the chief planner.
3 Chief planner He/she analyse the question of the customer and ask the process planner and control to be costly.
4 Process planner and controller head
He/she will see and lead to the process planner.
5 Process planner If the questions do not have a drawing, he/she will make the drawing to be made. If so, he will prepare the bill of material, labour and the required machines and then provide to process planner and control (PPC).
6 PPC head He will compare and contrast bill of material and labour with the ordered job then sends to finance.
7 Finance Finance will calculate and give the cost estimation based on the BOM and labour and finally proved to the manager.
8 Manager He will see the cost and order to continue the job. 9 Finance After receiving from the manager, it will give to sales/marketing 10 Sales/marketing Prepare Performa and provide it with the delivery time. 11 Customer Based on the cost, delivery time, the customer may or may not
agree. If agreed the job will be done through the order of sales section.
12 Casher He/she receives half or full payment and gives receipts to the customers.
13 Customer The customer will provide the receipt for the sales/marketing 14 Sales/marketing Inform the chief planner to be done the customer’s job. 15 Chief planner By filling the production requisition form, he/she will transfer
the job to PPC head. 40 Sales Using issue a voucher, he/she will take the finished goods and
delivered to the customer. 41 Customer The customer will take the product if it is according to his/her
requirements.
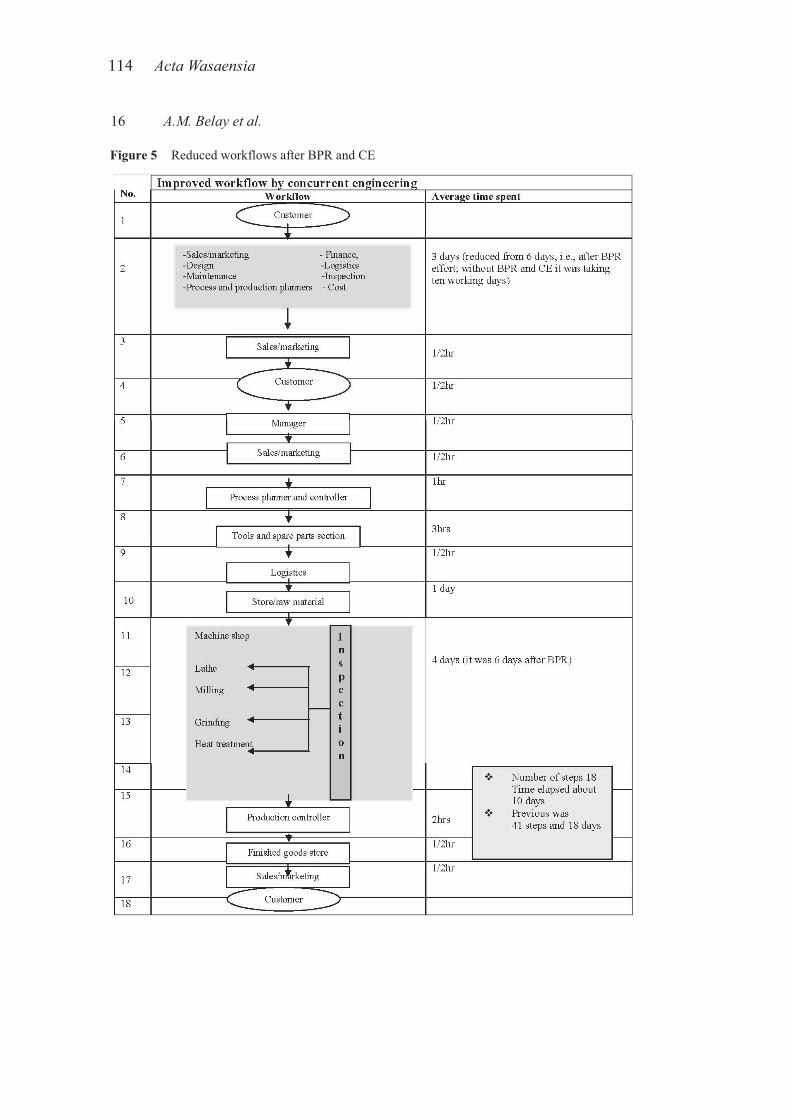
114 Acta Wasaensia
16 A.M. Belay et al.
Figure 5 Reduced workflows after BPR and CE
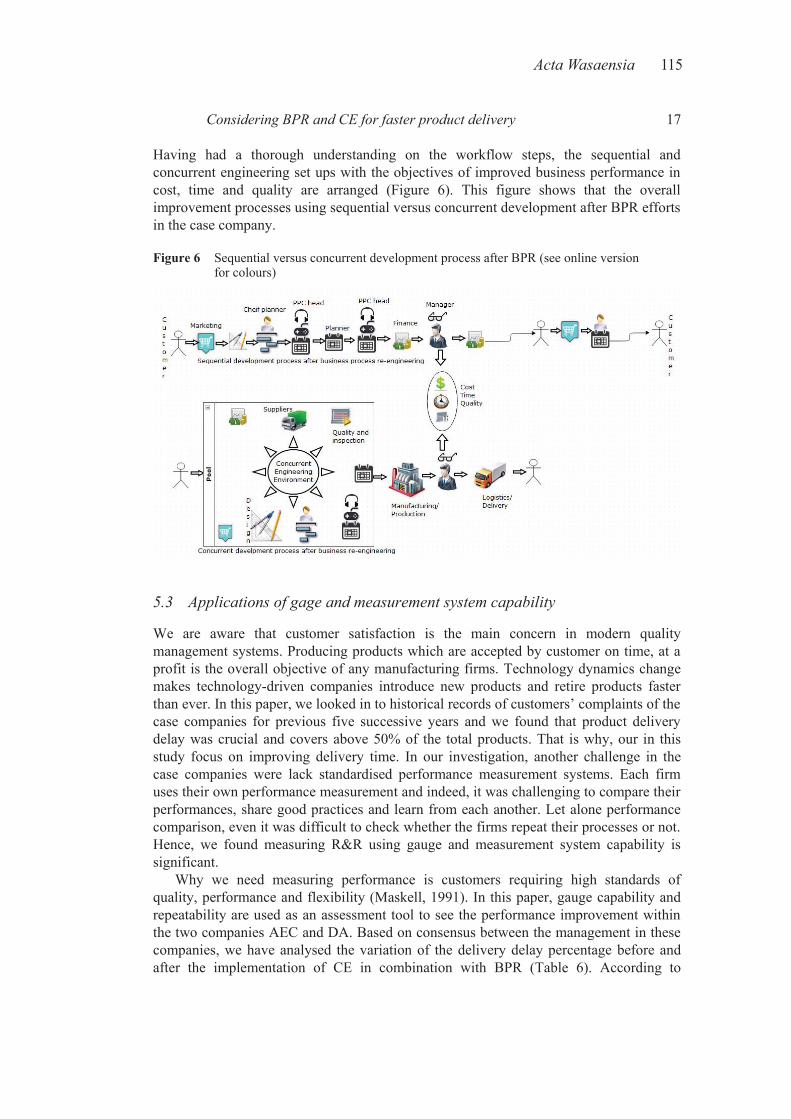
Acta Wasaensia 115
Considering BPR and CE for faster product delivery 17
Having had a thorough understanding on the workflow steps, the sequential and concurrent engineering set ups with the objectives of improved business performance in cost, time and quality are arranged (Figure 6). This figure shows that the overall improvement processes using sequential versus concurrent development after BPR efforts in the case company.
Figure 6 Sequential versus concurrent development process after BPR (see online version for colours)
5.3 Applications of gage and measurement system capability
We are aware that customer satisfaction is the main concern in modern quality management systems. Producing products which are accepted by customer on time, at a profit is the overall objective of any manufacturing firms. Technology dynamics change makes technology-driven companies introduce new products and retire products faster than ever. In this paper, we looked in to historical records of customers’ complaints of the case companies for previous five successive years and we found that product delivery delay was crucial and covers above 50% of the total products. That is why, our in this study focus on improving delivery time. In our investigation, another challenge in the case companies were lack standardised performance measurement systems. Each firm uses their own performance measurement and indeed, it was challenging to compare their performances, share good practices and learn from each another. Let alone performance comparison, even it was difficult to check whether the firms repeat their processes or not. Hence, we found measuring R&R using gauge and measurement system capability is significant.
Why we need measuring performance is customers requiring high standards of quality, performance and flexibility (Maskell, 1991). In this paper, gauge capability and repeatability are used as an assessment tool to see the performance improvement within the two companies AEC and DA. Based on consensus between the management in these companies, we have analysed the variation of the delivery delay percentage before and after the implementation of CE in combination with BPR (Table 6). According to
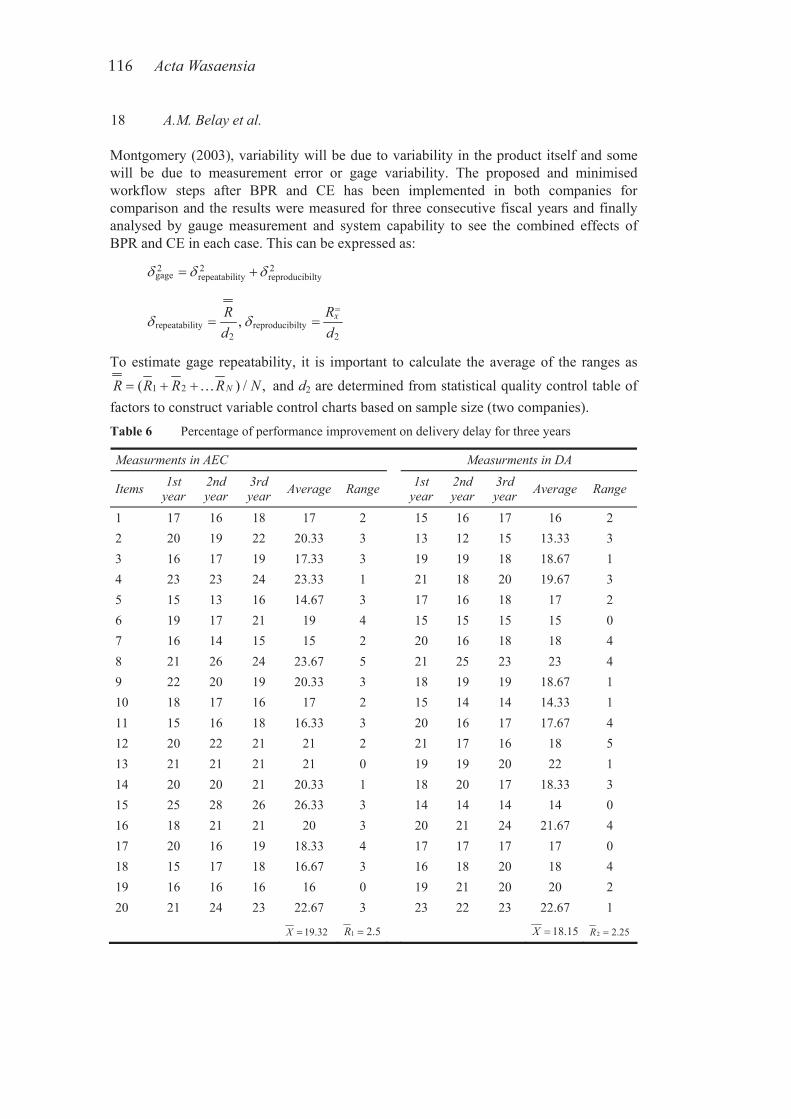
116 Acta Wasaensia
18 A.M. Belay et al.
Montgomery (2003), variability will be due to variability in the product itself and some will be due to measurement error or gage variability. The proposed and minimised workflow steps after BPR and CE has been implemented in both companies for comparison and the results were measured for three consecutive fiscal years and finally analysed by gauge measurement and system capability to see the combined effects of BPR and CE in each case. This can be expressed as:
2 2 2gage repeatability reproducibiltyδ δ δ= +
repeatability reproducibilty2 2
, xR Rd d
δ δ=
= =
To estimate gage repeatability, it is important to calculate the average of the ranges as
1 2( ) / ,NR R R R N= + +… and d2 are determined from statistical quality control table of factors to construct variable control charts based on sample size (two companies). Table 6 Percentage of performance improvement on delivery delay for three years
Measurments in AEC Measurments in DA
Items 1st year
2nd year
3rd year Average Range 1st
year 2nd year
3rd year Average Range
1 17 16 18 17 2 15 16 17 16 2 2 20 19 22 20.33 3 13 12 15 13.33 3 3 16 17 19 17.33 3 19 19 18 18.67 1 4 23 23 24 23.33 1 21 18 20 19.67 3 5 15 13 16 14.67 3 17 16 18 17 2 6 19 17 21 19 4 15 15 15 15 0 7 16 14 15 15 2 20 16 18 18 4 8 21 26 24 23.67 5 21 25 23 23 4 9 22 20 19 20.33 3 18 19 19 18.67 1 10 18 17 16 17 2 15 14 14 14.33 1 11 15 16 18 16.33 3 20 16 17 17.67 4 12 20 22 21 21 2 21 17 16 18 5 13 21 21 21 21 0 19 19 20 22 1 14 20 20 21 20.33 1 18 20 17 18.33 3 15 25 28 26 26.33 3 14 14 14 14 0 16 18 21 21 20 3 20 21 24 21.67 4 17 20 16 19 18.33 4 17 17 17 17 0 18 15 17 18 16.67 3 16 18 20 18 4 19 16 16 16 16 0 19 21 20 20 2 20 21 24 23 22.67 3 23 22 23 22.67 1
19.32X = 1 2.5R = 18.15X = 2 2.25R =
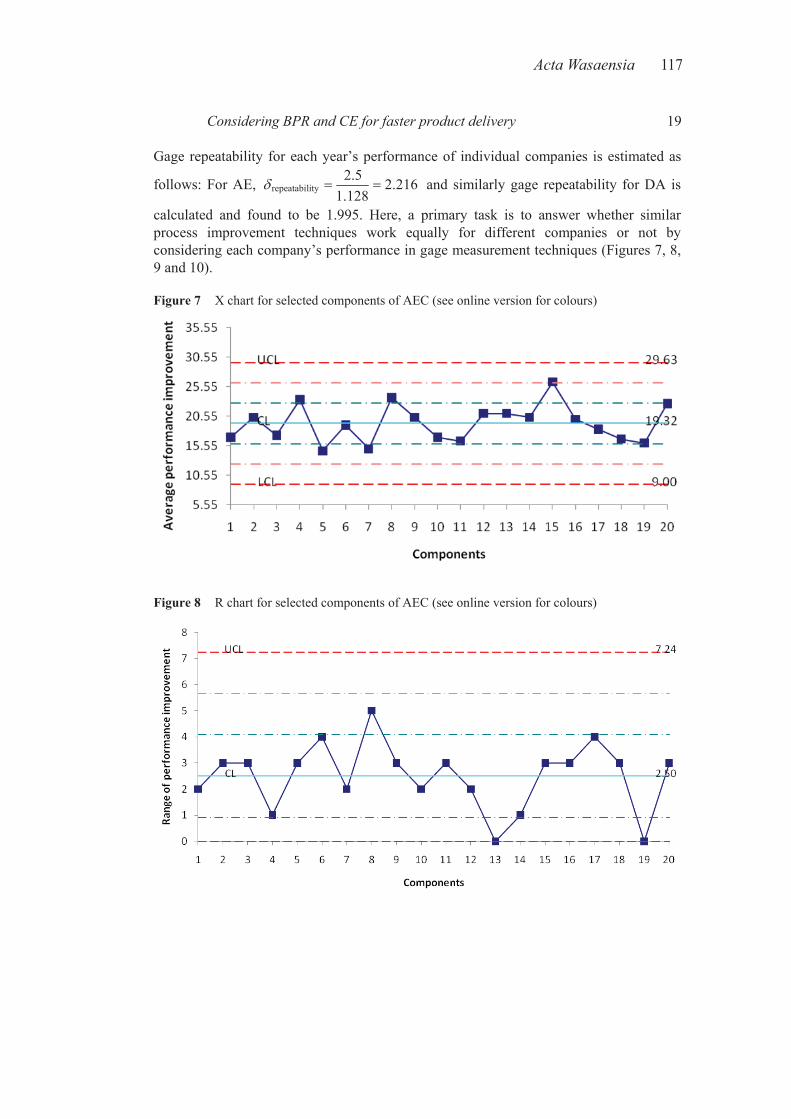
Acta Wasaensia 117
Considering BPR and CE for faster product delivery 19
Gage repeatability for each year’s performance of individual companies is estimated as
follows: For AE, repeatability2.5 2.216
1.128δ = = and similarly gage repeatability for DA is
calculated and found to be 1.995. Here, a primary task is to answer whether similar process improvement techniques work equally for different companies or not by considering each company’s performance in gage measurement techniques (Figures 7, 8, 9 and 10).
Figure 7 X chart for selected components of AEC (see online version for colours)
Figure 8 R chart for selected components of AEC (see online version for colours)
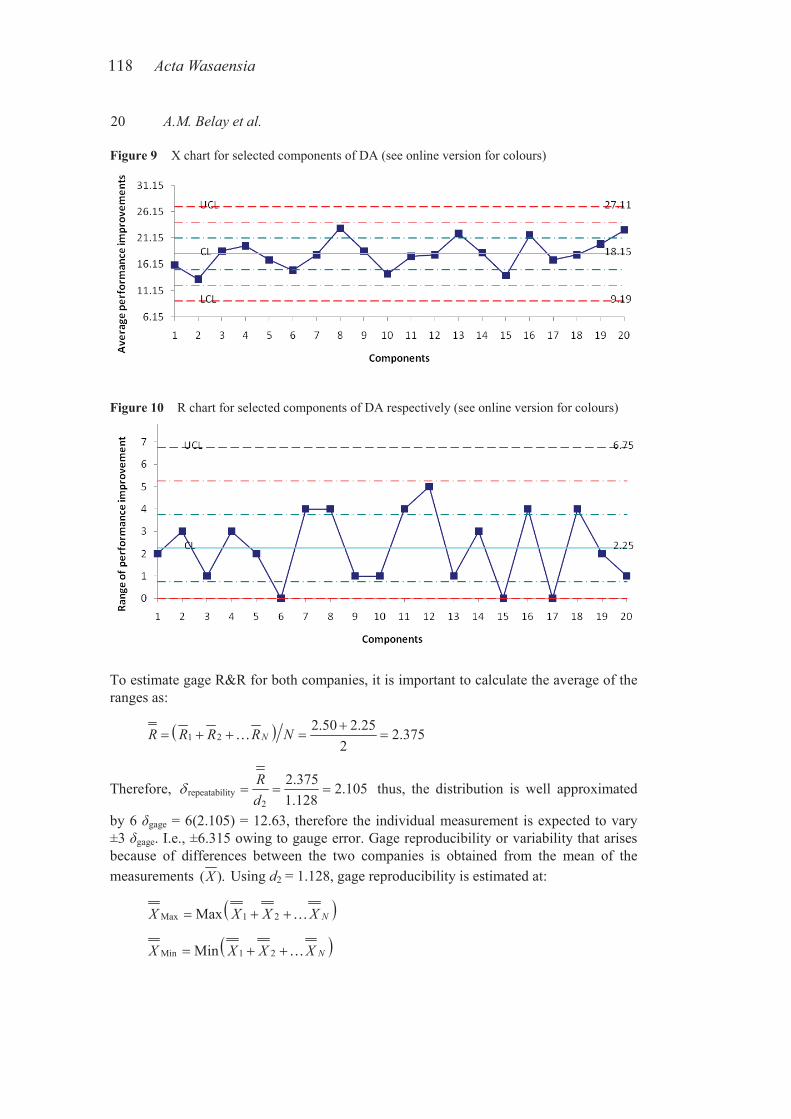
118 Acta Wasaensia
20 A.M. Belay et al.
Figure 9 X chart for selected components of DA (see online version for colours)
Figure 10 R chart for selected components of DA respectively (see online version for colours)
To estimate gage R&R for both companies, it is important to calculate the average of the ranges as:
( )1 22.50 2.25 2.375
2NR R R R N +
= + + = =…
Therefore, repeatability2
2.375 2.1051.128
Rd
δ = = = thus, the distribution is well approximated
by 6 δgage = 6(2.105) = 12.63, therefore the individual measurement is expected to vary ±3 δgage. I.e., ±6.315 owing to gauge error. Gage reproducibility or variability that arises because of differences between the two companies is obtained from the mean of the measurements ( ).X Using d2 = 1.128, gage reproducibility is estimated at:
( )Max 1 2Max NX X X X= + +…
( )Min 1 2Min NX X X X= + +…
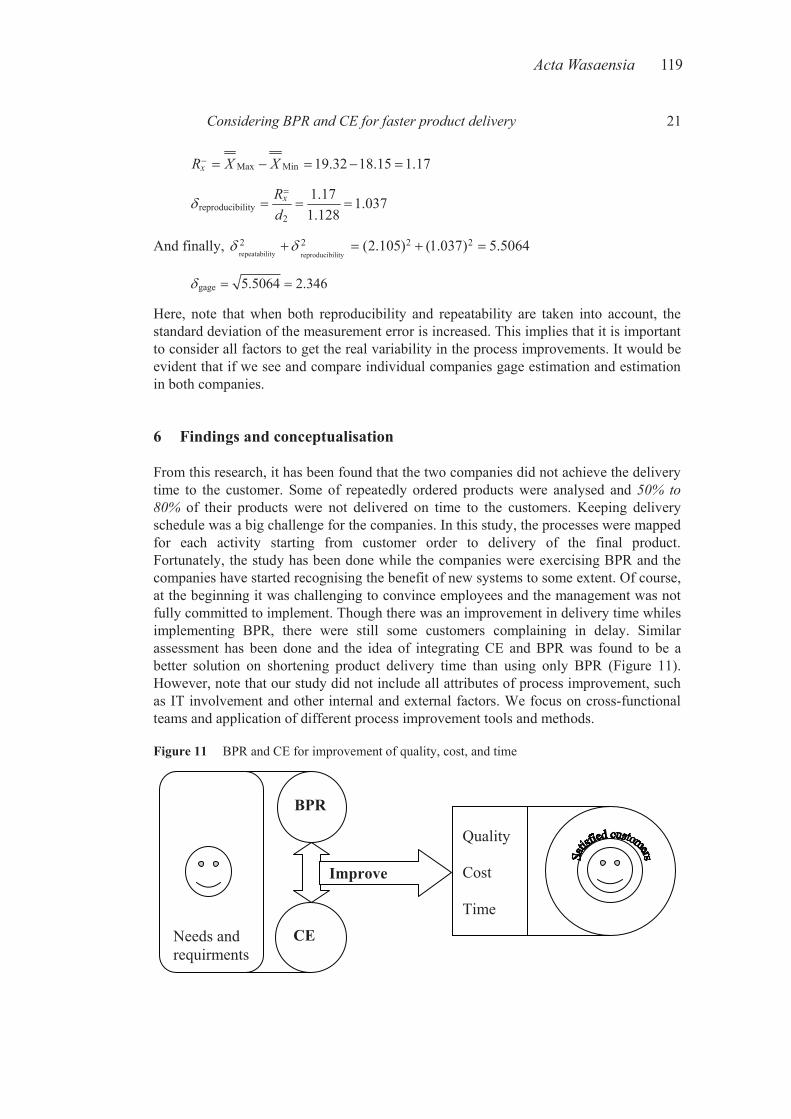
Acta Wasaensia 119
Considering BPR and CE for faster product delivery 21
Max Min 19.32 18.15 1.17xR X X− = − = − =
reproducibility2
1.17 1.0371.128
xRd
δ=
= = =
And finally, repeatability reproducibility2 2 2 2(2.105) (1.037) 5.5064δ δ+ = + =
gage 5.5064 2.346δ = =
Here, note that when both reproducibility and repeatability are taken into account, the standard deviation of the measurement error is increased. This implies that it is important to consider all factors to get the real variability in the process improvements. It would be evident that if we see and compare individual companies gage estimation and estimation in both companies.
6 Findings and conceptualisation
From this research, it has been found that the two companies did not achieve the delivery time to the customer. Some of repeatedly ordered products were analysed and 50% to 80% of their products were not delivered on time to the customers. Keeping delivery schedule was a big challenge for the companies. In this study, the processes were mapped for each activity starting from customer order to delivery of the final product. Fortunately, the study has been done while the companies were exercising BPR and the companies have started recognising the benefit of new systems to some extent. Of course, at the beginning it was challenging to convince employees and the management was not fully committed to implement. Though there was an improvement in delivery time whiles implementing BPR, there were still some customers complaining in delay. Similar assessment has been done and the idea of integrating CE and BPR was found to be a better solution on shortening product delivery time than using only BPR (Figure 11). However, note that our study did not include all attributes of process improvement, such as IT involvement and other internal and external factors. We focus on cross-functional teams and application of different process improvement tools and methods.
Figure 11 BPR and CE for improvement of quality, cost, and time
BPR
Quality
Cost
Time
Improve
CENeeds andrequirments
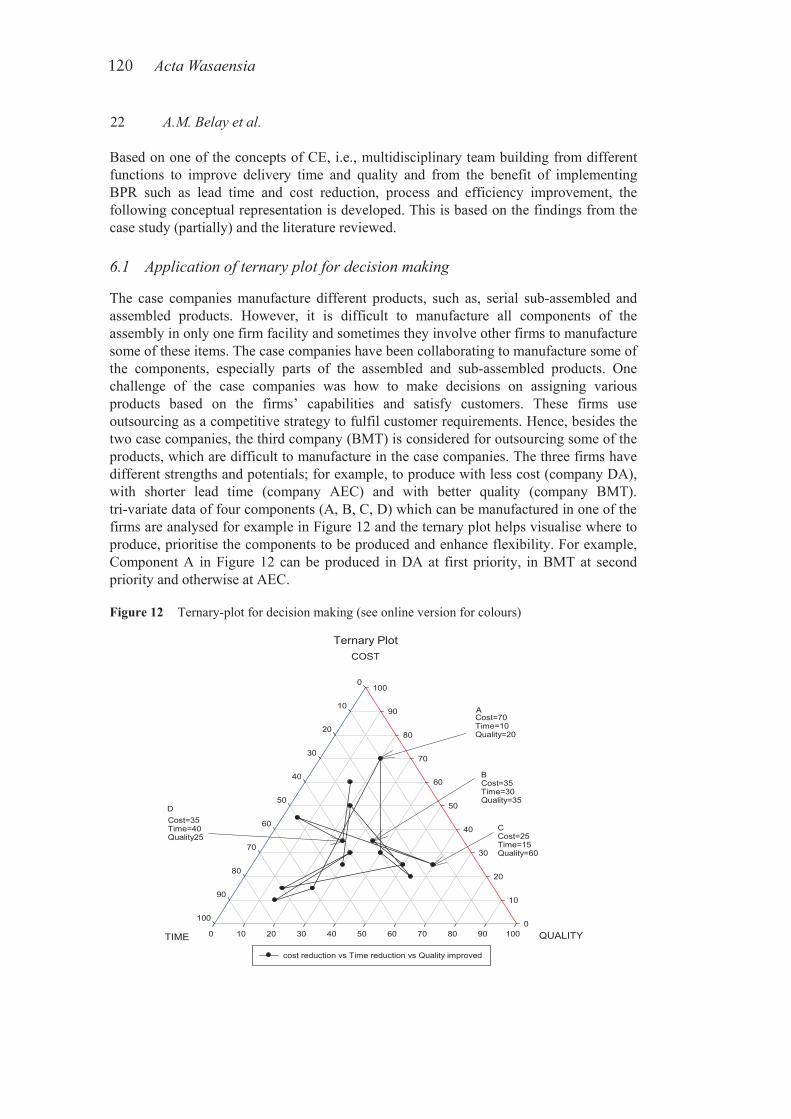
120 Acta Wasaensia
22 A.M. Belay et al.
Based on one of the concepts of CE, i.e., multidisciplinary team building from different functions to improve delivery time and quality and from the benefit of implementing BPR such as lead time and cost reduction, process and efficiency improvement, the following conceptual representation is developed. This is based on the findings from the case study (partially) and the literature reviewed.
6.1 Application of ternary plot for decision making
The case companies manufacture different products, such as, serial sub-assembled and assembled products. However, it is difficult to manufacture all components of the assembly in only one firm facility and sometimes they involve other firms to manufacture some of these items. The case companies have been collaborating to manufacture some of the components, especially parts of the assembled and sub-assembled products. One challenge of the case companies was how to make decisions on assigning various products based on the firms’ capabilities and satisfy customers. These firms use outsourcing as a competitive strategy to fulfil customer requirements. Hence, besides the two case companies, the third company (BMT) is considered for outsourcing some of the products, which are difficult to manufacture in the case companies. The three firms have different strengths and potentials; for example, to produce with less cost (company DA), with shorter lead time (company AEC) and with better quality (company BMT). tri-variate data of four components (A, B, C, D) which can be manufactured in one of the firms are analysed for example in Figure 12 and the ternary plot helps visualise where to produce, prioritise the components to be produced and enhance flexibility. For example, Component A in Figure 12 can be produced in DA at first priority, in BMT at second priority and otherwise at AEC.
Figure 12 Ternary-plot for decision making (see online version for colours)
Ternary Plot
QUALITY0 10 20 30 40 50 60 70 80 90 100
COST
0
10
20
30
40
50
60
70
80
90
100
TIME
0
10
20
30
40
50
60
70
80
90
100
cost reduction vs Time reduction vs Quality improved
Cost=70Time=10Quality=20
Cost=35Time=40Quality25
CCost=25Time=15Quality=60
BCost=35Time=30Quality=35
D
A
Acta Wasaensia 121
Considering BPR and CE for faster product delivery 23
7 Conclusions
The purpose of this research is to investigate the combining effect of BPR and CE and assess the possibility of using these improvement methods to enhance the product development performance. Unlike several studies which focus in either of these methods, this research tries to apply both concepts together in manufacturing firms. The study begins by identifying the major challenges of the previous performance of the firm.
The study found that, the case companies were using sequential product development process. Delivery delay for selected products was about 50% to 80%. This highly affects product delivery schedule and extended workflow steps. The decision that was made on combining BPR and CE was found relevant on reducing non-value adding activities and help avoiding time consuming, repetitive workflow steps that in turn reduce product development time. This is achieved by using cross-functional team to avoiding some redundant and iterative processes at early design stage and quality inspection section (see Figure 5); the company reduced the workflow steps significantly from 41 to 18 that reduce wastes like, overflow, over processing, etc. While assessing the process using process map, several activities were found unnecessarily deployed in the company’s product development processes, for instance on production planning stage, there are about three planners who are doing similar job that can be done by one. That means the work will start by chief planner then sent to process planner and controller and then goes to process planner. These prolonged and extended activities merged in reasonable way and the concept of concurrent engineering is intervened to shorten the workflow steps.
It is believed and compulsory for product development managers to measure and compare the outcomes of their decisions (e.g., using BPR and CE). In this regard, we considered the case companies’ workflow steps after implementation of BPR and CE, measure and test whether the companies repeat their processes or not. We use gauge and measurement system capability to measure the R&R as a measure of general performance improvement. We come up with different results though we used similar process in both companies, for example, the repeatability which is calculated in Section 5.3 shows different result. These show that, there could be other uncovered factors which need to be considered in product development processes to come up with a general conclusion.
The research has managerial implication in a way that managers could see the possibility of solving real world problems by considering more than one approach together. This is in line with contingency theory that states, no single approach is capable of solving every organisational problem. This study supports the decision of combining more than one approach, i.e., BPR and CE for the betterment of companies’ performance. Some of the challenges on BPR that are highlighted in this paper (Table 1) need advanced decision-making tools and techniques. We use and intervene some of the process improvement tools and found beneficial for the study. Hence, we propose product development managers use indefatigably these tools (R&R, process mapping, Ternary plot, etc.) starting from problem identification to strategic decisions. For instance Ternary plot used was found useful to give priority which component could be produced in which firm. Finally, a conceptual model is developed based on the results of the study and literature. The model shows combining BPR and CE leads to performance improvement that would help to have satisfied customers in some performance dimensions such as, quality, cost and time.
122 Acta Wasaensia
24 A.M. Belay et al.
This research has its own limitations. It was challenging to incorporate all activities and processes in the case companies so that we are limited to some common activities and processes. The research is conducted mainly in two manufacturing firms and this makes difficult to bring general conclusion. Therefore, similar research should be conducted in various manufacturing and service companies. The future work will be to carry out similar research by encompassing all processes and activities in both manufacturing and services.
Acknowledgements
First of all we would like to thank and acknowledge the reviewers and editor for their constructive comments and criticisms to make the manuscript readable. Next, we would like to acknowledge all institutions, firms and individuals who have involved in this research.
References Abdalla, H.S. (1999) ‘Concurrent engineering for global manufacturing’, International Journal of
Production Economics, Vols. 60–61, No. 1, pp.251–260. Ahsan, K.B. and Marufuzzaman, M. (2012) ‘Launching an existing product to a new demographic
area: strategic plans and system reconfiguration’, International Journal of Industrial and Systems Engineering, Vol. 10, No. 1, pp.117–133.
Anjard, R.P. (1996) ‘Process mapping: one of three, new, special quality tools’, Microelectronics and Reliability, Vol. 36, No. 2, pp.223–225.
Bataineh, O. and Al-Dwairi, A. (2009) ‘Integrated SPC-based scheme utilizing variable control charts and Cpm ratio to improve manufacturing quality of empty hard gelatin capsules’, International Journal of Productivity and Quality Management, Vol. 9, No. 3, pp.332–351.
Bhamu, J., Shailendra Kumar, J.V. and Sangwan, K.S. (2012) ‘Productivity and quality improvement through value stream mapping: a case study of Indian automotive industry’, International Journal of Productivity and Quality Management, Vol. 10, No. 3, pp.288–306.
Bovey, C. (1994) ‘Business process re-engineering, a concurrent engineering process’, IEEE Colloquium on Current Developments in Concurrent Engineering – Methodologies and Tools,2 June, pp.1–9, London.
Bowling, S.R., Rabadi, G., Khasawneh, M.T., Shearer, N.E.N. and Zhang, J. (2012) ‘Initiative mapping methodology for system-of-systems applications’, International Journal of Industrial and Systems Engineering, Vol. 10, No. 1, pp.75–95.
Brookes, N.J. and Backhouse, C.J. (1997) ‘Variety and concurrent engineering’, Manufacturing Engineer, Vol. 76, No. 2, pp.72–75.
Brooks, B. (1996) ‘Realizing the benefit of concurrent engineering through BPR’, IEE Computing & Control Journal, Vol. 7, No. 2, pp.63–68.
Browning, T. (2010) ‘On the alignment of the purposes and views of process models in project management’, Journal of Operations Management, Vol. 28, No. 4, pp.316–332.
Bryman, A. (2008) Social Research Methods, Oxford University Press, Oxford. Burt, D.N. and Soukup, W.R. (1985) ‘Purchasing role in new product development’, Harvard
Business Review, September/October, Vol. 63, No. 5, pp.90–97. Caputo, A.C. and Pelagagge, P.M. (2008) ‘Effects of product design on assembly lines
performances a concurrent engineering approach’, Industrial Management & Data Systems,Vol. 108, No. 6, pp.726–749.
Acta Wasaensia 123
Considering BPR and CE for faster product delivery 25
Chen, J., Damanpour, F. and Reilly, R.R. (2010) ‘Understanding antecedents of new product development speed: a meta-analysis’, Journal of Operations Management, Vol. 28, No. 1, pp.17–33.
Chinna, K., Kadir, S.L. and Abdullah, M. (2000) ‘Box-chart: combining x and S charts’, Total Quality Management, Vol. 11, No. 4, pp.857–862.
Cooper, R.G. and Edgett, S.J. (2003) ‘Overcoming the crunch in resources for new product development’, Research Technology Management, Vol. 46, No. 3, pp.48–58.
Crawford, C.M. (1992) ‘The hidden costs of accelerated product development’, The Journal of Product Innovation Management, Vol. 9, No. 3, pp.188–199.
Davenport, T.H. (1993) Process Innovation – Reengineering Work Through Information Technology, Ernest & Young, Harvard Business School Press.
Davenport, T.H. and Short, J.E. (1990) ‘The new industrial engineering: information technology and business process redesign’, Sloan Management Review, Vol. 31, No. 4, pp.11–27.
Davenport, T.H. and Stoddard, D.B. (1994) ‘Reengineering: business change of mythic proportions’, MIS Quarterly, June, Vol. 18, No. 2, pp.121–128.
Fithri, S. and Yahaya, J.H. (2012) ‘Conceptual model of business process re-engineering: a case study of a cargo company in Malaysia’, Proceedings of international conference on informatics and application, 3–5 June, Kuala Terengganu, Malaysia.
Frei, F.X. and Harker, P.T. (1999) ‘Measuring aggregate process performance using AHP’, European Journal of Operational Research, Vol. 116, No. 2, pp.436–442.
Goksoy, A. and Ozsoy, B. (2012) ‘Business process reengineering: strategic tool for managing organizational change an application in a multinational company’, International Journal of Business and Management, Vol. 7, No. 2, pp.80–112.
Grover, V. and Kettinger, W. (2000) Process Think: Winning Perspectives for Business Change in the Information Age, Idea Group, Harrisburg, PA.
Hammer, M. (1990) ‘Re-engineering work: don’t automate, obliterate’, Harvard Business Review,Vol. 68, No. 4, pp.104–112.
Hammer, M. and Champy, J. (1993) Re-engineering the Corporation – A Manifesto for Business Revolution, Harper Business, New York.
Hammer, M. and Stanton, S.A. (1995) The Reengineering Revolution, Harper Business, New York. Harrel, C.R. and Field, K.C. (1996) ‘Integrating process mapping and simulation’, Proceedings,
Winter Simulation Conference, Coronado, California, pp.1292–1296. Hartley, J.R. (1992) Concurrent Engineering, Productivity Press, Portland, OR. Hilletofth, P. and Eriksson, D. (2011) ‘Coordinating new product development with supply chain
management’, Industrial Management & Data Systems, Vol. 111, No. 2, pp.264–281. Huang, G., and Mak, K. (1998) ‘Re-engineering the product development process with ‘design for
x’’, Proceedings of the Institution of Mechanical Engineers, Part B, Vol. 212, pp.259–268. Jacka, J.M. and Keller, P.J. (2009) Business Process Mapping; Improving Customer Satisfaction,
2nd ed., John Wiley & Sons Inc., New Jersey. James, M. (1995), The Great Transition: Using the Seven Disciplines of Enterprise Engineering to
Align People, Technology, and Strategy. American Management Association, New York. Johnson, R.B. and Onwuegbuzie, A.J. (2004) ‘Mixed methods research: a research paradigm whose
time has come’, Educational Researcher, Vol. 33, No. 7, pp.14–26. Kleiner A. (2000) ‘Revisiting reengineering’, Strategy + Business, Vol. 20, No. 3, pp.27–31. Korherr, B. and List, B. (2007) ‘Extending the EPC and the BPMN with business process goals and
performance measures’, 9th International Conference on Enterprise Information Systems (ICEIS), Funchal, Madeira, 12–16 June.
Koshy, G.P. and Koshy, A.G. (2004) ‘Project management using statistical control chart’, Annual Quality Congress Proceedings, ASQ, Toronto, Ontario, 24–26 May, Vol. 58, pp.517–528.
124 Acta Wasaensia
26 A.M. Belay et al.
Koufteros, X.A., Vonderembse, M. and Doll, W. (2001) ‘Concurrent engineering and its consequences’, Journal of Operations Management, Vol. 19, No. 1, pp.97–115.
Laakso, T. (1997) Performance Evaluation and Process Intervention – A Method for Business Process Development, Helsinki University of Technology, Espoo.
Lipnack, J.L. and Stamps, J.S. (1994) The Age of Network, Organizing Principles for the 21st Century, John Wiley, New York.
Mäkinen, J.T. (2011) ‘Concurrent engineering approach to plastic optics design’, PhD dissertation, Faculty of Technology of the University of Oulu, Finland.
Maskell, B.H. (1991) Performance Measurement for World Class Manufacturing: A Model for American Companies, Productivity Press, New York, USA.
McDonough, E.F. and Barczak, G. (1991) ‘Speeding up new product development: the effects of leadership style and source of technology’, Journal of Product Innovation Management,Vol. 8, No. 3, pp.203–211.
Montgomery, D.C. (2003) Introduction to Statistical Quality Control, John Wiley, USA. Morgan, C. (2004) ‘Structure, speed and salience: performance measurement in the supply chain’,
Business Process Management Journal, Vol. 10, No. 5, pp.522–536. Morgan, D.L. (1998) ‘Practical strategies for combining qualitative and quantitative methods:
applications to health research’, Qualitative Health Research, Vol. 8, No. 3, pp.362–376. Nagarajan, S., Ganesh, K., Resmi, A.T., Anbuudayasankar, S.P. and Hemachitra, R. (2012)
‘Organisation structure, reward and communication design for implementation of knowledge management solution’, International Journal of Productivity and Quality Management,Vol. 10, No. 1, pp.40–68.
Okrent, M.D. and Vokurka, R.J. (2004) ‘Process mapping in successful ERP implementations’, Industrial Management & Data Systems, Vol. 104, No. 8, pp.637–643.
Ozcelik, Y. (2008) ‘IT-enabled reengineering: productivity impacts’, Encyclopedia of Information Communication Technology, Vol. 2, No. 1, pp.498–502.
Ozcelik, Y. (2010) ‘Do business process reengineering projects payoff? Evidence from the United States’, International Journal of Project Management, Vol. 28, No. 3, pp.7–13.
Perols, J., Zimmermann, C. and Kortmann, S. (2012) ‘On the relationship between supplier integration and time-to-market’, Journal of Operations Management,http://dx.doi.org/10.1016/j.jom.2012.11.002 (accessed 17 January 2013).
Prajapati, D.R. and Singh, S. (2012) ‘Control charts for monitoring the auto-correlated process parameters: a literature review’, International Journal of Productivity and Quality Management, Vol. 10, No. 2, pp.207–249.
Prastacos, G., Söderquist, K., Spanos, Y., VanWassenhove, L. (2002) ‘An integrated framework for managing change in the new competitive landscape’, European Management Journal, Vol. 20, No. 1, pp.55–71.
Sale, J.E.M., Lohfield, L. and Brazil, K. (2002) ‘Revisiting the quantitative-qualitative debate: implications for mixed-methods research’, Quality and Quantity, Vol. 36, No. 1, pp.43–53.
Scordaki, A. and Psarakis, S. (2005) ‘Statistical process control in service industry an application with real data in a commercial company’, The 7th Hellenic European Conference on Computer Mathematics and Its Applications, Athens, 22–24 September.
Sharma, J. (2009) ‘A cross-disciplinary approach to product development and design through quality function deployment, target costing and value engineering’, International Journal of Productivity and Quality Management, Vol. 9, No. 3, pp.309–331.
Sharma, M.K. and Bhagwat, R. (2007) ‘An integrated BSC-AHP approach for supply chain management evaluation’, Measuring Business Excellence, Vol. 11, No. 3, pp.57–68.
Singh, R.K., Garg, S.K. and Deshmukh, S.G. (2010) ‘The competitiveness of SMEs in a globalized economy: observations from China and India’, Management Research Review, Vol. 33, No. 1, pp.54–65.
Acta Wasaensia 125
Considering BPR and CE for faster product delivery 27
Singh, K. and Ahuja, I.S. (2012) ‘Justification of TQM-TPM implementations in manufacturing organisations using analytical hierarchy process: a decision-making approach under uncertainty’, Int. J. of Productivity and Quality Management, Vol. 10, No. 1, pp.69–84.
Singholi, A., Ali, A.M. and Sharma, C. (2012) ‘Impact of manufacturing flexibility on FMS performance: a simulation study’, International Journal of Industrial and Systems Engineering, Vol. 10, No. 1, pp.96–116.
Smith, P.G. and Reinertsen, D.G. (1998) Developing Products in Half the Time, John Wiley & Sons Inc., New York.
Stoddard, D.B., Jarvenpaa, S.L. and Littlejohn, M. (1996) ‘The reality of business process re-engineering Pacific Bell’s Centrex provisioning process’, California Management Review,Vol. 38, No. 3, pp.57–76.
Sulek, J.M. (2004) ‘Statistical quality control in services’, International Journal of Services Technology and Management, Vol. 5, Nos. 5/6, pp.522–531.
Swink, M., Talluri, S. and Pandejpong, T. (2006) ‘Faster, better, cheaper: a study of NPD project efficiency and performance trade-offs’, Journal of Operations Management, Vol. 24, No. 5, pp.542–562.
Tennant, C. and Wu, Y.C. (2005) ‘The application of business process reengineering in the UK’, The TQM Magazine, Vol. 17, No. 6, pp.537–545.
Tikkanen, H. (1998) ‘The process movement: a critical review’, Liiketaloudellinen Aikakauskirja-The Finnish Journal of Business Economics, LTA, Vol. 2, No. 1, pp.204–226.
Treacy, M. and Weirsema, F. (1993) ‘Customer intimacy and other value disciplines’, Harvard Business Review, Vol. 71, No. 1, pp.84–93.
Vincent, C.Y. (2009) ‘An integrated model for business process measurement’, Business Process Management Journal, Vol. 15, No. 6, pp.865–875.
Wellins, R., Byham, W. and Wilson, J. (1991) Empowered Teams: Creating Self-Directed Work Groups that Improve Quality, Productivity, and Participation, Jossey-Bass, New Jersey.
Wheeler, D.J. and Chambers, D.S. (1992) Understanding Statistical Process Control, 2nd ed., SPC, Knoxville, TN.
Winner, R.I., Pennell, J.P., Bertrend, H.E. and Slusarczuk, M.M.G. (1988) The Role of Concurrent Engineering in Weapons System Acquisition, IDA report R-338, Institute for Defence Analyses, Alexanderia, VA.
Yahaya, J.H., Fithri, S. and Deraman, A. (2012) ‘An enhanced workflow re-engineering methodology for SMEs’, International Journal of Digital Information and Wireless Communications (IJDIWC), Vol. 2, No. 1, pp.51–65.

Acta Wasaensia 127
Improving Product Development Performance by Front-loading: A System Dynamics Approach
Alemu Moges Belay*, Torgeir Welo, Petri Helo
Abstract
Nowadays, competing with successful products has become perplexing with sev-eral uncertainties and transmute from time to time as customers’ expectations are dynamic. That is why manufacturing firms exhaustively strive to look for a better competitive frontier using well-established and innovative product development processes. In this paper, we would like to answer three research questions: a) what would be the effects of front-loading in PD? b) Can we improve our PD process endlessly? c) When is the critical time that the firm should take remedial action for improvements? As a contribution to the vast numbers of improvement methods in NPD, this paper investigates the effects of front-loading using set-based concurrent engineering (SBCE) on cost and lead time. Models are devel-oped and treated using a system dynamics approach. We assign a hypothetical upfront investment for SBCE and compare its effects on total cost and lead time of the development process. From the research, it is found that the total cost of product development is reduced almost by half – although the front loading is higher in order to encompass multiple design alternatives. The total product lead time is reduced by almost 20%. The models reveals the critical time for improve-ment the PD process. We used system dynamics tool (STELLA) for simulation and visualization of the complex product development model, using SBCE as one of several strategies to front-load activities in the NPD process.
Keywords: Front-loading, Set-Based Concurrent Engineering (SBCE), Innova-tion, Lean product development, System dynamics (SD).
Introduction
Competing with new products has been considered as a global confrontation since the last few decades. Hence companies ceaselessly strive to improve and establish new strategies, engineering methods and techniques. The well-known lean phi-losophy has been adapted to several applications and obtained both successes and failures, depending on the nature of the NPD environment and the requirements of the philosophy by itself. One proven strategy to compete and win in the dy-
128 Acta Wasaensia
namic and vibrant automotive market is the one due to Toyota which is widely discussed by Morgan and Liker (2006), among others. In a more general context, however, competing with new product demands radical changes and significant continuous efforts. This may involve changing strategies (at different levels), product development processes, culture and mind-set, along with practices such as transforming from sequential to concurrent engineering, adopting components of the lean concept in NPD; e.g. applying set-based concurrent engineering in-stead of conventional point based concurrent engineering.
In this paper, lean is viewed as an umbrella which constitutes several blocks of engineering methods and techniques. These blocks mainly serve to eliminate wastes. However, relatively limited qualitative research has been carried out on lean that focus on value adding activities and optimizing NPD processes. Despite the presence of multiple methods and approaches, companies still struggle in their efforts for more profitable and successful new products.
In manufacturing firms, that develop and deliver products, cost, time and quality are the three main dimensions of competition. Being one of the main components of the lean philosophy when applied to NPD, concurrent engineering is one of the more common strategies to improve the performances of these three distinct di-mensions. In this context, transforming from a sequential product development to simultaneous engineering is considered as a competitive weapon (Würtemberg, et al. 2011).
In the present paper, attempts will be made to analyze and compare NPD out-comes in terms of two different strategies associated with concurrent engineering; that is, set-based and point-based concurrent engineering. In NPD, analyzing in-terdependent activities with several factors are challenging and even more diffi-cult to quantify the effects of various parameters on product development perfor-mance. To overcome this challenge, we considered NPD as a system and propose using a system dynamic approach. The assumption is because system dynamics (SD) is a well-developed theory applicable to consider complex systems, non-linearity, and several feedback loops of information in a system (Sterman 2000).
The paper is structured as follow: It starts with a brief introduction and discusses the problem statement of the research followed by explaining the main issues and contexts. It begins by explaining the different views on lean thinking beyond eliminating waste before going into NPD process and decision making. Next, it discusses SBCE and PBCE in terms of speed to market and the role of system dynamic in product development. Before giving the conclusion, the model with causal loops and the results of system dynamic simulations are presented.
Acta Wasaensia 129
Does Innovative Lean product development only stand for eliminating waste?
The industrial revolution in 1970’s brought the emergence of lean thinking in operations management. However, it has been applied in manufacturing and mainly on high volume products. Although lean business management and pro-duction strategy is considered as a major and successful Toyota’s production sys-tem, its principles have been broken down and applied in to several detailed oper-ational practices and applications. Nowadays, it is common to see lean as a prefix to different fields and operations: lean six-sigma, lean supply chain, lean con-struction, lean project management, lean product development, etc. Almost all focus on eliminating wastes that are exactly emanated from the basic single per-spective of lean that is “waste elimination”. Pettersen (2009) argues there is no agreed upon definition of lean and the formulations of the overall purpose of the concepts are instead going divergent. Some researchers link waste elimination to values that are added for customers (Dennis, 2002; Bicheno, 2004).
Having gone through literature of LPD (e.g. Karlsson, C. and Ahlström, P. 1996, Welo 2011), we develop the conceptual model that broadens the perspective and understanding of LPD beyond eliminating wastes. Figure 1 depicts and several authors also argue (Morgan and Liker 2006, Welo 2011), there are at least two factors repeatedly mentioned in the lean product development process, namely, waste and value. In the conceptual model developed, we want to view from other factors too. For example, the left part of the model shows that as we keep elimi-nating waste, the amount of efforts will reduce and the value added may increase. On the other hand, as firms keep trying to add value the effort or resource re-quirements also increase whereas waste may reduce. In general, these efforts are like force field analysis and the two factors oppose each other and these should be balanced and find the optimized solutions. However, the objective of the model is to show that values may not necessarily from waste elimination but it can be from other knowledge based activities like product innovation, knowledge and skilled developed through the entire product development process. In the model, the bro-ken line shows the extra value added without significant effort to eliminate waste. Lean as a foundation requires several optimization methods and tools for the bet-terment of lean product development process and subsequent decision making, for example System dynamics.
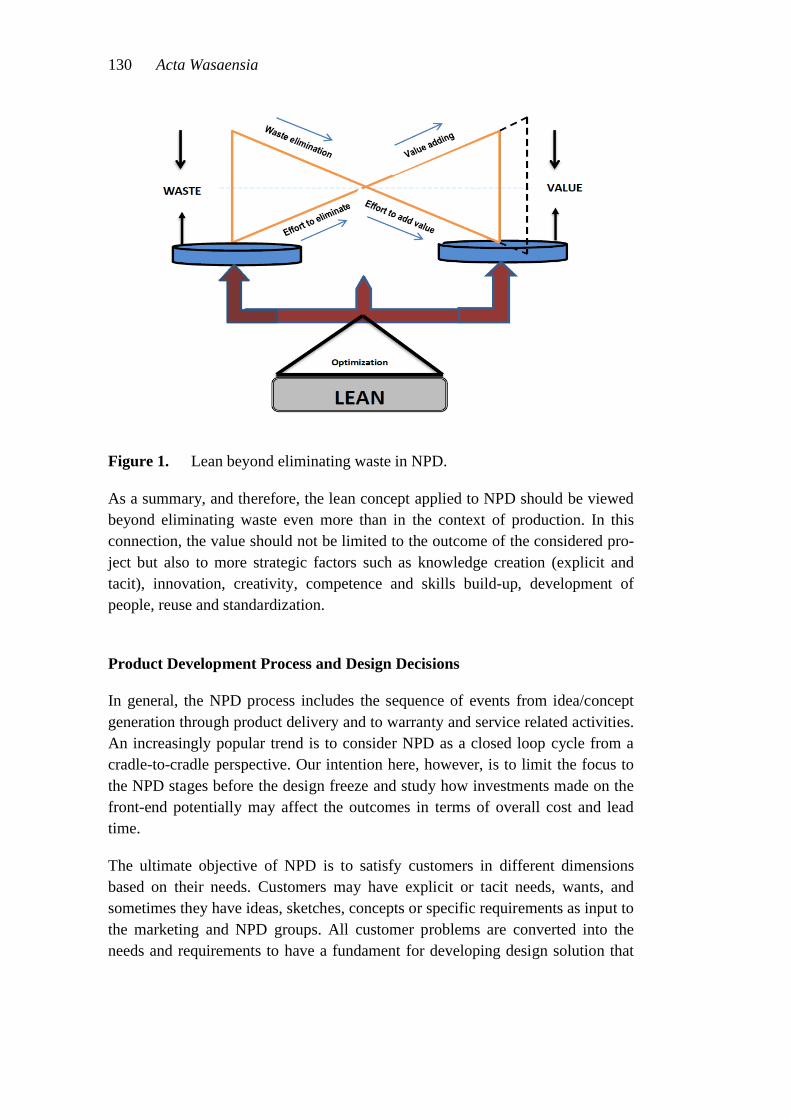
130 Acta Wasaensia
Figure 1. Lean beyond eliminating waste in NPD.
As a summary, and therefore, the lean concept applied to NPD should be viewed beyond eliminating waste even more than in the context of production. In this connection, the value should not be limited to the outcome of the considered pro-ject but also to more strategic factors such as knowledge creation (explicit and tacit), innovation, creativity, competence and skills build-up, development of people, reuse and standardization.
Product Development Process and Design Decisions
In general, the NPD process includes the sequence of events from idea/concept generation through product delivery and to warranty and service related activities. An increasingly popular trend is to consider NPD as a closed loop cycle from a cradle-to-cradle perspective. Our intention here, however, is to limit the focus to the NPD stages before the design freeze and study how investments made on the front-end potentially may affect the outcomes in terms of overall cost and lead time.
The ultimate objective of NPD is to satisfy customers in different dimensions based on their needs. Customers may have explicit or tacit needs, wants, and sometimes they have ideas, sketches, concepts or specific requirements as input to the marketing and NPD groups. All customer problems are converted into the needs and requirements to have a fundament for developing design solution that
Acta Wasaensia 131
solves the basic problem. Various methods are used to capture customer needs, covering the spectrum of anthropological approaches to blue print design.
The next stage after need capture is the concept development. To develop a de-sign with optimum performance, it is important to mitigate the risk through reuse of knowledge, test several alternatives (test-then-design, Kennedy 2007, 2008), start preliminary design and delay design freeze within the critical path of the project to capture as much learning as possible before final design decisions are made. The concept development stage may require preparation of a decision-making matrix for concept screening, scoring and ranking (‘Pugh-matrix’). The high ranking concept(s) is carried foreward to the next development. Product de-sign documentation has to be developed along other activities to ensure compli-ance to legalizations, codes, requirements and business goals, avoiding design re-loops. Resources are also required to develop and integrate suppliers in the NPD process; for example, long lead time items like hard tools have to be kicked be-fore the design is frozen. In the next development stage, different-level prototypes are manufactured, tested and cost and performance characteristics are compared with initial goals. When goals are satisfied, the NPD process continues to the manufacturing process (launch) and distribution; otherwise, a redesign loop is conducted.
In summary, due to the interdependencies and relations between various tasks in the NPD process, the cost of doing design changes increase along the develop-ment timeline. For the same reason, the risk associated with successfully carrying a change through the NPD system increases exponentially with the number of ‘nodes’ (as do the resources necessary to support the change activities.
Design is the crucial element in product development processes and designers are usually challenged to find design solutions that satisfy predefined constraints and meet the performance requirements. Optimization and design are inseparable in successful product development as the product is expected to be efficient and economical. Here, note that product development process is not an easy task and sometimes become a very complex process that needs comparing several feasible alternative designs. While designers looking for a feasible solution, iterative pro-cesses are imminent and solving the problems by optimization is a must. One of the decisive considerations while designing a new product is the know-how what to change and how to change and this may be sometimes dependent on the de-signers’ experiences and the availability of resources. In developing complex products, decisions in design are not easy and needs well defined optimization problem. Then, all variables that satisfy the objective function and all constraints are determined using an appropriate optimization process and tools. For example,
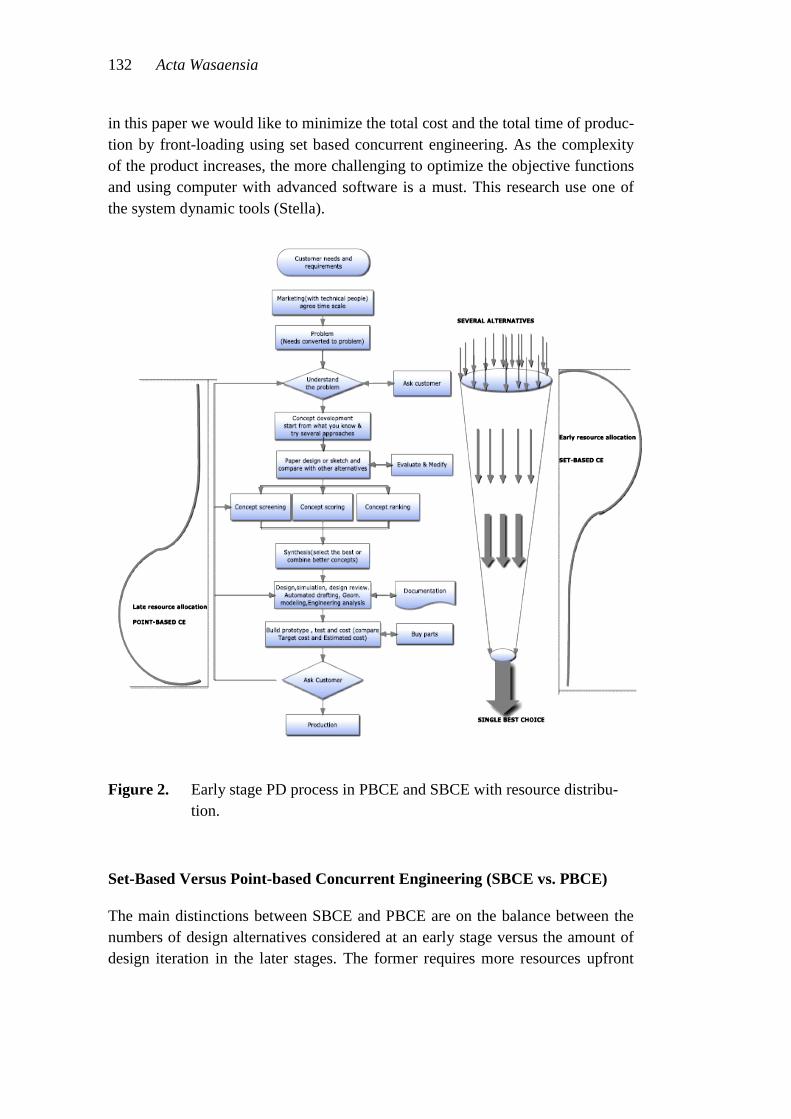
132 Acta Wasaensia
in this paper we would like to minimize the total cost and the total time of produc-tion by front-loading using set based concurrent engineering. As the complexity of the product increases, the more challenging to optimize the objective functions and using computer with advanced software is a must. This research use one of the system dynamic tools (Stella).
Figure 2. Early stage PD process in PBCE and SBCE with resource distribu-tion.
Set-Based Versus Point-based Concurrent Engineering (SBCE vs. PBCE)
The main distinctions between SBCE and PBCE are on the balance between the numbers of design alternatives considered at an early stage versus the amount of design iteration in the later stages. The former requires more resources upfront
Acta Wasaensia 133
but is somehow repetitive and simple, involving innovation in the system whiles minimizing risk compared to the latter. In SBCE, several alternatives are consid-ered and combined; the weak ones are successively eliminated while keeping one safe alternative based on past experience and knowledge. The better alternative, balancing business goals and customer requirements, is carried forward to the next stage. Another important feature of SBCE is its robustness and organization-al knowledge generating capability throughout the development processes. Raud-berget, (2010) found that SBCE has the positive effects on NPD process and product performances in terms of increased innovation capability, reduced prod-uct cost and improved product performance.
Ford and Sobek (2005) studied the set-based theory into a continuum of set-based development plans considering the time of convergence. In addition, they showed how PD managers face difficulties while making key decisions on how to con-verge from an initial set of conceptual ideas to one final design idea. For example, from the conceptual representation of point based and set based concurrent engi-neering (see Figure 3), we want to visualize in an understandable way the differ-ences between them and see the benefits of set based concurrent engineering through several alternatives.
In general, the main feature of SBCE is its convergences through time and differ-ent stages of the development processes. Belay et al. (2011) indicated that con-vergence of ideas is inevitable for creative NPD. Although the concept of conver-gence is the pillar in CE in which large scale collaboration thinking leads to un-derstand the ideas for innovation, market, and process and product knowledge, convergence should not be too fast or slow in one area and should be managed properly otherwise, the result would be very limited and difficult to obtain well engineered products. Products as well as processes are changing rapidly from one stage to another during the product development process and learning is factored until a distinct set of processes and products that can emerges into a highly com-petitive result.
In PBCE, there are very few alternatives at the beginning and perhaps only a sin-gle option considered in the product design process. When product teams face challenges or difficulties, modifications and redesign are required. In the iteration process extra resources in terms of people, time and cost are required. Too much iteration may not be economical and the further down the time line, the more costly and more difficult to move into a conceptually different alternative, forcing the NPD team into a reactive ‘fix’ mode with minimum organizational knowledge capture. If design iterations are done at an early stage with more buffers to the critical path of the project, however, iterations are a means to innovation since it
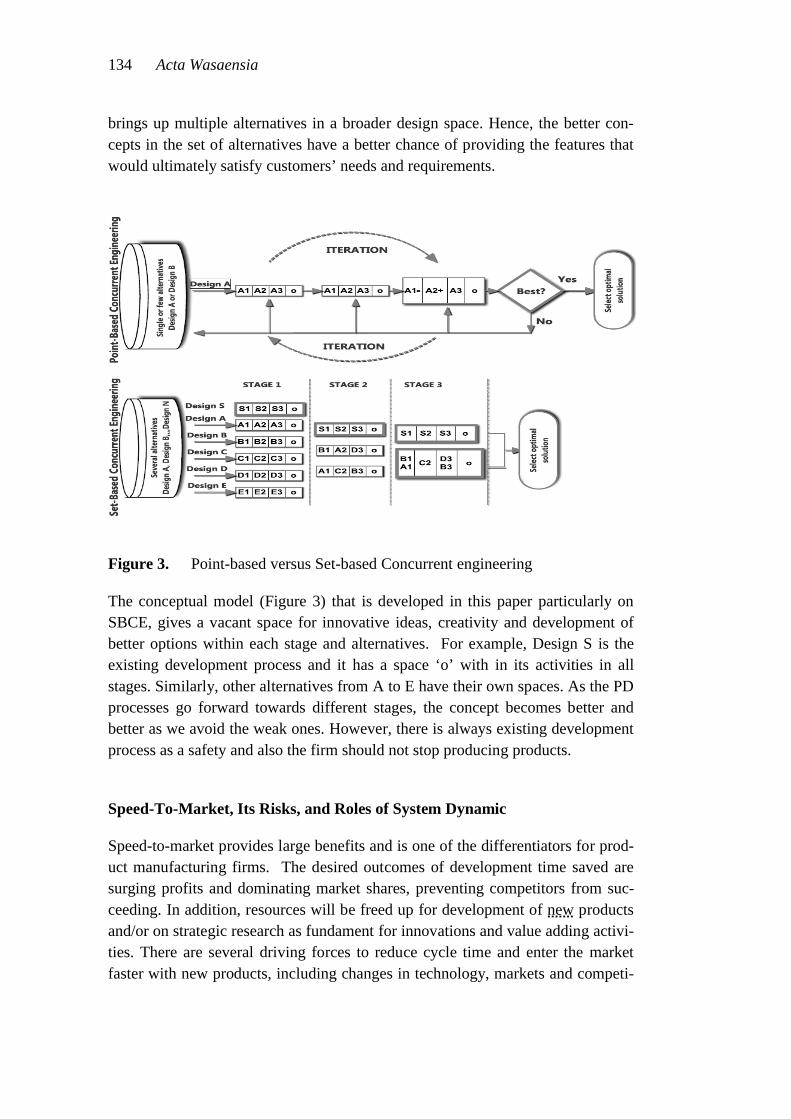
134 Acta Wasaensia
brings up multiple alternatives in a broader design space. Hence, the better con-cepts in the set of alternatives have a better chance of providing the features that would ultimately satisfy customers’ needs and requirements.
Figure 3. Point-based versus Set-based Concurrent engineering
The conceptual model (Figure 3) that is developed in this paper particularly on SBCE, gives a vacant space for innovative ideas, creativity and development of better options within each stage and alternatives. For example, Design S is the existing development process and it has a space ‘o’ with in its activities in all stages. Similarly, other alternatives from A to E have their own spaces. As the PD processes go forward towards different stages, the concept becomes better and better as we avoid the weak ones. However, there is always existing development process as a safety and also the firm should not stop producing products.
Speed-To-Market, Its Risks, and Roles of System Dynamic
Speed-to-market provides large benefits and is one of the differentiators for prod-uct manufacturing firms. The desired outcomes of development time saved are surging profits and dominating market shares, preventing competitors from suc-ceeding. In addition, resources will be freed up for development of new products and/or on strategic research as fundament for innovations and value adding activi-ties. There are several driving forces to reduce cycle time and enter the market faster with new products, including changes in technology, markets and competi-
Acta Wasaensia 135
tion. In such a complex and dynamic environment, it is mandatory to improve critical activities in the NPD process. Several studies have shown that increased speed to market requires continuous efforts on improving the early stages in NPD; see e.g. Thomke, and Fujimoto (2000). However, it is important to consider the opportunity cost and the risk level before going to decide speeding up the cycle time. In some cases, e.g., when increased speed lacks root in true NPD process improvements, cutting corners may lead to quality sacrifices which in turn may result in customer complaints and lost market shares.
Although firms exhaustively try to speed up their product development processes, especial attention should be given to the risks that are going to be encountered during this effort. In some cases, the cutting corners may lead to quality sacrifices and that in turn result so many complaints from customers and distributors. If once the customers drift to the competitors, it may be difficult to bring back and the payback period and cost would be very high. Since the ultimate objective of the PD is not only to win speed to market, due attention should be given to the consequences and how the firms should approach the development processes so launch their products faster. Otherwise, only focusing and extraordinary efforts only in speeding up the development cycle may be mishandled and finally the firm loses the opportunity of having new and novel products to the market. In addition to that, regardless of the firms’ endeavor from time to market, the possi-bility of producing technologically inferior products and missing some customer requirements are most likely to happen. To overcome such risks, it is important to make products more flexible and analyze systematically to balance both extremes, find optimized and successful products. We want to relate the risk in the context of minimizing the iteration and avoid early freezing of product concept by involv-ing several alternatives as much as possible. However, this requires careful analy-sis and system thinking to take advantage by using set based strategy.
System dynamics is a methodology for studying and managing complex systems (Ford and Sobek, 2005). Since the strategic business goal is to improve from pro-ject to project, optimizing the entire process rather than individual steps, we found system dynamics with its causal loop suitable for the present purpose such com-plex processes. Using system dynamics to analyze a complex project, Ford and Sterman (1998) concluded that a complete causal dynamic model is required to integrate the influences of processes, resources, scope and targets. Another appli-cation of system dynamics in a complex product development system has been presented by Lai (2008), who considered system dynamics in combination with support vector machine and rough set method, analyzing feedback loop to deter-mine the non-linear system dynamics. Ford (1999) showed that system dynamics
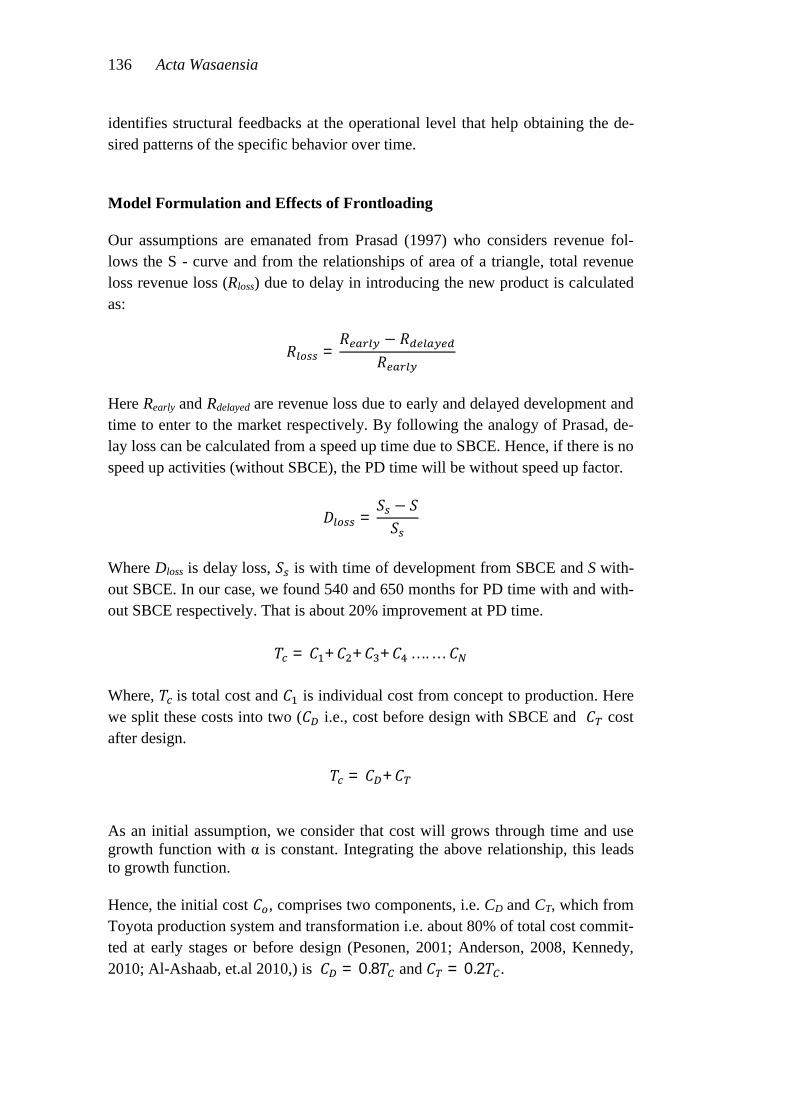
136 Acta Wasaensia
identifies structural feedbacks at the operational level that help obtaining the de-sired patterns of the specific behavior over time.
Model Formulation and Effects of Frontloading
Our assumptions are emanated from Prasad (1997) who considers revenue fol-lows the S - curve and from the relationships of area of a triangle, total revenue loss revenue loss (Rloss) due to delay in introducing the new product is calculated as:
=
Here Rearly and Rdelayed are revenue loss due to early and delayed development and time to enter to the market respectively. By following the analogy of Prasad, de-lay loss can be calculated from a speed up time due to SBCE. Hence, if there is no speed up activities (without SBCE), the PD time will be without speed up factor.
=
Where Dloss is delay loss, is with time of development from SBCE and S with-out SBCE. In our case, we found 540 and 650 months for PD time with and with-out SBCE respectively. That is about 20% improvement at PD time.
= + + + … . …
Where, is total cost and is individual cost from concept to production. Here we split these costs into two ( i.e., cost before design with SBCE and cost after design.
= +
As an initial assumption, we consider that cost will grows through time and use growth function with is constant. Integrating the above relationship, this leads to growth function.
Hence, the initial cost , comprises two components, i.e. CD and CT, which from Toyota production system and transformation i.e. about 80% of total cost commit-ted at early stages or before design (Pesonen, 2001; Anderson, 2008, Kennedy, 2010; Al-Ashaab, et.al 2010,) is = 0.8 and = 0.2 .
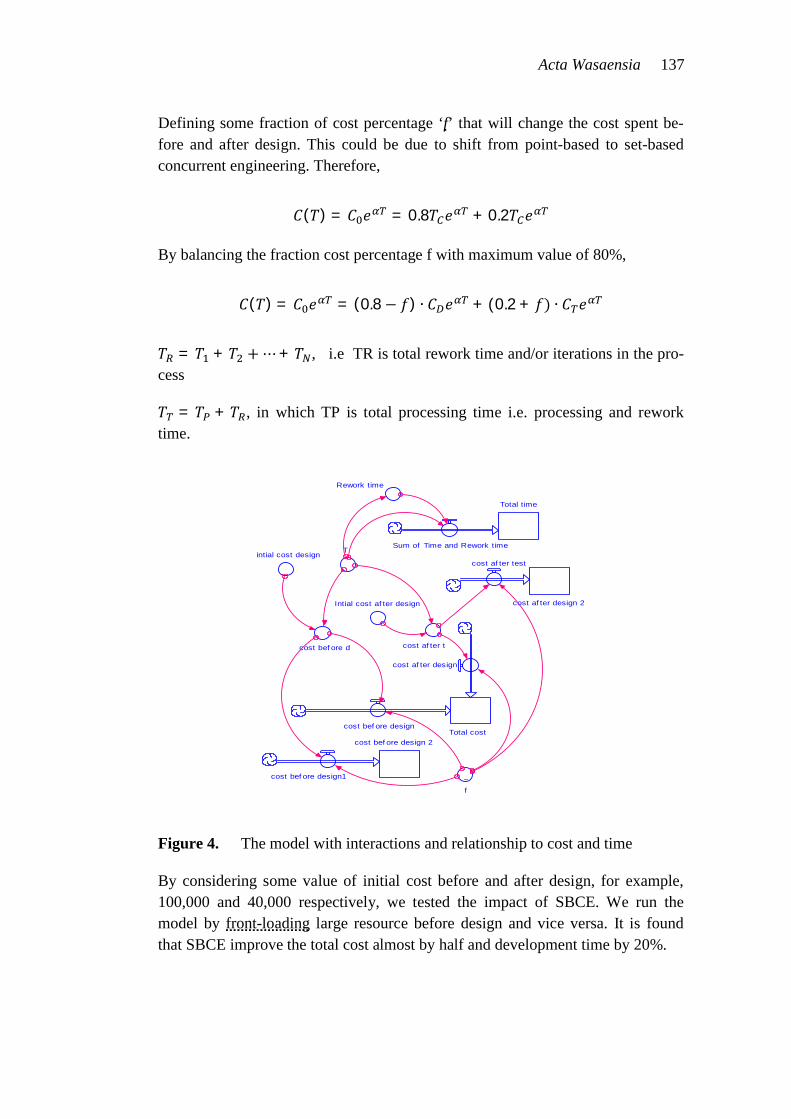
Acta Wasaensia 137
Defining some fraction of cost percentage ‘f’ that will change the cost spent be-fore and after design. This could be due to shift from point-based to set-based concurrent engineering. Therefore,
( ) = = 0.8 + 0.2 By balancing the fraction cost percentage f with maximum value of 80%,
( ) = = (0.8 ) + (0.2 +
= + + , i.e TR is total rework time and/or iterations in the pro-cess
= + , in which TP is total processing time i.e. processing and rework time.
Figure 4. The model with interactions and relationship to cost and time
By considering some value of initial cost before and after design, for example, 100,000 and 40,000 respectively, we tested the impact of SBCE. We run the model by front-loading large resource before design and vice versa. It is found that SBCE improve the total cost almost by half and development time by 20%.
Total cost
cost af ter design
cost bef ore design
~f
cost bef ore d cost af ter t
Tintial cost design
Rework time
Total time
Sum of Time and Rework time
Intial cost af ter design cost af ter design 2
cost af ter test
cost bef ore design 2
cost bef ore design1
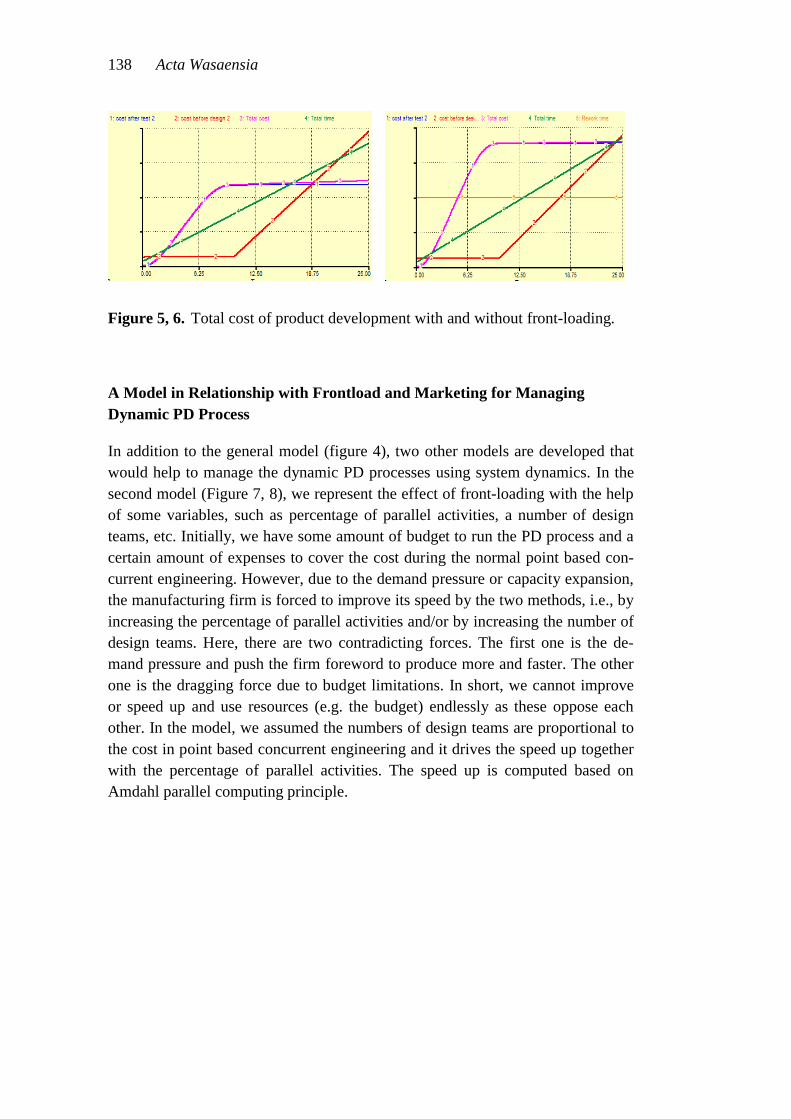
138 Acta Wasaensia
Figure 5, 6. Total cost of product development with and without front-loading.
A Model in Relationship with Frontload and Marketing for Managing Dynamic PD Process
In addition to the general model (figure 4), two other models are developed that would help to manage the dynamic PD processes using system dynamics. In the second model (Figure 7, 8), we represent the effect of front-loading with the help of some variables, such as percentage of parallel activities, a number of design teams, etc. Initially, we have some amount of budget to run the PD process and a certain amount of expenses to cover the cost during the normal point based con-current engineering. However, due to the demand pressure or capacity expansion, the manufacturing firm is forced to improve its speed by the two methods, i.e., by increasing the percentage of parallel activities and/or by increasing the number of design teams. Here, there are two contradicting forces. The first one is the de-mand pressure and push the firm foreword to produce more and faster. The other one is the dragging force due to budget limitations. In short, we cannot improve or speed up and use resources (e.g. the budget) endlessly as these oppose each other. In the model, we assumed the numbers of design teams are proportional to the cost in point based concurrent engineering and it drives the speed up together with the percentage of parallel activities. The speed up is computed based on Amdahl parallel computing principle.
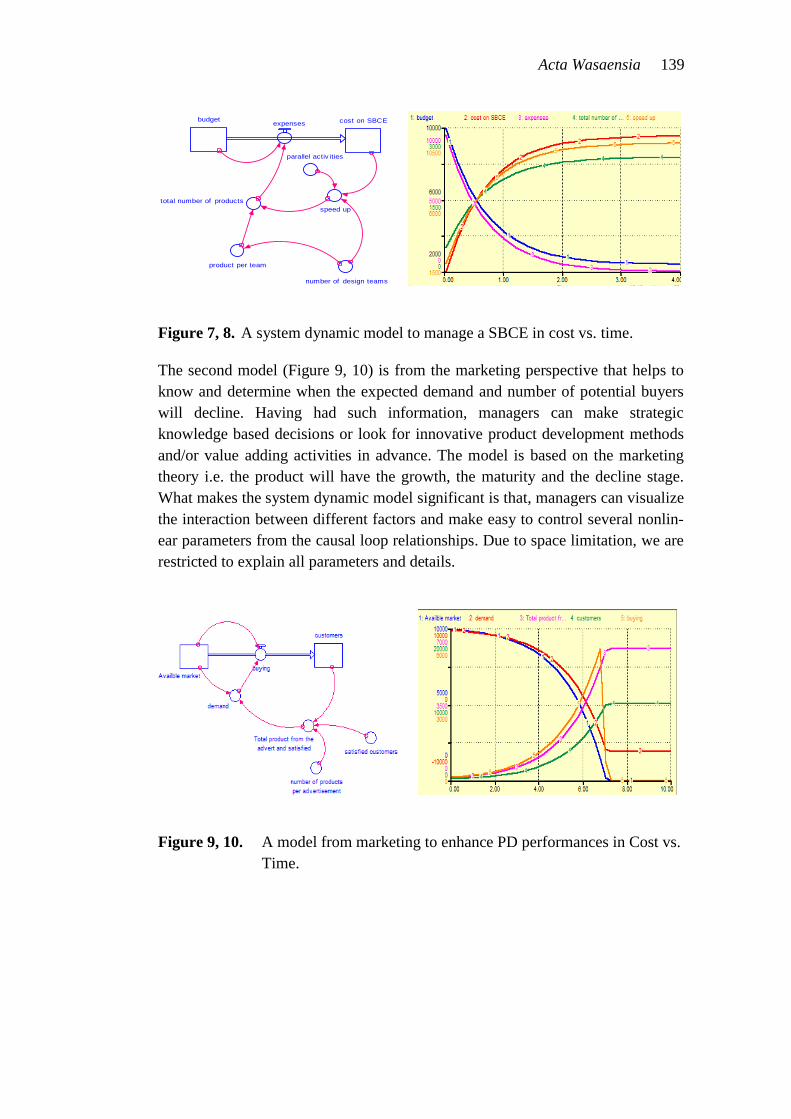
Acta Wasaensia 139
Figure 7, 8. A system dynamic model to manage a SBCE in cost vs. time.
The second model (Figure 9, 10) is from the marketing perspective that helps to know and determine when the expected demand and number of potential buyers will decline. Having had such information, managers can make strategic knowledge based decisions or look for innovative product development methods and/or value adding activities in advance. The model is based on the marketing theory i.e. the product will have the growth, the maturity and the decline stage. What makes the system dynamic model significant is that, managers can visualize the interaction between different factors and make easy to control several nonlin-ear parameters from the causal loop relationships. Due to space limitation, we are restricted to explain all parameters and details.
Figure 9, 10. A model from marketing to enhance PD performances in Cost vs. Time.
budget cost on SBCEexpenses
speed uptotal number of products
parallel activ ities
number of design teams
product per team
140 Acta Wasaensia
Findings and Conclusion
We use a hypothetical value (cost) to test the models developed. First, we as-sumed few resources assigned in the early stage and more resources assigned after the design stage. Then we interchanged the case and compared the results. Based on the model in Figure 4, the results are shown in Figures 5 and 6:
Within the scope of the assumptions made, front-load (e.g. using SBCE) in NPD reduces the total cost by more than half and improve lead time by 20%, resulting in a proportional delay loss when loading resources in the later stage. That may result in lost opportunities in the market place.
From the result, the general trends of the cost curves are somehow similar to that of the literature (Anderson 2008) and Toyota (Pesonen 2001).
We analyzed the second model (Figure 7, 8) by varying different parameters for example, increasing the number of teams in order to see the overall impact. It was found that, we cannot improve continuously the whole PD processes using a few parameters since we have the resource limitations i.e. budget. However, the mod-el can give an insight to see the optimal solution.
From the last model in relation to marketing (Figure 9, 10), we consider a 10 year product development situation and the result shows beginning of the 7th year the managers should look for sound improvement methods because of the decline in buying and the potential market is almost exploited. As a solution, the managers could go for innovative PD, apply Set based concurrent engineering, etc.
From the results we can conclude that; If SBCE is analyzed systematically using system dynamics, it will reward significant benefits in terms of reduced cost and lead time. Analyzing the effect of SBCE on product quality in beyond the scope of the present work, we believed that exploring the design space with multiple alternatives will have a positive impact on product quality as well if we measure quality in terms of rework rate. Front-loading is one of the core components in LPD and if successfully implemented, firms could be benefited from this strategy. This paper provides three models and analyzes using a system dynamic approach that shows the interrelationships between different parameters. We believe a con-ceptual model developed for SBCE and PBCE will help to understand the differ-ences between the two approaches. As a limitation, the model should be tested in practice and it may give better results by considering more parameters and dimen-sions, for e.g. Quality. The future work will be combining all these models that are treated separately and develop a holistic model that gives an outlook for saga-cious decision making.
Acta Wasaensia 141
References
Al-Ashaab et al. (2010). The Conceptual Lean PPD Model, the 17th ISPE Inter-national Conference on Concurrent Engineering, CE2010, 6–10 September, Cra-cow, Poland.
Anderson, D.M. (2008). How to Design for Low Cost, Design in High Quality, Design for Lean Manufacture, and Design Quickly for Fast Production’, Design for Manufacturability & Concurrent Engineering. Cambria, California: CIM Press.
Belay, et al. (2011).Time to market and concurrent engineering in product de-velopment processes. International Journal of Innovation and Learning 10, 68–84.
Bicheno, J. (2004). The New Lean Toolbox: Towards Fast, Flexible Flow (3rd ed.). Buckingham: PICSIE Books.
Dennis, P. (2002). Lean Production Simplified: A Plain Language Guide to the World's Most Powerful Production System. New York: Productivity Press.
Dombrowski, et al. (2011). State of the Art – Lean Development. 21st CIRP De-sign Conference, KAIST, Daejeon, Korea, 27–29 March.
Ford, D.N. & Sobek II, D.K. (2005). Adapting real options to new product devel-opment by modelling the Second Toyota Paradox. IEEE Transactions on Engi-neering Management 52:2, 175–185.
Ford, D.N. & Sterman, J.D. (1998). Dynamic Modeling of Product Development Processes. System Dynamics Review 14:1, 31–68.
Karlsson, C. & Ahlström, P. (1996). The difficult path to lean product develop-ment. Journal of Product Innovation Management 13, 283–295.
Kennedy, D. (2010). Engineering Design and Development. First International Conference in Mechanical Technology and Structural Materials, MTSM 2010, Split, 21–22 October.
Kennedy, et al. (2008). Ready, Set, Dominate: Implement Toyota’s Set-Based Learning for Developing Products and Nobody Can Catch You! Oaklea Press.
Morgan & Liker (2006). The Toyota Product Development System: Integrating People, Process and Technology. New York: Productivity Press.
Pesonen (2001). Implementation of Design to Profit in a Complex and Dynamic Business Context. Academic Dissertation, Dept of Process and Environmental Eng, Univ. of Oulu, Finland.Accessed30.4.2012 http://herkules.oulu.fi/isbn 9514264509/isbn9514264509.pdf.
142 Acta Wasaensia
Pettersen, J. (2009). Defining Lean production: some conceptual and practical issues. TQM J. 21, 127–142.
Prasad, B. (1997). Analysis of pricing strategies for new product introduction. Journal of Product & Brand Management 5: 4, 132–141.
Raudberget, D. (2010). Practical applications of set-based concurrent engineering in industry Strojniški vestnik. Journal of Mechanical Engineering 56:11, 685–695.
Sobek, W., Ward, A.C. & Liker, J.K. (1999). Toyota's principles of set-based concurrent engineering. Sloan Management Review 40:2, 67–83.
Sterman, J.D. (2000). Business Dynamics: systems thinking and modeling for a complex world, New York: Irwin McGraw-Hill.
Thomke & Fujimoto (2000). The e ect of front-loading problem-solving on product development performance. Journal of Product Innovation Management 17:2, 128–142.
Welo, T. (2011). On the application of lean principles in product development: a commentary on models and practices. International Journal of Product Develop-ment 13:4, 316–343.
Würtemberg, et al. (2011). Abstract model of LPD: A critical review of the lean product development concept. Proceedings of PICMET '11: Technology Man-agement in the Energy-Smart World (PICMET).
Acta Wasaensia 143
286 Int. J. Sustainable Economy, Vol. 5, No. 3, 2013
Copyright © 2013 Inderscience Enterprises Ltd.
Scaled critical factor index for optimal resource allocation in service and lean construction
Alemu Moges Belay*, Josu Takala and Rayko Toshev Department of Production Technology/Industrial Management, University of Vaasa, FI-65101, Vaasa, Finland E-mail: [email protected] E-mail: [email protected] E-mail: [email protected] *Corresponding author
Bjørn Andersen Norwegian University of Science and Technology, S.P. Andersens veg 5, Trondheim, Norway E-mail: [email protected]
Abstract: Service and construction require large resource, thus there is a need for a comprehensive method for optimal resource allocation. The purpose of this study is to develop and use scaled critical factor index (SCFI) for sustainable resource allocations in a service provision company and a lean construction project. In this research, 160 questionnaires were distributed and the response rate was 48%. Different statistical process control charts were incorporated in the analysis to avoid subjective decisions. The pitfalls of the previous CFI model are explained and improved. The managers identified areas to be improved and developed an insight into how to balance the resources. Results were validated by plotting an implementation index versus relative importance and it was found that the results are in line with the literature. SCFI enables seeing the relative differences in resource allocation under all conditions and helps managers to allocate resource in a more sustainable way.
Keywords: scaled critical factor index; SCFI; service; lean construction; concurrent engineering; CE; sustainable allocation of resource; customer satisfaction.
Reference to this paper should be made as follows: Belay, A.M., Takala, J., Toshev, R. and Andersen, B. (2013) ‘Scaled critical factor index for optimal resource allocation in service and lean construction’, Int. J. Sustainable Economy, Vol. 5, No. 3, pp.286–306.
Biographical notes: Alemu Moges Belay is a PhD researcher/student at University of Vaasa, Finland. He has industrial experiences and published peer reviewed international journals and conferences proceedings. Reviewed several peer reviewed international journals and conference papers. He received best student research paper prize and award from CE2011 Conference at MIT, Boston, USA. Exchange in Norwegian University of Science and Technology
144 Acta Wasaensia
Scaled critical factor index for optimal resource allocation in service 287
(NTNU). His research areas cover concurrent engineering, lean product development and product life cycle, decision making, performance measurement, statistical process control, technology management, system dynamics, sustainable development, manufacturing, service and energy business.
Josu Takala is a Professor of Industrial Management (IM) and has been a Research Professor at the University of Vaasa and Academy of Finland. He recently is conducting a research on global manufacturing strategies. He graduated at Tampere University of Technology in DrTech, worked in ABB (R&D and QA in automation), Adjunct Professor of IM in several universities (Aalto, Jyväskylä Oulu and National Defence) in Finland, and a Visiting Professor in Slovakia, Thailand, Malaysia and China. He worked for several scientific forums and global businesses. He has been a Chairman of international society productivity and quality research and published about 500 scientific articles and some books.
Rayko Toshev received his MSc Management of Information Technologies from Sofia University, Bulgaria and MSc International Finance degree from University of Vaasa, Finland. He is currently acting as a project researcher in cooperation with TEKES – the Finnish Funding Agency for Technology and Innovation and is teaching operation strategies, technology management and ERP-SAP courses at University of Vaasa. His professional interests focus on strategic innovation practices in technology business, and his current projects include decision support system implementing critical performance indicators in real estate sector. He was recently honoured with grant from Evald and Hilda Nissi and Marcus Wallenberg foundations.
Bjørn Andersen is a Professor of Quality and Project Management at the Norwegian University of Technology and Science and Research Manager at SINTEF Technology and Society, has co-authored around 20 books and numerous papers for international journals and conferences. He has managed and been involved in several national and international research and implementation projects. He serves as the Director of the Norwegian Centre of Project Management, is an Academic in the International Academy of Quality, is co-editor of the International Journal of Production Planning and Control and reviewer for several other journals and conferences, and directs the NTNU master programme in mechanical engineering.
1 Introduction
To survive in the existing dynamic global market, all stakeholders should defy unbalanced resource allocation and utilisation. This would be significant in the booming but challenging businesses that encompass several interdependent activities, such as, service and construction. These businesses need large capital investments and play a significant role in the economy. The relevance of optimal resource allocation has been studied by several researchers and they have proposed different complex methods that require much time and deep mathematical know-how (Kallitsis et al., 2007; Faniran et al., 1999). However, these businesses require fast, simple, quality and reliable tools and methods to identify the critical factors while allocating resources.
Acta Wasaensia 145
288 A.M. Belay et al.
The general scope of the paper is to give an overview of how optimal resource allocation can be achieved using improved critical factor index (CFI) to satisfy customers in service and construction businesses. Indeed, customers want to get services and products at lower price, with better quality and delivered on schedule, which is exactly the same as fulfilling the definition of concurrent engineering (CE) by Winner et al. (1988). However, it is not easy to achieve this and it requires resources and optimal decision making. For example, finding optimal solutions in a time-based strategy is crucial and Stalk and Hout (1990) considered time as a resource and it is the equivalent of money, productivity, quality, and even innovation. Our objective here is to connect resources, CE and lean in a way Huovila and Koskela (1998) considered and further to use scaled critical factor index (SCFI) to support the knowledge-based resource allocations. Huovila and Koskela (1998) studied the contribution of the principles of lean construction and CE to meet the challenges of sustainable development using three views; conversion view (conventional engineering which is essentially to meet the requirements), flow and value generation view (for lean and CE which are entitled for waste elimination, minimisation of resource depletion, etc.).
Nowadays, service and construction have become an increasingly important part of national and global economy. Enhancing service productivity and construction performance is crucial to sustaining the economy as these sectors become more knowledge-based and competition gets even more intense. Substantial studies show that excellent service is widely recognised as a decisive factor in different business environments (Voss et al., 2004; Vilares and Coehlo, 2003). According to Newman and Cowling (1996), the service sector quality is “essential to corporate profitability and survival” and Rosen et al. (2003) described service as “not just a corporate offering, but a competitive weapon”. Voss et al. (2002) and Johnston (1995) indicated the complexity of service quality and that there is no clear picture of the drivers for delivering this in an effective way. However, globalisation advances in information technology, etc., cause changes in the nature of competition in services and construction. That is why managers are striving to have an appropriate tools and methods that fit with the changes and make knowledge-based decisions on resource allocations accordingly.
Making a sensible choice for resource allocation in a particular system of activities to improve service and construction processes is a complex task. More often managers have to make decisions based on information on expectations of service levels and that may create information gaps and affect the entire decision-making. Similar information gap theory but in different applications was studied by Duncan et al. (2008). Based on the information gap theory and to attempt filling the gap, we looked holistically into the companies’ performance in both the service and construction processes and assessed their expectations and experiences by going through the entire processes. This requires flexible strategy orientation combined with proactive identification and assessment of relevant attributes and concepts. Therefore, the organisations could have an overview about the current situation, future improvement and development possibilities; especially on identifying the critical factors for optimal resource allocations and apply appropriate tools and methods to sustain its competitiveness. In general, using tools and methods that would help for making knowledge-based decision are necessary.
CFI is one of these tools that can be used to identify the critical attributes of the business process based on experiences, expectations and competitor’s performances (Ranta and Takala, 2007). The attempt is to assure and sustain operational and strategic effectiveness that is reflected in service and construction, specifically in terms of resource
146 Acta Wasaensia
Scaled critical factor index for optimal resource allocation in service 289
allocation that would directly or indirectly influences customer satisfaction. The method designates resource flexibility and would help to ensure sustainability in the firms’ performance and finally deliver services and products to the customers that meet their requirements and specifications.
Although CFI is developed to identify critical factors and make knowledge-based decision in a comprehensive way, it has its own weaknesses. For example, CFI does not produce any results if the value is zero even though we use some resources in the processes; it has no objective method to categorise and identify the three distinct areas of attributes that use optimum resources, larger resources, and little resources. The paper attempts to fill the gap, which is proposed, by Ranta and Takala (2007) in their case study about further development of the CFI in order to improve the reliability of the findings and related developments of the method. In this study, the method is improved by avoiding zero CFI using the sample error correction and the use of control limits to identify the most critical attributes. Furthermore, we apply emphasised implementation index (IMPL), validate its consistency in the present cases and compare the results with the previous study. The study tries to develop and extend the method and relate it with simple forecasting methods to predict the future situations. The overall purpose of the study is to improve the CFI method and use to identify the critical factors that affect resource allocation. The paper also wants to see if there are any inconsistencies while using this approach on service and construction projects. Beyond method development, optimal resource allocation will help sustain firm’s competitiveness and it will give managers opportunity to make decisions proactively to satisfy their customers.
2 Methodology
From an application point of view we have two broad categories of research; pure and applied research, and our study belongs to the latter, to solve a specific, practical problem, i.e., identifying the critical factors for appropriate resource allocation. The study is conducted using a mixed research paradigm that uses both qualitative and quantitative methods. Morgan (1998) and Sale et al. (2002) have studied the practical and strategic advantages of combining these two approaches and Johnson and Onwuegbuzie (2004) presented the strength and weaknesses of all strategies. Taking into account their inherent weaknesses and strengths, we followed this combined strategy in our research.
Based on the project documents, records, interviews and discussions we developed and distributed a questionnaire that encompassed tailored, significant attributes for each case, as each case study has different characteristics since they belong respectively to the service and the construction industry. In the first case, we obtained an ample amount of respondents with a response rate of 48% whereas in the second case, we carried out a pilot survey that requires sample error correction as the sample size was smaller. The model in this research is modified by adding sample error correction, incorporated with other methods like statistical process control charts, sensitivity and forecasting techniques that were not included in the previous model and studies.
The rationale to select the case companies has been to assess the application of SCFI in service and construction that have challenges in meeting their leanness to their customers. Thus, we have utilised one construction project that saw delays in the earlier phases of construction (the Norwegian St. Olavs Hospital project) and a Finnish service
Acta Wasaensia 147
290 A.M. Belay et al.
company that experienced challenges in delivering services to customer. The attributes were taken from previous improvement efforts in both cases.
3 Revising related concepts, drivers for attributes, and contexts for resource allocation
In this section, we would like to discuss some relevant concepts that are related to resource allocation, thus discussing relevant literature.
3.1 The roles of operation and strategic methods for sustainable resource allocation
Some literature has presented the debate between manufacturing and service in terms of their contribution to sustainable development. According to Daniel (1999), Arthur (1996) and Demsetz (1973) manufacturing is more capital intensive, larger in size, more productive, more tradable, and with increasing returns, unlike service with constant returns. On the other hand some studies, for example by Pitelis and Antonakis (2003), showed a de-industrialisation in the structure of demand and this argument is in favour of services, as incomes increase. The third argument is the criticism of the first two for example; Pitelis and Antonakis (2003) presented the possibility and tendency of new technologies to increase the productivity of services, so that services can be characterised by increasing returns. In general, we observed three categories in the broader sense of their contribution to sustainability: some are in favour of manufacturing; some stand with services and the rest criticise both manufacturing and services and view them an interdependent. In this paper, sustainability is about time and the effect that today’s decisions will have tomorrow (Chichilnisky, 2011).
Pitelis and Antonakis (2003) indicated that new technology, tools, methods, and strategy matters. For example, as manufacturing and construction grow, there could be a possibility to expand services and vice versa and naturally there would be knowledge sharing and adoption of best practices, new methods, strategies, etc. This indeed helps for the overall growth and sustainable economy. Here, for instance, we can consider the methods and tools that are already well-established approaches for time-based strategy like CE and the newly introduced SCFI method.
Since the 1980s, several researchers studied CE, lean and related technical engineering improvement methods. However, most of these methods are applied in manufacturing and construction industries and less effort has been done to apply them in services. Others, such as quality function deployment (QFD), balanced scorecard (BSC), and service quality have been used in services. For example, Martin et al. (1998) applied CE in delivering successful service and outsourcing projects. Nowadays, there is a tendency of moving from manufacturing to service and vice versa and at the same time enhancing their continuous and sustainable improvement methods. For example, Phusavat et al. (2008) claimed that the focus on industries, from manufacturing firms to service providers, has begun to shift. In our study, we wanted to follow this up adopting proven manufacturing improvement methods (mostly technical) to the service sector and vice versa. Indeed, there are some important CE concepts for services, such as,
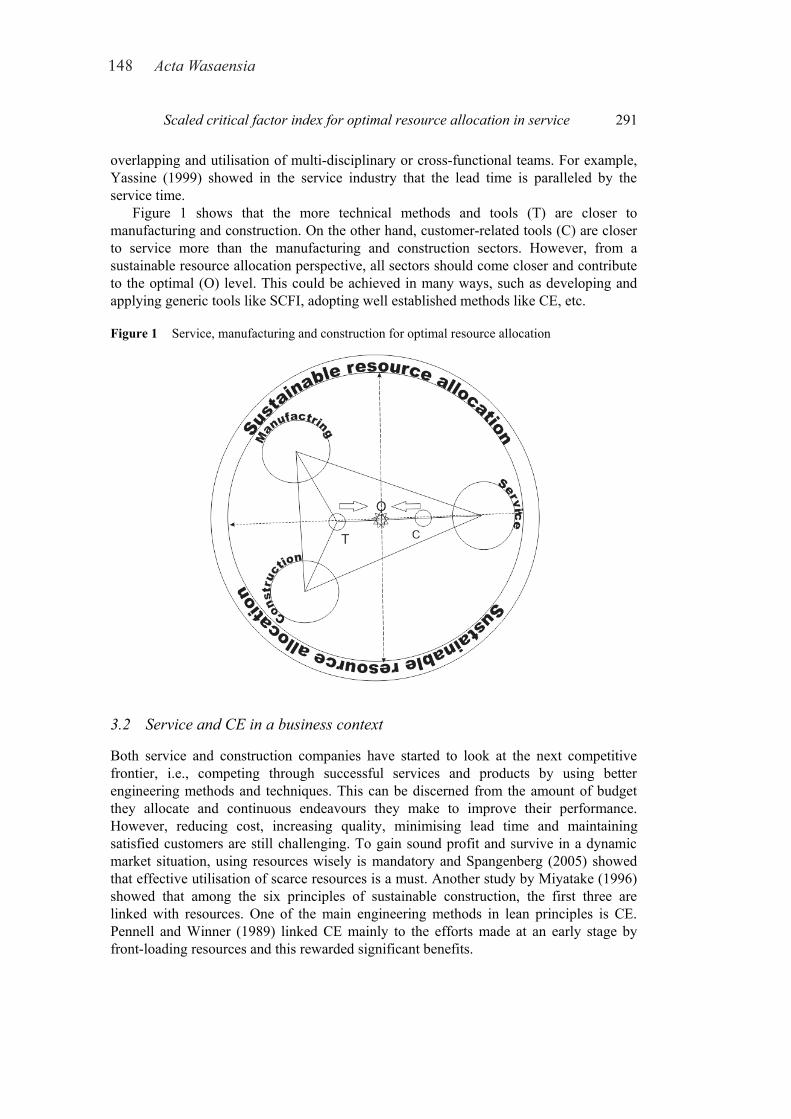
148 Acta Wasaensia
Scaled critical factor index for optimal resource allocation in service 291
overlapping and utilisation of multi-disciplinary or cross-functional teams. For example, Yassine (1999) showed in the service industry that the lead time is paralleled by the service time.
Figure 1 shows that the more technical methods and tools (T) are closer to manufacturing and construction. On the other hand, customer-related tools (C) are closer to service more than the manufacturing and construction sectors. However, from a sustainable resource allocation perspective, all sectors should come closer and contribute to the optimal (O) level. This could be achieved in many ways, such as developing and applying generic tools like SCFI, adopting well established methods like CE, etc.
Figure 1 Service, manufacturing and construction for optimal resource allocation
3.2 Service and CE in a business context
Both service and construction companies have started to look at the next competitive frontier, i.e., competing through successful services and products by using better engineering methods and techniques. This can be discerned from the amount of budget they allocate and continuous endeavours they make to improve their performance. However, reducing cost, increasing quality, minimising lead time and maintaining satisfied customers are still challenging. To gain sound profit and survive in a dynamic market situation, using resources wisely is mandatory and Spangenberg (2005) showed that effective utilisation of scarce resources is a must. Another study by Miyatake (1996) showed that among the six principles of sustainable construction, the first three are linked with resources. One of the main engineering methods in lean principles is CE. Pennell and Winner (1989) linked CE mainly to the efforts made at an early stage by front-loading resources and this rewarded significant benefits.
Acta Wasaensia 149
292 A.M. Belay et al.
3.3 Drivers for service and lean construction attributes
Recently, all types of businesses, including service and construction, have come under extreme pressure to provide services to the customers quicker than ever before. The ‘sense and response’ approach aims at capturing the voice of the customers and their requirements for products and services. The sense and response method, which has been studied by Ranta and Takala (2007), is developed by considering the analogy of digital signal processing/impulse response.
Contemporary approaches to services and construction identify the power of customer delight. It brings customers coming back for more, creates interest in new customers and distinguishes your company from the competition. At the same time, to be able to sustain such effect, one needs deep expertise in sensing customer behaviour and responding accordingly by employing value adding activities. Forss and Toshev (2011) listed some of the steps for enhancing the client’s experience, for example, respond to messages promptly, friendly communications define and apply clear customer service policy, etc.
Minimising the topmost resource wastes of services and reducing complaints from customers is a continuous and consistent endeavour. Major challenges in services are to identify, analyse and develop the capability to control resource waste in a systematic way. Seven industrial wastes were identified by Ohno (1988) and these numbers were extended into eight by So (2010) in his study of adopting lean principles as a sustainable manufacturing strategy. Some of the wastes are over processing, transportation, motion, inventory, waiting time, defects, over-production, and information. One of the motives of this paper is to introduce the possibility of reducing resource waste by optimal resource allocation based on the critical level of each attribute. Having well-defined attributes, SCFI can aid appropriate and timely decisions.
The decision making process in this paper is linked with sustainable allocation of resources that is distributed into several attributes. According to Higginson and Vredenburg (2010) and Prahalad and Hamel (1994), the main responsibility of managers is the allocation of scarce resources in a sustainable manner among competing demands in order to meet the goals of the company. Hence, the application of SCFI in this paper will support managers in identifying the critical factors for better utilisation of scarce resources.
3.4 Decision making processes of resource allocations in complex environments
Real economic efficiency implies and includes all resources that affect sustainable allocation systems (Costanza, 2009). Sustainable resource allocation is very important in both static and dynamic decisions. Managing and making appropriate decisions have become challenging since customers’ and the stakeholders’ satisfaction levels are unpredictable and dynamic in nature. According to Brehmer (1992) and Kleinmuntz (1993) static decisions are made once and do not have consequences whereas the dynamic ones have a series of linked consequences and the outcomes of the pervious decisions alter the latter. Service-providing firms and construction industries have complex activities and processes that need knowledge-based decisions. In most cases, decision making on resource allocation has a causal connection with other strategies so that a little mistake due to lack of knowledge may not only lead to ineffective decisions but also be disastrous for the well-being of the firms. Having this in mind, a method like
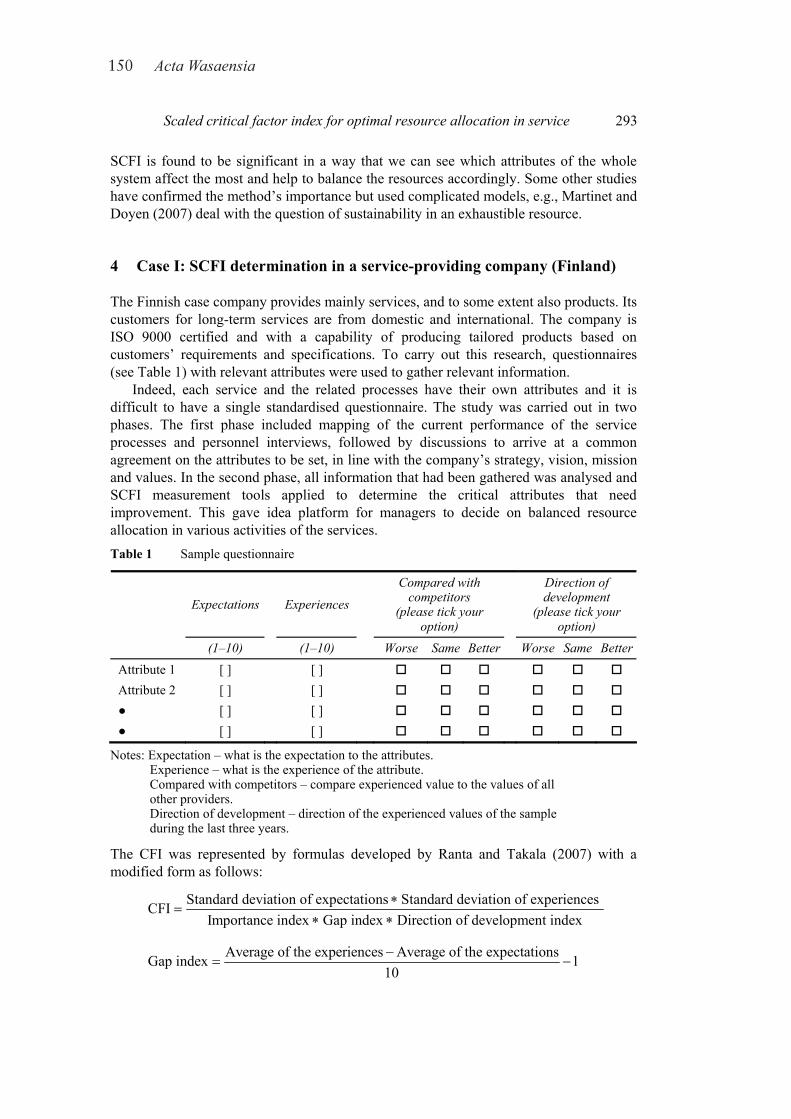
150 Acta Wasaensia
Scaled critical factor index for optimal resource allocation in service 293
SCFI is found to be significant in a way that we can see which attributes of the whole system affect the most and help to balance the resources accordingly. Some other studies have confirmed the method’s importance but used complicated models, e.g., Martinet and Doyen (2007) deal with the question of sustainability in an exhaustible resource.
4 Case I: SCFI determination in a service-providing company (Finland)
The Finnish case company provides mainly services, and to some extent also products. Its customers for long-term services are from domestic and international. The company is ISO 9000 certified and with a capability of producing tailored products based on customers’ requirements and specifications. To carry out this research, questionnaires (see Table 1) with relevant attributes were used to gather relevant information.
Indeed, each service and the related processes have their own attributes and it is difficult to have a single standardised questionnaire. The study was carried out in two phases. The first phase included mapping of the current performance of the service processes and personnel interviews, followed by discussions to arrive at a common agreement on the attributes to be set, in line with the company’s strategy, vision, mission and values. In the second phase, all information that had been gathered was analysed and SCFI measurement tools applied to determine the critical attributes that need improvement. This gave idea platform for managers to decide on balanced resource allocation in various activities of the services. Table 1 Sample questionnaire
Expectations Experiences
Compared with competitors
(please tick your option)
Direction of development
(please tick your option)
(1–10)
(1–10)
Worse Same Better Worse Same Better
Attribute 1 [ ] [ ] Attribute 2 [ ] [ ] ● [ ] [ ] ● [ ] [ ]
Notes: Expectation – what is the expectation to the attributes. Experience – what is the experience of the attribute. Compared with competitors – compare experienced value to the values of all other providers. Direction of development – direction of the experienced values of the sample during the last three years.
The CFI was represented by formulas developed by Ranta and Takala (2007) with a modified form as follows:
Standard deviation of expectations Standard deviation of experiences CFIImportance index Gap index Direction of development index
∗=
∗ ∗
Average of the experiences Average of the expectationsGap index 110−
= −
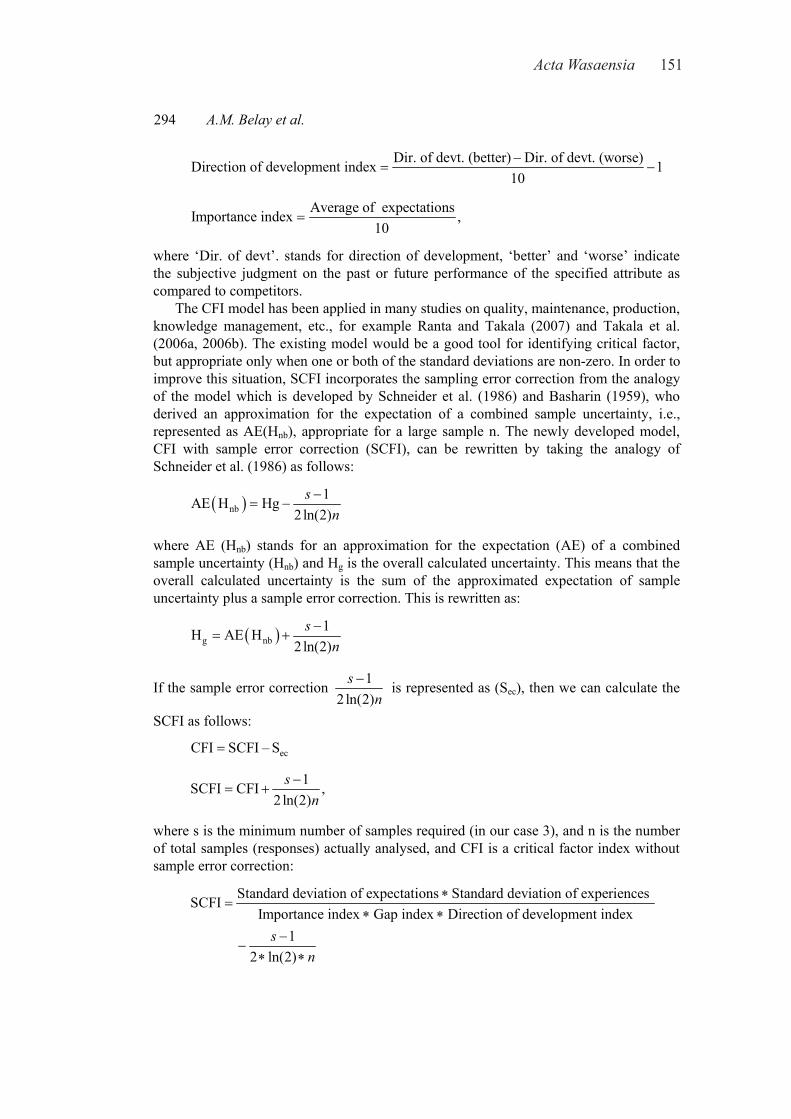
Acta Wasaensia 151
294 A.M. Belay et al.
Dir. of devt. (better) Dir. of devt. (worse)Direction of development index 110−
= −
Average of expectationsImportance index ,10
=
where ‘Dir. of devt’. stands for direction of development, ‘better’ and ‘worse’ indicate the subjective judgment on the past or future performance of the specified attribute as compared to competitors.
The CFI model has been applied in many studies on quality, maintenance, production, knowledge management, etc., for example Ranta and Takala (2007) and Takala et al. (2006a, 2006b). The existing model would be a good tool for identifying critical factor, but appropriate only when one or both of the standard deviations are non-zero. In order to improve this situation, SCFI incorporates the sampling error correction from the analogy of the model which is developed by Schneider et al. (1986) and Basharin (1959), who derived an approximation for the expectation of a combined sample uncertainty, i.e., represented as AE(Hnb), appropriate for a large sample n. The newly developed model, CFI with sample error correction (SCFI), can be rewritten by taking the analogy of Schneider et al. (1986) as follows:
( )nb1AE H Hg
2ln(2)s
n−
= −
where AE (Hnb) stands for an approximation for the expectation (AE) of a combined sample uncertainty (Hnb) and Hg is the overall calculated uncertainty. This means that the overall calculated uncertainty is the sum of the approximated expectation of sample uncertainty plus a sample error correction. This is rewritten as:
( )g nb1H AE H
2ln(2)s
n−
= +
If the sample error correction 12 ln(2)
sn
− is represented as (Sec), then we can calculate the
SCFI as follows:
ecCFI SCFI – S=
1SCFI CFI ,2 ln(2)
sn
−= +
where s is the minimum number of samples required (in our case 3), and n is the number of total samples (responses) actually analysed, and CFI is a critical factor index without sample error correction:
Standard deviation of expectations Standard deviation of experiences SCFIImportance index Gap index Direction of development index
1 2 ln(2)
sn
∗=
∗ ∗−
−∗ ∗
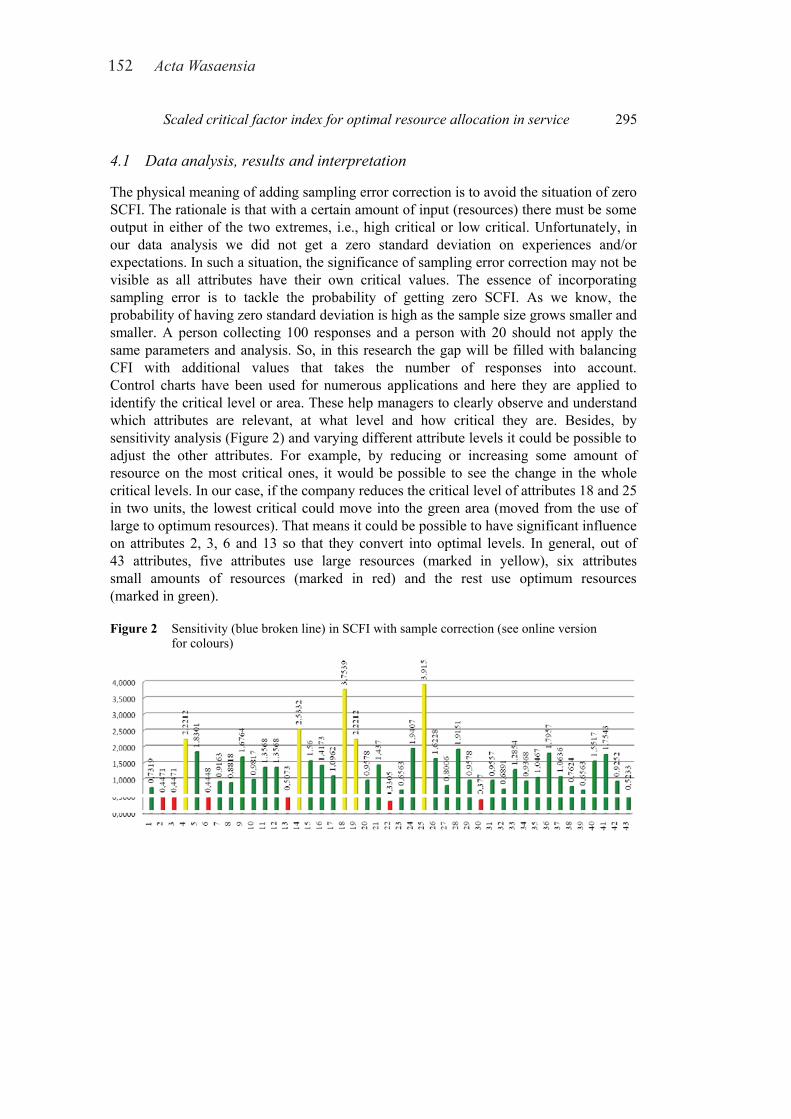
152 Acta Wasaensia
Scaled critical factor index for optimal resource allocation in service 295
4.1 Data analysis, results and interpretation
The physical meaning of adding sampling error correction is to avoid the situation of zero SCFI. The rationale is that with a certain amount of input (resources) there must be some output in either of the two extremes, i.e., high critical or low critical. Unfortunately, in our data analysis we did not get a zero standard deviation on experiences and/or expectations. In such a situation, the significance of sampling error correction may not be visible as all attributes have their own critical values. The essence of incorporating sampling error is to tackle the probability of getting zero SCFI. As we know, the probability of having zero standard deviation is high as the sample size grows smaller and smaller. A person collecting 100 responses and a person with 20 should not apply the same parameters and analysis. So, in this research the gap will be filled with balancing CFI with additional values that takes the number of responses into account. Control charts have been used for numerous applications and here they are applied to identify the critical level or area. These help managers to clearly observe and understand which attributes are relevant, at what level and how critical they are. Besides, by sensitivity analysis (Figure 2) and varying different attribute levels it could be possible to adjust the other attributes. For example, by reducing or increasing some amount of resource on the most critical ones, it would be possible to see the change in the whole critical levels. In our case, if the company reduces the critical level of attributes 18 and 25 in two units, the lowest critical could move into the green area (moved from the use of large to optimum resources). That means it could be possible to have significant influence on attributes 2, 3, 6 and 13 so that they convert into optimal levels. In general, out of 43 attributes, five attributes use large resources (marked in yellow), six attributes small amounts of resources (marked in red) and the rest use optimum resources (marked in green).
Figure 2 Sensitivity (blue broken line) in SCFI with sample correction (see online version for colours)
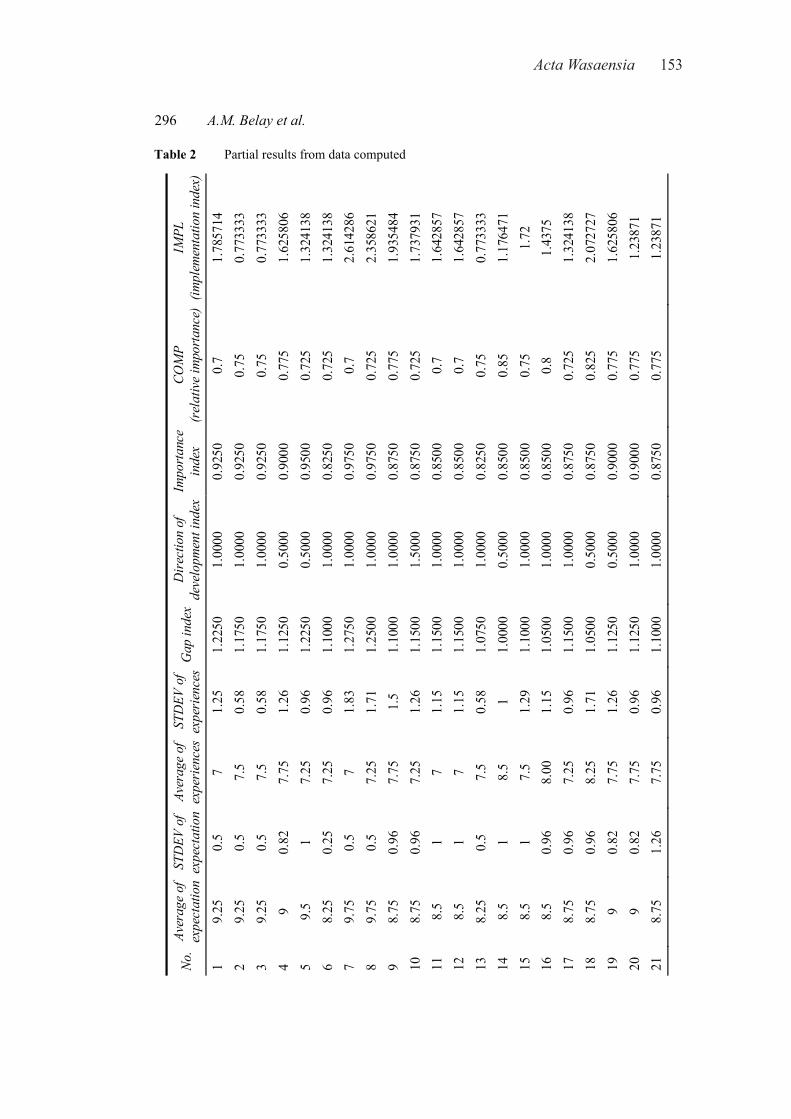
Acta Wasaensia 153
296 A.M. Belay et al.
Table 2 Partial results from data computed
No.
Aver
age
of
expe
ctat
ion
STD
EV o
f ex
pect
atio
n Av
erag
e of
expe
rien
ces
STD
EV o
f ex
peri
ence
s G
ap in
dex
Dir
ectio
n of
de
velo
pmen
t ind
exIm
porta
nce
inde
x CO
MP
(rel
ativ
e im
porta
nce)
IM
PL
(impl
emen
tatio
n in
dex)
1 9.
25
0.5
7 1.
25
1.22
50
1.00
00
0.92
50
0.7
1.78
5714
2
9.25
0.
5 7.
5 0.
58
1.17
50
1.00
00
0.92
50
0.75
0.
7733
33
3 9.
25
0.5
7.5
0.58
1.
1750
1.
0000
0.
9250
0.
75
0.77
3333
4
9 0.
82
7.75
1.
26
1.12
50
0.50
00
0.90
00
0.77
5 1.
6258
06
5 9.
5 1
7.25
0.
96
1.22
50
0.50
00
0.95
00
0.72
5 1.
3241
38
6 8.
25
0.25
7.
25
0.96
1.
1000
1.
0000
0.
8250
0.
725
1.32
4138
7
9.75
0.
5 7
1.83
1.
2750
1.
0000
0.
9750
0.
7 2.
6142
86
8 9.
75
0.5
7.25
1.
71
1.25
00
1.00
00
0.97
50
0.72
5 2.
3586
21
9 8.
75
0.96
7.
75
1.5
1.10
00
1.00
00
0.87
50
0.77
5 1.
9354
84
10
8.75
0.
96
7.25
1.
26
1.15
00
1.50
00
0.87
50
0.72
5 1.
7379
31
11
8.5
1 7
1.15
1.
1500
1.
0000
0.
8500
0.
7 1.
6428
57
12
8.5
1 7
1.15
1.
1500
1.
0000
0.
8500
0.
7 1.
6428
57
13
8.25
0.
5 7.
5 0.
58
1.07
50
1.00
00
0.82
50
0.75
0.
7733
33
14
8.5
1 8.
5 1
1.00
00
0.50
00
0.85
00
0.85
1.
1764
71
15
8.5
1 7.
5 1.
29
1.10
00
1.00
00
0.85
00
0.75
1.
72
16
8.5
0.96
8.
00
1.15
1.
0500
1.
0000
0.
8500
0.
8 1.
4375
17
8.
75
0.96
7.
25
0.96
1.
1500
1.
0000
0.
8750
0.
725
1.32
4138
18
8.
75
0.96
8.
25
1.71
1.
0500
0.
5000
0.
8750
0.
825
2.07
2727
19
9
0.82
7.
75
1.26
1.
1250
0.
5000
0.
9000
0.
775
1.62
5806
20
9
0.82
7.
75
0.96
1.
1250
1.
0000
0.
9000
0.
775
1.23
871
21
8.75
1.
26
7.75
0.
96
1.10
00
1.00
00
0.87
50
0.77
5 1.
2387
1
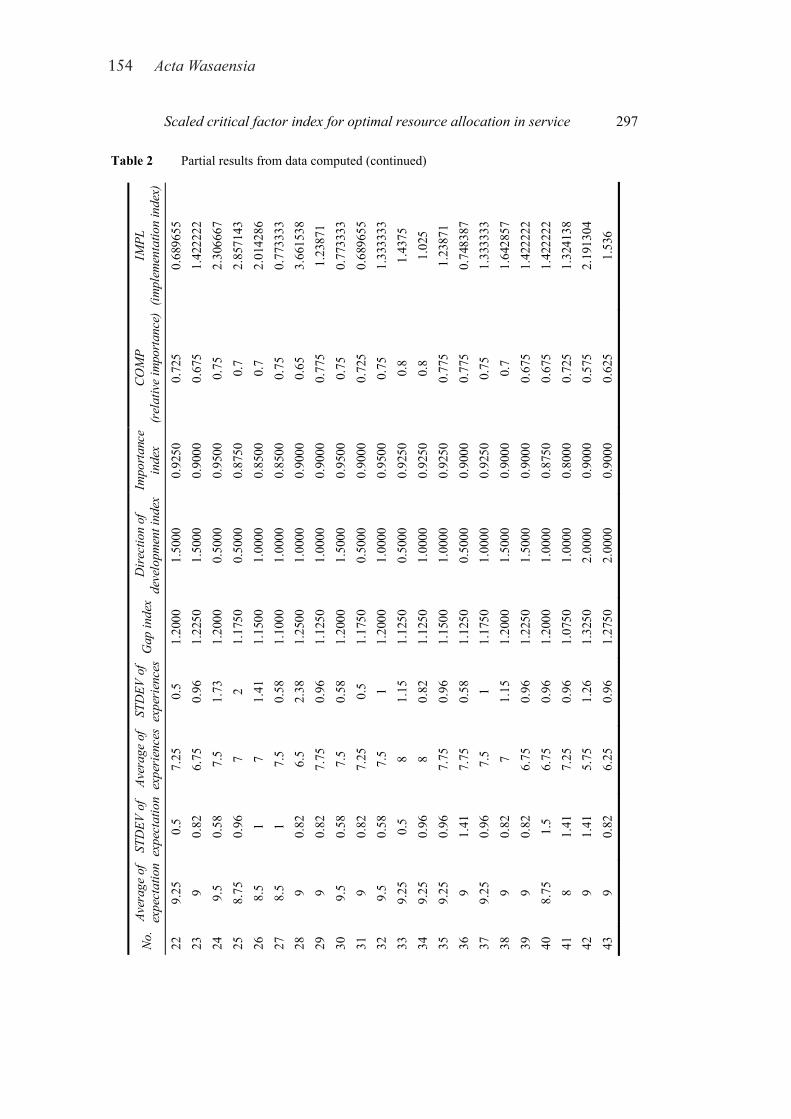
154 Acta Wasaensia
Scaled critical factor index for optimal resource allocation in service 297
Table 2 Partial results from data computed (continued) N
o.
Aver
age
of
expe
ctat
ion
STD
EV o
f ex
pect
atio
n Av
erag
e of
expe
rien
ces
STD
EV o
f ex
peri
ence
s G
ap in
dex
Dir
ectio
n of
de
velo
pmen
t ind
exIm
porta
nce
inde
x C
OM
P (r
elat
ive
impo
rtan
ce)
IMPL
(im
plem
enta
tion
inde
x)22
9.
25
0.5
7.25
0.
5 1.
2000
1.
5000
0.
9250
0.
725
0.68
9655
23
9
0.82
6.
75
0.96
1.
2250
1.
5000
0.
9000
0.
675
1.42
2222
24
9.
5 0.
58
7.5
1.73
1.
2000
0.
5000
0.
9500
0.
75
2.30
6667
25
8.
75
0.96
7
2 1.
1750
0.
5000
0.
8750
0.
7 2.
8571
43
26
8.5
1 7
1.41
1.
1500
1.
0000
0.
8500
0.
7 2.
0142
86
27
8.5
1 7.
5 0.
58
1.10
00
1.00
00
0.85
00
0.75
0.
7733
33
28
9 0.
82
6.5
2.38
1.
2500
1.
0000
0.
9000
0.
65
3.66
1538
29
9
0.82
7.
75
0.96
1.
1250
1.
0000
0.
9000
0.
775
1.23
871
30
9.5
0.58
7.
5 0.
58
1.20
00
1.50
00
0.95
00
0.75
0.
7733
33
31
9 0.
82
7.25
0.
5 1.
1750
0.
5000
0.
9000
0.
725
0.68
9655
32
9.
5 0.
58
7.5
1 1.
2000
1.
0000
0.
9500
0.
75
1.33
3333
33
9.
25
0.5
8 1.
15
1.12
50
0.50
00
0.92
50
0.8
1.43
75
34
9.25
0.
96
8 0.
82
1.12
50
1.00
00
0.92
50
0.8
1.02
5 35
9.
25
0.96
7.
75
0.96
1.
1500
1.
0000
0.
9250
0.
775
1.23
871
36
9 1.
41
7.75
0.
58
1.12
50
0.50
00
0.90
00
0.77
5 0.
7483
87
37
9.25
0.
96
7.5
1 1.
1750
1.
0000
0.
9250
0.
75
1.33
3333
38
9
0.82
7
1.15
1.
2000
1.
5000
0.
9000
0.
7 1.
6428
57
39
9 0.
82
6.75
0.
96
1.22
50
1.50
00
0.90
00
0.67
5 1.
4222
22
40
8.75
1.
5 6.
75
0.96
1.
2000
1.
0000
0.
8750
0.
675
1.42
2222
41
8
1.41
7.
25
0.96
1.
0750
1.
0000
0.
8000
0.
725
1.32
4138
42
9
1.41
5.
75
1.26
1.
3250
2.
0000
0.
9000
0.
575
2.19
1304
43
9
0.82
6.
25
0.96
1.
2750
2.
0000
0.
9000
0.
625
1.53
6
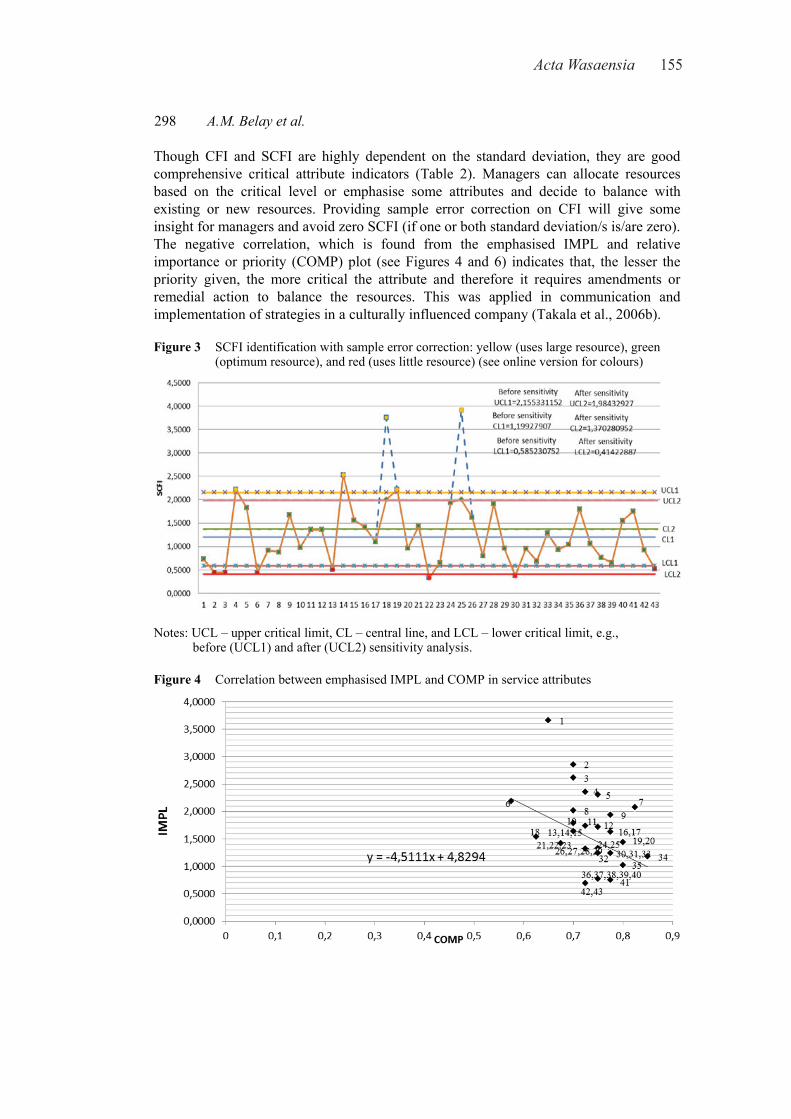
Acta Wasaensia 155
298 A.M. Belay et al.
Though CFI and SCFI are highly dependent on the standard deviation, they are good comprehensive critical attribute indicators (Table 2). Managers can allocate resources based on the critical level or emphasise some attributes and decide to balance with existing or new resources. Providing sample error correction on CFI will give some insight for managers and avoid zero SCFI (if one or both standard deviation/s is/are zero). The negative correlation, which is found from the emphasised IMPL and relative importance or priority (COMP) plot (see Figures 4 and 6) indicates that, the lesser the priority given, the more critical the attribute and therefore it requires amendments or remedial action to balance the resources. This was applied in communication and implementation of strategies in a culturally influenced company (Takala et al., 2006b).
Figure 3 SCFI identification with sample error correction: yellow (uses large resource), green (optimum resource), and red (uses little resource) (see online version for colours)
Notes: UCL – upper critical limit, CL – central line, and LCL – lower critical limit, e.g., before (UCL1) and after (UCL2) sensitivity analysis.
Figure 4 Correlation between emphasised IMPL and COMP in service attributes
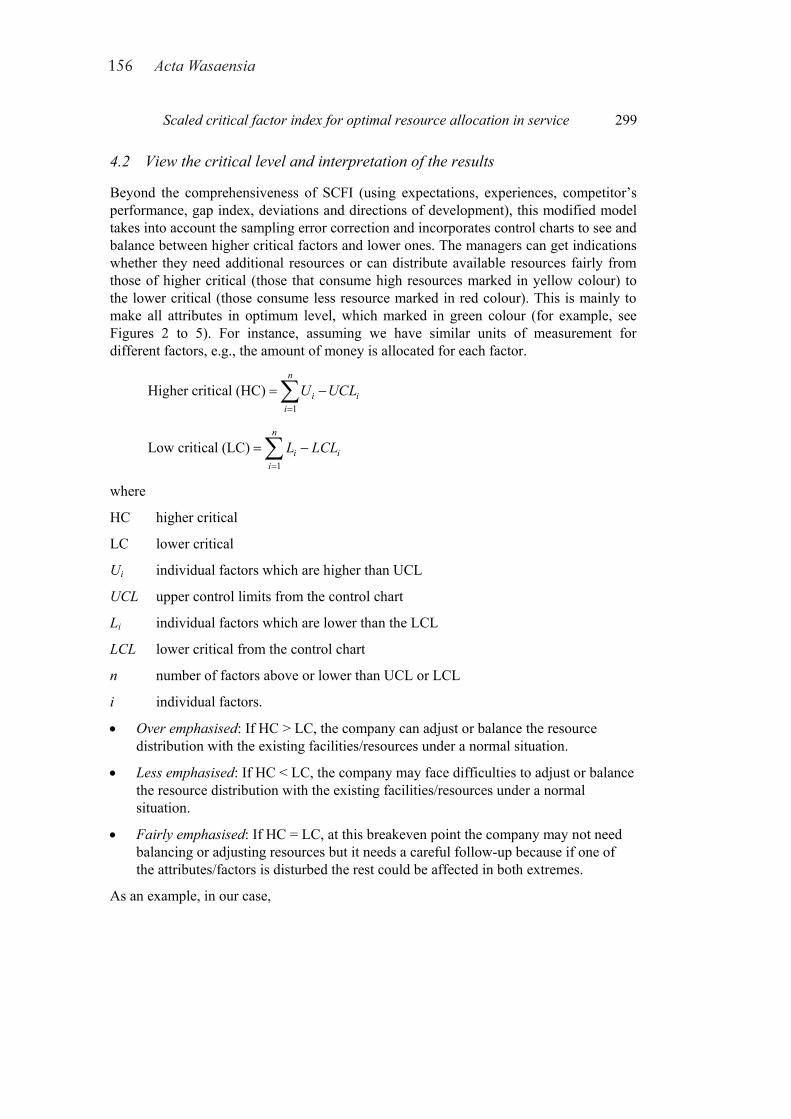
156 Acta Wasaensia
Scaled critical factor index for optimal resource allocation in service 299
4.2 View the critical level and interpretation of the results
Beyond the comprehensiveness of SCFI (using expectations, experiences, competitor’s performance, gap index, deviations and directions of development), this modified model takes into account the sampling error correction and incorporates control charts to see and balance between higher critical factors and lower ones. The managers can get indications whether they need additional resources or can distribute available resources fairly from those of higher critical (those that consume high resources marked in yellow colour) to the lower critical (those consume less resource marked in red colour). This is mainly to make all attributes in optimum level, which marked in green colour (for example, see Figures 2 to 5). For instance, assuming we have similar units of measurement for different factors, e.g., the amount of money is allocated for each factor.
1
Higher critical (HC)n
i ii
U UCL=
= −∑
1
Low critical (LC)n
i ii
L LCL=
= −∑
where
HC higher critical
LC lower critical
Ui individual factors which are higher than UCL
UCL upper control limits from the control chart
Li individual factors which are lower than the LCL
LCL lower critical from the control chart
n number of factors above or lower than UCL or LCL
i individual factors.
• Over emphasised: If HC > LC, the company can adjust or balance the resource distribution with the existing facilities/resources under a normal situation.
• Less emphasised: If HC < LC, the company may face difficulties to adjust or balance the resource distribution with the existing facilities/resources under a normal situation.
• Fairly emphasised: If HC = LC, at this breakeven point the company may not need balancing or adjusting resources but it needs a careful follow-up because if one of the attributes/factors is disturbed the rest could be affected in both extremes.
As an example, in our case,
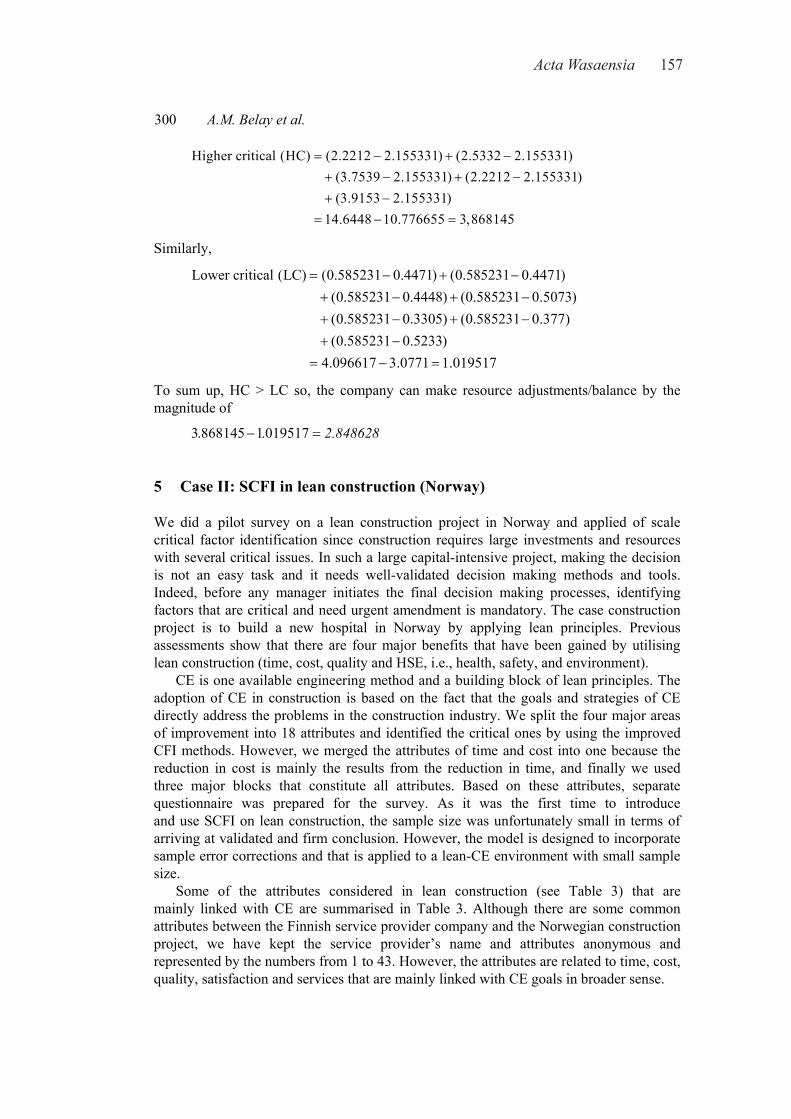
Acta Wasaensia 157
300 A.M. Belay et al.
Higher critical (HC) (2.2212 2.155331) (2.5332 2.155331) (3.7539 2.155331) (2.2212 2.155331) (3.9153 2.155331)14.6448 10.776655 3,868145
= − + −+ − + −+ −
= − =
Similarly,
Lower critical (LC) (0.585231 0.4471) (0.585231 0.4471) (0.585231 0.4448) (0.585231 0.5073) (0.585231 0.3305) (0.585231 0.377) (0.585231 0.5233)
4.096617 3.0771 1.019517
= − + −+ − + −+ − + −+ −
= − =
To sum up, HC > LC so, the company can make resource adjustments/balance by the magnitude of
3.868145 1.019517 2.848628− =
5 Case II: SCFI in lean construction (Norway)
We did a pilot survey on a lean construction project in Norway and applied of scale critical factor identification since construction requires large investments and resources with several critical issues. In such a large capital-intensive project, making the decision is not an easy task and it needs well-validated decision making methods and tools. Indeed, before any manager initiates the final decision making processes, identifying factors that are critical and need urgent amendment is mandatory. The case construction project is to build a new hospital in Norway by applying lean principles. Previous assessments show that there are four major benefits that have been gained by utilising lean construction (time, cost, quality and HSE, i.e., health, safety, and environment).
CE is one available engineering method and a building block of lean principles. The adoption of CE in construction is based on the fact that the goals and strategies of CE directly address the problems in the construction industry. We split the four major areas of improvement into 18 attributes and identified the critical ones by using the improved CFI methods. However, we merged the attributes of time and cost into one because the reduction in cost is mainly the results from the reduction in time, and finally we used three major blocks that constitute all attributes. Based on these attributes, separate questionnaire was prepared for the survey. As it was the first time to introduce and use SCFI on lean construction, the sample size was unfortunately small in terms of arriving at validated and firm conclusion. However, the model is designed to incorporate sample error corrections and that is applied to a lean-CE environment with small sample size.
Some of the attributes considered in lean construction (see Table 3) that are mainly linked with CE are summarised in Table 3. Although there are some common attributes between the Finnish service provider company and the Norwegian construction project, we have kept the service provider’s name and attributes anonymous and represented by the numbers from 1 to 43. However, the attributes are related to time, cost, quality, satisfaction and services that are mainly linked with CE goals in broader sense.
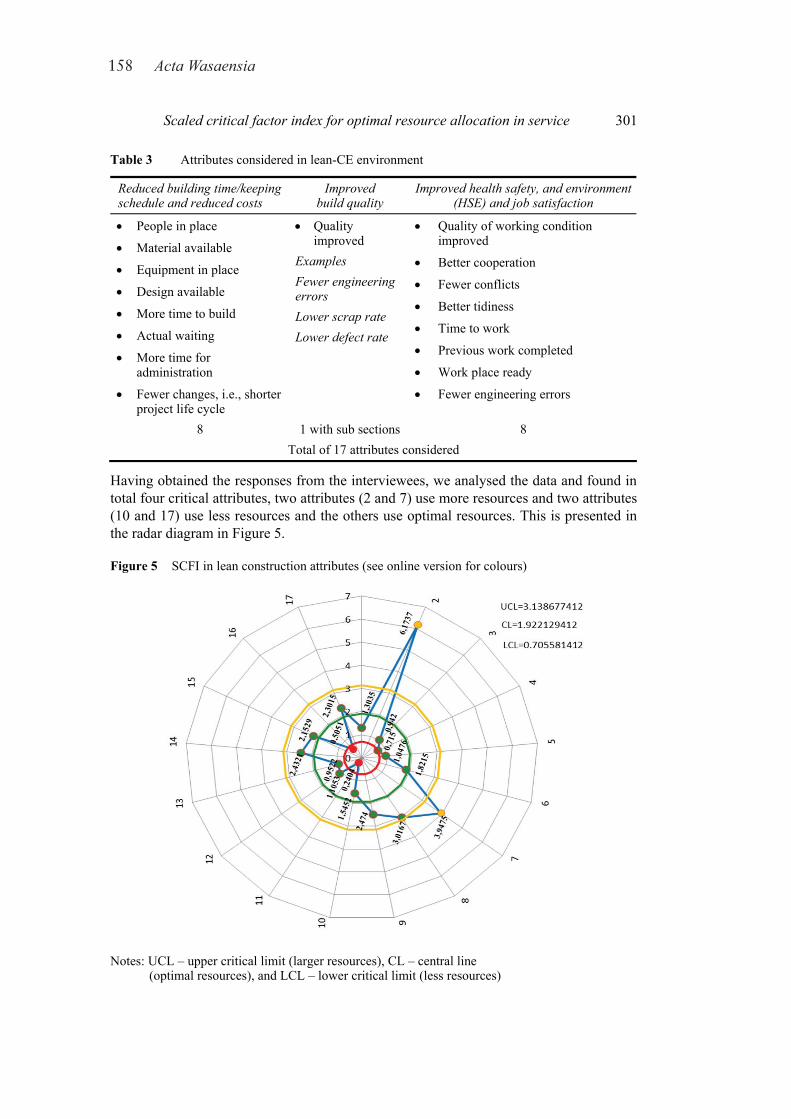
158 Acta Wasaensia
Scaled critical factor index for optimal resource allocation in service 301
Table 3 Attributes considered in lean-CE environment
Reduced building time/keeping schedule and reduced costs
Improved build quality
Improved health safety, and environment (HSE) and job satisfaction
• People in place
• Material available
• Equipment in place
• Design available
• More time to build
• Actual waiting
• More time for administration
• Fewer changes, i.e., shorter project life cycle
• Quality improved
Examples Fewer engineering errors Lower scrap rate Lower defect rate
• Quality of working condition improved
• Better cooperation
• Fewer conflicts
• Better tidiness
• Time to work
• Previous work completed
• Work place ready
• Fewer engineering errors
8 1 with sub sections 8 Total of 17 attributes considered
Having obtained the responses from the interviewees, we analysed the data and found in total four critical attributes, two attributes (2 and 7) use more resources and two attributes (10 and 17) use less resources and the others use optimal resources. This is presented in the radar diagram in Figure 5.
Figure 5 SCFI in lean construction attributes (see online version for colours)
Notes: UCL – upper critical limit (larger resources), CL – central line (optimal resources), and LCL – lower critical limit (less resources)
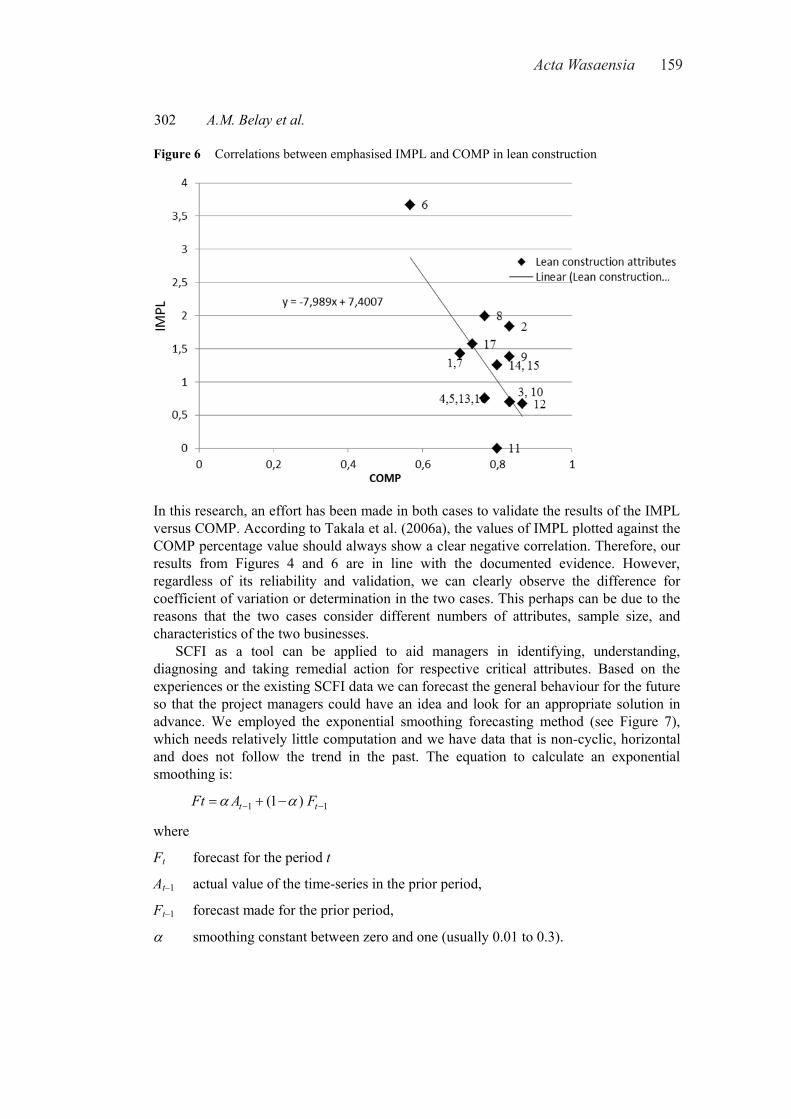
Acta Wasaensia 159
302 A.M. Belay et al.
Figure 6 Correlations between emphasised IMPL and COMP in lean construction
In this research, an effort has been made in both cases to validate the results of the IMPL versus COMP. According to Takala et al. (2006a), the values of IMPL plotted against the COMP percentage value should always show a clear negative correlation. Therefore, our results from Figures 4 and 6 are in line with the documented evidence. However, regardless of its reliability and validation, we can clearly observe the difference for coefficient of variation or determination in the two cases. This perhaps can be due to the reasons that the two cases consider different numbers of attributes, sample size, and characteristics of the two businesses.
SCFI as a tool can be applied to aid managers in identifying, understanding, diagnosing and taking remedial action for respective critical attributes. Based on the experiences or the existing SCFI data we can forecast the general behaviour for the future so that the project managers could have an idea and look for an appropriate solution in advance. We employed the exponential smoothing forecasting method (see Figure 7), which needs relatively little computation and we have data that is non-cyclic, horizontal and does not follow the trend in the past. The equation to calculate an exponential smoothing is:
1 1(1 ) t tFt A F− −= + −α α
where
Ft forecast for the period t
At–1 actual value of the time-series in the prior period,
Ft–1 forecast made for the prior period,
α smoothing constant between zero and one (usually 0.01 to 0.3).
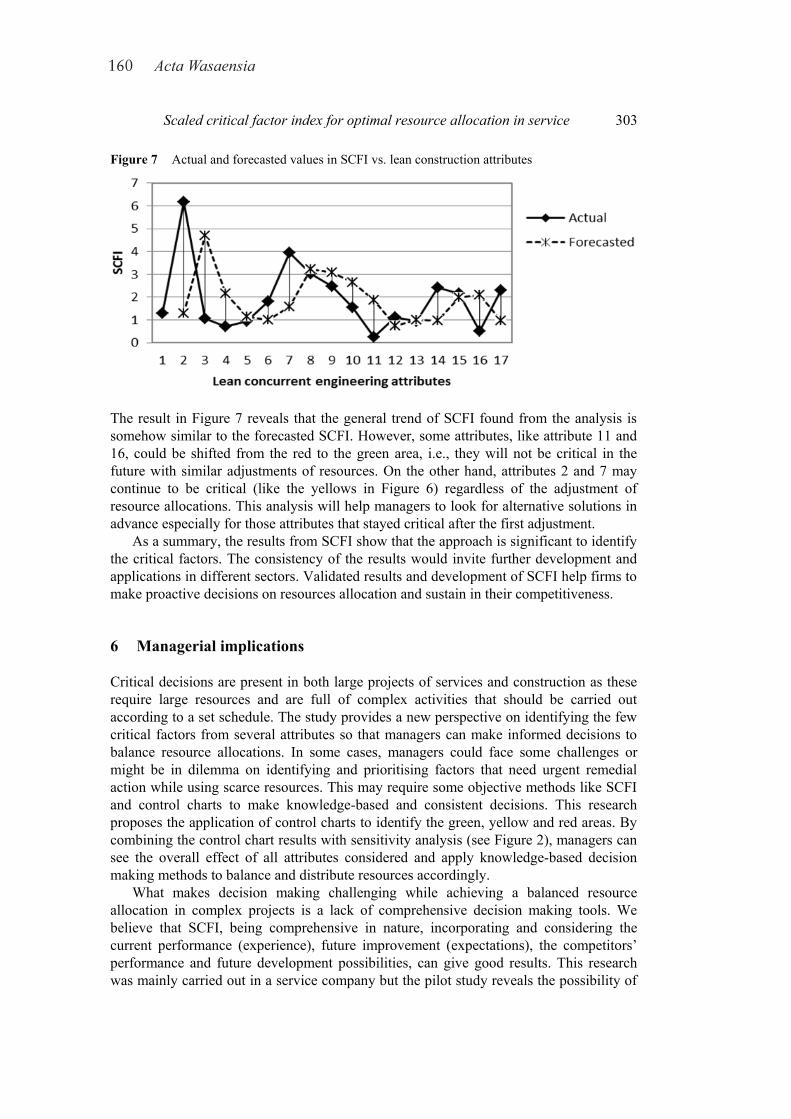
160 Acta Wasaensia
Scaled critical factor index for optimal resource allocation in service 303
Figure 7 Actual and forecasted values in SCFI vs. lean construction attributes
The result in Figure 7 reveals that the general trend of SCFI found from the analysis is somehow similar to the forecasted SCFI. However, some attributes, like attribute 11 and 16, could be shifted from the red to the green area, i.e., they will not be critical in the future with similar adjustments of resources. On the other hand, attributes 2 and 7 may continue to be critical (like the yellows in Figure 6) regardless of the adjustment of resource allocations. This analysis will help managers to look for alternative solutions in advance especially for those attributes that stayed critical after the first adjustment.
As a summary, the results from SCFI show that the approach is significant to identify the critical factors. The consistency of the results would invite further development and applications in different sectors. Validated results and development of SCFI help firms to make proactive decisions on resources allocation and sustain in their competitiveness.
6 Managerial implications
Critical decisions are present in both large projects of services and construction as these require large resources and are full of complex activities that should be carried out according to a set schedule. The study provides a new perspective on identifying the few critical factors from several attributes so that managers can make informed decisions to balance resource allocations. In some cases, managers could face some challenges or might be in dilemma on identifying and prioritising factors that need urgent remedial action while using scarce resources. This may require some objective methods like SCFI and control charts to make knowledge-based and consistent decisions. This research proposes the application of control charts to identify the green, yellow and red areas. By combining the control chart results with sensitivity analysis (see Figure 2), managers can see the overall effect of all attributes considered and apply knowledge-based decision making methods to balance and distribute resources accordingly.
What makes decision making challenging while achieving a balanced resource allocation in complex projects is a lack of comprehensive decision making tools. We believe that SCFI, being comprehensive in nature, incorporating and considering the current performance (experience), future improvement (expectations), the competitors’ performance and future development possibilities, can give good results. This research was mainly carried out in a service company but the pilot study reveals the possibility of
Acta Wasaensia 161
304 A.M. Belay et al.
applying SCFI in lean construction too. The conceptual representation (Figure 1) shows there is a potential to use interchangeably tools and methods that can be used in both sectors that in turn support sustainable resource allocation.
7 Conclusions
The benefits of a fast and comprehensive method to gather important information in order to make knowledge-based decisions at the operational level is self-evident. In this paper, SCFI is introduced and used in service provision (Finland) and lean construction (Norway) to identify the most critical attributes, allocate, and balance resources based on the critical level. The research tries to tackle the shortcomings of the previous CFI model and improve it by incorporating sample error correction to avoid zero CFI, further to use control charts to identify critical attributes objectively, include forecasting methods to act proactively, and compare and validate the emphasised IMPL.
In the service case, out of 43 attributes, six attributes are found to be in red, i.e., critical (with a shortage of resources or under-emphasised). On the other hand, six attributes were found to be in the yellow region that implies that the attributes used more resources than what was supposed (over-emphasised). Managers can thus have an idea how to balance the resources of these attributes by distributing them to place all factors at an optimum level. In the case of construction project, out of 17 attributes, two attributes used large resources, two other attributes used little resources and the rest used an optimum amount of resources. In both cases, from the plot of emphasising IMPL versus COMP, we found a negative correlation that is in line with the literature (Takala et al., 2006a).
From a SCFI method development perspective, this paper delivers some reasonable contributions as compared to the previous CFI model. First, SCFI avoids non-zero values of the index that can help to see a relative gap of resource utilisation and the method will work for all extreme values. Second, the incorporation of statistical process control charts will help in identifying the three distinct areas (use of large resources marked by yellow, optimum resources by green and the use of little resource in red) objectively unlike the previous subjective judgments. Besides this, the sensitivity (Figure 2) and forecasting (see Figure 7) is an addition to knowledge-based decisions in such a way that managers can broaden their view before they make decisions in such a critical environment. The third one (see Figures 4 and 6) is the validation by plotting emphasised IMPL versus COMP.
The merit of a fast, comprehensive and reliable method to identify the critical attributes in order to make managerial decisions at low cost is crucial and will probably lead to a further increase of interest in SCFI. The comprehensiveness of this method is an advantage for managers to take into account different factors. The sense and response approach gives flexibility for managers while making decisions. The integration of the CFI with related concepts, the negative correlation between emphasising IMPL and the relative importance or priority which is represented as COMP, gives the method reliability and is in line with the previous study (Takala et al., 2006a). The SCFI model helps the construction of a decision support system driven by reasoned judgment and taking actual actions in reallocation of resources.
However, the method may require further improvement and development and should be tested in more varied case studies as well. As a recommendation, while carrying out an
162 Acta Wasaensia
Scaled critical factor index for optimal resource allocation in service 305
assessment using SCFI, there should not be too many attributes because the measurement process may take much time and the target of the development may not come into existence.
References Arthur, B.W. (1996) ‘Increasing returns and the new world of business’, Harvard Business Review,
Vol. 74, No. 4, pp.100–104. Basharin, G. (1959) ‘On a statistical estimate for the entropy of a sequence of independent random
variables’, Theory of Probability and its Applications, Vol. 4, No. 3, pp.333–336. Brehmer, B. (1992) ‘Dynamic decision making: Human control of complex systems’,
Acta Psychological, Vol. 81, No. 3, pp.211–241. Chichilnisky, G. (2011) ‘What is sustainability?’, International Journal of Sustainable Economy,
Vol. 3, No. 2, pp.125–140. Costanza, R. (2009) ‘Toward a new sustainable economy’, Real-world Economics Review, No. 49,
pp.20–21 [online] http://www.paecon.net/PAEReview/issue49/Costanza49.pdf (accessed 3 April 2012).
Daniel, T.G. (1999) Trade, Jobs, and Manufacturing Why (Almost All) U.S. Workers Should Welcome Imports, Executive Summary, Cato Institute’s Center for Trade Policy Studies [online] http://www.cato.org/pubs/tbp/tbp-006.pdf (accessed 16 May 2012).
Demsetz, H. (1973) ‘Industry structure, market rivalry and public policy’, Journal of Law and Economics, Vol. 16, No. 1, pp.1–9.
Duncan, S.J., Bras, B. and Paredis, C.J.J. (2008) ‘An approach to robust decision making under severe uncertainty in life cycle design’, International Journal of Sustainable Design, Vol. 1, No. 1, pp.45–59.
Faniran, O.O., Love, P.E.D. and Li, H. (1999) ‘Optimal allocation of construction planning resources’, ASCE, Journal of Construction Engineering and Management, Vol. 125, No. 5, pp.311–319.
Forss, T. and Toshev, R. (2011) ‘Implementing customer delight in decision support system with performance indicators: comparative study of Finnish housing market’, Proceedings of the 7th International Conference on Innovation & Management, July 12–15, Malaysia.
Higginson, N. and Vredenburg, H. (2010) ‘Collaborating for sustainability: strategic knowledge networks, natural resource management and regional development’, International Journal of Sustainable Economy, Vol. 2, No. 3, pp.334–351.
Huovila, P. and Koskela, L. (1998) ‘Contribution of the principles of lean construction to meet the challenges of sustainable development’, Proceedings of the Sixth Annual Conference on Lean Construction – IGLC ‘98, Brazil, pp.1–11.
Johnson, R.B. and Onwuegbuzie, A.J. (2004) ‘Mixed Methods research: a research paradigm whose time has come’, Educational Researcher, Vol. 33, No. 7, pp.14–26.
Johnston, R. (1995) ‘The determinants of service quality: satisfiers and dissatisfiers’, International Journal of Service Industry Management, Vol. 6, No. 5, pp.53–71.
Kallitsis, M.G., Michailidis, G. and Devetsikiotis, M. (2007) ‘Pricing and optimal resource allocation in next generation network services’, in Proceedings of IEEE Sarnoff Symposium, April 30–May 2, Princeton, NJ, USA.
Kleinmuntz, D.N. (1993) ‘Information processing and misperceptions of the implications of feedback in dynamic decision making’, System Dynamics Review, Vol. 9, No. 3, pp.223–237.
Martin, M.G., Weeks, M.R. and Davis, K.J. (1998) ‘Delivering successful service and outsourcing projects using concurrent engineering methodologies’, Proceedings of the 29th Annual Project Management Institute, Seminars & Symposium Long Beach, California, USA, Papers Presented October 9 to 15.
Acta Wasaensia 163
306 A.M. Belay et al.
Martinet, V. and Doyen, L. (2007) ‘Sustainability of an economy with an exhaustible resource: a viable control approach’, Resource and Energy Economics, Vol. 29, No. 1, pp.17–39.
Miyatake, Y. (1996) ‘Technology development and sustainable construction’, Journal of Management in Engineering, Vol. 12, No. 4, pp.23–27.
Morgan, D.L. (1998) ‘Practical strategies for combining qualitative and quantitative methods: applications to health research’, Qualitative Health Research, Vol. 8, No. 3, pp.362–376.
Newman, K. and Cowling, A. (1996) ‘Service quality in retail banking: the experience of two British clearing banks’, International Journal of Bank Marketing, Vol. 14, No. 6, pp.3–11.
Ohno, T. (1988) Toyota Production System, Productivity Press, Portland. Pennell, J.P. and Winner, R.I. (1989) ‘Concurrent engineering: practices and prospects’,
Proceedings of the IEEE Global Telecommunications Conference and Exhibition, Vol. 1, No. 1, pp.647–655, November 27–30, Dallas, Texas, USA.
Phusavat, K., Songnisai, S., Rassameethes, B. and Kekale, T. (2008) ‘Sustaining quality management: case study at Sanyo Semiconductor (Thailand)’, International Journal of Sustainable Economy, Vol. 1, No. 1, pp.85–99.
Pitelis, C. and Antonakis, N. (2003) ‘Manufacturing and competitiveness: the case of Greece’, Journal of Economic Studies, Vol. 30, No. 5, pp.535–547.
Prahalad, C. and Hamel, G. (1994) ‘Strategy as a field of study: why search for a new paradigm?’, Strategic Management Journal, Special Issue, Summer, pp.5–16.
Ranta, J.M. and Takala, J. (2007) ‘A holistic method for finding out critical features of industry maintenance services’, International Journal of Services and Standards, Vol. 3, No. 3, pp.312–325.
Rosen, L.D., Karwan, K.R. and Scribner, L.L. (2003) ‘Service quality measurement and the disconfirmation model: taking care in interpretation’, Total Quality Management, Vol. 14, No. 1, pp.3–14.
Sale, J.E.M., Lohfield, L. and Brazil, K. (2002) ‘Revisiting the quantitative-qualitative debate: implications for mixed-methods research’, Quality and Quantity, Vol. 36, No. 1, pp.43–53.
Schneider, T.D., Stormo, G.D. and Gold, L. (1986) ‘Information content of binding sites on nucleotide sequences’, Journal of Molecular Biology, Vol. 188, No. 3, pp.415–431.
So, S.C.K. (2010) ‘Adopting lean principle as sustainable manufacturing strategy in an electronic enabled supply chain environment’, International Journal of Sustainable Economy, Vol. 2, No. 3, pp.310–333.
Spangenberg, J.H. (2005) ‘Economic sustainability of the economy: concepts and indicators’, International Journal of Sustainable Development, Vol. 8, No. 1, pp.47–64.
Stalk, G. and Hout, T. (1990) Competing against Time, Free Press, New York, NY. Takala, J., Leskinen, J., Sivusuo, H., Hirvelä, J. and Kekäle, T. (2006a) ‘The sand cone model:
illustrating multi-focused strategies’, Management Decision, Vol. 44, No. 3, pp.335–345. Takala, J., Sivusuo, H., Leskinen, J. and Hirvelä, J. (2006b) ‘How to communicate and implement
strategies in a strong organization culture?’, Tehnički vjesnik, Vol. 13, No. 1, pp.49–55. Vilares, M.J. and Coehlo, P.S. (2003) ‘The employee-customer satisfaction chain in the ESCI
model’, European Journal of Marketing, Vol. 37, Nos. 11–12, pp.1703–1722. Voss, C., Roth, A.V., Rosenzweig, E.D., Blackmon, K. and Chase, R.B. (2004) ‘A tale of two
countries’ conservatism, service quality, and feedback on customer satisfaction’, Journal of Service Research, Vol. 6, No. 3, pp.212–223.
Voss, C., Tsikriktsis, N. and Frohlich, M. (2002) ‘Case research in operations management’, International Journal of Operations & Production Management, Vol. 22, No. 2, pp.195–219.
Winner, R.I., Pennell, J.P., Bertrand, H.E. and Slusarezuk, M.M.G. (1988) ‘The role of concurrent engineering in weapon systems acquisition’, Institute for Defense Analysis, IDA Report R-338, Alexandria, VA, USA.
Yassine, A.A. (1999) ‘A conceptual concurrent engineering model of service quality’, Information and Management Sciences, Vol. 10, No. 2, pp.37–52.

Acta Wasaensia 165 Proc. of the 2012 7th International Conference on System of Systems Engineering, Genoa, Italy-16-19 July 2012 (extended)
Systems of System Thinking in Product Development: A System Dynamics Approach.
Alemu Moges Belay* Department of Production
University of Vaasa Vaasa, Finland [email protected]
Norwegian University of Science & Technology
Trondheim, Norway
Petri Helo Department of Production
University of Vaasa Vaasa, Finland [email protected]
Torgeir Welo Department of Engineering Design and Materials Norwegian University of Science & Technology
Trondheim, Norway [email protected]
Abstract - Companies ceaselessly strive to have a systemic approach to survive. One of those approaches is systems of system engineering (SoSE) that enables the decision-makers to understand the interactions of different systems in terms of the given parameters. This paper considers product development (PD) in light of SoSE. Different PD stages (before and after design) treated as a system and analyzed to see the effects of concurrent engineering in total cost and lead time. We also analyze marketing with its parameters to have sound decision as part of SoSE. We use system dynamics approach and found that, the more cost allocated in early stage, the more reduced the total cost and the lead time. From marketing system analysis with interdependent variables, firms can control and make crucial decisions for improvement. Some attributes could be unpredictable and difficult to control as the system grows from simple to complex, e.g. advertisement.
Keywords: system of system engineering (SoSE), System, System dynamics; Concurrent engineering; System engineering, Product development, Design, Marketing.
1 Introduction. Companies want to sell their products as fast as possible to have a bigger market share. But, time-to-market is not an easy task with several complicated systems, processes and activities especially in high technology industries that require huge investment (for example power plant and aerospace industries). Decisions that are made at early design stage during product development have impacts on direct and indirect product development related activities and costs. This is also extended to the whole project time and cost overrun problem that mainly due to design changes (Chritamara, et.al, 2002)
According to Department of Defense (DoD, 2008) and the National Defense Industry Association (NDIA), modeling and simulation is considered as a technical tool-set and is applied throughout the system development life cycle (from concept to delivery). In this study, we use one
of modeling and simulation method i.e. system dynamics, by considering the complex product development in SoSE level. J. W. Forrester in 1961 developed idea of System Dynamics (SD) and (Sterman, J.D 2000), developed a theory to approach complex systems, non-linearity, and with several feedback loops of information in a system. One of the tools that help to understand the tradeoffs in the product development stage is dynamic simulation models. For example, Ford, D.N. and Sterman, J.D (1998) showed that system dynamics identifies structural feedbacks at the operational level that help obtaining the desired patterns of the specific behavior over time, Marujo, LG (2009) applied in the rework impact evaluation in the overlapped product development schedule and its aim was to reduce the lead-time of activities. He provided the general model to estimate the extended design time, strictly related to the necessary rework fraction, considering over-lapped activities using system dynamics. Lai, C. (2008), considered system dynamics in production systems, analyzing feedback loop to determine the non-linear system dynamics. Sterman, J.D (2000) indicated the dynamic behavior of product development with an involvement of multiple feedbacks, complex framework and has several interdependent activities. He also argues that the models should reflect and solve real-world problems of the complex systems.
The whole process of product development would be considered as systems of system including all efforts to achieve time-to-market and satisfy customers by large. This is because all functions have their own people, process and technology which are the basic requirement to be a system. However, the previous trends of product development process show that firms were only focusing on certain part of the development processes to enhance their performances, e.g. improvement efforts on design. Obviously, this will improve some parts but not the whole development process and at the end of the day, the product fails. Our motivation is based on Cooper, R (2001) who claims that out of the total four products, three fails and an urgent call by Hoppmann’s, et al. (2011) to view product
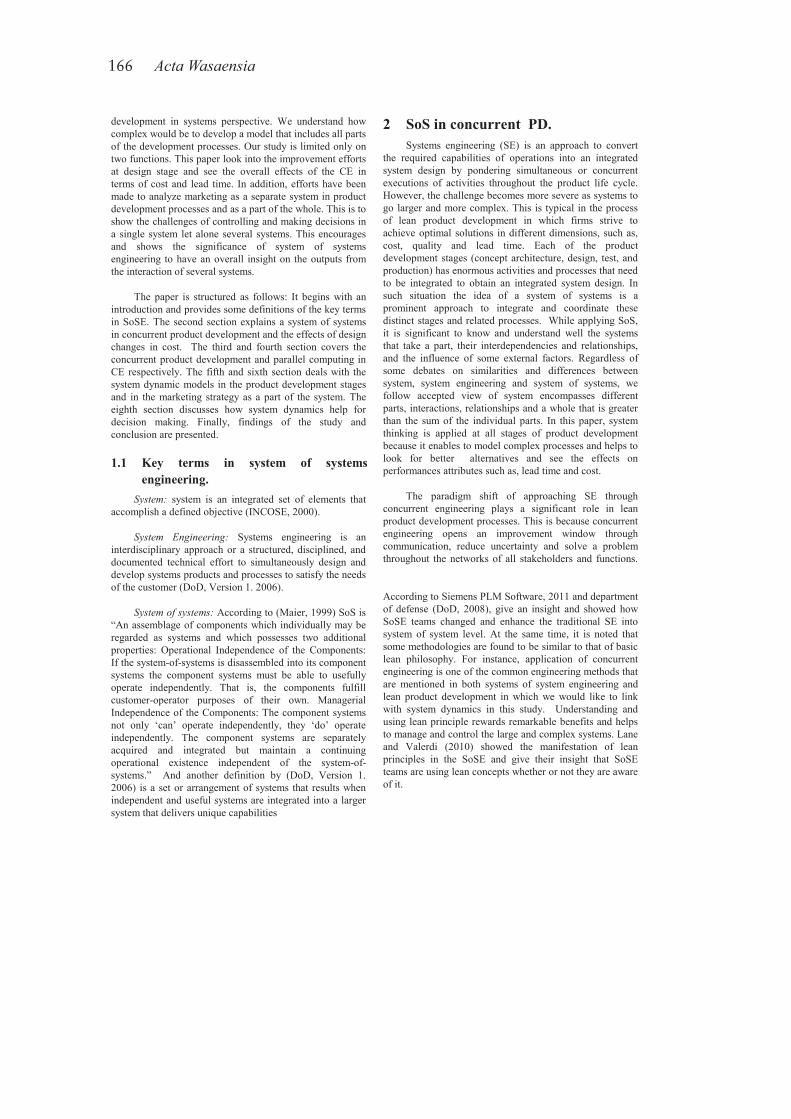
166 Acta Wasaensia
development in systems perspective. We understand how complex would be to develop a model that includes all parts of the development processes. Our study is limited only on two functions. This paper look into the improvement efforts at design stage and see the overall effects of the CE in terms of cost and lead time. In addition, efforts have been made to analyze marketing as a separate system in product development processes and as a part of the whole. This is to show the challenges of controlling and making decisions in a single system let alone several systems. This encourages and shows the significance of system of systems engineering to have an overall insight on the outputs from the interaction of several systems.
The paper is structured as follows: It begins with an introduction and provides some definitions of the key terms in SoSE. The second section explains a system of systems in concurrent product development and the effects of design changes in cost. The third and fourth section covers the concurrent product development and parallel computing in CE respectively. The fifth and sixth section deals with the system dynamic models in the product development stages and in the marketing strategy as a part of the system. The eighth section discusses how system dynamics help for decision making. Finally, findings of the study and conclusion are presented.
1.1 Key terms in system of systems engineering.
System: system is an integrated set of elements that accomplish a defined objective (INCOSE, 2000).
System Engineering: Systems engineering is an interdisciplinary approach or a structured, disciplined, and documented technical effort to simultaneously design and develop systems products and processes to satisfy the needs of the customer (DoD, Version 1. 2006).
System of systems: According to (Maier, 1999) SoS is “An assemblage of components which individually may be regarded as systems and which possesses two additional properties: Operational Independence of the Components: If the system-of-systems is disassembled into its component systems the component systems must be able to usefully operate independently. That is, the components fulfill customer-operator purposes of their own. Managerial Independence of the Components: The component systems not only ‘can’ operate independently, they ‘do’ operate independently. The component systems are separately acquired and integrated but maintain a continuing operational existence independent of the system-of-systems.” And another definition by (DoD, Version 1. 2006) is a set or arrangement of systems that results when independent and useful systems are integrated into a larger system that delivers unique capabilities
2 SoS in concurrent PD. Systems engineering (SE) is an approach to convert the required capabilities of operations into an integrated system design by pondering simultaneous or concurrent executions of activities throughout the product life cycle. However, the challenge becomes more severe as systems to go larger and more complex. This is typical in the process of lean product development in which firms strive to achieve optimal solutions in different dimensions, such as, cost, quality and lead time. Each of the product development stages (concept architecture, design, test, and production) has enormous activities and processes that need to be integrated to obtain an integrated system design. In such situation the idea of a system of systems is a prominent approach to integrate and coordinate these distinct stages and related processes. While applying SoS, it is significant to know and understand well the systems that take a part, their interdependencies and relationships, and the influence of some external factors. Regardless of some debates on similarities and differences between system, system engineering and system of systems, we follow accepted view of system encompasses different parts, interactions, relationships and a whole that is greater than the sum of the individual parts. In this paper, system thinking is applied at all stages of product development because it enables to model complex processes and helps to look for better alternatives and see the effects on performances attributes such as, lead time and cost.
The paradigm shift of approaching SE through concurrent engineering plays a significant role in lean product development processes. This is because concurrent engineering opens an improvement window through communication, reduce uncertainty and solve a problem throughout the networks of all stakeholders and functions.
According to Siemens PLM Software, 2011 and department of defense (DoD, 2008), give an insight and showed how SoSE teams changed and enhance the traditional SE into system of system level. At the same time, it is noted that some methodologies are found to be similar to that of basic lean philosophy. For instance, application of concurrent engineering is one of the common engineering methods that are mentioned in both systems of system engineering and lean product development in which we would like to link with system dynamics in this study. Understanding and using lean principle rewards remarkable benefits and helps to manage and control the large and complex systems. Lane and Valerdi (2010) showed the manifestation of lean principles in the SoSE and give their insight that SoSE teams are using lean concepts whether or not they are aware of it.
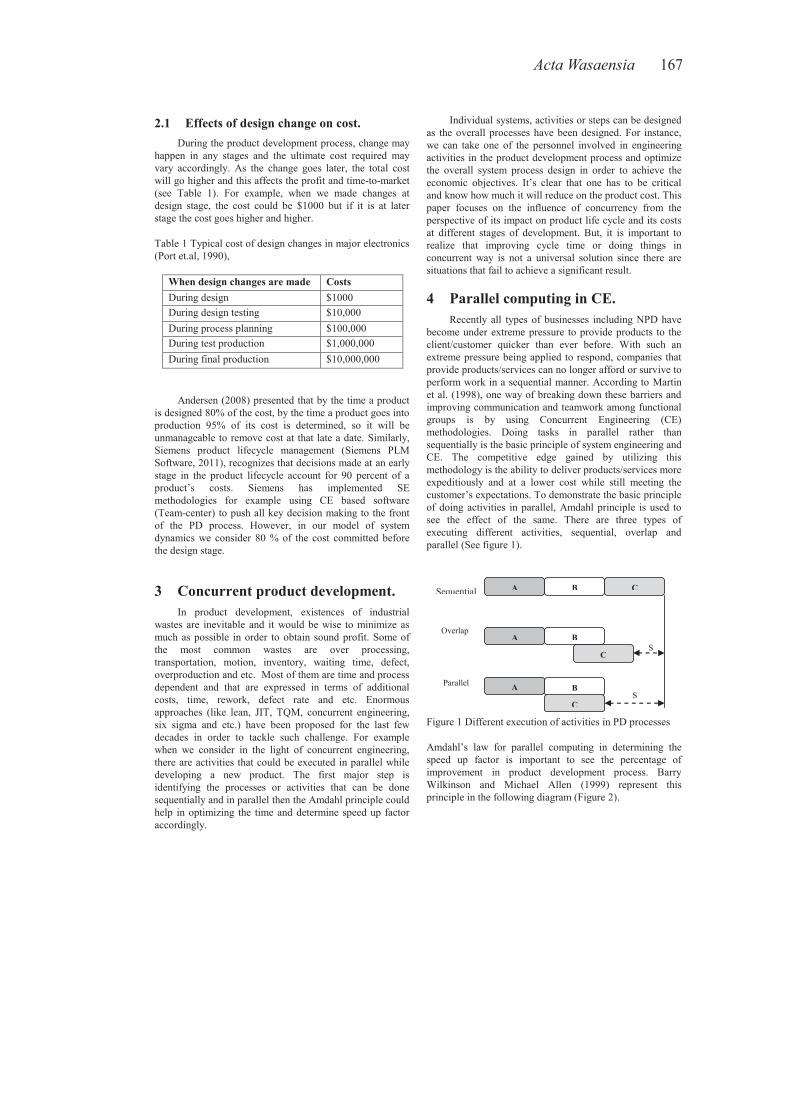
Acta Wasaensia 167
2.1 Effects of design change on cost. During the product development process, change may happen in any stages and the ultimate cost required may vary accordingly. As the change goes later, the total cost will go higher and this affects the profit and time-to-market (see Table 1). For example, when we made changes at design stage, the cost could be $1000 but if it is at later stage the cost goes higher and higher.
Table 1 Typical cost of design changes in major electronics (Port et.al, 1990),
When design changes are made Costs During design $1000 During design testing $10,000 During process planning $100,000 During test production $1,000,000 During final production $10,000,000
Andersen (2008) presented that by the time a product is designed 80% of the cost, by the time a product goes into production 95% of its cost is determined, so it will be unmanageable to remove cost at that late a date. Similarly, Siemens product lifecycle management (Siemens PLM Software, 2011), recognizes that decisions made at an early stage in the product lifecycle account for 90 percent of a product’s costs. Siemens has implemented SE methodologies for example using CE based software (Team-center) to push all key decision making to the front of the PD process. However, in our model of system dynamics we consider 80 % of the cost committed before the design stage.
3 Concurrent product development. In product development, existences of industrial wastes are inevitable and it would be wise to minimize as much as possible in order to obtain sound profit. Some of the most common wastes are over processing, transportation, motion, inventory, waiting time, defect, overproduction and etc. Most of them are time and process dependent and that are expressed in terms of additional costs, time, rework, defect rate and etc. Enormous approaches (like lean, JIT, TQM, concurrent engineering, six sigma and etc.) have been proposed for the last few decades in order to tackle such challenge. For example when we consider in the light of concurrent engineering, there are activities that could be executed in parallel while developing a new product. The first major step is identifying the processes or activities that can be done sequentially and in parallel then the Amdahl principle could help in optimizing the time and determine speed up factor accordingly.
Individual systems, activities or steps can be designed as the overall processes have been designed. For instance, we can take one of the personnel involved in engineering activities in the product development process and optimize the overall system process design in order to achieve the economic objectives. It’s clear that one has to be critical and know how much it will reduce on the product cost. This paper focuses on the influence of concurrency from the perspective of its impact on product life cycle and its costs at different stages of development. But, it is important to realize that improving cycle time or doing things in concurrent way is not a universal solution since there are situations that fail to achieve a significant result.
4 Parallel computing in CE. Recently all types of businesses including NPD have become under extreme pressure to provide products to the client/customer quicker than ever before. With such an extreme pressure being applied to respond, companies that provide products/services can no longer afford or survive to perform work in a sequential manner. According to Martin et al. (1998), one way of breaking down these barriers and improving communication and teamwork among functional groups is by using Concurrent Engineering (CE) methodologies. Doing tasks in parallel rather than sequentially is the basic principle of system engineering and CE. The competitive edge gained by utilizing this methodology is the ability to deliver products/services more expeditiously and at a lower cost while still meeting the customer’s expectations. To demonstrate the basic principle of doing activities in parallel, Amdahl principle is used to see the effect of the same. There are three types of executing different activities, sequential, overlap and parallel (See figure 1).
Figure 1 Different execution of activities in PD processes
Amdahl’s law for parallel computing in determining the speed up factor is important to see the percentage of improvement in product development process. Barry Wilkinson and Michael Allen (1999) represent this principle in the following diagram (Figure 2).
Parallel
Overlap
Sequential
So
Sp
A B C
A B
C
A B
C
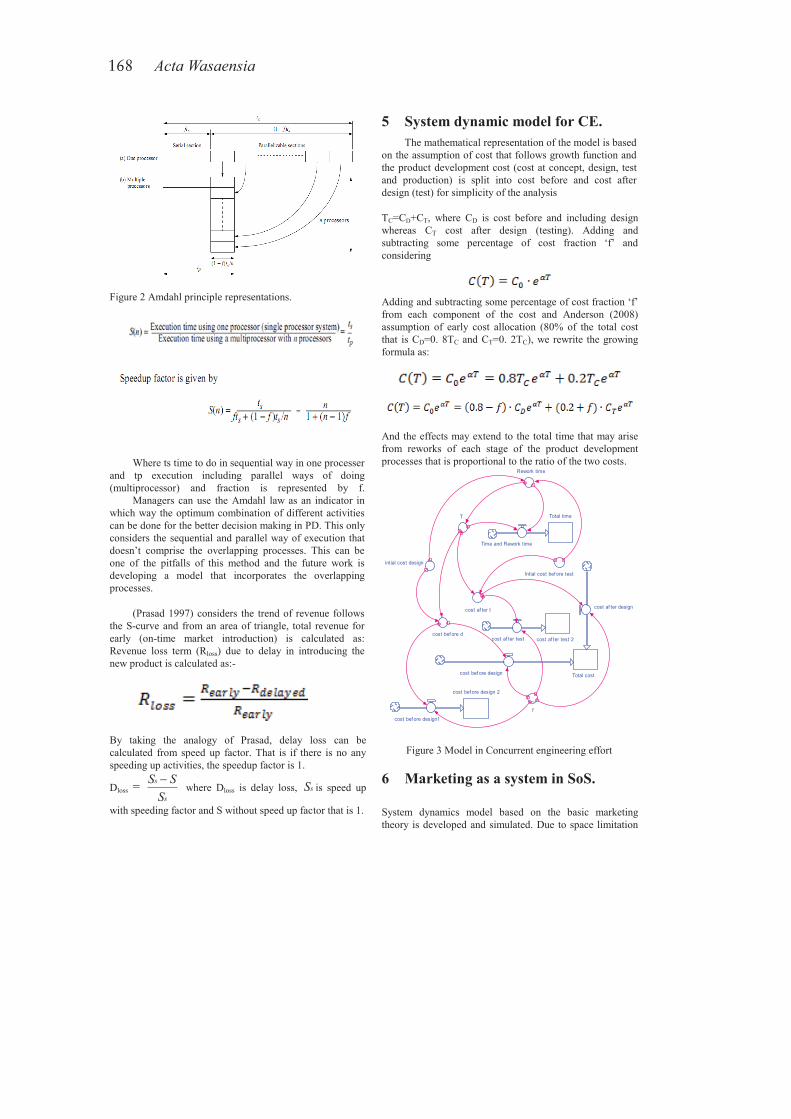
168 Acta Wasaensia
Figure 2 Amdahl principle representations.
Where ts time to do in sequential way in one processer and tp execution including parallel ways of doing (multiprocessor) and fraction is represented by f. Managers can use the Amdahl law as an indicator in which way the optimum combination of different activities can be done for the better decision making in PD. This only considers the sequential and parallel way of execution that doesn’t comprise the overlapping processes. This can be one of the pitfalls of this method and the future work is developing a model that incorporates the overlapping processes.
(Prasad 1997) considers the trend of revenue follows the S-curve and from an area of triangle, total revenue for early (on-time market introduction) is calculated as: Revenue loss term (Rloss) due to delay in introducing the new product is calculated as:-
By taking the analogy of Prasad, delay loss can be calculated from speed up factor. That is if there is no any speeding up activities, the speedup factor is 1.
Dloss = s
s
SSS where Dloss is delay loss, sS is speed up
with speeding factor and S without speed up factor that is 1.
5 System dynamic model for CE. The mathematical representation of the model is based on the assumption of cost that follows growth function and the product development cost (cost at concept, design, test and production) is split into cost before and cost after design (test) for simplicity of the analysis
TC=CD+CT, where CD is cost before and including design whereas CT cost after design (testing). Adding and subtracting some percentage of cost fraction ‘f’ and considering
Adding and subtracting some percentage of cost fraction ‘f’ from each component of the cost and Anderson (2008) assumption of early cost allocation (80% of the total cost that is CD=0. 8TC and CT=0. 2TC), we rewrite the growing formula as:
And the effects may extend to the total time that may arise from reworks of each stage of the product development processes that is proportional to the ratio of the two costs.
Total cost
cost af ter design
cost bef ore design
~f
cost bef ore d
cost af ter t
T
intial cost design
Rework time
Total time
Time and Rework time
Intial cost bef ore test
cost af ter test 2cost af ter test
cost bef ore design 2
cost bef ore design1
Figure 3 Model in Concurrent engineering effort
6 Marketing as a system in SoS. System dynamics model based on the basic marketing theory is developed and simulated. Due to space limitation
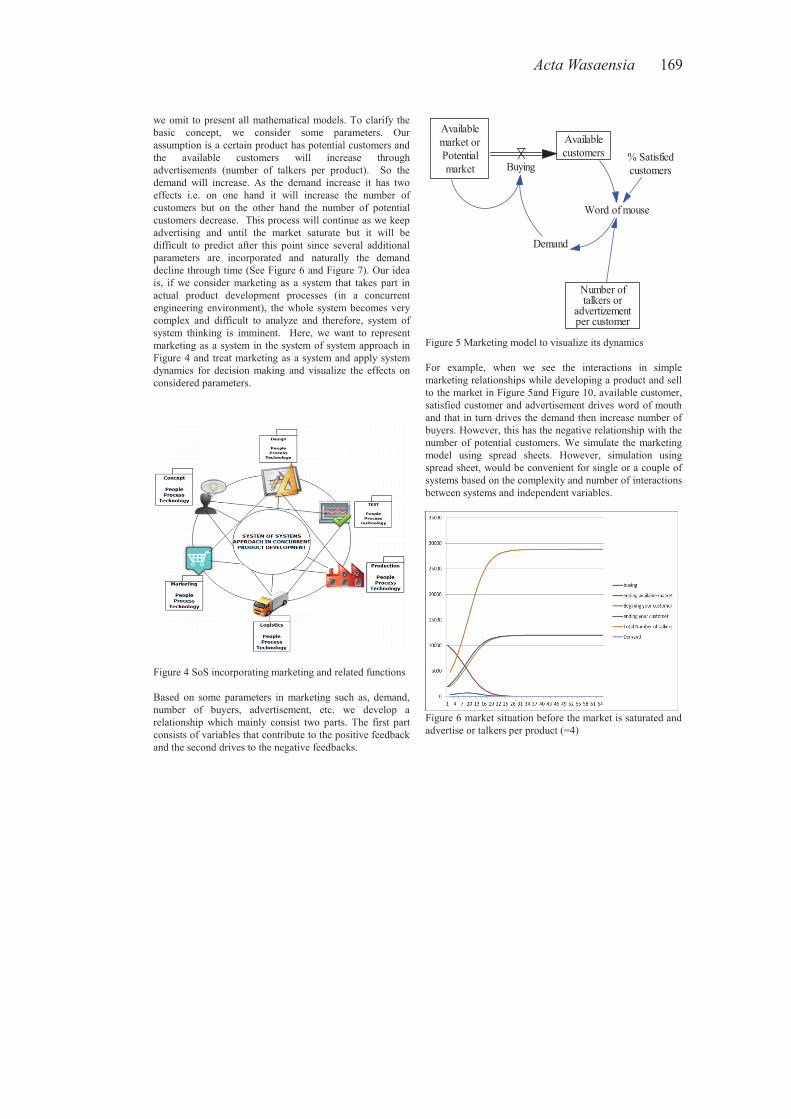
Acta Wasaensia 169
we omit to present all mathematical models. To clarify the basic concept, we consider some parameters. Our assumption is a certain product has potential customers and the available customers will increase through advertisements (number of talkers per product). So the demand will increase. As the demand increase it has two effects i.e. on one hand it will increase the number of customers but on the other hand the number of potential customers decrease. This process will continue as we keep advertising and until the market saturate but it will be difficult to predict after this point since several additional parameters are incorporated and naturally the demand decline through time (See Figure 6 and Figure 7). Our idea is, if we consider marketing as a system that takes part in actual product development processes (in a concurrent engineering environment), the whole system becomes very complex and difficult to analyze and therefore, system of system thinking is imminent. Here, we want to represent marketing as a system in the system of system approach in Figure 4 and treat marketing as a system and apply system dynamics for decision making and visualize the effects on considered parameters.
Figure 4 SoS incorporating marketing and related functions Based on some parameters in marketing such as, demand, number of buyers, advertisement, etc. we develop a relationship which mainly consist two parts. The first part consists of variables that contribute to the positive feedback and the second drives to the negative feedbacks.
Availablemarket orPotentialmarket
Availablecustomers
Buying
Demand
% Satisfiedcustomers
Number oftalkers or
advertizementper customer
Word of mouse
Figure 5 Marketing model to visualize its dynamics For example, when we see the interactions in simple marketing relationships while developing a product and sell to the market in Figure 5and Figure 10, available customer, satisfied customer and advertisement drives word of mouth and that in turn drives the demand then increase number of buyers. However, this has the negative relationship with the number of potential customers. We simulate the marketing model using spread sheets. However, simulation using spread sheet, would be convenient for single or a couple of systems based on the complexity and number of interactions between systems and independent variables.
Figure 6 market situation before the market is saturated and advertise or talkers per product (=4)
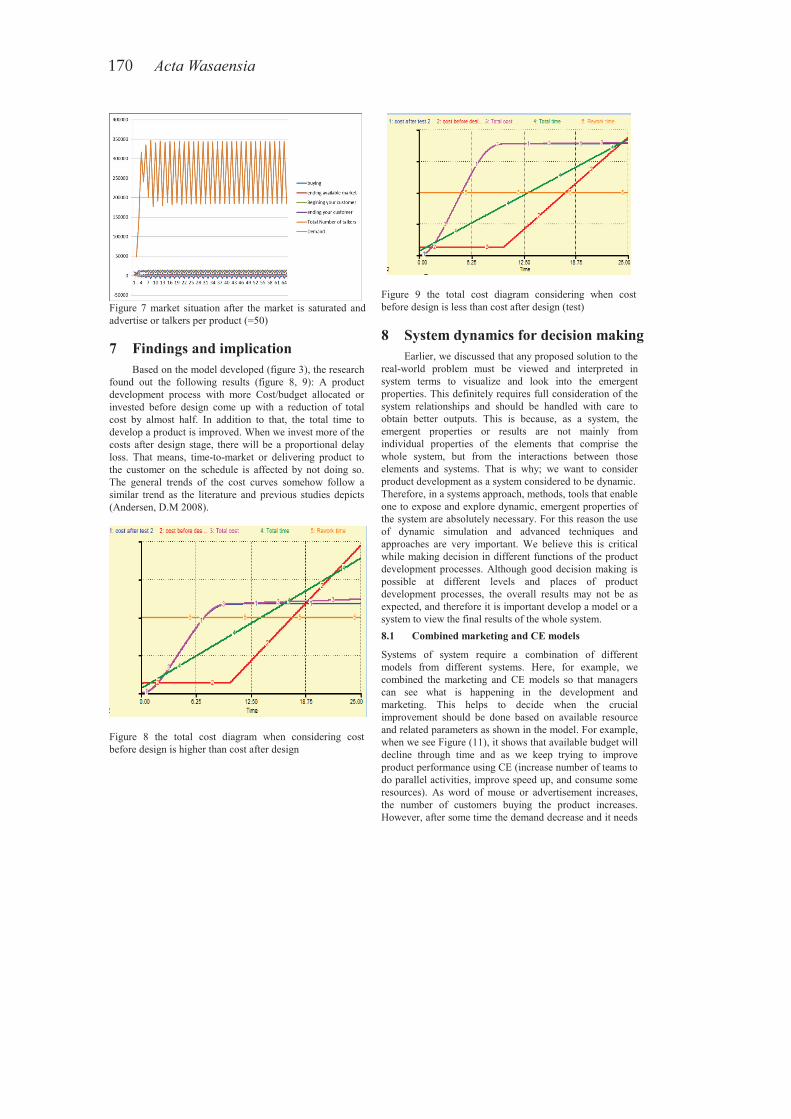
170 Acta Wasaensia
Figure 7 market situation after the market is saturated and advertise or talkers per product (=50) 7 Findings and implication Based on the model developed (figure 3), the research found out the following results (figure 8, 9): A product development process with more Cost/budget allocated or invested before design come up with a reduction of total cost by almost half. In addition to that, the total time to develop a product is improved. When we invest more of the costs after design stage, there will be a proportional delay loss. That means, time-to-market or delivering product to the customer on the schedule is affected by not doing so. The general trends of the cost curves somehow follow a similar trend as the literature and previous studies depicts (Andersen, D.M 2008).
Figure 8 the total cost diagram when considering cost before design is higher than cost after design
Figure 9 the total cost diagram considering when cost before design is less than cost after design (test)
8 System dynamics for decision making Earlier, we discussed that any proposed solution to the
real-world problem must be viewed and interpreted in system terms to visualize and look into the emergent properties. This definitely requires full consideration of the system relationships and should be handled with care to obtain better outputs. This is because, as a system, the emergent properties or results are not mainly from individual properties of the elements that comprise the whole system, but from the interactions between those elements and systems. That is why; we want to consider product development as a system considered to be dynamic. Therefore, in a systems approach, methods, tools that enable one to expose and explore dynamic, emergent properties of the system are absolutely necessary. For this reason the use of dynamic simulation and advanced techniques and approaches are very important. We believe this is critical while making decision in different functions of the product development processes. Although good decision making is possible at different levels and places of product development processes, the overall results may not be as expected, and therefore it is important develop a model or a system to view the final results of the whole system. 8.1 Combined marketing and CE models
Systems of system require a combination of different models from different systems. Here, for example, we combined the marketing and CE models so that managers can see what is happening in the development and marketing. This helps to decide when the crucial improvement should be done based on available resource and related parameters as shown in the model. For example, when we see Figure (11), it shows that available budget will decline through time and as we keep trying to improve product performance using CE (increase number of teams to do parallel activities, improve speed up, and consume some resources). As word of mouse or advertisement increases, the number of customers buying the product increases. However, after some time the demand decrease and it needs
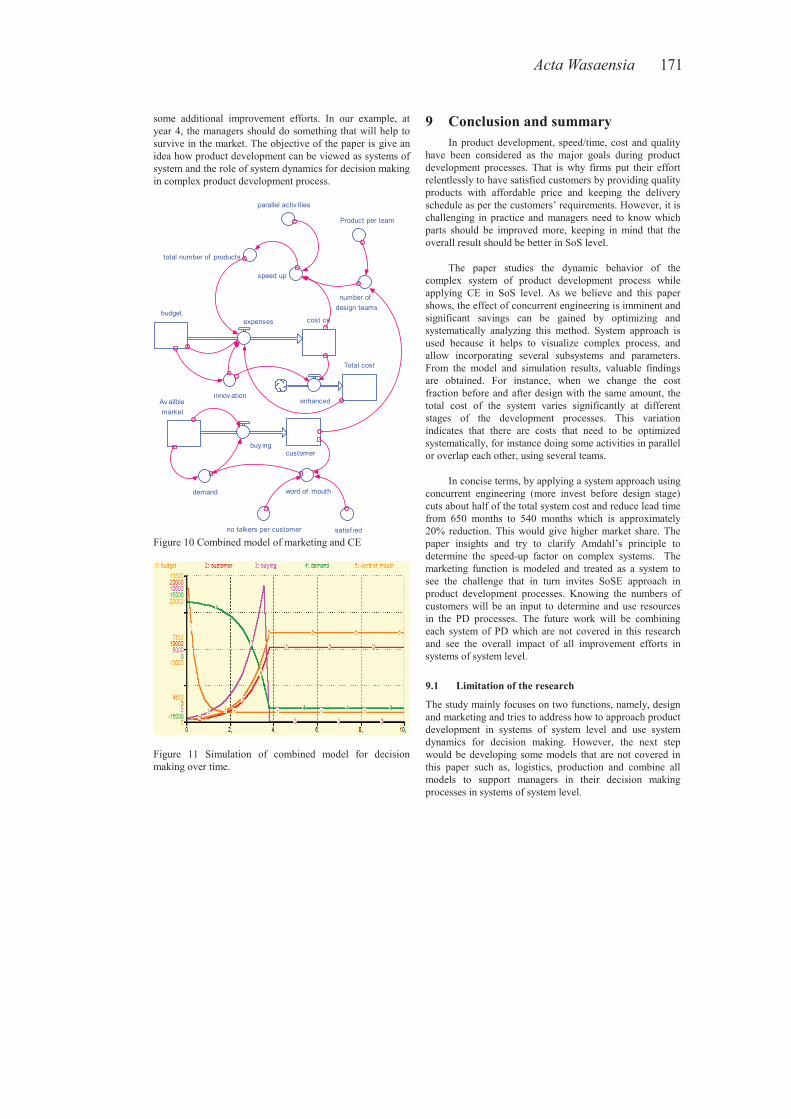
Acta Wasaensia 171
some additional improvement efforts. In our example, at year 4, the managers should do something that will help to survive in the market. The objective of the paper is give an idea how product development can be viewed as systems of system and the role of system dynamics for decision making in complex product development process.
Av ailble market
customerbuy ing
word of mouthdemand
satisf iedno talkers per customer
budgetcost ceexpenses
speed up
total number of products
parallel activ ities
number of design teams
Total cost
enhanced
Product per team
innov ation
Figure 10 Combined model of marketing and CE
Figure 11 Simulation of combined model for decision making over time.
9 Conclusion and summary In product development, speed/time, cost and quality have been considered as the major goals during product development processes. That is why firms put their effort relentlessly to have satisfied customers by providing quality products with affordable price and keeping the delivery schedule as per the customers’ requirements. However, it is challenging in practice and managers need to know which parts should be improved more, keeping in mind that the overall result should be better in SoS level.
The paper studies the dynamic behavior of the complex system of product development process while applying CE in SoS level. As we believe and this paper shows, the effect of concurrent engineering is imminent and significant savings can be gained by optimizing and systematically analyzing this method. System approach is used because it helps to visualize complex process, and allow incorporating several subsystems and parameters. From the model and simulation results, valuable findings are obtained. For instance, when we change the cost fraction before and after design with the same amount, the total cost of the system varies significantly at different stages of the development processes. This variation indicates that there are costs that need to be optimized systematically, for instance doing some activities in parallel or overlap each other, using several teams.
In concise terms, by applying a system approach using concurrent engineering (more invest before design stage) cuts about half of the total system cost and reduce lead time from 650 months to 540 months which is approximately 20% reduction. This would give higher market share. The paper insights and try to clarify Amdahl’s principle to determine the speed-up factor on complex systems. The marketing function is modeled and treated as a system to see the challenge that in turn invites SoSE approach in product development processes. Knowing the numbers of customers will be an input to determine and use resources in the PD processes. The future work will be combining each system of PD which are not covered in this research and see the overall impact of all improvement efforts in systems of system level.
9.1 Limitation of the research
The study mainly focuses on two functions, namely, design and marketing and tries to address how to approach product development in systems of system level and use system dynamics for decision making. However, the next step would be developing some models that are not covered in this paper such as, logistics, production and combine all models to support managers in their decision making processes in systems of system level.
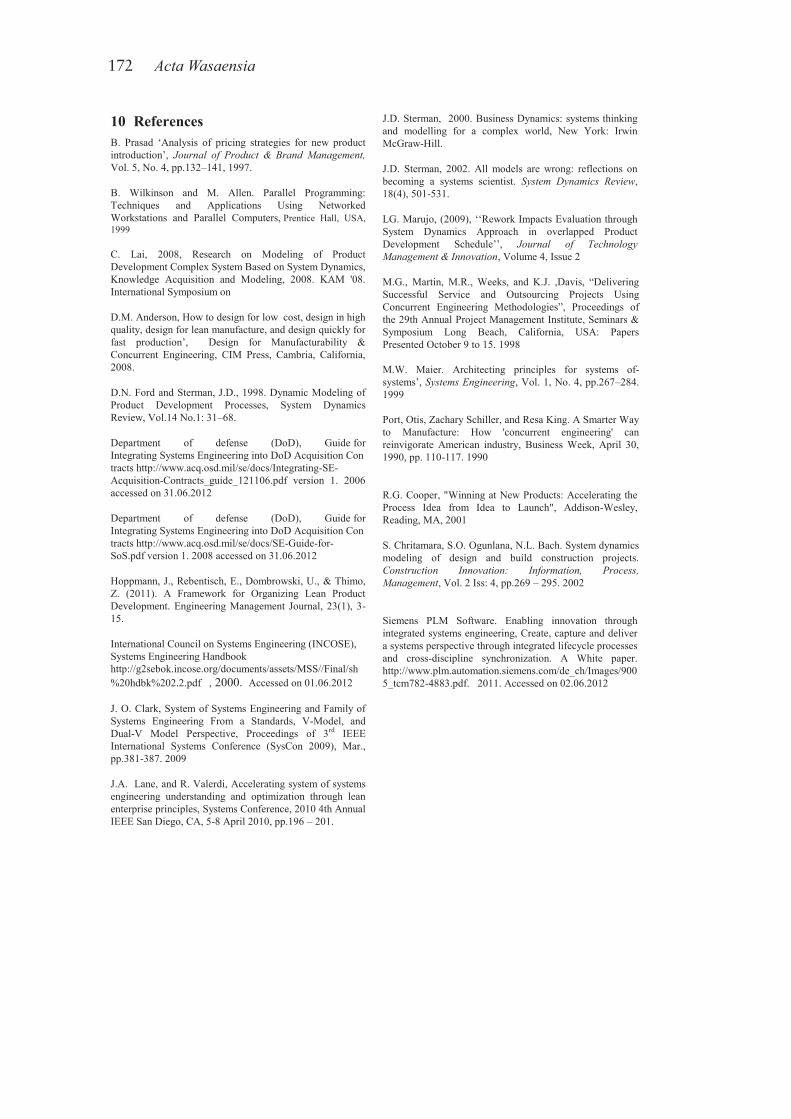
172 Acta Wasaensia
10 References B. Prasad ‘Analysis of pricing strategies for new product introduction’, Journal of Product & Brand Management, Vol. 5, No. 4, pp.132–141, 1997.
B. Wilkinson and M. Allen. Parallel Programming: Techniques and Applications Using Networked Workstations and Parallel Computers, Prentice Hall, USA, 1999
C. Lai, 2008, Research on Modeling of Product Development Complex System Based on System Dynamics, Knowledge Acquisition and Modeling, 2008. KAM '08. International Symposium on
D.M. Anderson, How to design for low cost, design in high quality, design for lean manufacture, and design quickly for fast production’, Design for Manufacturability & Concurrent Engineering, CIM Press, Cambria, California, 2008.
D.N. Ford and Sterman, J.D., 1998. Dynamic Modeling of Product Development Processes, System Dynamics Review, Vol.14 No.1: 31–68.
Department of defense (DoD), Guide for Integrating Systems Engineering into DoD Acquisition Contracts http://www.acq.osd.mil/se/docs/Integrating-SE-Acquisition-Contracts_guide_121106.pdf version 1. 2006 accessed on 31.06.2012
Department of defense (DoD), Guide for Integrating Systems Engineering into DoD Acquisition Contracts http://www.acq.osd.mil/se/docs/SE-Guide-for-SoS.pdf version 1. 2008 accessed on 31.06.2012
Hoppmann, J., Rebentisch, E., Dombrowski, U., & Thimo, Z. (2011). A Framework for Organizing Lean Product Development. Engineering Management Journal, 23(1), 3-15.
International Council on Systems Engineering (INCOSE), Systems Engineering Handbook http://g2sebok.incose.org/documents/assets/MSS//Final/sh%20hdbk%202.2.pdf , 2000. Accessed on 01.06.2012
J. O. Clark, System of Systems Engineering and Family of Systems Engineering From a Standards, V-Model, and Dual-V Model Perspective, Proceedings of 3rd IEEE International Systems Conference (SysCon 2009), Mar., pp.381-387. 2009
J.A. Lane, and R. Valerdi, Accelerating system of systems engineering understanding and optimization through lean enterprise principles, Systems Conference, 2010 4th Annual IEEE San Diego, CA, 5-8 April 2010, pp.196 – 201.
J.D. Sterman, 2000. Business Dynamics: systems thinking and modelling for a complex world, New York: Irwin McGraw-Hill.
J.D. Sterman, 2002. All models are wrong: reflections on becoming a systems scientist. System Dynamics Review, 18(4), 501-531.
LG. Marujo, (2009), ‘‘Rework Impacts Evaluation through System Dynamics Approach in overlapped Product Development Schedule’’, Journal of Technology Management & Innovation, Volume 4, Issue 2
M.G., Martin, M.R., Weeks, and K.J. ,Davis, “Delivering Successful Service and Outsourcing Projects Using Concurrent Engineering Methodologies”, Proceedings of the 29th Annual Project Management Institute, Seminars & Symposium Long Beach, California, USA: Papers Presented October 9 to 15. 1998 M.W. Maier. Architecting principles for systems of-systems’, Systems Engineering, Vol. 1, No. 4, pp.267–284. 1999 Port, Otis, Zachary Schiller, and Resa King. A Smarter Way to Manufacture: How 'concurrent engineering' can reinvigorate American industry, Business Week, April 30, 1990, pp. 110-117. 1990
R.G. Cooper, "Winning at New Products: Accelerating the Process Idea from Idea to Launch", Addison-Wesley, Reading, MA, 2001
S. Chritamara, S.O. Ogunlana, N.L. Bach. System dynamics modeling of design and build construction projects. Construction Innovation: Information, Process, Management, Vol. 2 Iss: 4, pp.269 – 295. 2002
Siemens PLM Software. Enabling innovation through integrated systems engineering, Create, capture and deliver a systems perspective through integrated lifecycle processes and cross-discipline synchronization. A White paper. http://www.plm.automation.siemens.com/de_ch/Images/9005_tcm782-4883.pdf. 2011. Accessed on 02.06.2012
Acta Wasaensia 173
18th International Society of Productivity and Enhancement conference Concurrent Engineering-CE2011, July 4-8, MIT, Boston, USA
Concurrent engineering yesterday, today and tomorrow
Alemu Moges Belaya, , Petri Helob,1 and Fentahun Moges Kasieb
aPhD student, University of Vaasa, Dept. of production, Vaasa, Finland. b,1Professor, University of Vaasa, Dept. of production, Vaasa, Finland bInstitute of technology ,Dept of Mech and Industrial Eng.,Hawassa, Ethiopia
Abstract. The purpose of this paper is to give an in-depth insight for the development and improvement of concurrent engineering in several applications. In addition to that the conceptual model that includes the new application areas is developed and presented in simplified way so that the new practitioner in the field of concurrent engineering can understand easily. The methodology that is followed in this paper is review of concurrent engineering since the philosophy has started (80’s). The paper will start with historical background of CE, explains its general characteristics, different types of processes execution while doing overlapping and parallelism. Another area that will be covered is CE in relationship with other improvement principles and philosophies (like…supply chain, BPR, TQM) and etc. The challenges of CE are presented in this article to give a glance for managerial decision making purposes. Different perspectives towards CE and application areas is presented in a way that reader can understand in simplified but with clear objective in the implementation of CE. From the findings, though there are some challenges, still there are untapped application areas (like services) that could exploit the benefits of CE if it is considered with cautions and analyzed in advance using system dynamics.
Keywords. Concurrent Engineering, Product development, Supply chain
1 Historical Background of Concurrent Engineering
Both manufacturing and services have made several changes to be competent in global markets in order to sustain their competitiveness in dynamic and turbulent global markets. One of the adopted management and manufacturing philosophies is CE that companies use to withstand the challenges, use their resources efficiently and wisely. Companies can achieve this through a CE approach of production [8]. The main objective of CE is to minimize production life cycle of a product by making processes more efficient [7]. Different researches have carried out by different stakeholders on implementation of CE to reduce product life cycle. For instance, Shorts and Boeing – have adopted 1 PhD student, University of Vaasa, Department of production, Vaasa, Finland, Tel: +358443126822; Email: [email protected]
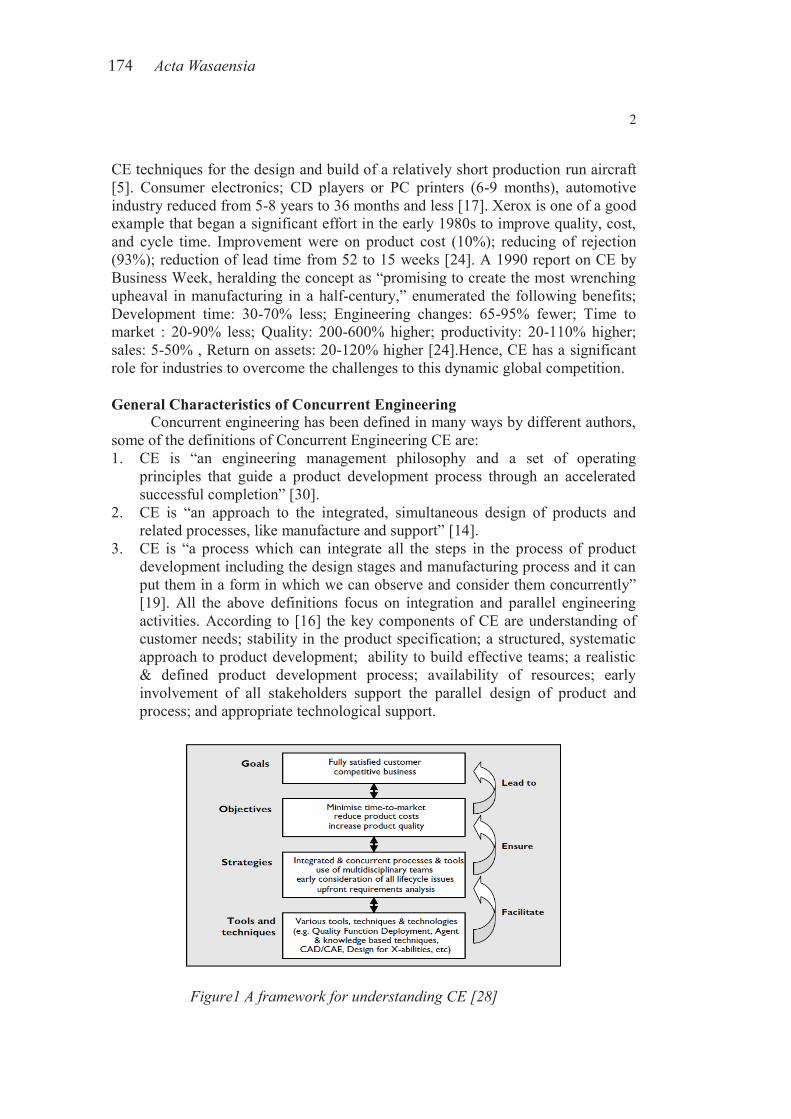
174 Acta Wasaensia
2
CE techniques for the design and build of a relatively short production run aircraft [5]. Consumer electronics; CD players or PC printers (6-9 months), automotive industry reduced from 5-8 years to 36 months and less [17]. Xerox is one of a good example that began a significant effort in the early 1980s to improve quality, cost, and cycle time. Improvement were on product cost (10%); reducing of rejection (93%); reduction of lead time from 52 to 15 weeks [24]. A 1990 report on CE by Business Week, heralding the concept as “promising to create the most wrenching upheaval in manufacturing in a half-century,” enumerated the following benefits; Development time: 30-70% less; Engineering changes: 65-95% fewer; Time to market : 20-90% less; Quality: 200-600% higher; productivity: 20-110% higher; sales: 5-50% , Return on assets: 20-120% higher [24].Hence, CE has a significant role for industries to overcome the challenges to this dynamic global competition. General Characteristics of Concurrent Engineering Concurrent engineering has been defined in many ways by different authors, some of the definitions of Concurrent Engineering CE are: 1. CE is “an engineering management philosophy and a set of operating
principles that guide a product development process through an accelerated successful completion” [30].
2. CE is “an approach to the integrated, simultaneous design of products and related processes, like manufacture and support” [14].
3. CE is “a process which can integrate all the steps in the process of product development including the design stages and manufacturing process and it can put them in a form in which we can observe and consider them concurrently” [19]. All the above definitions focus on integration and parallel engineering activities. According to [16] the key components of CE are understanding of customer needs; stability in the product specification; a structured, systematic approach to product development; ability to build effective teams; a realistic & defined product development process; availability of resources; early involvement of all stakeholders support the parallel design of product and process; and appropriate technological support.
Figure1 A framework for understanding CE [28]
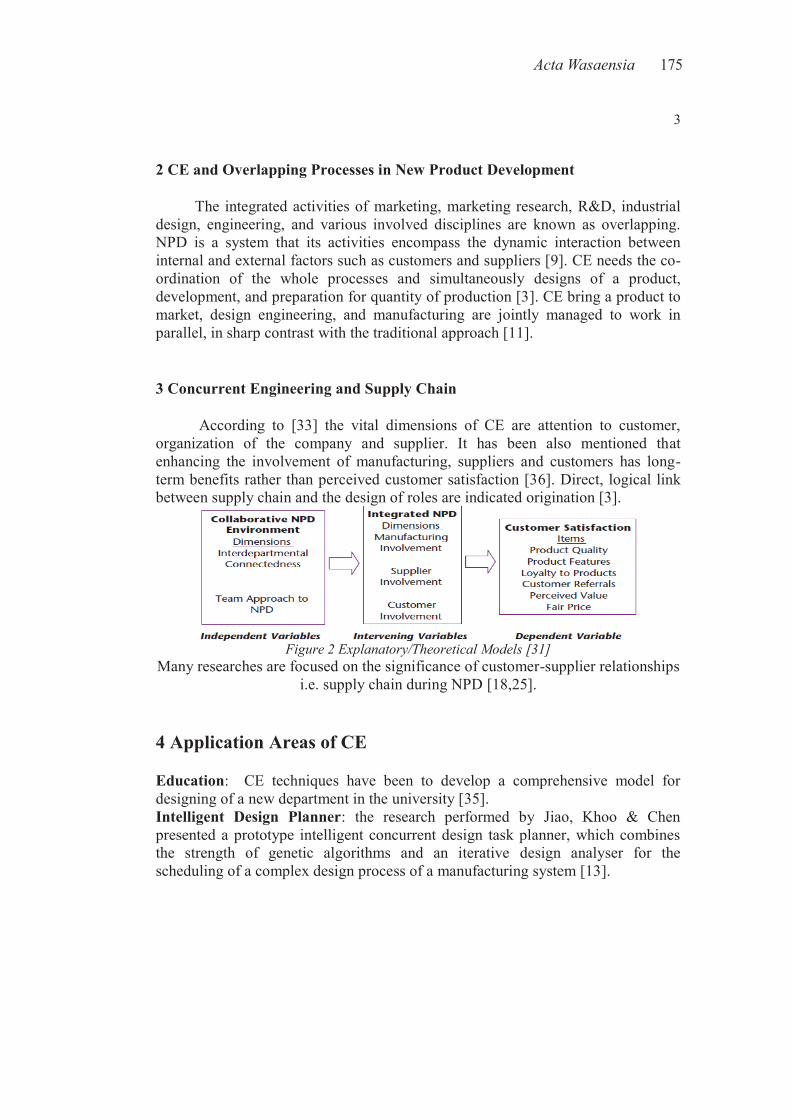
Acta Wasaensia 175
3
2 CE and Overlapping Processes in New Product Development
The integrated activities of marketing, marketing research, R&D, industrial design, engineering, and various involved disciplines are known as overlapping. NPD is a system that its activities encompass the dynamic interaction between internal and external factors such as customers and suppliers [9]. CE needs the co-ordination of the whole processes and simultaneously designs of a product, development, and preparation for quantity of production [3]. CE bring a product to market, design engineering, and manufacturing are jointly managed to work in parallel, in sharp contrast with the traditional approach [11].
3 Concurrent Engineering and Supply Chain
According to [33] the vital dimensions of CE are attention to customer, organization of the company and supplier. It has been also mentioned that enhancing the involvement of manufacturing, suppliers and customers has long-term benefits rather than perceived customer satisfaction [36]. Direct, logical link between supply chain and the design of roles are indicated origination [3].
Figure 2 Explanatory/Theoretical Models [31]
Many researches are focused on the significance of customer-supplier relationships i.e. supply chain during NPD [18,25].
4 Application Areas of CE
Education: CE techniques have been to develop a comprehensive model for designing of a new department in the university [35]. Intelligent Design Planner: the research performed by Jiao, Khoo & Chen presented a prototype intelligent concurrent design task planner, which combines the strength of genetic algorithms and an iterative design analyser for the scheduling of a complex design process of a manufacturing system [13].
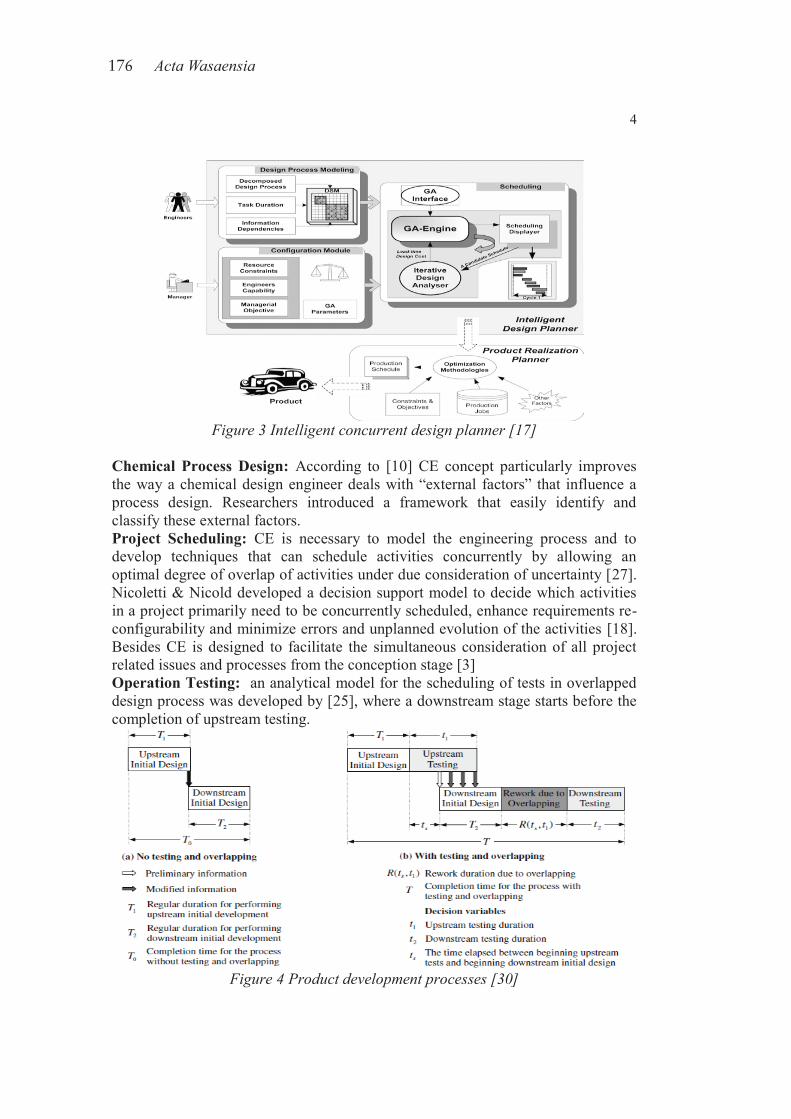
176 Acta Wasaensia
4
Figure 3 Intelligent concurrent design planner [17]
Chemical Process Design: According to [10] CE concept particularly improves the way a chemical design engineer deals with “external factors” that influence a process design. Researchers introduced a framework that easily identify and classify these external factors. Project Scheduling: CE is necessary to model the engineering process and to develop techniques that can schedule activities concurrently by allowing an optimal degree of overlap of activities under due consideration of uncertainty [27]. Nicoletti & Nicold developed a decision support model to decide which activities in a project primarily need to be concurrently scheduled, enhance requirements re-configurability and minimize errors and unplanned evolution of the activities [18]. Besides CE is designed to facilitate the simultaneous consideration of all project related issues and processes from the conception stage [3] Operation Testing: an analytical model for the scheduling of tests in overlapped design process was developed by [25], where a downstream stage starts before the completion of upstream testing.
Figure 4 Product development processes [30]
Acta Wasaensia 177
5
Construction: the adoption of CE in construction is shown by literatures [2, 14]. If we consider construction, operation and maintenance phases at early stage of a project would undoubtedly lead to an overall improvement in the project performance [2].
5 Relation with Other Concepts
Several researches indicate the positive relationships between CE and other improvement philosophies( its compatibility with TQM, BPR, IT and etc.) Total Quality Management TQM and CE: the effect of quality management on the speed of NPD and compared CE and TQM that leads to several common principles [4,28,29]. It is indicated that the possibility of CE characteristics to be incorporated in TQM approach (ISO9000:2000 standard) [22]. QFD fits ideally as a “front-end” process to CE [12]. [34] Reveals that TQM, teamwork, value analysis (VA) and QFD are all positively correlated with the speed of NPD. BPR and CE: Bovey described that BPR in a CE environment covers all dimensions from all of a business's functional groups need to be brought together. According to [6] if correctly applied, CE and BPR can be very effective in improving the performance of a company. IT & CE: The main step while implementing CE is effective cross-functional teams, which integrate the development process using both organisational and information management methods [1]. A PDM helps engineers and others manage both data and the PD processes, and hence support a CE framework in a company [16]. Kong et al. also developed mathematical model [15]. Automation and CE: CIM and concurrent engineering (CE) are multidisciplinary subjects concerned with providing computer assistance, control and high level integrated automation; at all levels of manufacturing (and other) industries, by linking islands of automation into a distributed processing system[21]. The design DFA concept is also widely used [32]. CE nowadays focused on those tools which facilitate it, CAD/CAE/CAM and MRP products [17].
6 Challenges/Limitations of CE
The challenge of developing successful products, to increase the user’s experience, needs an interrelation approach across all the key functions involved in NPD. [11] Argued on major limitations of CE. For instance, in the design of integrated circuits, subdividing the work into modules smaller than individual components can be impractical, counterproductive, resource limitations, product technology, and when subcontracted to suppliers. [20] Focused on four critical problems that challenge management while implementing CE in complex product development projects. These problems referred as iteration, parallelism, decomposition and stability. Another limitation of CE is its human resource implication. When humans are added to CE, it is logical solution but it can become messy as Filipczak indicated. Tucker & Hackney underlined that the main reasons
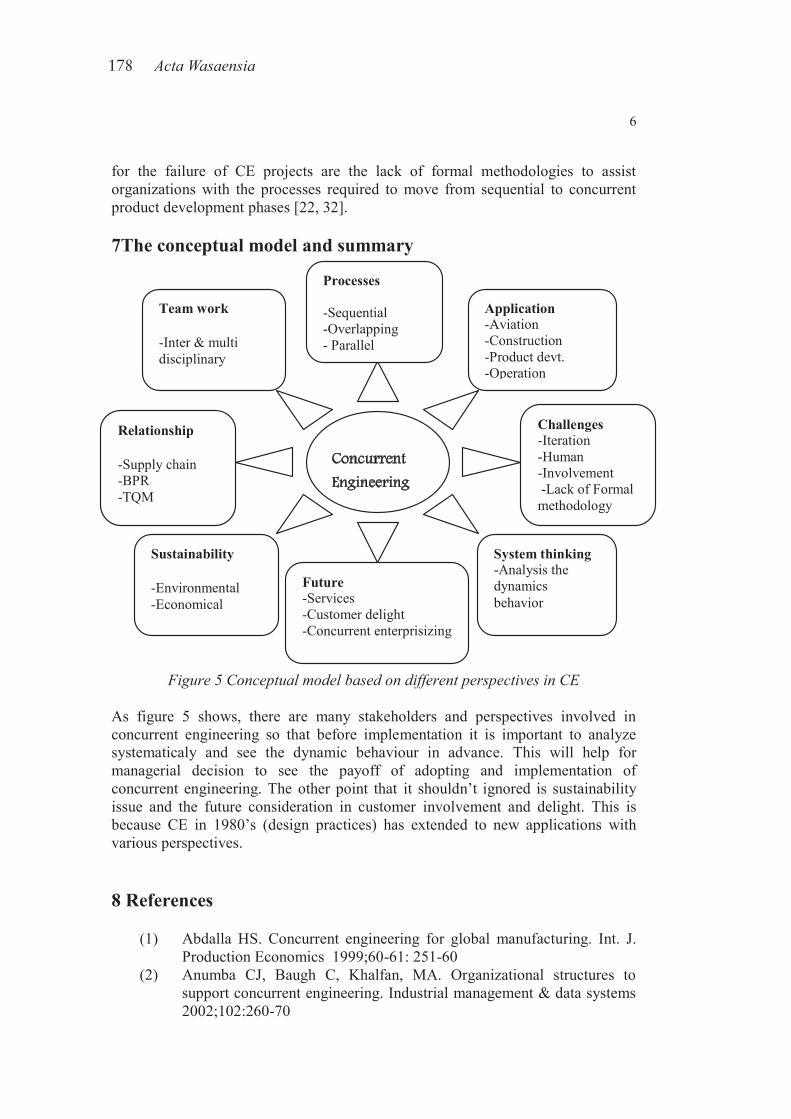
178 Acta Wasaensia
6
for the failure of CE projects are the lack of formal methodologies to assist organizations with the processes required to move from sequential to concurrent product development phases [22, 32]. 7The conceptual model and summary
Figure 5 Conceptual model based on different perspectives in CE As figure 5 shows, there are many stakeholders and perspectives involved in concurrent engineering so that before implementation it is important to analyze systematicaly and see the dynamic behaviour in advance. This will help for managerial decision to see the payoff of adopting and implementation of concurrent engineering. The other point that it shouldn’t ignored is sustainability issue and the future consideration in customer involvement and delight. This is because CE in 1980’s (design practices) has extended to new applications with various perspectives.
8 References
(1) Abdalla HS. Concurrent engineering for global manufacturing. Int. J. Production Economics 1999;60-61: 251-60
(2) Anumba CJ, Baugh C, Khalfan, MA. Organizational structures to support concurrent engineering. Industrial management & data systems 2002;102:260-70
Concurrent Engineering
Team work -Inter & multi disciplinary
Processes -Sequential -Overlapping - Parallel
Relationship -Supply chain -BPR -TQM
Sustainability -Environmental -Economical
Future -Services -Customer delight -Concurrent enterprisizing
System thinking -Analysis the dynamics behavior
Challenges -Iteration -Human -Involvement -Lack of Formal methodology
Application -Aviation -Construction -Product devt. -Operation
Acta Wasaensia 179
7
(3) Anumba CJ, Siemieniuch CE, Sinclair MA. Supply chain implications of concurrent engineering. International Journal of Physical Distribution & Logistics Management 2000; 30: 566-97
(4) Belay AM, Helo P, Takala J, Kasie FM. Effects of Quality Management Practices and Concurrent Engineering in Business Performance. International Journal of Business and Management 2011;6:45-62
(5) Bradley D. Concurrent engineering for bespoke products. Assembly Automation 1995;15:. 35-37
(6) Brooks B.Realising the benefits of concurrent engineering through BPR. Computing & Control Engineering Journal 1996
(7) Chou S, Trappey A, Pokojski J, Smith S. Global Perspective for Competitive Enterprise, Economy and Ecology: Proceedings of the 16th ISPE International Conference on Concurrent Engineering 2009
(8) Curran R, Chou SY, Trappey A. Collaborative Product and Service Life Cycle Management for a Sustainable World. Proceedings of the 15th ISPE International Conference on Concurrent Engineering. Verlag London Limited 2008: Springer
(9) Harmancioglu N, McNally RC, Calantone RJ, Durmusoglu SS.Your new product development [NPD) is only as good as your process: an exploratory analysis of new NPD process design and implementation. R&D Management 2007; 37:339-424
(10) Herder PM, Weijnen PC. A concurrent engineering approach to chemical process design Int. J. Production Economics 2000;64: 311-18
(11) Hoedemaker GM, Blackburn JD, Van Wassenhove LN. Limits of concurrency. Decision sciences 1999;30:1-18
(12) Jarvis M. Concurrent engineering. Work Study 1999;48:88–91 (13) Jiao LM, Khoo LP, Chen CH. An intelligent concurrent design task
lanner for manufacturing systems. Int J Adv Manuf Technol 2004; 23: 672–81
(14) Kamara JM, Anumba CJ, Evbuomwan NFO. Developments in the Implementation of Concurrent Engineering in Construction. International Journal of Computer-Integrated Design and Construction 2000; 2: 68–78.
(15) Kong L, Bhuiyan N, Thomson V. The Value of Organizational Structures. Concurrent Engineering 2009; 17: 61-72
(16) Kumar R, Midha PS. A QFD based methodology for evaluating a company’s PDM requirements for collaborative product development. Industrial management and data systems 2001;101:126-31
(17) Landeghem RV. Experiences with a concurrent engineering self-assessment tool. Int. J. Production Economics 2000; 64:295-309
(18) Li Y, Jian J, Yan R, Liao W. Aircraft Tooling Collaborative Design Based on Multi-agent and PDM. Concurrent Engineering 2009; 17: 139-46
(19) Lindquist A, Berglund F, Johannesson H. Supplier Integration and Communication Strategies in Collaborative Platform Development. Concurrent Engineering 2008; 16: 23-35
180 Acta Wasaensia
8
(20) Luh D, Ko Y, Ma C. A Dynamic Planning Approach for New Product Development. Concurrent Engineering 2009; 17: 43-59
(21) Maffin D, Braiden P. Manufacturing and supplier roles in product development. Int. J. Production Economics 2001;69: 205-13
(22) Melin T, Isikveren AT, Rizzi A, Stamblewski C, Anders HV. How industry concepts of concurrent engineering enhance aircraft design education. Proc. Imeche Vol. 221 Part G: J. Aerospace Engineering JAERO127 imeche 2007
(23) Najmi M, Ip-Shing F. Concurrent Engineering in Total Quality Management Environment”, 8th International Conference on Concurrent Enterprising 2002, Rome, Italy.
(24) Nicoletti S, Nicolo F. A concurrent engineering decision model: Management of the project activities information flows. Int. J. Production Economics 19981;54: 115-27
(25) O'Neal C. Concurrent Engineering with Early Supplier Involvement: A Cross- Functional Challenge. International Journal of Purchasing and Materials Management, Spring 1993; 1-9
(26) Qian Y , Xie M, Goh TN, Lin J. Decision Support Optimal testing strategies in overlapped design process. European Journal of Operational Research 2010; 206: 131–43
(27) Ranky PG. Features Concurrent Engineering and Enterprise Modeling. Assembly Automation 1994;14:14-21.
(28) Rolstadas A. Planning and control of concurrent engineering projects. Int. J. Production Economics 1995; 38: 3-13
(29) Sun H, Zhao Y, and Hon Keung Yau HK. The relationship between quality management and the speed of new product development. The TQM Journal 2009; 21:576-88.
(30) Sun H, Zhao Y. The empirical relationship between quality management and the speed of new product development Total Quality Management 2010;21:351–61
(31) Tan CL, Tracey M. Collaborative New Product Development Environments: Implications for Supply Chain Management. The Journal of Supply Chain Management Summer 2007;1-15
(32) Tucker D, Hackney R. Towards the integration of concurrent engineering environment within organizational strategy. Journal of management development 2000;19:179-89
(33) Veryzer RW, de Mozota BB. The Impact of User-Oriented Design on New Product Development: An Examination of Fundamental Relationships. J Prod Innov Manag 2005;22:128–43
(34) Willaert SA, de Graaf R, Minderhoud S. concurrent engineering in a wider context. J. Eng. Manage. 1998;15:87-109
(35) Yang CC, Chen SH, Jiun-Yan Shiau JY. A DFX and concurrent engineering model for the establishment of a new department in a university. Int. J. Production Economics 2007;107: 179–89
(36) Yassine A, Braha D. Complex Concurrent Engineering and the Design Structure Matrix Method. Concurrent Engineering 2003; 11: 165-76