Embed Size (px)
Citation preview
July 30, 2018
ICICI Securities Ltd | Retail Equity Research
Result Update
Revenue beat; but margins disappoint...
Revenues grew 33% YoY to | 863 crore (I-direct estimate: | 817
crore) on account of 40% YoY growth in domestic formulations to
| 331 crore (I-direct estimate: | 327 crore), up 79% YoY in
international (ex-US) business to | 126 crore (I-direct estimate: | 69
crore) and 38.5% YoY growth in API segment to | 180 crore
EBITDA margins improved 186 bps YoY to 17.5% but came in lower-
than I-direct estimate of 20.0% mainly due higher other expenditure.
EBITDA grew 48.8% YoY to | 151 crore
Net profit grew 35.6% YoY to | 90.4 crore (I-direct estimate: | 104.7
crore). Growth in operational performance was partly offset by
higher interest cost and tax rate (25.9% vs. 19.6% in Q1FY18)
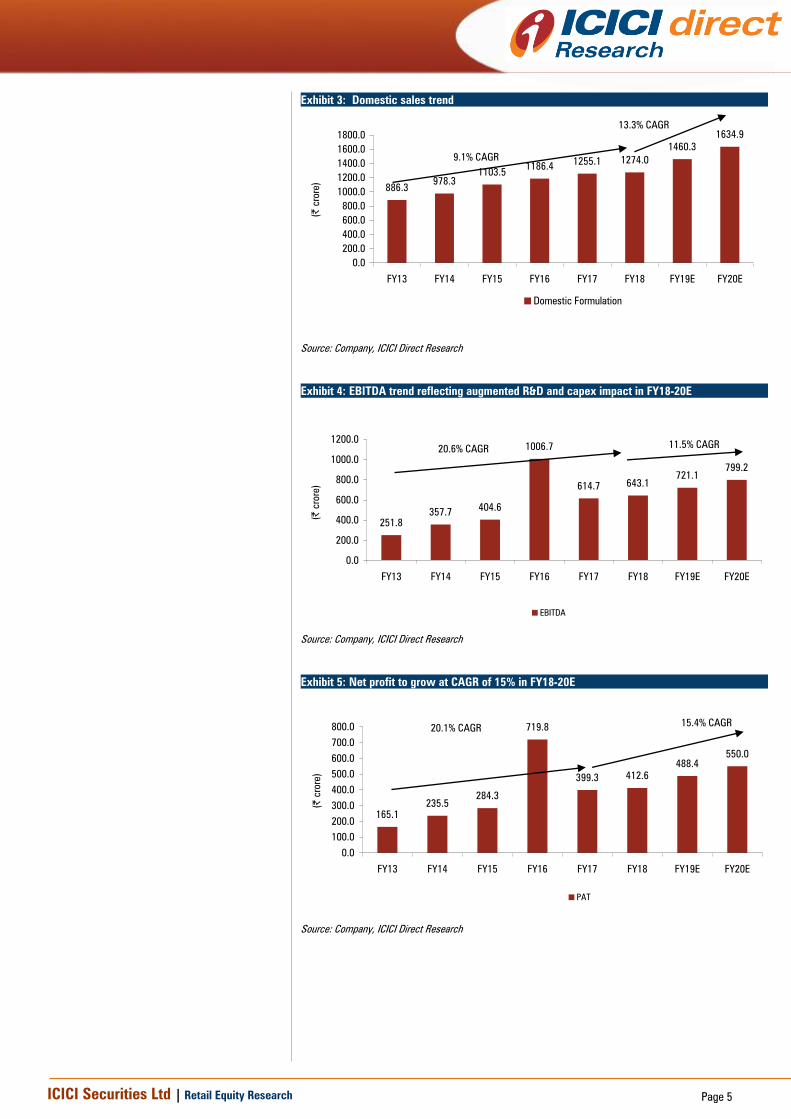
Domestic sales growth riding on speciality segment growth
APL’s domestic formulation sales (41% of total revenues) grew at ~9%
CAGR in FY13-18 mainly due to ~19% growth in the speciality segment.
Specialty contribution in the domestic branded space increased to 68% in
FY18 from 49% in FY13. With a 5000+ marketing team at its disposal, the
company enjoys a wide reach among doctors. We expect the speciality
segment to grow at 15-20% CAGR in FY18-20E on the back of aggressive
product launches and constant addition of new speciality segments and
sub-segments. Overall, we expect domestic formulations to grow at 13%
CAGR in FY18-20E to | 1635 crore.
US key growth driver for generic exports
APL’s exports generic business (38% of FY18 revenues) grew at ~45%
CAGR in FY13-18 to | 1207 crore driven by strong traction in the US (77%
of export sales). The US traction was on the back of consistent product
launches including limited competition products. Despite being a late
entrant, the company has done reasonably well with a product basket of
132 ANDA filings with 62 pending final approvals. APL has already
demonstrated required capabilities by securing limited competition
approvals like gAbilify(CNS), gExforge(CVS), gCelebrex(Pain) and
gMicardis(CVS). APL now has its own front-end team, which gives better
control on its product launches. We expect US sales to register 15%
CAGR in FY18-20E to | 1235 due to new launches.
High capex, R&D to drive long term growth plans
Alembic has spent | 1000-1500 crore in FY16-18 and also guided an
additional ~| 600 crore capex for FY19 to set up injectable, oral solid
oncology facilities, API capacity ramp-up and to set up a plant under the
Derma JV (orbicular). Guidance | 450-500 crore (i.e. ~14% of sales) of
R&D for FY19 was one of the highest in the industry in percentage term.
Both heads are likely to witness above normal outflows.
R&D, capex benefits back-loaded; maintain HOLD
Beat in Q1 revenues was mainly attributable to non-sustainable ex-US
export business and volatile API segment. Margins were also
disappointing. The management has guided for 18-20% margins in FY19.
With the announcement of aggressive R&D and capex plans, the
management has signalled its long term strategy for the next five to six
years, especially on the US front. This includes a foray into niche areas
like oncology, injectables, derma, etc. We believe this is fraught with a
new set of challenges. The benefits are most likely to be back-loaded.
Immediate cash burn is likely to weigh on sentiments in the near term.
Accordingly, we arrive at our new target price of | 525 based on 18x
FY20E EPS of | 29.2.
Rating matrix
Rating : Hold
Target : | 525
Target Period : 12-15 months
Potential Upside : -5%
What’s Changed?
Target Changed from | 460 to | 525
EPS FY19E Changed from | 23 to | 25.9
EPS FY20E Changed from | 28.6 to | 29.2
Rating Unchanged
Quarterly Performance
Q1FY19 Q1FY18 YoY (%) Q4FY18 QoQ (%)
Revenue 862.5 648.2 33.1 853.3 1.1
EBITDA 151.0 101.4 48.8 173.2 -12.8
EBITDA (%) 17.5 15.6 185.6 20.3 -279.5
Net Profit 90.4 66.7 35.6 93.8 -3.6
Key Financials
(|crore) FY17 FY18 FY19E FY20E
Revenues 3134.6 3130.8 3688.3 3964.3
EBITDA 614.7 643.1 721.1 799.2
Net Profit 399.3 412.6 488.4 550.0
EPS (|) 21.2 21.9 25.9 29.2
Valuation summary
FY17 FY18 FY19E FY20E
PE (x) 26.2 25.4 21.4 19.0
Target PE (x) 24.8 24.0 20.3 18.0
EV to EBITDA (x) 16.9 17.2 15.8 13.8
ROIC (%) 34.5 27.9 30.9 32.4
RoNW (%) 21.0 18.6 18.7 18.1
RoCE (%) 25.3 18.0 16.8 18.0
Stock data
Particular
Market Capitalisation
Debt (FY18)
Cash & cash equivalents (FY18)
EV
52 week H/L 598/412
Equity capital | 38 crore
Face value | 2
| 90 crore
| 11086 crore
Amount
| 10468 crore
| 708 crore
Price performance (%)
1M 3M 6M 1Y
Alembic Pharma 11.4 4.9 0.9 3.2
Ajanta Pharma 14.1 -17.3 -22.6 -21.1
Torrent Pharma 5.9 4.9 10.4 20.3
Research Analyst
Siddhant Khandekar
Mitesh Shah
Alembic Pharma (ALEPHA) | 483
ICICI Securities Ltd | Retail Equity Research Page 2
Variance analysis
Q1FY19 Q1FY19E Q1FY18 Q4FY18 YoY (%) QoQ (%) Comments
Revenue 862.5 816.9 648.2 853.3 33.1 1.1 YoY growth mainly due to 40% growth in domestic formulations and 38.5%
growth in API segment. Beat via-a-vis I-direct estimates due to higher-than-
expected sales in API and non US export business
Raw Material Expenses 255.4 245.1 182.0 263.8 40.4 -3.2 154 bps YoY decline due to adverse product mix
Employee Expenses 164.9 163.4 158.5 157.3 4.0 4.9
R&D Expenditure 121.5 110.3 94.0 121.1 29.3 0.3
Other Expenditure 169.7 134.8 112.2 137.9 51.2 23.1
EBITDA 151.0 163.4 101.4 173.2 48.8 -12.8
EBITDA (%) 17.5 20.0 15.6 20.3 186 bps -280 bps YoY improved mainly due to lower employee cost. Miss vis-à-vis I-direct
estimates mainly due to higher other expenditure
Interest 1.6 1.3 0.9 1.3 76.4 17.2
Depreciation 27.6 31.8 21.8 31.6 26.4 -12.6
Other Income 0.1 0.6 0.2 0.6 -41.2 -84.4
PBT before EO & Forex 121.9 130.9 78.9 141.0 54.6 -13.5
Forex & EO 0.0 0.0 0.0 0.0 NA NA
PBT 121.9 130.9 78.9 141.0 54.6 -13.5
Tax 31.5 26.2 15.5 38.5 103.7 -18.1
PAT before MI 90.4 104.7 63.4 102.4 42.6 -11.8
Net Profit 90.4 104.7 66.7 93.8 35.6 -3.6 YoY higher net profit growth mainly due to a better operational performance
and lower tax rate. Beat vis-à-vis estimates mainly in sync with EBITDA
besides lower interest and depreciation
Key Metrics
Domestic Formulation 331.0 326.5 236.0 273.6 40.3 21.0 YoY growth was mainly due to lower base of GST implementation in Q1FY18
International 352.0 343.4 282.0 352.0 24.8 0.0 YoY growth was mainly due to 78.8% growth in ex US export business to |
126 crore. US business grew 6.9% YoY to | 226 crore
APIs 180.0 143.0 130.0 198.0 38.5 -9.1
Common size (%)
Source: Company, ICICI Direct Research
Change in estimates
(| Crore) Old New % Change Old New % Change Comments
Revenue 3,476.7 3,688.3 6.1 3,919.5 3,964.3 1.1 Change as per management guidance and higher-than-expected sales in Q1FY19
EBITDA 678.0 721.1 6.4 823.1 799.2 -2.9
EBITDA Margin (%) 19.5 19.5 5 bps 21.0 20.2 -84 bps
PAT 434.4 488.4 12.4 538.4 550.0 2.1 Changed mainly in sync with operational growth
EPS (|) 23.0 25.9 12.7 28.6 29.2 2.0
FY19E FY20E
Source: Company, ICICI Direct Research
Assumptions
(| crore) FY17 FY18 FY19E FY20E FY19E FY20E
Domestic Formulation 1,255.1 1,274.0 1,460.3 1,634.9 1,500.0 1,683.8
Export sales 1,236.5 1,207.0 1,484.2 1,543.1 1,296.6 1,510.8 Change as per management guidance
APIs 640.2 650.0 726.0 762.3 674.2 707.9 Change mainly due to higher-than-expected sales in Q1FY19
Current Earlier
Source: Company, ICICI Direct Research
ICICI Securities Ltd | Retail Equity Research Page 3
Company Analysis
Tracing its roots way back to 1907, the company has remained an active
player in the domestic formulations space with a few legacy brands like
Azithral, Althrocin and Wikoryl in the anti-infective and cough & cold
segments. In 2011, APL was de-merged from Alembic Ltd to provide
more thrust to formulations and insulate this business from the vagaries
of commoditised APIs. Formulations account for 79% of the business
while the rest comes from APIs. As of FY18, the domestic: exports
formulation ratio was at 51:49. Consolidated revenues, EBITDA and PAT
have grown at a CAGR of 16%, 21% and 20%, respectively, in FY13-18.
The company’s domestic branded portfolio is gradually shifting to the
speciality business segment, which now accounts for ~65% of domestic
branded formulations in FY18 from 49% in FY13.
Export formulations constitute 38% of revenues (FY18). Of this, ~77% of
export formulations are generics catering to the regulated market of the
US. APL owns ~70 approved ANDA across US markets with 62 pending
ANDA.
The company has acquired US based Orit Laboratories LLC along with
real estate. Orit is focused on developing and filing oral solid and liquid
products. With 8,600 square feet R&D and pilot manufacturing facility, it
has seven approved ANDAs and four ANDAs pending approval. Orit adds
complementary skill sets in soft gelatin based oral solids and oral liquids
to Alembic with a team of eight highly experienced scientists.
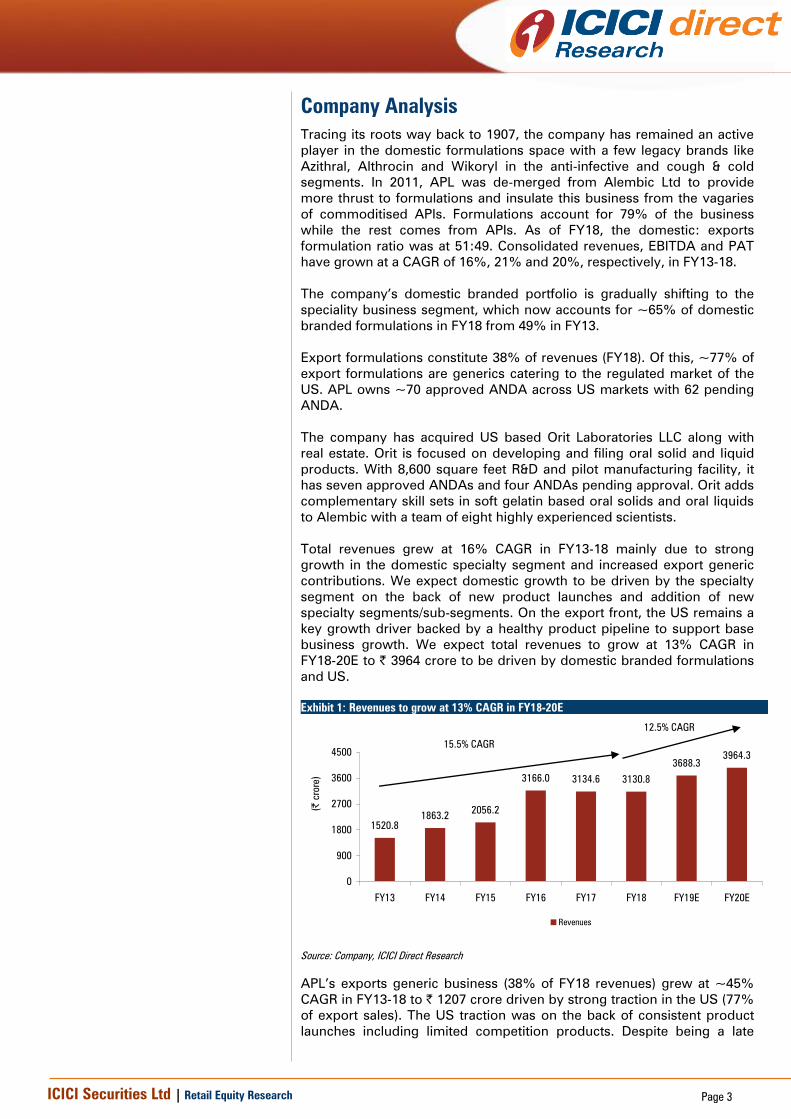
Total revenues grew at 16% CAGR in FY13-18 mainly due to strong
growth in the domestic specialty segment and increased export generic
contributions. We expect domestic growth to be driven by the specialty
segment on the back of new product launches and addition of new
specialty segments/sub-segments. On the export front, the US remains a
key growth driver backed by a healthy product pipeline to support base
business growth. We expect total revenues to grow at 13% CAGR in
FY18-20E to | 3964 crore to be driven by domestic branded formulations
and US.
Exhibit 1: Revenues to grow at 13% CAGR in FY18-20E
1520.8
1863.22056.2
3166.0 3134.6 3130.8
3688.3
3964.3
0
900
1800
2700
3600
4500
FY13 FY14 FY15 FY16 FY17 FY18 FY19E FY20E
(|
crore)
Revenues
Source: Company, ICICI Direct Research
APL’s exports generic business (38% of FY18 revenues) grew at ~45%
CAGR in FY13-18 to | 1207 crore driven by strong traction in the US (77%
of export sales). The US traction was on the back of consistent product
launches including limited competition products. Despite being a late
15.5% CAGR
12.5% CAGR
ICICI Securities Ltd | Retail Equity Research Page 4
entrant, the company has done reasonably well with a product basket of
132 ANDA filings with 62 pending final approvals. APL has already
demonstrated required capabilities by securing approvals for limited
competition products like gAbilify (CNS), gExforge (CVS), gCelebrex
(Pain) and gMicardis (CVS). The company now has its own front-end
team, which gives it better control on its product launches. We expect US
sales to register 15% CAGR in FY18-20E to | 1235 due to its front-end
initiatives and new launches.
Exhibit 2: US sales trend (US growth to be 15.3% in FY18-20E)
129.7
331.7368.1
1248.1
917.0
1234.8
928.5
1027.2
0
400
800
1200
1600
FY13 FY14 FY15 FY16 FY17 FY18 FY19E FY20E
(|
crore)
US Sales
Source: Company, ICICI Direct Research
Over the years, APL has developed power brands like Azithral and
Althrocin in the anti-infective segment. Historically, the company’s
domestic portfolio was tilted more towards acute therapies, especially the
anti-infective segment. Anti-infective was in fact the identity for APL.
However, most of these products came under price control - some under
DPCO 1990 and more under NLEM 2011 later. Hence, to mitigate the price
control impact, the erstwhile Alembic Ltd acquired the non-oncology
portfolio of Dabur Pharma in 2007. Gradually, the company restricted its
anti-infective focus to key legacy brands and diverted the resources
towards speciality segments. Domestic formulation sales (40% of
revenues in FY18) grew at 9% CAGR in FY13-18 to | 1653 crore mainly
due to strong growth in the specialty segment. The specialty portfolio
grew at 19% CAGR in FY13-18. At the same time, the anti-infective
segment contribution reduced ~1297 bps, resulting in an improvement in
the acute: speciality ratio to 35:65 in FY18 from 51:49 in FY13.
With 5000+ MRs at its disposal, the company enjoys a wide reach among
doctors. APL has added ~1000 MRs in the past four years to widen its
focus on the specialty segment by introducing more divisions within
segments. We expect the domestic speciality segment to maintain its
strong growth trajectory backed by its aggressive approach of introducing
new divisions and launching products in existing & new therapeutic areas.
While the acute segment growth is likely to recover, it would remain in
single digits in the near future. We expect domestic formulations to grow
at a CAGR of 13% to | 1635 crore in FY18-20E.
ICICI Securities Ltd | Retail Equity Research Page 5
Exhibit 3: Domestic sales trend
886.3978.3
1103.51186.4
1255.1 1274.0
1460.3
1634.9
0.0
200.0
400.0
600.0
800.0
1000.0
1200.0
1400.0
1600.0
1800.0
FY13 FY14 FY15 FY16 FY17 FY18 FY19E FY20E
(|
crore)
Domestic Formulation
Source: Company, ICICI Direct Research
Exhibit 4: EBITDA trend reflecting augmented R&D and capex impact in FY18-20E
251.8
357.7404.6
1006.7
614.7643.1
721.1
799.2
0.0
200.0
400.0
600.0
800.0
1000.0
1200.0
FY13 FY14 FY15 FY16 FY17 FY18 FY19E FY20E
(|
crore)
EBITDA
Source: Company, ICICI Direct Research
Exhibit 5: Net profit to grow at CAGR of 15% in FY18-20E
165.1
235.5
284.3
719.8
399.3 412.6
488.4
550.0
0.0
100.0
200.0
300.0
400.0
500.0
600.0
700.0
800.0
FY13 FY14 FY15 FY16 FY17 FY18 FY19E FY20E
(|
crore)
PAT
Source: Company, ICICI Direct Research
9.1% CAGR
13.3% CAGR
20.6% CAGR 11.5% CAGR
20.1% CAGR 15.4% CAGR
ICICI Securities Ltd | Retail Equity Research Page 6
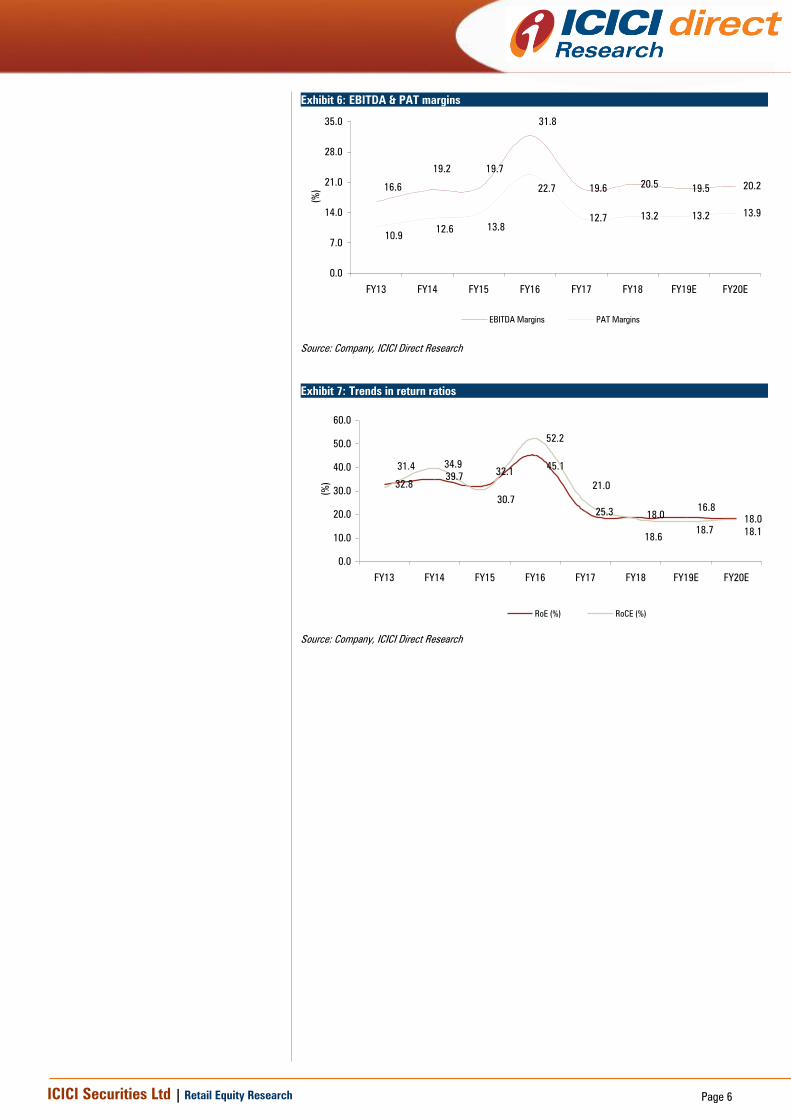
Exhibit 6: EBITDA & PAT margins
19.620.5
19.5 20.2
12.7 13.2 13.213.9
16.6
19.2 19.7
31.8
10.912.6 13.8
22.7
0.0
7.0
14.0
21.0
28.0
35.0
FY13 FY14 FY15 FY16 FY17 FY18 FY19E FY20E
(%
)EBITDA Margins PAT Margins
Source: Company, ICICI Direct Research
Exhibit 7: Trends in return ratios
32.8
52.2
18.0
34.9
32.145.1
21.0
18.6
18.7 18.1
31.4
39.7
30.7
25.318.0
16.8
0.0
10.0
20.0
30.0
40.0
50.0
60.0
FY13 FY14 FY15 FY16 FY17 FY18 FY19E FY20E
(%
)
RoE (%) RoCE (%)
Source: Company, ICICI Direct Research
ICICI Securities Ltd | Retail Equity Research Page 7
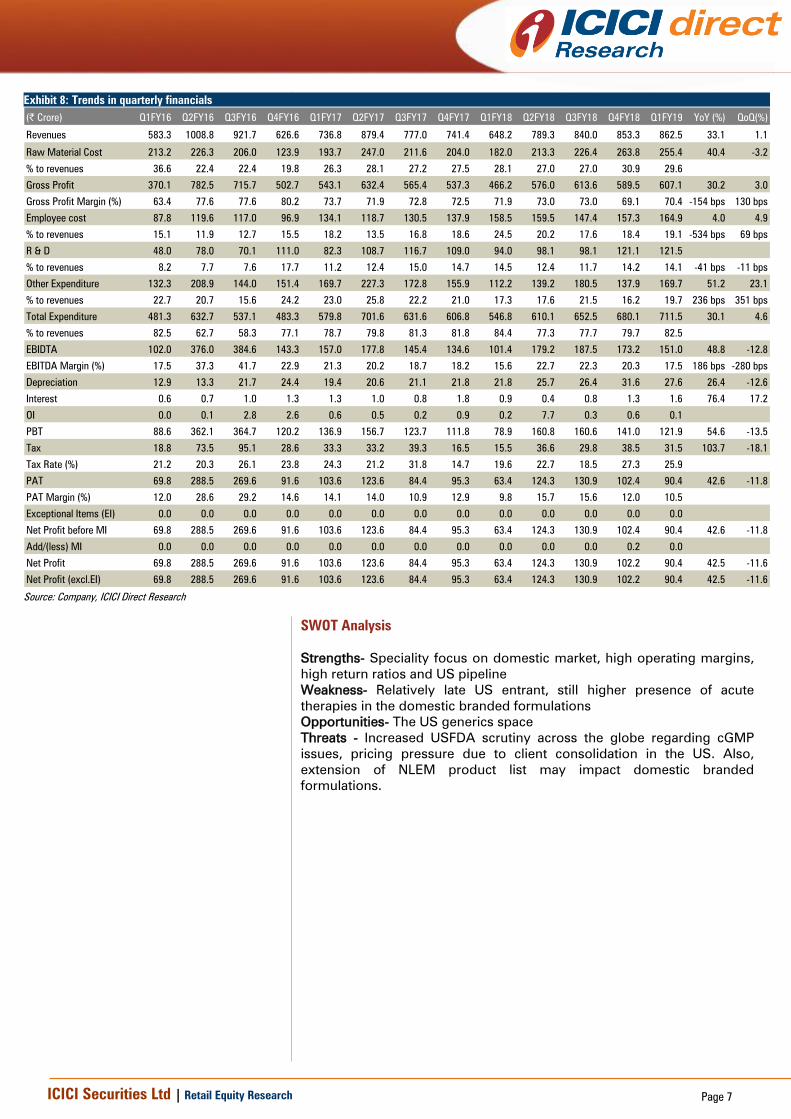
Exhibit 8: Trends in quarterly financials
(| Crore) Q1FY16 Q2FY16 Q3FY16 Q4FY16 Q1FY17 Q2FY17 Q3FY17 Q4FY17 Q1FY18 Q2FY18 Q3FY18 Q4FY18 Q1FY19 YoY (%) QoQ(%)
Revenues 583.3 1008.8 921.7 626.6 736.8 879.4 777.0 741.4 648.2 789.3 840.0 853.3 862.5 33.1 1.1
Raw Material Cost 213.2 226.3 206.0 123.9 193.7 247.0 211.6 204.0 182.0 213.3 226.4 263.8 255.4 40.4 -3.2
% to revenues 36.6 22.4 22.4 19.8 26.3 28.1 27.2 27.5 28.1 27.0 27.0 30.9 29.6
Gross Profit 370.1 782.5 715.7 502.7 543.1 632.4 565.4 537.3 466.2 576.0 613.6 589.5 607.1 30.2 3.0
Gross Profit Margin (%) 63.4 77.6 77.6 80.2 73.7 71.9 72.8 72.5 71.9 73.0 73.0 69.1 70.4 -154 bps 130 bps
Employee cost 87.8 119.6 117.0 96.9 134.1 118.7 130.5 137.9 158.5 159.5 147.4 157.3 164.9 4.0 4.9
% to revenues 15.1 11.9 12.7 15.5 18.2 13.5 16.8 18.6 24.5 20.2 17.6 18.4 19.1 -534 bps 69 bps
R & D 48.0 78.0 70.1 111.0 82.3 108.7 116.7 109.0 94.0 98.1 98.1 121.1 121.5
% to revenues 8.2 7.7 7.6 17.7 11.2 12.4 15.0 14.7 14.5 12.4 11.7 14.2 14.1 -41 bps -11 bps
Other Expenditure 132.3 208.9 144.0 151.4 169.7 227.3 172.8 155.9 112.2 139.2 180.5 137.9 169.7 51.2 23.1
% to revenues 22.7 20.7 15.6 24.2 23.0 25.8 22.2 21.0 17.3 17.6 21.5 16.2 19.7 236 bps 351 bps
Total Expenditure 481.3 632.7 537.1 483.3 579.8 701.6 631.6 606.8 546.8 610.1 652.5 680.1 711.5 30.1 4.6
% to revenues 82.5 62.7 58.3 77.1 78.7 79.8 81.3 81.8 84.4 77.3 77.7 79.7 82.5
EBIDTA 102.0 376.0 384.6 143.3 157.0 177.8 145.4 134.6 101.4 179.2 187.5 173.2 151.0 48.8 -12.8
EBITDA Margin (%) 17.5 37.3 41.7 22.9 21.3 20.2 18.7 18.2 15.6 22.7 22.3 20.3 17.5 186 bps -280 bps
Depreciation 12.9 13.3 21.7 24.4 19.4 20.6 21.1 21.8 21.8 25.7 26.4 31.6 27.6 26.4 -12.6
Interest 0.6 0.7 1.0 1.3 1.3 1.0 0.8 1.8 0.9 0.4 0.8 1.3 1.6 76.4 17.2
OI 0.0 0.1 2.8 2.6 0.6 0.5 0.2 0.9 0.2 7.7 0.3 0.6 0.1
PBT 88.6 362.1 364.7 120.2 136.9 156.7 123.7 111.8 78.9 160.8 160.6 141.0 121.9 54.6 -13.5
Tax 18.8 73.5 95.1 28.6 33.3 33.2 39.3 16.5 15.5 36.6 29.8 38.5 31.5 103.7 -18.1
Tax Rate (%) 21.2 20.3 26.1 23.8 24.3 21.2 31.8 14.7 19.6 22.7 18.5 27.3 25.9
PAT 69.8 288.5 269.6 91.6 103.6 123.6 84.4 95.3 63.4 124.3 130.9 102.4 90.4 42.6 -11.8
PAT Margin (%) 12.0 28.6 29.2 14.6 14.1 14.0 10.9 12.9 9.8 15.7 15.6 12.0 10.5
Exceptional Items (EI) 0.0 0.0 0.0 0.0 0.0 0.0 0.0 0.0 0.0 0.0 0.0 0.0 0.0
Net Profit before MI 69.8 288.5 269.6 91.6 103.6 123.6 84.4 95.3 63.4 124.3 130.9 102.4 90.4 42.6 -11.8
Add/(less) MI 0.0 0.0 0.0 0.0 0.0 0.0 0.0 0.0 0.0 0.0 0.0 0.2 0.0
Net Profit 69.8 288.5 269.6 91.6 103.6 123.6 84.4 95.3 63.4 124.3 130.9 102.2 90.4 42.5 -11.6
Net Profit (excl.EI) 69.8 288.5 269.6 91.6 103.6 123.6 84.4 95.3 63.4 124.3 130.9 102.2 90.4 42.5 -11.6
Source: Company, ICICI Direct Research
SWOT Analysis
Strengths- Speciality focus on domestic market, high operating margins,
high return ratios and US pipeline
Weakness- Relatively late US entrant, still higher presence of acute
therapies in the domestic branded formulations
Opportunities- The US generics space
Threats - Increased USFDA scrutiny across the globe regarding cGMP
issues, pricing pressure due to client consolidation in the US. Also,
extension of NLEM product list may impact domestic branded
formulations.
ICICI Securities Ltd | Retail Equity Research Page 8
Conference call Highlights
The company has filed three ANDAs (including one from Orit) and
one DMF in Q1FY19. Cumulative ANDA filings were at 135. It has
received three USFDA approvals in Q1FY19. Cumulative ANDA
approvals were at 73 including nine tentative approvals. Out of 62
pending approvals ~20% are P-IV or FTFs
Strong non-US growth was mainly due to clearance of supply
backlogs and market share gain by the partners. The management
expects similar growth for the next two quarters
US growth was mainly due to volume gain from existing products
The company has guided for 18-20% margins in FY19
Adverse government regulation on fixed dosage combinations
(FDC) has impacted one of the company’s products, which is
likely to have a minor impact on overall financials
The company expects to start dermatology approvals in the US
from FY20 and injectables from FY21
The company is capitalising ~| 45-50 crore annually related to
operational cost of validation batches from new plants
Q1FY19 capex was at | 156 crore
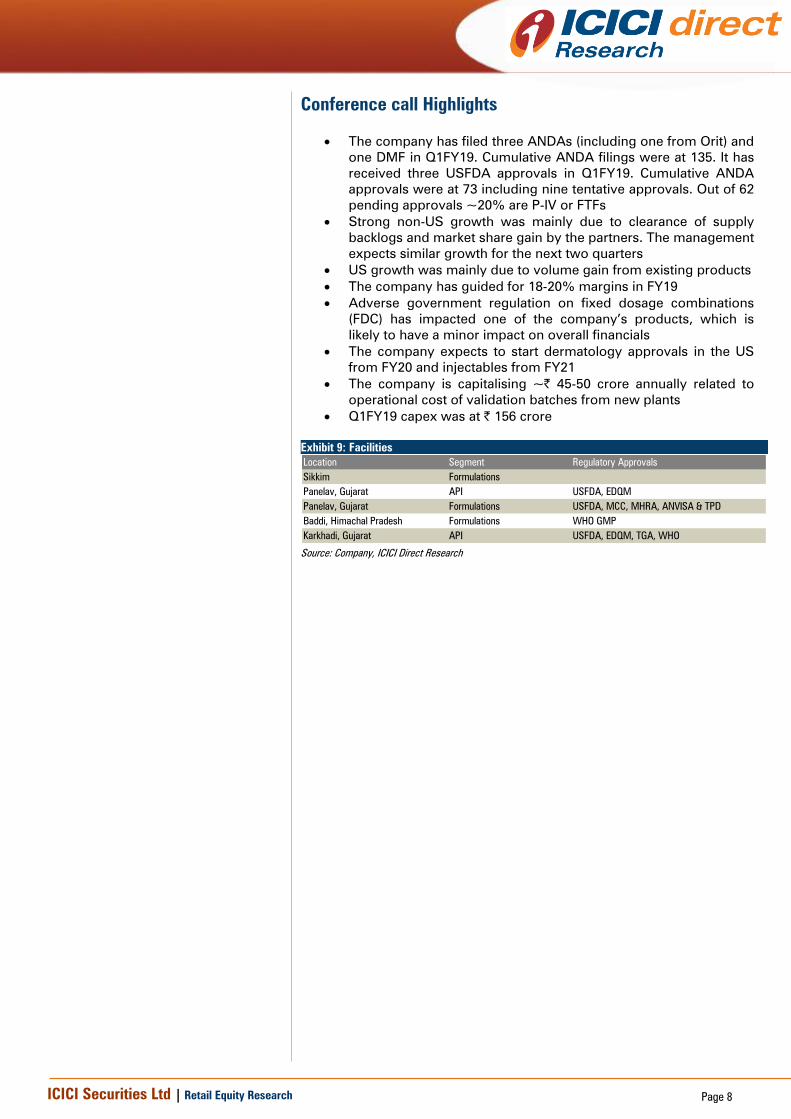
Exhibit 9: Facilities
Location Segment Regulatory Approvals
Sikkim Formulations
Panelav, Gujarat API USFDA, EDQM
Panelav, Gujarat Formulations USFDA, MCC, MHRA, ANVISA & TPD
Baddi, Himachal Pradesh Formulations WHO GMP
Karkhadi, Gujarat API USFDA, EDQM, TGA, WHO
Source: Company, ICICI Direct Research
ICICI Securities Ltd | Retail Equity Research Page 9
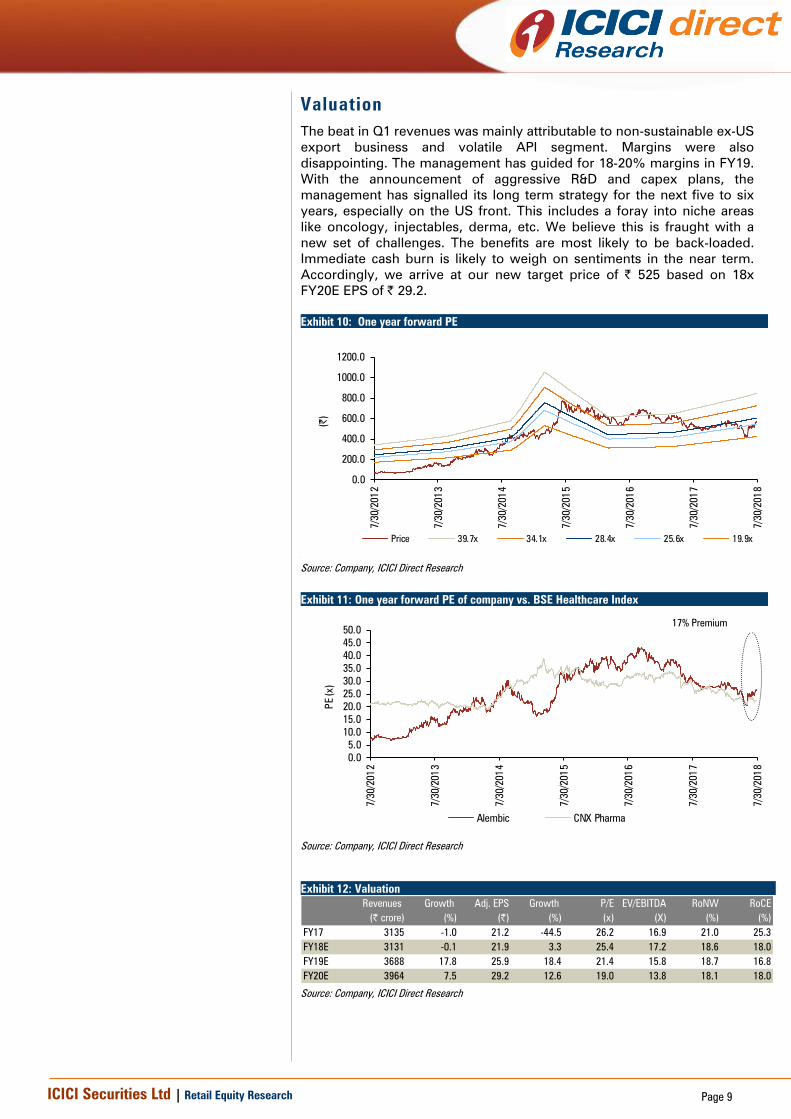
Valuation
The beat in Q1 revenues was mainly attributable to non-sustainable ex-US
export business and volatile API segment. Margins were also
disappointing. The management has guided for 18-20% margins in FY19.
With the announcement of aggressive R&D and capex plans, the
management has signalled its long term strategy for the next five to six
years, especially on the US front. This includes a foray into niche areas
like oncology, injectables, derma, etc. We believe this is fraught with a
new set of challenges. The benefits are most likely to be back-loaded.
Immediate cash burn is likely to weigh on sentiments in the near term.
Accordingly, we arrive at our new target price of | 525 based on 18x
FY20E EPS of | 29.2.
Exhibit 10: One year forward PE
0.0
200.0
400.0
600.0
800.0
1000.0
1200.0
7/30/201
2
7/30/201
3
7/30/201
4
7/30/201
5
7/30/201
6
7/30/201
7
7/30/201
8
(|)
Price 39.7x 34.1x 28.4x 25.6x 19.9x
[
Source: Company, ICICI Direct Research
Exhibit 11: One year forward PE of company vs. BSE Healthcare Index
0.0
5.0
10.0
15.0
20.0
25.0
30.0
35.0
40.0
45.0
50.0
7/30/201
2
7/30/201
3
7/30/201
4
7/30/201
5
7/30/201
6
7/30/201
7
7/30/201
8
PE (x)
Alembic CNX Pharma
Source: Company, ICICI Direct Research
Exhibit 12: Valuation
Revenues Growth Adj. EPS Growth P/E EV/EBITDA RoNW RoCE
(| crore) (%) (|) (%) (x) (X) (%) (%)
FY17 3135 -1.0 21.2 -44.5 26.2 16.9 21.0 25.3
FY18E 3131 -0.1 21.9 3.3 25.4 17.2 18.6 18.0
FY19E 3688 17.8 25.9 18.4 21.4 15.8 18.7 16.8
FY20E 3964 7.5 29.2 12.6 19.0 13.8 18.1 18.0
Source: Company, ICICI Direct Research
17% Premium
ICICI Securities Ltd | Retail Equity Research Page 10
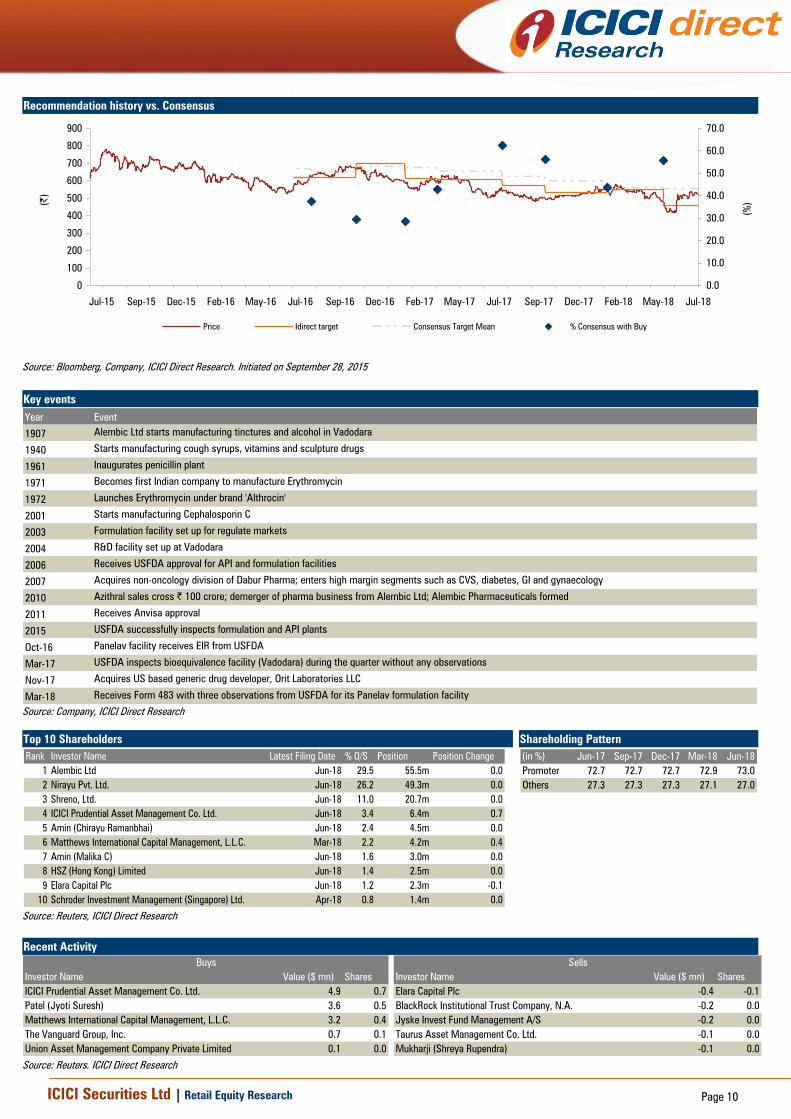
Recommendation history vs. Consensus
0
100
200
300
400
500
600
700
800
900
Jul-18May-18Feb-18Dec-17Sep-17Jul-17May-17Feb-17Dec-16Sep-16Jul-16May-16Feb-16Dec-15Sep-15Jul-15
(|
)
0.0
10.0
20.0
30.0
40.0
50.0
60.0
70.0
(%
)
Price Idirect target Consensus Target Mean % Consensus with Buy
Source: Bloomberg, Company, ICICI Direct Research. Initiated on September 28, 2015
Key events
Year Event
1907 Alembic Ltd starts manufacturing tinctures and alcohol in Vadodara
1940 Starts manufacturing cough syrups, vitamins and sculpture drugs
1961 Inaugurates penicillin plant
1971 Becomes first Indian company to manufacture Erythromycin
1972 Launches Erythromycin under brand 'Althrocin'
2001 Starts manufacturing Cephalosporin C
2003 Formulation facility set up for regulate markets
2004 R&D facility set up at Vadodara
2006 Receives USFDA approval for API and formulation facilities
2007 Acquires non-oncology division of Dabur Pharma; enters high margin segments such as CVS, diabetes, GI and gynaecology
2010 Azithral sales cross | 100 crore; demerger of pharma business from Alembic Ltd; Alembic Pharmaceuticals formed
2011 Receives Anvisa approval
2015 USFDA successfully inspects formulation and API plants
Oct-16 Panelav facility receives EIR from USFDA
Mar-17 USFDA inspects bioequivalence facility (Vadodara) during the quarter without any observations
Nov-17 Acquires US based generic drug developer, Orit Laboratories LLC
Mar-18 Receives Form 483 with three observations from USFDA for its Panelav formulation facility
Source: Company, ICICI Direct Research
Top 10 Shareholders Shareholding Pattern
Rank Investor Name Latest Filing Date % O/S Position Position Change
1 Alembic Ltd Jun-18 29.5 55.5m 0.0
2 Nirayu Pvt. Ltd. Jun-18 26.2 49.3m 0.0
3 Shreno, Ltd. Jun-18 11.0 20.7m 0.0
4 ICICI Prudential Asset Management Co. Ltd. Jun-18 3.4 6.4m 0.7
5 Amin (Chirayu Ramanbhai) Jun-18 2.4 4.5m 0.0
6 Matthews International Capital Management, L.L.C. Mar-18 2.2 4.2m 0.4
7 Amin (Malika C) Jun-18 1.6 3.0m 0.0
8 HSZ (Hong Kong) Limited Jun-18 1.4 2.5m 0.0
9 Elara Capital Plc Jun-18 1.2 2.3m -0.1
10 Schroder Investment Management (Singapore) Ltd. Apr-18 0.8 1.4m 0.0
(in %) Jun-17 Sep-17 Dec-17 Mar-18 Jun-18
Promoter 72.7 72.7 72.7 72.9 73.0
Others 27.3 27.3 27.3 27.1 27.0
Source: Reuters, ICICI Direct Research
Recent Activity
Investor Name Value ($ mn) Shares Investor Name Value ($ mn) Shares
ICICI Prudential Asset Management Co. Ltd. 4.9 0.7 Elara Capital Plc -0.4 -0.1
Patel (Jyoti Suresh) 3.6 0.5 BlackRock Institutional Trust Company, N.A. -0.2 0.0
Matthews International Capital Management, L.L.C. 3.2 0.4 Jyske Invest Fund Management A/S -0.2 0.0
The Vanguard Group, Inc. 0.7 0.1 Taurus Asset Management Co. Ltd. -0.1 0.0
Union Asset Management Company Private Limited 0.1 0.0 Mukharji (Shreya Rupendra) -0.1 0.0
Buys Sells
Source: Reuters, ICICI Direct Research
ICICI Securities Ltd | Retail Equity Research Page 11
.
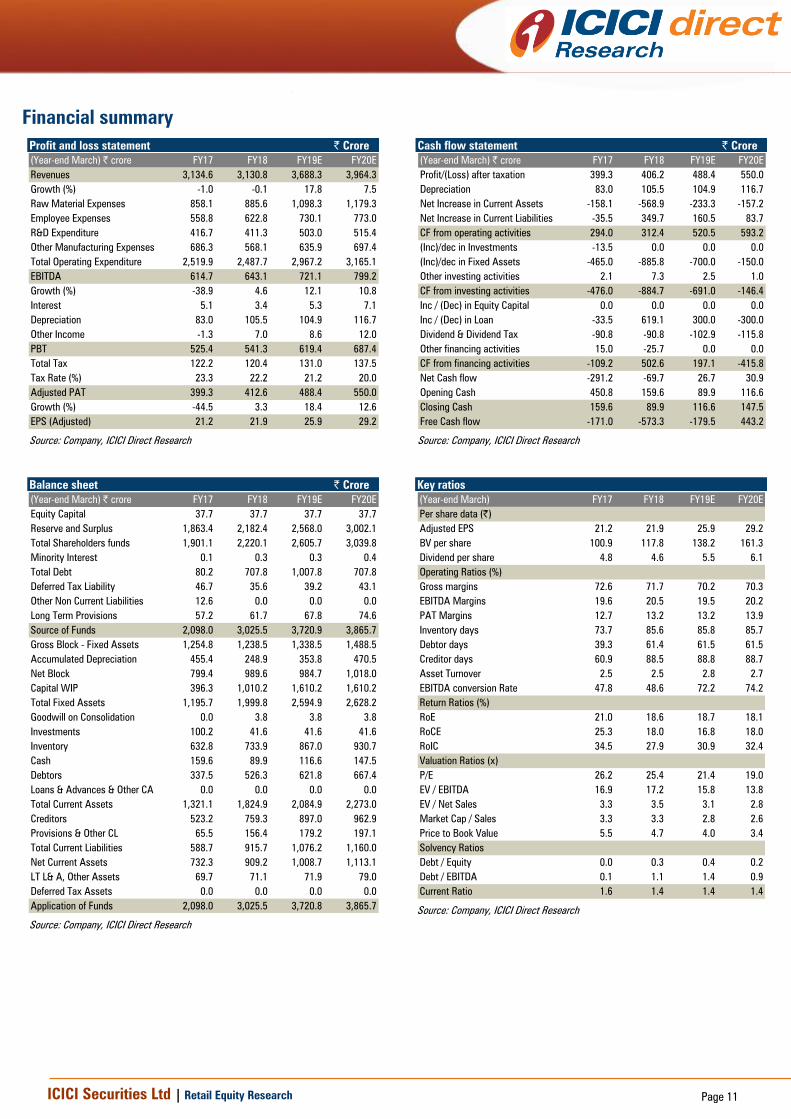
Financial summary
Profit and loss statement | Crore
(Year-end March) | crore FY17 FY18 FY19E FY20E
Revenues 3,134.6 3,130.8 3,688.3 3,964.3
Growth (%) -1.0 -0.1 17.8 7.5
Raw Material Expenses 858.1 885.6 1,098.3 1,179.3
Employee Expenses 558.8 622.8 730.1 773.0
R&D Expenditure 416.7 411.3 503.0 515.4
Other Manufacturing Expenses 686.3 568.1 635.9 697.4
Total Operating Expenditure 2,519.9 2,487.7 2,967.2 3,165.1
EBITDA 614.7 643.1 721.1 799.2
Growth (%) -38.9 4.6 12.1 10.8
Interest 5.1 3.4 5.3 7.1
Depreciation 83.0 105.5 104.9 116.7
Other Income -1.3 7.0 8.6 12.0
PBT 525.4 541.3 619.4 687.4
Total Tax 122.2 120.4 131.0 137.5
Tax Rate (%) 23.3 22.2 21.2 20.0
Adjusted PAT 399.3 412.6 488.4 550.0
Growth (%) -44.5 3.3 18.4 12.6
EPS (Adjusted) 21.2 21.9 25.9 29.2
Source: Company, ICICI Direct Research
Cash flow statement | Crore
(Year-end March) | crore FY17 FY18 FY19E FY20E
Profit/(Loss) after taxation 399.3 406.2 488.4 550.0
Depreciation 83.0 105.5 104.9 116.7
Net Increase in Current Assets -158.1 -568.9 -233.3 -157.2
Net Increase in Current Liabilities -35.5 349.7 160.5 83.7
CF from operating activities 294.0 312.4 520.5 593.2
(Inc)/dec in Investments -13.5 0.0 0.0 0.0
(Inc)/dec in Fixed Assets -465.0 -885.8 -700.0 -150.0
Other investing activities 2.1 7.3 2.5 1.0
CF from investing activities -476.0 -884.7 -691.0 -146.4
Inc / (Dec) in Equity Capital 0.0 0.0 0.0 0.0
Inc / (Dec) in Loan -33.5 619.1 300.0 -300.0
Dividend & Dividend Tax -90.8 -90.8 -102.9 -115.8
Other financing activities 15.0 -25.7 0.0 0.0
CF from financing activities -109.2 502.6 197.1 -415.8
Net Cash flow -291.2 -69.7 26.7 30.9
Opening Cash 450.8 159.6 89.9 116.6
Closing Cash 159.6 89.9 116.6 147.5
Free Cash flow -171.0 -573.3 -179.5 443.2
Source: Company, ICICI Direct Research
Balance sheet | Crore
(Year-end March) | crore FY17 FY18 FY19E FY20E
Equity Capital 37.7 37.7 37.7 37.7
Reserve and Surplus 1,863.4 2,182.4 2,568.0 3,002.1
Total Shareholders funds 1,901.1 2,220.1 2,605.7 3,039.8
Minority Interest 0.1 0.3 0.3 0.4
Total Debt 80.2 707.8 1,007.8 707.8
Deferred Tax Liability 46.7 35.6 39.2 43.1
Other Non Current Liabilities 12.6 0.0 0.0 0.0
Long Term Provisions 57.2 61.7 67.8 74.6
Source of Funds 2,098.0 3,025.5 3,720.9 3,865.7
Gross Block - Fixed Assets 1,254.8 1,238.5 1,338.5 1,488.5
Accumulated Depreciation 455.4 248.9 353.8 470.5
Net Block 799.4 989.6 984.7 1,018.0
Capital WIP 396.3 1,010.2 1,610.2 1,610.2
Total Fixed Assets 1,195.7 1,999.8 2,594.9 2,628.2
Goodwill on Consolidation 0.0 3.8 3.8 3.8
Investments 100.2 41.6 41.6 41.6
Inventory 632.8 733.9 867.0 930.7
Cash 159.6 89.9 116.6 147.5
Debtors 337.5 526.3 621.8 667.4
Loans & Advances & Other CA 0.0 0.0 0.0 0.0
Total Current Assets 1,321.1 1,824.9 2,084.9 2,273.0
Creditors 523.2 759.3 897.0 962.9
Provisions & Other CL 65.5 156.4 179.2 197.1
Total Current Liabilities 588.7 915.7 1,076.2 1,160.0
Net Current Assets 732.3 909.2 1,008.7 1,113.1
LT L& A, Other Assets 69.7 71.1 71.9 79.0
Deferred Tax Assets 0.0 0.0 0.0 0.0
Application of Funds 2,098.0 3,025.5 3,720.8 3,865.7
Source: Company, ICICI Direct Research
Key ratios
(Year-end March) FY17 FY18 FY19E FY20E
Per share data (|)
Adjusted EPS 21.2 21.9 25.9 29.2
BV per share 100.9 117.8 138.2 161.3
Dividend per share 4.8 4.6 5.5 6.1
Operating Ratios (%)
Gross margins 72.6 71.7 70.2 70.3
EBITDA Margins 19.6 20.5 19.5 20.2
PAT Margins 12.7 13.2 13.2 13.9
Inventory days 73.7 85.6 85.8 85.7
Debtor days 39.3 61.4 61.5 61.5
Creditor days 60.9 88.5 88.8 88.7
Asset Turnover 2.5 2.5 2.8 2.7
EBITDA conversion Rate 47.8 48.6 72.2 74.2
Return Ratios (%)
RoE 21.0 18.6 18.7 18.1
RoCE 25.3 18.0 16.8 18.0
RoIC 34.5 27.9 30.9 32.4
Valuation Ratios (x)
P/E 26.2 25.4 21.4 19.0
EV / EBITDA 16.9 17.2 15.8 13.8
EV / Net Sales 3.3 3.5 3.1 2.8
Market Cap / Sales 3.3 3.3 2.8 2.6
Price to Book Value 5.5 4.7 4.0 3.4
Solvency Ratios
Debt / Equity 0.0 0.3 0.4 0.2
Debt / EBITDA 0.1 1.1 1.4 0.9
Current Ratio 1.6 1.4 1.4 1.4
Source: Company, ICICI Direct Research
ICICI Securities Ltd | Retail Equity Research Page 12
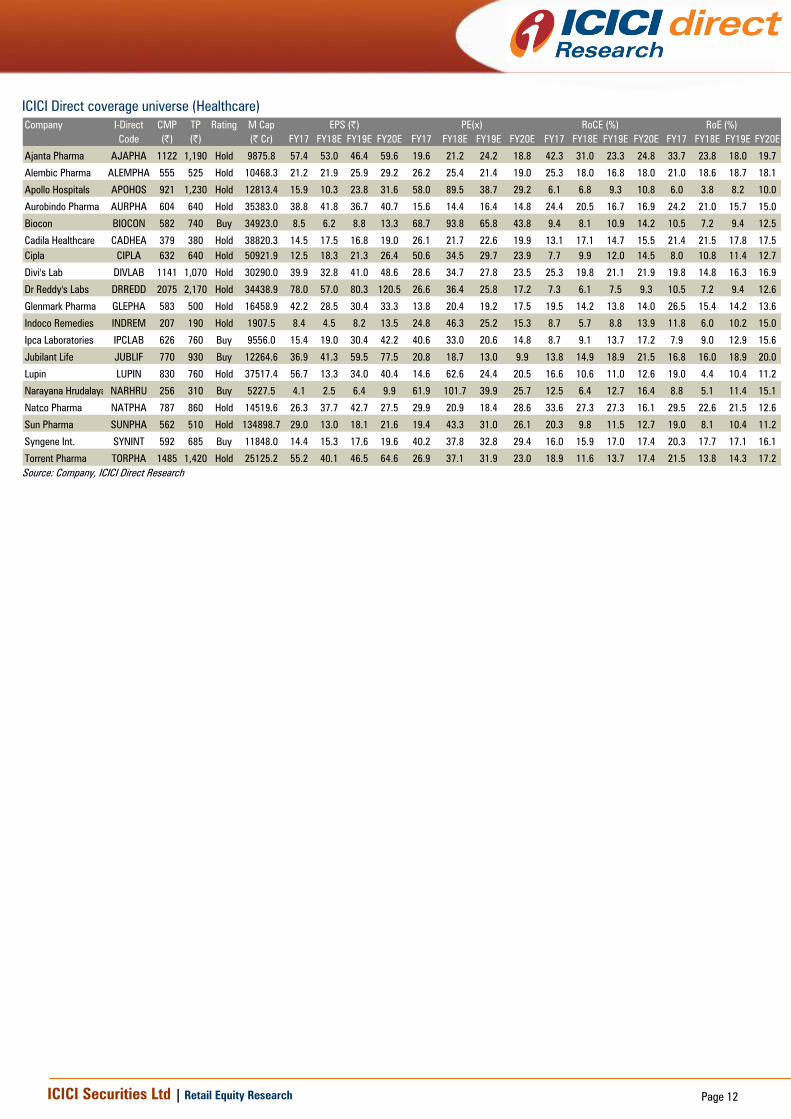
ICICI Direct coverage universe (Healthcare)
Company I-Direct CMP TP Rating M Cap
Code (|) (|) (| Cr) FY17 FY18E FY19E FY20E FY17 FY18E FY19E FY20E FY17 FY18E FY19E FY20E FY17 FY18E FY19E FY20E
Ajanta Pharma AJAPHA 1122 1,190 Hold 9875.8 57.4 53.0 46.4 59.6 19.6 21.2 24.2 18.8 42.3 31.0 23.3 24.8 33.7 23.8 18.0 19.7
Alembic Pharma ALEMPHA 555 525 Hold 10468.3 21.2 21.9 25.9 29.2 26.2 25.4 21.4 19.0 25.3 18.0 16.8 18.0 21.0 18.6 18.7 18.1
Apollo Hospitals APOHOS 921 1,230 Hold 12813.4 15.9 10.3 23.8 31.6 58.0 89.5 38.7 29.2 6.1 6.8 9.3 10.8 6.0 3.8 8.2 10.0
Aurobindo Pharma AURPHA 604 640 Hold 35383.0 38.8 41.8 36.7 40.7 15.6 14.4 16.4 14.8 24.4 20.5 16.7 16.9 24.2 21.0 15.7 15.0
Biocon BIOCON 582 740 Buy 34923.0 8.5 6.2 8.8 13.3 68.7 93.8 65.8 43.8 9.4 8.1 10.9 14.2 10.5 7.2 9.4 12.5
Cadila Healthcare CADHEA 379 380 Hold 38820.3 14.5 17.5 16.8 19.0 26.1 21.7 22.6 19.9 13.1 17.1 14.7 15.5 21.4 21.5 17.8 17.5
Cipla CIPLA 632 640 Hold 50921.9 12.5 18.3 21.3 26.4 50.6 34.5 29.7 23.9 7.7 9.9 12.0 14.5 8.0 10.8 11.4 12.7
Divi's Lab DIVLAB 1141 1,070 Hold 30290.0 39.9 32.8 41.0 48.6 28.6 34.7 27.8 23.5 25.3 19.8 21.1 21.9 19.8 14.8 16.3 16.9
Dr Reddy's Labs DRREDD 2075 2,170 Hold 34438.9 78.0 57.0 80.3 120.5 26.6 36.4 25.8 17.2 7.3 6.1 7.5 9.3 10.5 7.2 9.4 12.6
Glenmark Pharma GLEPHA 583 500 Hold 16458.9 42.2 28.5 30.4 33.3 13.8 20.4 19.2 17.5 19.5 14.2 13.8 14.0 26.5 15.4 14.2 13.6
Indoco Remedies INDREM 207 190 Hold 1907.5 8.4 4.5 8.2 13.5 24.8 46.3 25.2 15.3 8.7 5.7 8.8 13.9 11.8 6.0 10.2 15.0
Ipca Laboratories IPCLAB 626 760 Buy 9556.0 15.4 19.0 30.4 42.2 40.6 33.0 20.6 14.8 8.7 9.1 13.7 17.2 7.9 9.0 12.9 15.6
Jubilant Life JUBLIF 770 930 Buy 12264.6 36.9 41.3 59.5 77.5 20.8 18.7 13.0 9.9 13.8 14.9 18.9 21.5 16.8 16.0 18.9 20.0
Lupin LUPIN 830 760 Hold 37517.4 56.7 13.3 34.0 40.4 14.6 62.6 24.4 20.5 16.6 10.6 11.0 12.6 19.0 4.4 10.4 11.2
Narayana Hrudalaya NARHRU 256 310 Buy 5227.5 4.1 2.5 6.4 9.9 61.9 101.7 39.9 25.7 12.5 6.4 12.7 16.4 8.8 5.1 11.4 15.1
Natco Pharma NATPHA 787 860 Hold 14519.6 26.3 37.7 42.7 27.5 29.9 20.9 18.4 28.6 33.6 27.3 27.3 16.1 29.5 22.6 21.5 12.6
Sun Pharma SUNPHA 562 510 Hold 134898.7 29.0 13.0 18.1 21.6 19.4 43.3 31.0 26.1 20.3 9.8 11.5 12.7 19.0 8.1 10.4 11.2
Syngene Int. SYNINT 592 685 Buy 11848.0 14.4 15.3 17.6 19.6 40.2 37.8 32.8 29.4 16.0 15.9 17.0 17.4 20.3 17.7 17.1 16.1
Torrent Pharma TORPHA 1485 1,420 Hold 25125.2 55.2 40.1 46.5 64.6 26.9 37.1 31.9 23.0 18.9 11.6 13.7 17.4 21.5 13.8 14.3 17.2
RoE (%)EPS (|) PE(x) RoCE (%)
Source: Company, ICICI Direct Research
ICICI Securities Ltd | Retail Equity Research Page 13
RATING RATIONALE
ICICI Direct endeavours to provide objective opinions and recommendations. ICICI Direct assigns ratings to its
stocks according to their notional target price vs. current market price and then categorises them as Strong
Buy, Buy, Hold and Sell. The performance horizon is two years unless specified and the notional target price is
defined as the analysts' valuation for a stock.
Strong Buy: >15%/20% for large caps/midcaps, respectively, with high conviction;
Buy: >10%/15% for large caps/midcaps, respectively;
Hold: Up to +/-10%;
Sell: -10% or more;
Pankaj Pandey Head – Research [email protected]
ICICI Direct Research Desk,
ICICI Securities Limited,
1st Floor, Akruti Trade Centre,
Road No 7, MIDC,
Andheri (East)
Mumbai – 400 093
ICICI Securities Ltd | Retail Equity Research Page 14
ANALYST CERTIFICATION
We /I, Siddhant Khandekar CA-INTER, Mitesh Shah MS (Finance) Research Analysts, authors and the names subscribed to this report, hereby certify that all of the views expressed in this research report
accurately reflect our views about the subject issuer(s) or securities. We also certify that no part of our compensation was, is, or will be directly or indirectly related to the specific recommendation(s) or
view(s) in this report.
Terms & conditions and other disclosures:
ICICI Securities Limited (ICICI Securities) is a full-service, integrated investment banking and is, inter alia, engaged in the business of stock brokering and distribution of financial products. ICICI Securities
Limited is a Sebi registered Research Analyst with Sebi Registration Number – INH000000990. ICICI Securities is a wholly-owned subsidiary of ICICI Bank which is India’s largest private sector bank and has
its various subsidiaries engaged in businesses of housing finance, asset management, life insurance, general insurance, venture capital fund management, etc. (“associates”), the details in respect of which
are available on www.icicibank.com.
ICICI Securities is one of the leading merchant bankers/ underwriters of securities and participate in virtually all securities trading markets in India. We and our associates might have investment banking
and other business relationship with a significant percentage of companies covered by our Investment Research Department. ICICI Securities generally prohibits its analysts, persons reporting to analysts
and their relatives from maintaining a financial interest in the securities or derivatives of any companies that the analysts cover.
The information and opinions in this report have been prepared by ICICI Securities and are subject to change without any notice. The report and information contained herein is strictly confidential and
meant solely for the selected recipient and may not be altered in any way, transmitted to, copied or distributed, in part or in whole, to any other person or to the media or reproduced in any form, without
prior written consent of ICICI Securities. While we would endeavour to update the information herein on a reasonable basis, ICICI Securities is under no obligation to update or keep the information current.
Also, there may be regulatory, compliance or other reasons that may prevent ICICI Securities from doing so. Non-rated securities indicate that rating on a particular security has been suspended
temporarily and such suspension is in compliance with applicable regulations and/or ICICI Securities policies, in circumstances where ICICI Securities might be acting in an advisory capacity to this
company, or in certain other circumstances.
This report is based on information obtained from public sources and sources believed to be reliable, but no independent verification has been made nor is its accuracy or completeness guaranteed. This
report and information herein is solely for informational purpose and shall not be used or considered as an offer document or solicitation of offer to buy or sell or subscribe for securities or other financial
instruments. Though disseminated to all the customers simultaneously, not all customers may receive this report at the same time. ICICI Securities will not treat recipients as customers by virtue of their
receiving this report. Nothing in this report constitutes investment, legal, accounting and tax advice or a representation that any investment or strategy is suitable or appropriate to your specific
circumstances. The securities discussed and opinions expressed in this report may not be suitable for all investors, who must make their own investment decisions, based on their own investment
objectives, financial positions and needs of specific recipient. This may not be taken in substitution for the exercise of independent judgment by any recipient. The recipient should independently evaluate
the investment risks. The value and return on investment may vary because of changes in interest rates, foreign exchange rates or any other reason. ICICI Securities accepts no liabilities whatsoever for any
loss or damage of any kind arising out of the use of this report. Past performance is not necessarily a guide to future performance. Investors are advised to see Risk Disclosure Document to understand the
risks associated before investing in the securities markets. Actual results may differ materially from those set forth in projections. Forward-looking statements are not predictions and may be subject to
change without notice.
ICICI Securities or its associates might have managed or co-managed public offering of securities for the subject company or might have been mandated by the subject company for any other assignment
in the past twelve months.
ICICI Securities or its associates might have received any compensation from the companies mentioned in the report during the period preceding twelve months from the date of this report for services in
respect of managing or co-managing public offerings, corporate finance, investment banking or merchant banking, brokerage services or other advisory service in a merger or specific transaction.
ICICI Securities or its associates might have received any compensation for products or services other than investment banking or merchant banking or brokerage services from the companies mentioned
in the report in the past twelve months.
ICICI Securities encourages independence in research report preparation and strives to minimize conflict in preparation of research report. ICICI Securities or its associates or its analysts did not receive any
compensation or other benefits from the companies mentioned in the report or third party in connection with preparation of the research report. Accordingly, neither ICICI Securities nor Research Analysts
and their relatives have any material conflict of interest at the time of publication of this report.
It is confirmed that Siddhant Khandekar CA-INTER, Mitesh Shah MS (Finance) Research Analysts of this report have not received any compensation from the companies mentioned in the report in the
preceding twelve months.
Compensation of our Research Analysts is not based on any specific merchant banking, investment banking or brokerage service transactions.
ICICI Securities or its subsidiaries collectively or Research Analysts or their relatives do not own 1% or more of the equity securities of the Company mentioned in the report as of the last day of the month
preceding the publication of the research report.
Since associates of ICICI Securities are engaged in various financial service businesses, they might have financial interests or beneficial ownership in various companies including the subject
company/companies mentioned in this report.
It is confirmed that Siddhant Khandekar CA-INTER, Mitesh Shah MS (Finance) Research Analysts do not serve as an officer, director or employee of the companies mentioned in the report.
ICICI Securities may have issued other reports that are inconsistent with and reach different conclusion from the information presented in this report.
Neither the Research Analysts nor ICICI Securities have been engaged in market making activity for the companies mentioned in the report.
We submit that no material disciplinary action has been taken on ICICI Securities by any Regulatory Authority impacting Equity Research Analysis activities.
This report is not directed or intended for distribution to, or use by, any person or entity who is a citizen or resident of or located in any locality, state, country or other jurisdiction, where such distribution,
publication, availability or use would be contrary to law, regulation or which would subject ICICI Securities and affiliates to any registration or licensing requirement within such jurisdiction. The securities
described herein may or may not be eligible for sale in all jurisdictions or to certain category of investors. Persons in whose possession this document may come are required to inform themselves of and
to observe such restriction.