Embed Size (px)
Citation preview

Full Year Results 2015 Aldermore Group PLC
10 March 2016
Full year results 2015
1
Business update Phillip Monks
Performance update James Mack
Q&A
Outlook Phillip Monks
A year on from IPO ….
Generating attractive and sustainable returns 2
Delivered another excellent set of financial results 1
Strong balance sheet and capital position
3
2
Benefit from a diversified lending, funding and distribution model 4
Confident of driving continued significant growth 5
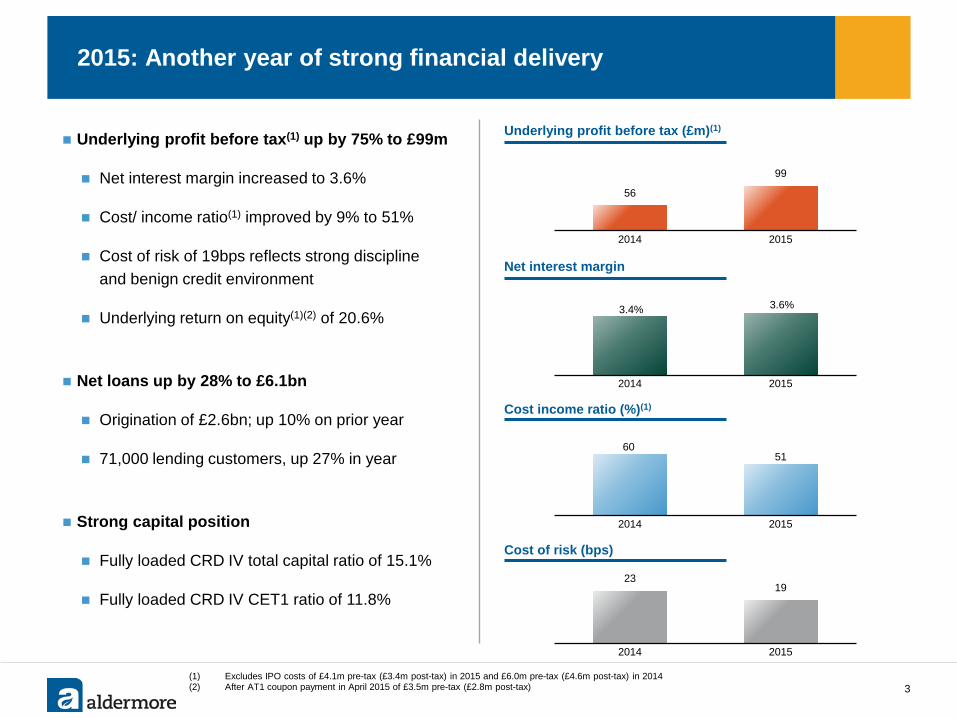
Underlying profit before tax (£m)(1)
Cost of risk (bps)
2015: Another year of strong financial delivery
3
Cost income ratio (%)(1)
(1) Excludes IPO costs of £4.1m pre-tax (£3.4m post-tax) in 2015 and £6.0m pre-tax (£4.6m post-tax) in 2014 (2) After AT1 coupon payment in April 2015 of £3.5m pre-tax (£2.8m post-tax)
Net interest margin
3.4% 3.6%
2014 2015
56
99
2014 2015
60 51
2014 2015
23 19
2014 2015
Underlying profit before tax(1) up by 75% to £99m
Net interest margin increased to 3.6%
Cost/ income ratio(1) improved by 9% to 51%
Cost of risk of 19bps reflects strong discipline and benign credit environment
Underlying return on equity(1)(2) of 20.6%
Net loans up by 28% to £6.1bn
Origination of £2.6bn; up 10% on prior year
71,000 lending customers, up 27% in year
Strong capital position
Fully loaded CRD IV total capital ratio of 15.1%
Fully loaded CRD IV CET1 ratio of 11.8%
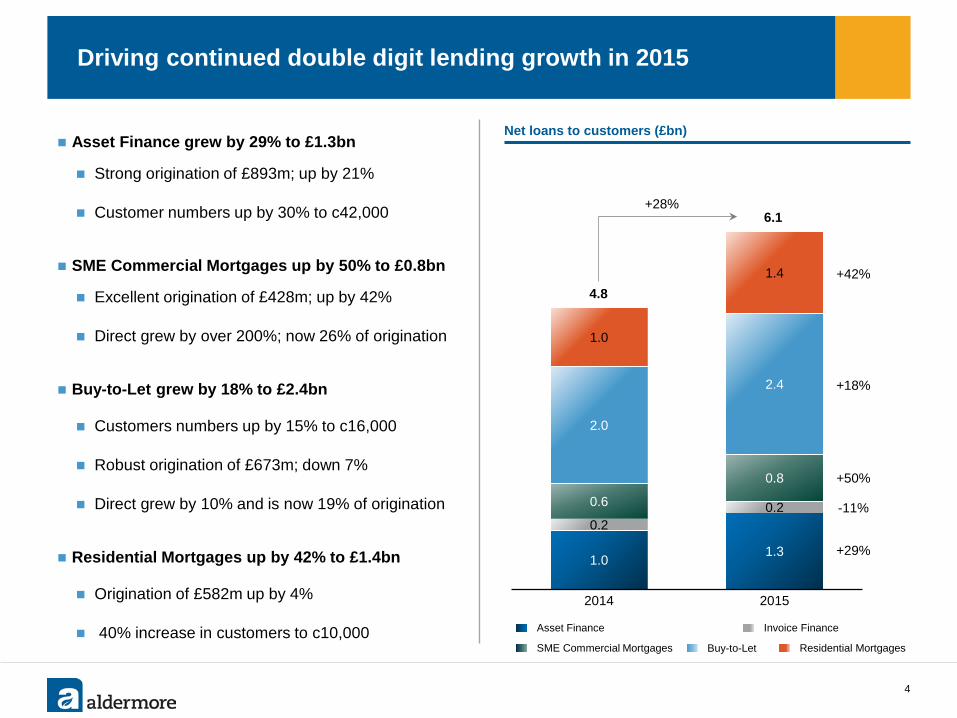
Asset Finance grew by 29% to £1.3bn
Strong origination of £893m; up by 21%
Customer numbers up by 30% to c42,000
SME Commercial Mortgages up by 50% to £0.8bn
Excellent origination of £428m; up by 42%
Direct grew by over 200%; now 26% of origination
Buy-to-Let grew by 18% to £2.4bn
Customers numbers up by 15% to c16,000
Robust origination of £673m; down 7%
Direct grew by 10% and is now 19% of origination
Residential Mortgages up by 42% to £1.4bn
Origination of £582m up by 4%
40% increase in customers to c10,000
Driving continued double digit lending growth in 2015
4
1.0 1.3
0.2 0.2 0.6
0.8
2.0
2.4
1.0
1.4
2014 2015
Asset Finance Invoice Finance
SME Commercial Mortgages Residential Mortgages Buy-to-Let
4.8
6.1
+42%
+18%
+50%
+29%
-11%
+28%
Net loans to customers (£bn)
£28bn Credit cards
£111bn
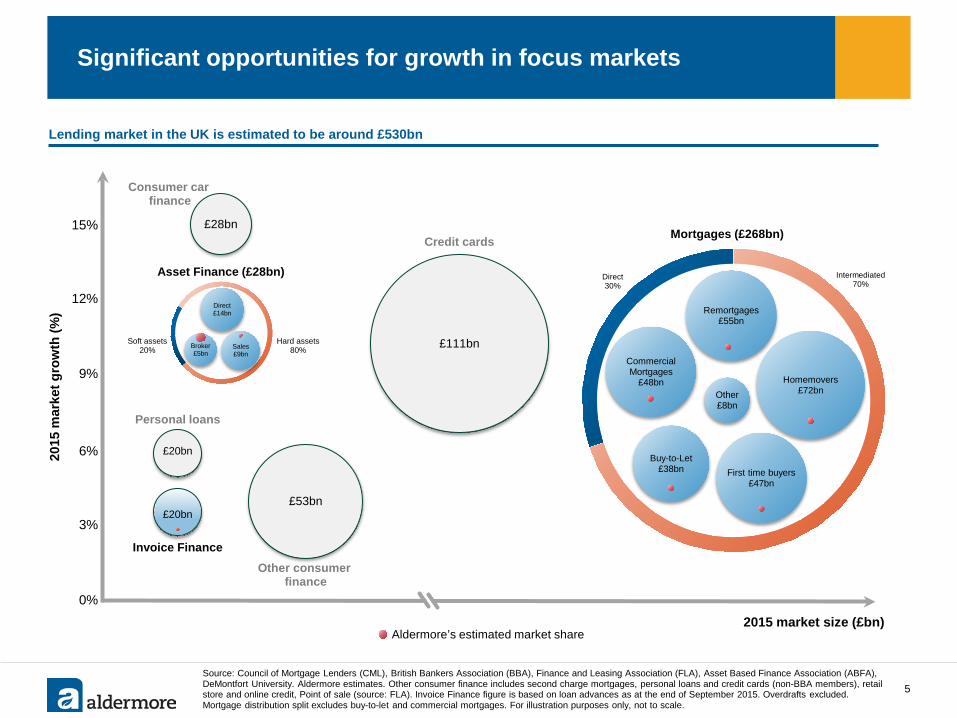
Significant opportunities for growth in focus markets
5
Lending market in the UK is estimated to be around £530bn
Source: Council of Mortgage Lenders (CML), British Bankers Association (BBA), Finance and Leasing Association (FLA), Asset Based Finance Association (ABFA), DeMontfort University. Aldermore estimates. Other consumer finance includes second charge mortgages, personal loans and credit cards (non-BBA members), retail store and online credit, Point of sale (source: FLA). Invoice Finance figure is based on loan advances as at the end of September 2015. Overdrafts excluded. Mortgage distribution split excludes buy-to-let and commercial mortgages. For illustration purposes only, not to scale.
2015
mar
ket g
row
th (%
)
2015 market size (£bn)
15%
Invoice Finance
Mortgages (£268bn)
£20bn
9%
6%
3%
12%
0%
Aldermore’s estimated market share
Broker £5bn
£53bn
Other consumer finance
Consumer car finance
Asset Finance (£28bn)
Personal loans
£20bn
Hard assets 80%
Soft assets 20%
Intermediated 70%
Direct 30%
Remortgages £55bn
Commercial Mortgages
£48bn
First time buyers £47bn
Homemovers £72bn
Buy-to-Let £38bn
Other £8bn
Direct £14bn
Sales £9bn
Broker £5bn
22%
3%
13%
39%
23%
Asset Finance
Invoice Finance
SME CommercialMortgages
Buy-to-Let
Residential Mortgages
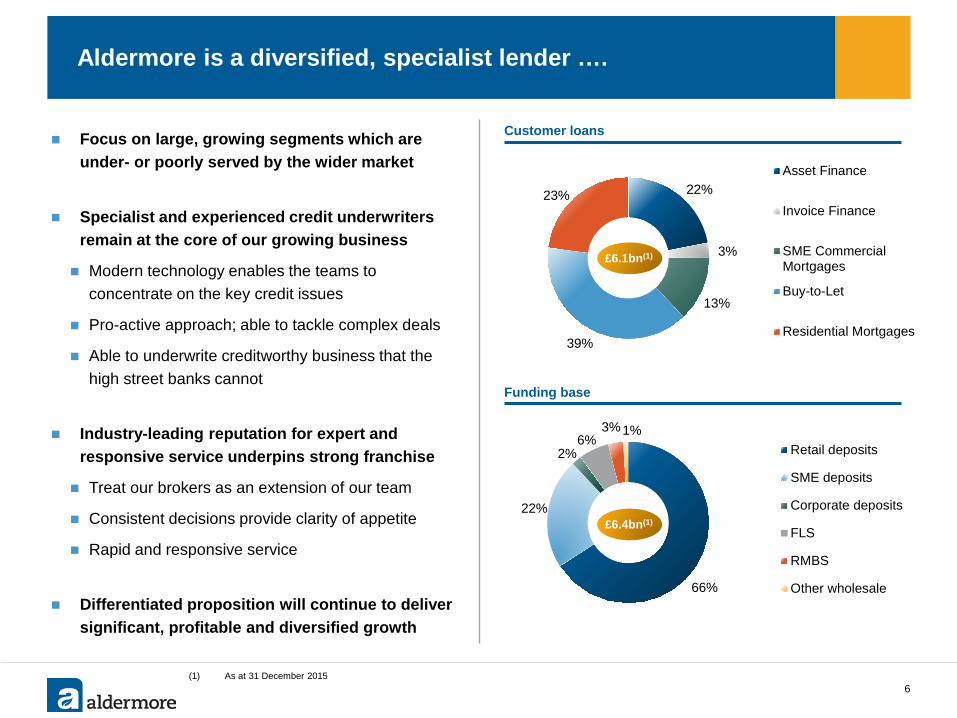
Aldermore is a diversified, specialist lender ….
6
66%
22%
2% 6%
3% 1% Retail deposits
SME deposits
Corporate deposits
FLS
RMBS
Other wholesale
£6.1bn(1)
Customer loans
Funding base
£6.4bn(1)
(1) As at 31 December 2015
Focus on large, growing segments which are under- or poorly served by the wider market
Specialist and experienced credit underwriters remain at the core of our growing business
Modern technology enables the teams to concentrate on the key credit issues
Pro-active approach; able to tackle complex deals
Able to underwrite creditworthy business that the high street banks cannot
Industry-leading reputation for expert and responsive service underpins strong franchise
Treat our brokers as an extension of our team
Consistent decisions provide clarity of appetite
Rapid and responsive service
Differentiated proposition will continue to deliver significant, profitable and diversified growth
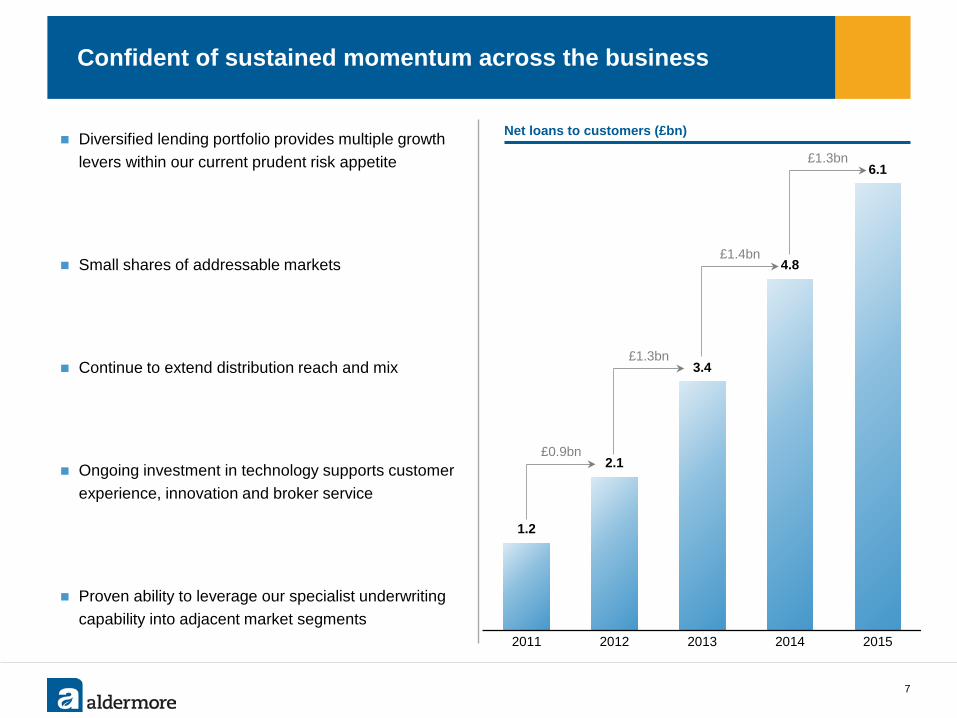
Confident of sustained momentum across the business
7
First time buyers £33bn
Buy-to-Let £23bn
Diversified lending portfolio provides multiple growth levers within our current prudent risk appetite
Small shares of addressable markets
Continue to extend distribution reach and mix
Ongoing investment in technology supports customer experience, innovation and broker service
Proven ability to leverage our specialist underwriting capability into adjacent market segments
1.2
2.1
3.4
4.8
6.1
2011 2012 2013 2014 2015
£0.9bn
£1.3bn
£1.4bn
£1.3bn
Net loans to customers (£bn)
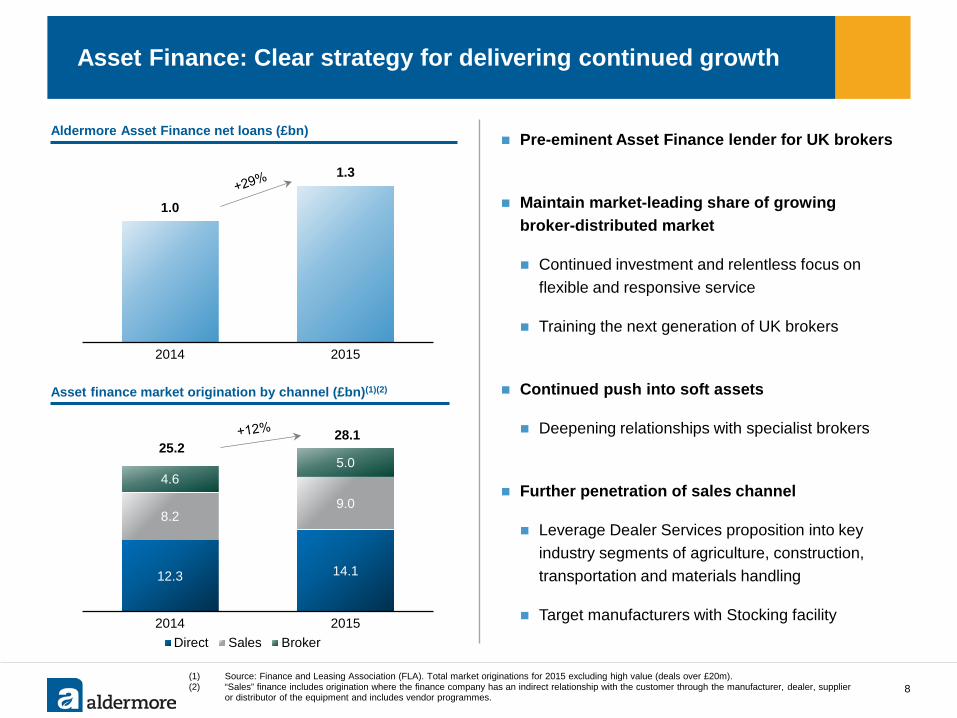
Asset Finance: Clear strategy for delivering continued growth
(1) Source: Finance and Leasing Association (FLA). Total market originations for 2015 excluding high value (deals over £20m). (2) “Sales” finance includes origination where the finance company has an indirect relationship with the customer through the manufacturer, dealer, supplier
or distributor of the equipment and includes vendor programmes.
Pre-eminent Asset Finance lender for UK brokers
Maintain market-leading share of growing broker-distributed market
Continued investment and relentless focus on flexible and responsive service
Training the next generation of UK brokers
Continued push into soft assets
Deepening relationships with specialist brokers
Further penetration of sales channel
Leverage Dealer Services proposition into key industry segments of agriculture, construction, transportation and materials handling
Target manufacturers with Stocking facility
8
Aldermore Asset Finance net loans (£bn)
12.3 14.1
8.2 9.0
4.6 5.0
25.2 28.1
2014 2015Direct Sales Broker
Asset finance market origination by channel (£bn)(1)(2)
1.0
1.3
2014 2015
Buy-to-Let remains a significant growth opportunity
9
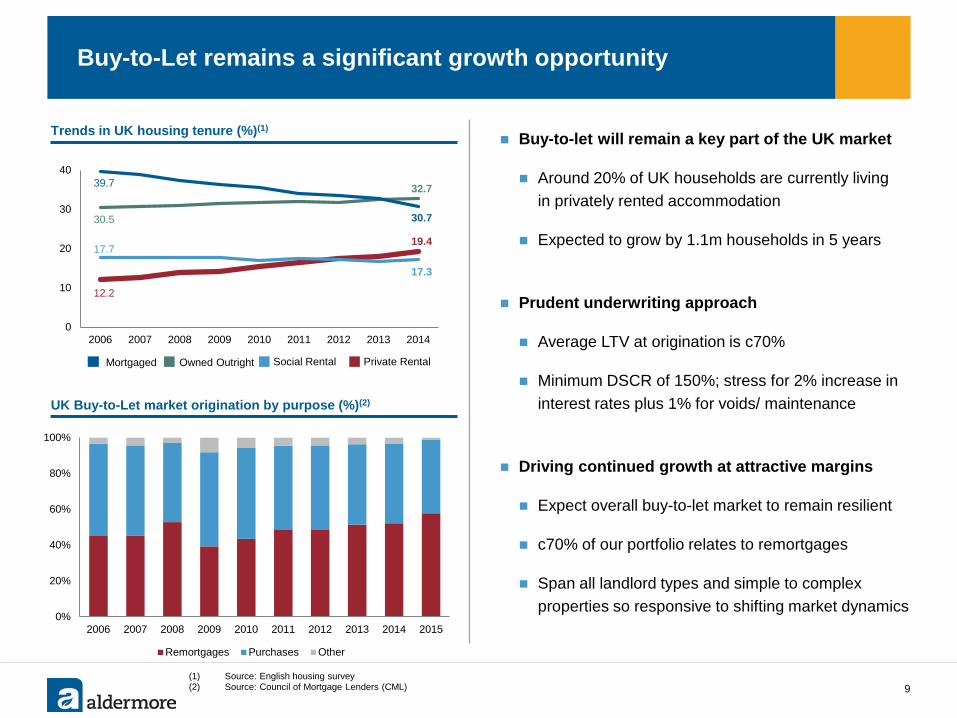
57%
(1) Source: English housing survey (2) Source: Council of Mortgage Lenders (CML)
0
10
20
30
40
2006 2007 2008 2009 2010 2011 2012 2013 2014
Mortgaged Owned Outright Social Rental Private Rental
32.7
30.7
19.4
17.3
30.5
39.7
12.2
17.7
Trends in UK housing tenure (%)(1)
UK Buy-to-Let market origination by purpose (%)(2)
0%
20%
40%
60%
80%
100%
2006 2007 2008 2009 2010 2011 2012 2013 2014 2015
Remortgages Purchases Other
Buy-to-let will remain a key part of the UK market
Around 20% of UK households are currently living in privately rented accommodation
Expected to grow by 1.1m households in 5 years
Prudent underwriting approach
Average LTV at origination is c70%
Minimum DSCR of 150%; stress for 2% increase in interest rates plus 1% for voids/ maintenance
Driving continued growth at attractive margins
Expect overall buy-to-let market to remain resilient
c70% of our portfolio relates to remortgages
Span all landlord types and simple to complex properties so responsive to shifting market dynamics
Diversified mortgage strategy levers multiple growth options
10
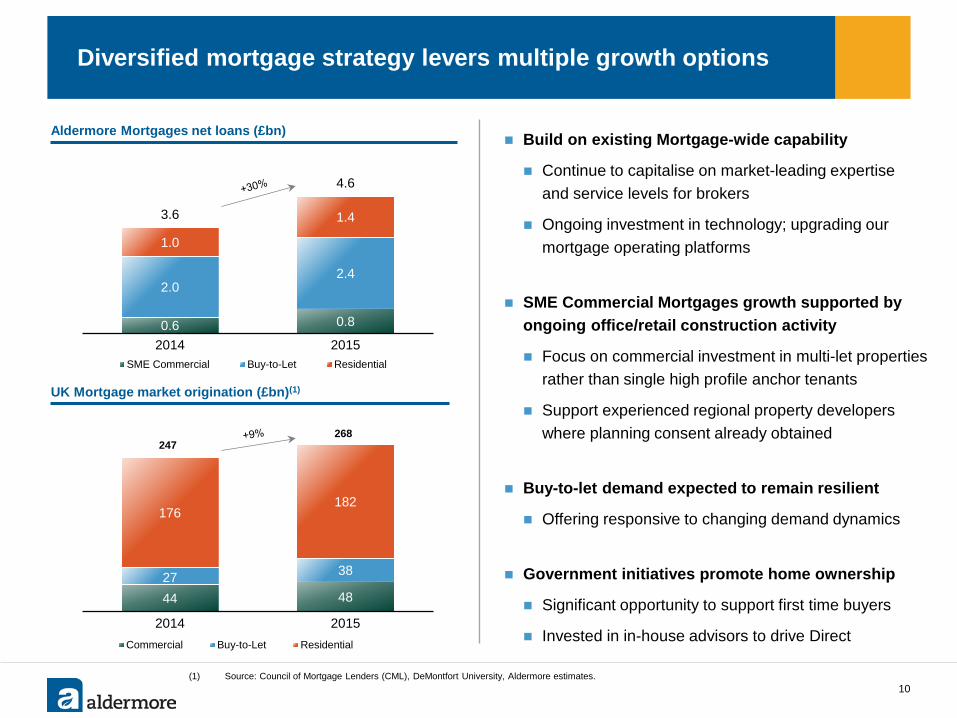
Build on existing Mortgage-wide capability
Continue to capitalise on market-leading expertise and service levels for brokers
Ongoing investment in technology; upgrading our mortgage operating platforms
SME Commercial Mortgages growth supported by ongoing office/retail construction activity
Focus on commercial investment in multi-let properties rather than single high profile anchor tenants
Support experienced regional property developers where planning consent already obtained
Buy-to-let demand expected to remain resilient
Offering responsive to changing demand dynamics
Government initiatives promote home ownership
Significant opportunity to support first time buyers
Invested in in-house advisors to drive Direct
Aldermore Mortgages net loans (£bn)
44 48 27 38
176 182
247 268
2014 2015Commercial Buy-to-Let Residential
UK Mortgage market origination (£bn)(1)
0.6 0.8
2.0 2.4
1.0
1.4 3.6
4.6
2014 2015SME Commercial Buy-to-Let Residential
(1) Source: Council of Mortgage Lenders (CML), DeMontfort University, Aldermore estimates.
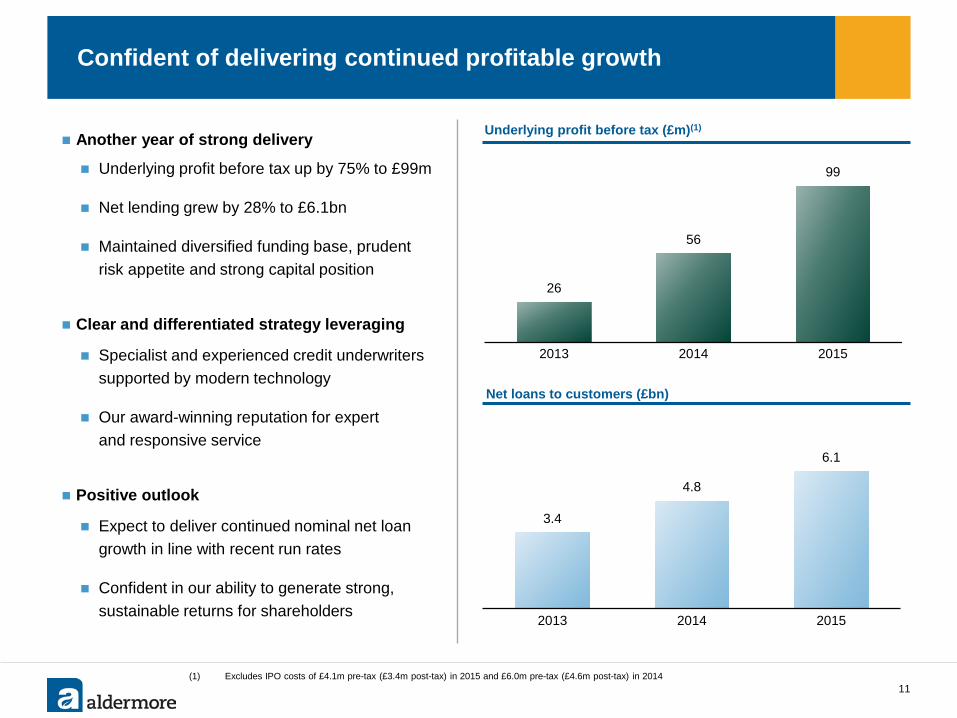
26
56
99
2013 2014 2015
Confident of delivering continued profitable growth
11
Another year of strong delivery
Underlying profit before tax up by 75% to £99m
Net lending grew by 28% to £6.1bn
Maintained diversified funding base, prudent risk appetite and strong capital position
Clear and differentiated strategy leveraging
Specialist and experienced credit underwriters supported by modern technology
Our award-winning reputation for expert and responsive service
Positive outlook
Expect to deliver continued nominal net loan growth in line with recent run rates
Confident in our ability to generate strong, sustainable returns for shareholders
Net loans to customers (£bn)
Underlying profit before tax (£m)(1)
3.4
4.8
6.1
2013 2014 2015
(1) Excludes IPO costs of £4.1m pre-tax (£3.4m post-tax) in 2015 and £6.0m pre-tax (£4.6m post-tax) in 2014
Full year results 2015
12
Business update Phillip Monks
Performance update James Mack
Q&A
Outlook Phillip Monks
Commentary
Note: Numbers may not exactly sum / reconcile due to rounding. (1) Includes derivatives held for risk management, fair value adjustments for
portfolio hedged risk, other assets, prepayments and accrued income, deferred tax and property, plant and equipment.
(2) Includes corporate deposits.
13
(3) RWA = Risk weighted assets. (4) CET1 ratio = Common equity tier 1 capital / RWAs
Continued balance sheet momentum…
31 December 31 December(£m) 2015 2014 Growth %
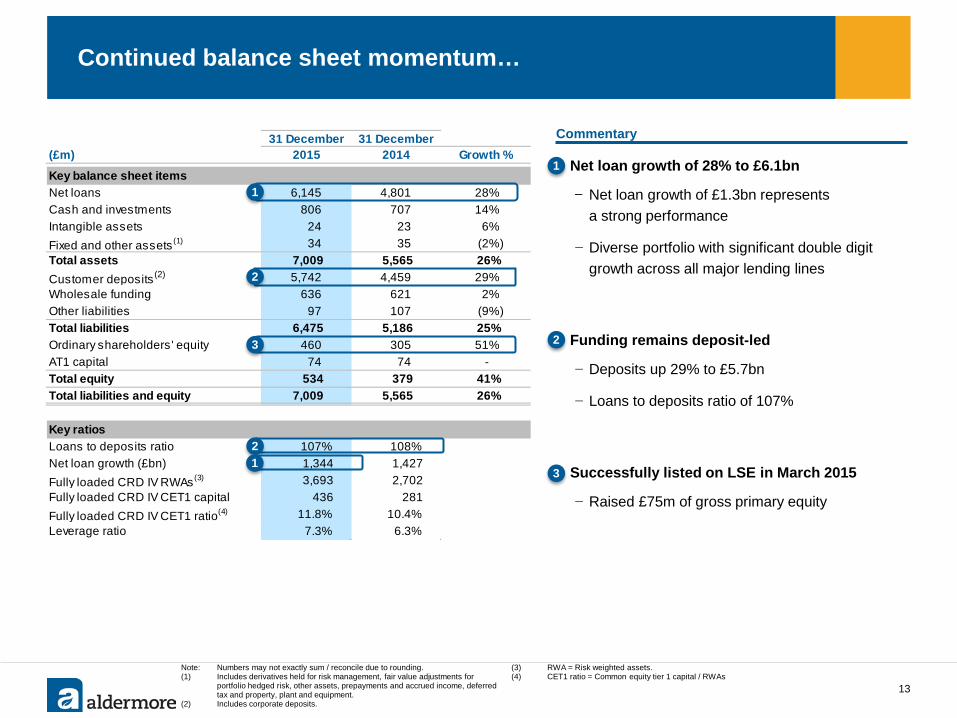
Key balance sheet itemsNet loans 6,145 4,801 28%Cash and investments 806 707 14%Intangible assets 24 23 6%Fixed and other assets(1) 34 35 (2%)Total assets 7,009 5,565 26%Customer deposits(2) 5,742 4,459 29%Wholesale funding 636 621 2%Other liabilities 97 107 (9%)Total liabilities 6,475 5,186 25%Ordinary shareholders' equity 460 305 51%AT1 capital 74 74 -Total equity 534 379 41%Total liabilities and equity 7,009 5,565 26%
Key ratiosLoans to deposits ratio 107% 108%Net loan growth (£bn) 1,344 1,427Fully loaded CRD IV RWAs(3) 3,693 2,702Fully loaded CRD IV CET1 capital 436 281Fully loaded CRD IV CET1 ratio(4) 11.8% 10.4%Leverage ratio 7.3% 6.3%
1
2
2
3
1. Net loan growth of 28% to £6.1bn
− Net loan growth of £1.3bn represents a strong performance
− Diverse portfolio with significant double digit growth across all major lending lines
1. Funding remains deposit-led
− Deposits up 29% to £5.7bn
− Loans to deposits ratio of 107%
1. Successfully listed on LSE in March 2015
− Raised £75m of gross primary equity
1
2
3 1
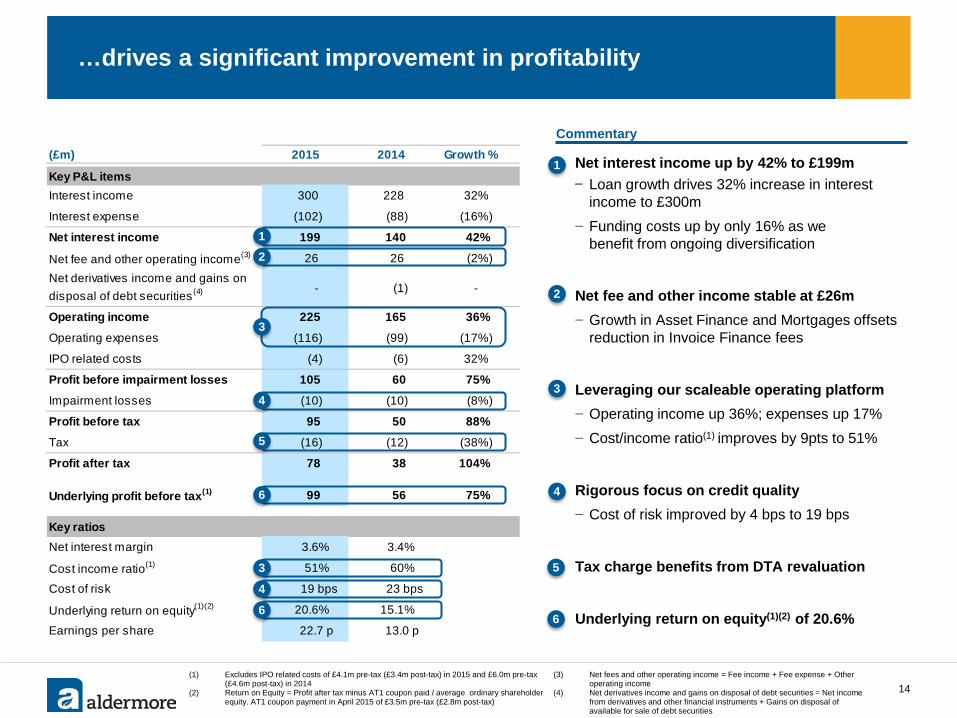
(£m) 2015 2014 Growth %
Key P&L itemsInterest income 300 228 32%
Interest expense (102) (88) (16%)
Net interest income 199 140 42%
Net fee and other operating income(3) 26 26 (2%)
- (1) -
Operating income 225 165 36%
Operating expenses (116) (99) (17%)
IPO related costs (4) (6) 32%
Profit before impairment losses 105 60 75%
Impairment losses (10) (10) (8%)
Profit before tax 95 50 88%
Tax (16) (12) (38%)
Profit after tax 78 38 104%
Underlying profit before tax(1) 99 56 75%
Key ratiosNet interest margin 3.6% 3.4%
Cost income ratio(1) 51% 60%
Cost of risk 19 bps 23 bps
Underlying return on equity(1)(2) 20.6% 15.1%
Earnings per share 22.7 p 13.0 p
Net derivatives income and gains on disposal of debt securities(4)
…drives a significant improvement in profitability
14 (1) Excludes IPO related costs of £4.1m pre-tax (£3.4m post-tax) in 2015 and £6.0m pre-tax
(£4.6m post-tax) in 2014 (2) Return on Equity = Profit after tax minus AT1 coupon paid / average ordinary shareholder
equity. AT1 coupon payment in April 2015 of £3.5m pre-tax (£2.8m post-tax)
1. Net interest income up by 42% to £199m − Loan growth drives 32% increase in interest
income to £300m − Funding costs up by only 16% as we
benefit from ongoing diversification
2. Net fee and other income stable at £26m − Growth in Asset Finance and Mortgages offsets
reduction in Invoice Finance fees
2. Leveraging our scaleable operating platform − Operating income up 36%; expenses up 17% − Cost/income ratio(1) improves by 9pts to 51%
2. Rigorous focus on credit quality − Cost of risk improved by 4 bps to 19 bps
2. Tax charge benefits from DTA revaluation
3. Underlying return on equity(1)(2) of 20.6%
4
3
1
2
5
1
3
6
4
6
3
6
(3) Net fees and other operating income = Fee income + Fee expense + Other operating income
(4) Net derivatives income and gains on disposal of debt securities = Net income from derivatives and other financial instruments + Gains on disposal of available for sale of debt securities
2
4
5
Commentary
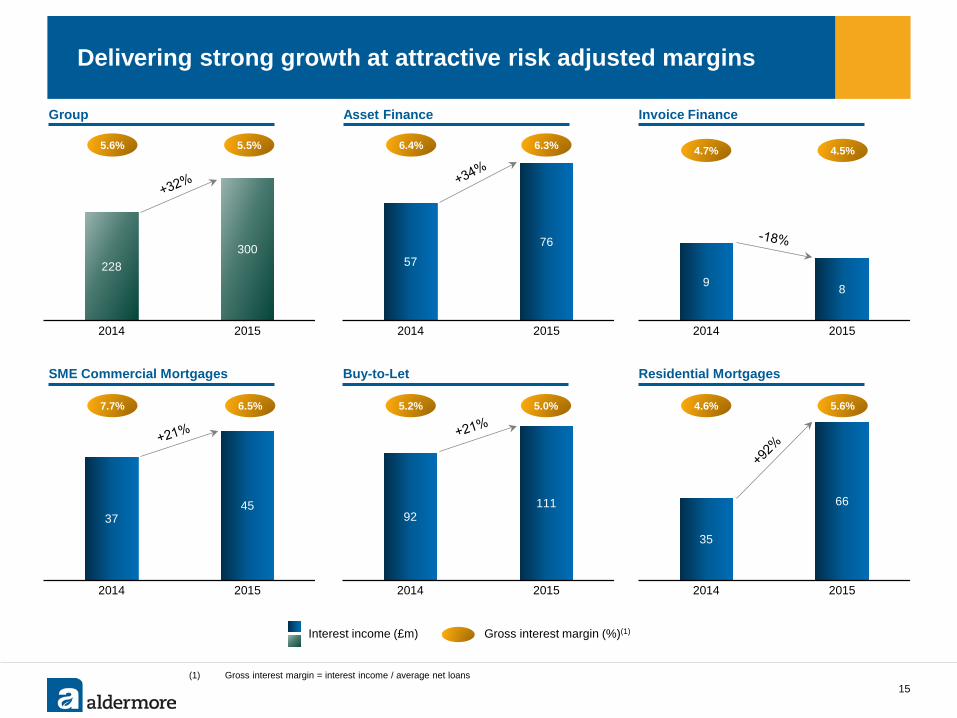
92 111
2014 2015
37 45
2014 2015
7.7% 6.5%
SME Commercial Mortgages
35
66
2014 2015
228 300
2014 2015
Delivering strong growth at attractive risk adjusted margins
15 (1) Gross interest margin = interest income / average net loans
Gross interest margin (%)(1)
Asset Finance
57 76
2014 2015
6.4% 6.3%
9 8
2014 2015
Invoice Finance
4.7% 4.5%
Residential Mortgages
5.6% 4.6%
Group
5.6% 5.5%
Interest income (£m)
Buy-to-Let
5.2% 5.0%
Funding diversification drives expected improvement in NIM
(1) Numbers may not exactly sum / reconcile due to rounding (2) Loans to deposits ratio = net customer loans / customer deposits (3) Cost of funding = interest expense / average net loans. (4) Net interest margin = net interest income / average net loans.
16
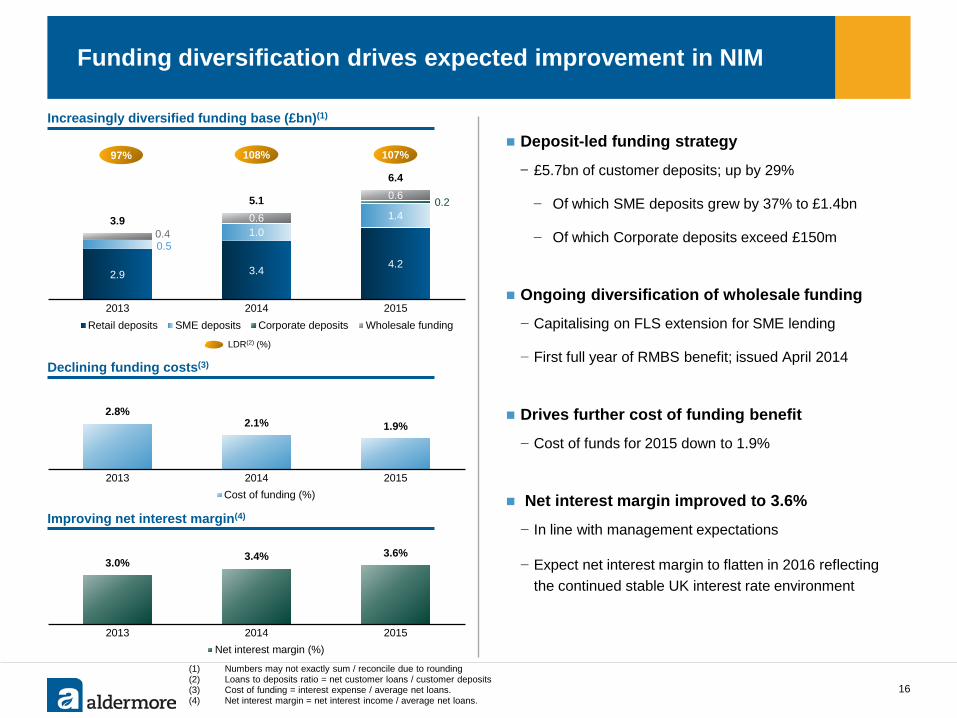
Deposit-led funding strategy
− £5.7bn of customer deposits; up by 29%
− Of which SME deposits grew by 37% to £1.4bn
− Of which Corporate deposits exceed £150m
Ongoing diversification of wholesale funding
− Capitalising on FLS extension for SME lending
− First full year of RMBS benefit; issued April 2014
Drives further cost of funding benefit
− Cost of funds for 2015 down to 1.9%
Net interest margin improved to 3.6%
− In line with management expectations
− Expect net interest margin to flatten in 2016 reflecting the continued stable UK interest rate environment
2.9 3.4 4.2
0.5 1.0
1.4 0.2
0.4 0.6
0.6
3.9
5.1
6.4
2013 2014 2015Retail deposits SME deposits Corporate deposits Wholesale funding
2.8% 2.1% 1.9%
2013 2014 2015Cost of funding (%)
108%
LDR(2) (%)
Increasingly diversified funding base (£bn)(1)
107%
Declining funding costs(3)
97%
Improving net interest margin(4)
3.0% 3.4% 3.6%
2013 2014 2015Net interest margin (%)
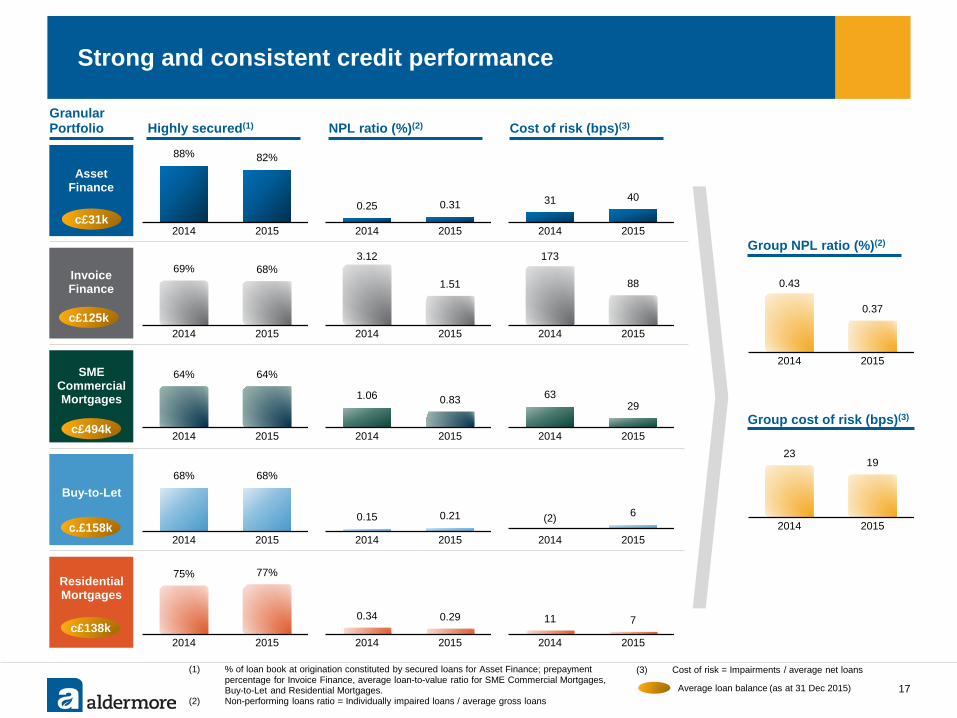
Strong and consistent credit performance
17 Average loan balance (as at 31 Dec 2015)
(1) % of loan book at origination constituted by secured loans for Asset Finance; prepayment percentage for Invoice Finance, average loan-to-value ratio for SME Commercial Mortgages, Buy-to-Let and Residential Mortgages.
(2) Non-performing loans ratio = Individually impaired loans / average gross loans
Granular Portfolio
c£31k
88% 82%
2014 2015
(3) Cost of risk = Impairments / average net loans
Group cost of risk (bps)(3)
Group NPL ratio (%)(2)
0.25 0.31
2014 2015
NPL ratio (%)(2) Cost of risk (bps)(3) Highly secured(1)
31 40
2014 2015
69% 68%
2014 2015
3.12
1.51
2014 2015
173
88
2014 2015
64% 64%
2014 2015
1.06 0.83
2014 2015
63 29
2014 2015
68% 68%
2014 2015
0.15 0.21
2014 2015
(2) 6
2014 2015
75% 77%
2014 2015
0.34 0.29
2014 2015
11 7
2014 2015
0.43
0.37
2014 2015
23 19
2014 2015
SME Commercial Mortgages
Asset Finance
Invoice Finance
Buy-to-Let
Residential Mortgages
c£125k
c£494k
c.£158k
c£138k
60%
51%
2014 2015
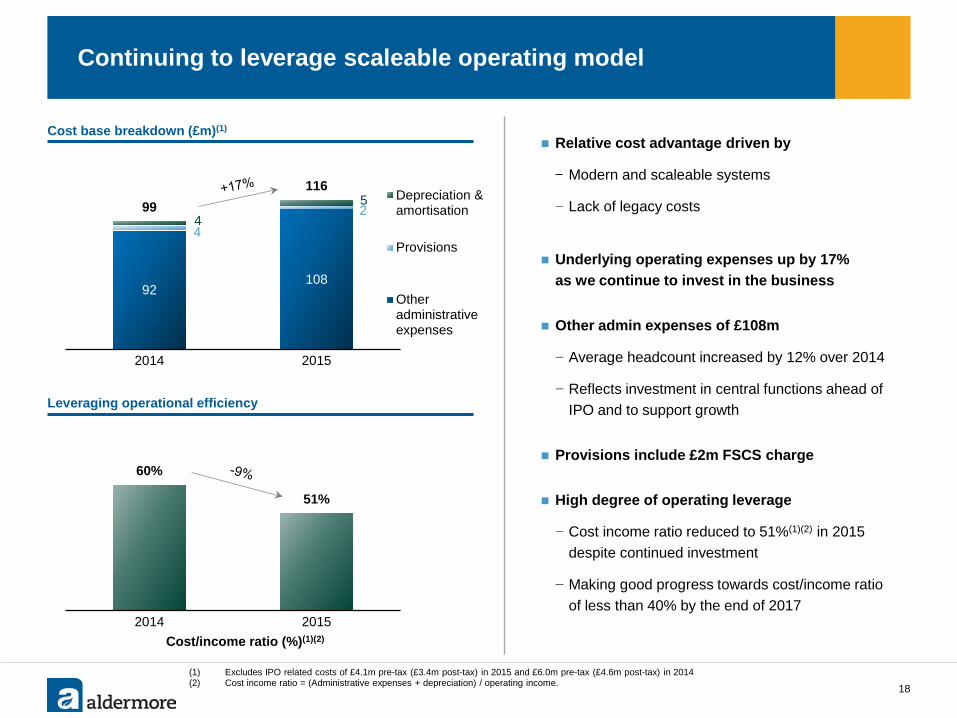
Continuing to leverage scaleable operating model
Relative cost advantage driven by
− Modern and scaleable systems
− Lack of legacy costs
Underlying operating expenses up by 17% as we continue to invest in the business
Other admin expenses of £108m
− Average headcount increased by 12% over 2014
− Reflects investment in central functions ahead of IPO and to support growth
Provisions include £2m FSCS charge
High degree of operating leverage
− Cost income ratio reduced to 51%(1)(2) in 2015 despite continued investment
− Making good progress towards cost/income ratio of less than 40% by the end of 2017
18
Leveraging operational efficiency
92 108
4 2
4 5 99
116
2014 2015
Depreciation &amortisation
Provisions
Otheradministrativeexpenses
Cost base breakdown (£m)(1)
Cost/income ratio (%)(1)(2)
(1) Excludes IPO related costs of £4.1m pre-tax (£3.4m post-tax) in 2015 and £6.0m pre-tax (£4.6m post-tax) in 2014 (2) Cost income ratio = (Administrative expenses + depreciation) / operating income.
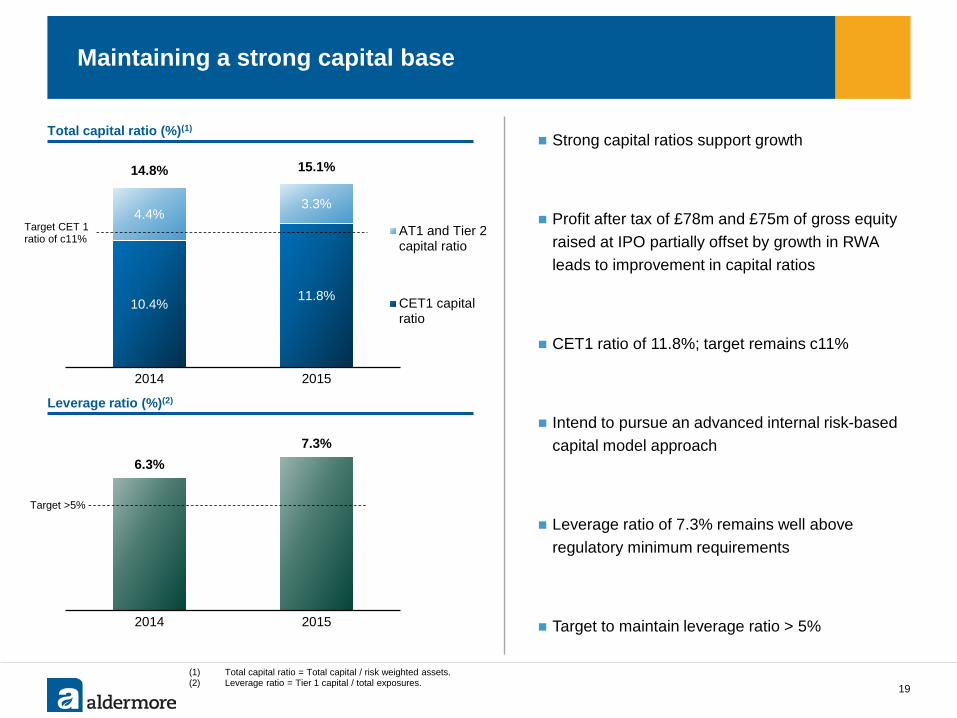
6.3% 7.3%
2014 2015
Maintaining a strong capital base
Total capital ratio (%)(1)
Leverage ratio (%)(2)
(1) Total capital ratio = Total capital / risk weighted assets. (2) Leverage ratio = Tier 1 capital / total exposures. 19
Target CET 1 ratio of c11%
Target >5%
Strong capital ratios support growth
Profit after tax of £78m and £75m of gross equity raised at IPO partially offset by growth in RWA leads to improvement in capital ratios
CET1 ratio of 11.8%; target remains c11%
Intend to pursue an advanced internal risk-based capital model approach
Leverage ratio of 7.3% remains well above regulatory minimum requirements
Target to maintain leverage ratio > 5%
10.4% 11.8%
4.4% 3.3%
14.8% 15.1%
2014 2015
AT1 and Tier 2capital ratio
CET1 capitalratio
Full year results 2015
20
Business update Phillip Monks
Performance update James Mack
Q&A
Outlook Phillip Monks
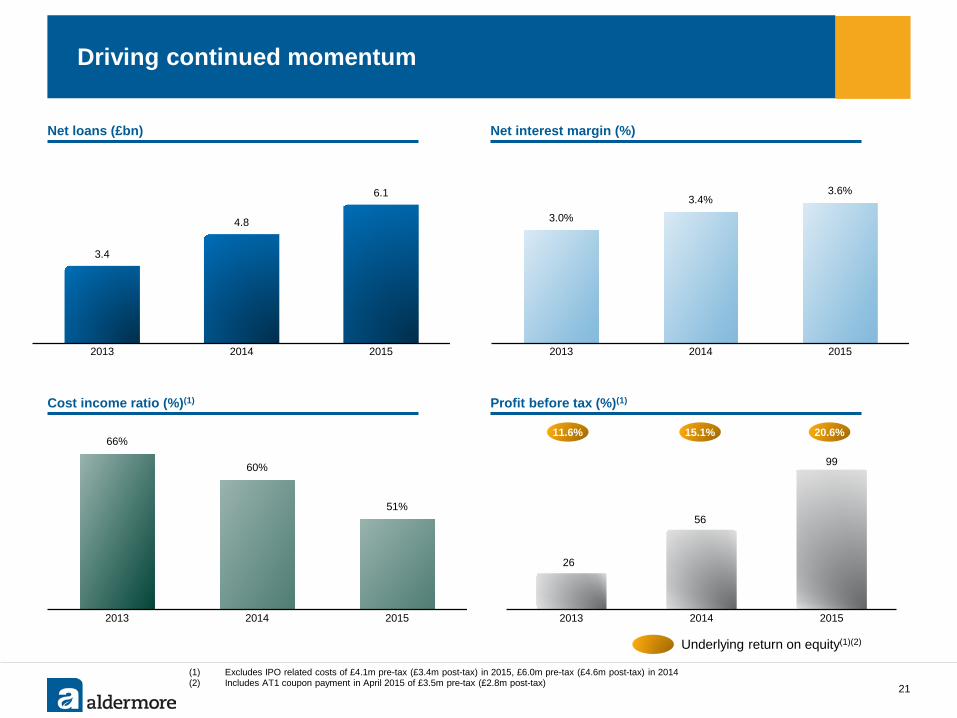
66%
60%
51%
2013 2014 2015
26
56
99
2013 2014 2015
Net loans (£bn) Net interest margin (%)
Profit before tax (%)(1) Cost income ratio (%)(1)
Driving continued momentum
21
3.0%
3.4% 3.6%
2013 2014 2015
Underlying return on equity(1)(2)
11.6%
(1) Excludes IPO related costs of £4.1m pre-tax (£3.4m post-tax) in 2015, £6.0m pre-tax (£4.6m post-tax) in 2014 (2) Includes AT1 coupon payment in April 2015 of £3.5m pre-tax (£2.8m post-tax)
15.1% 20.6%
3.4
4.8
6.1
2013 2014 2015
Full year results 2015
22
Business update Phillip Monks
Performance update James Mack
Q&A
Outlook Phillip Monks

23
Appendices
75% 75%
25% 25% 740 893
2014 2015
93% 91%
7% 9% 560 582
2014 2015
84% 81%
16% 19%
726 673
2014 2015
88% 74% 12%
26% 301 428
2014 2015
71% 60%
29% 40%
45 35
2014 2015
0.3%
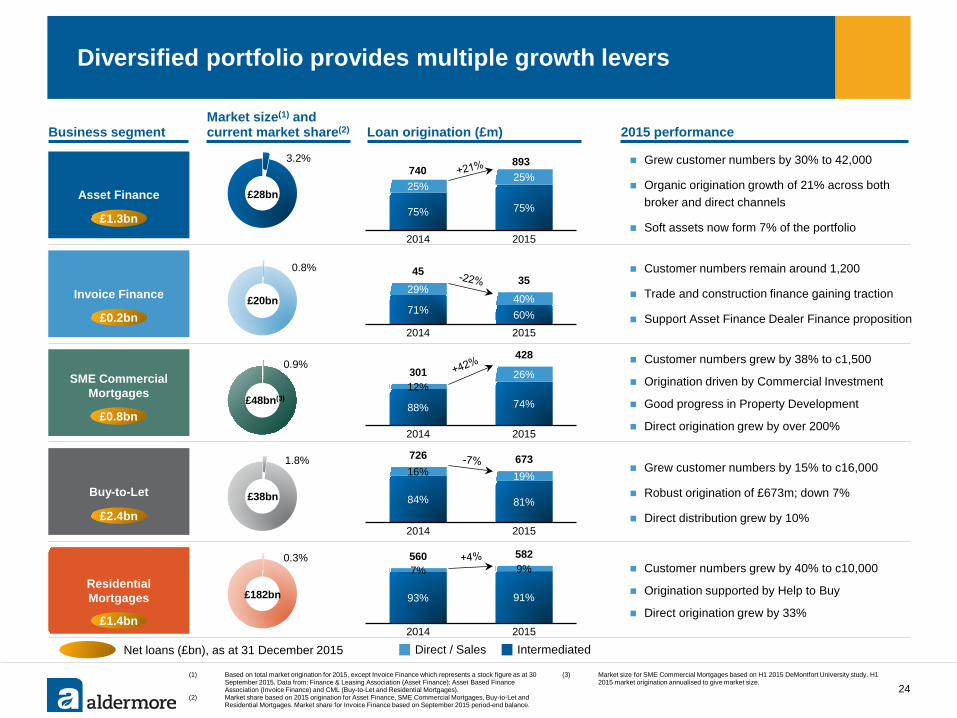
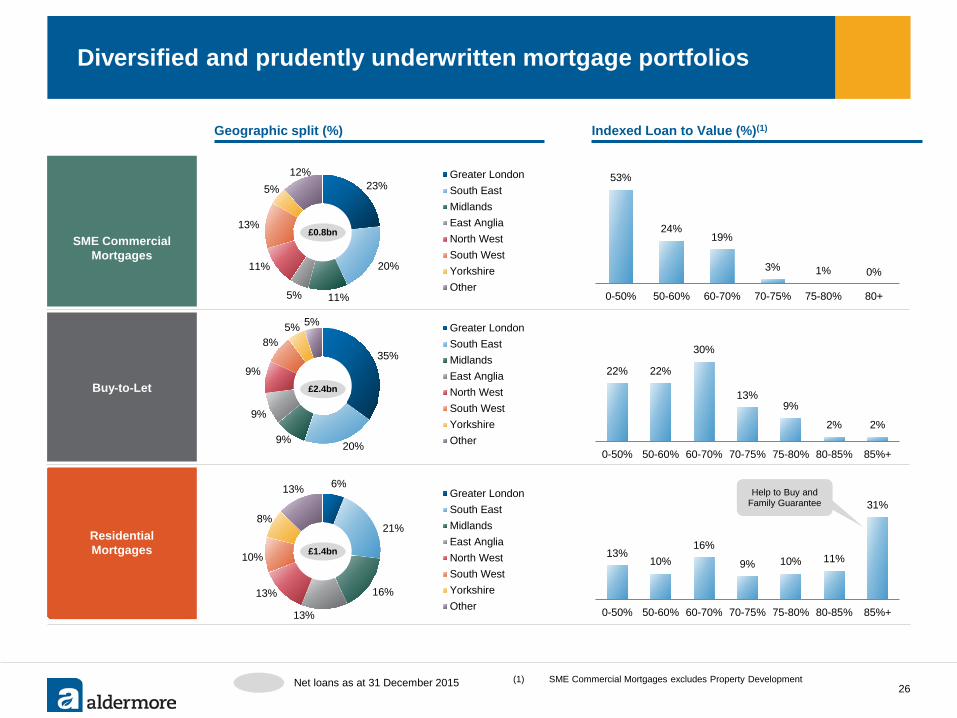
Diversified portfolio provides multiple growth levers
(1) Based on total market origination for 2015, except Invoice Finance which represents a stock figure as at 30 September 2015. Data from: Finance & Leasing Association (Asset Finance); Asset Based Finance Association (Invoice Finance) and CML (Buy-to-Let and Residential Mortgages).
(2) Market share based on 2015 origination for Asset Finance, SME Commercial Mortgages, Buy-to-Let and Residential Mortgages. Market share for Invoice Finance based on September 2015 period-end balance.
(3) Market size for SME Commercial Mortgages based on H1 2015 DeMontfort University study. H1 2015 market origination annualised to give market size.
Asset Finance
Residential Mortgages
Invoice Finance
SME Commercial Mortgages
Grew customer numbers by 15% to c16,000
Robust origination of £673m; down 7%
Direct distribution grew by 10%
Grew customer numbers by 30% to 42,000
Organic origination growth of 21% across both broker and direct channels
Soft assets now form 7% of the portfolio
Customer numbers remain around 1,200
Trade and construction finance gaining traction
Support Asset Finance Dealer Finance proposition
Customer numbers grew by 38% to c1,500
Origination driven by Commercial Investment
Good progress in Property Development
Direct origination grew by over 200%
£1.3bn
£0.2bn
£0.8bn
£1.4bn
Net loans (£bn), as at 31 December 2015 Intermediated Direct / Sales
Business segment 2015 performance Market size(1) and current market share(2)
3.2%
£28bn
0.8%
£20bn
0.9%
£48bn(3)
1.8%
£182bn
24
Loan origination (£m)
Buy-to-Let
£2.4bn £38bn
Customer numbers grew by 40% to c10,000
Origination supported by Help to Buy
Direct origination grew by 33%
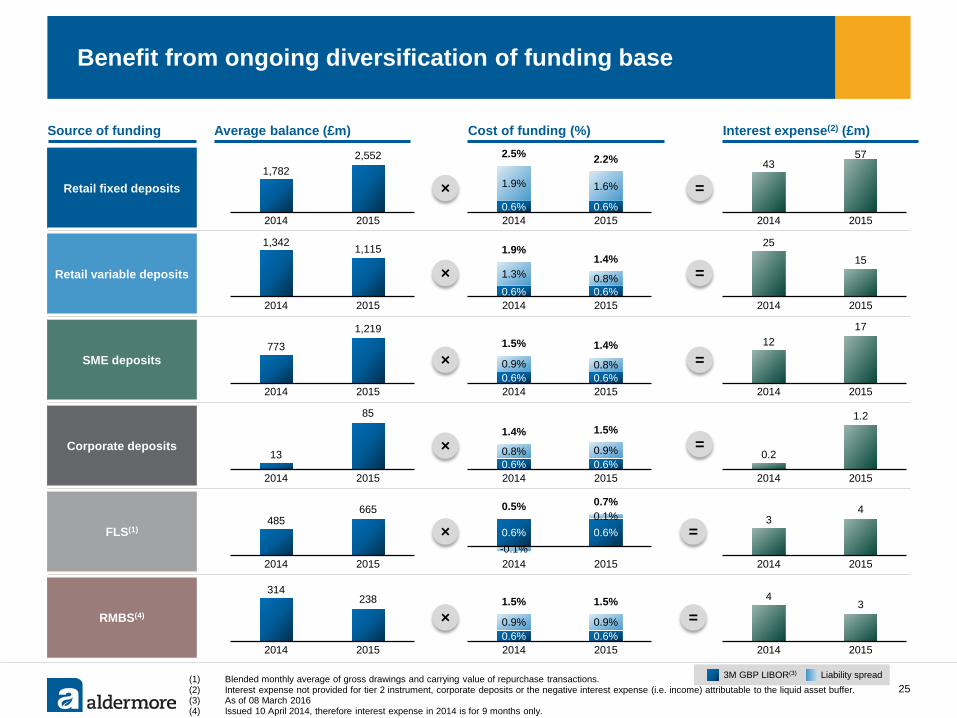
Benefit from ongoing diversification of funding base
25
Source of funding Average balance (£m) Cost of funding (%) Interest expense(2) (£m)
3M GBP LIBOR(3) Liability spread
Retail fixed deposits ×
×
×
×
=
=
=
=
1,782 2,552
2014 2015
× =
(1) Blended monthly average of gross drawings and carrying value of repurchase transactions. (2) Interest expense not provided for tier 2 instrument, corporate deposits or the negative interest expense (i.e. income) attributable to the liquid asset buffer. (3) As of 08 March 2016 (4) Issued 10 April 2014, therefore interest expense in 2014 is for 9 months only.
Retail variable deposits
SME deposits
Corporate deposits
FLS(1)
RMBS(4)
0.6% 0.6%
1.9% 1.6%
2.5% 2.2%
2014 2015
43 57
2014 2015
1,342 1,115
2014 20150.6% 0.6% 1.3% 0.8%
1.9% 1.4%
2014 2015
25 15
2014 2015
773
1,219
2014 20150.6% 0.6% 0.9% 0.8%
1.5% 1.4%
2014 2015
12 17
2014 2015
13
85
2014 20150.6% 0.6% 0.8% 0.9%
1.4% 1.5%
2014 2015
0.2
1.2
2014 2015
485 665
2014 2015
0.6% 0.6% -0.1%
0.1% 0.5% 0.7%
2014 2015
3 4
2014 2015
314 238
2014 2015
4 3
2014 20150.6% 0.6% 0.9% 0.9%
1.5% 1.5%
2014 2015
× =
35%
20% 9%
9%
9%
8% 5% 5% Greater London
South EastMidlandsEast AngliaNorth WestSouth WestYorkshireOther
Diversified and prudently underwritten mortgage portfolios
26
Geographic split (%) Indexed Loan to Value (%)(1)
SME Commercial Mortgages
Buy-to-Let
Residential Mortgages
£2.4bn
Net loans as at 31 December 2015
0% 1% 3%
19% 24%
53%
80+75-80%70-75%60-70%50-60%0-50%
2% 2%
9% 13%
30%
22% 22%
85%+80-85%75-80%70-75%60-70%50-60%0-50%
31%
11% 10% 9%
16% 10%
13%
85%+80-85%75-80%70-75%60-70%50-60%0-50%
6%
21%
16%
13%
13%
10%
8%
13% Greater LondonSouth EastMidlandsEast AngliaNorth WestSouth WestYorkshireOther
£1.4bn
23%
20%
11% 5%
11%
13%
5% 12% Greater London
South EastMidlandsEast AngliaNorth WestSouth WestYorkshireOther
£0.8bn
Help to Buy and Family Guarantee
(1) SME Commercial Mortgages excludes Property Development
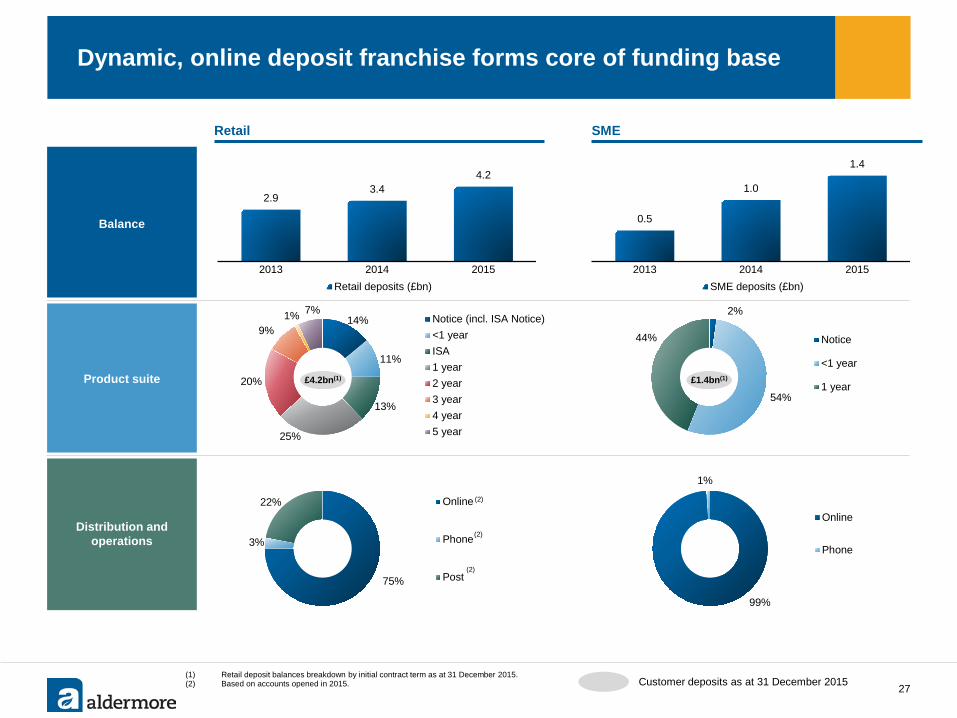
99%
1%
Online
Phone
75%
3%
22% Online
Phone
Post
Dynamic, online deposit franchise forms core of funding base
27
Retail SME
Balance
Product suite
Distribution and operations
(1) Retail deposit balances breakdown by initial contract term as at 31 December 2015. (2) Based on accounts opened in 2015.
0.5
1.0
1.4
2013 2014 2015SME deposits (£bn)
14%
11%
13%
25%
20%
9% 1% 7%
Notice (incl. ISA Notice)<1 yearISA1 year2 year3 year4 year5 year
2%
54%
44% Notice
<1 year
1 year
(2)
(2)
(2)
£4.2bn(1)
Customer deposits as at 31 December 2015
2.9 3.4
4.2
2013 2014 2015Retail deposits (£bn)
£1.4bn(1)
28
Disclaimer
The provision of the information in this document (the “Information”) or any part of it does not constitute, and should not be construed as, investment advice or part of any offer or invitation to sell, or any recommendation or invitation to purchase, or any solicitation of any offer to purchase or subscribe for, any securities in any member of Aldermore Group PLC (the “Company”) or its subsidiaries from time to time (together the “Group”) and is not intended to provide the basis of any investment decision, nor does it nor is it intended to form the basis of any contract for acquisition or investment in any member of the Group, financial promotion, or any offer, invitation or recommendation in relation to any acquisition of, or investment in, any member of the Group in any jurisdiction. The Information is not directed to or intended for distribution to, or use by, any person or entity in any jurisdiction where such distribution, publication, availability or use would be contrary to local laws or regulations or require any registration or licensing within such jurisdiction, including without limitation Australia, Canada, Japan or the United States. None of the Company or any of its associates, accepts any liability to any person in relation to the distribution or possession of the Information in or from any such jurisdiction. No representation or warranty, express or implied, is given by or on behalf of the Company or its affiliates, agents, advisers, parent or subsidiary undertakings, shareholders, directors, partners, employees or any other person (“Associates”) as to, and no reliance may be placed for any purposes whatsoever on, the adequacy, accuracy, completeness, fairness or reasonableness of the Information, including any opinions contained within the Information. The Company and its Associates disclaim, to the fullest extent permitted by applicable law and regulation, all and any responsibility or liability whether arising in tort, contract or otherwise, which they might otherwise have in respect of any of the Information. No duty of care is owed or will be deemed to be owed to you or any other person in respect of the Information. Recipients should not construe the Information as legal, tax, regulatory, financial or accounting advice and are urged to consult with their own advisers in relation to such matters. The Information is provided as at the date of this document, is of a preliminary nature and is subject to change, without notice. The Information may change materially. None of the Company or its Associates undertakes or is under any duty to update, complete, revise or keep current the Information or to correct any inaccuracies in the Information which may become apparent, or to provide you with any additional information. Certain industry and market data contained in the Information has come from third party sources. Third party industry publications, studies and surveys generally state that the data contained therein have been obtained from sources believed to be reliable, but that there is no guarantee of the accuracy or completeness of such data. While the Company believes that each of these publications, studies and surveys has been prepared by a reputable source, the Company or its Associates have not independently verified the data contained therein. In addition, certain of the industry and market data contained in the Information comes from the Company's own internal research and estimates based on the knowledge and experience of the Company's management in the market in which the Company operates. While the Company believes that such research and estimates are reasonable and reliable, they, and their underlying methodology and assumptions, have not been verified by any independent source for accuracy or completeness and are subject to change without notice. Accordingly, no reliance should be placed on any of the industry or market data contained in the Information. The Information may contain "forward-looking statements" or "projections“ which include all statements other than statements of historical facts, including, without limitation, those regarding the Company's financial position, business strategy, plans and objectives of management for future operations, or any statements preceded by, followed by or that include the words "targets", "believes", "estimates", "expects", "aims", "intends", "will", "may", "anticipates", "projects", "plans", "forecasts", "would", "could", "should" or similar expressions or negatives thereof. Such forward-looking statements involve known and unknown risks, uncertainties and other important factors beyond the Company’s control that could cause the actual results, performance or achievements of the Company to be materially different from future results, performance or achievements expressed or implied by such forward-looking statements. Such forward looking statements are based on numerous assumptions regarding the Company's present and future business strategies and the environment in which the Company will operate in the future. Forward-looking statements involve numerous risks and uncertainties that could cause actual results to differ materially from expected results. No attempt has been made by the Company to audit or verify the forward-looking statements or any other financial information. No representation or warranty, express or implied, is made that any of these statements, projections or forecasts will come to pass or that any forecasted result will be achieved. As a result, you are cautioned not to place undue reliance on such forward-looking statements. Past performance should not be taken as an indication or guarantee of future results, and no representation or warranty, express or implied, is made regarding future performance. Some of the information is still in draft form and will only be finalised, if legally verifiable, at a later date. Forward-looking statements speak only as of their date and the Company and its Associates expressly disclaim any obligation or undertaking to supplement, amend, update or revise any of the forward-looking statements made herein, except where it would be required to do so under applicable law or regulation.