Embed Size (px)
Citation preview
06/01/2010
1
Euro-Mediterranean Energy Market Integration Project
Germany
France
Lebanon
Belgium
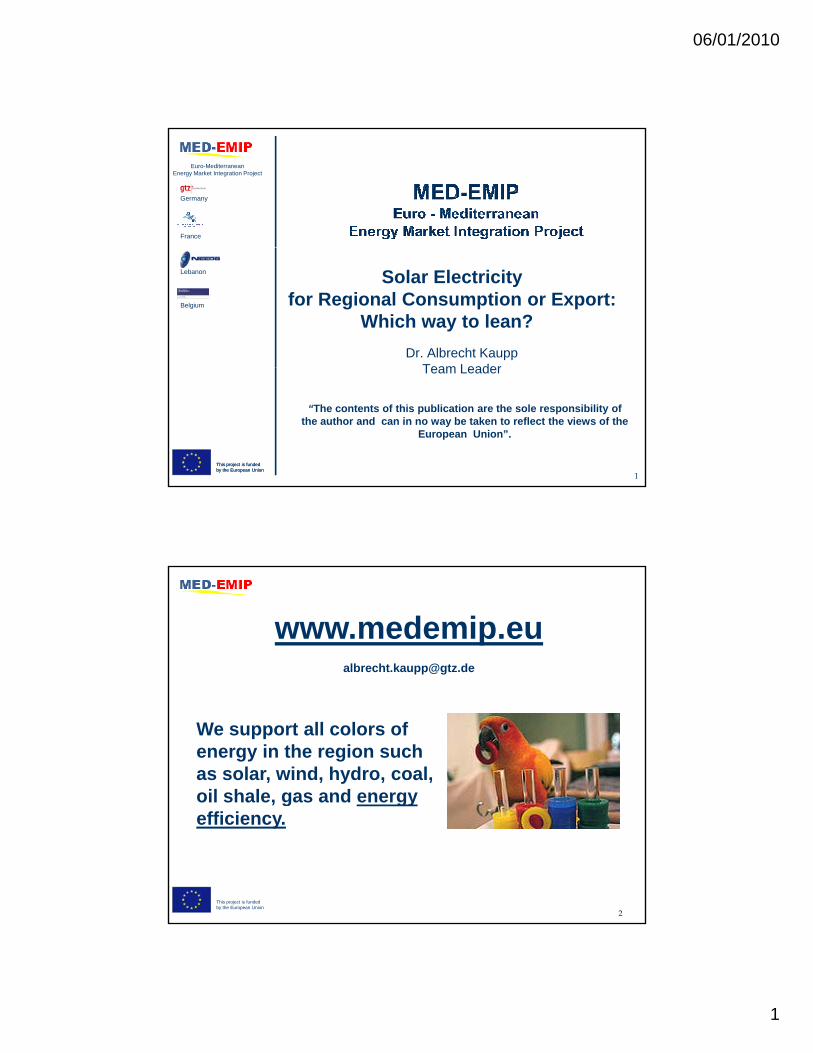
Dr. Albrecht KauppTeam Leader
Solar Electricity for Regional Consumption or Export:
Which way to lean?
This project is funded by the European UnionThis project is funded by the European Union
Team Leader
“The contents of this publication are the sole responsibility of the author and can in no way be taken to reflect the views of the
European Union”.
1
We support all colors of energy in the region such as solar, wind, hydro, coal, oil shale, gas and energy
This project is funded by the European Union
2
, g gyefficiency.
06/01/2010
2
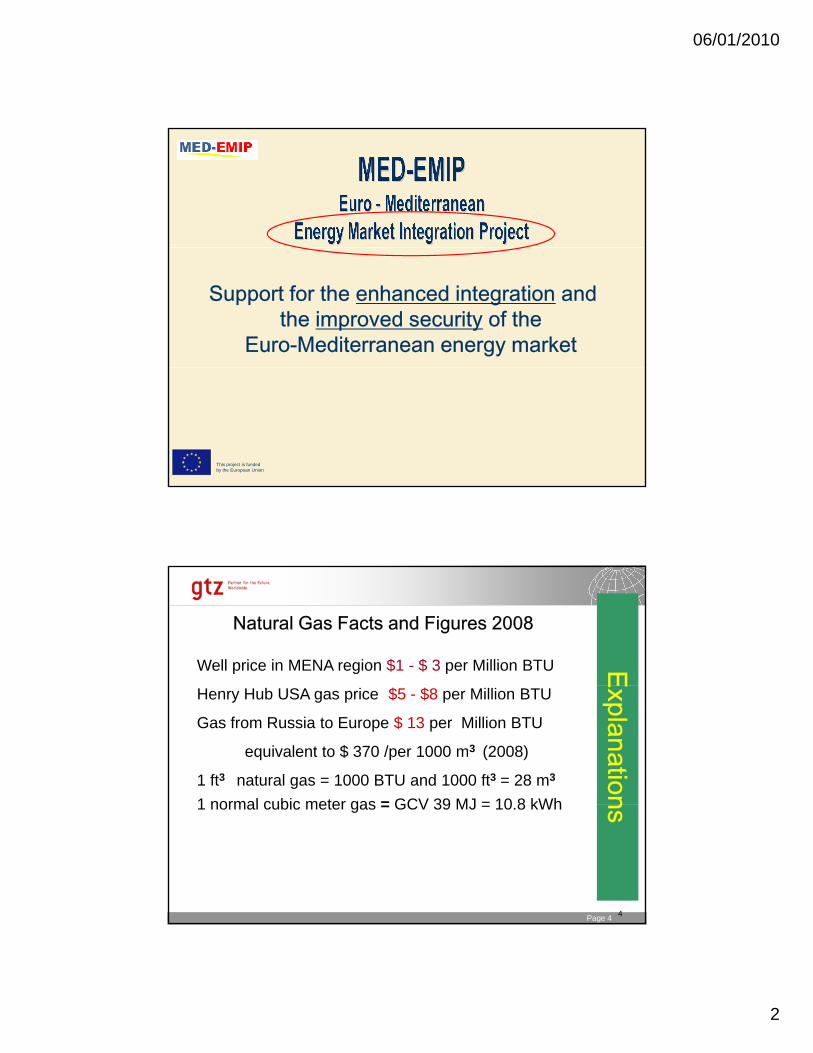
Support for the enhanced integration and the improved security of the
Euro-Mediterranean energy market
This project is funded by the European Union
Natural Gas Facts and Figures 2008
EWell price in MENA region $1 - $ 3 per Million BTU Explanation
Henry Hub USA gas price $5 - $8 per Million BTU
Gas from Russia to Europe $ 13 per Million BTU
equivalent to $ 370 /per 1000 m3 (2008)
1 ft3 natural gas = 1000 BTU and 1000 ft3 = 28 m3
1 normal cubic meter gas = GCV 39 MJ = 10 8 kWh
06.01.2010 Seite 4Page 4 4
ns1 normal cubic meter gas = GCV 39 MJ = 10.8 kWh
06/01/2010
3
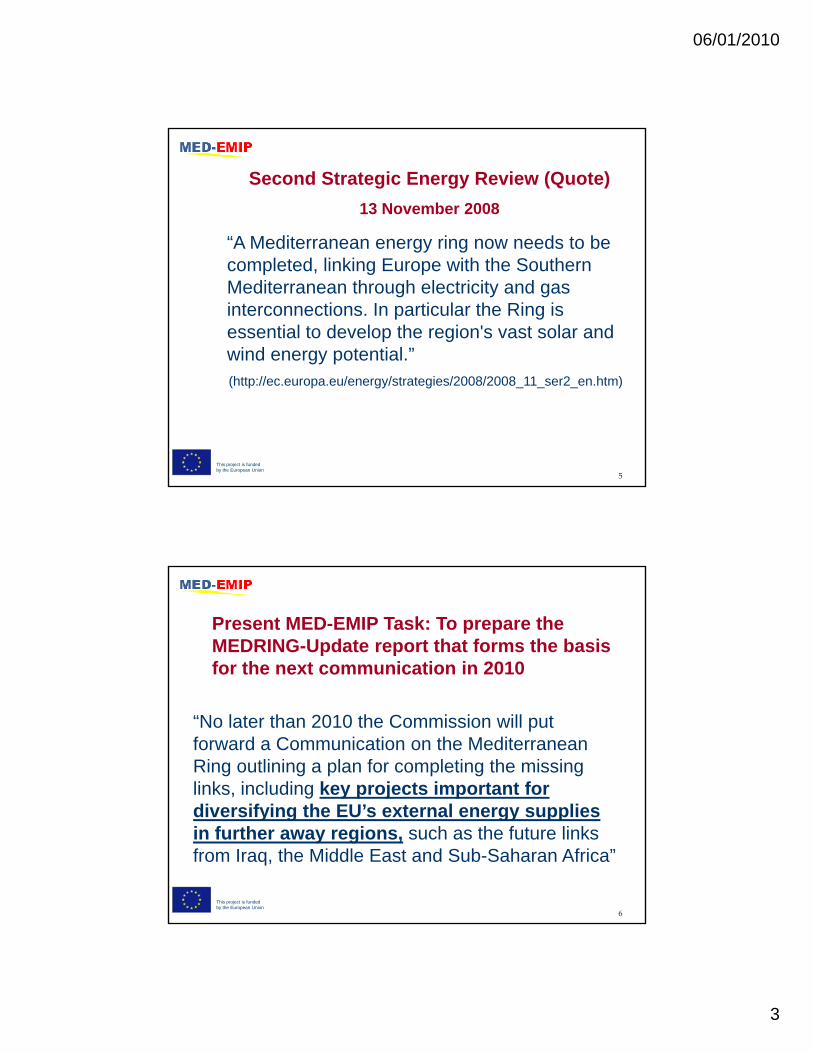
Second Strategic Energy Review (Quote)13 November 2008
“A Mediterranean energy ring now needs to beA Mediterranean energy ring now needs to be completed, linking Europe with the Southern Mediterranean through electricity and gas interconnections. In particular the Ring is essential to develop the region's vast solar and wind energy potential.”
This project is funded by the European Union
5
(http://ec.europa.eu/energy/strategies/2008/2008_11_ser2_en.htm)
Present MED-EMIP Task: To prepare the MEDRING-Update report that forms the basis for the next communication in 2010
“No later than 2010 the Commission will put forward a Communication on the Mediterranean Ring outlining a plan for completing the missing links, including key projects important for di if i th EU’ t l li
This project is funded by the European Union
6
diversifying the EU’s external energy supplies in further away regions, such as the future links from Iraq, the Middle East and Sub-Saharan Africa”
06/01/2010
4
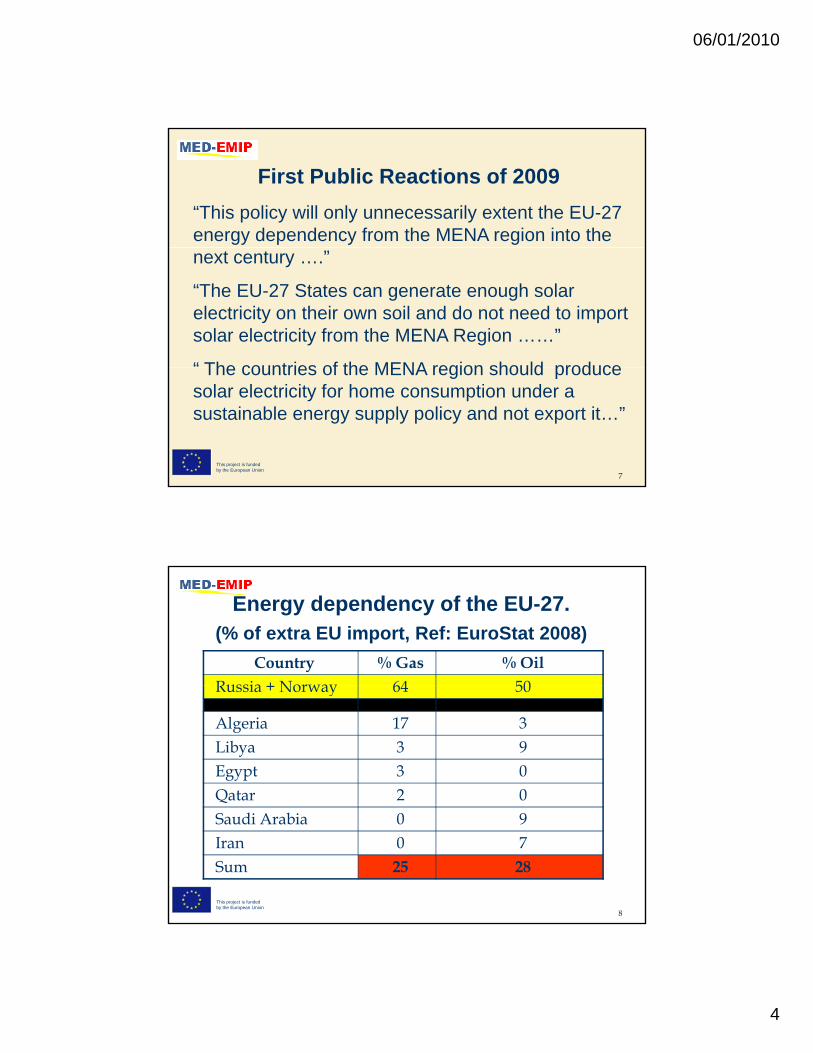
First Public Reactions of 2009“This policy will only unnecessarily extent the EU-27 energy dependency from the MENA region into the next century ….”
“The EU-27 States can generate enough solar electricity on their own soil and do not need to import solar electricity from the MENA Region ……”
“ The countries of the MENA region should produce
This project is funded by the European Union
7
The countries of the MENA region should produce solar electricity for home consumption under a sustainable energy supply policy and not export it…”
Energy dependency of the EU-27.(% of extra EU import, Ref: EuroStat 2008)
Country % Gas % OilRussia + Norway 64 50Russia + Norway 64 50
Algeria 17 3Libya 3 9Egypt 3 0Qatar 2 0
This project is funded by the European Union
8
Saudi Arabia 0 9Iran 0 7Sum 25 28
06/01/2010
5
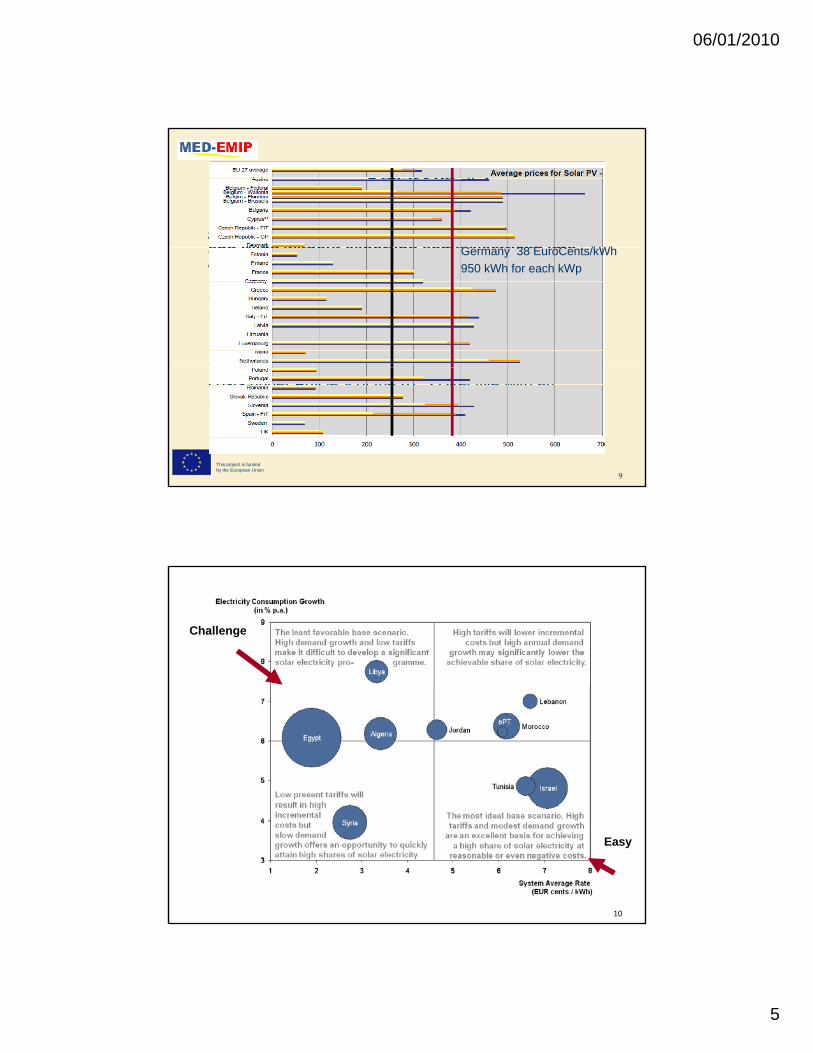
Key-Issue # 1 Is it possible to built a significant and economically attractive RE based power industry with PV, CSP and Wind without exporting some electricity intoG 38 E C t /kWhand Wind without exporting some electricity into well paying EU markets ?
• Significant is defined as 30% of the electricity generation in 2030 is based on PV, CSP and Wind in a Country of the MENA region .
•Well paying is defined as full cost recovery of supply
Germany 38 EuroCents/kWh950 kWh for each kWp
This project is funded by the European Union
9
Well paying is defined as full cost recovery of supply costs under Article 9 of the RES Directive with an orientation on various feed-in-tariff schemes.
Challenge
10
Easy

06/01/2010
6
Variables and Constants
11
14
16SAR (€¢ / kWh)
CSP, PV, EU 27 Residential
System Average Rates (2008)
Large range of 3 $Cents/ kWh to 10 $Cents/ kWh
4,64
6,086,176,596,69
7,07
6
8
10
12
Wind
EU 27 Industry
g g $ $
1,912,74
3,323,42
0
2
4
LYDZJOoPTMATNMediterranean Partner Countries
EGSYLBIL
Note: Assumed US$-EUR exchange rate: 1.4

06/01/2010
7
AIC (€ million)
-400
400
0
AAIC (€ million)
-4,000
4,000
0
-4,000
4,000
0
AIC (€ million)
-400
400
0
AAIC (€ million)
Favourable scenario Unfavourable scenario
Targ
et
10%
TUNESIA
-800
-1,200
-8,000
-12,00020282024202020162012
-8,000
-12,00020282024202020162012
-800
-1,200AAIC (€ million)AIC (€ million)
AAIC (€ million)AIC (€ million)
AIC (€ million)400
0
AAIC (€ million)4,000
0 0
4,000
AIC (€ million)400
0
AAIC (€ million)
rget
0%
13
-1,200
-800
-400
-8,000
-4,000
-12,00020282024202020162012 2012 2016 2024
-800
-400
2020-1,200
-8,000
-4,000
2028-12,000
Ta 40
AAIC (€ million)AIC (€ million)
AAIC (€ million)AIC (€ million)
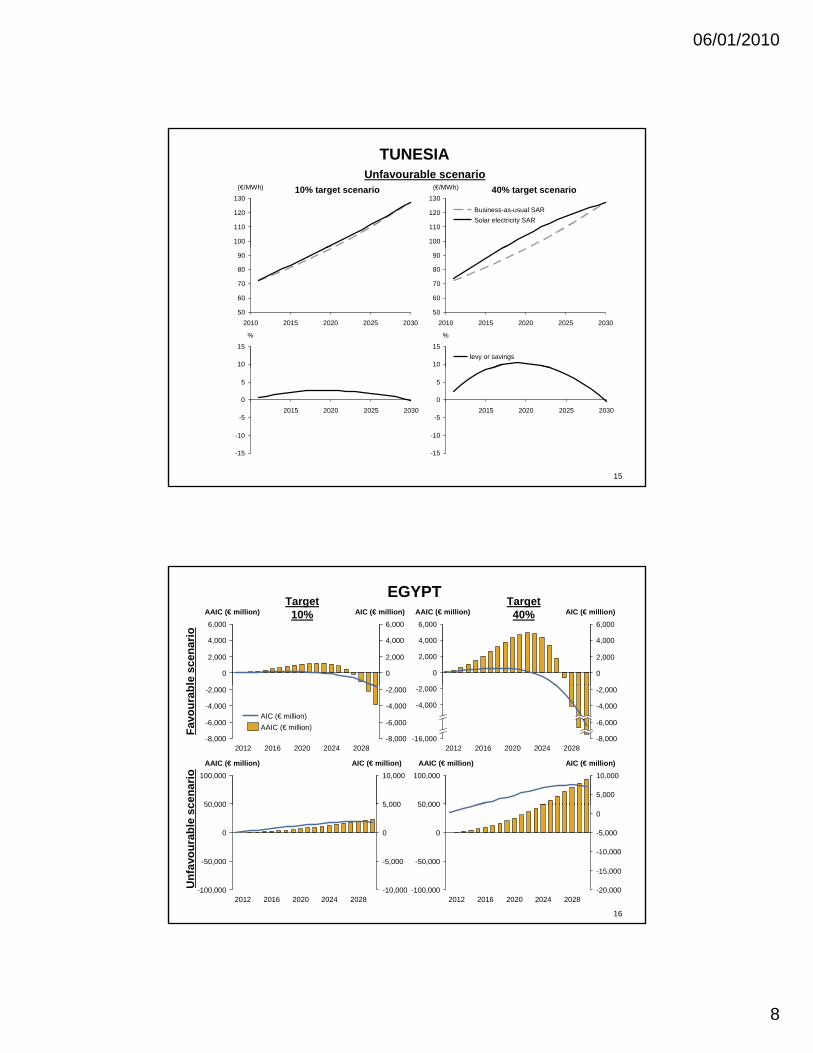
TUNESIA
40% target scenario
100
110
120
130(€/MWh)
Solar electricity SARBusiness-as-usual SAR
10% target scenarioFavourable scenario
100
110
120
130(€/MWh)
50
60
70
80
90
202520202015 20302010
10
15%
levy or savings
50
60
70
80
90
202520202015 20302010
10
15%
14
-30
-25
-20
-15
-10
-5
0
5
202520202015 2030
-15
-10
-5
0
5
10
202520202015 2030
06/01/2010
8
TUNESIA
40% target scenario
100
110
120
130(€/MWh)
Solar electricity SARBusiness-as-usual SAR
10% target scenarioUnfavourable scenario
100
110
120
130(€/MWh)
50
60
70
80
90
202520202015 20302010
10
15%
levy or savings
50
60
70
80
90
202520202015 20302010
10
15%
15
-15
-10
-5
0
5
202520202015 2030
-15
-10
-5
0
5
202520202015 2030
EGYPT
0
AIC (€ million)
0
2,000
4,000
6,000
2,000
4,000
AAIC (€ million)6,000
le s
cena
rio
Target 40%
Target 10%
0
2,000
0
AAIC (€ million) AIC (€ million)
2,000
4,000
6,000
4,000
6,000
2016 20282020 20242012
-2,000
-4,000
-8,000
-6,000
-8,000
-6,000
-4,000
-2,000
AIC (€ million)100,000
5 00050 000
10,000
AAIC (€ million)
AIC (€ million)AAIC (€ million)Fa
vour
ab
100,000
5,00050 000
AAIC (€ million)10,000
AIC (€ million)
-4,000
-16,000
-2,000-2,000
-8,000
-6,000
2020
-4,000
2024 20282012 2016
cena
rio
16
20242016 2020
0
2012 2028
0
-5,000
5,00050,000
-50,000
-100,000 -10,0002016 20242020 20282012
0
-15,000
50,000
-100,000 -20,000
-10,000-50,000
0
-5,000
Unf
avou
rabl
e sc
06/01/2010
9
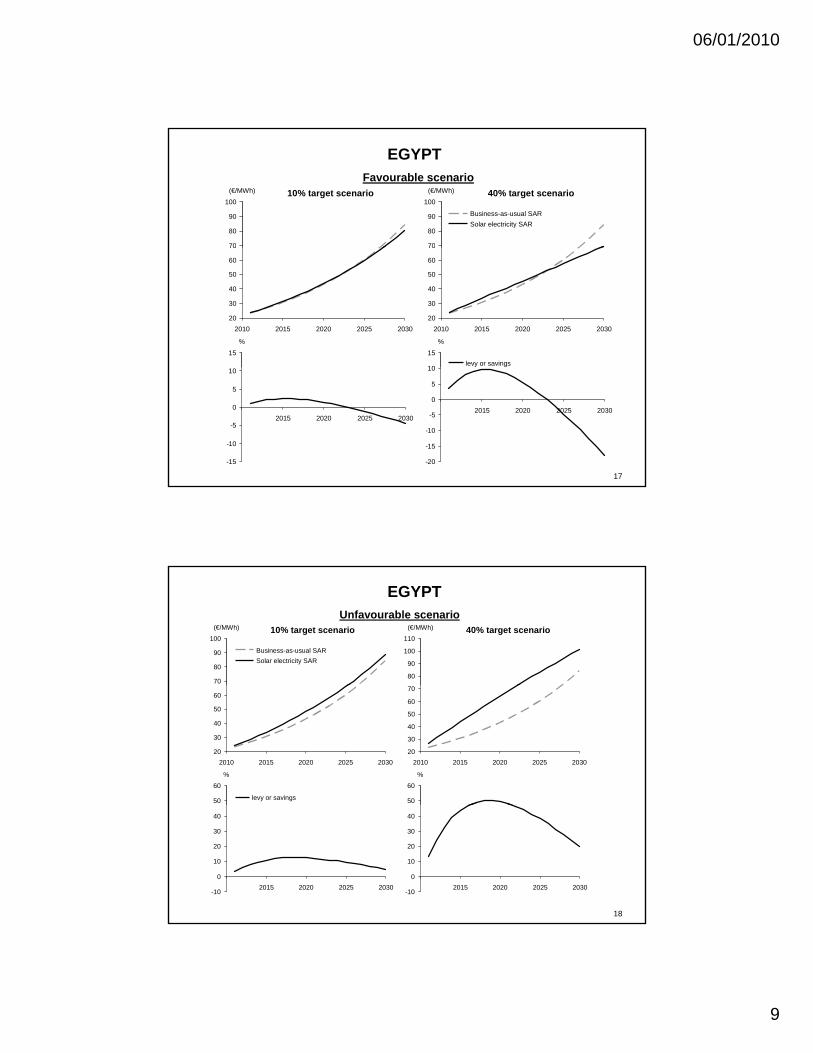
EGYPT
40% target scenario
70
80
90
100(€/MWh)
Solar electricity SARBusiness-as-usual SAR
10% target scenarioFavourable scenario
70
80
90
100(€/MWh)
20
30
40
50
60
70
202520202015 20302010
10
15%
levy or savings
20
30
40
50
60
70
202520202015 20302010
15%
17
-20
-15
-10
-5
0
5
10
202520202015 2030
-15
-10
-5
0
5
10
202520202015 2030
EGYPT
40% target scenario
80
90
100
110(€/MWh)
Solar electricity SARBusiness-as-usual SAR
10% target scenarioUnfavourable scenario
70
80
90
100(€/MWh)
20
30
40
50
60
70
202520202015 20302010
50
60%
levy or savings
20
30
40
50
60
202520202015 20302010
50
60%
18
-10
0
10
20
30
40
202520202015 2030-10
0
10
20
30
40
202520202015 2030

06/01/2010
10
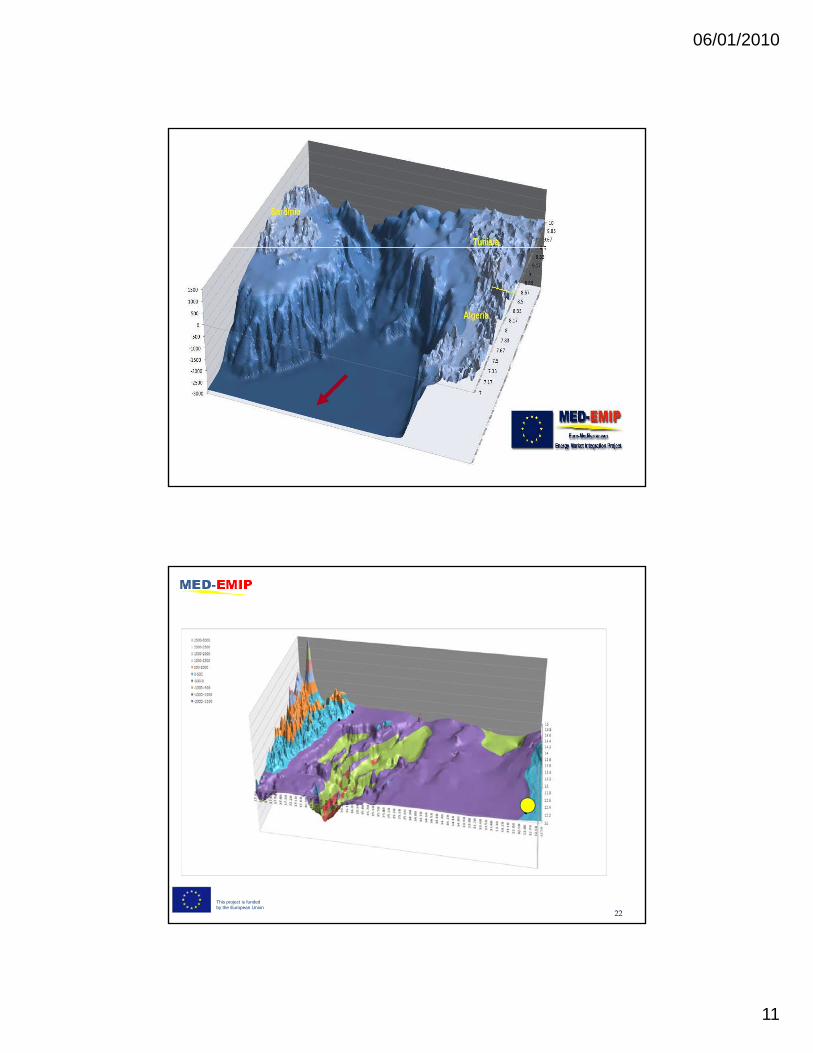
Key-Issue # 2
Is it technically feasible to run submarine power transmission lines across the M dit S ?Mediterranean Sea ?
YES, but best from Algeria, Morocco, Tunisia and Libya! Egypt is uncertain.
…and at what approximate wheeling
This project is funded by the European Union
19
pp gcosts ?
Costs will be around 1- 2 $Cents/kWh
Technically feasible corridorsRed areas are deeper than 2000 m,
This project is funded by the European Union
20
06/01/2010
11
This project is funded by the European Union
21
This project is funded by the European Union
22
06/01/2010
12
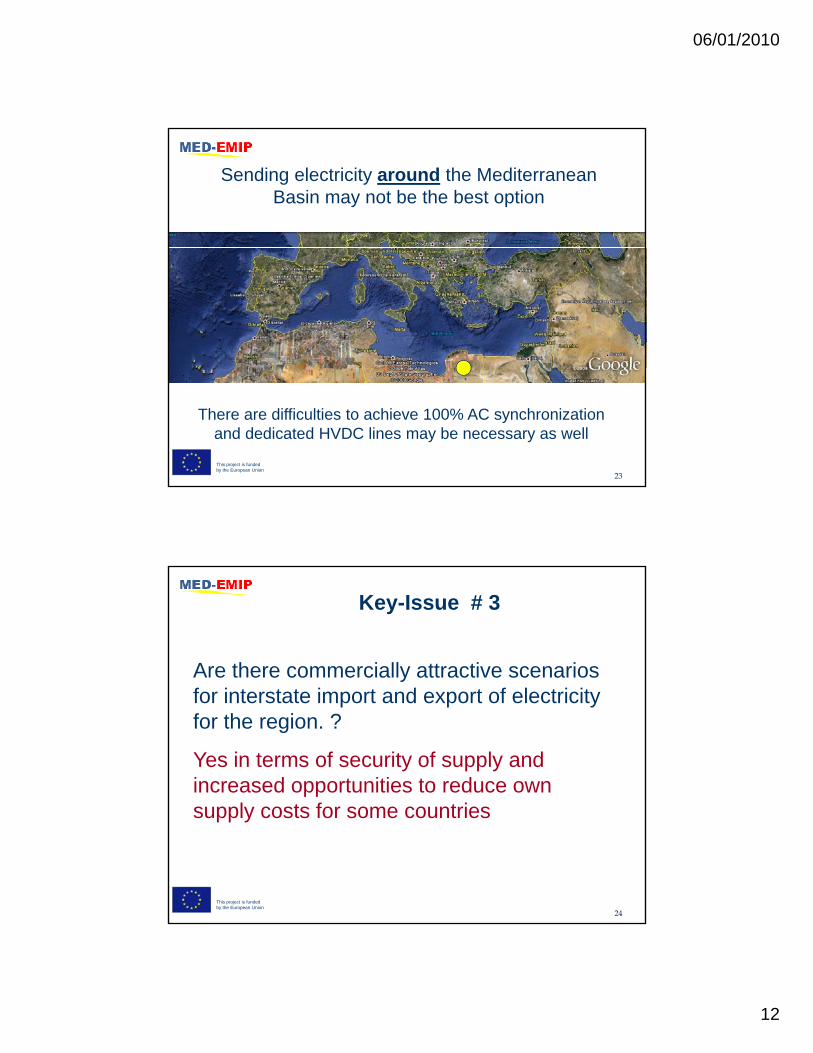
Sending electricity around the Mediterranean Basin may not be the best option
This project is funded by the European Union
23
There are difficulties to achieve 100% AC synchronization and dedicated HVDC lines may be necessary as well
Key-Issue # 3
Are there commercially attractive scenarios for interstate import and export of electricity for the region. ?
Yes in terms of security of supply and increased opportunities to reduce own
l t f t i
This project is funded by the European Union
24
supply costs for some countries
06/01/2010
13
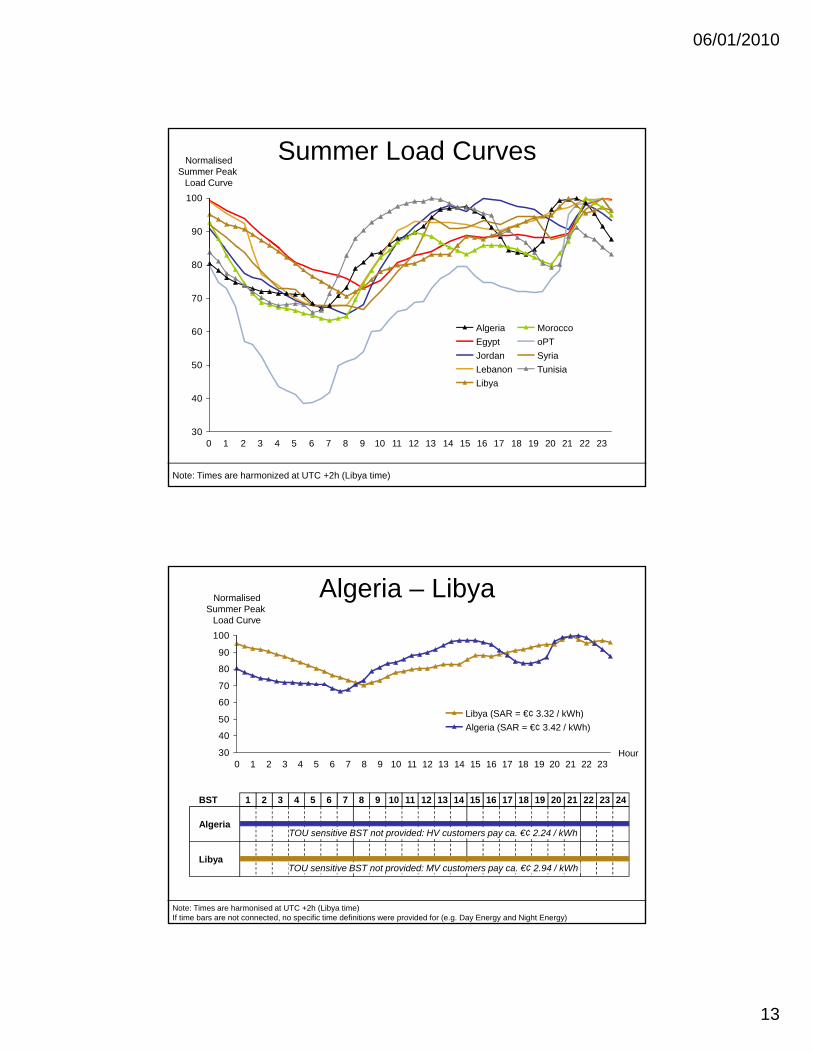
Summer Load Curves
90
100
NormalisedSummer Peak
Load Curve
50
60
70
80
T i iSyriaoPTMorocco
L bJordanEgyptAlgeria
Note: Times are harmonized at UTC +2h (Libya time)
30
40
50
23222120191817161514131211109876543210
TunisiaLibyaLebanon
Algeria – Libya
70
80
90
100
NormalisedSummer Peak
Load Curve
30
40
50
60
70
Hour23222120191817161514131211109876543210
Algeria (SAR = €¢ 3.42 / kWh)Libya (SAR = €¢ 3.32 / kWh)
242322212019181611 12 13 15 171410987654321BST
Note: Times are harmonised at UTC +2h (Libya time)If time bars are not connected, no specific time definitions were provided for (e.g. Day Energy and Night Energy)
TOU sensitive BST not provided: MV customers pay ca. €¢ 2.94 / kWh Libya
AlgeriaTOU sensitive BST not provided: HV customers pay ca. €¢ 2.24 / kWh

06/01/2010
14
The unpleasant news
All countries except for two have moved in the last 4 years into low to very low operational reserve margins because of fast increasing demand and too little capacity addition.
There is little electricity to exchange or to
27
export and it would be also appropriate to invest in demand side management strategies.
28
06/01/2010
15
“Everything should be made as simple as possible, but p p ,
not simpler”(ALBERT EINSTEIN)
THE END
This project is funded by the European Union
29
THE END