Embed Size (px)
Citation preview

© Copyright 2011 National Council on Compensation Insurance, Inc. All Rights Reserved.
Alaska
October 19, 2011
[email protected] 808-524-6239
[email protected] 818-707-8376

© Copyright 2011 National Council on Compensation Insurance, Inc. All Rights Reserved. 2
Workers Compensation Environment
The State of the Economy
State of the Industry
Alaska Workers Compensation System Overview
Claim Frequency
Medical Severity
Prescription Drug Study 2011 Update
Indemnity Severity
Workers Compensation and an Aging Workforce: Is 35 the New ―Older‖ Worker?
The Residual Market in Alaska
NCCI Initiatives
Alaska Workers Compensation State Advisory Forum

© Copyright 2011 National Council on Compensation Insurance, Inc. All Rights Reserved.
Workers Compensation Environment

© Copyright 2011 National Council on Compensation Insurance, Inc. All Rights Reserved. 4
Five workers compensation bills were introduced
• Issues included:
−Presumption of compensability for firefighters
−Mediation and collective bargaining in workers compensation
−Establishing a Workers Compensation Advisory Council
• One workers compensation bill was passed:
−HB 13 establishes parameters for a medical fee schedule
Alaska Legislature—2011

© Copyright 2011 National Council on Compensation Insurance, Inc. All Rights Reserved. 5
• State budget issues continue to dominate
• Regulatory turnover continues
• Some states have enacted system reforms
• Misclassification of employees/independent contractors is an ongoing concern
Countrywide Legislative Environment

© Copyright 2011 National Council on Compensation Insurance, Inc. All Rights Reserved. 6
Federal Insurance Office (FIO) • Within the Treasury Department
• Michael McRaith has been selected as Director of the Federal Insurance Office (FIO)
• Study of state regulation and recommendations are due January 2012
• Office will monitor the insurance industry to gain expertise
• No supervisory or regulatory authority over ―the business of insurance‖
Insurance Advisory Committee • Created by Treasury to advise FIO and Treasury
• 15 members, including insurers, regulators, public advocates, and others
Wall Street Reform and Consumer Protection Act

© Copyright 2011 National Council on Compensation Insurance, Inc. All Rights Reserved. 7
Medicare
• Medicare Secondary Payment (MSP) Act Reporting
• Recent changes in physician fee schedules
Social Security
• The Government Accountability Office (GAO) study on the impact of state workers compensation benefits on the Social Security Disability Insurance (SSDI) program
Reverse offset provisions
Should be completed by the end of 2011
• Administration could require insurance companies to report, so that SSDI could recoup possible overpayments
State Workers Compensation Benefits and Federal Programs

© Copyright 2011 National Council on Compensation Insurance, Inc. All Rights Reserved.
The State of the Economy ―Son, this ain’t a dream no more, it’s the real thing‖
Bob Dylan, Street Legal

© Copyright 2011 National Council on Compensation Insurance, Inc. All Rights Reserved. 9
Severity of Recession: Output The 2007 Recession Was the Most Severe Post-War Contraction
Severity is measured as the maximum cumulative percentage decline from the onset of the recession (peak of economic activity, as defined by the NBER); output is measured as Real GDP, billions of chained 2000 dollars, seasonally adjusted Recessions are identified by the calendar year in which they started Frequency of observation: quarterly; latest data point available for consideration: Q2/2011 Sources: BEA, www.bea.gov; NBER, www.nber.org/cycles.html

© Copyright 2011 National Council on Compensation Insurance, Inc. All Rights Reserved. 10
Severity of Recession: Employment The 2007 Recession Caused Severe Job Losses
Severity is measured as the maximum cumulative percentage decline from the onset of the recession (peak of economic activity, as defined by the NBER); employment is measured as Total Nonfarm, Current Employment Statistics Survey, seasonally adjusted Recessions are identified by the calendar year in which they started Frequency of observation: monthly; latest data point available for consideration: August 2011 Sources: US Bureau of Labor Statistics (BLS), www.bls.gov; NBER, www.nber.org/cycles.html

© Copyright 2011 National Council on Compensation Insurance, Inc. All Rights Reserved. 11
The chart shows the number of states for which the one-month change in the coincidence index of economic activity indicates an expansion; this index summarizes the state of the economy in a single statistic, using nonfarm payroll employment, average hours worked in manufacturing, the unemployment rate, and wage and salary disbursements deflated by the consumer price index (US city average); frequency of observation: monthly; latest observation: August 2011; does not include District of Columbia Source: FRB of Philadelphia, www.philadelphiafed.org/research-and-data/regional-economy/indexes/coincident
Number of States Expanding There Is an Elevated Risk of the Current Soft Patch Giving Way to Recession

© Copyright 2011 National Council on Compensation Insurance, Inc. All Rights Reserved. 12
Unemployment: Official Rate and U-6 The Unemployment Rate Is More Persistent Than in Past Recoveries
U-6 measures the number of the unemployed and the marginally attached for economic reasons as a percentage of the labor force plus marginally attached; official unemployment rate and U-6 are seasonally adjusted; prior to 1994, U-6 unemployment are estimates from Moody's Analytics Frequency of observation: monthly; latest available data point: August 2011 Sources: Moody’s Analytics, www.economy.com; US Bureau of Labor Statistics (BLS), www.bls.gov

© Copyright 2011 National Council on Compensation Insurance, Inc. All Rights Reserved. 13
Employment by Industry Several Sectors Have Added Jobs Since the Onset of the Recovery
Percentage change since the onset of the recovery (trough of economic activity, June 2009) Seasonally adjusted; frequency of observation: monthly; latest observed data point: August 2011 Note that the public school system is part of Government; Educational and Health Services consists primarily of healthcare and social assistance Source: US Bureau of Labor Statistics (BLS): Current Employment Statistics (CES), www.bls.gov/ces

© Copyright 2011 National Council on Compensation Insurance, Inc. All Rights Reserved. 14
Employment by Industry Employment Has Yet to Recover From the Recession in Most Industries
Percentage change since the onset of the recession (peak of economic activity, December 2007) Seasonally adjusted; frequency of observation: monthly; latest observed data point: August 2011 Note that the public school system is part of Government; Educational and Health Services consists primarily of healthcare and social assistance Source: US Bureau of Labor Statistics (BLS): Current Employment Statistics (CES), www.bls.gov/ces

© Copyright 2011 National Council on Compensation Insurance, Inc. All Rights Reserved. 15
Nonfarm Employment, seasonally adjusted Monthly employment shown for the period November 2001 through August 2011 Sources: FRED, www.research.stlouisfed.org/fred2; US Bureau of Labor Statistics (BLS), www.bls.gov
The Industrial Structure Is Changing Recession as a Catalyst for Change in Employment

© Copyright 2011 National Council on Compensation Insurance, Inc. All Rights Reserved. 16
Frequency and Economic Structure The Frequency Decline Is Primarily Due to Workplaces Getting
Safer by Design
Injury and Illnesses Cases per 100 Full-Time Equivalent Workers, Total Recordable Cases, All Private Industry Frequency of observation: annual; latest available data point: 2009; no data points are available for 2001 and 2002 due to changes in industry classification; tick marks indicate beginning of year; data points are mid-year Sources: Bureau of Economic Analysis (BEA), www.bea.gov; US Bureau of Labor Statistics (BLS), www.bls.gov/iif

© Copyright 2011 National Council on Compensation Insurance, Inc. All Rights Reserved. 17
Workplace Injuries and Job Tenure Short-Tenured Employees Are Overrepresented Among the Injured
Workplace injuries represent nonfatal injuries and illnesses involving days away from work; short job tenure means 11 months or less (workplace injuries) or 12 months or less (employment); intermediate length of service means 1 to 5 years and 13 months to 4 years, respectively; long length of service means more than 5 years or 5 years or more, respectively; percentages for workplace injuries do not account for a small ―residual category‖; job tenure information for employment is available bi-annually (for January only); percentages may not add to 100 due to rounding Source: US Bureau of Labor Statistics, www.bls.gov

© Copyright 2011 National Council on Compensation Insurance, Inc. All Rights Reserved. 18
• During recessions, there are many establishments cutting
jobs (job destruction) and only a few adding jobs (job
creation).
• Job creation means adding employees, who are typically inexperienced in the new job. Because employees with short tenure are overrepresented among the injured, faster job creation (as is observed during economic recoveries) causes frequency to drop less than it would drop otherwise, or even causes frequency to rise temporarily.
• During recessions, the impact of slowing job creation more than offsets the opportunistic filing of workers compensation claims following layoffs.
Frequency and the Business Cycle The Business Cycle Behavior of Frequency Is Driven by Job Creation
For an empirical study on the link between frequency and the business cycle see Schmid, Frank A. (2009) Job Flows and Workplace Injuries, www.ncci.com/Documents/WorkplaceInjuries-0709.pdf

© Copyright 2011 National Council on Compensation Insurance, Inc. All Rights Reserved. 19
Labor Force Participation by Age Group
The Labor Force Participation Rate is the share of the population 16 years and older working or seeking work; the population is defined as noninstitutionalized civilian; persons seeking work are defined as those who have actively looked for work in the past four weeks; baby boomers are defined as persons born in the years 1946 through 1964 Frequency of observation: annual; latest available data point: 2010 Source: US Bureau of Labor Statistics (BLS), www.bls.gov

© Copyright 2011 National Council on Compensation Insurance, Inc. All Rights Reserved. 20
Labor Force Participation and Job Tenure Changing Participation Patterns Contribute to a Lengthening of Job Tenure
The Labor Force Participation Rate is the share of the population 16 years and older working or seeking work; the population is defined as noninstitutionalized civilian; persons seeking work are defined as those who have actively looked for work in the past four weeks Median job tenure is available for even calendar years only, and only for January; for some age groups, median job tenure was obtained by taking the mean across two or more age sub-groups; frequency of observation: annual (participation rate) and bi-annual (job tenure), January; latest available data point: 2010 Source: US Bureau of Labor Statistics (BLS), www.bls.gov/cps

© Copyright 2011 National Council on Compensation Insurance, Inc. All Rights Reserved. 21
Median Unemployment Duration Half of the Unemployed Have Been Out of Work for More Than Five Months
The median unemployment duration is based on seasonally adjusted data Frequency of observation: monthly; latest available data point: August 2011 Source: US Bureau of Labor Statistics (BLS), www.bls.gov

© Copyright 2011 National Council on Compensation Insurance, Inc. All Rights Reserved. 22
Alaska Employment Increased During the Past Three Recessions
Percentage change from the onset of the recession (peak of economic activity, as defined by the NBER) to the onset of the recovery (trough of economic activity); Current Employment Statistics Survey, seasonally adjusted Frequency of observation: monthly; range of US states includes District of Columbia Source: US Bureau of Labor Statistics (BLS), www.bls.gov/ces

© Copyright 2011 National Council on Compensation Insurance, Inc. All Rights Reserved. 23
Alaska Employment Growth Is More Robust Than Most of the United States
Nonfarm Employment, seasonally adjusted Frequency of observation: monthly; latest available data point: August 2011; range of US states includes District of Columbia Tick marks indicate beginning of year Source: US Bureau of Labor Statistics (BLS), www.bls.gov

© Copyright 2011 National Council on Compensation Insurance, Inc. All Rights Reserved. 24
Alaska Many Sectors Have Added Jobs Since the Onset of the Recovery
Percentage change since the onset of the recovery (trough of economic activity, June 2009); Current Employment Statistics Survey, seasonally adjusted; frequency of observation: monthly; latest observed data point: August 2011 Source: US Bureau of Labor Statistics (BLS), www.bls.gov/ces

© Copyright 2011 National Council on Compensation Insurance, Inc. All Rights Reserved. 25
Alaska Employment Is Above Pre-Recession Level in Most Industries
Percentage change since the onset of the recession (peak of economic activity, December 2007); Current Employment Statistics Survey, seasonally adjusted; frequency of observation: monthly; latest observed data point: August 2011 Source: US Bureau of Labor Statistics (BLS), www.bls.gov/ces

© Copyright 2011 National Council on Compensation Insurance, Inc. All Rights Reserved. 26
Alaska The Change in Industrial Structure Is Comparably Mild
Nonfarm Employment, seasonally adjusted Monthly employment shown for the period November 2001 through August 2011 Sources: US Bureau of Labor Statistics (BLS), www.bls.gov; Moody’s Economy.com

© Copyright 2011 National Council on Compensation Insurance, Inc. All Rights Reserved. 27
Alaska The Unemployment Rate Is Well Below the National Average
Unemployment rate, seasonally adjusted; range of US states includes District of Columbia Frequency of observation: monthly; latest available data point: August 2011 Source: US Bureau of Labor Statistics (BLS), www.bls.gov

© Copyright 2011 National Council on Compensation Insurance, Inc. All Rights Reserved. 28
Alaska The Private Sector BLS Injury and Illness Rate Is Above Average
Injury and Illnesses Cases per 100 Full-Time Equivalent Workers, Total Recordable Cases, All Private Industry Frequency of observation: annual; latest available data point: 2009 Range of US states includes District of Columbia Source: US Bureau of Labor Statistics (BLS), www.bls.gov/iif

© Copyright 2011 National Council on Compensation Insurance, Inc. All Rights Reserved. 29
• For the nation, economic growth is slow and is likely to remain sub-par for several years into the future
– Job creation is tepid (and is likely to remain so)
– As a consequence, upward pressure on frequency is limited
– Alaska is an exception—although growth slowed during the 2007 recession, the economy showed little signs of contracting
• Inflationary forces are weak, due to significant excess industrial capacity and high unemployment
– Medical care price inflation and wage inflation are likely to be muted
Implications for Workers Compensation

© Copyright 2011 National Council on Compensation Insurance, Inc. All Rights Reserved. 30
• Prior to the recession, economic growth was fueled to a large extent by a continually decreasing personal saving rate
– Private household deleveraging and the ensuing sluggish consumption growth portends a slow pace of economic expansion
• High government debt may depress economic growth
– Households anticipate tax increases and cutbacks in entitlements, which gives them an incentive to increase the saving rate, which places additional drag on consumption growth
– Businesses anticipate tax increases
• The financial crises raised government debt levels in many developed countries
– There is a non-negligible risk of sovereign default (and a potential replay of the 2007–2008 financial crisis)
Challenges for the US Economy

© Copyright 2011 National Council on Compensation Insurance, Inc. All Rights Reserved.
State of the Industry

© Copyright 2011 National Council on Compensation Insurance, Inc. All Rights Reserved. 32
• Calendar year and accident year combined ratios continue to deteriorate
• Decline in lost-time claim frequency stopped in 2010
• More increases proposed in latest NCCI filing cycle
• Impact of healthcare reform and federal involvement in insurance remains uncertain
State of the Workers Compensation Market
―Deteriorating‖

© Copyright 2011 National Council on Compensation Insurance, Inc. All Rights Reserved. 33
Workers Compensation Premium Decline Moderates
Net Written Premium
26.1 29.2
31.1
34.7 37.8 38.6 37.6
33.8
30.3 29.9
32.1
37.7
42.3
46.5 47.8
46.5 44.3
39.3
34.6 33.8
4.1 4.1 4.2 4.5 4.7 5.0 5.3 5.4 5.1 5.2
0
5
10
15
20
0
10
20
30
40
50
60
70
2001 2002 2003 2004 2005 2006 2007 2008 2009 2010p
State Funds ($ B)
Private Carriers ($ B)
Private Non-Farm Wages and Salaries
Premium
$ Billions
Calendar Year p Preliminary Sources: 2001–2009 Private Carriers, Annual Statement data; 2010p, NCCI 2001–2010p State Funds: AZ, CA, CO, HI, ID, KY, LA, MD, MO, MT, NM, OK, OR, RI, TX, UT Annual Statements
Wages
$ Trillions

© Copyright 2011 National Council on Compensation Insurance, Inc. All Rights Reserved. 34
Countrywide Impact of Discounting on Workers Compensation Premium
NCCI States—Private Carriers
-7.1 -7.4 -7.1 -8.5
-10.5
-14.6
-17.7
-22.6 -23.2
-19.2
-14.3
-4.0 -1.7
2.1 0.7
-2.2
-4.7 -7.4 -8.2 -9.2
-25
-20
-15
-10
-5
0
5
10
1991 1992 1993 1994 1995 1996 1997 1998 1999 2000 2001 2002 2003 2004 2005 2006 2007 2008 2009 2010p
Rate/Loss Cost DepartureSchedule RatingDividends
Policy Year p Preliminary Dividend ratios are based on calendar year statistics NCCI benchmark level does not include an underwriting contingency provision Based on data through 12/31/2010 for the states where NCCI provides ratemaking services
Percent

© Copyright 2011 National Council on Compensation Insurance, Inc. All Rights Reserved. 35
Countrywide Average Approved Bureau Rates/Loss Costs
History of Average WC Bureau Rate/Loss Cost Level Changes
* Preliminary Countrywide approved changes in advisory rates, loss costs, and assigned risk rates as filed by the applicable rating organization
12.1
7.4
10.0
2.9
-6.4
-3.2
-6.0
-8.0
-5.4
-2.6
3.5
1.2
4.9
6.6
-6.0 -5.1
-5.7 -6.6
-3.1 -2.0
-1.1
0.2
-10
-5
0
5
10
15
1990 1991 1992 1993 1994 1995 1996 1997 1998 1999 2000 2001 2002 2003 2004 2005 2006 2007 2008 2009 2010 2011*
Percent
Calendar Year
Cumulative 1994–1999
–27.8%
Cumulative
1990–1993
+36.3%
Cumulative 2000–2003
+17.1%
Cumulative 2004–2010
–26.2%

© Copyright 2011 National Council on Compensation Insurance, Inc. All Rights Reserved. 36
Status of NCCI Filing Activity Voluntary Market Filings
30 28
21
7
1 0 0 0
5
8
16 17
0
5
10
15
20
25
30
2008/2009 Season 2009/2010 Season 2010/2011 Season 2011/2012 Season
Nu
mb
er
of
Sta
tes
Less than 0% No Filing 0% and greater

© Copyright 2011 National Council on Compensation Insurance, Inc. All Rights Reserved. 37
-9.8
-8.1
-7.5
-5.8
-5.6
-4.5
-3.9
-3.7
-3.7
-3.0
-2.6
-1.8
-1.7
0.6
1.2
3.6
3.7
4.2
4.4
5.2
6.2
7.4
-9.3
-3.2
-0.3
1.4
1.5
1.6
1.7
2.3
2.7
3.5
3.7
4.5
5.2
6.7
8.9
10.5
-25
-20
-15
-10
-5
0
5
10
15
MS AL WVKY AR MT NE NV GA SC MEMO VT OROK TX NC SDMD UT TN KS IN AK IL RI CO ID LA IA CT AZ HI DC NHNM FL VA
Approved Pending
Current NCCI Voluntary Market Filed Rate/Loss Cost Changes
Excludes Law-Only Filings
Percent

© Copyright 2011 National Council on Compensation Insurance, Inc. All Rights Reserved. 38
New Mexico 1/1/12 +7.4%
Arizona 1/1/12 +5.2%
Hawaii * 1/1/12 +5.2%
Colorado* 1/1/12 +3.7%
Idaho 1/1/11 +3.7%
Alaska* 1/1/12 +2.7%
Utah* 12/1/11 +1.5%
California 1/1/11 0.0%
Oregon 1/1/11 -1.8%
Nevada 3/1/11 -3.9%
Montana 7/1/11 -5.6%
State Voluntary Market Filed Rates/Loss Costs
Western NAIC Zone
* Pending

© Copyright 2011 National Council on Compensation Insurance, Inc. All Rights Reserved. 39
Alaska* 1/1/12 +2.9%
Nevada 3/1/11 -2.2%
Oregon 1/1/11 -1.8%
New Mexico 1/1/12 -5.0%
Residual Market Filings Western NAIC Zone
* Pending

© Copyright 2011 National Council on Compensation Insurance, Inc. All Rights Reserved. 40
-10.9
-4.8
-2.9
-10.3
-2.5
2.7
-13.7
-5.2
-2.9
-9.9
-0.4
2.9
-15
-10
-5
0
5
10
1/1/2008 1/1/2009 5/1/2009 1/1/2010 1/1/2011 1/1/2012Pending
Pe
rce
nt
Effective Date
Voluntary Assigned Risk
Alaska’s Filing Activity
Voluntary Loss Cost and Assigned Risk Rate Changes

© Copyright 2011 National Council on Compensation Insurance, Inc. All Rights Reserved. 41
Alaska January 1, 2012 Filing Average Changes by Industry Group
Manufacturing
+2.8%
Contracting
-0.1%
Office & Clerical
+4.3%
Goods & Services
+4.3%
Miscellaneous
+2.9%
Oil & Gas
-1.8%
OVERALL +2.7%

© Copyright 2011 National Council on Compensation Insurance, Inc. All Rights Reserved. 42
157
216 242
302
337 347 333
285
256 235
7.6 8.0 8.3 8.8 9.3 9.9 10.6 11.3 11.5 11.7
0.0
5.0
10.0
15.0
20.0
25.0
30.0
0
50
100
150
200
250
300
350
400
2001 2002 2003 2004 2005 2006 2007 2008 2009 2010p
Written Premium
Private Non-FarmWages and Salaries
Alaska’s Workers Compensation Premium Volume
Direct Written Premium
Premium
$ Millions
p Preliminary Source: NAIC Annual Statement data Bureau of Economic Analysis
Calendar Year
Wages
$ Billions

© Copyright 2011 National Council on Compensation Insurance, Inc. All Rights Reserved. 43
-26.4
-7.0 -11.0
2.0
11.1 14.0 14.7 9.2 5.1
-0.2
0.3
-0.2
-30
-20
-10
0
10
20
1999 2000 2001 2002 2003 2004 2005 2006 2007 2008 2009 2010
Pe
rce
nt
Policy Year
Rate/Loss Cost Departure Schedule Rating Dividends
The Impact on Premium of Rate/Loss Cost Departures, Schedule Rating, and
Dividends in Alaska
Based on data through 12/31/2010 Dividend ratios are based on calendar year statistics

© Copyright 2011 National Council on Compensation Insurance, Inc. All Rights Reserved. 44
Current Average Voluntary Pure Loss Costs Using Alaska’s
Payroll Distribution
2.11
1.58 1.52
0
1
2
3
AK REG CW
Pu
re L
os
s C
os
t—A
ll C
las
se
s
State
Regional states are AZ, MT, NM, and OR Based on the latest NCCI approved rates and loss costs in the various states

© Copyright 2011 National Council on Compensation Insurance, Inc. All Rights Reserved. 45
1.020
3.100
3.330
0.0
1.0
2.0
3.0
4.0
5.0
6.0
ND IN AR DC VA CO UT MA KS MD OR FL HI AZ WY IA WV DE MO NM MS NE ID RI SD WA LA GA NC MI NV TN WI VT OH MN KY PA NY SC TX AL NH ME NJ CT CA OK IL AK MT
Workers Compensation Premium Rate Ranking
Premium Rate Index per $100 of Payroll
Source: 2010 Oregon Workers’ Compensation Premium Rate Ranking Summary Indexes based on rates in effect on January 1, 2010
AK Ranking
50th (out of 51).

© Copyright 2011 National Council on Compensation Insurance, Inc. All Rights Reserved. 46
0.649
1.088
1.688
0.0
0.2
0.4
0.6
0.8
1.0
1.2
1.4
1.6
1.8
2.0
ND AL WY NY FL KS MS MN NM GA MT AR UT NJ IN MO TN CA SC AZ WV LA NH OR CO OK NC SD NE MD MI ME OH ID AK HI VA KY TX DE WI WA VT CT IA IL PA RI NV MA
Average Statutory Benefit Provisions
(Indemnity only; as of 1/1/2008)
1.0 represents countrywide average cost
per case (indemnity only). All states
indexed to countrywide average.
AK Ranking
35th (out of 50).
All states based
on rates in effect
on 1/1/2008.
Source: Workers Compensation State Rankings, Manufacturing Industry Costs, and Statutory Benefit Provisions, 2008 Ed., Prepared by Actuarial & Technical Solutions, Inc.

© Copyright 2011 National Council on Compensation Insurance, Inc. All Rights Reserved. 47
$85
$342
$457
$0
$100
$200
$300
$400
$500
$600
IN AR AZ UT DC TX FL AL VA KS WI SD NE NH KY MS ID MO NM MI OR TN CO IA MN MD HI GA MA ME LA CA SC NC NJ DE VT RI PA MT NY AK NV CT IL OK
Actual Average Indemnity Benefits per Employee per Year
(Cost spread over all employees whether or not injured)
AK Ranking
42nd (out of 46).
Source: NCCI’s Statistical Plan data at first report for policies effective in 2006 and 2007

© Copyright 2011 National Council on Compensation Insurance, Inc. All Rights Reserved. 48
$109
$679
$1,007
$0
$100
$200
$300
$400
$500
$600
$700
$800
$900
$1,000
$1,100
DC MA RI NY HI MI AR IN NC CO TX MD SC GA VA MO ME IA NM KS OR FL WI ID UT NE LA PA MS AZ TN NV NJ CT OK IL VT KY MN AL NH SD CA DE AK MT
Actual Average Medical Benefits per Employee per Year
(Cost spread over all employees whether or not injured)
AK Ranking
45th (out of 46).
Source: NCCI’s Statistical Plan data at first report for policies effective in 2006 and 2007

© Copyright 2011 National Council on Compensation Insurance, Inc. All Rights Reserved. 49
$226
$1,021
$1,334
$0
$200
$400
$600
$800
$1,000
$1,200
$1,400
$1,600
DC IN AR TX VA MA MI UT AZ FL KS HI MO WI CO NE NM MD ID MS GA IA OR RI NC SC ME KY AL TN NY NH LA SD MN NJ PA VT NV CT IL CA OK DE AK MT
Actual Average Total Benefits per Employee per Year
(Cost spread over all employees whether or not injured)
AK Ranking
45th (out of 46).
Source: NCCI’s Statistical Plan data at first report for policies effective in 2006 and 2007

© Copyright 2011 National Council on Compensation Insurance, Inc. All Rights Reserved. 50
Alaska Policy Year Combined Ratios
95%
103% 108%
117%
144%
155% 151%
130%
106%
100%
84%
70% 73%
81% 85%
60%
80%
100%
120%
140%
160%
1994 1995 1996 1997 1998 1999 2000 2001 2002 2003 2004 2005 2006 2007 2008
Co
mb
ine
d R
ati
o
Policy Year
Source: NCCI financial data

© Copyright 2011 National Council on Compensation Insurance, Inc. All Rights Reserved. 51
Alaska Accident Year Combined Ratios
80%
66%
78%
84% 83%
0%
20%
40%
60%
80%
100%
2005 2006 2007 2008 2009
Co
mb
ine
d R
ati
o
Accident Year Sources: NCCI financial data, NAIC Annual Statement data

© Copyright 2011 National Council on Compensation Insurance, Inc. All Rights Reserved. 52
Countrywide WC Calendar Year Combined Ratio Continues to Deteriorate
Private Carriers
117 123 121
109
102 97 100 101
107
115 118
122
111 110 107 103
93
101 101
110 115
0
20
40
60
80
100
120
140
1990 1991 1992 1993 1994 1995 1996 1997 1998 1999 2000 2001 2002 2003 2004 2005 2006 2007 2008 2009 2010p
Dividends Underwriting Expense LAE Loss
Percent
Calendar Year
p Preliminary Source: 1990–2009, Annual Statement Data; 2010p, NCCI

© Copyright 2011 National Council on Compensation Insurance, Inc. All Rights Reserved. 53
Countrywide Accident Year Combined Ratios
Workers Compensation Calendar Year vs. Ultimate Accident Year Private Carriers
122
111 110 107
103
93
101 101
110
115
125
106
97
88 87 86
98
104
109
114
80
90
100
110
120
130
140
2001 2002 2003 2004 2005 2006 2007 2008 2009 2010p
Calendar Year Accident Year
Percent
p Preliminary Accident Year data is evaluated as of 12/31/2010 and developed to ultimate Sources: Calendar Years 2001–2009, Annual Statement data; Calendar Year 2010p and Accident Years 2001–2010, NCCI analysis based on Annual Statement data Includes dividends to policyholders

© Copyright 2011 National Council on Compensation Insurance, Inc. All Rights Reserved. 54
83
126
0
20
40
60
80
100
120
140
AK TX AR,DC
HI,MO
KS,NM
AL,NE
MS IN,VA
NV ME,SD,VT
SC LA,NC,TN
UT MT,OK
ID,IA
FL KY IL AZ,MD
NH CT,GA
CO OR RI
Results Vary From State to State
Accident Year 2009 Combined Ratios
Data is evaluated as of 12/31/2009

© Copyright 2011 National Council on Compensation Insurance, Inc. All Rights Reserved.
Alaska Workers Compensation
System Overview
© Copyright 2011 National Council on Compensation Insurance, Inc. All Rights Reserved. 56
• Written premium continues to decrease
• Combined ratios have been below 100% recently
• Claim frequency continues to decline
• Indemnity loss ratios have been steadily decreasing, while medical loss ratios show volatility
Alaska Workers Compensation System—
An Overview

© Copyright 2011 National Council on Compensation Insurance, Inc. All Rights Reserved. 57
0.62 0.62 0.56
0.60 0.63 0.69
0.61
0.47 0.45 0.40
0.30 0.38 0.35
0.30 0.28
0.71 0.68 0.68
0.81 0.86
0.92 0.93
0.83 0.90
0.78
0.68
0.84 0.81
0.76 0.73
0.0
0.2
0.4
0.6
0.8
1.0
1995 1996 1997 1998 1999 2000 2001 2002 2003 2004 2005 2006 2007 2008 2009
Lo
ss
Rati
o
Policy Year
Indemnity Medical
Alaska’s Indemnity and Medical Loss Ratios
Based on NCCI’s financial data at current benefit level and developed to ultimate

© Copyright 2011 National Council on Compensation Insurance, Inc. All Rights Reserved.
Claim Frequency

© Copyright 2011 National Council on Compensation Insurance, Inc. All Rights Reserved. 59
-4.2 -4.4
-9.2
0.3
-6.5
-4.5
0.5
-3.9
-2.3
-4.5
-6.9
-4.5 -4.1
-3.7
-6.6
-4.5
-2.1
-4.1
-5.5
3.0
-10
-8
-6
-4
-2
0
2
4
1991 1992 1993 1994 1995 1996 1997 1998 1999 2000 2001 2002 2003 2004 2005 2006 2007 2008 2009 2010p
Percent Change
Accident Year
Countrywide Workers Compensation Lost-Time Claim Frequency
Increased in 2010
Lost-Time Claims
Cumulative Change of –56.4%
(1991–2009)
2010p: Preliminary based on data valued as of 12/31/2010 1991–2009: Based on data through 12/31/2009, developed to ultimate Based on the states where NCCI provides ratemaking services, including state funds; excludes high deductible policies Frequency is the number of lost-time claims per $1M wage-adjusted pure premium at current voluntary level Frequency changes are adjusted for payroll audits

© Copyright 2011 National Council on Compensation Insurance, Inc. All Rights Reserved. 60
Alaska Claim Frequency
30
16
10
15
20
25
30
35
40
1995 1996 1997 1998 1999 2000 2001 2002 2003 2004 2005 2006 2007 2008 2009
Fre
qu
en
cy p
er
Mil
lio
n
of
On
-Le
ve
led
Pre
miu
m
Policy Year
Based on NCCI’s financial data Frequency of lost-time claims

© Copyright 2011 National Council on Compensation Insurance, Inc. All Rights Reserved. 61
18
15
22
19
14
16
18
20
22
24
2005 2006 2007 2008 2009
Fre
qu
en
cy p
er
$1
M
Pu
re P
rem
ium
Accident Year
Alaska Countrywide
Alaska vs. Countrywide Claim Frequency
Frequency of lost-time claims Source: NCCI financial data
© Copyright 2011 National Council on Compensation Insurance, Inc. All Rights Reserved. 62
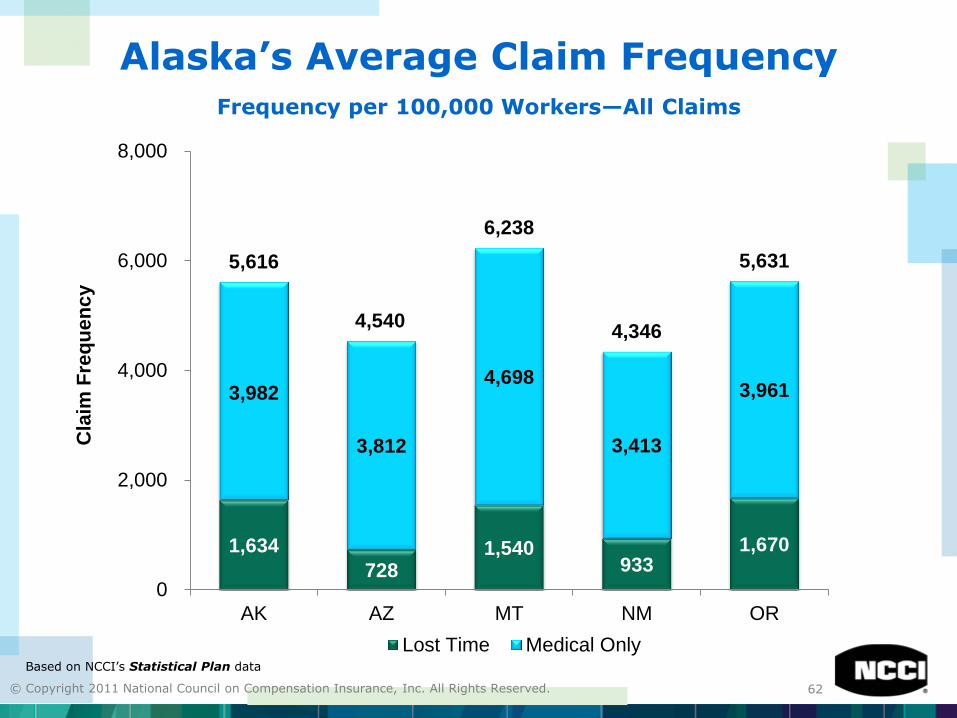
Alaska’s Average Claim Frequency
Frequency per 100,000 Workers—All Claims
1,634
728 1,540
933 1,670
3,982
3,812
4,698
3,413
3,961
5,616
4,540
6,238
4,346
5,631
0
2,000
4,000
6,000
8,000
AK AZ MT NM OR
Cla
im F
req
ue
nc
y
Lost Time Medical OnlyBased on NCCI’s Statistical Plan data

© Copyright 2011 National Council on Compensation Insurance, Inc. All Rights Reserved. 63
Alaska’s Distribution of Claims by Injury Type
70.9%
20.4%
8.6% 0.1%
76.4%
14.6%
8.8% 0.2%
Alaska
Temporary Total Permanent Partial Permanent Total/Fatal Medical Only
76.5%
14.5%
8.9% 0.1%
Regional Average Countrywide
Regional states are AZ, MT, NM, and OR Based on NCCI’s Statistical Plan data

© Copyright 2011 National Council on Compensation Insurance, Inc. All Rights Reserved. 64
Percent of Lost-time Claims Closed
At First Report
74.8%
62.6%
55%
60%
65%
70%
75%
80%
1997 1998 1999 2000 2001 2002 2003 2004 2005 2006 2007 2008 2009
% C
laim
s C
los
ed
Policy Year
Based on NCCI’s financial data

© Copyright 2011 National Council on Compensation Insurance, Inc. All Rights Reserved. 65
04/03 - 03/04 04/04 - 03/05 04/05 - 03/06 04/06 - 03/07 04/07 - 03/08
Permanent Total/Fatal 0.5% 0.4% 0.4% 0.7% 0.5%
Permanent Partial 21.9% 24.4% 27.7% 30.1% 29.5%
Temporary Total 77.7% 75.2% 71.9% 69.2% 70.0%
0%
20%
40%
60%
80%
100%
Pe
rce
nt
Policy Period
Alaska’s Distribution of Lost-Time Claims by Injury Type Over Time
Source: NCCI’s 2011 Annual Statistical Bulletin Based on NCCI’s Statistical Plan data

© Copyright 2011 National Council on Compensation Insurance, Inc. All Rights Reserved.
Medical Severity

© Copyright 2011 National Council on Compensation Insurance, Inc. All Rights Reserved. 67
Medical/Indemnity Cost Distribution Comparison
76%
25%
Indemnity Medical
66%
34%
59%
41%
Regional Average Countrywide
Alaska
Regional states are AZ, MT, NM, and OR

© Copyright 2011 National Council on Compensation Insurance, Inc. All Rights Reserved. 68
$8
.2
$8
.4
$8
.2
$8
.9
$9
.4
$1
0.1
$11
.1
$1
2.0
$1
3.3
$1
4.2
$1
6.2
$1
7.6
$1
8.9
$2
0.0
$2
1.8
$2
3.1
$2
4.5
$2
5.7
$2
7.1
$2
7.7
+6.8% +1.3% -2.1% +9.0% +5.1%
+7.4% +10.1%
+8.3% +10.6%
+7.3%
+13.5% +8.8%
+7.7% +5.4%
+9.1% +6.1%
+6.1% +5.0%
+5.4% +2%
5
10
15
20
25
30
1991 1992 1993 1994 1995 1996 1997 1998 1999 2000 2001 2002 2003 2004 2005 2006 2007 2008 2009 2010p
Accident Year
Accident Year
Annual Change 1991–1993: +1.9%
Annual Change 1994–2001: +8.9%
Annual Change 2002–2009: +6.7%
Medical
Claim Cost
($ '000s)
2010p: Preliminary based on data valued as of 12/31/2010 1991–2009: Based on data through 12/31/2009, developed to ultimate Based on the states where NCCI provides ratemaking services, including state funds Excludes high deductible policies
Countrywide Workers Compensation Medical Claim Cost Trends
Average Medical Cost per Lost-Time Claim

© Copyright 2011 National Council on Compensation Insurance, Inc. All Rights Reserved. 69
Countrywide Workers Compensation Medical Severity Lags Medical Inflation
Average Medical Cost per Lost-Time Claim
5.1
7.4
10.1
8.3
10.6
7.3
13.5
8.8
7.7
5.4
9.1
6.1 6.1
5.0 5.4
2
4.5
3.5
2.8 3.2 3.5
4.1 4.6 4.7
4.0 4.4 4.2 4.0
4.4 3.7
3.2 3.4
0
2
4
6
8
10
12
14
16
1995 1996 1997 1998 1999 2000 2001 2002 2003 2004 2005 2006 2007 2008 2009 2010p
Change in Medical Cost per Lost-Time Claim
Change in Medical CPI
Year
Based on the states where NCCI provides ratemaking services, including state funds; excludes high deductible policies Sources: Medical CPI—All states, Moody’s Economy.com; Accident year medical severity—NCCI states, NCCI
Percent Change

© Copyright 2011 National Council on Compensation Insurance, Inc. All Rights Reserved. 70
Alaska’s Average Medical Severity
16.1
25.2
15.4
4
9
14
19
24
29
34
39
44
49
1995 1996 1997 1998 1999 2000 2001 2002 2003 2004 2005 2006 2007 2008 2009
Me
dic
al A
ve
rag
e
Cla
im S
eve
rity
($
'0
00
s)
Policy Year
Adjusted to Current Wage Level Actual
Based on NCCI’s financial data for lost-time claims at current benefit level and developed to ultimate

© Copyright 2011 National Council on Compensation Insurance, Inc. All Rights Reserved. 71
31
47
23
28
15
20
25
30
35
40
45
50
2006 2007 2008 2009 2010*
Co
st
pe
r C
as
e (
$ '0
00
s)
Accident Year
Alaska Countrywide
Alaska vs. Countrywide Average Medical Claim Severity
* Countrywide figure is preliminary Source: NCCI financial data valued as of 12/31/2010

© Copyright 2011 National Council on Compensation Insurance, Inc. All Rights Reserved. 72
Alaska’s Medical Loss Distribution by Injury Type
10.9%
17.0%
72.1%
0.0%
12.7%
14.9%
57.1%
15.3%
Alaska
Temporary Total Permanent Partial Permanent Total/Fatal Medical Only
11.9%
17.4%
59.1%
11.6%
Regional Average Countrywide
Regional states are AZ, MT, NM, and OR Based on NCCI’s Statistical Plan data

© Copyright 2011 National Council on Compensation Insurance, Inc. All Rights Reserved. 73
04/03 - 03/04 04/04 - 03/05 04/05 - 03/06 04/06 - 03/07 04/07 - 03/08
Medical Only 9.0% 10.9% 8.1% 8.7% 10.9%
Permanent Total/Fatal 16.9% 1.2% 23.2% 17.0% 0.0%
Permanent Partial 53.9% 66.0% 52.4% 59.3% 72.1%
Temporary Total 20.2% 21.9% 16.3% 15.1% 17.0%
0%
20%
40%
60%
80%
100%
Pe
rce
nt
Policy Period
Alaska’s Distribution of Medical Losses by Injury Type Over Time
Source: NCCI’s 2011 Annual Statistical Bulletin Based on NCCI’s Statistical Plan data

© Copyright 2011 National Council on Compensation Insurance, Inc. All Rights Reserved.
Prescription Drug Study 2011 Update

© Copyright 2011 National Council on Compensation Insurance, Inc. All Rights Reserved. 75
• The indicated Rx share of total medical is 19%; this is slightly higher than the estimate given in our 2010 update
• Recent overall cost increases are driven more by utilization increases than by price increases
• Physician dispensing continues to increase in Service Year 2009 in almost every state
• Increased physician dispensing is associated with
increased drug costs per claim
Key Findings

© Copyright 2011 National Council on Compensation Insurance, Inc. All Rights Reserved. 76
The Indicated Rx Share of Total Medical Is Slightly Elevated From the Last Study
18% 19% 19%
14.1% 14.2% 14.2%
18% 18%
13% 13%
10%
15%
20%
1999 2000 2001 2002 2003 2004 2005 2006 2007 2008 2009
Es
tim
ate
d R
x S
ha
re o
f
To
tal M
ed
ica
l a
t U
ltim
ate
Injury Year
Best Estimate(Current Study)
Not Trended(Current Study)
Best Estimate(Prior Study)
Not Trended(Prior Study)
Source: Derived from sample data provided by carriers Aggregation of states where NCCI provides ratemaking services, excludes WV, plus CA, DE, MA, MI, MN, NJ, NY, PA, and WI Prior Study: Workers Compensation Prescription Drug Study—2008 Update, available at ncci.com

© Copyright 2011 National Council on Compensation Insurance, Inc. All Rights Reserved. 77
Top Drugs for Service Year 2009
Rank Based on Total Dollars Paid in Workers Compensation
Paid Share
Service Year
2009 Drug Name Service Year
2009 2008 2007
6.1% OXYCONTIN® 1 3 8
5.2% LIDODERM® 2 2 2
5.1% HYDROCODONE-ACETAMINOPHEN 3 1 1
4.4% LYRICA® 4 4 4
3.7% CELEBREX® 5 5 3
3.4% GABAPENTIN 6 6 5
2.8% SKELAXIN® 7 7 7
2.7% CYMBALTA® 8 8 13
2.3% MELOXICAM 9 11 15
2.3% CYCLOBENZAPRINE HCL 10 9 9
2.1% TRAMADOL HCL 11 10 10
2.0% OMEPRAZOLE 12 15 18
1.8% FENTANYL 13 12 14
1.5% FLECTOR® 14 28 >1000
1.4% OXYCODONE HCL 15 13 6
Source: Derived from sample data provided by carriers Aggregation of states where NCCI provides ratemaking services, excludes WV, plus CA, DE, MA, MI, MN, NJ, NY, PA, and WI

© Copyright 2011 National Council on Compensation Insurance, Inc. All Rights Reserved. 78
Utilization Continues to Be a Major Cost Driver
-10%
-5%
0%
5%
10%
15%
20%
25%
30%
2000-2001
2001-2002
2002-2003
2003-2004
2004-2005
2005-2006
2006-2007
2007-2008
2008-2009p
Pe
rce
nta
ge
Ch
an
ge
Service Year
Price Utilization Total Cost
Source: Derived from sample data provided by carriers Aggregation of states where NCCI provides ratemaking services, excludes WV, plus CA, DE, MA, MI, MN, NJ, NY, PA, and WI 2009p = Preliminary

© Copyright 2011 National Council on Compensation Insurance, Inc. All Rights Reserved.
Physician-Dispensed and Repackaged Drugs in
Workers Compensation

© Copyright 2011 National Council on Compensation Insurance, Inc. All Rights Reserved. 80
Physician Dispensing Increased in Service Year 2009
16% 17%
18% 19% 19%
23%
28%
9% 10% 10% 10%
12%
18%
23%
0%
5%
10%
15%
20%
25%
30%
2003 2004 2005 2006 2007 2008 2009
Ph
ys
icia
n-D
isp
en
se
d R
x
Do
lla
r S
ha
re o
f A
ll R
x
Service Year
Including California With California Removed
Source: Derived from sample data provided by carriers 1st through 10th relative service year Average cost per claim with physician-dispensed drugs Aggregation of states where NCCI provides ratemaking services, excludes WV, plus CA, DE, MA, MI, MN, NJ, NY, PA, and WI

© Copyright 2011 National Council on Compensation Insurance, Inc. All Rights Reserved. 81
Many States Have Substantial Physician Dispensing
> 15.5%
≤ 15.5% AND ≥ 10.5%
< 10.5%
OR
MT
KS
NE
OK
LA
MS
KY
TN
FL
WI
IN
GA
MN
TX
CO
ID
UT
AR
AL
SC
VA
NC
AZ
IL
MI
IA
MO
CA
NH
MA
CT
MD
PA
DE
NM
NV
AK
VT
HI
NJ
NY
ME
RI
SD
Source: Derived from sample data provided by carriers 1st through 10th relative service year Statistics are based on at least $150,000 paid Rx for each state service year combination
Physician-Dispensed Rx Dollar Share of All Rx Service Year 2009

© Copyright 2011 National Council on Compensation Insurance, Inc. All Rights Reserved. 82
Physician Dispensing on the Rise in Most States
0%
10%
20%
30%
40%
50%
FL CA GA MD PA IL DE AZ CO MI SC TN AL IN IA LA AK CT MO HI KS NM MS VT NY OK VA DC NJ NC
Ph
ys
icia
n-D
isp
en
se
d R
x
Do
lla
r S
hare
of
All
Rx
State
SY 2007 SY 2008 SY 2009
States With Physician Dispensing in 2009 ≥ 15.5%
Source: Derived from sample data provided by carriers 1st through 10th relative service year Statistics are based on at least $150,000 paid Rx for each state service year combination
ALASKA

© Copyright 2011 National Council on Compensation Insurance, Inc. All Rights Reserved. 83
• This update shows that physician dispensing continued to increase in 2009. The update also points toward new evidence that physician dispensing increases drug costs on claims. The update also looks into the drivers of state differences in per-claim Rx costs.
• NCCI will continue to look for other drivers of per-
claim Rx costs and will continue to monitor and report on prescription drugs and other important issues that affect the workers compensation industry.
Prescription Drug Study Summary

© Copyright 2011 National Council on Compensation Insurance, Inc. All Rights Reserved.
Indemnity Severity

© Copyright 2011 National Council on Compensation Insurance, Inc. All Rights Reserved. 85
Countrywide Workers Compensation Indemnity Claim Costs Decline in 2010
Average Indemnity Cost per Lost-Time Claim
$1
0.0
$9
.7
$9
.5
$9
.9
$1
0.1
$1
0.7
$11
.5
$1
2.5
$1
3.8
$1
5.2
$1
6.6
$1
7.1
$1
7.9
$1
8.2
$1
8.8
$1
9.9
$2
1.1
$2
2.8
$2
3.0
$2
2.3
+1.0% -3.1% -2.8% +4.9% +1.7%
+5.9% +7.7%
+9.0%
+10.1%
+10.1% +9.2%
+3.1% +4.6% +1.6%
+3.4% +5.6%
+5.9%
+8.2% +0.8% -3%
5
10
15
20
25
1991 1992 1993 1994 1995 1996 1997 1998 1999 2000 2001 2002 2003 2004 2005 2006 2007 2008 2009 2010p
Accident Year
Accident Year 2010p: Preliminary based on data valued as of 12/31/2010 1991–2009: Based on data through 12/31/2009, developed to ultimate Based on the states where NCCI provides ratemaking services, including state funds Excludes high deductible policies
Annual Change 1991–1993: –1.7%
Annual Change 1994–2001: +7.3%
Annual Change 2002–2009: +4.1%
Indemnity
Claim Cost
($ '000s)

© Copyright 2011 National Council on Compensation Insurance, Inc. All Rights Reserved. 86
Countrywide WC Indemnity Severity Declines in Spite of Wage Recovery
Average Indemnity Cost per Lost-Time Claim
1.7
5.9
7.7
9.0
10.1 10.1
9.2
3.1
4.6
1.6
3.4
5.6 5.9
8.2
0.8
-3
3.6 4.2
5.2 5.6
4.7
6.3
2.3
1.1
2.7
4.3
3.5
4.7 4.6
2.3
-0.6
2
-4
-2
0
2
4
6
8
10
12
1995 1996 1997 1998 1999 2000 2001 2002 2003 2004 2005 2006 2007 2008 2009 2010p
Change in Indemnity Cost per Lost-Time Claim
Change in Average Weekly Wage
Year Based on the states where NCCI provides ratemaking services, including state funds; excludes high deductible policies Sources: Average Weekly Wage 1995–2009: Quarterly Census of Employment and Wages, Moody’s Economy.com; 2010p, NCCI Accident year indemnity severity—NCCI states, NCCI
Percent Change

© Copyright 2011 National Council on Compensation Insurance, Inc. All Rights Reserved. 87
Alaska’s Average Indemnity Severity
20.7
17.7
13.5
4
9
14
19
24
29
1995 1996 1997 1998 1999 2000 2001 2002 2003 2004 2005 2006 2007 2008 2009
Ind
em
nit
y A
ve
rag
e
Cla
im S
eve
rity
($
'0
00
s)
Policy Year
Adjusted to Current Wage Level Actual
Based on NCCI’s financial data for lost-time claims at current benefit level and developed to ultimate

© Copyright 2011 National Council on Compensation Insurance, Inc. All Rights Reserved. 88
15 18
20 22
0
5
10
15
20
25
30
35
2006 2007 2008 2009 2010*
Co
st
pe
r C
as
e (
$ '0
00
s)
Accident Year
Alaska Countrywide
Alaska vs. Countrywide Average Indemnity Claim Severity
* Countrywide figure is preliminary Source: NCCI financial data

© Copyright 2011 National Council on Compensation Insurance, Inc. All Rights Reserved. 89
Alaska’s Indemnity Loss Distribution by Injury Type
Temporary Total Permanent Partial Permanent Total/Fatal
14.0%
70.4%
15.6%
12.3%
73.6%
14.1% 13.9%
78.2%
7.9%
Regional Average Countrywide
Alaska
Regional states are AZ, MT, NM, and OR Based on NCCI’s Statistical Plan data

© Copyright 2011 National Council on Compensation Insurance, Inc. All Rights Reserved. 90
04/03 - 03/04 04/04 - 03/05 04/05 - 03/06 04/06 - 03/07 04/07 - 03/08
Permanent Total/Fatal 9.9% 7.6% 8.0% 17.4% 15.6%
Permanent Partial 67.5% 71.9% 74.7% 68.1% 70.4%
Temporary Total 22.6% 20.5% 17.4% 14.5% 14.0%
0%
20%
40%
60%
80%
100%
Pe
rce
nt
Policy Period
Alaska’s Distribution of Indemnity Losses by Injury Type Over Time
Source: NCCI’s 2011 Annual Statistical Bulletin Based on NCCI’s Statistical Plan data

© Copyright 2011 National Council on Compensation Insurance, Inc. All Rights Reserved.
Workers Compensation and an Aging Workforce:
Is 35 the New ―Older‖ Worker?

© Copyright 2011 National Council on Compensation Insurance, Inc. All Rights Reserved. 92
Workers Compensation and an Aging Workforce
• An Aging Workforce
• Frequency—Steady Declines
• Medical and Indemnity Severity—Steady Increases
– Types of Injuries
– Wage Rates
• Loss Costs—Flat to Up Moderately
– Remarkably Similar for Workers 35 and Older
Overview

© Copyright 2011 National Council on Compensation Insurance, Inc. All Rights Reserved. 93
Alaska Population Distribution
Source: US Census Bureau
0%
5%
10%
15%
20%
25%
30%
<15 15-19 20-24 25-34 35-44 45-54 55-64 65-74 75-84 85<
Pe
rce
nta
ge
of
To
tal P
op
ula
tio
n
1990 Census 2000 Census 2010 Census

© Copyright 2011 National Council on Compensation Insurance, Inc. All Rights Reserved. 94
0%
5%
10%
15%
20%
25%
30%
2000 2001 2002 2003 2004 2005 2006 2007 2008 2009 2010
Calendar Year
15–19 20–24 25–34 35–44 45–54 55–64 65+
Workers 45 and Older Account for an Increasing Share of the US Workforce
Derived Labor Force Share
Source: Based on labor force participation rates from the Bureau of Labor Statistics and forecasts of population from Moody’s Economy.com

© Copyright 2011 National Council on Compensation Insurance, Inc. All Rights Reserved. 95
0%
5%
10%
15%
20%
25%
30%
2000 2001 2002 2003 2004 2005 2006 2007 2008 2009 2010
Calendar Year
15–19 20–24 25–34 35–44 45–54 55–64 65+
And Younger Workers Make Up a Declining Share of the US Workforce
Derived Labor Force Share
Source: Based on labor force participation rates from the Bureau of Labor Statistics and forecasts of population from Moody’s Economy.com

© Copyright 2011 National Council on Compensation Insurance, Inc. All Rights Reserved. 96
50
100
150
200
250
300
1994 1995 1996 1997 1998 1999 2000 2001 2002 2003 2004 2005 2006 2007 2008 2009
Inci
de
nce
Rat
e
Calendar Year
16+ 16–19 20–24 25–34 35–44 45–54 55–64 65+
Frequency Has Fallen Consistently Across Prime Age Groups
Derived Injury and Illness Incidence Rates Involving Days Away From Work per 10,000 FTE Workers
FTE = Full-Time Equivalent Source: Derived by NCCI using data from the Bureau of Labor Statistics

© Copyright 2011 National Council on Compensation Insurance, Inc. All Rights Reserved. 97
50
75
100
125
150
2006 2007 2008 2009
Inci
de
nce
Rat
e
Calendar Year
16+ 16–19 20–24 25–34 35–44 45–54 55–64 65+
Differences in Frequency Now Modest Across Prime Age Groups
Injury and Illness Incidence Rates Involving Days Away From Work per 10,000 FTE Workers
FTE = Full-Time Equivalent Source: Bureau of Labor Statistics

© Copyright 2011 National Council on Compensation Insurance, Inc. All Rights Reserved. 98
$0
$5,000
$10,000
$15,000
$20,000
1995 1996 1997 1998 1999 2000 2001 2002 2003 2004 2005 2006 2007 2008
Accident Year
16+ 16–19 20–24 25–34 35–44 45–54 55–64 65+
Indemnity Severity Increases by Age Have Continued
Average Paid Plus Case Indemnity Severities Reported at 18 Months
Source: NCCI’s Detailed Claim Information data

© Copyright 2011 National Council on Compensation Insurance, Inc. All Rights Reserved. 99
$0
$5,000
$10,000
$15,000
$20,000
1995 1996 1997 1998 1999 2000 2001 2002 2003 2004 2005 2006 2007 2008
Accident Year
16+ 16–19 20–24 25–34 35–44 45–54 55–64 65+
Indemnity Severity Increases by Age Have Continued
Average Paid Plus Case Indemnity Severities Reported at 18 Months
Source: NCCI’s Detailed Claim Information data

© Copyright 2011 National Council on Compensation Insurance, Inc. All Rights Reserved. 100
$0
$5,000
$10,000
$15,000
$20,000
1995 1996 1997 1998 1999 2000 2001 2002 2003 2004 2005 2006 2007 2008
Accident Year
16+ 16–19 20–24 25–34 35–44 45–54 55–64 65+
Medical Severity Increases by Age Have Continued
Average Paid Plus Case Medical Severities on Lost-Time Claims Reported at 18 Months
Source: NCCI’s Detailed Claim Information data

© Copyright 2011 National Council on Compensation Insurance, Inc. All Rights Reserved. 101
$0
$5,000
$10,000
$15,000
$20,000
1995 1996 1997 1998 1999 2000 2001 2002 2003 2004 2005 2006 2007 2008
Accident Year
16+ 16–19 20–24 25–34 35–44 45–54 55–64 65+
Medical Severity Increases by Age Have Continued
Average Paid Plus Case Medical Severities on Lost-Time Claims Reported at 18 Months
Source: NCCI’s Detailed Claim Information data

© Copyright 2011 National Council on Compensation Insurance, Inc. All Rights Reserved. 102
Differences in the Mix of Diagnoses Top 10 Claim Diagnoses for Lost-Time Claims With Temporary Payments
That Closed Within 24 Months of Date of Injury, Accident Years 1996–2007, NCCI States
Ages 20–34 Ages 45–64
Diagnosis and Indemnity Severity Index Diagnosis and Indemnity Severity Index
1 Sprain Lumbar Region 0.53 Sprain Rotator Cuff 2.04
2 Lower Leg Injury, not otherwise specified 0.95 Unilateral Inguinal Hernia 0.67
3 Sprain of Ankle, not otherwise specified 0.46 Carpal Tunnel Syndrome 1.06
4 Unilateral Inguinal Hernia 0.84 Tear Medial Cartilage/Meniscus of Knee 1.28
5 Cervicalgia 1.45 Lower Leg Injury, not otherwise specified 0.88
6 Lumbar Disc Displacement 2.43 Sprain Lumbar Region 0.42
7 Carpal Tunnel Syndrome 1.55 Cervicalgia 1.34
8 Lumbago 0.73 Rotator Cuff Syndrome, unspecified 1.68
9 Sprain Lumbosacral 0.47 Lumbar Disc Displacement 1.80
10 Sprain of Neck 0.68 Lumbosacral Neuritis, not otherwise
specified 1.54
The severity index is the ratio of paid temporary indemnity severity for that diagnosis to average paid temporary indemnity severity for all claims for the relevant experience period Source: NCCI

© Copyright 2011 National Council on Compensation Insurance, Inc. All Rights Reserved. 103
0
10
20
30
40
50
60
70
80
1996 1997 1998 1999 2000 2001 2002 2003 2004 2005 2006 2007
Du
rati
on
in D
ays
Accident Year
20–34 45–64
Average Temporary Duration 1996–2007 =
57 for the 20–34 age cohort, and
61 for the 45–64 age cohort
A 7% difference (after controlling for mix)
Average Duration for Temporary Payments After Controlling for the
Difference in Injury Mix
Lost-Time Claims With Temporary Payments Closed Within 24 Months of Date of Injury, NCCI States
Source: NCCI

© Copyright 2011 National Council on Compensation Insurance, Inc. All Rights Reserved. 104
0
10
20
30
40
50
60
70
1996 1997 1998 1999 2000 2001 2002 2003 2004 2005 2006 2007
Nu
mb
er
of
Tre
atm
en
ts p
er
Cla
im
Accident Year
20–34 45–64
Average Treatments per Claim 1996–2007 =
48 for the 20–34 age cohort, and
54 for the 45–64 age cohort
A 14% difference (after controlling for mix)
Average Number of Treatments per Claim After Controlling for the Difference in Injury Mix
Lost-Time Claims With Temporary Payments Closed Within 24 Months of Date of Injury, NCCI States
Source: NCCI

© Copyright 2011 National Council on Compensation Insurance, Inc. All Rights Reserved. 105
$0
$100
$200
$300
$400
$500
$600
$700
$800
1996 1997 1998 1999 2000 2001 2002 2003 2004 2005 2006 2007
Accident Year
20–34 45–64
Average Weekly Wages 1996–2007 =
$485 for the 20–34 age cohort, and
$633 for the 45–64 age cohort
A 31% difference (not controlling for mix)
Average Weekly Wages as Reported
Lost-Time Claims With Temporary Payments Closed Within 24 Months of Date of Injury, NCCI States
Source: NCCI

© Copyright 2011 National Council on Compensation Insurance, Inc. All Rights Reserved. 106
$0
$10
$20
$30
$40
$50
$60
$70
1996 1997 1998 1999 2000 2001 2002 2003 2004 2005 2006 2007
Accident Year
20–34 45–64
Average Temporary Benefits Paid per Day 1996–2007 =
$43 for the 20–34 age cohort, and
$52 for the 45–64 age cohort
A 21% difference (after controlling for mix)
Average Temporary Benefits Paid per Day After Controlling for Mix
Lost-Time Claims With Temporary Payments Closed Within 24 Months of Date of Injury, NCCI States
Source: NCCI

© Copyright 2011 National Council on Compensation Insurance, Inc. All Rights Reserved. 107
$0
$20
$40
$60
$80
$100
$120
$140
$160
$180
1996 1997 1998 1999 2000 2001 2002 2003 2004 2005 2006 2007
Accident Year
20–34 45–64
Average Price per Treatment 1996–2007 =
$117 for the 20–34 age cohort, and
$126 for the 45–64 age cohort
An 8% difference (after controlling for mix)
Average Price per Treatment After Controlling for Mix
Lost-Time Claims With Temporary Payments Closed Within 24 Months of Date of Injury, NCCI States
Source: NCCI

© Copyright 2011 National Council on Compensation Insurance, Inc. All Rights Reserved. 108
Contribution of Differences in Mix, Quantity, and Price to Differences in
Indemnity and Medical Severity by Age Modest Impact
Paid Temporary Indemnity Severities and Paid Medical Severities on Claims With Temporary Payments
Lost-Time Claims Closed Within 24 Months of Date of Injury, Accident Years 1996–2007, NCCI States
Indemnity
45–64 vs. 20–34
Medical
45–64 vs. 20–34
Difference Share Difference Share
Total 56% 100% 51% 100%
Due to Diagnosis Mix 26% 46% 28% 55%
Due to Number of Treatments or
Duration 8% 14% 15% 29%
Due to Price and Other Factors 22% 39% 8% 16%
Source: NCCI
© Copyright 2011 National Council on Compensation Insurance, Inc. All Rights Reserved. 109
$0
$500,000
$1,000,000
$1,500,000
$2,000,000
$2,500,000
$3,000,000
$3,500,000
$4,000,000
1995 1996 1997 1998 1999 2000 2001 2002 2003 2004 2005 2006 2007 2008
Calendar/Accident Year
16+ 16–19 20–24 25–34 35–44 45–54 55–64 65+
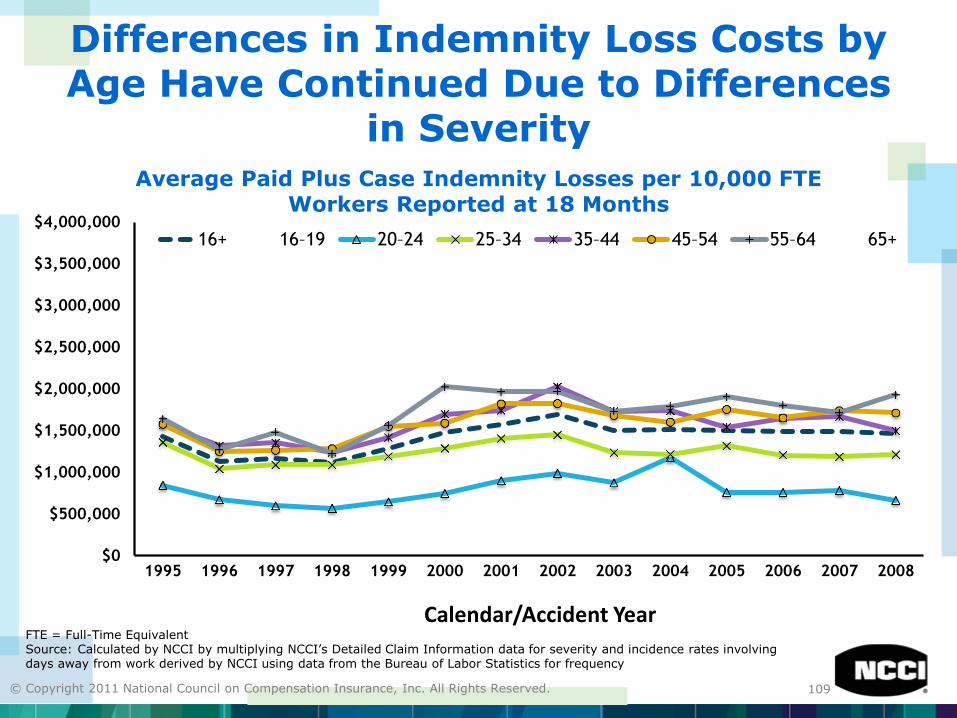
Differences in Indemnity Loss Costs by Age Have Continued Due to Differences
in Severity
Average Paid Plus Case Indemnity Losses per 10,000 FTE Workers Reported at 18 Months
FTE = Full-Time Equivalent Source: Calculated by NCCI by multiplying NCCI’s Detailed Claim Information data for severity and incidence rates involving days away from work derived by NCCI using data from the Bureau of Labor Statistics for frequency

© Copyright 2011 National Council on Compensation Insurance, Inc. All Rights Reserved. 110
$0
$500,000
$1,000,000
$1,500,000
$2,000,000
$2,500,000
$3,000,000
$3,500,000
$4,000,000
1995 1996 1997 1998 1999 2000 2001 2002 2003 2004 2005 2006 2007 2008
Calendar/Accident Year
16+ 16–19 20–24 25–34 35–44 45–54 55–64 65+
Differences in Medical Loss Costs by Age Have Continued Due to
Differences in Severity
Average Paid Plus Case Medical Losses per 10,000 FTE Workers Reported at 18 Months
FTE = Full-Time Equivalent Source: Calculated by NCCI by multiplying NCCI’s Detailed Claim Information data for severity and incidence rates involving days away from work derived by NCCI using data from the Bureau of Labor Statistics for frequency

© Copyright 2011 National Council on Compensation Insurance, Inc. All Rights Reserved. 111
$0
$500,000
$1,000,000
$1,500,000
$2,000,000
$2,500,000
$3,000,000
$3,500,000
$4,000,000
1995 1996 1997 1998 1999 2000 2001 2002 2003 2004 2005 2006 2007 2008
Calendar/Accident Year
16+ 16–19 20–24 25–34 35–44 45–54 55–64 65+
Differences in Total Loss Costs by Age Have Continued Due to
Differences in Severity
Average Paid Plus Case Total Losses per 10,000 FTE Workers Reported at 18 Months
FTE = Full-Time Equivalent Source: Calculated by NCCI by multiplying NCCI’s Detailed Claim Information data for severity and incidence rates involving days away from work derived by NCCI using data from the Bureau of Labor Statistics for frequency

© Copyright 2011 National Council on Compensation Insurance, Inc. All Rights Reserved. 112
$0
$500,000
$1,000,000
$1,500,000
$2,000,000
$2,500,000
$3,000,000
$3,500,000
$4,000,000
1995 1996 1997 1998 1999 2000 2001 2002 2003 2004 2005 2006 2007 2008
Calendar/Accident Year
16+ 16–19 20–24 25–34 35–44 45–54 55–64 65+
Differences in Total Loss Costs by Age Have Continued Due to
Differences in Severity
Average Paid Plus Case Total Losses per 10,000 FTE Workers Reported at 18 Months
FTE = Full-Time Equivalent Source: Calculated by NCCI by multiplying NCCI’s Detailed Claim Information data for severity and incidence rates involving days away from work derived by NCCI using data from the Bureau of Labor Statistics for frequency

© Copyright 2011 National Council on Compensation Insurance, Inc. All Rights Reserved. 113
• Workers Aged 35 to 64 Appear to Have Similar Costs per Worker
• Workers Aged 20 to 24 Appear to Have Markedly Lower Severities and Loss Costs
• Workers Aged 25 to 34 Fall in the Middle
• Differences Primarily Reflect Differences in Severities
– Claims of Older Workers 50% More Costly
– Differences in Leading Types of Injuries a Major Factor
o Rotator Cuff, Knee vs. Back and Ankle Sprains
• Indemnity Severity—Higher Wages a Key Factor
• Medical Severity—More Treatments per Claim a Material Factor
Summary

© Copyright 2011 National Council on Compensation Insurance, Inc. All Rights Reserved.
The Residual Market in Alaska

© Copyright 2011 National Council on Compensation Insurance, Inc. All Rights Reserved. 115
68.8
56.4
44.9 49.8
$199M
$153M $127M $136M
0
100
200
300
400
500
2007 2008 2009 2010
0
20
40
60
80
100
Calendar Year
Total New Applications Total New Premium
Total Residual Market New Applications and Premium Assigned in All Plan States
# Thousands $ Millions
$ Premium (Millions) # Applications (‘000s)

© Copyright 2011 National Council on Compensation Insurance, Inc. All Rights Reserved. 116
1,998 1,869 1,687 1,774
$8M $7M
$5M $5M
0
5
10
15
2007 2008 2009 2010
0
500
1,000
1,500
2,000
2,500
3,000
Calendar Year
Total New Applications Total New Premium
Total Residual Market New Applications and
Premium Assigned in Alaska
# Count $ Millions
$ Premium (Millions) # Applications

© Copyright 2011 National Council on Compensation Insurance, Inc. All Rights Reserved. 117
Alaska’s Total Residual Market Plan Policy Count
8,357
8,178
8,024
7,866
7,500
8,000
8,500
2007 2008 2009 2010
Nu
mb
er
of
Po
lic
ies
Policy Year

© Copyright 2011 National Council on Compensation Insurance, Inc. All Rights Reserved. 118
Alaska’s Total Residual Market Plan Premium Volume
$39.0
$32.1
$26.4
$23.6
$0
$5
$10
$15
$20
$25
$30
$35
$40
$45
2007 2008 2009 2010
Pre
miu
m (
in M
illi
on
s)
Policy Year

© Copyright 2011 National Council on Compensation Insurance, Inc. All Rights Reserved. 119
Alaska Residual Market Plan 2009 vs. 2010 Total
Policy Size Comparison
Premium Size
2009 2010
# of Policies Premium # of Policies Premium
$0–$2,499 5,741 $5,200,352 5,717 $5,136,025
$2,500–$4,999 1,169 $4,099,513 1,127 $3,922,425
$5,000–$9,999 593 $4,166,854 557 $3,892,024
$10,000–$19,999 318 $4,378,907 290 $3,962,139
$20,000–$49,999 162 $4,715,822 149 $4,485,611
$50,000–$99,999 34 $2,341,684 21 $1,408,031
$100,000–$199,999 4 $473,543 4 $533,723
$200,000 and greater 3 $1,057,157 1 $212,626
TOTAL 8,024 $26,433,832 7,866 $23,552,604

© Copyright 2011 National Council on Compensation Insurance, Inc. All Rights Reserved. 120
Comparison of the Estimated Market Share for Alaska’s
Residual Market by Total Policy Count and Written Premium
Market share as a percentage of residual market total written premium/policies in force
2010 numbers are preliminary
13.8% 12.0%
55.7% 53.2%
0%
10%
20%
30%
40%
50%
60%
2007 2008 2009 2010
Pe
rce
nta
ge
of
Ma
rke
t
Year
Premium Policies

© Copyright 2011 National Council on Compensation Insurance, Inc. All Rights Reserved. 121
National
5645—Carpentry (5.3%)
5551—Roofing (3.6%)
7228—Trucking, Local (3.0%)
8835—Nursing, Home Health (2.5%)
5474—Painting (2.1%)
Alaska’s Top Five Class Codes Based on Residual Market
Plan Total Written Premium
Alaska
5645—Carpentry (5.1%)
9094—Outdoor Guide Service (5.0%)
8832—Physician (4.9%)
8017—Retail Store NOC (4.0%)
8824—Retirement Living Centers (2.9%)

© Copyright 2011 National Council on Compensation Insurance, Inc. All Rights Reserved. 122
• Elimination of Premium Discounts
• Surcharge
• Take-Out Credit (TOC) Program
• Safe Workplace Incentive Program
• Voluntary Coverage Assistance Program (VCAP® Service)
Alaska Assigned Risk Programs

© Copyright 2011 National Council on Compensation Insurance, Inc. All Rights Reserved.
NCCI Initiatives
123

© Copyright 2011 National Council on Compensation Insurance, Inc. All Rights Reserved. 124
• Increase the split point
• Index the split point so future increases are automatic
• Revise the maximum modification formula/cap so the maximum mod is not less than 1.10
• Experience rating changes will be premium- neutral statewide
Experience Rating Plan Update

© Copyright 2011 National Council on Compensation Insurance, Inc. All Rights Reserved. 125
• The split point separates losses into primary and excess components. It is currently 5,000.
• If the split point is not indexed for claim cost inflation, a greater proportion of losses fall into the excess category as time goes on.
• Since excess losses receive less weight than primary losses in the experience rating formula, the plan becomes less responsive.
• Indications are that the split point should be increased to 15,000. This is not surprising since the average cost of a claim has tripled since the last split point update (20 years ago).
Experience Rating Plan Split Point Review

© Copyright 2011 National Council on Compensation Insurance, Inc. All Rights Reserved. 126
• NCCI plans to institute a transition program that increases the split point most of the way initially and phases in the rest of the change
– The split point will initially be increased to 10k
– The next effective year filing will further increase the split point to 13.5k
– The third effective year filing will further increase the split point all the way to the indicated split point of 15k trended two years forward (rounded to the nearest 500)
• Subsequent effective year filings will increase the split point as indicated
Experience Rating Plan Split Point Review

© Copyright 2011 National Council on Compensation Insurance, Inc. All Rights Reserved. 127
Experience Rating Plan Update
Projected timeline:
• Filed August 2, 2011
• Effective on the loss cost effective date beginning with 1/1/2013 filings
• NCCI will pursue a six-month approval lead time (e.g., approval by 6/30/2012 in states with 1/1/2013 loss cost filings)
An on-demand webinar is currently available on ncci.com

© Copyright 2011 National Council on Compensation Insurance, Inc. All Rights Reserved.
Q & A

© Copyright 2011 National Council on Compensation Insurance, Inc. All Rights Reserved.
Closing Remarks
Thank You!

© Copyright 2011 National Council on Compensation Insurance, Inc. All Rights Reserved.
Glossary

© Copyright 2011 National Council on Compensation Insurance, Inc. All Rights Reserved. 131
• Assigned Risk Adjustment Program (ARAP)—An assigned risk market program that surcharges residual market risks based on the magnitude of their experience rating modification.
• Calendar Year (CY)—Experience of earned premium and loss transactions occurring within the calendar year beginning January 1, irrespective of the contractual dates of the policies to which the transactions relate and the dates of the accidents.
• Calendar-Accident Year (AY)—The accumulation of loss data on all accidents with the date of occurrence falling within a given calendar year. The premium figure is the same as that used in calendar year experience.
• Claim Frequency—The number of claims per unit of exposure; for example, the number of claims per million dollars of premium or per 100 workers.
Glossary

© Copyright 2011 National Council on Compensation Insurance, Inc. All Rights Reserved. 132
• Claim Severity—The average cost of a claim. Severity is calculated by dividing total losses by the total number of claims.
• Combined Ratio—The sum of the (i) loss ratio, (ii) expense ratio, and (iii) dividend ratio for a given time period.
• Detailed Claim Information (DCI)—An NCCI call that collects detailed information on an individual workers compensation lost-time claim basis, such as type of injury, whether or not an attorney was involved, timing of the claim’s report to the carrier, etc.
• Direct Written Premium (DWP)—The gross premium income adjusted for additional or return premiums, but excluding any reinsurance premiums.
Glossary
© Copyright 2011 National Council on Compensation Insurance, Inc. All Rights Reserved. 133
• Indemnity Benefits—Payments by an insurance company to cover an injured worker's time lost from work. These benefits are also referred to as ―wage replacement‖ benefits.
• Loss Ratio—The ratio of losses to premium for a given time period.
• Lost-Time (LT) Claims—Claims resulting in indemnity benefits (and usually medical benefits) being paid to or on behalf of the injured worker for time lost from work.
• Medical-Only Claims—Claims resulting in only medical benefits being paid on behalf of an injured worker.
• Net Written Premium (NWP)—The gross premium income adjusted for additional or return premiums and including any additions for reinsurance assumed and any deductions for reinsurance ceded.
Glossary
© Copyright 2011 National Council on Compensation Insurance, Inc. All Rights Reserved. 134
• Permanent Partial (PP)—Disability that prevents the insured from working at their own (and sometimes any) occupation. A disability is considered to result in partial permanent loss of earning power.
• Policy Year (PY)—Premium and loss data on business for a 12-month period for policies with inception dates within the 12-month period.
• Schedule Rating—A debit and credit plan that recognizes variations in the hazard-causing features of an individual risk.
• Take-Out Credit Program—An assigned risk program that encourages carriers to write current residual market risks in the competitive voluntary marketplace.
• Temporary Total (TT)—A disability that totally disables a worker for a temporary period of time.
Glossary

© Copyright 2011 National Council on Compensation Insurance, Inc. All Rights Reserved.
Appendix

© Copyright 2011 National Council on Compensation Insurance, Inc. All Rights Reserved. 136
• Financial Aggregate Calls
– Used for aggregate ratemaking
• Statistical Plan for Workers Compensation and Employers Liability Insurance (Statistical Plan)
– Used for class ratemaking
• Detailed Claim Information
– In-depth sample of lost-time claims
• Policy Data
– Policy declaration page information
NCCI Workers Compensation Resources

© Copyright 2011 National Council on Compensation Insurance, Inc. All Rights Reserved. 137
• Collected annually
– Policy and calendar-accident year basis
– Statewide and assigned risk data
• Premiums, losses, and claim counts
– Evaluated as of December 31
• Purpose
– Basis for overall aggregate rate indication
– Research
Financial Aggregate Calls

© Copyright 2011 National Council on Compensation Insurance, Inc. All Rights Reserved. 138
Policy Year Financial Aggregate Data
1/1/2009 12/31/2009 1/1/2008 1/1/2012 12/31/2012
Policy Expiration Date
Policy Effective Date
Policy
Year
2008
Policy
Year
2009
Policy
Year
2012

© Copyright 2011 National Council on Compensation Insurance, Inc. All Rights Reserved. 139
Calendar-Accident Year Financial Aggregate Data
1/1/2010 12/31/2010 1/1/2009 1/1/2013 12/31/2013
Policy Expiration Date
Policy Effective Date
Calendar-
Accident
Year
2009
Calendar-
Accident
Year
2010
Calendar-
Accident
Year
2013

© Copyright 2011 National Council on Compensation Insurance, Inc. All Rights Reserved. 140
• Experience by policy detail
– Exposure, premium, experience rating modifications
– Individual claims by injury type
• Purposes
– Classification relativities
– Experience Rating Plan
– Research
Statistical Plan for Workers Compensation and Employers Liability
Insurance (Statistical Plan) Data

© Copyright 2011 National Council on Compensation Insurance, Inc. All Rights Reserved. 141
Valuation of Statistical Plan Data
Policy
Effective 18 Months
1st
Report
Valuation
2nd
Report
Valuation
3rd
Report
Valuation
4th
Report
Valuation
5th
Report
Valuation
30 Months 42 Months
54 Months 66 Months