Embed Size (px)
Citation preview
U.S. Department of the InteriorU.S. Geological Survey
Data Series 759
Alaska Geochemical Database Version 2.0 (AGDB2)—Including “Best Value” Data Compilations for Rock, Sediment, Soil, Mineral, and Concentrate Sample Media

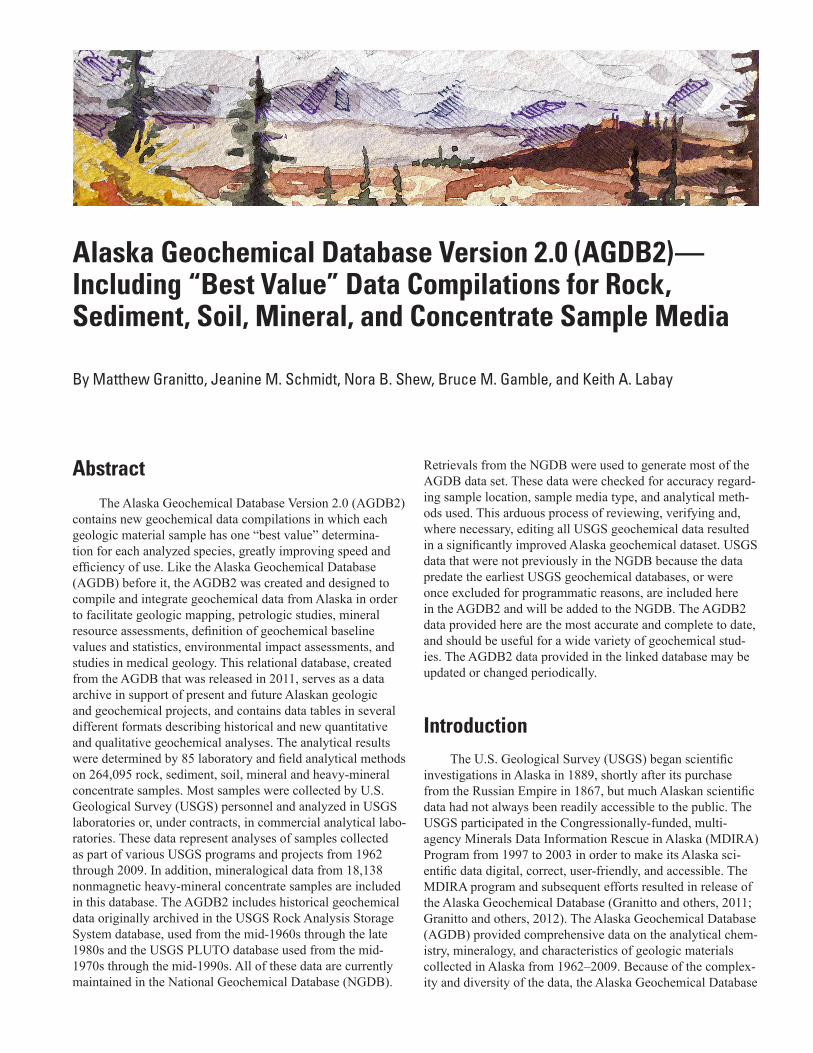
Cover art: “Late summer at Denali©” Watercolor in pen and ink, by Daniel Granitto, 2013. Used with permission.
Alaska Geochemical Database Version 2.0 (AGDB2)—Including “Best Value” Data Compilations for Rock, Sediment, Soil, Mineral, and Concentrate Sample Media
By Matthew Granitto, Jeanine M. Schmidt, Nora B. Shew, Bruce M. Gamble, and Keith A. Labay
Data Series 759
U.S. Department of the InteriorU.S. Geological Survey
U.S. Department of the InteriorSALLY JEWELL, Secretary
U.S. Geological SurveySuzette M. Kimball, Acting Director
U.S. Geological Survey, Reston, Virginia: 2013
For more information on the USGS—the Federal source for science about the Earth, its natural and living resources, natural hazards, and the environment, visit http://www.usgs.gov or call 1–888–ASK–USGS.
For an overview of USGS information products, including maps, imagery, and publications, visit http://www.usgs.gov/pubprod
To order this and other USGS information products, visit http://store.usgs.gov
Any use of trade, firm, or product names is for descriptive purposes only and does not imply endorsement by the U.S. Government.
Although this information product, for the most part, is in the public domain, it also may contain copyrighted materials as noted in the text. Permission to reproduce copyrighted items must be secured from the copyright owner.
Suggested citation:Granitto, Matthew, Schmidt, J.M., Shew, N.B., Gamble, B.M., and Labay, K.A., 2013, Alaska Geochemical Database, Version 2.0 (AGDB2)—including “best value” data compilations for rock, sediment, soil, mineral, and concentrate sample media: U.S. Geological Survey Data Series 759, 20 p. 1 DVD, http://pubs.usgs.gov/ds/759.
iii
Contents
List of Acronyms.............................................................................................................................................vUseful websites .............................................................................................................................................viAbstract ...........................................................................................................................................................1Introduction.....................................................................................................................................................1Geographic Setting ........................................................................................................................................2Methods of Study ...........................................................................................................................................2
Sample Media and Collection .............................................................................................................2Analytical Techniques ..........................................................................................................................4Quality Assurance/Quality Control .....................................................................................................4
“Best Value” Concept ...................................................................................................................................4Determining “Best Value” Rankings ..................................................................................................4
Sample Weight .............................................................................................................................4Sample Decomposition ...............................................................................................................5Analytical Instrumentation .........................................................................................................5Limits of Detection .......................................................................................................................5
Review of Analytical Methods ............................................................................................................5“Best Value” Ranking Tables ..............................................................................................................6
Characteristics of the Relational Database ..............................................................................................6Contents..................................................................................................................................................6Structure.................................................................................................................................................6Other Data Formats.............................................................................................................................10
“Best Value” Data Population ...................................................................................................................10Detected Values ..................................................................................................................................11Non-detected Values .........................................................................................................................11
Acknowledgments .......................................................................................................................................12References ....................................................................................................................................................12
Database References ........................................................................................................................12References Cited.................................................................................................................................12
Appendix 1.....................................................................................................................................................14Analytical Methods.............................................................................................................................14
Appendix 2.....................................................................................................................................................17Mineral Name Abbreviations ............................................................................................................17
Appendix 3.....................................................................................................................................................19Mineralogical Data References .......................................................................................................19
Figures 1. Geographic area covered by Alaska Geochemical Database Version 2.0 .........................3 2. Table relationships in the Alaska Geochemical Database Version 2.0................................8 3. “Best value” analytical method ranking table for silver used in the Alaska
Geochemical Database Version 2.0 .........................................................................................11
iv
Conversion Factors
Inch/Pound to SI
Multiply By To obtain
Lengthinch (in.) 2.54 centimeter (cm)inch (in.) 25.4 millimeter (mm)foot (ft.) 0.3048 meter (m)
SI to Inch/Pound
Multiply By To obtain
Volumeliter (L) 0.2642 gallon (gal)
Massgram (g) 0.03527 ounce, avoirdupois (oz.)
Temperature in degrees Celsius (°C) may be converted to degrees Fahrenheit (°F) as follows:°F=(1.8×°C)+32Temperature in degrees Fahrenheit (°F) may be converted to degrees Celsius (°C) as follows:°C=(°F-32)/1.8Concentrations of chemical constituents in water are given either in milligrams per liter (mg/L) or micro-
grams per liter (µg/L).
Tables 1. Tables of Alaska Geochemical Database Version 2.0 ............................................................7 2. List of spreadsheets containing data from Alaska Geochemical Database
Version 2.0 ....................................................................................................................................10 A1. Analytical methods. ....................................................................................................................14 A2. Mineral name abbreviations. ....................................................................................................17
v
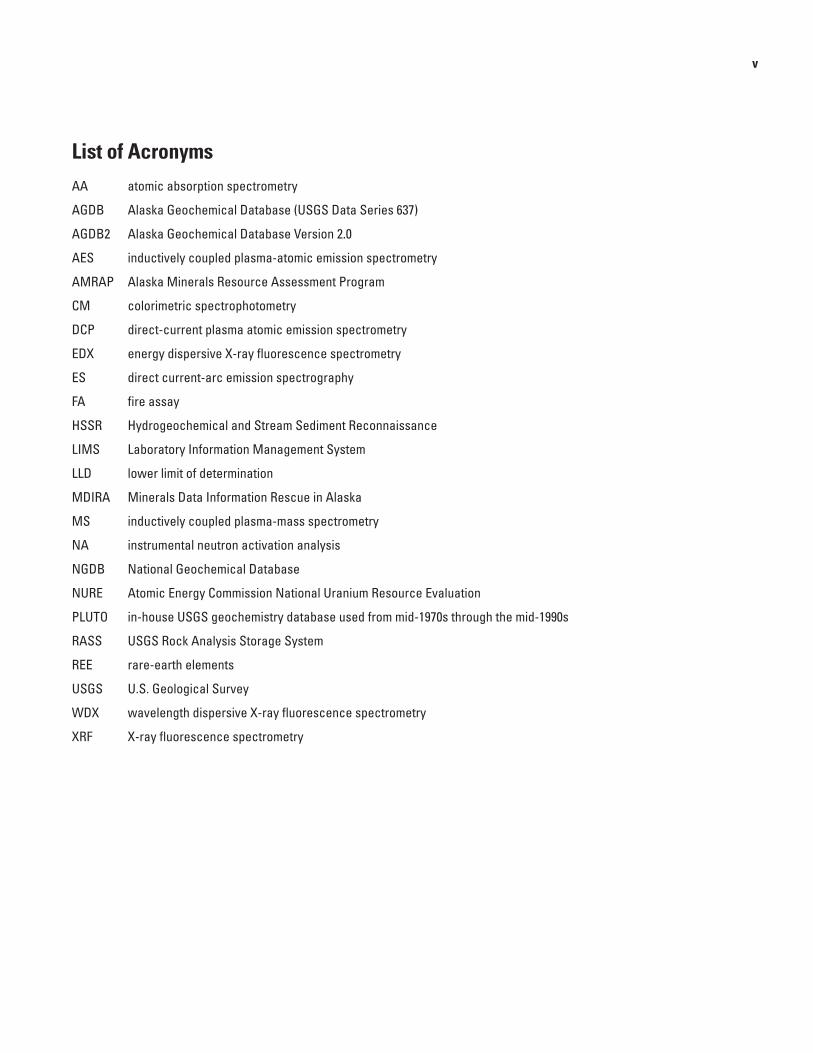
List of AcronymsAA atomic absorption spectrometry
AGDB Alaska Geochemical Database (USGS Data Series 637)
AGDB2 Alaska Geochemical Database Version 2.0
AES inductively coupled plasma-atomic emission spectrometry
AMRAP Alaska Minerals Resource Assessment Program
CM colorimetric spectrophotometry
DCP direct-current plasma atomic emission spectrometry
EDX energy dispersive X-ray fluorescence spectrometry
ES direct current-arc emission spectrography
FA fire assay
HSSR Hydrogeochemical and Stream Sediment Reconnaissance
LIMS Laboratory Information Management System
LLD lower limit of determination
MDIRA Minerals Data Information Rescue in Alaska
MS inductively coupled plasma-mass spectrometry
NA instrumental neutron activation analysis
NGDB National Geochemical Database
NURE Atomic Energy Commission National Uranium Resource Evaluation
PLUTO in-house USGS geochemistry database used from mid-1970s through the mid-1990s
RASS USGS Rock Analysis Storage System
REE rare-earth elements
USGS U.S. Geological Survey
WDX wavelength dispersive X-ray fluorescence spectrometry
XRF X-ray fluorescence spectrometry
vi
Useful websites:USGS main webpage.......................................................................................................................................
http://www.usgs.gov/USGS publications search page ...................................................................................................................
http://pubs.er.usgs.gov/USGS Alaska Science Center ........................................................................................................................
http://alaska.usgs.gov/USGS Mineral Resources On-line Spatial Data ..........................................................................................
http://mrdata.usgs.gov/USGS Open-File Report 99-433, Rock Analysis Storage System (RASS) ................................................
http://pubs.usgs.gov/of/1999/of99-433/USGS Open-File Report 97-492, National Geochemical Database (NURE, HSSR) ................................
http://pubs.usgs.gov/of/1997/ofr-97-0492/USGS Data Series 637, Alaska Geochemical Database (AGDB) .............................................................
http://pubs.usgs.gov/ds/637/Alaska Department of Natural Resources ...................................................................................................
http://dnr.alaska.gov/
AbstractThe Alaska Geochemical Database Version 2.0 (AGDB2)
contains new geochemical data compilations in which each geologic material sample has one “best value” determina-tion for each analyzed species, greatly improving speed and efficiency of use. Like the Alaska Geochemical Database (AGDB) before it, the AGDB2 was created and designed to compile and integrate geochemical data from Alaska in order to facilitate geologic mapping, petrologic studies, mineral resource assessments, definition of geochemical baseline values and statistics, environmental impact assessments, and studies in medical geology. This relational database, created from the AGDB that was released in 2011, serves as a data archive in support of present and future Alaskan geologic and geochemical projects, and contains data tables in several different formats describing historical and new quantitative and qualitative geochemical analyses. The analytical results were determined by 85 laboratory and field analytical methods on 264,095 rock, sediment, soil, mineral and heavy-mineral concentrate samples. Most samples were collected by U.S. Geological Survey (USGS) personnel and analyzed in USGS laboratories or, under contracts, in commercial analytical labo-ratories. These data represent analyses of samples collected as part of various USGS programs and projects from 1962 through 2009. In addition, mineralogical data from 18,138 nonmagnetic heavy-mineral concentrate samples are included in this database. The AGDB2 includes historical geochemical data originally archived in the USGS Rock Analysis Storage System database, used from the mid-1960s through the late 1980s and the USGS PLUTO database used from the mid-1970s through the mid-1990s. All of these data are currently maintained in the National Geochemical Database (NGDB).
Retrievals from the NGDB were used to generate most of the AGDB data set. These data were checked for accuracy regard-ing sample location, sample media type, and analytical meth-ods used. This arduous process of reviewing, verifying and, where necessary, editing all USGS geochemical data resulted in a significantly improved Alaska geochemical dataset. USGS data that were not previously in the NGDB because the data predate the earliest USGS geochemical databases, or were once excluded for programmatic reasons, are included here in the AGDB2 and will be added to the NGDB. The AGDB2 data provided here are the most accurate and complete to date, and should be useful for a wide variety of geochemical stud-ies. The AGDB2 data provided in the linked database may be updated or changed periodically.
IntroductionThe U.S. Geological Survey (USGS) began scientific
investigations in Alaska in 1889, shortly after its purchase from the Russian Empire in 1867, but much Alaskan scientific data had not always been readily accessible to the public. The USGS participated in the Congressionally-funded, multi-agency Minerals Data Information Rescue in Alaska (MDIRA) Program from 1997 to 2003 in order to make its Alaska sci-entific data digital, correct, user-friendly, and accessible. The MDIRA program and subsequent efforts resulted in release of the Alaska Geochemical Database (Granitto and others, 2011; Granitto and others, 2012). The Alaska Geochemical Database (AGDB) provided comprehensive data on the analytical chem-istry, mineralogy, and characteristics of geologic materials collected in Alaska from 1962‒2009. Because of the complex-ity and diversity of the data, the Alaska Geochemical Database
Alaska Geochemical Database Version 2.0 (AGDB2)—Including “Best Value” Data Compilations for Rock, Sediment, Soil, Mineral, and Concentrate Sample Media
By Matthew Granitto, Jeanine M. Schmidt, Nora B. Shew, Bruce M. Gamble, and Keith A. Labay
2 Alaska Geochemical Database Version 2.0 (AGDB2)
Version 2.0 (AGDB2) presented here contains new geochemi-cal data compilations in which each geologic material sample has one “best value” determination for each analyzed species, greatly improving speed and efficiency of use.
The AGDB2 includes analyses of rocks, sediments (collected from streams, lakes, and various sources), soils, minerals, and heavy-mineral concentrates (derived from stream sediments, soils or rocks) compiled in part during the MDIRA process (Bailey and others, 1999), together with analyses of a variety of geologic materials from 1996 through 2010. Many of the analyses were the result of min-eral resource investigations conducted by the Alaska Mineral Resource Assessment Program (AMRAP) in the mid-1970s through early 1990s; some of the data were produced in support of other USGS programs such as National Geologic Mapping, Volcano Hazards, Development of Assessment Techniques, and Energy Resources.
Most of these data were originally entered into the USGS Rock Analysis Storage System (RASS) or PLUTO databases. The RASS database, which contained over 730,000 data records, was used by the USGS Geologic Division from the late 1960s through the late 1980s to archive geochemical data produced by the Branch of Exploration Services primarily from mineral resource studies. The PLUTO database, which contained over 530,000 data records, was used by the USGS Geologic Division from the late 1960s through 1997 to archive geochemical data from the Branch of Analytical Chemistry and successor branches. More recent geochemical data are presently stored in the commercial Laboratory Information Management System (LIMS) database (1996 to present). Data from these databases have been merged and are maintained in the Oracle-based National Geochemical Database (NGDB; available at http://mrdata.usgs.gov/) which currently contains nearly 2 million data records. Many of these determinations have been previously published in hardcopy or digital USGS Open-File Reports by the original sample submitters or ana-lysts; however, some have never before been published.
These data were generated over a span of nearly 50 years from 1962 to 2010 in USGS laboratories or, under con-tracts, in commercial analytical laboratories. Upon comple-tion of the sampling and analysis, data for the original RASS and PLUTO databases were keypunched for digital storage. Automated data entry from a LIMS was begun in the late 1980’s in the PLUTO database. Over the years, USGS scien-tists recognized several problems with the databases. Three primary issues were: (1) erroneous or missing sample local-ity coordinates, (2) sample media were often not adequately identified, and (3) analytical methods were poorly identified (often missing from the early PLUTO database structure). Beginning in 1998, a major review of Alaska samples from these databases was initiated to confirm sample and lab num-bers for analyses, correct errors in sample site locations, add sample site locations when missing, and to correctly identify the sample media and analytical protocols for each record. This re-processing consisted of comparing the recorded digi-tal information to the information found in original sample
submittal forms, the original analytical reports, published reports, field notebooks and field sheets (sample locality maps), and follow-up discussions with submitters and ana-lysts (when available). As necessary, additional data fields were added to the database structure to more fully describe sample preparation methods and sample media. Geochemical datasets that were not entered in RASS and PLUTO during the re-processing have been incorporated into the AGDB2 database, resulting in the addition of thousands of sample data records to the NGDB. The RASS and PLUTO analyti-cal data were not checked in great detail, but obvious errors were corrected. Discussion of these corrections and additions is found in Appendix 3 of Granitto and others, 2011.
The AGDB2 is the most current, complete, and accurate data compilation for new and historical geochemical analyses of rock, sediment, soil, and concentrate samples. The AGDB2 also contains mineralogical information from optical examina-tion of the nonmagnetic fractions of heavy-mineral concen-trate samples. In addition, geochemical data from reanalyses of sediment samples collected under the Atomic Energy Commission National Uranium Resource Evaluation (NURE) Hydrogeochemical and Stream Sediment Reconnaissance (HSSR) program (henceforth called NURE), and reanalyses (2007–2009) of AMRAP sediment samples from the Alaska Range have been included in the AGDB2. Data from other recent projects in Taylor Mountains Quadrangle, southwestern Alaska, Fortymile district, and statewide Surveys and Analysis are also included in the AGDB2.
Geographic SettingThe geographic boundaries of the AGDB2 include all
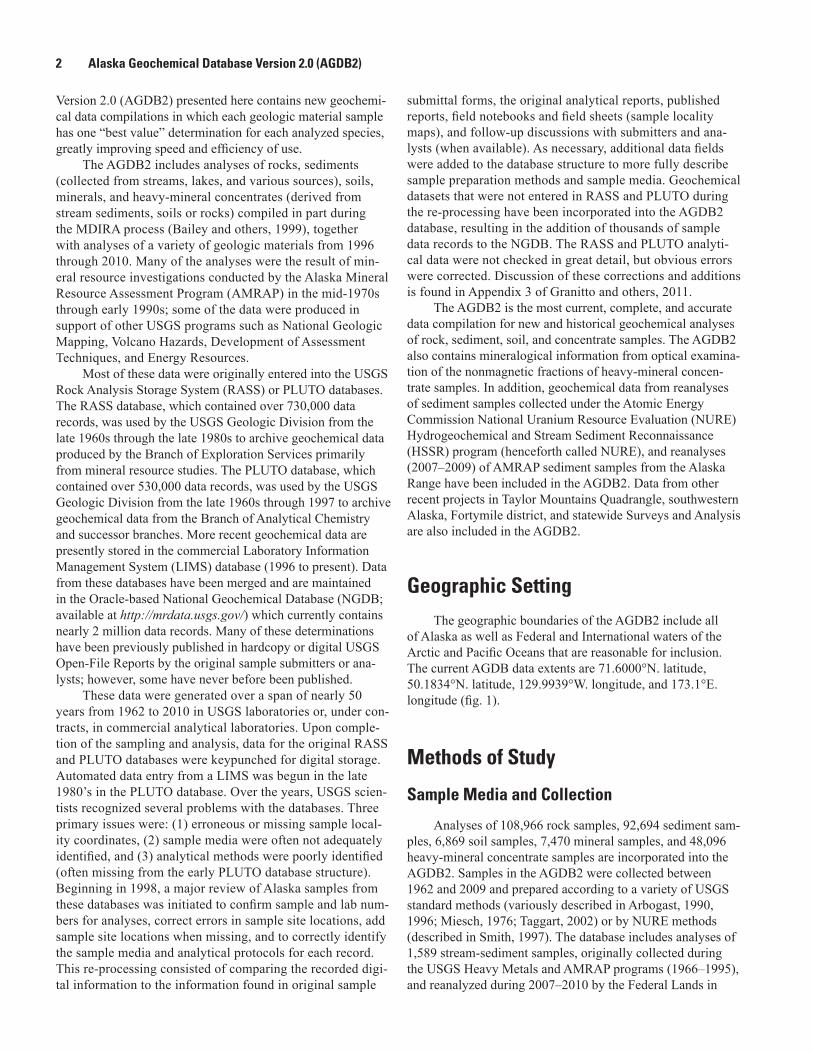
of Alaska as well as Federal and International waters of the Arctic and Pacific Oceans that are reasonable for inclusion. The current AGDB data extents are 71.6000°N. latitude, 50.1834°N. latitude, 129.9939°W. longitude, and 173.1°E. longitude (fig. 1).
Methods of Study
Sample Media and Collection
Analyses of 108,966 rock samples, 92,694 sediment sam-ples, 6,869 soil samples, 7,470 mineral samples, and 48,096 heavy-mineral concentrate samples are incorporated into the AGDB2. Samples in the AGDB2 were collected between 1962 and 2009 and prepared according to a variety of USGS standard methods (variously described in Arbogast, 1990, 1996; Miesch, 1976; Taggart, 2002) or by NURE methods (described in Smith, 1997). The database includes analyses of 1,589 stream-sediment samples, originally collected during the USGS Heavy Metals and AMRAP programs (1966–1995), and reanalyzed during 2007–2010 by the Federal Lands in
Methods of Study
3
Figure 1. Geographic area covered by Alaska Geochemical Database Version 2.0. The state of Alaska is in the center of the map. Gray rectangles are the 1:250,000 topographic quadrangle outlines. The red dots are sediment, soil, and heavy-mineral concentrate sample localities. The blue dots are rock and mineral sample localities.
4 Alaska Geochemical Database Version 2.0 (AGDB2)
Alaska-Geologic Studies project (Bailey and others, 2010; Gamble and others, 2010); analyses of 3,015 rock, sediment, soil, mineral, and concentrate samples collected during the 2004–2010 Taylor Mountains quadrangle project (Bailey and others, 2007; Klimasauskas and others, 2007; Klimasauskas, Miller, Bradley, Bundtzen and others, 2006; Klimasauskas, Miller, Bradley, Karl and others, 2006); data from 6,686 NURE sediment samples that were reanalyzed, including, in part, 4,804 for the National Geochemical Survey proj-ect between 1998–2008 (U.S. Geological Survey, 2004) and 1,640 for AMRAP projects; and analyses of 536 rock, sediment, and soil samples collected during the 2007–2009 Concealed Deposits—Pebble Cu-Au-Mo porphyry deposit project (Anderson and others, 2011; Fey and others, 2009, 2008). Existing NGDB data from Alaskan water, leachate, and organic samples (including humus and peat) have been excluded from this database but are planned to be compiled, verified, and included in a later version of the AGDB.
Analytical Techniques
Eighty-five different field and laboratory analytical methods were used to produce geochemical data included in the AGDB2. These methods reflect the evolution of analytical chemistry from 1960 to 2009. Appendix 1 provides a complete list of the analytical methods included in the AGDB2 and descriptive information for each. The AnalyticMethod table in the AGDB2 provides detailed information about techniques and the AnalyticMethodBiblio table contains citations for the analytical methods.
Quality Assurance/Quality Control
Quality assurance and quality control (QA/QC) proce-dures varied over the time of AGDB2 sample processing and analysis, and are not included in this database. Data from field sample-site duplicates and analytical replicates (splits of a single sample to check laboratory precision) are included in the database. USGS and contract laboratories reporting these analyses use constituent standards (for example, USGS geo-chemical reference rock standard STM–1, nepheline syenite) and blanks for their internal QA/QC controls (Arbogast, 1990; Taggart, 2002). Data for commonly used reference samples are described at (http://minerals.cr.usgs.gov/geo_chem_stand/).
“Best Value” ConceptThe comprehensive nature of the first AGDB (Granitto and
others, 2011) meant that it included as many as four separate values for a given element, where samples were analyzed by multiple analytical methods. The AGDB contained 7,346,935 cases where there is only one determination of a given species (element) for a given sample record; 1,086,397 cases with two determinations; 54,761 cases with three determinations; and
3,998 matches where there are four different determinations of a given species for a given sample record. Species that have the most multiple determination matches are Ag, As, Au, Bi, Cd, Cu, Mo, Pb, Sb, and Zn. While these comprehensive data are complete, for many users such multiple analyses raise difficult questions of which value to use in their work.
This Alaska Geochemical Database Version 2.0 (AGDB2) includes a subset of data that represents one “best value” per species for each of its samples. Where used in this report, the term “best value” means that single value per ele-ment per sample chosen by the rubric and reasoning described below. This rubric was designed to provide the best values for mineral exploration and assessment purposes and should not be assumed to be appropriate for other purposes (for example, evaluation of environmental background and baseline geo-chemical values would require development of a different “best value” ranking). The best values subset greatly reduces the total number of determinations a user must consider for a given sample, and facilitates use of the AGDB for geochemi-cal mapping, data synthesis, and regional evaluation in Alaska.
Determining “Best Value” Rankings
Different analytical determinations of the same element for any given sample do not have equal value to a user for dif-ferent purposes. Some analytical methods result in values that are more quantitative, precise, or accurate than others. When developing a ranking of methods best for any particular use it is necessary to take into account factors which vary between analytical methods. These include weight of sample analyzed, method of decomposition of the sample during the preparation for analysis, sensitivity and accuracy of the instrument used in each method, upper and lower limits of detection for a given element by a given method, the age of the method and stage of its development when a specific analysis was performed, and the exact analytical laboratory and equipment used. Creation of the AGDB2 “best value” subset followed a rubric or decision tree that considered all these factors in ranking the analytical methods in the AGDB2 to determine methods most useful to mineral resource evaluation.
Sample Weight
The amount of sample required for analysis varies widely between methods. On the high end, 15 to 30 grams (g) of sam-ple are needed to determine gold or the platinum group elements by fire assay (FA) methods, and 10 to 15 g for the detection of Au by atomic absorption spectrometry (AA) or direct-current plasma (DCP). On the low end, only 10 milligrams (mg) of sample are needed for direct-current arc emission spectrography (ES), a method that was used to detect concentrations of 33 to 65 elements. In general, larger sample aliquots provide a more accurate assessment of a sample’s chemical makeup, so deter-minations by ES, for example, are less quantitative than those by analytical methods that require larger sample amounts.
“Best Value” Concept 5
Sample Decomposition
The methods used to decompose a geologic sample to be analyzed vary by material (for example, rock vs. soil) and effectiveness, and are an important factor to consider in determining “best” methods. In general, methods which digest or dissolve a sample vary from near total (“complete”) to partial decomposition of a sample. The AGDB2 does not include results from any analytical methods that use passive or weak leaches of geologic material samples. Decomposition methods that result in complete or near complete digestion are herein referred to as “total.” Instrumental neutron activa-tion analysis (NA) and energy dispersive X-ray fluorescence spectrometry (EDX), which comprises 3.3 percent of AGDB2 analyses, are non-destructive techniques that analyze the entire sample without requiring digestion, and thus usually represent the best total decomposition of the sample. Wave-length dispersive X-ray fluorescence spectrometry (WDX), inductively coupled plasma-atomic emission spectrometry (AES), inductively coupled plasma-mass spectrometry (MS), atomic absorption (AA), and colorimetric spectrophotom-etry (CM), which comprise 5.2 percent of AGDB2 analyses, employ various highly effective fusion or sinter digestions that yield near “total” analyses of the elements of interest, but may drive off volatile elements such as As, Hg, S, Sb, or Te in the process. AES, MS, AA, and CM may also employ strong acid digestions that provide for virtually complete decomposition. A common “total” acid digestion technique using a four-acid solution (HF, HClO4, HNO3, and HCl) is sufficient for many elements of interest, but may not be effective in putting Ba, Cr, Hf, Nb, Sc, Sn, Ta, Ti, W, Zr, and rare-earth elements (REEs) into solution. Decomposi-tion techniques that employ HF account for 10.9 percent of AGDB2 analyses. Partial-digestion acid solution methods and partial fusion methods (9.5 percent of AGDB2 analyses) are moderately effective for some elements but ineffective for others. Most analytical methods are designed for the detection of one or a specific suite of elements and employ decomposition techniques suitable for those elements at the expense of accurate determinations of other elements.
Analytical Instrumentation
The sensitivity and reliability of individual analytic instruments is another factor which affects the method’s ranking in the “best values” rubric. The instruments most commonly used for analysis of Alaskan samples are: (1) ES, 69.1 percent of the determinations, (2) AES, 14.7 percent, (3) AA, 6.3 percent, (4) XRF (X-ray fluorescence spectrometry), 3 percent, (5) MS, 2.9 percent, and (6) NA, 2.3 percent. For the determination of most elemental concentrations, NA, AES, MS, and XRF are more sensitive and more quantitative than ES which was usually employed as a semi-quantitative method of determination. In general, newer models of instruments are more sensitive than older ones. For some instruments, spectral interferences, background shifts, matrix
effects, and mineralogical and other structural effects cause some element determinations to be less accurate than others. Analytical methods that use WDX spectrometers have devel-oped modifications in sample decomposition, or correction factors that yield more accurate chemical determinations (Taggart and others, 1987).
Limits of DetectionThe lower limit of determination (LLD) is the lowest
quantity of a substance that can be distinguished from the absence of that substance within a stated confidence limit (Taggart, 2002). As an analytical method becomes more sensitive and can detect lower elemental concentrations, its LLD moves lower. One analytical method may have multiple LLDs for a single element in the database due to preconcentration or dilution of a specific sample, improved sensitivity as newer models of instruments are used, varying dates of analysis for the same method, or different analytical laboratories using varying procedures for the same analyti-cal method. The presence of interfering elements also can affect the LLD. Upper limits of detection are the highest quantity of an analyte that can be determined within a stated confidence limit without further dilution of the digestate. The methods and procedures of USGS laboratories and USGS-contracted laboratories reported in AGDB2 are comparable, since contract laboratories are held to USGS quality assur-ance and quality control standards.
Review of Analytical Methods
A thorough understanding of all USGS analytical proto-cols used over the past 50 years was crucial in verifying the chemical analytical data in the AGDB. From 1998 through 2010, analytical method publications from the 1950’s to the present were compiled (see table AnalyticMethodBiblio in the AGDB2), and chemists knowledgeable in various meth-ods were frequently queried through phone calls, emails, and personal visits. These efforts were continued when develop-ing the AGDB2 in order to capture the details of analytical methods to rank methods on an element by element basis. In December 2011, USGS emeritus chemists James G. Crock, Paul J. Lamothe, and Richard M. O’Leary, representing more than 110 cumulative years of USGS operational and research chemistry (1970 through 2012) along with senior author Matthew Granitto, systematically ranked all the AGDB spe-cies and elements by the quality of the analytical methods used. This ranking has since been refined and contributed significantly to the creation of the AGDB2 “best values” sub-set. Other chemists who have contributed to AGDB efforts over the past 14 years are Philip A. Baedecker, William M. Benzel, Zoe Ann Brown, James R. Budahn, Robert R. Carl-son, LaDonna M. Choate, Anthony F. Dorrzapf, Michael W. Doughten, David L. Fey, Philip L. Hageman, Larry L. Jack-son, Allen L. Meier, Stephen J. Sutley, Joseph E. Taggart, Jr., and Stephen A. Wilson.
6 Alaska Geochemical Database Version 2.0 (AGDB2)
“Best Value” Ranking Tables
The review of analytical methods discussed above resulted in a series of tables (BestValue_Rank.xlsx) which rank, from best to least preferred, the analytical methods that produced the “best values” for each element within the AGDB2. The ranking for each element contains two sub-sets—methods that employ “total” decomposition techniques (for example, rated as “01”) are listed above, and separate from methods that use partial decomposition techniques (for example, “P01”). The method ranking tables are compiled in the AGDB2 as the table Parameter_Rank, and as the Excel spreadsheet Parameter_Rank.xlsx.
The method ranking tables for each element contain the same field names (column headers). SPECIES is the chemi-cal entity for which samples have been analyzed. PARAM-ETER is a concatenation of the fields SPECIES, UNITS, TECHNIQUE, DIGESTION, and sometimes DECOMPOSI-TION from the AGDB2. ANALYTIC_METHOD contains the short name of the analytical method as used in the AGDB. BESTVALUE_RANK is the numeric ranking of the analytical methods used in the determination of each species. NON-DETECT_RANGE contains the range of non-detect values for the analytical method. Wherever the species concentra-tion is lower than the LLDs of the method used, yielding a negative value entry in the QUALIFIED_VALUE field of the Chem2 table in the AGDB2, the NONDETECT_RANGE value equals the LLD for that method. Non-detect values of a method vary due to sample preconcentration or dilution, instrumental sensitivity, the laboratory performing analyses, or the date of analysis. Non-detect ranges in parentheses represent approximately 90 percent of the non-detects in the AGDB2 for that analytical method species combina-tion. Non-detect ranges such as “< 0.28” indicate that no non-detects were encountered, and that 0.28 was the lowest detected value in the AGDB2 for that particular analytical method and species. The field LLD_RANGE is the range of LLDs reported in USGS publications or in-house laboratory manuals, and does not represent actual analytical determina-tions in the AGDB2. The entry “na” indicates that no pub-lished LLD was found for the analytical method and species. NONDETECT_RANK is the ranking of LLD entries in LLD_RANGE. No distinction is made between methods employ-ing total or partial digestion, and NONDETECT_RANK reflects only the sensitivity of the method in recognizing the presence of the species. The field RANK_COUNT contains the total number of determinations of each species in the AGDB2 by the analytical method listed. Further method information is available in the field ANALYTIC_METHOD_DESC of the AnalyticMethod table.
Characteristics of the Relational Database
Because of the scope and complexity of the Alaskan geo-logic materials analyzed, a tabular relational database which records both field site and sample observations and laboratory analyses was designed for data storage. The AGDB2 was con-structed in Microsoft Access 2010 as an archive and a tool to be used for data synthesis and analysis. The database structure and format are a modification of that used by the National Geochemical Database (NGDB) because more than 85 percent of the data were originally retrieved from the NGDB (Smith and others, 2003).
Contents
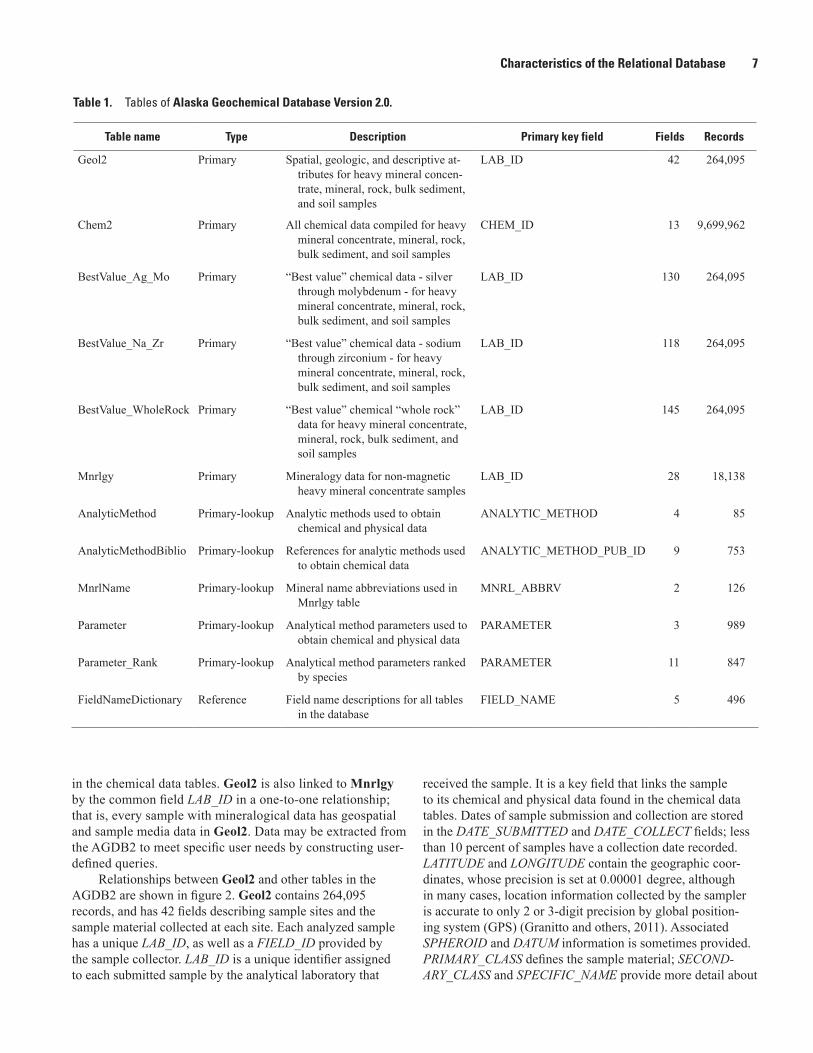
The AGDB2 (2.34 gigabytes) comprises two linked data-bases, AGDB2.accdb and AGDB2_Chem.accdb, to accommo-date the Microsoft Access limitation of 2 gigabytes for a single database. Data are contained in 12 tables, which are described in table 1of this report pamphlet. The six primary database tables contain quantitative analytical results, sample data, field site information, geologic and mineralogic data. Analyti-cal method information and analytical method bibliography core-lookup tables provide references for quantitative results. A reference table of field name definitions assists the user in understanding the names and content of database fields. In this report, names of tables cited are in boldface; field names within tables are italicized.
Structure
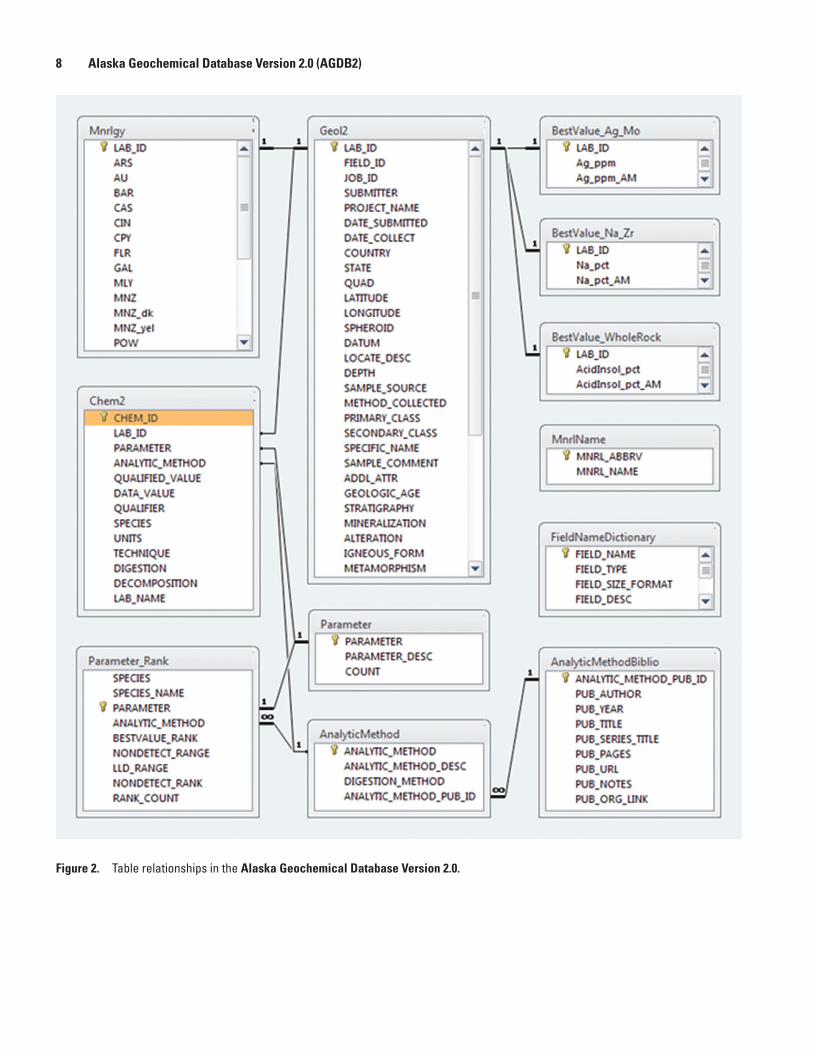
AGDB2 data are contained in six primary tables, Geol2, Chem2, BestValue_Ag_Mo, BestValue_Na_Zr, BestValue_WholeRock, and Mnrlgy, and relationships are defined to link these tables (fig. 2). This structure provides for efficient storage of information and for data verification. Relationships between these tables are depicted as lines in figure 2. Geol2 is linked to Chem2 by the common field (LAB_ID). Therefore, all chemical values have correspond-ing sample information in Geol2. This is a one-to-many relationship; that is, a single sample may have many analyti-cal results (for example, different elements, same element by multiple methods, and so forth). Geol2 is also linked to Best-Value_Ag_Mo by the common field LAB_ID since chemical values cannot exist without corresponding sample informa-tion in Geol2. This is a one-to-one relationship; that is, a sin-gle sample record in Geol2 has one or more analytical results
Characteristics of the Relational Database 7
Table 1. Tables of Alaska Geochemical Database Version 2.0.
Table name Type Description Primary key field Fields Records
Geol2 Primary Spatial, geologic, and descriptive at-tributes for heavy mineral concen-trate, mineral, rock, bulk sediment, and soil samples
LAB_ID 42 264,095
Chem2 Primary All chemical data compiled for heavy mineral concentrate, mineral, rock, bulk sediment, and soil samples
CHEM_ID 13 9,699,962
BestValue_Ag_Mo Primary “Best value” chemical data - silver through molybdenum - for heavy mineral concentrate, mineral, rock, bulk sediment, and soil samples
LAB_ID 130 264,095
BestValue_Na_Zr Primary “Best value” chemical data - sodium through zirconium - for heavy mineral concentrate, mineral, rock, bulk sediment, and soil samples
LAB_ID 118 264,095
BestValue_WholeRock Primary “Best value” chemical “whole rock” data for heavy mineral concentrate, mineral, rock, bulk sediment, and soil samples
LAB_ID 145 264,095
Mnrlgy Primary Mineralogy data for non-magnetic heavy mineral concentrate samples
LAB_ID 28 18,138
AnalyticMethod Primary-lookup Analytic methods used to obtain chemical and physical data
ANALYTIC_METHOD 4 85
AnalyticMethodBiblio Primary-lookup References for analytic methods used to obtain chemical data
ANALYTIC_METHOD_PUB_ID 9 753
MnrlName Primary-lookup Mineral name abbreviations used in Mnrlgy table
MNRL_ABBRV 2 126
Parameter Primary-lookup Analytical method parameters used to obtain chemical and physical data
PARAMETER 3 989
Parameter_Rank Primary-lookup Analytical method parameters ranked by species
PARAMETER 11 847
FieldNameDictionary Reference Field name descriptions for all tables in the database
FIELD_NAME 5 496
in the chemical data tables. Geol2 is also linked to Mnrlgy by the common field LAB_ID in a one-to-one relationship; that is, every sample with mineralogical data has geospatial and sample media data in Geol2. Data may be extracted from the AGDB2 to meet specific user needs by constructing user-defined queries.
Relationships between Geol2 and other tables in the AGDB2 are shown in figure 2. Geol2 contains 264,095 records, and has 42 fields describing sample sites and the sample material collected at each site. Each analyzed sample has a unique LAB_ID, as well as a FIELD_ID provided by the sample collector. LAB_ID is a unique identifier assigned to each submitted sample by the analytical laboratory that
received the sample. It is a key field that links the sample to its chemical and physical data found in the chemical data tables. Dates of sample submission and collection are stored in the DATE_SUBMITTED and DATE_COLLECT fields; less than 10 percent of samples have a collection date recorded. LATITUDE and LONGITUDE contain the geographic coor-dinates, whose precision is set at 0.00001 degree, although in many cases, location information collected by the sampler is accurate to only 2 or 3-digit precision by global position-ing system (GPS) (Granitto and others, 2011). Associated SPHEROID and DATUM information is sometimes provided. PRIMARY_CLASS defines the sample material; SECOND-ARY_CLASS and SPECIFIC_NAME provide more detail about
8 Alaska Geochemical Database Version 2.0 (AGDB2)
Figure 2. Table relationships in the Alaska Geochemical Database Version 2.0.
Characteristics of the Relational Database 9
the sample medium. Media type should be carefully noted so that data from different sample types are not mistakenly equated. For example, AGDB2 contains copper analyses for multiple subsamples (described in SPECIFIC_NAME) derived from one sediment sample site (for example, bulk sediment of various size-fractions, and their panned concentrate fractions of various magnetic susceptibilities). Information regard-ing the collection and preparation of the sample are found in METHOD_COLLECTED, PREP, and MESH_PORE_SIZE. Most of the LAB_ID entries are samples entered in the USGS laboratory information management system, archived in the NGDB (Smith and others, 2003).
The Chem2 table contains 9,699,962 records in 13 fields with laboratory and field analytical measurements, expressed as numeric values. CHEM_ID is a unique identi-fier assigned to each measurement in the table and is a key field of software-assigned integers. Measurements in Chem2 consist of a numeric DATA_VALUE and an optional QUALI-FIER, which is used to describe results such as those that were not detectable or that were estimates based on limits of instrumental detection (for example, “less than” values, such as < 2). QUALIFIER entries include “<” or “N,” meaning that the element was not detected at concentrations above the lower limit of determination for the method; “L,” meaning that the element was detected, but at concentrations below the lower limit of determination for the method; and “>” or “G,” meaning that the element was measured at a concentration greater than the upper limit of determination for the method. QUALIFIED_VALUE was populated by combining the data in DATA_VALUE with its complement in QUALIFIER, according to the following conventions: DATA_VALUE entries that are accompanied by “<,” “N,” or “L” entries in QUALIFIER are represented in QUALIFIED_VALUE as negative numbers (for example, “-2”); and DATA_VALUE entries that are accom-panied by “>” or “G” entries in QUALIFIER are represented in QUALIFIED_VALUE as values with 0.00111, 0.01111 or 0.11111 added to them (for example, >0.25 becomes 0.25111, >0.5 becomes 0.51111, and >10 becomes 10.11111).
Measurement characteristics such as units and analytical techniques are identified using a PARAMETER code, which is a concatenation of data from the fields SPECIES, UNITS, TECHNIQUE, and DIGESTION. For example, the parameter “Sb_ppm_AA_F_HNO3_P” represents the concentration of antimony, expressed in parts per million, as detected by flame atomic absorption spectrometry after a partial digestion (disso-lution) with HNO3. PARAMETER is a 25-character-length field that contains a method summary that can be used as a column name in a data report or spreadsheet.
The chemical data have been split into tables Best-Value_Ag_Mo, BestValue_Na_Zr and BestValue_Whol-eRock due to the 255-field limit of Access software. These data are derived from all of the determinations in the Chem2 table of the AGDB2 and are presented in “best value” format. In BestValue_Ag_Mo data for trace-elements Ag through Mo are reported for all samples. For non-rock samples (sedi-ment, soil, mineral and heavy-metal concentrates), data for
major elements Al, Ca, Fe, K, Mg, and Mn are reported in this table as elemental concentrations. BestValue_Na_Zr includes data for trace-elements Nb through Zr for all samples. For non-rock samples (sediment, soil, mineral and heavy-metal concentrates), data for major elements Na, P, Si, and Ti are reported in this table as elemental concentrations. BestValue_WholeRock contains whole-rock data for all samples. For rock samples, major element chemical determi-nations are expressed as oxide concentrations and fields are named accordingly (for example, Al2O3_pct_WDX rather than Al_pct_WDX). LAB_ID, the key field of the chemical data tables, is described in the “BestValue” Ranking Tables section of this report.
The chemical data tables BestValue_Ag_Mo, Best-Value_Na_Zr, and BestValue_WholeRock contain fields of the type “Species_ppm” (for example, Ag_ppm) that contain the “best value” for the species entered as qualified values from the QUALIFIED_VALUE field of the Chem2 table. The chemical data tables contain fields of the type “Spe-cies_ppm_AM” (for example, Ag_ppm_AM) which include the abbreviated name of the analytical method used to determine the “best value” for the species. These are the same methods and names found in the AGDB2. The chemical data tables also contain fields of the type “Species_ppm_SUM” (for example, Ag_ppm_SUM) that concatenate in order from best method to least, all available values and their respective analytical methods for the species and sample. For example, sample LAB_ID C286881 has a Ag_ppm_SUM entry “0.4, AES_AZ; -1, MS_ST; -1, MS_HF”. This indicates that the best value for Ag in this sample is “0.4 ppm” by AES_AZ, the second best value is “<1 ppm” by MS_ST, and the third best value is “<1 ppm” by MS_HF. Descriptions of all analytical methods are found in the AnalyticMethod table. All determinations in the Chem2 table of the AGDB are contained in these “Species_ppm_SUM” fields of the AGDB2.
The Mnrlgy table contains 28 fields with optical mineralogical data for 18,138 nonmagnetic heavy-mineral concentrate samples. The 18 fields record the occurrence of 18 discrete ore-related minerals; NORM field indicates that no ore-related minerals were observed. Details and ore-related minerals beyond the 18 are recorded in OreRelated-Mnrl_Comment; data regarding rock-forming minerals are in RockFormingMnrl_Comment. Appendix 2 lists the mineral name abbreviations in Mnrlgy. The relationship between Mnrlgy and Geol2 is shown in figure 2. More than 75 percent of these data were generated by Richard B. Tripp (retired, USGS) from1975 through 2009 in support of various USGS mineral resource assessment projects. Mineralogic data were originally recorded in hardcopy with mineral abundances variously reported as: (1) “present” or “not present”, (2) “abundant” or “moderate” or “trace” or “absent”, (3) as a per-centage or as a percentage range, or (4) as numbers of mineral particles. The field Inferred_Comment contains R.B. Tripp’s comments based on chemical analyses and previous USGS map publications, and those that were noted during the Fed-eral Lands in Alaska–Geologic Studies project (2007–2009)
10 Alaska Geochemical Database Version 2.0 (AGDB2)
for samples that had been hand ground or consumed during analysis. Appendix 3 contains a bibliographic list of these USGS map publications as well as other USGS publications containing relevant mineralogical information.
AnalyticMethod, Parameter, Parameter_Rank, and AnalyticMethodBiblio are reference tables in the AGDB2. AnalyticMethod is a look-up table with additional infor-mation on the 85 field and laboratory techniques used for analysis of the various geologic materials. It is linked by ANALYTIC_METHOD to the Chem2 table. AnalyticMethod includes a description of the methods and relevant published references, and is linked by ANALYTIC_METHOD_PUB_ID to references in AnalyticMethodBiblio. In the Chem2 table, details of sample preparation methods are found in DECOMPOSITION, and LAB_NAME indicates the labora-tory or work group responsible for the analysis. Parameter is a look-up table of analytical method parameters used to describe measurement characteristics of chemical and physical data, and is linked by PARAMETER to the Chem2 table. There are 989 unique parameters in the AGDB2. The Parameter_Rank table contains the analytical method parameters of the AGDB2 ranked by species, and is linked by ANALYTIC_METHOD to the AnalyticMethod table, and by PARAMETER to the Parameter table. The FieldNameDictionary table contains the field name, size, definition, and general data type of the 496 fields used in the AGDB2 tables as well as the names of tables in which these fields appear. Relationships between chemical data tables and all other tables in the AGDB2 are shown in figure 2.
Other Data Formats
To serve a wider audience of potential users of the AGDB2, all of the geospatial and chemical data have been exported from Access tables into five Excel spreadsheets with data on rock, sediment, concentrate, mineral, and soil samples. The reference tables are also provided as Excel spreadsheets. Table 2 lists the spreadsheet files included in the data release. In addition, these spreadsheets and tables are also included as tab-delimited ASCII flat files (.txt) that may be used by various applications.
Relational databases can be implemented using a variety of proprietary or nonproprietary software packages. AGDB2 data are reported here in proprietary (Microsoft Office Access 2010 and Excel 2010) and nonproprietary (ASCII tab-delimited) formats.
“Best Value” Data Population
The AGDB2 “best value” chemical data tables were populated element by element with chemical determinations and corresponding analytical method data from the Chem2 table of the AGDB2 by the use of Microsoft Access select and update queries. Though an analytical method may determine multiple species concentrations, each species in the AGDB2 was ranked individually to consider the many factors that have been mentioned in the section Determining “Best Value”
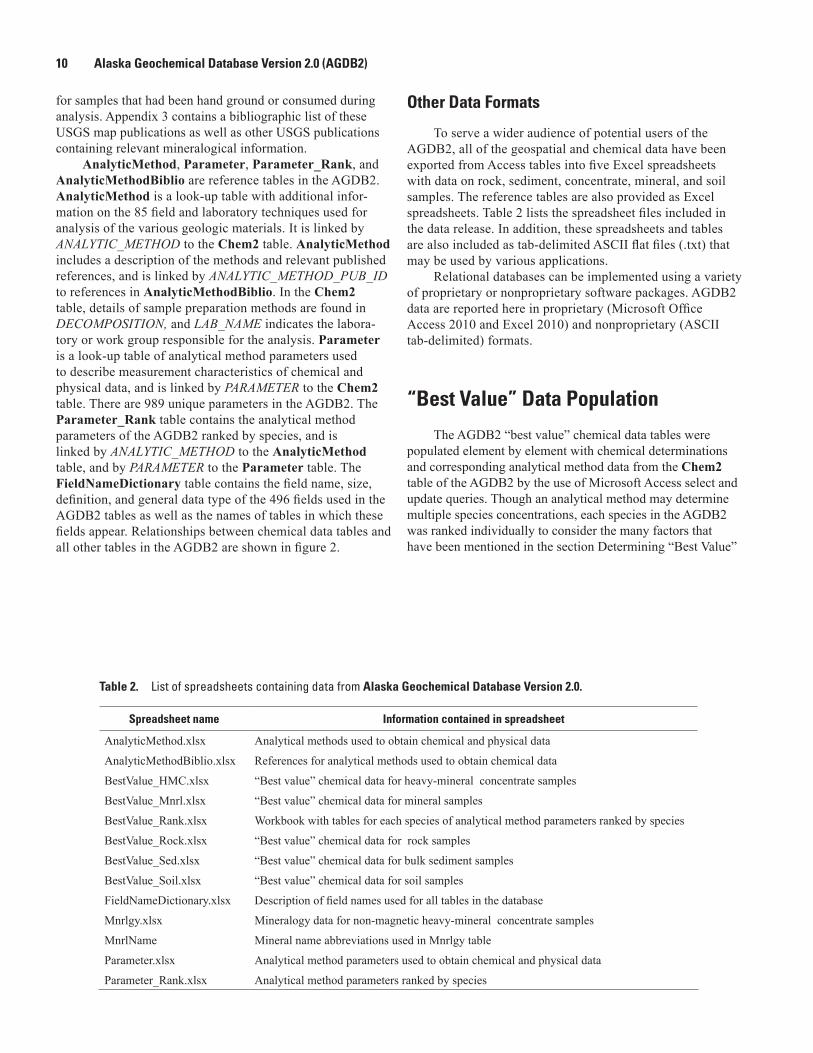
Table 2. List of spreadsheets containing data from Alaska Geochemical Database Version 2.0.
Spreadsheet name Information contained in spreadsheet
AnalyticMethod.xlsx Analytical methods used to obtain chemical and physical data
AnalyticMethodBiblio.xlsx References for analytical methods used to obtain chemical data
BestValue_HMC.xlsx “Best value” chemical data for heavy-mineral concentrate samples
BestValue_Mnrl.xlsx “Best value” chemical data for mineral samples
BestValue_Rank.xlsx Workbook with tables for each species of analytical method parameters ranked by species
BestValue_Rock.xlsx “Best value” chemical data for rock samples
BestValue_Sed.xlsx “Best value” chemical data for bulk sediment samples
BestValue_Soil.xlsx “Best value” chemical data for soil samples
FieldNameDictionary.xlsx Description of field names used for all tables in the database
Mnrlgy.xlsx Mineralogy data for non-magnetic heavy-mineral concentrate samples
MnrlName Mineral name abbreviations used in Mnrlgy table
Parameter.xlsx Analytical method parameters used to obtain chemical and physical data
Parameter_Rank.xlsx Analytical method parameters ranked by species
“Best Value” Data Population 11
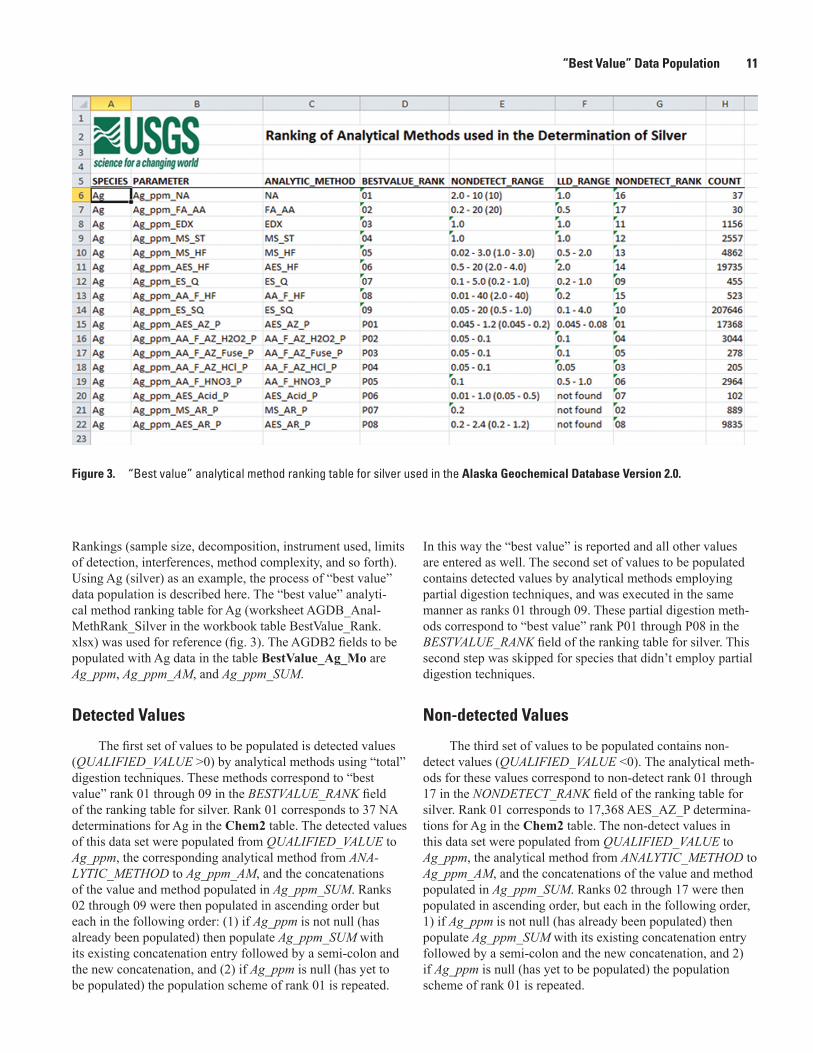
Rankings (sample size, decomposition, instrument used, limits of detection, interferences, method complexity, and so forth). Using Ag (silver) as an example, the process of “best value” data population is described here. The “best value” analyti-cal method ranking table for Ag (worksheet AGDB_Anal-MethRank_Silver in the workbook table BestValue_Rank.xlsx) was used for reference (fig. 3). The AGDB2 fields to be populated with Ag data in the table BestValue_Ag_Mo are Ag_ppm, Ag_ppm_AM, and Ag_ppm_SUM.
Detected Values
The first set of values to be populated is detected values (QUALIFIED_VALUE >0) by analytical methods using “total” digestion techniques. These methods correspond to “best value” rank 01 through 09 in the BESTVALUE_RANK field of the ranking table for silver. Rank 01 corresponds to 37 NA determinations for Ag in the Chem2 table. The detected values of this data set were populated from QUALIFIED_VALUE to Ag_ppm, the corresponding analytical method from ANA-LYTIC_METHOD to Ag_ppm_AM, and the concatenations of the value and method populated in Ag_ppm_SUM. Ranks 02 through 09 were then populated in ascending order but each in the following order: (1) if Ag_ppm is not null (has already been populated) then populate Ag_ppm_SUM with its existing concatenation entry followed by a semi-colon and the new concatenation, and (2) if Ag_ppm is null (has yet to be populated) the population scheme of rank 01 is repeated.
In this way the “best value” is reported and all other values are entered as well. The second set of values to be populated contains detected values by analytical methods employing partial digestion techniques, and was executed in the same manner as ranks 01 through 09. These partial digestion meth-ods correspond to “best value” rank P01 through P08 in the BESTVALUE_RANK field of the ranking table for silver. This second step was skipped for species that didn’t employ partial digestion techniques.
Non-detected Values
The third set of values to be populated contains non-detect values (QUALIFIED_VALUE <0). The analytical meth-ods for these values correspond to non-detect rank 01 through 17 in the NONDETECT_RANK field of the ranking table for silver. Rank 01 corresponds to 17,368 AES_AZ_P determina-tions for Ag in the Chem2 table. The non-detect values in this data set were populated from QUALIFIED_VALUE to Ag_ppm, the analytical method from ANALYTIC_METHOD to Ag_ppm_AM, and the concatenations of the value and method populated in Ag_ppm_SUM. Ranks 02 through 17 were then populated in ascending order, but each in the following order, 1) if Ag_ppm is not null (has already been populated) then populate Ag_ppm_SUM with its existing concatenation entry followed by a semi-colon and the new concatenation, and 2) if Ag_ppm is null (has yet to be populated) the population scheme of rank 01 is repeated.
Figure 3. “Best value” analytical method ranking table for silver used in the Alaska Geochemical Database Version 2.0.
12 Alaska Geochemical Database Version 2.0 (AGDB2)
AcknowledgmentsThe authors thank James G. Crock, Paul J. Lamothe, and
Richard M. O’Leary (U.S. Geological Survey, Emeriti), and Steven M. Smith (U.S. Geological Survey) for their advice and assistance in defining the “best value” geochemical data model. We also thank Dorothy M. Trujillo for her assistance in providing data from the NGDB, and many thanks go to Jill Schneider (U.S. Geological Survey) for making the Alaska Technical Data Unit so accessible. The authors acknowledge David B. Smith (U.S. Geological Survey), and Elizabeth A. Bailey and Carl C. Abston (U.S. Geological Survey, retired) for their early work on the Alaska Geochemical Database project. Their assistance and encouragement throughout the life of this project is much appreciated. The authors acknowl-edge Peter N. Schweitzer, J.G. Crock, P.J. Lamothe, and R.M. O’Leary for their technical review of the manuscript and database; their expertise and assistance were invaluable in improving the work.
References
Database References
Within the database, references are cited for analytical methods that were used to determine elemental concentrations in the chemical data tables. Information regarding the method of analysis or measurement used to obtain data is found in AnalyticMethodBiblio (table 1). Refer to the ANALYTIC_METHOD_PUB_ID—in most cases the USGS Library call number—when researching the analytical method in question.
References Cited
Anderson, E.D., Smith, S.M., Giles, S.A., Granitto, Matthew, Eppinger, R.G., Bedrosian, P.A., Shah, A.K., Kelley, K.D., Fey, D.L., Minsley, B.J., Brown, P.J., 2011, Geophysical and geochemical data from the area of the Pebble Cu-Au-Mo porphyry deposit, southwestern Alaska—Contributions to assessment techniques for concealed mineral resources: U.S. Geological Survey Data Series 608, 43-p. pamphlet, accessed July 27, 2012, at http://pubs.er.usgs.gov/publica-tion/ds608/.
Arbogast, B.F., 1990, Quality assurance manual for the Branch of Geochemistry, U.S. Geological Survey: U.S. Geological Survey Open-File Report 90–668, 184 p., accessed July 27, 2012, at http://pubs.usgs.gov/of/1990/0668/report.pdf
Arbogast, B.F., ed., 1996, Analytical methods manual for the Mineral Resource Surveys Program, U.S. Geological Survey: U.S. Geological Survey Open-File Report 96–525, 248 p., accessed July 27, 2012, at http://pubs.usgs.gov/of/1996/0525/report.pdf
Bailey, E.A., Lee, G.K., Mueller, S.H., Wang, Bronwen, Brown, Zoe Ann, and Beischer, G.A., 2007, Major and trace-element data from stream-sediment and rock samples collected in the Taylor Mountains 1:250,000-scale quad-rangle, Alaska: U.S. Geological Survey Open-File Report 2007–1196, 7- p. pamphlet, v. 1.1, accessed July 27, 2012, at http://pubs.usgs.gov/of/2007/1196/.
Bailey, E.A., Shew, N.E., Labay, K.A., Schmidt, J.M., O’Leary, R.M., and Detra, D.E., 2010, Stream-sediment samples reanalyzed for major, rare-earth, and trace elements from ten 1:250,000-scale quadrangles, south-central Alaska, 2007–2008: U.S. Geological Survey Open File Report 2010–1147, 6-p. pamphlet, accessed July 27, 2012, at http://pubs.usgs.gov/of/2010/1147/.
Bailey, E.A., Smith, D.B., Abston, C.C., Granitto, Matthew, and Burleigh, K.A., 1999, National Geochemical Database, U.S. Geological Survey RASS (Rock Analysis Storage Sys-tem) geochemical data for Alaska: U.S. Geological Survey Open-File Report 99–433, v. 2.0, accessed on July 27, 2012 at http://pubs.usgs.gov/of/1999/of99-433/
Fey, D.L., Granitto, Matthew, Giles, S.A., Smith, S.M., Eppinger, R.G. and Kelley, K.D., 2009, Geochemical data for samples collected in 2008 near the concealed Pebble porphyry Cu-Au-Mo deposit, southwest Alaska: U.S. Geological Survey Open-File Report 2009‒1239, 107-p. pamphlet, 2 plates, accessed July 27, 2012, at http://pubs.er.usgs.gov/publication/ofr20091239/. Superseded by U.S. Geological Survey Data Series 608, http://pubs.usgs.gov/ds/608/.
Fey, D.L., Granitto, Matthew, Giles, S.A., Smith, S.M., Eppinger, R.G. and Kelley, K.D., 2008, Geochemical data for samples collected in 2007 near the concealed Pebble porphyry Cu-Au-Mo deposit, southwest Alaska: U.S. Geological Survey Open-File Report 2008‒1132, 153-p. pamphlet, 1 plate, , accessed Jul. 27, 2012, at http://pubs.er.usgs.gov/publication/ofr20081132/. Superseded by Data Series 608, http://pubs.usgs.gov/ds/608/.
Gamble, B.M., Bailey, E.A., Schmidt, J.M., Shew, N.B., Labay, K.A., ,Granitto, Matthew, O’Leary, R.M., and Detra, D.E., 2010, Stream sediment samples reanalyzed for major, rare earth, and trace elements from seven 1:250,000-scale quadrangles, south central Alaska, 2007-2009: U.S. Geological Survey Data Series 532, 4-p. pamphlet, accessed on Jul. 27, 2012 at http://pubs.usgs.gov/ds/532/.
Granitto, Matthew, Bailey, E.A., Schmidt, J.M., Shew, N.B., Gamble, B.M. and Labay, K.A., 2011, Alaska Geo-chemical Database (AGDB)—Geochemical data for rock, sediment, soil, mineral, and concentrate sample media: U.S. Geological Survey Data Series 637, 11-p., accessed on July 27, 2012 at http://pubs.er.usgs.gov/publication/ds637/.
References 13
Granitto, Matthew; Schmidt, J.M., Labay, K.A., Shew, N.B., Gamble, B.M., 2012, Alaska Geochemical Database—Min-eral exploration tool for the 21st century—PDF of presenta-tion: U.S. Geological Survey Open-File Report 2012‒1060, 33-p. pamphlet, accessed on July 27, 2012 at http://pubs.usgs.gov/of/2012/1060/.
Klimasauskas, E.P., Miller, M.L., and Bradley, D.C., 2007, Major- and trace-element concentrations in rock samples collected in 2006 from the Taylor Mountains 1:250,000-scale quadrangle, Alaska: U.S. Geological Survey Open-File Report 2007–1386, 6-p. pamphlet, accessed July 27, 2012, at http://pubs.usgs.gov/of/2007/1386/.
Klimasauskas, E.P., Miller, M.L., Bradley, D.C., Bundtzen, T.K., and Hudson, T.L., 2006, Major- and trace-element concentrations in rock samples collected in 2005 from the Taylor Mountains 1:250,000-scale quadrangle, Alaska: U.S. Geological Survey Open-File Report 2006–1306, 8-p. pamphlet, accessed July 27, 2012, at http://pubs.usgs.gov/of/2006/1306/.
Klimasauskas, E.P., Miller, M.L., Bradley, D.C., Karl, S.M., Baichtal, J.F., and Blodgett, R.B., 2006, Major- and trace-element concentrations in rock samples collected in 2004 from the Taylor Mountains 1:250,000-scale quad-rangle, Alaska: U.S. Geological Survey Open-File Report 2006–1070, 8-p. pamphlet, v. 1.1, accessed July 27, 2012, at http://pubs.usgs.gov/of/2006/1070/.
Miesch, A.T., 1976, Sampling designs for geochemical sur-veys—Syllabus for a short course: U.S. Geological Survey Open-File Report 76–772, 128 p., accessed July 27, 2012, at http://pubs.er.usgs.gov/publication/ofr76772.
Smith, S.M., 1997, National Geochemical Database reformat-ted data from the National Uranium Resource Evaluation (NURE) Hydrogeochemical and Stream Sediment Recon-naissance (HSSR) Program: U.S. Geological Survey Open-File Report 97–492, v. 1.4, accessed Jan. 27, 2011, at http://pubs.usgs.gov/of/1997/ofr-97-0492/.
Smith, S.M., Smith, D.B., and Bailey, E.A., 2003, The U.S. Geological Survey’s National Geochemical Database [abs.]: Geological Society of America Abstracts with Program, v. 35, no. 7, p. 366.
Taggart, J.E., ed., 2002, Analytical methods for chemical analysis of geologic and other materials, U.S. Geological Survey: U.S. Geological Survey Open-File Report 2002–0223, v. 5.0, accessed July 27, 2012, at http://pubs.usgs.gov/of/2002/ofr-02-0223/.
Taggart, J.E., Lindsay, J.R., Scott, B.A., Vivit, D.V., Bartel, A.J., and Stewart, K.C., 1987, Analysis of geologic materi-als by wavelength-dispersive X-ray fluorescence spectrom-etry, in Methods for geochemical analysis: U.S. Geological Survey Bulletin 1770-E, E1‒E19, accessed Aug. 13, 2012 at http://pubs.er.usgs.gov/publication/b1770.
U.S. Geological Survey, 2004, The National Geochemical Survey, database and documentation: U.S. Geological Sur-vey Open-File Report 2004–1001, v. 5.0, accessed July 27, 2012, at http://pubs.usgs.gov/of/2004/1001/.
Publishing support provided by: Denver Publishing Service Center
For more information concerning this publication, contact:Center Director, USGS Central Mineral and Environmental Resources
Science Center
Box 25046, Mail Stop 973Denver, CO 80225(303) 236-1562
Or visit the Central Mineral and Environmental Resources Science Center Web site at:
http://minerals.cr.usgs.gov/
14 Alaska Geochemical Database Version 2.0 (AGDB2)
Appendix 1
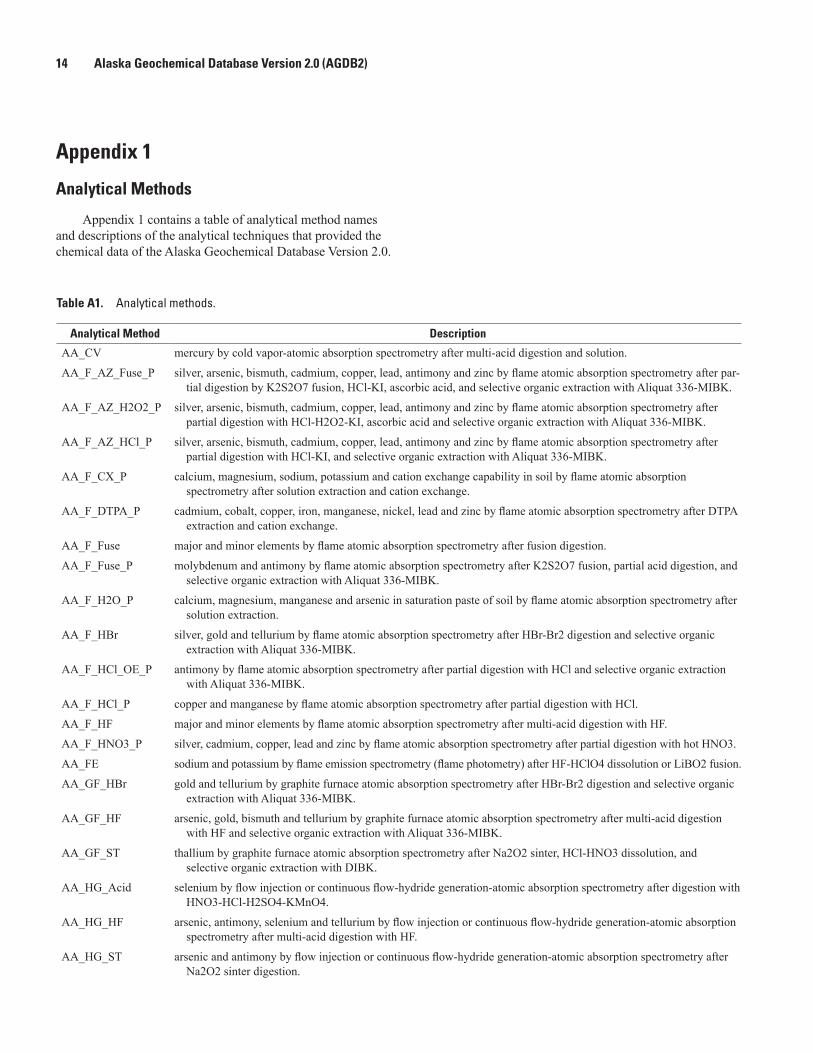
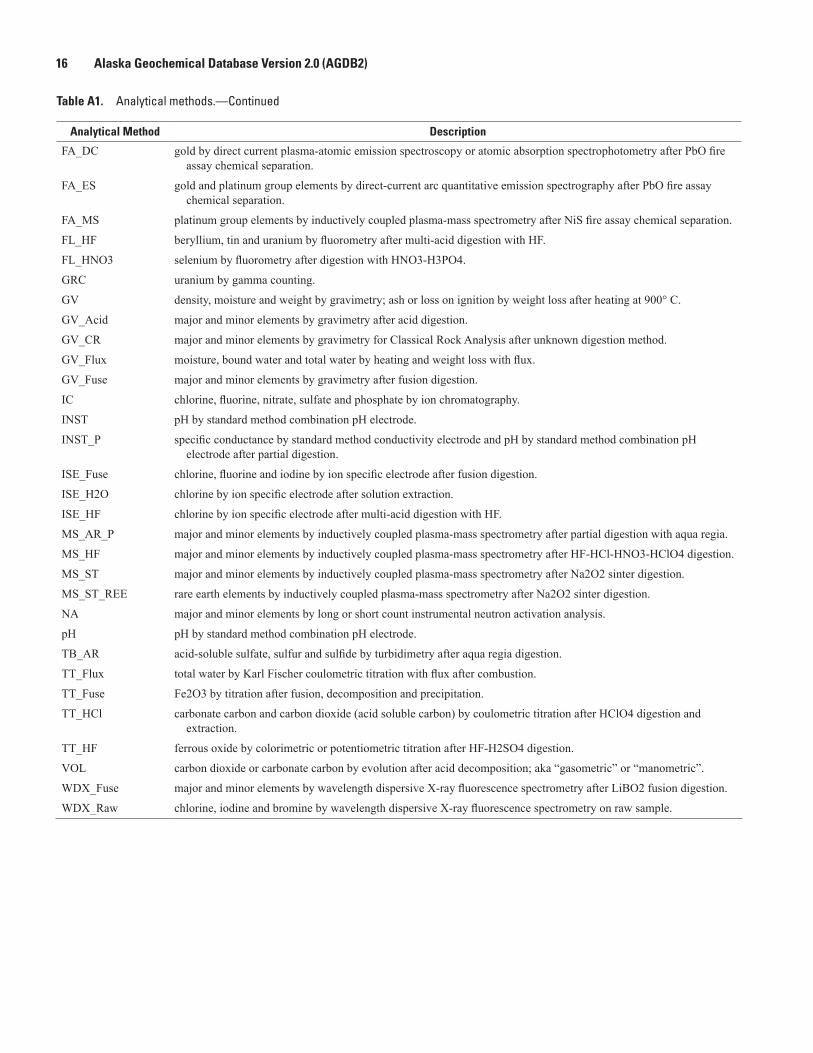
Analytical Methods
Appendix 1 contains a table of analytical method names and descriptions of the analytical techniques that provided the chemical data of the Alaska Geochemical Database Version 2.0.
Table A1. Analytical methods.—Continued
Analytical Method Description
AA_CV mercury by cold vapor-atomic absorption spectrometry after multi-acid digestion and solution.
AA_F_AZ_Fuse_P silver, arsenic, bismuth, cadmium, copper, lead, antimony and zinc by flame atomic absorption spectrometry after par-tial digestion by K2S2O7 fusion, HCl-KI, ascorbic acid, and selective organic extraction with Aliquat 336-MIBK.
AA_F_AZ_H2O2_P silver, arsenic, bismuth, cadmium, copper, lead, antimony and zinc by flame atomic absorption spectrometry after partial digestion with HCl-H2O2-KI, ascorbic acid and selective organic extraction with Aliquat 336-MIBK.
AA_F_AZ_HCl_P silver, arsenic, bismuth, cadmium, copper, lead, antimony and zinc by flame atomic absorption spectrometry after partial digestion with HCl-KI, and selective organic extraction with Aliquat 336-MIBK.
AA_F_CX_P calcium, magnesium, sodium, potassium and cation exchange capability in soil by flame atomic absorption spectrometry after solution extraction and cation exchange.
AA_F_DTPA_P cadmium, cobalt, copper, iron, manganese, nickel, lead and zinc by flame atomic absorption spectrometry after DTPA extraction and cation exchange.
AA_F_Fuse major and minor elements by flame atomic absorption spectrometry after fusion digestion.
AA_F_Fuse_P molybdenum and antimony by flame atomic absorption spectrometry after K2S2O7 fusion, partial acid digestion, and selective organic extraction with Aliquat 336-MIBK.
AA_F_H2O_P calcium, magnesium, manganese and arsenic in saturation paste of soil by flame atomic absorption spectrometry after solution extraction.
AA_F_HBr silver, gold and tellurium by flame atomic absorption spectrometry after HBr-Br2 digestion and selective organic extraction with Aliquat 336-MIBK.
AA_F_HCl_OE_P antimony by flame atomic absorption spectrometry after partial digestion with HCl and selective organic extraction with Aliquat 336-MIBK.
AA_F_HCl_P copper and manganese by flame atomic absorption spectrometry after partial digestion with HCl.
AA_F_HF major and minor elements by flame atomic absorption spectrometry after multi-acid digestion with HF.
AA_F_HNO3_P silver, cadmium, copper, lead and zinc by flame atomic absorption spectrometry after partial digestion with hot HNO3.
AA_FE sodium and potassium by flame emission spectrometry (flame photometry) after HF-HClO4 dissolution or LiBO2 fusion.
AA_GF_HBr gold and tellurium by graphite furnace atomic absorption spectrometry after HBr-Br2 digestion and selective organic extraction with Aliquat 336-MIBK.
AA_GF_HF arsenic, gold, bismuth and tellurium by graphite furnace atomic absorption spectrometry after multi-acid digestion with HF and selective organic extraction with Aliquat 336-MIBK.
AA_GF_ST thallium by graphite furnace atomic absorption spectrometry after Na2O2 sinter, HCl-HNO3 dissolution, and selective organic extraction with DIBK.
AA_HG_Acid selenium by flow injection or continuous flow-hydride generation-atomic absorption spectrometry after digestion with HNO3-HCl-H2SO4-KMnO4.
AA_HG_HF arsenic, antimony, selenium and tellurium by flow injection or continuous flow-hydride generation-atomic absorption spectrometry after multi-acid digestion with HF.
AA_HG_ST arsenic and antimony by flow injection or continuous flow-hydride generation-atomic absorption spectrometry after Na2O2 sinter digestion.
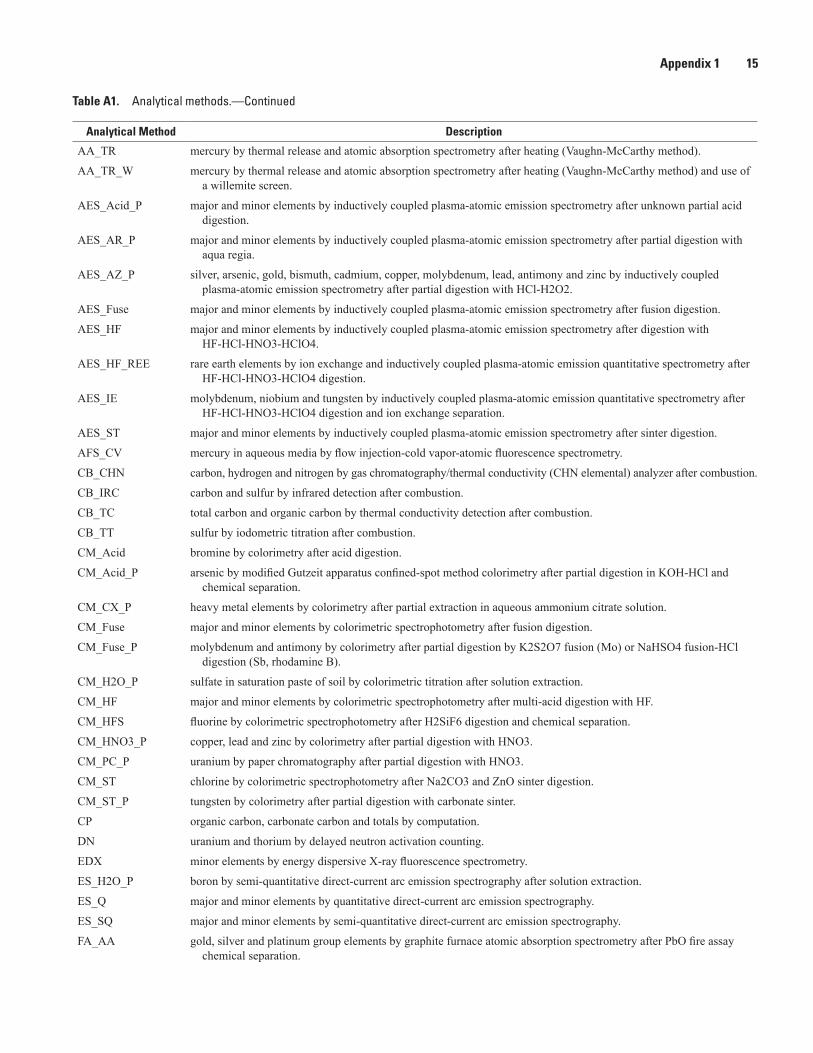
Appendix 1 15
Table A1. Analytical methods.—Continued
Analytical Method Description
AA_TR mercury by thermal release and atomic absorption spectrometry after heating (Vaughn-McCarthy method).
AA_TR_W mercury by thermal release and atomic absorption spectrometry after heating (Vaughn-McCarthy method) and use of a willemite screen.
AES_Acid_P major and minor elements by inductively coupled plasma-atomic emission spectrometry after unknown partial acid digestion.
AES_AR_P major and minor elements by inductively coupled plasma-atomic emission spectrometry after partial digestion with aqua regia.
AES_AZ_P silver, arsenic, gold, bismuth, cadmium, copper, molybdenum, lead, antimony and zinc by inductively coupled plasma-atomic emission spectrometry after partial digestion with HCl-H2O2.
AES_Fuse major and minor elements by inductively coupled plasma-atomic emission spectrometry after fusion digestion.
AES_HF major and minor elements by inductively coupled plasma-atomic emission spectrometry after digestion with HF-HCl-HNO3-HClO4.
AES_HF_REE rare earth elements by ion exchange and inductively coupled plasma-atomic emission quantitative spectrometry after HF-HCl-HNO3-HClO4 digestion.
AES_IE molybdenum, niobium and tungsten by inductively coupled plasma-atomic emission quantitative spectrometry after HF-HCl-HNO3-HClO4 digestion and ion exchange separation.
AES_ST major and minor elements by inductively coupled plasma-atomic emission spectrometry after sinter digestion.
AFS_CV mercury in aqueous media by flow injection-cold vapor-atomic fluorescence spectrometry.
CB_CHN carbon, hydrogen and nitrogen by gas chromatography/thermal conductivity (CHN elemental) analyzer after combustion.
CB_IRC carbon and sulfur by infrared detection after combustion.
CB_TC total carbon and organic carbon by thermal conductivity detection after combustion.
CB_TT sulfur by iodometric titration after combustion.
CM_Acid bromine by colorimetry after acid digestion.
CM_Acid_P arsenic by modified Gutzeit apparatus confined-spot method colorimetry after partial digestion in KOH-HCl and chemical separation.
CM_CX_P heavy metal elements by colorimetry after partial extraction in aqueous ammonium citrate solution.
CM_Fuse major and minor elements by colorimetric spectrophotometry after fusion digestion.
CM_Fuse_P molybdenum and antimony by colorimetry after partial digestion by K2S2O7 fusion (Mo) or NaHSO4 fusion-HCl digestion (Sb, rhodamine B).
CM_H2O_P sulfate in saturation paste of soil by colorimetric titration after solution extraction.
CM_HF major and minor elements by colorimetric spectrophotometry after multi-acid digestion with HF.
CM_HFS fluorine by colorimetric spectrophotometry after H2SiF6 digestion and chemical separation.
CM_HNO3_P copper, lead and zinc by colorimetry after partial digestion with HNO3.
CM_PC_P uranium by paper chromatography after partial digestion with HNO3.
CM_ST chlorine by colorimetric spectrophotometry after Na2CO3 and ZnO sinter digestion.
CM_ST_P tungsten by colorimetry after partial digestion with carbonate sinter.
CP organic carbon, carbonate carbon and totals by computation.
DN uranium and thorium by delayed neutron activation counting.
EDX minor elements by energy dispersive X-ray fluorescence spectrometry.
ES_H2O_P boron by semi-quantitative direct-current arc emission spectrography after solution extraction.
ES_Q major and minor elements by quantitative direct-current arc emission spectrography.
ES_SQ major and minor elements by semi-quantitative direct-current arc emission spectrography.
FA_AA gold, silver and platinum group elements by graphite furnace atomic absorption spectrometry after PbO fire assay chemical separation.
16 Alaska Geochemical Database Version 2.0 (AGDB2)
Table A1. Analytical methods.—Continued
Analytical Method Description
FA_DC gold by direct current plasma-atomic emission spectroscopy or atomic absorption spectrophotometry after PbO fire assay chemical separation.
FA_ES gold and platinum group elements by direct-current arc quantitative emission spectrography after PbO fire assay chemical separation.
FA_MS platinum group elements by inductively coupled plasma-mass spectrometry after NiS fire assay chemical separation.
FL_HF beryllium, tin and uranium by fluorometry after multi-acid digestion with HF.
FL_HNO3 selenium by fluorometry after digestion with HNO3-H3PO4.
GRC uranium by gamma counting.
GV density, moisture and weight by gravimetry; ash or loss on ignition by weight loss after heating at 900° C.
GV_Acid major and minor elements by gravimetry after acid digestion.
GV_CR major and minor elements by gravimetry for Classical Rock Analysis after unknown digestion method.
GV_Flux moisture, bound water and total water by heating and weight loss with flux.
GV_Fuse major and minor elements by gravimetry after fusion digestion.
IC chlorine, fluorine, nitrate, sulfate and phosphate by ion chromatography.
INST pH by standard method combination pH electrode.
INST_P specific conductance by standard method conductivity electrode and pH by standard method combination pH electrode after partial digestion.
ISE_Fuse chlorine, fluorine and iodine by ion specific electrode after fusion digestion.
ISE_H2O chlorine by ion specific electrode after solution extraction.
ISE_HF chlorine by ion specific electrode after multi-acid digestion with HF.
MS_AR_P major and minor elements by inductively coupled plasma-mass spectrometry after partial digestion with aqua regia.
MS_HF major and minor elements by inductively coupled plasma-mass spectrometry after HF-HCl-HNO3-HClO4 digestion.
MS_ST major and minor elements by inductively coupled plasma-mass spectrometry after Na2O2 sinter digestion.
MS_ST_REE rare earth elements by inductively coupled plasma-mass spectrometry after Na2O2 sinter digestion.
NA major and minor elements by long or short count instrumental neutron activation analysis.
pH pH by standard method combination pH electrode.
TB_AR acid-soluble sulfate, sulfur and sulfide by turbidimetry after aqua regia digestion.
TT_Flux total water by Karl Fischer coulometric titration with flux after combustion.
TT_Fuse Fe2O3 by titration after fusion, decomposition and precipitation.
TT_HCl carbonate carbon and carbon dioxide (acid soluble carbon) by coulometric titration after HClO4 digestion and extraction.
TT_HF ferrous oxide by colorimetric or potentiometric titration after HF-H2SO4 digestion.
VOL carbon dioxide or carbonate carbon by evolution after acid decomposition; aka “gasometric” or “manometric”.
WDX_Fuse major and minor elements by wavelength dispersive X-ray fluorescence spectrometry after LiBO2 fusion digestion.
WDX_Raw chlorine, iodine and bromine by wavelength dispersive X-ray fluorescence spectrometry on raw sample.
Appendix 2 17
Appendix 2
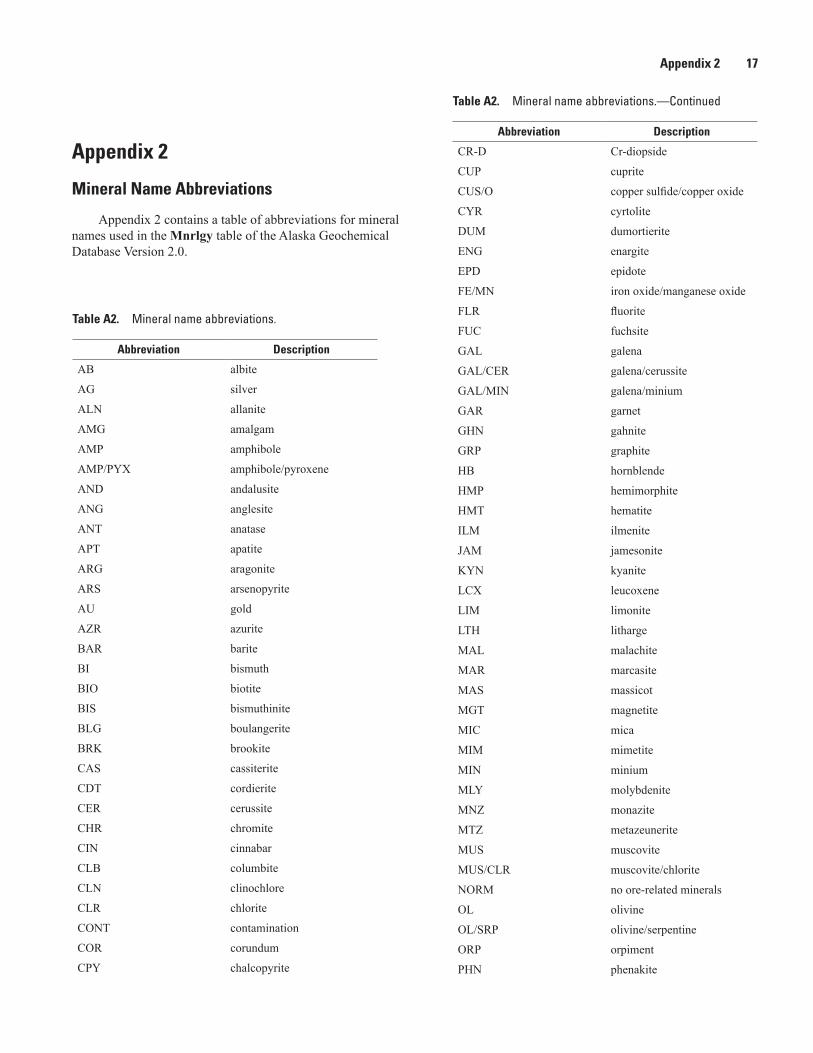
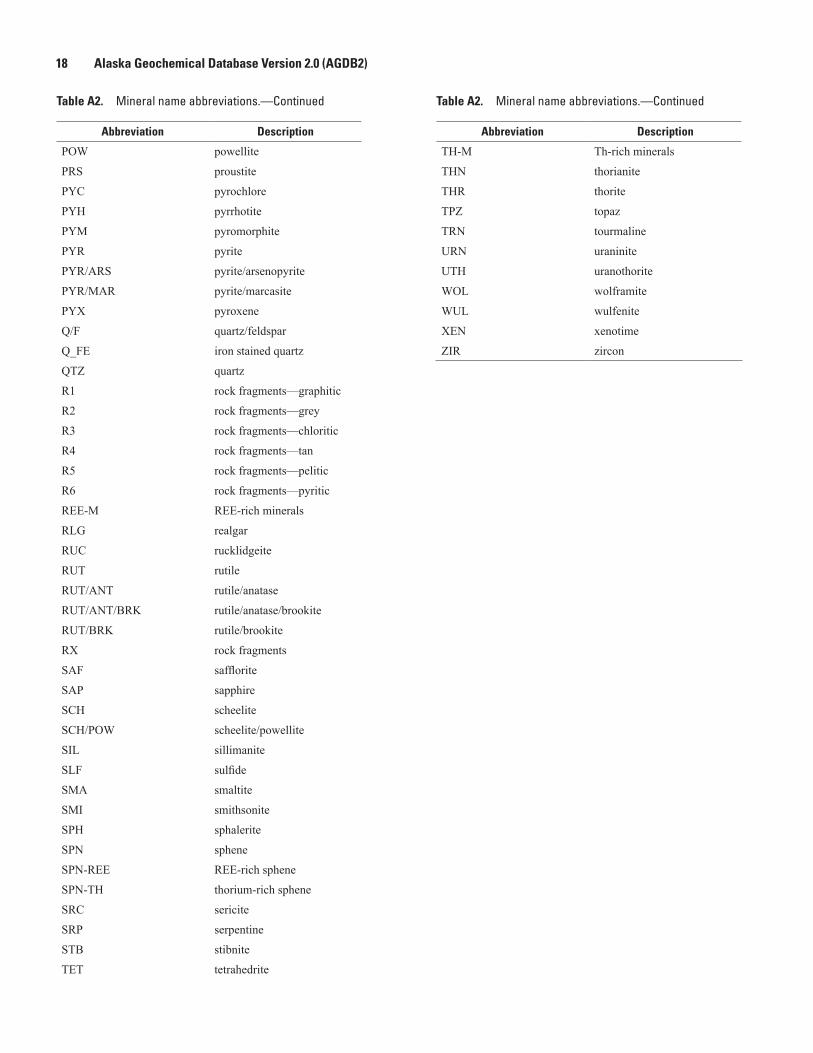
Mineral Name Abbreviations
Appendix 2 contains a table of abbreviations for mineral names used in the Mnrlgy table of the Alaska Geochemical Database Version 2.0.
Table A2. Mineral name abbreviations.—Continued
Abbreviation Description
AB albite
AG silver
ALN allanite
AMG amalgam
AMP amphibole
AMP/PYX amphibole/pyroxene
AND andalusite
ANG anglesite
ANT anatase
APT apatite
ARG aragonite
ARS arsenopyrite
AU gold
AZR azurite
BAR barite
BI bismuth
BIO biotite
BIS bismuthinite
BLG boulangerite
BRK brookite
CAS cassiterite
CDT cordierite
CER cerussite
CHR chromite
CIN cinnabar
CLB columbite
CLN clinochlore
CLR chlorite
CONT contamination
COR corundum
CPY chalcopyrite
Table A2. Mineral name abbreviations.—Continued
Abbreviation Description
CR-D Cr-diopside
CUP cuprite
CUS/O copper sulfide/copper oxide
CYR cyrtolite
DUM dumortierite
ENG enargite
EPD epidote
FE/MN iron oxide/manganese oxide
FLR fluorite
FUC fuchsite
GAL galena
GAL/CER galena/cerussite
GAL/MIN galena/minium
GAR garnet
GHN gahnite
GRP graphite
HB hornblende
HMP hemimorphite
HMT hematite
ILM ilmenite
JAM jamesonite
KYN kyanite
LCX leucoxene
LIM limonite
LTH litharge
MAL malachite
MAR marcasite
MAS massicot
MGT magnetite
MIC mica
MIM mimetite
MIN minium
MLY molybdenite
MNZ monazite
MTZ metazeunerite
MUS muscovite
MUS/CLR muscovite/chlorite
NORM no ore-related minerals
OL olivine
OL/SRP olivine/serpentine
ORP orpiment
PHN phenakite
18 Alaska Geochemical Database Version 2.0 (AGDB2)
Table A2. Mineral name abbreviations.—Continued
Abbreviation Description
POW powellite
PRS proustite
PYC pyrochlore
PYH pyrrhotite
PYM pyromorphite
PYR pyrite
PYR/ARS pyrite/arsenopyrite
PYR/MAR pyrite/marcasite
PYX pyroxene
Q/F quartz/feldspar
Q_FE iron stained quartz
QTZ quartz
R1 rock fragments—graphitic
R2 rock fragments—grey
R3 rock fragments—chloritic
R4 rock fragments—tan
R5 rock fragments—pelitic
R6 rock fragments—pyritic
REE-M REE-rich minerals
RLG realgar
RUC rucklidgeite
RUT rutile
RUT/ANT rutile/anatase
RUT/ANT/BRK rutile/anatase/brookite
RUT/BRK rutile/brookite
RX rock fragments
SAF safflorite
SAP sapphire
SCH scheelite
SCH/POW scheelite/powellite
SIL sillimanite
SLF sulfide
SMA smaltite
SMI smithsonite
SPH sphalerite
SPN sphene
SPN-REE REE-rich sphene
SPN-TH thorium-rich sphene
SRC sericite
SRP serpentine
STB stibnite
TET tetrahedrite
Table A2. Mineral name abbreviations.—Continued
Abbreviation Description
TH-M Th-rich minerals
THN thorianite
THR thorite
TPZ topaz
TRN tourmaline
URN uraninite
UTH uranothorite
WOL wolframite
WUL wulfenite
XEN xenotime
ZIR zircon
Appendix 3 19
Appendix 3
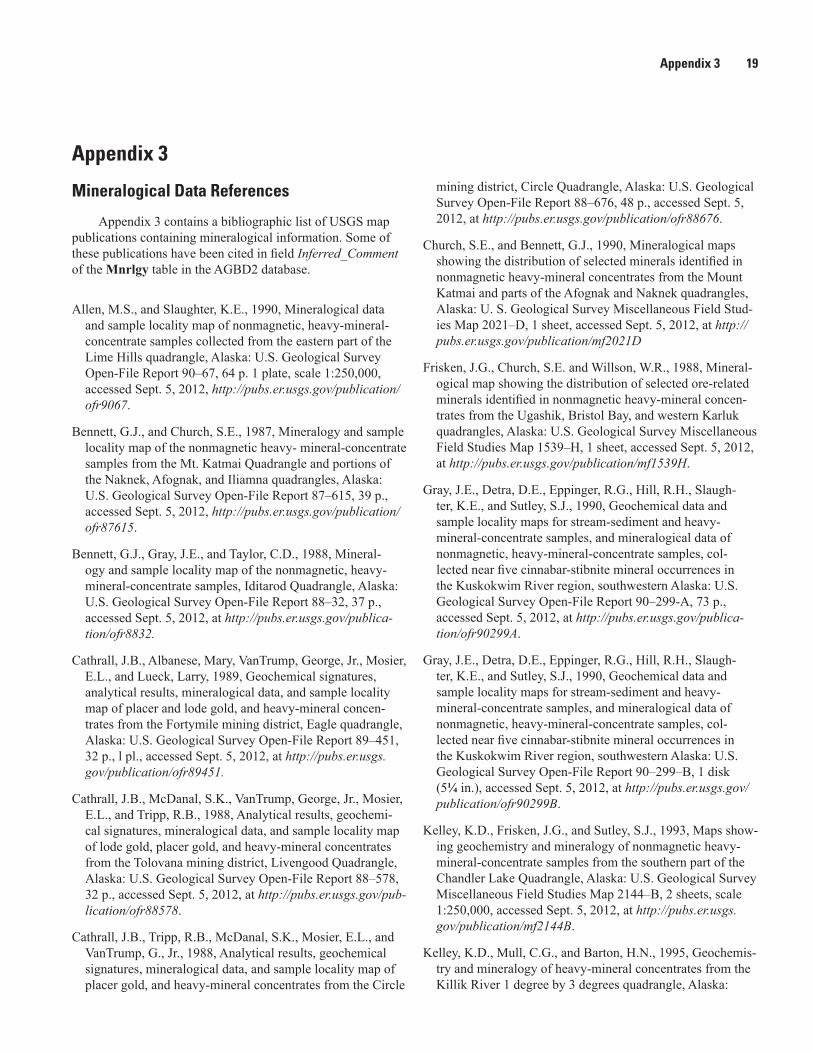
Mineralogical Data References
Appendix 3 contains a bibliographic list of USGS map publications containing mineralogical information. Some of these publications have been cited in field Inferred_Comment of the Mnrlgy table in the AGBD2 database.
Allen, M.S., and Slaughter, K.E., 1990, Mineralogical data and sample locality map of nonmagnetic, heavy-mineral-concentrate samples collected from the eastern part of the Lime Hills quadrangle, Alaska: U.S. Geological Survey Open-File Report 90–67, 64 p. 1 plate, scale 1:250,000, accessed Sept. 5, 2012, http://pubs.er.usgs.gov/publication/ofr9067.
Bennett, G.J., and Church, S.E., 1987, Mineralogy and sample locality map of the nonmagnetic heavy- mineral-concentrate samples from the Mt. Katmai Quadrangle and portions of the Naknek, Afognak, and Iliamna quadrangles, Alaska: U.S. Geological Survey Open-File Report 87‒615, 39 p., accessed Sept. 5, 2012, http://pubs.er.usgs.gov/publication/ofr87615.
Bennett, G.J., Gray, J.E., and Taylor, C.D., 1988, Mineral-ogy and sample locality map of the nonmagnetic, heavy-mineral-concentrate samples, Iditarod Quadrangle, Alaska: U.S. Geological Survey Open-File Report 88‒32, 37 p., accessed Sept. 5, 2012, at http://pubs.er.usgs.gov/publica-tion/ofr8832.
Cathrall, J.B., Albanese, Mary, VanTrump, George, Jr., Mosier, E.L., and Lueck, Larry, 1989, Geochemical signatures, analytical results, mineralogical data, and sample locality map of placer and lode gold, and heavy-mineral concen-trates from the Fortymile mining district, Eagle quadrangle, Alaska: U.S. Geological Survey Open-File Report 89‒451, 32 p., l pl., accessed Sept. 5, 2012, at http://pubs.er.usgs.gov/publication/ofr89451.
Cathrall, J.B., McDanal, S.K., VanTrump, George, Jr., Mosier, E.L., and Tripp, R.B., 1988, Analytical results, geochemi-cal signatures, mineralogical data, and sample locality map of lode gold, placer gold, and heavy-mineral concentrates from the Tolovana mining district, Livengood Quadrangle, Alaska: U.S. Geological Survey Open-File Report 88‒578, 32 p., accessed Sept. 5, 2012, at http://pubs.er.usgs.gov/pub-lication/ofr88578.
Cathrall, J.B., Tripp, R.B., McDanal, S.K., Mosier, E.L., and VanTrump, G., Jr., 1988, Analytical results, geochemical signatures, mineralogical data, and sample locality map of placer gold, and heavy-mineral concentrates from the Circle
mining district, Circle Quadrangle, Alaska: U.S. Geological Survey Open-File Report 88‒676, 48 p., accessed Sept. 5, 2012, at http://pubs.er.usgs.gov/publication/ofr88676.
Church, S.E., and Bennett, G.J., 1990, Mineralogical maps showing the distribution of selected minerals identified in nonmagnetic heavy-mineral concentrates from the Mount Katmai and parts of the Afognak and Naknek quadrangles, Alaska: U. S. Geological Survey Miscellaneous Field Stud-ies Map 2021‒D, 1 sheet, accessed Sept. 5, 2012, at http://pubs.er.usgs.gov/publication/mf2021D
Frisken, J.G., Church, S.E. and Willson, W.R., 1988, Mineral-ogical map showing the distribution of selected ore-related minerals identified in nonmagnetic heavy-mineral concen-trates from the Ugashik, Bristol Bay, and western Karluk quadrangles, Alaska: U.S. Geological Survey Miscellaneous Field Studies Map 1539‒H, 1 sheet, accessed Sept. 5, 2012, at http://pubs.er.usgs.gov/publication/mf1539H.
Gray, J.E., Detra, D.E., Eppinger, R.G., Hill, R.H., Slaugh-ter, K.E., and Sutley, S.J., 1990, Geochemical data and sample locality maps for stream-sediment and heavy-mineral-concentrate samples, and mineralogical data of nonmagnetic, heavy-mineral-concentrate samples, col-lected near five cinnabar-stibnite mineral occurrences in the Kuskokwim River region, southwestern Alaska: U.S. Geological Survey Open-File Report 90‒299-A, 73 p., accessed Sept. 5, 2012, at http://pubs.er.usgs.gov/publica-tion/ofr90299A.
Gray, J.E., Detra, D.E., Eppinger, R.G., Hill, R.H., Slaugh-ter, K.E., and Sutley, S.J., 1990, Geochemical data and sample locality maps for stream-sediment and heavy-mineral-concentrate samples, and mineralogical data of nonmagnetic, heavy-mineral-concentrate samples, col-lected near five cinnabar-stibnite mineral occurrences in the Kuskokwim River region, southwestern Alaska: U.S. Geological Survey Open-File Report 90‒299‒B, 1 disk (5¼ in.), accessed Sept. 5, 2012, at http://pubs.er.usgs.gov/publication/ofr90299B.
Kelley, K.D., Frisken, J.G., and Sutley, S.J., 1993, Maps show-ing geochemistry and mineralogy of nonmagnetic heavy-mineral-concentrate samples from the southern part of the Chandler Lake Quadrangle, Alaska: U.S. Geological Survey Miscellaneous Field Studies Map 2144‒B, 2 sheets, scale 1:250,000, accessed Sept. 5, 2012, at http://pubs.er.usgs.gov/publication/mf2144B.
Kelley, K.D., Mull, C.G., and Barton, H.N., 1995, Geochemis-try and mineralogy of heavy-mineral concentrates from the Killik River 1 degree by 3 degrees quadrangle, Alaska:
20 Alaska Geochemical Database Version 2.0 (AGDB2)
U.S. Geological Survey Miscellaneous Field Studies Map 2225‒D, 2 sheets, scale 1:250,000, accessed Sept. 5, 2012, at http://pubs.er.usgs.gov/publication/mf2225D.
King, H.D., Smith, S.C., and Werschky, Scott, 1989, Min-eralogical maps showing the distribution and abundance of selected minerals in nonmagnetic heavy-mineral-concentrate samples from stream sediment, Solomon and Bendeleben 1 degree by 3 degrees quadrangles, Seward Peninsula, Alaska: U.S. Geological Survey Miscellaneous Field Studies Map 2071‒C, 4-p. pamphlet, 1 sheet, scale 1:250,000, accessed Sept. 5, 2012, at http://pubs.er.usgs.gov/publication/mf2071C.
McDanal, S.K., Cathrall, J.B., Mosier, E.L., Antweiler, J.C., and Tripp, R.B., 1988, Analytical results, geochemical signatures, mineralogical data, and sample locality map of placer gold and heavy-mineral concentrates from the Manley Hot Springs, Tofty, Eureka, and Rampart min-ing districts, Tanana and Livengood quadrangles, Alaska: U.S. Geological Survey Open-File Report 88‒443, 54 p., accessed Sept. 5, 2012, at http://pubs.er.usgs.gov/publication/ofr88443.
Tripp, R.B., and Cathrall, J.B., 1983, Mineralogical map showing the distribution of selected minerals in nonmag-netic fraction of heavy-mineral concentrates from stream sediments, Petersburg area, Southeast Alaska: U.S. Geo-logical Survey Open-File Report 83‒420‒X, 1 sheet, scale 1:250,000, accessed Sept. 5, 2012, at http://pubs.er.usgs.gov/publication/ofr83420X.
Tripp, R.B., and Crim, W.D., 1978, Mineralogical map showing the distribution and abundance of gold, scheelite, chalcopyrite, arsenopyrite, minium and sapphire corundum in heavy-mineral concentrates in the Seward and Bly-ing Sound quadrangles, Alaska: U.S. Geological Survey Miscellaneous Field Studies Map 880‒G, 2 sheets, scale 1:250,000, accessed Sept. 6, 2012, at http://pubs.er.usgs.gov/publication/mf880G.
Tripp, R.B., Crim, W.D., Hoffman, J.D., O’Leary, R.M., and Risoli, D.A., 1986, Mineralogical and geochemical maps showing the distribution of selected minerals and elements found in the minus-80-mesh stream-sediment and related minus-30-mesh heavy-mineral-concentrate samples from the Circle quadrangle, Alaska: U.S. Geological Survey Open-File Report 83‒170‒F, 7-p. pamphlet,6 sheets, scale 1:250,000, accessed Sept. 5, 2012, at http://pubs.er.usgs.gov/publication/ofr83170F.
Tripp, R.B., Curtin, G.C., Day, G.W., O’Leary, R.M., and Carten, R.B., 1976, Maps showing mineralogical and geochemical data for heavy-mineral concentrates in the Tanacross quadrangle, Alaska: U.S. Geological Survey Miscellaneous Field Studies Map 767‒O, 2 sheets, scale 1:500,000, accessed Sept. 6, 2012, at http://pubs.er.usgs.gov/publication/mf767O.
Tripp, R.B., Curtin, G.C., Nokleberg, W.J., Huston, D.L., and Hampton, J.R., 1993, Mineralogical maps showing distribu-tion of selected ore-related minerals in the nonmagnetic, heavy-mineral-concentrate fraction of stream sediment from the Mount Hayes 1 degree by 3 degrees quadrangle, eastern Alaska Range, Alaska: U.S. Geological Survey Miscella-neous Field Studies Map 1996‒E, 13-p. pamphlet, 3 sheets, scale 1:250,000, accessed Sept. 6, 2012, at http://pubs.er.usgs.gov/publication/mf1996E.
Tripp, R.B., and Detra, D.E., 1980, Maps showing mineralogic data for selected minerals in nonmagnetic heavy-mineral concentrates of stream sediments in the Chignik and Sut-wik Island quadrangles, Alaska: U.S. Geological Survey Miscellaneous Field Studies Map 1053‒I, 2 sheets, scale 1:250,000, accessed Sept. 5, 2012, at http://pubs.er.usgs.gov/publication/mf1053I.
Tripp, R.B., Carlson, R.C., and Curtin, G.C., 1978, Maps showing mineralogical data for nonmagnetic heavy-mineral concentrates in the Talkeetna Quadrangle, Alaska: U.S. Geological Survey Miscellaneous Field Studies Map 870‒I, 1 sheet, scale 1:250,000, accessed Sept. 6, 2012, at http://pubs.er.usgs.gov/publication/mf870I.
Tripp, R.B., and King, H.D., 1993, Maps showing distribu-tion of selected minerals in the nonmagnetic heavy-mineral fraction of stream-sediment samples, Medfra Quadrangle, Alaska: U.S. Geological Survey Miscellaneous Field Stud-ies Map 2207, 1 sheet, scale, 1:250,000, accessed Sept. 6, 2012, at http://pubs.er.usgs.gov/publication/mf2207.
Tripp, R.B., King, H.D., and Light, T.D., 1995, Mineralogical maps showing the distribution of ore-related minerals in the minus-30-mesh, nonmagnetic heavy-mineral fraction of stream sediment, Healy quadrangle, Alaska: U.S. Geologi-cal Survey Miscellaneous Field Studies Map 2058‒D, 2 sheets, scale, 1:250,000, accessed Sept. 6, 2012, at http://pubs.er.usgs.gov/publication/mf2058D.
Granitto and others—A
laska Geochem
ical Database Version 2.0 (A
GD
B2)—
Data Series 759