Embed Size (px)
Citation preview
STATE OF ALASKA
K e i t h H. M i l l e r - Governor
DEPARTMENT OF NATURAL RESOURCES
Thomas E. K e l l y - Commissioner
DIVISION OF M I N E S AND GEOLOGY
James A. N i l l i a m s - D i r e c t o r
GEOLOGIC REPORT NO. 33
Geolog ica l and Geochemical Study, Solomon C - 5 Quadrangle, Seward Peninsula, A laska
R. R. Asher
A p r i l 1969

C O N T E N T S
Page
ABSTRACT
. . . . . . . . . . . . . . . . . . . . . . . . . . . . . . INTRODUCTION Purposeandscope . . . . . . . . . . . . . . . . . . . . . . . . .
. . . . . . . . . . . . . . . . . Locat ion. Access. and Popu la t ion . . . . . . . . . . . . . . . . . . . . . . Cl imate and Vegetat ion . . . . . . . . . . . . . . . . . . . . . . Topography and Drainage . . . . . . . . . . . . . . . . . . . . . . . . . . . . . . H i s t o r y P l a c e r M i n i n g . . . . . . . . . . . . . . . . . . . . . . . . . . . . . . . . . . . . . . . . . . . . . . . . . Lode Min ing . . . . . . . . . . . . . . . . . . . . . . . . . Acknowledgements . . . . . . . . . . . . . . . . . . . . . . . . . . . Previous Work
GEOLOGIC SETTING . . . . . . . . . . . . . . . . . . . . . . . . . . . . 6 Metasedimentary Rocks . . . . . . . . . . . . . . . . . . . . . . . 6
S t ra t i g raphy . Seward Peninsula . . . . . . . . . . . . . . . . 6 St ra t ig raphy . Solomon R ive r Area . . . . . . . . . . . . . . . 7
Solomon s c h i s t . . . . . . . . . . . . . . . . . . . . . 8 Calcareous s c h i s t member . . . . . . . . . . . . . . . . 9 Limes tone member . . . . . . . . . . . . . . . . . . . . 9 Hurrah s l a t e member . . . . . . . . . . . . . . . . . . . 9 Sowik l imestone . . . . . . . . . . . . . . . . . . . . . 10
Igneous Rocks . . . . . . . . . . . . . . . . . . . . . . . . . . . 10 Greenstone . . . . . . . . . . . . . . . . . . . . . . . . . . 10 Basa l t Dike . . . . . . . . . . . . . . . . . . . . . . . . . 11
Unconsol i da ted Deposits . . . . . . . . . . . . . . . . . . . . . . 11 S t r u c t u r a l Geology . . . . . . . . . . . . . . . . . . . . . . . . 11
ECONOMICGEOLOGY . . . . . . . . . . . . . . . . . . . . . . . . . . . . 12 Veins i n Hurrah S l a t e . . . . . . . . . . . . . . . . . . . . . . . 12
B i g H u r r a h m i n e . . . . . . . . . . . . . . . . . . . . . . . 12 Veins near mouth o f L inda V i s t a Creek . . . . . . . . . . . . 14 Antimony on B i g Hurrah Creek . . . . . . . . . . . . . . . . . 14 R . W . S i l v e r prospect. T r i l b y H i l l . . . . . . . . . . . . . . 15 Nor th s i d e o f B ig Hurrah Creek; mouth o f L i t t l e Hurrah Creek t o mouth o f T r i l b y Creek . . . . . . . . . . . . . . . . 18 Nor th s i d e o f B ig Hurrah Creek; unnamed creek west of mouth o f L i t t l e Hurrah Creek . . . . . . . . . . . . . . . . . 18 M i n e r a l i z a t i o n south o f B ig Hurrah Creek . . . . . . . . . . . 19 Other prospects . . . . . . . . . . . . . . . . . . . . . . . 19
Veins and Disseminated Deposits i n the Solomon S c h i s t . . . . . . . 19 Head o f West Creek . . . . . . . . . . . . . . . . . . . . . . 19 Head o f Kasson Creek . . . . . . . . . . . . . . . . . . . . . 19 . . . . . . . . . . . . . . . . . . . . . Head o f Johns Creek 20 . . . . . . . . . . . . . . . . Disseminated Deposits i n Limestone 20
. . . . . . Disseminated copper depos i t west o f Solomon R iver 20 M i n e r a l i z a t i o n i n greenstone . . . . . . . . . . . . . . . . . . . 21 . . . . . . . . . . . . . . . . . . . . Summary o f Economic Geology 21

C O N T E N T S
Page
GEOCHEMISTRY . . . . . . . . . . . . . . . . . . . . . . . . . . . . . . . 22 Stream Sediment Sampling . . . . . . . . . . . . . . . . . . . . . . 22
Sampl i ng and A n a l y t i c a l Methods . . . . . . . . . . . . . . . . 22 Discussion o f Anomalies . . . . . . . . . . . . . . . . . . . . 23 Trend Surface Analys is o f Z inc . . . . . . . . . . . . . . . . . 25 Summary, Stream Sediment Sampling . . . . . . . . . . . . . . . 27
Trace Element Study of Hurrah S l a t e . . . . . . . . . . . . . . . . . 27
SUMMARY . . . . . . . . . . . . . . . . . . . . . . . . . . . . . . . . . 29 Concl usions . . . . . . . . . . . . . . . . . . . . . . . . . . . . . 29 Suggestions t o Prospectors . . . . . . . . . . . . . . . . . . . . . 30
REFERENCESCITED . . . . . . . . . . . . . . . . . . . . . . . . . . . . . 30
APPENDICES
Appendix I - Geochemical f i e l d data, r e s u l t s o f ex t rac tab le metals t e s t and comparison t o l abo ra to ry analyses f o r gold, copper, lead, and z i n c . . . . . . . . . . . . . . . . 32
Appendix I 1 - I n t e r v a l s o f es t imat ion and de tec t i on l i m i t s , semi- q u a n t i t a t i v e spectrographic analyses . . . . . . . . . 49
Appendix I 1 1 A - Atomic absorpt ion and semiquant i ta t i ve emission spectrograph a n a l y t i c a l data, stream sediment samples, Solomon C-5 quadrangle . . . . . . . . . . . . . . . . 50
Appendix I 1 1 B - Atomic absorpt ion and semiquant i ta t i ve emission spectrograph a n a l y t i c a l data, stream sediment samples, Solomon C-5 quadrangle . . . . . . . . . . . . . . . . 57
Appendix I11 C - Averages and standard dev ia t ions o f r e s u l t s o f analyses, stream sediment samples, Solomon C-5 quadrangle, Alaska . . . . . . . . . . . . . . . . . . . . . . . . 64
Appendix I V - Frequency d i s t r i b u t i o n histograms o f copper, lead, and z i n c i n stream sediment samples, Solomon C-5 quadrangle . . . . . . . . . . . . . . . . . . . . . . 65
ILLUSTRATIONS
F igure 1 - Locat ion map, Solomon C-5 quadrangle . . . . . . . . . 3 2 - Geological-Geochemical map and sect ion, Solomon C-5
quadrangle, Seward Peninsula . . . . . . . . . . . . . Pocket 3 - P a t e n t e d l o d e c l a i m s , R . W.S i lverMine,So lomon
quadrangl e . . . . . . . . . . . . . . . . . . . . . . 16 4 - Workingsandsarnples, R. W . Si lverMine,So lomon
quadrangle . . . . . . . . . . . . . . . . . . . . . . 17

C O N T E N T S
Page
Figure 5 - Map and sections of Area A , showing dis t r ibut ion of copper along contact of Sowi k limestone and . . . . . . . . . . . . . . . . . . . . Solomon schis t Pocket
6 - Generalized trend surfaces for three degrees and . . . . . . . . . . . . . . . . . . . three variables 26 7 - S i x t h degree zinc trend surface map and residuals, . . . . . . . . . . . . . . . . Solomon C-5 quadrangle 28
. . . . . . . . . . . . . Table 1 - Assay data, Big Hurrah Mine 13 2 - Threshold and anomalous values, stream sediment . . . . . . . . . . . . . samples, Solomon quadrangle 23 3 - Class i f ica t ionof t rendsurfaceequat ions, . . . i l lus t ra t ing three components and three degrees 25

G E O L O G I C A L A N D G E O C H E M I C A L S T U D Y ,
S O L O M O N C - 5 Q U A D R A N G L E ,
S E W A R D P E N I N S U L A , A L A S K A
R . R . Asher
A B S T R A C T
The Solomon C-5 quadrangle i s about 25 miles ea s t of Nome on the Seward Peninsula i n the Solomon River drainage. Geologic mapping and stream sediment geochemical sampling show tha t mineralization i s concentrated along northwest f rac tures t ha t cross the en- t i r e quadrangle.
About $3,000,000 worth of placer gold has been dredged from the auriferous gravels i n the Solomon River basin. The Big Hurrah lode gold mine was in production from 1903 unt i l 1907. I t i s the only lode gold mine on the Seward Peninsula w i t h a production record.
Metamorphosed sedimentary rocks are the most abundant l i tho log ies i n the quadrangle. They are probably equivalent t o the Nome group of Paleozoic age. Formations include the Solomon sch i s t and the Sowik limestone. The Solomon s c h i s t includes a calcareous sch i s t member, an interbedded limestone member and the Hurrah s l a t e member. Greenstone bodies and a basa l t dike have intruded the metamorphic rocks. The rocks a r e folded and overturned, th rus t faulted and broken by several s e t s of high angle normal f a u l t s .
All of the major rock types show indications of hydrothermal mineralization. The Hurrah s l a t e is cut by numerous quartz veins, but gold is sparse. Only the veins on Tr i lby Hill are considered potent ia l ly economic. Minor amounts of copper a re associated with s i l i c i f i e d zones a t the base of the Sowik limestone where i t is i n th rus t contact w i t h the Solomon sch i s t .
Analyses of geochemical stream sediment samples reveals several paral le l lineaments t ha t are mineralized. These s t ruc tures trend northwest across the quadrangle. Trend surface analysis of zinc content confirms t h e i r presence.
No de f in i t e ore bodies are pointed out. Further investigation might lead t o the discov- ery of lode deposits of copper, lead, zinc, molybdenum, gold, o r s i l v e r along the i n d i - cated northwest s t ruc tura l trends.
PURPOSE AND SCOPE
When miners f i rst arrived on the Seward Peninsula i n the l a t e 18901s, r i c h placer gold deposits were found i n many of the streams. That condition leads t o the conclusion t h a t lode deposits of valuable minerals are abundant as well. To date few lode deposits of su f f i c i en t grade and tonnage to warrant development have been found. The purpose of t h i s investigation was t o learn i f a combination of applied geology and geochemistry would be an e f fec t ive exploration method i n the region.

The Big Hurrah mine i n the Solomon (C-5) quadrangle i s t he on l y lode go ld mine on the Seward Peninsula w i t h a product ion record. The southern p a r t o f a b e l t o f l ime- stone t h a t extends south from I r o n Creek ( f i g 1 ) i s i n t he Solomon (C-5) quadrangle. Copper and go ld occurrences a re known w i t h i n t h i s b e l t where the l imestone i s i n contact w i t h s c h i s t . An antimony v e i n occurs west o f the Big Hurrah mine on B i g Hurrah Creek. Because o f t he known mineral deposits, t h a t a re f o r t he most p a r t un- developed, t he Solomon C-5 quadrangle was se lec ted f o r study.
This r e p o r t inc ludes t h e r e s u l t s o f geologic mapping i n t h e northwest p a r t of t h e quadrangle, the r e s u l t s of stream sediment sampling o f a l l drainages i n t h e quadrangle and p re l im ina ry r e s u l t s o f s o i l and rock sample t raverses across a se lec ted l i t h o l o g i c u n i t . Approximately s i x weeks were spent i n the area i n J u l y and August, 1968. Two f i e l d ass i s tan ts aided i n the work p a r t o f the t ime; a t o ther t imes on l y one ass i s tan t was employed.
LOCATION, ACCESS, AND POPULATION
The area s tud ied i s on the Seward Peninsula t h a t i s surrounded by the Ber ing Sea on the nor th , west and south. The Solomon C-5 quadrangle i s about 25 m i les eas t o f Nome, Alaska, i n the Solomon River drainage. The quadrangle i s between 64" 30' and 64" 45'N l a t i t u d e and 164' 00' and 164" 30'W longi tude. The area i s accessib le from Nome by the wel l-graded gravel road t h a t extends from Nome t o Counci 1 ( f i g 1 ) .
There a re no permanent res iden ts i n the region. During t h e sumner a road maintenance crew stays a t the B i g Hurrah road camp t h a t i s loca ted a t the mouth o f Big Hurrah Creek ( f i g 1). Radio communication w i t h Nome i s poss ib le from the road camp. Lee's camp, on the lower Solomon River , and a re indeer s t a t i o n near t he Big Hurrah road camp a re occupied p a r t o f the summer.
Because much o f t he reg ion i s tundra-covered, o f f - road t r a v e l by standard v e h i c l e i s seldom p r a c t i c a l . Tracked veh ic les and four-wheel d r i v e veh ic les can be used i n p a r t s o f t he area.
CLIMATE AND VEGETATION
Cl imate and vegeta t ion are t y p i c a l l y a r c t i c . Summer storms are frequent w i t h much wind, r a i n , and fog, b u t dur ing per iods of good weather summer days are warm and pleasant. Winters a re severe w i t h sub-zero temperatures, heavy snow, and f requent h igh winds. The Ber ing Sea i s f rozen f o r approximately s i x months o f t he year. The area i s t ree less and barren of vegeta t ion except f o r extensive, undu la t ing t r a c t s o f grassy tundra and stands of w i l lows along creeks and g u l l i e s . F ros t - r i ven rubb le mantles most o f t he steeper s 1 opes.
TOPOGRAPHY AND DRAINAGE
The Seward Peninsula i s a t t he western end o f an intermontane p la teau t h a t forms a major physiographic d i v i s i o n o f t he North American Continent. The p la teau l i e s between the Rocky Mountain system t o t h e n o r t h and P a c i f i c Mountain system t o t h e south.
The major land forms on t h e Seward Peninsula cons i s t o f i s o l a t e d mountain ranges 20-60 m i les long and 10 m i l e s wide, extensive uplands o f broad convex h i l l s and broad, f l a t d i v ides and coasta l lowlands and i n t e r i o r basins (Wahrhaftig, 1965, p 31).

15O 00' Figure I LOCATION MAP, SOLOMOFJ(-C-5) QUADRANGLE, A L A S K A 7

I n the Solomon C-5 quadrangle the re are coasta l lowlands and uplands. The coasta l lowlands are charac ter ized by extensive grass-covered f l a t s across which f l o w s lug- g i s h meandering streams t h a t discharge i n t o Norton Sound ( f i g 1 ) . The coasta l low- lands extend northward f rom the sea and merge w i t h the southern slopes o f the more extensive uplands a t an e leva t i on o f about 250 feet. The lowlands s lope seaward a t about 75 f e e t per m i l e .
L i t h o l o g y has a marked e f f e c t on topography i n t h e uplands i n t h e Solomon C-5 quad- rang le ( f i g 2). Areas under la in by s c h i s t a re character ized by rounded tundra-covered slopes and broad f l a t d iv ides . A t places eros iona l remnants o f s c h i s t s tand as i so - l a t e d outcrops on r i d g e tops. Where massive l imestone crops out , p rec ip i t ous c l i f f s and steep slopes o f bare bedrock are encountered. The Hurrah s l a t e i s a black, s i l i - ceous g r a p h i t i c rock and topographic forms developed i n i t are in te rmed ia te between the rounded slopes o f areas under la in by s c h i s t and the steep rugged topography devel- oped i n l imestone t e r r a i n .
Streams i n t h e uplands f l ow i n broad f l a t va l l eys , w i t h g e n t l e slopes and l ess comon ly i n steep rock wa l led canyons. The v a l l e y s o f some streams, such as B ig Hurrah Creek, are i nc i sed below a former base l e v e l as evidenced by remnants o f te r races along the stream course.
The master stream i n the Solomon C-5 quadrangle i s the Solomon River . The Solomon River has a general sou the r l y course, b u t i n d e t a i l i t s course i s broken i n t o d i s t i n c t sec t ions o r segments t h a t t rend southeast and southwest ( f i g 2) . Each segment i s f i v e t o s i x m i l e s long i n t he upland p o r t i o n o f t he quadrangle.
Shovel Creek i s a major t r i b u t a r y on the west; i t f lows genera l l y southeastward b u t i t s course i s a l so composed o f segments of t he same o r i e n t a t i o n as those on the Solomon R ive r . Other major t r i b u t a r i e s are B ig Hurrah Creek, East Fork, and Coal Creek. These streams a l l en te r Solomon River from the east. They f l o w west and are f a i r l y s t r a i g h t ( f i g 1). Stream v a l l e y s are probably s t r u c t u r a l l y c o n t r o l l e d and r e f l e c t major j o i n t t rends o r i en ted nor theast , northwest, and east-west. The map a l s o i n d i c a t e s t h a t t he upper p a r t of Quar tz Creek has been captured by Uncle Sam Creek. Th is accounts f o r t he sharp bend t o the south made by Uncle Sam Creek on the west s i d e o f Uncle Sam Mountain ( f i g 2) .
The h ighes t p o i n t i n t h e Solomon C-5 quadrangle i s on the r i d g e near t he head o f Coal Creek i n the nor theast corner o f t h e map area on the d i v i d e separat ing the Solomon River drainage on the west from the F i sh R iver drainage on the east ( f i g 2). Th is p o i n t , a t an e leva t i on of 1,778 feet , i s ou ts ide the area mapped g e o l o g i c a l l y , b u t w i t h i n the area o f geochemical study. The Solomon River i s a t an e l e v a t i o n o f 250 f e e t , thus maximum l o c a l r e l i e f i s 1,528 fee t . Other r idges and h igh po in t s a re a t e leva t ions of 1,200 t o 1,500 f e e t . Uncle Sam Mountain i s a prominent landmark on t h e south edge of t h e uplands w i t h steep slopes and a broad sumnit a t an e leva t i on o f 1,297 f e e t . It r i s e s ab rup t l y from the coasta l lowlands t o the south and i s about f o u r m i l e s from the beach a t Norton Sound.
HISTORY
Placer Mining
P lacer go ld was f i r s t discovered on t h e Solomon River by P ierce Thomas i n June, 1899 ( C o l l i e r and others, 1908, p 223). A c t i v e min ing d i d n o t g e t underway u n t i l 1900; i n t h a t year approximately $10,000 was ex t rac ted f rom p lacer g rave ls on t h e Solomon River .

Hydraul i c and shovel-in operations began on t r ibu ta ry streams shor t ly a f t e r the i n i t i a l discovery i n 1899. By 1901 a small dred e was operating on the Solomon River (Col l i e r and o thers , 1908, p 30). Brooks 9 1913, p 292) remarks t ha t success- f u l dredging began in 1905 when the Three Friends dredge was ins ta l l ed on Solomon River. The dredge i s described as the Bucyrus type w i t h a capacity of 3,700 yards per day. A second dredge of s imi la r capacity was a l so i n s t a l l ed i n 1905 (Col l i e r , 1913, p 294) .
According t o Cathcart (1922, p 197) placer gold is widely d i s t r ibu ted i n the Solomon River basin, but there i s l i t t l e very r i ch placer ground. Consequently, the auriferous gravels were worked most successfully by dredges.
Lu and o thers , (1968, p 28) give the cumulative t o t a l of placer gold extracted from the Solomon River as $2,424,797. Production periods a r e given as 1907, 1912-1917, 1920-1923, 1926-1932, 1934-1960. Shovel Creek, a major t r i bu t a ry of Solomon River, i s credited with a production of $408,006. Production periods a r e 1912-1915, 1917-1921, 1923-1927, ( L u and others , 1968, p 28). Big Hurrah Creek i s the only other major t r ibu ta ry of Solomon River t ha t has produced more than $10,000 in placer gold. According t o L u and others (1968, p 24), $120,606 worth of gold was extracted from B i g Hurrah Creek i n the years 1912, 1916-1924, 1933, 1935, 1937, 1939, 1940-1941.
Small hand operations have been ac t ive on West Creek, Mystery Creek, Kasson Creek, Lion Creek and other streams i n the Solomon drainage a t various times from 1900 un t i l f a i r l y recently. In the ea r ly 1900's d r i f t mining during the winter was a l so practiced i n the Solomon River basin. Ditches t o d ive r t water from one place t o another f o r ear ly placer operations a r e abundant i n the area.
Lode Mining
The his tory of lode mining i n the region involves the s to ry of only one mine -- The Big Hurrah mine a t the confluence of Big Hurrah and L i t t l e Hurrah Creeks ( f i g 1 ) . Prospect p i t s , trenches and shor t underground workings a re i n existence a t several other places, b u t production on a sustained basis was never a t ta ined a t these l o c a l i t i e s .
The following information i s taken from a report by Saunders (1964). The Big Hurrah lode was discovered in 1900 b u t mining did not ge t underway un t i l 1903. Between 1900 and 1903 a stamp mill consist ing of four ba t t e r i es of f i v e stamps each was ins ta l l ed . The Hurrah Quartz Mining Company operated the mine and mi 11 continuously from 1903 u n t i 1 Ju ly , 1907 when d i f f i c u l t i e s i n administration forced a closure. The mine has not been in production s ince t h a t time, a1 though several attempts have been made t o reopen i t . L u and others (1968, p 15) estimate t ha t i n the three year period, 1903-1905 inclus ive , $100,000 in gold was recovered from the operation.
Sometime pr ior t o 1951 the mine was leased t o permit placer mining on the creeks con- t r o l l e d by the mine owners. A t t h a t time the top of the lode was excavated and washed through s l u i ce boxes. The resul t ing trench, about 20 f e e t deep, i s dangerously c lose t o the mine shaf t .
In 1951 and 1952 a cyanide plant was ins ta l led, and Travis P. Lane cyanided the mil 1 t a i l i n g s from previous operations. In 1953 and 1954 the underground workings were un- watered, mapping and sampling were done, the sha f t was r ehab i l i t a t ed , new underground workings were driven, and a new mill bu i l t . In the spring of 1954 a f i r e destroyed some of the new equipment, and in the fa1 1 of t h a t year serious ground movements i n and around the shaf t took place. For sa fe ty reasons the mine was closed and never reopened.
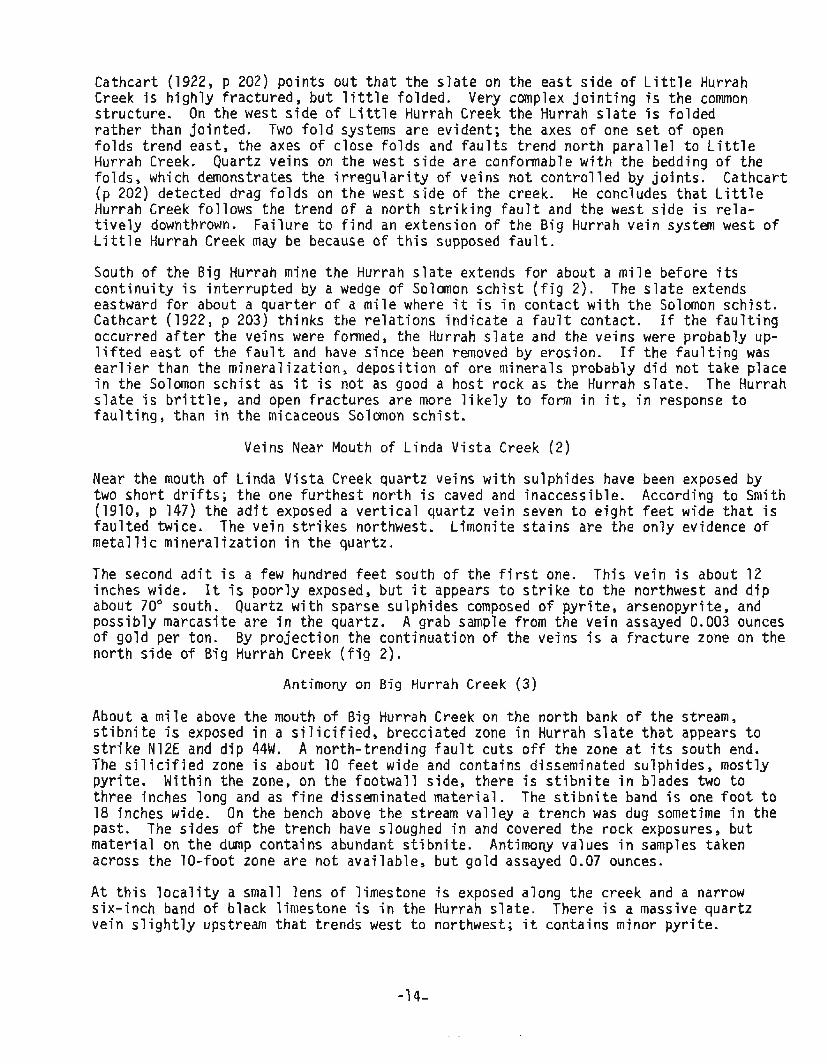
Underground workings consist of an inclined shaft 250 feet deep on a 60 degree in- cline and 1800 feet of drifts and crosscuts. The workings are filled with water at the present time.
ACKNOWLEDGEMENTS
The assistance rendered by the residents of Nome during the course of this study are gratefully acknowledged. Special thanks are due to Pearse Walsh of Nome for aid and advice; Richard Lee of Nome for use of his cabin on Solomon River; and personnel of the Alaska Highway Department at Big Hurrah camp and Nome for invaluable aid in solv- ing transportation problems.
Thanks are also expressed to field assistants John Hedden and Roger Baer. They aided the writer in mapping and collected all of the geochemical samples. Lawrence Heiner, Mining Engineer, University of Alaska, provided invaluable assistance in programming geochemical data for the computer. The field laboratory of the U. S. Geological Survey aided the project materially by providing analytical data on all the geochemical samples.
PREVIOUS WORK
Brief reports on mining developments and gold resources of the Solomon River and its tributaries are mentioned in the early reports of the U. S. Geological Survey. Among these are Smith (1907) and Collier and others (1908). The most detailed account of the area is by Smith (1910) in U. S. Geological Survey Bulletin 433 -- The Geology and Mineral Resources of the Solomon and Casadepaga Quadrangles, Seward Peninsula, Alaska. This report includes a geological map showing the major rock types and the locations of lode and placer deposits as well as a detailed discussion of the general geology and economic geology. Cathcart (1922) includes a discussion of the lode deposits of the Solomon River area in Bulletin 722-F.
G E O L O G I C S E T T I N G
METASEDIMENTARY ROCKS
Stratigraphy, Seward Peninsula
According to Collier and others (1908, p 61) Brooks (1901) differentiated the metamor- phosed sedimentary rocks o f the Seward Peninsula into three units. In ascending order these are: 1) the Kigluaik series, 2) the Kuzitrin series, and 3) the Nome series. Brooks described t h e K ig lua i k and K u z i t r i n se r ies as we l l -de f ined s t r a t i g r a p h i c u n i t s , but he noted that the Nome series is a complex of metamorphic rocks (Collier and others, 1908, p 61). The Nome series consists principally of limestone and schist. All of these rocks are thought to be Paleozoic in age.
In 1904 Collier differentiated a massive limestone unit within the Nome series that contains Ordovician fossils. He named it the Port Clarence limestone (Collier and others, 1908, p 61). The Port Clarence limestone overlies a basal schist unit. Simi- lar limestones near Nome were found to contain Silurian fossils, hence the Port Clarence 1 imestone may contain either Silurian or Ordovician fossi 1s.

in the northeastern part of the peninsula, schists were found that overlie t h e Port. Clarence limestone (Collier and others, 1908, p 62). Consequently, the Nome series contains the following units; an upper formation of schists, a middle formation of massive limestone, and a lower formation of schists with interbedded limestone. The lower schist has been intruded by igneous rocks represented by greenstone masses.
Collier (1904, p 13-14] describes slates from the York region, in the northwestern part of the Seward Peninsula, as graphitic, arenaceous, and calcareous rocks. Brooks was not certairl of ago relations because of thrust faulting in the vicinity, but he was of the opinion that the slates underlie the Port Clarence limestone.
Stratigraphy, Solomon River Area
Collier and others (1908, p 72) remark that schists of the Non~e region (the basal schist of the Nome series) extend in a wide belt across the Solomon River, but along the upper Casadepaga River they overlie limestone that was correlated with the Port Clarence limestone near the Solomon River. Collier and others (1908, p 72) offer three possible explanations; 1) the schist is in part equivalent to the upper schist unit of the Nome series, 2) the limestone on Solomon River is not equivalent to the Port Clarence limestone, or 3) the schists are thrust over the Port Clarence.
In 1910 Smith mapped the Solomon quadrangle. He did not correlate the rocks with the stratigraphic units previously used on the Seward Peninsula. The stratigraphjc units that Smith used are given below in ascending order:
1) The Solomon schist, including interbedded limestones 2) The Sowi k limestone 3) The Hurrah slate 4) The Casadepaga schist of igneous origin
Smith (1910, p 54) remarked that the Sowik limestone was previously correlated with the Port Clarence limestone but there was not enough evidence to support the correla- tion. Smith also notes that the limestone is extensively thrust-faulted and silici- fied near the base (p 56, 58).
Based on descriptions given by earlier workers it is likely that the rocks in the Solomon River area are part of the Nome series. However, for consistency and ease of reference the nomenclature used by Smith is retained in this report.
Smith considered the Hurrah slate to be younger than the Sowik limestone, although he expressed some uncertainty on the point. He notes (p 128):
"Apparently conformably overlying the Sowi k l imestone, although the evidence is not entirely conclusive, the Hurrah slate was laid down."
Smith also notes (p 128) that the Hurrah slate resembles the slates near York and the upper part of the Kuzitrin formation that Collier included in the lower part of the Nome group (Collier and others, 1908, p 65). The true stratigraphic position of the slates near York and the Kuzitrin formation was never definitely established, however.

Because the Sowik l imestone and Hurrah s l a t e are no t i n contact i n the area mapped f o r t h i s repo r t , t he r e l a t i v e ages o f t he two u n i t s could n o t be d e f i n i t e l y deter- mined. In my opin ion t h e Hurrah s l a t e i s o lde r than t h e Sowik l imestone and i t i s an in terbed i n t h e Solomon s c h i s t because:
1) A t places the Hurrah s l a t e grades i n t o s c h i s t arid the contact between the two becomes i n d e f i n i t e . One such place i s the contact around the tongue o f s c h i s t t h a t extends westward from the upper p a r t o f L i t t l e Hurrdh Creek t o Linda V i s t a Creek ( f i g 2 ) .
2) The Hurrah s l a t e i s associated w i t h l imestone s i m i l a r t o the l imestone interbedded i n the Solomon sch is t .
3) On Shovel Creek and West Creek are smal l exposures o f rocks l i t h a l o g i c a l l y s i m i l a r t o t h e Hurrah s l a t e t h a t a re i n t e r - bedded i n the Solomon s c h i s t .
Smith (1910, p l . V I ) mapped the Casadepaga s c h i s t on several dome-li ke topographic features t h a t a re w i t h i n the area mapped f o r t h i s repo r t . Smith d i f f e r e n t i a t e d the Cfisadepaga s c h i s t from the Solomon s c h i s t on the basis of l ess than 25 percent quartz and abundant fe ldspar c r y s t a l s (Smith 1910, p 70). During t h i s study I was unable t o d i f f e r e n t i a t e the Solomon and Casadepaga sch is t s , and these are no t separated on the geologic map inc luded w i t h t h i s r e p o r t ( f i g 2) .
Solomon s c h i s t -- The Solomon s c h i s t i s probably e a r l y Paleozoic i n age. There are several v a r i e t i e s o f s c h i s t inc luded i n the formation; a l l a re more o r l ess s i l i ceous . The v a r i e t i t e s are muscovite-quartz sch is t , c h l o r i t e s c h i s t , b i o t i t e sch is t , and g r a p h i t i c sch is t . Calcareous s c h i s t , interbedded l imestone, and the Hurrah s l a t e were mapped separately, bu t they are approximately equivalent i n age t o the Solomon s c h i s t and are members o f t he formation.
The Solomon s c h i s t i s t he most abundant rock i n the area mapped f o r t h i s repo r t . Over much of t he area the s c h i s t i s poo r l y exposed. It tends t o form rounded h i l l s w e l l mantled by tundra. I n such areas the presence o f s c h i s t must be determined from f l o a t fragments and widely-spaced poorly-exposed outcrops. S l umping and f r o s t heaving makes determinat ions o f a t t i t u d e s un re l i ab le . Stream banks o f f e r t he best exposures.
On t h e r i d g e tops the more s i l i c e o u s v a r i e t i e s stand as p innacles and c a s t e l l a t e d forms above the surrounding t e r r a i n . These outcrop forms are w e l l developed on the r i d g e between East Fork Creek and B ig Hurrah Creek ( f i g 2) . The most abundant v a r i e t y of t he Solomon s c h i s t i s muscovite-quartz sch is t . The rock has a s i l v e r y gray t o l i g h t t a n co lor . S e r i c i t e , quartz , and minor b i o t i t e a re the p r i n c i p a l minerals.
C h l o r i t e s c h i s t predominates i n some outcrops. I t i s green i n co lo r and character ized by a smooth soapy fee l . Quartz, muscovite, and b i o t i t e are associated w i t h the c h l o r i t e .
B i o t i t e s c h i s t i s abundant east o f t he Solomon River i n the v i c i n i t y o f Big Hurrah Creek. This rock i s composed of b i o t i t e and quartz; i t weathers dark brown. The b i o t i t e s c h i s t grades i n t o g r a p h i t i c sch is t , p h y l l i t e and dark s l a t e .
Quartz knots and s t r i n g e r s are comnon i n the Solomon sch is t . Many o f these quartz i nc lus ions show p y r i t e o r other su lph ide minerals. The quartz lenses are genera l ly i n t r i c a t e l y fo lded and contor ted and o f l i m i t e d s ize, genera l ly l ess than s i x inches i n s ize. One minera l ized quartz knot a t t he mouth o f Johns Creek i s one foo t by f i v e feet.

Cdicareous schis t member -- Calcareous schis t i s most abundant i n the Shovel Creek drainage. I t appears to be interbedded near the upper contact of the Solomon schis t and associated with interbedded limestone. The change from schis t t o limestone a t places i s evidently gradational ; the amount of calcium carbonate increases unLi 1 the rock i s more accurately described as a schistose limestone. On Shovel Creek, i n the vicini ty of West Creek, the member was traced by intermittent outcrops for several rql'les and it; appears as a d is t inc t bed. A t other places outcrops of calcareous schis t are too s111al1 and discontinuous t o distinguish on the map.
In sppearance the rocks of the calcareous schis t member resembles the s i lvery gray schis t described previously. They are l igh t gray i n color, and they have a schistose tex tlrre.
Limestone member -- Throughout the area mapped irregular outcrops and exposures of limestone are interbedded i n the schis t . The largest outcrops are i n the Shovel Creek drainage, b u t the limestone i s exposed here and there throughout the outcrop area of the Soloman schist . Stratigraphically i t appears to be near the top of the formation.
A t places i t i s d i f f i c u l t to d i f fe rent ia te the interbedded limestone from the Sowik limestone that overlies the Solomon schis t . The interbedded limestone, however, tends t o be schistose in character, i t weathers into slabby thin fragments. Outcrops are much more subdued and rounded than in the cliff-forming Sowik limestone. The inter- bedded limestone and the Sowik limestone are both recrystall ized but they d i f f e r i n color. The interbedded limestone i s darker gray.
Hurrah s l a t e member -- The Hurrah s l a t e crops out continuously from just south of the mouth of East Fork Creek to Uncle Sam Mountain in a triangular-shaped area of about seven square miles ( f ig 2 ) . Elsewhere in the area mapped, outcrops of Hurrah s l a t e are sparse. On Doverspike Creek in the northwest corner of the map area, f l o a t frag- ments of Hurrah s l a t e are abundant, b u t i t was not found in place. Jus t south of the mouth of West Fork Creek on Shovel Creek, Hurrah s l a t e occurs in an outcrop showing Solomon schis t and interbedded limestone. A small outcrop of Hurrah s l a t e also occurs along the f a u l t that crosses the upper part of West Creek.
The most comnon rock type included in the Hurrah s l a t e i s a s i l iceous, black, dense, fine-grained variety tha t i s not schistose. I t i s resis tant t o weathering, b u t because of s la ty partings in the rock i t breaks into flaggy pieces one to two f e e t across and several inches thick. These fragments form long talus slopes. Quartz s t r ingers and veinlets a re comnon in the Hurrah s l a t e and are most abundant in the nonschistose variety. The quartz occurs as numerous interlacing veinlets and s t r ingers . A t some places, such as near the head of L i t t l e Hurrah Creek, the head of Linda Vista Creek, or near the mouth of Big Hurrah Creek, the Hurrah s l a t e becomes schistose, the amount of b io t i t e increases and i t grades into a phylli te or graphitic schis t . A t such places i t i s d i f f i c u l t to distinguish from Solomon schis t .
Because of differences i n l i thologic character the Hurrah s l a t e reacts i n various ways to weathering processes. Where the dense, hard s l a t e i s the major rock type, there a re prominent, talus covered slopes surmounted by we1 1 exposed outcrops. Slopes devel- oped are steep. The best example of th i s type of topography i s Uncle Sam Mountain. Where the Hurrah s l a t e i s more schistose, topography i s more subdued and rounded; and outcrops a re not as abundant.

On a h i l l west of Trilby Creek, limestone and s l a t e are mixed. A number of prospect trenches have been dug a t t h i s loca l i ty and limestone fragments are abundant in the resulting debris. The relat ion between the two rock types was not established, but evidently the Hurrah s l a t e contains interbedded 1 imestone much 1 i ke the Solomon schis t . On the south bank of Big Hurrah Creek, about midway between L i t t l e Hurrah and Linda Vista Creeks, a small highly folded outcrop of limestone is surrounded by Hurrah s l a t e .
Sowik limestone -- No defini te age has been assigned to any of the rocks i n the Solomon C-5 quadrangle. I t is thought that the rocks are Paleozoic i n age; the Sowik limestone overlies the Solomon schis t and i s re lat ively younger.
In the area mapped the Sowik limestone crops out i n a discontinuous be l t from north to south across the en t i re area. The largest continuous exposure of Sowik limestone is in the northwest part of the map area and forms part of the divide between Shovel Creek on the west and Solomon River on the east . The limestone forms a north-trending ridge about f ive miles long and a mile wide.
The Sowik limestone i s white to l ight blue i n color. I t i s f inely crystal l ine i n character and i t has a sugary texture. The limestone is res i s tan t t o erosion and forms rugged topography.
Calcite veins are numerous i n the limestone; they range from a fraction of an inch t o several f e e t i n w i d t h and can be traced fo r several hundred f e e t along s t r ike . The ca lc i t e in the veins is i n large, well formed, brown t o white crystals. The veins examined are barren of metall ic minerals.
The irregular outcrop pattern of the Sowik limestone is related to thrust f a u l t s , and the base of many limestone exposures are s i l i c i f i e d fo r 10 t o 15 f ee t above schis t contacts. Copper minerals a re associated w i t h the s i l i c i f i e d zones a t places.
IGNEOUS ROCKS
Most of the outcrops i n the mapped area are metamorphosed sedimentary rocks. Other rocks include small greenstone masses and a basalt dike.
Smith (1910) mapped rocks i n the region that he named the Casadepaga schis t . The u n i t was differentiated because the rocks contain abundant feldspar ( p 70, 71). Smith (p 74, 75) presents evidence t o show tha t outcrops of Casadepaga schis t represent altered intrusive rocks. As noted ea r l i e r , the Casadepaga schis t was not differentiated d u r i n g f i e l d mapping fo r th i s report because i t was not recognized i n the f ie ld . Conse- quently, there may be more metamorphosed intrusive rocks in the area than are shown on figure 2.
Greenstone
The greenstone in the report area crops out in the Shovel Creek drainage. Two small elliptical-shaped bodies of greenstone are exposed on Shovel Creek near the mouth of Harlem Creek. Several other exposures are west of Doverspike Creek and Johnson Creek a t the west margin of the quadrangle; these exposures are approximately aligned i n a northerly direction. The exposures may represent the exposed part of a larger intrusive mass.

The greenstone i s a gray ish green, f ine-gra ined rock. I n hand speciman i t appears t o be composed o f b i o t i t e and quartz. The b i o t i t e i s a l igned and imparts a crude f o l i a t i o n t o the rocks. Small garnets and sulphide minerals, most ly p y r i t e , a re associated as accessory minerals. A t places p y r i t e i s f a i r l y abundant i n the green- s tone.
Basa l t Dike
I n the northwest p a r t o f t he map area a b a s a l t d i k e crops ou t on t h e l imestone r i d g e east o f Johnson Creek. The d i ke i s about 25 f e e t wide and can be t raced f o r about 1 114 mi les. I t s t r i k e s N20°E and dips s teep ly west. The b a s a l t i s n o t metamorphosed and i s younger than the l a t e s t episode o f metamorphism i n t h e region. The basa l t i s dark blue, f ine-gra ined, and ves i cu la r .
UNCONSOLIDATED DEPOSITS
The wide r i v e r va l l eys i n the quadrangle are mantled by recent gravels, most o f which are aur i fe rous. G l a c i a l s i l t i s i n the bank o f t he Solomon R ive r near Q u i g l e y ' s camp ( f i g 2 ) . S c i l , f rozen a few inches below the surface, mantles the h i l l s l o p e s .
Th is r e p o r t i s concerned p r i m a r i l y w i t h bedrock geology. The unconsol idated deposi ts were no t studied.
STRUCTURAL GEOLOGY
As i n most pa r t s o f the Seward Peninsula, t he bedrock exposures i n the Solomon C-5 quadrangle i n d i c a t e a complex s t r u c t u r a l h i s to ry . D i f f i c u l t i e s o f i n t e r p r e t a t i o n are f u r t h e r complicated by the l ack o f a f irmly establ ished reg iona l s t r a t i g r a p h i c sequence.
The rocks i n the area mapped are fo lded and fau l ted . A t t i t u d e s are l o c a l l y va r iab le , b u t i n general t he rocks s t r i k e no r th t o northeast and d i p 20 t o 30 degrees west.
Fold axes t rend no r th t o nor theast i n the Shovel Creek drainage as i nd i ca ted on the map and cross-sect ion i n f i g u r e 2 . A t the west s ide o f t he map area the outcrop p a t t e r n and a t t i t u d e s o f bedding and f o l i a t i o n i n d i c a t e a sync l i ne t h a t has been overturned t o the east. The f o l d plunges souther ly ; the ax i s s t r i k e s northeast. A reverse f a u l t borders the eastern l imb o f the s t ruc tu re ; because o f eastward displacement along the f a u l t the calcareous member o f t he Solomon s c h i s t o v e r l i e s the Sowik l imestone i n p a r t o f t he Shovel Creek drainage. Fur ther east, d ips i n the Sowik l imestone i n d i c a t e a broad a n t i c l i n a l s t r u c t u r e t h a t i s terminated on i t s eastern f l a n k by a low-angle normal f a u l t ( f i g 2 ) . The a x i s o f t h e f o l d i s poor ly def ined, bu t i t appears t o t rend northwest i n i t s southern p a r t ; f u r t h e r no r th i t trends n o r t h e r l y ( f i g 2). There a re probably other f o l d s i n the map area bu t mapping was not done i n s u f f i c i e n t d e t a i l t o de tec t them.
Many o f t he contacts between the Sowik l imestone and the Solomon s c h i s t mark t h e surface t races o f t h r u s t f a u l t s . The evidence f o r t h e i r presence i s the outcrop pat te rns of t h e Sowi k l imestone and fea tures i n the l imestone a t the contacts i nc lud ing s i l i c i f i c a t i o n s , copper m ine ra l i za t i on , b recc ia t ions , and a t places, dolomi t i z a t i o n . General ly exposures are too poor t o determine the a t t i t u d e s o f the f a u l t s i n question, bu t cross-sect ions i n d i c a t e t h a t d ips are wester ly and range from 25 t o 50 degrees. The f a u l t s s t r i k e no r th t o northeast.
A h igh angle normal f a u l t t h a t trends no r th l i e s along the Solomon River; i t b r ings the Hurrah s l a t e (member o f Solomon s c h i s t ) i n t o j u x t a p o s i t i o n w i t h b i o t i t e s c h i s t between East Fork Creek and Quar tz Creek.

A subordinate s e t of fractures trends northwest. Most of these were noted i n the eastern part of the mapped area. They appear t o be h i g h angle normal faul t s . The vein a t the Big Hurrah mine is evidently localized i n a f racture of th i s set . East of the Solomon River quartz-filled s tr ingers represent other northwest-trending fractures. Faults of this system can be followed for only a short distance on the surface, b u t a t places, l ike i n the Hurrah s l a t e near Big Hurrah Creek, they are abundant. By projection along s t r ike , fractures of this s e t intersect the north- trending normal f a u l t tha t para1 l e l s Solomon River, Geochemical data indicate that northwest fractures i n the area are mineralized.
E C O N O M I C G E O L O G Y
Lode deposits containing copper, gold, and antimony are in the area mapped. Because bo th lithology and structure controlled the localization of mineralization the deposits can be classified as follows:
1) Vein deposits in the Hurrah s l a t e 2 ) Vein deposits and disseminated deposits i n the Solomon schis t
Disseminated deposits i n limestone Disseminated deposits i n greenstone
VEINS IN HURRAH SLATE
Smith (1910, p 149) remarks tha t the Hurrah s l a t e is the most highly mineralized rock i n the Solomon-Casadepaga region. Smith ( p 147) also notes the widespread evidence of mineralization in the Hurrah s l a t e . The evidence is the great number of quartz veins and veinlets i n the rocks.
Two types of structures can be recognized; these are defini te quartz veins and so-called "ribbon rock" (Cathcart, 1922, p 203). The "ribbon rock" consists of alternating para- l l e l laminae of s l a t e and quartz, or s l a t e that i s traversed i n a l l directions by numer- ous quartz veinlets. Quartz tha t is i n well defined veins is coarsely crystal l ine, vitreous and white, w i t h cavities lined by well terminated quartz crystals.
Most of the veins and zones of "ribbon rock" in the Hurrah s l a t e s t r ike northwest, bu t one s t r ikes north. Vein exposures are poor and no underground workings are accessible. The veins probably represent f i 1 led f issures , or shear zones.
B ig Hurrah Mine ( I )*
The underground workings of the Big Hurrah Mine are inaccessible, and l i t t l e could be learned about the character of the mineralization from the scanty surface exposures. The following information is taken from Smith (1910), Cathcart (1922), and Hellerich ( 1954).
There are three veins i n the Big Hurrah mine. All three structures s t r i k e northwest; the south and middle veins dip southwest, the north vein dips northeast. The middle vein was worked most extensively. According t o Smith ( p 144) the veins are more or less crushed and crumpled, b u t not so greatly deformed as t o lose the i r continuity.
*Numbers i n parentheses following headings refer to map locations on figure 2.

The ore consists of bunches of quartz and ribbon rock. The "ribbon rock" is the better grade ore. The hanging walls and footwalls of the veins are marked by s1 ickensides. Smith notes ( p 146) tha t f au l t s do not persis t uninterruptedly through the mine, b u t movement took place along a number of parallel planes.
Smith ( p 144) s t a t e s tha t sulphides are absent in the veins. Quartz with good values in gold looks barren t o the unaided eye. However, a private report by Hellerich (1954), the engineer in charge when the mine was reopened in 1953 and 1954, notes that the h i g h sulphide content of the ore in depth hampered certain aspects of the milling operation.
The mine was opened by an inclined shaft about 250 fee t deep. The shaft i s inclined about 60 degrees southwest. Three levels extend from the shaft: the 70 foot level, the 150 foot level, and the 250 foot level. There are about 1800 fee t of la teral work- ings in the mine. During 1954 a sublevel was driven between two raises fo r 105 f e e t , 20 f ee t below the 150 level eas t , and stoping was begun a t the ra ise on the east end. About 300 tons of ore were extracted, but work was stopped because of caving ground and poor values. In the sublevel the ore averaged about $15.81 across 45 inches (Hellerich, 1954). Another 200 tons of ore were extracted from the 250 foot level west, but because of ground subsidence and low grade ore, the work was stopped.
Some long-hole percussion dr i l l ing was done from the 150 foot level in 1954. Two of three holes dr i l led from the face of the north d r i f t intersected the downward extension of the north vein which consisted of a small ser ies of quartz s t r ingers about 12 inches wide tha t averaged $6.80 per ton. Hellerich (1954) concluded that the ore shoot raked and the holes were dri l led ei ther east or west of the ore shoot.
Sample resul ts from the 70 foot level of the mine follow in Table 1. No widths were included with the sample data. Evidently high-grade values are randomly distributed along the vein, but the overall average is low. The ore carries values i n s i lver as well as gold. The ra t io i s about one ounce of gold t o six ounces of s i lver .
Table 1 Assay Data, Big Hurrah Mine
(From f i l e s , Alaska Division Mines and Geology, Samples taken in 1952)
Description Go 1 d Silver
70 foot level 70 foot level 70 foot level 70 foot level 70 foot level 70 foot level Tailing p i le Ore bin
2 .o (center) 0.88 ( N W face) 5.2 (SE face) 0.16 (SE face) 0.08 (SE face) 0.42
0.18 0.40
Evidence of prospecting for extensions of the Big Hurrah veins can be seen southeast of the mine, north of Big Hurrah Creek, and west of L i t t l e Hurrah Creek ( f ig 2 ) . All of these efforts were unsuccessful. .
Cathcart (1922, p 202) points out that the s l a t e on the east s ide of L i t t l e Hurrah Creek i s highly fractured, but l i t t l e folded. Very complex jointing is the common structure. On the west s ide of L i t t l e Hurrah Creek the Hurrah s l a t e i s folded rather than jointed. Two fold systems are evident; the axes of one s e t of open folds trend eas t , the axes of close folds and fau l t s trend north parallel to L i t t l e Hurrah Creek. Quartz veins on the west s ide are conformable w i t h the bedding of the folds, which demonstrates the i r regular i ty of veins not controlled by joints. Cathcart (p 202) detected drag folds on the west s ide of the creek. He concludes tha t L i t t l e Hurrah Creek follows the trend of a north s t r iking f a u l t and the west s ide is rela- t ively downthrown. Failure to find an extension of the Big Hurrah vein system west of L i t t l e Hurrah Creek may be because of t h i s supposed f au l t .
South of the Big Hurrah mine the Hurrah s l a t e extends for about a mile before i t s continuity i s interrupted by a wedge of Solomon schis t ( f i g 2 ) . The s l a t e extends eastward for about a quarter of a mile where i t is i n contact w i t h the Solomon schis t . Cathcart (1922, p 203) thinks the relations indicate a f au l t contact. If the faulting occurred a f t e r the veins were formed, the Hurrah s l a t e and the veins were probably up- l i f t e d eas t of the f a u l t and have since been removed by erosion. If the faulting was ear l ie r than the mineral ization, deposition of ore minerals probably d i d not take place in the Solomon schis t as i t is not as good a host rock as the Hurrah s la te . The Hurrah s l a t e i s b r i t t l e , and open fractures are more l ikely to form i n i t , i n response to faul t ing, than i n the micaceous Solomon schist .
Veins Near Mouth of Linda Vista Creek ( 2 )
Near the mouth of Linda Vista Creek quartz veins with sulphides have been exposed by two short d r i f t s ; the one fur thest north i s caved and inaccessible. According t o Smith (1910, p 147) the ad i t exposed a vertical quartz vein seven t o eight f ee t wide that i s faulted twice. The vein s t r ikes northwest. Limonite s ta ins are the only evidence of metall ic mineralization in the quartz.
The second adi t is a few hundred fee t south of the f i r s t one. T h i s vein is about 12 inches wide. I t is poorly exposed, but i t appears to s t r ike to the northwest and dip about 70° south. Quartz w i t h sparse sulphides composed of pyri te , arsenopyri t e , and possibly marcasite are i n the quartz. A grab sample from the vein assayed 0.003 ounces of gold per ton. By projection the continuation of the veins is a fracture zone on the north s ide of Big Hurrah Creek ( f i g 2 ) .
Antimony on Big Hurrah Creek ( 3 )
About a mile above the mouth of Big Hurrah Creek on the north bank of the stream, s t ibn i t e is exposed i n a s i l i c i f i e d , brecciated zone in Hurrah s l a t e tha t appears t o s t r i k e N12E and d i p 44W. A north-trending f a u l t cuts off the zone a t its south end. The s i l i c i f i e d zone is about 10 fee t wide and contains disseminated sulphides, mostly pyrite. Within the zone, on the footwall side, there i s s t i b n i t e in blades two t o three inches long and as f ine disseminated material. The s t i b n i t e band i s one foot t o 18 inches wide. On the bench above the stream valley a trench was dug sometime i n the past. The sides of the trench have sloughed i n and covered the rock exposures, b u t material on the dump contains abundant s t ibni te . Antimony values in samples taken across the 10-foot zone are not available, b u t gold assayed 0.07 ounces.
A t t h i s loca l i ty a small lens of limestone i s exposed along the creek and a narrow six-inch band of black limestone is i n the Hurrah s l a t e . There i s a massive quartz vein s l ight ly upstream that trends west t o northwest; i t contains minor pyrite.
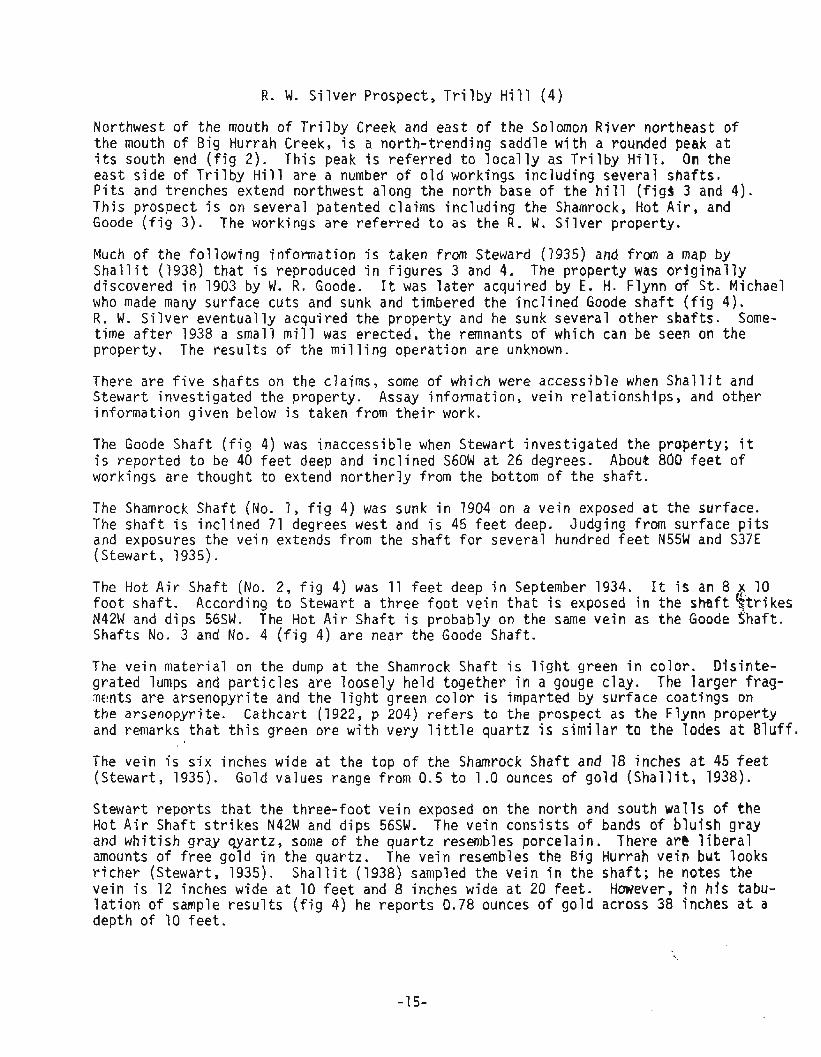
R. W. S i lve r Prospect, Tri lby Hill ( 4 )
Northwest of the mouth of Tri lby Creek and ea s t of the Solomon River northeast of the mouth of Big Hurrah Creek, i s a north-trending saddle w i t h a rounded peak a t i t s south end ( f i g 2) . This peak i s referred t o local ly as Tri lby Hi l l . On the ea s t s ide of Tri lby Hill a re a number of old workings including several shaf t s . P i t s and trenches extend northwest along the north base of the h i l l ( f ig3 3 and 4) . This prospect is on several patented claims including the Shamrock, Hot Air, and Goode ( f i g 3 ) . The workings a r e referred t o as the R. W . S i lver property.
Much of the following information i s taken from Steward (1935) and from a map by Shall i t (1938) t ha t i s reproduced i n f igures 3 and 4. The property was or ig ina l ly discovered in 1903 by W. R. Goode. I t was l a t e r acquired by E . H. Flynn of St . Michael who made many surface cuts and s u n k and timbered the inclined Goode shaf t ( f i g 4 ) . R. W. Silver eventually acquired the property and he sunk several other shaf t s . Some- time a f t e r 1938 a small mill was erected, the remnants of which can be seen on the property. The resu l t s of the milling operation are unknown.
There are f i v e shaf t s on the claims, some of which were accessible when S h a l l i t and Stewart investigated the property. Assay information, vein re la t ionships , and other information given below i s taken from t h e i r work.
The Goode Shaft ( f i g 4) was inaccessible when Stewart investigated the property; i t is reported t o be 40 f e e t deep and inclined S60W a t 26 degrees. About 800 f e e t of workings are thought to extend northerly from the bottom of the shaf t .
The Shamrock Shaft (No. 1 , f i g 4 ) was sunk in 1904 on a vein exposed a t the surface. The shaf t i s inclined 71 degrees west and i s 45 f e e t deep. Judging from surface pits and exposures the vein extends from the shaf t f o r several hundred f e e t N55W and S37E (Stewart, 1935).
The Hot Air Shaft (No. 2 , f i g 4) was 11 f e e t deep in September 1934. I t i s an 8 10 foo t shaf t . According t o Stewart a three foot vein t ha t i s exposed i n the sha f t $ t r ikes N42W and dips 56SW. The Hot Air Shaft i s probably on the same vein as the Goode Shaft. Shafts No. 3 and No. 4 ( f i g 4) a re near the Goode Shaft.
The vein material on the dump a t the Shamrock Shaft i s l i g h t green i n color. Disinte- grated lumps and par t i c les a re loosely held together i n a gouge clay. The larger frag- nents are arsenopyrite and the l i gh t green color i s imparted by surface coatings on the arsenopyrite. Cathcart (1922, p 204) re fe r s t o the prospect as the F l y n n property and remarks t ha t t h i s green ore w i t h very l i t t l e q u a r t z i s s imilar t o the lodes a t Bluff.
The vein i s s i x inches wide a t the top of the Shamrock Shaft and 18 inches a t 45 f e e t (Stewart, 1935). Gold values range from 0.5 t o 1.0 ounces of gold ( S h a l l i t , 1938).
Stewart reports t ha t the three-foot vein exposed on the north and south walls of the Hot Air Shaft s t r i k e s N42W and dips 56SW. The vein consis ts of bands of b l u i s h gray and whitish gray qyartz, some of the quartz resembles porcelain. There art! l ibe ra l amounts of f r e e gold i n the quartz. The vein resembles the Big Hurrah vein but looks r i cher (Stewart, 1935). S h a l l i t (1938) sampled the vein i n the sha f t ; he notes the vein is 12 inches wide a t 10 f e e t and 8 inches wide a t 20 f ee t . However, in his tabu- l a t ion of sample r e su l t s ( f i g 4) he reports 0.78 ounces of gold across 38 jnches a t a depth of 10 f e e t .
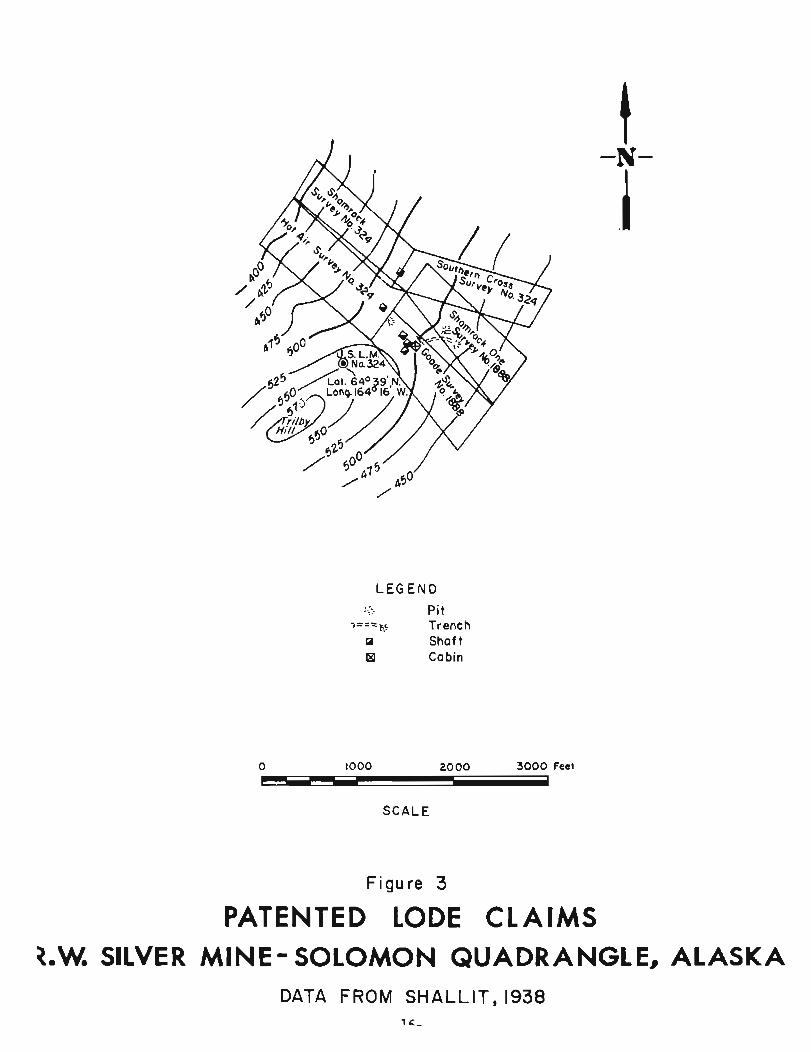
LEGEND ?.I- : i
---- Pit $-- - - - ..
I ,- Trench a Shaft E4 Cabin
0 1000 20 00 3000 Feet
SCALE
Figure 3
PATENTED LODE CLAIMS 3.W. SILVER MINE - SOLOMON QUADRANGLE, ALASKA
DATA FROM SHALLIT, 1938 1 c -

SHAFT NO. 1 /
I SOUTHERN -N-
I
HOT A I R
SAMPLE - - - IN FORMAT ION LOCATION AND D E S C R I P T I O ~ ~
- - - - - - -- - - ----
Shoft No l, dump spectman, sulfides 0 .80 0 lo Shoft No. 1, dump specimon, sulf ides
Shofl No./, dump specimon, oxidized ore
Dump, sulfide specimon
Shaft No 2 , schist foofwol/
Shoft No. 2, shattered part of vein, SE side shoft ol lO feef
Sooff of 10 No. feet 2, solid port of vein, SE side shaft
Shoff No. 2, slate honqing wall
Shattered ond solid vein, NW side shaft of /O feet
Sorted ore dump, grab sample
Sorted ore dump, grab sam~ le
Picked specimens, sheor zone dump
1 Shnff No. 4, vein, h'E s~de shoft of lO feef
1500 f + . /4 Shoff No 4, schist footwnll at /O feet
15 Sl~of f No 4 , grey quortz vein a t 10 feet
S C A L E /6 Shoff Nn 4, slate between veins
/ 7 Shaft No 4 , oxidized quartz vein
/8 Shoff No.4, s/ufe !,unging wa/ /
/ 9 Shoff No 3, grey quartz vein of 10 feef
20 Shaff No. 3, oxidized quartz vein of /O feet
2 / Grob somple, dump, sorted f/oot
11 10 f t. west to U.S. L . M . 394 at LO^. 64 $9: N, Long 164 16 W
L E G E N D / ( 1 G1 9 ): Shaft Dump SHAFT NO. 4
At I0 f t vein is 16 in., /3,/4,/5,/6, s t r ~ k e s N 34 W dips 42 W, slate ho ig ing wol I, schist footwall.
SECTION GOODE SHAFT o NE Wall , No. 4 20 Shaft 30 f t.
(Inoccessi ble) __I0
02% Vein float - 4 - Sample location ...,., A *.. Vein outcrop @ Cabin
. I \ .;I i= =$ Trench
a".- Pit
Figure 4
WORKINGS AND SAMPLES Re We SILVER MINE -SOLOMON QUADRANGLE, ALASKA
DATA FROM SHALLIT, 1938

Shaft No. 4 ( f i g 4) i s about 350 fee t northwest of the Goode Shaft and probably on the same vein structure. Accordi ng t o S h a l l i t the vein i s 16 inches wide a t 18 f e e t and s t r i kes N34W and dips 42W. A section ( f i g 4) shows a band o f gray quartz s i x and one h a l f inches wide on the f o o w a l l o f the vein tha t assays 0.81 gold, The gray quartz i s separated fronr a band o f oxidized quartz by a three-inch band o f s la te tha t assayed only 0.01 i n gold. The oxidized quartz on the hanging wal l i s seven inches wide and i t assays 0.16 gold. The country rocks an the foo t and hanging wal ls are not m i neral i zed.
From the data col lected by previous workers and from my own observations i t i s safe t o conclude tha t there are a t least two veins on T r i l b y H i 11 , and they represent two dis- t i n c t types of mineral ization; one i s f ree gold i n quartz, the other i s arsenopyrite wi th f ree gold. The veins range i n s t r i k e from N30W t o N60W and d ip SW; they are con- tinuous f o r several hundred feet a t least. Vein widths are variable, as are gold values. A grab sample I col lected from the dump o f the Goode Shaft gave 2.2 ounces of gold per ton.
The veins are i n Hurrah s la te tha t grades from hard qua r t z i t i c black s la te t o micaceous schist or phy l l i t e . The Goode vein appears t o be localized along the contact between a schistose m i caceous facies and quar t z i t i c slate. The Shamrock vein i s local ized i n the schistose facies according t o S h a l l i t (1938), Stewart mentions s imi la r var iat ions i n the Hurrah s la te i n the Big Hurrah Mine.
North side Big Hurrah Creek, Mouth of L i t t l e Hurrah Creek t o Mouth of T r i l b y Creek (5)
The r idge tha t slopes southward from the d iv ide between East Fork Creek and Big Hurrah Creek east o f T r i l b y Creek ( f i g 2) i s made up of Hurrah s la te that i s traversed by numerous quartz veins and veinlets. The number of prospect p i t s i n the s la te are a good ind icat ion o f how thoroughly the area has been prospected.
Samples o f vein matter were col lected from a number o f l o c a l i t i e s on the ridge. None carr ied appreciable amounts of gold, copper, lead, o r zinc. The quarts i s c rys ta l l i ne t o massive.
North side Big Hurrah Creek, Unnamed Creek West o f Mouth o f L i t t l e Hurrah Creek (6)
About a m i l e above the mouth o f a stream tha t enters Big Hurrah Creek from the north are several prospect p i t s and trenches. The stream i s unnamed; i t i s between Hutt Creek and T r i l b y Creek ( f i g 2).
Vein material on the dumps consists o f quartz and pyr i te . Some of the quartz i s crys- t a l l ine; there are wel l terminated crystals up t o two inches i n length. Analyses f o r gold, copper, lead, and zinc detected l i t t l e o f value i n grab samples and sorted sam- ples from the dumps. The highest value was 0.17 ounces o f gold and 0.04 percent copper. No veins were seen i n place, but judging from the aligrment o f the workings the vein or veins s t r i k e north t o northeast.
Cathcart (1922, p 199-200) included the fol lowing remarks concerning t h i s prospect. The workings are so caved and slumped tha t no veins can be seen. Quartz on the dump a t the main shaf t i s o f open texture and coarsely crysta l l ine. There i s considerable sulphide i n the quartz as well-defined veins which i n places swells t o nests. Py r i t e and pyrrhot i t e are the p r i ncipal sulphides. There i s some arsenopyrite, and chalcopyrite i s recognizable microscopically. The vein i s s t ruc tu ra l l y d i f f e ren t from others i n the

area i n the absence o f " r ibbon rock", and i t i s m i n e r a l o g i c a l l y d i f f e ren t from most sulphide-bearing go ld lodes, because o f t he preponderance of p y r r h o t i t e over arseno- p y r i t e and t h e presence o f chalcopyr i te.
M i n e r a l i z a t i o n South o f Big Hurrah Creek (7 )
On t h e south s i d e o f B ig Hurrah Creek t h e Hurrah s l a t e contains quartz v e i n l e t s t h a t fill the numerous f rac tu res i n the rocks. A number o f r i bbon rock and quar tz ve in samples were taken b u t s i g n i f i c a n t amounts o f gold, copper, lead, o r z i n c were no t detected. Prospect p i t s , trenches, ad i t s , and sha f t s , 1 ong abandoned, are p l e n t i f u l throughout t h e area.
Other Prospects
Smith (1910) and Cathcart (1922) mention several prospects i n the v i c i n i t y o f Uncle Sam Mountain. Reportedly, none o f these contained economic amounts o f go ld o r o ther minerals and they were no t v i s i t e d by the w r i t e r dur ing t h i s i nves t i ga t i on .
VEIN AND DISSEMINATED DEPOSITS IN THE SOLOMON SCHIST
Head o f West Creek ( 8 )
About two m i les above t h e mouth o f West Creek a t t he western edge o f t h e area mapped there a re several prospects i n the Solomon sch is t . The veins bear no apparent r e l a - t i o n t o contacts, b u t they are along the ax i s o f an overturned syncl ine.
A t the present t ime a l l t h a t can be seen a t t h e prospect i s t he p o r t a l o f a caved a d i t and a dump conta in ing quartz h e a v i l y impregnated w i t h p y r i t e . The a d i t t rends about S l O E i n t o the h i l l on the south bank o f West Creek. A grab sample from the dump assayed 0.04 ounces o f gold. A zone o f quartz f l o a t trends S30W up the h i l l s l o p e from the p o r t a l . The zone i s about 250 f e e t long and 50 f e e t wide. A composite sample o f quartz fragments from t h i s zone assayed 0.11 ounces o f go ld and 0.01 ounces of s i l v e r .
I n 1910 Smith (p 148) noted t h a t t he re were 600 o r 700 f e e t of underground workings a t t he prospect. An a d i t was d r i ven about 350 f e e t along the vein. Both w a l l s a re i n c h l o r i t i c sch is t . A t places s l i ckens ides are ev ident on both wa l ls . A crosscut f o l l o w s a small cross s t r i n g e r o f quartz from the main a d i t . About 350 f e e t west of t h e f i r s t a d i t a second ve in o f the same character was opened by an a d i t 300 f e e t long.
The quartz i n the veins i s wh i te and shattered, b u t no t sheared o r folded. C h l o r i t e i s abundant; p y r i t e and marcasi te occur i n vugs i n the quartz. According t o Smith (1910, p 148) the w a l l rocks as w e l l as the quartz are minera l ized and c a r r y about ha l f an ounce o f go ld per ton.
According t o Cathcart (1922, p 198), who r e f e r s t o t h e l o c a l i t y as the Alden prospect, arsenopyr i te i s abundant and impregnates the w a l l rocks i n an assoc ia t ion common i n t h e v i c i n i t y o f Nome.
Head Kasson Creek (9)
Near t h e head of Kasson Creek, a t r i b u t a r y o f Shovel Creek, a shor t , steep t r i b u t a r y enters from t h e south. About one-quarter m i l e above t h e mouth o f t he draw, f l o a t cons is t i ng o f l i m o n i t e and f i n e disseminated sulphides i n calcareous s c h i s t are i n the loose debr is o f t he stream bed. The source o f the f l o a t was not found. A sample of t he sulphide ma te r ia l assayed 0.07 ounces o f gold.

Mouth of Johns Creek (10)
At the north end of the mapped area near the confluence of Johns Creek and the Solomon River, outcrops of Solomon schist are broken, shattered, and highly jointed. The rocks are siliceous; quartz lenses are abundant and quartz stringers fill frac- tures. Pyrite and minor chalcopyrite are associated with the quartz. Analyses of samples show that mineralization in economic quantities is wanting, however. The best sample obtained was from a lens of quartz one foot by five feet that assayed 0.18 percent copper with traces of lead, zinc, and gold.
DISSEMINATED DEPOSITS IN LIMESTONE
Fault contacts between the Sowik limestone and the Solomon schist are sites for the localization of disseminated copper mineralization. Although concentrations in eco- nomic quantities were not found, the mineralization is widespread.
Gold is associated with the copper at most places. Smith (1910, p 215) points out a distinct relation between areas of rich placer ground and contacts between limestone and schist at several places on the Seward Peninsula.
A few disseminated copper minerals can be found along limestone-schist contacts almost anywhere in the area mapped. A few localities where the minerals can be most readily observed, are mentioned below; only one locality is discussed in detail. Localities include the head of Penny Creek ( 11, fig 2), near the head of Johns Creek as float (12, fig 2), on Nobhill Creek, a tributary of Kasson Creek (13, fig 2 ) , and the lime- stone hill on the west side of the Solomon River just north of the mouth of Big Hurrah Creek (area A, fig 2).
The base of the limestone is commonly silicified for 10 to 15 feet above the contact. At places the replacement of calcium carbonate has been almost complete and little 1 imestone remains. Within the zone of si 1 icif ication secondary copper minerals, mostly malachite, are disseminated. Rarely small sulphide blebs can be seen in the silicified zones. Values of grab samples of float and samples chipped from outcrops range from 0.13 to 0.78 percent copper. Over a large area a deposit would probably average only 0.2 to 0.3 percent copper. Gold was detected in only trace amounts in the samples at most places. Samples from near the head of Penny Creek contain from 0.02 to 0.08 ounces of gold and 0.02 to 0.04 ounces of silver.
Detailed mapping of one occurrence was done to better understand this type of deposit i n the quadrangle. The limestone hill west of the Solomon River and north o f the mouth of Big Hurrah Creek was selected for study (area A, fig 2).
Disseminated Copper Deposit West of Solomon River
Area A on figure 2 is shown in detail in figure 5. An alidade and plane table were used to locate points by stadia measurement. The purpose of the study was to learn what factors influence the localization of the copper minerals in the vicinity.
The limestone outcrop pattern indicates a thrust fault in the northwest part of the area; the fault trends north to northeasterly and separates the area into blocks of limestone separated by bands of schist.
Along the east margin of the area, high angle faults offset the thrust plate. Three prominent high-angle fracture trends are present, these are northwest, northeast, and east-west.

Two cross-sections were prepared and represent an interpretation of the data. Other interpretations are possible, b u t the interpretation presented seems to f i t the ob- served data best.
Si l ica has replaced the limestone along the high angle f au l t s and along the thrust ~ 7 a t e . Near the trace of the thrust f a u l t in the n o r t h central part of the area a zone o f s i l i c i f i ca t ion 10 to 15 f ee t wide can be traced intermittently fo r about 1500 fee t . A t the west contact between the limestone and sch i s t , in the upper thrust plate , s i l i c i f i ca t ion i s also present, b u t i t i s less intense than in the limestone on the lower thrust plate.
S i l ic i f ica t ion along h i g h angle f au l t s i s irregular. A t places i t appears t o have been pervasive on both sides of the fracture and moved as an irregular front into the limestone; i t decreases in intensity away from the f au l t . A t other places irregular lenses of s i l i c a i n contorted shapes are i n s l igh t ly altered limestone. The replace- ment phenomena are related to fau l t s of one kind or another; the f a u l t s provided channelways f o r the altering solutions.
Copper minerals, generally in the form of carbonates, such as malachite and less commonly azuri te are in the s i l i c i f i e d zones. Sulphides are present a t some places, b u t they are sparse. The copper i s widely disseminated, b u t i t is not concentrated in s ignif icant amounts a t any given locality. Gold i s also sparse. No attempt i s made to estimate the overall grade because sampling was inadequate.
The mineralization would probably follow the thrust f a u l t downdip; i t i s not known i f the grade would improve away from the influences of surface leaching and oxidation. The mineralization along the high-angle f au l t s would probably pers i s t in depth t o the base of the limestone. The thickness of the limestone i s unknown. Only subsurface exploration would provide answers t o the above questions.
MINERALIZATION IN GREENSTONE
In that part of the Sol omon quadrangl e mapped geological ly , small metamorphosed i n t r u - s ive bodies are represented by greenstone in the northwest part of the area, along Shovel, Doverspike, and Johnson Creeks. According t o Smith (1910, pl VI) other greenstone bodies a re larger and more plentiful outside of the area mapped in the eastern part of the quadrangle.
Sulphide minerals are sparsely disseminated through greenstone samples, but analyses reveal only trace amounts of gold, copper, lead, or zinc.
SUMMARY OF ECONOMIC GEOLOGY
The following points a re s ignif icant i n regard t o mineral deposits in the region:
1. Gold-bearing veins and veinlets are most abundant in the Hurrah s l a t e , but only a t the B ig Hurrah Mine and on Trilby Hill is gold known to be present i n economic quantit ies.
2. The R. W. Silver prospect should be investigated further because there are a t leas t two vein systems, there are economic amounts of gold in the veins, and the veins are continuous. T h i s i s the most promising deposit seen i n the area mapped.
3. Lode mineral deposits are i n the Solomon sch i s t , b u t i n general they are sparse and low grade.

4. Copper-gold mineralization accompanies s i l i c i f i ca t ion a t schist-limestone contacts in zones of thrust faulting. No deposits containing economic amounts of copper minerals were found i n the area mapped.
5. Greenstone bodies carry sulphides, b u t values are poor.
G E O C H E M I S T R Y
Geochemical sampling i n the Solomon C-5 quadrangle resulted i n two sets of data. One se t represents analyses of stream sediment samples from a l l of the streams i n the up- land portion of the quadrangle ( f i g 2 ) . The other s e t of data i s made up of analyses of so i l and rock samples from the Hurrah s l a t e . Samples were collected throughout the outcrop area of the Hurrah s l a t e shown on figure 2 (area B ) . Data from the Hurrah s l a t e are s t i l l being analyzed and only preliminary conclusions can be drawn. A detailed report on t h i s phase of the project is contemplated fo r the future.
STREAM SEDIMENT SAMPLING
Sampling and Analytical Methods
Samples were collected a t one-quarter mile intervals from the active bed of each stream i n the upland portion of the quadrangle. Sample s i t e s a re shown on figure 2. Fine sand or s i l t , rather than coarse material, was collected where possible and stored i n plast ic bags. Care was taken t o exclude organic material from the samples. The samples were analyzed i n camp by dithizone f i e ld t e s t s described by Hawkes (1963) before being sent to the laboratory a t College fo r analysis. Appendix I shows the resu l t s of the f i e ld t e s t s as compared to laboratory analyses for gold, copper, lead, and zinc, i n addition to notes concerning the various sample s i t e s .
The samples were dried i n the College laboratory of the Division of Mines and Geology and then forwarded to the U. S. Geological Survey Field Laboratory i n Anchorage f o r analyses.
The U. S. Geological Survey analyzed each sample f o r gold, copper, lead, and zinc by atomic absorption. A 30-element semiquantitative spectrographic analysis was also performed on each sample. Analytical l imits and ranges of detection are shown i n Appendix 11. Apprndix 111-A and 111-B are l i s t s showing the resu l t s of the laboratory analyses for each sample.
A computer program t o tabulate the samples and calculate s t a t i s t i c a l character is t ics of the analytical data was written by L . E. Heiner, Mining Engineer, University of Alaska. The IBM 360 computer a t the University of Alaska performed the computations.
Samples were assigned map numbers before they were fed into the computer. The computer tabulated a l i s t of samples and analytical data i n numerical order according to map number. For each element the mean and the standard deviation were calculated. From these measures of central tendency the threshold value, or upper l imit of normal back- ground fluctuation, and anomalous values were determined f o r each element. The computer also plotted histograms of frequency dis t r ibut ion f o r selected elements. As a special project, a zinc trend surface map was plotted and residuals determined.

The thresho ld and anomalous values f o r each element were computed by methods de- scr ibed i n Hawkes and Webb (1962, p 30). The th resho ld value i s taken as the mean p lus tw ice t h e standard dev ia t ion ; anomalous values are taken as the mean p lus th ree standard deviat ions. These values are meaningful f o r a normal d i s t r i b u t i o n ; the f u r t h e r the data departs from normalcy the l ess r e l i a b l e i s the computed thresh- o l d and anomalous value. Frequency d i s t r i b u t i o n histograms f o r copper and z i n c as determined by atomic absorpt ion and lead as determined by spectrograph are shown i n Appendix I V . Table 2 shows the th resho ld and anomalous values f o r each element detected.
Table 2 - Threshold and Anomalous Values, Stream Sediment Samples, Solomon Quadrangle, Alaska (Values i n pa r t s per m i l l i o n unless i nd i ca ted otherwise; (1) = Atomic Absorpt ion)
Threshold Anomalous Threshold Anomalous E 1 emen t Value Value Element Value Value
Gold (1) Copper (1 Lead (1) Z inc (1) Copper Lead Zinc Molybdenum S i l v e r Cobalt Chromium Nicke l Manganese
Ti tanium (%) I r o n (%) Magnesium (%) Calcium (%) Bar i um S t r o n t i urn Boron Bery l 1 i um Zirconium Lanthanum Niobium Scandi um Y t t r i um Vanadium
The concentrat ion o f an element i n a g iven sample i s e i t h e r i n the background range, between the th resho ld value and anomalous value o r g reater than the anomalous value. Samples are considered poss ib l y anomalous i f the concentrat ion i s between the thresh- o l d value and the anomalous value and probably anomalous if t h e concentrat ion of an element i s above the anomalous value. Samples conta in ing concentrat ions o f copper, l e ad , z i n c , o r gold i n t h e poss ib ly anomalous and probably anomalous ranges a r e i n d i - cated on f i g u r e 2. Samples conta in ing anomalous amounts of coba l t , molybdenum, and s i l v e r a r e a l s o shown.
Discussion o f Anmal i e s
A study o f Appendix 111, t h a t shows the r e s u l t s of labora tory analyses o f stream sedi- ment samples, revea ls t h a t r e s u l t s o f analyses f o r copper and lead by atomic absorpt ion cannot be co r re la ted w i t h the r e s u l t s o f analyses fo r copper and lead by spectrographic methods. For example where the spectrographic ana lys is shows anomalous copper i n a sample, atomic absorpt ion may show on ly low background, and vice-versa. The same i s t r u e f o r lead. Z inc analyses by the two methods show some v a r i a t i o n , b u t the corre- l a t i o n i s b e t t e r . No explanat ion i s o f f e r e d f o r t he discrepancy. Poss ib ly and prob- ab ly anomalous samples i nd i ca ted on f i g u r e 2 a re based on r e s u l t s frm e i t h e r method.

There are several copper anomalies i n the part of the quadrangle tha t was mapped geologically. None were judged to be of economic significance. The copper anom- a l i e s occur below contacts of limestone and schis t tha t a re known t o contain sparse amounts of copper, such as on Penny Creek and Minnesota Creek. Copper anomalies are in the northwest corner of the area near Johnson and Doverspike Creeks where greenstone is abundant. Some of the samples that are anomalous in copper a re . also weakly anomalous i n cobalt i n areas where greenstone crops out. Anomalous copper i s found below the t race of a f a u l t tha t trends northeast and crosses the upper part of West Creek. Soil and rock samples from the vicini ty of th i s f au l t a re weakly anomalous i n gold and s i lver . Sample 91, s l ight ly fur ther east on West Creek, shows anomalous molybdenum on a fracture of para1 l e l orientation. The anomalous samples indicate hydrothermal ac t iv i ty and mineralization along these f a u l t structures. Indi- cations of mineralization were not detected by geologic observations.
There is a minor copper anomaly i n the Hurrah s l a t e below the antimony vein described previously. The quartz-sulphide f l o a t i n the f i r s t t r ibutary to Big Hurrah Creek from the south contains enough copper to be detectable i n stream sediments.
Outside the mapped area copper anomalies occur a t the east edge of the quadrangle on the Kocheblok River and 0 ' Brien Creek. According to Smith (1910, pl. VI) greenstone intrusive bodies are abundant i n the vicini ty , and these probably contribute copper to the anomalous samples. Lead anomalies, discussed below, indicate that f racture trends cross the h i g h ridge west of the anomalies. These also may be the source of the anomalous copper.
Samples anomalous in lead form the most d is t inc t pattern. East of the Solomon River, and west of the Solomon River southwest of the mouth of Shovel Creek, the upper portions of streams containing samples anomalous in lead form a ser ies of parallel lineaments that trend northwest across the map area. In several places zinc i s associated with the lead, and near Uncle Sam Mountain there is anomalous molybdenum. These trends most l ikely mark the traces of mineralized fractures that cross the region. I t i s noteable that one of these lineaments can be traced northwest from the east s ide of Uncle Sam Mountain, through Linda Vista Creek, across Trilby Hill t o the Solomon River. I t s northwest extension appears to be cut off by the north-trending f au l t just below the mouth of East Fork Creek. Mineralization i s known a t several places along the trend.
I t i s doubtful that the anomalies are derived from lode deposits of lead, b u t they do delineate mineralized fracture zones. Investigation of these zones might lead to lode gold deposits. Closely spaced so i l samples transverse to the trends indicated is one recommended method. Other methods m i g h t work as well.
A t places, as i n upper Shovel Creek, samples anomalous i n lead and calcium occur in the Sowik limestone. These appear to be associated w i t h ca lc i te veins tha t cut the limestone and are of l i t t l e significance.
Samples anomalous i n z inc only are not comnon i n the quadrangle. Samples tha t contain abnormal concentrations of zinc are usually anomalous in copper or lead as well. In general the dis t r ibut ion pattern of anomalous zinc samples i s similar t o tha t described fo r lead.
Sample 21 i s near the head of Ball Creek; i t contains 20 parts per million s i lver . T h i s is the only stream sediment sample in ' t he quadrangle tha t contained anomalous s i lver .
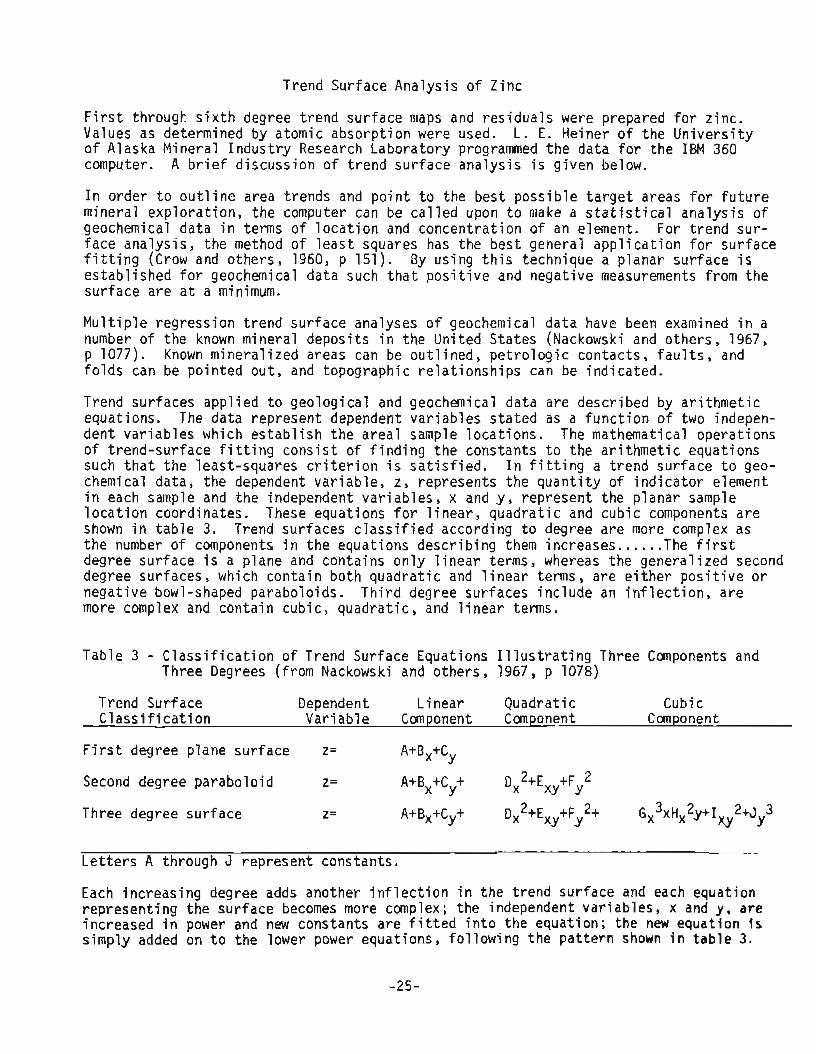
Trend Surface Analysis of Zinc
Fi rs t through s ixth degree trend surface maps and residuals were prepared for zinc. Values as determined by atomic absorption were used. L . E . Heiner of the University of Alaska Mineral Industry Research Laboratory programmed the data for the IBM 360 computer. A brief discussion of trend surface analysis i s given below.
In order to outline area trends and point to the best possible target areas for future mineral exploration, the computer can be called upon to make a s t a t i s t i c a l analysis of geochemical data in terms of location and concentration of an element. For trend sur- face analysis, the method of least squares has the best general application for surface f i t t i n g (Crow and others, 1960, p 151). By using th i s technique a planar surface i s established for geochemical data such that positive and negative measurements from the surface are a t a minimum.
Multiple regression trend surface analyses of geochemical data have been examined in a number of the known mineral deposits i n the United States (Nackowski and others, 1967, p 1077). Known mineralized areas can be outlined, petrologic contacts, f a u l t s , and folds can be pointed out, and topographic relationships can be indicated.
Trend surfaces applied to geological and geochemical data are described by arithmetic equations. The data represent dependent variables stated as a function of two indepen- dent variables which establish the areal sample locations. The mathematical operations of trend-surface f i t t i n g consist of finding the constants to the arithmetic equations such that the least-squares cr i ter ion is sa t i s f ied . I n f i t t i n g a trend surface t o geo- chemical data, the dependent variable, z , represents the quantity of indicator element in each sample and the independent variables, x and y , represent the planar sample location coordinates. These equations fo r l inear , quadratic and cubic components a re shown i n table 3. Trend surfaces classif ied according to degree are more complex as the number of components i n the equations describing them increases ...... The f i r s t degree surface i s a plane and contains only l inear terms, whereas the generalized second degree surfaces, which contain both quadratic and linear terms, are ei ther positive or negative bowl-shaped paraboloids. Third degree surfaces include an inf lect ion, are more complex and contain cubic, quadratic, and linear terms.
Table 3 - Classification of Trend Surface Equations I l lus t ra t ing Three Components and Three Degrees (from Nackowski and others, 1967, p 1078)
Trend Surf ace Dependent Linear Quadratic Cubic Classification Variable Component Component Component
F i rs t degree plane surface z= A+Bx+Cy
Second degree paraboloid
Three degree surface
Letters A through J represent constants.
Each increasing degree adds another inflection in the trend surface and each equation representing the surface becomes more complex; the independent variables, x and y , are increased i n power and new constants are f i t t e d into the equation; the new equation i s simply added on t o the lower power equations, following the pattern shown i n table 3.

Figure 6 shows generalized trend surfaces for the f i r s t three degrees and variables.
IST DEGREE 2 N D DEGREE 3 R D DEGREE
PLANE PARABOLOID .THIRD DEGREE SURFACE
Figure 6
Generalized t rend surfaces fo r three surfaces for three degrees and three variables. (A f te r Nackowski and others , 1967. )
"The trend surface i t s e l f represents the regional component or geochemical trend. This surface, or the value of any point on the surface, represents a threshold value which i s variable across the map area. " ( L . kleiner, personal communication, 3-25-69)
Values which f a l l above or below the trend surface i n any degree are termed residuals. Each advancing trend surface degree will generally cover some of the residuals from the degree below i t . Residuals t h a t pers is t through increasing trend surface degrees are considered possible target areas for future prospecting and mineral exploration.
Figure 7 i s a map of the s ixth degree trend for zinc with residual values.
The trend map indicates a northwest regional trend of the geochemical data. The resid- uals, which represent anomalies are also aligned northwest. The trend surface study confirms the conclusion that there are mineralized structures i n the quadrangle that trend northwest. The trend surface also indicates that the structures extend across the en t i re quadrangle and include the head of Topnotch Creek where an anomalous s i lver value was found.
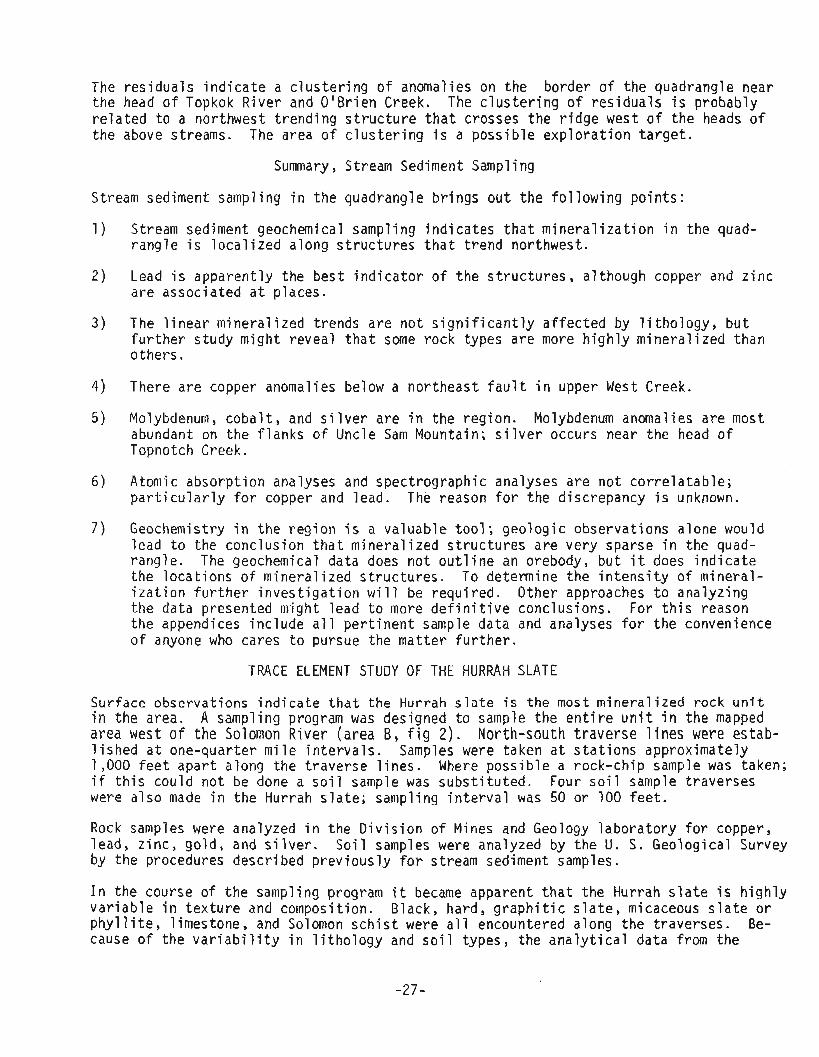
The r e s i d u a l s i n d i c a t e a c l u s t e r i n g o f anomalies on t he border o f t h e quadrangle near t h e head of Topkok R i v e r and 0 ' B r i e n Creek. The c l u s t e r i n g o f r e s i d u a l s i s p robab ly r e l a t e d t o a nor thwest t r end ing s t r u c t u r e t h a t crosses t h e r i d g e west o f t h e heads of t he above streams. The area o f c l u s t e r i n g i s a p o s s i b l e e x p l o r a t i o n t a r g e t .
Summary, Stream Sediment Sampling
Stream sediment sampling i n t h e quadrangle b r i n g s o u t t h e f o l l o w i n g p o i n t s :
1 ) Stream sediment geochemical sampl ing i n d i c a t e s t h a t m i n e r a l i z a t i o n i n t he quad- r a n g l e i s l o c a l i z e d a long s t r u c t u r e s t h a t t r e n d nor thwest .
2) Lead i s apparen t l y the b e s t i n d i c a t o r o f t h e s t r u c t u r e s , a l though copper and z i n c a re assoc ia ted a t p laces.
3) The l i n e a r m ine ra l i zed t rends a r e n o t s i g n i f i c a n t l y a f f e c t e d by l i t h o l o g y , b u t f u r t h e r s tudy m igh t r evea l t h a t some r o c k types a r e more h i g h l y m i n e r a l i z e d than o thers .
4) There a re copper anomalies below a no r theas t f a u l t i n upper West Creek.
5) Molybdenum, c o b a l t , and s i l v e r a re i n t he reg ion . Molybdenum anomalies a re most abundant on t he f lanks of Uncle Sam Mountain; s i l v e r occurs near t h e head of Topnotch Creek.
6 ) Atomic absorp t ion analyses and spec t rograph ic analyses a r e n o t c o r r e l a t a b l e ; p a r t i c u l a r l y f o r copper and lead. The reason f o r t he d iscrepancy i s unknown.
Geochemistry i n t h e r e g i o n i s a va luab le t o o l ; geo log i c observa t ions a lone would l ead t o t he conc lus ion t h a t m ine ra l i zed s t r u c t u r e s a r e ve ry sparse i n the quad- rang le . The geochemical data does n o t o u t l i n e an orebody, b u t i t does i n d i c a t e t h e l o c a t i o n s o f m i n e r a l i z e d s t r u c t u r e s . To determine t h e i n t e n s i t y o f m ine ra l - i z a t i o n f u r t h e r i n v e s t i g a t i o n w i l l be requ i red . Other approaches t o ana lyz ing t h e da ta presented migh t l ead t o more d e f i n i t i v e conc lus ions. For t h i s reason t he appendices i n c l u d e a l l p e r t i n e n t sample da ta and analyses f o r t h e convenience o f anyone who cares t o pursue t he ma t te r f u r t h e r .
TRACE ELEMENT STUDY OF THE HURRAH SLATE
Sur face observat ions i n d i c a t e t h a t t h e Hurrah s l a t e i s t he most m i n e r a l i z e d rock u n i t i n the area. A sampl ing program was designed t o sample t he e n t i r e u n i t i n t h e mapped area west of t he Solomon R i ve r (area B, f i g 2 ) . Nor th-south t r a v e r s e l i n e s were estab- l i s h e d a t one-quar ter m i l e i n t e r v a l s . Samples were taken a t s t a t i o n s approx imate ly 1,000 f ee t a p a r t a long t h e t r a v e r s e l i n e s . Where p o s s i b l e a rock -ch ip sample was taken; if t h i s cou ld n o t be done a s o i l sample was s u b s t i t u t e d . Four s o i l sample t r ave rses were a l s o made i n t he Hurrah s l a t e ; sampling i n t e r v a l was 50 o r 100 fee t .
Rock samples were analyzed i n t he D i v i s i o n o f Mines and Geology l a b o r a t o r y f o r copper, lead, z i n c , go ld , and s i l v e r . Soi 1 samples were analyzed by t h e U. S. Geo log ica l Survey by t he procedures descr ibed p r e v i o u s l y f o r stream sediment samples.
I n t he course o f t h e sampl ing program i t became apparent t h a t t h e Hurrah s l a t e i s h i g h l y v a r i a b l e i n t e x t u r e and composit ion. Black, hard, g r a p h i t i c s l a t e , micaceous s l a t e o r p h y l l i t e , 1 imestone, and Solomon s c h i s t were a1 1 encountered a long t he t raverses . Be- cause of t he v a r i a b i l i t y i n l i t h o l o g y and s o i l types, the a n a l y t i c a l da ta from t h e

0 I 2 4 5Miles
SCALE I 1
Figure 7
IXTH DEGREE ZINC TREND SURFACE MAP & RESIDUALS
SOLOMON C- 5 QUADRANGLE, ALASKA

various rock types should be treated independently in order t o establish meaningful figures for threshold and anomalous values. Spectrographic analyses should be made of the rock samples so that resul ts can be compared to so i l samples. This work i s contemplated for the future. A separate report with complete detai ls of the resul ts of sample analyses and conclusions will be prepared.
Preliminary work shows that the Hurrah s l a t e does not contain disseminated gold in commercial quantit ies. Throughout most of the outcrop area, gold occurs in only trace amounts. Copper, lead, or zinc in soil and rock samples are not re l iab le path- finder elements for gold deposits in the Hurrah s la te . These elements did not indi- cate the presence of the Big Hurrah Mine.
Further research will point out which elements are rel iable indicators and the ele- mental variation in the differing 1 i thologies.
S U M M A R Y
CONCLUSIONS
As a resul t of th i s study the following conclusions have been reached:
1 ) A combination of applied geology and geochemistry i s effective for locating min- eralized structures in the region.
2 ) The rocks in t h e Solomon C-5 quadrangle are probably Paleozoic in age and equiv- alent t o the Nome group that i s recognized elsewhere on the Seward Peninsula. The Hurrah s l a t e i s probably an interbed in the Solomon schis t and i s older t h a n the Sowik limestone.
3 ) The structural history of the region i s highly complex. Structures include over- turned folds , thrust f au l t s , high angle normal f au l t s , and a subordinate se t of northwest fractures. All of these have had an influence on the location of lode deposits, b u t the northwest fracture system i s the most important.
4) The Hurrah s l a t e appears to be the most highly mineralized rock unit in the region, b u t geochemical data indicate that l i thologic control of lode deposits i s less important than structural control.
5) The Big Hurrah vein system i s of limited extent. Neither past prospecting nor the geochelnical work done during the course of th is project revealed vein exten- sions t o the northwest or southeast. The veins may be terminated by fau l t s northwest and southeast of the mine.
6 ) Except for t h e gold deposits on Tri 1 by Hill no lode deposits were observed t h a t are of economic interest in the Hurrah s l a t e .
7 ) There are a t leas t two veins on the R . W . Silver property on Trilby Hill. The veins s t r ike northwest and are continuous on the surface for several hundred feet . Gold values range from 0.5 to 1.0 ounce per ton.
8) I n the Solomon schis t sulphide deposits are sparse and of l i t t l e consequence. The old prospect on upper West Creek may have some potential. Two quartz veins with pyrite and arsenopyrite a re opened by d r i f t s and the wall rocks are mineralized.

9 ) Copper mineralization i s widespread i n the Sowik limestone where the u n i t i s in contact with the Solomon schis t . Detailed study shows tha t s i l i c a replaces limestone along thrust fau l t s and high angle f au l t s ; sparse copper carbonates are associated with the s i l i c i f i ca t ion .
10) Greenstone bodies contain disseminated sulphides, but apparently not in economic quantit ies.
11) Lead in stream sediment samples i s a re l iab le indicator element. A number of northwest-trending fractures were outlined by lead anomalies. Zinc, molybdenum, and s i lve r are associated w i t h the lead a t places. Further exploration will be required to learn i f mineralization i s concentrated along the fractures in eco- nomic quantit ies. A zinc trend surface map supports the conclusion that north- west trending fractures are mineralized.
12) Copper anomalies point out limestone-schist contacts, verify the presence of a f a u l t , and indicate areas where greenstone crops out. Minor cobalt i s also asso- ciated with the greenstone.
13) Residuals from the trend map show a cluster of anomalies near the head of 0' Brien Creek. This may be a target area.
14) The resul ts of a sampling program across the outcrop area of the Hurrah s l a t e are s t i l l being studied. A preliminary conclusion i s that the Hurrah s l a t e apparently does not contain disseminated gold in economic amounts.
15) The potential of the area as a whole seems low. Northwest fractures are mineral- ized, b u t the deposits are not exposed on the surface, and the concentration of metals in them is not known.
SUGGESTIONS TO PROSPECTORS
The work done i n the Solomon quadrangle failed to define any exploration targets with well defined boundaries. There a re indications of mineralization, however, and anyone prospecting i n the area should consider the following points:
1) There a re mineralized structures in the region that trend northwest. The struc- tures can be detected by geochemical means. Lead in stream sediment samples is a re l iab le indicator element.
2) Because mineralized zones are indicated by geochemical anomalies rather t h a n conventional prospecting techniques no estimation of the quality or quantity of mineralization is possible. Further investigation of these zones may reveal eco- nomic deposits beneath the tundra. Ore minerals i n the area contain copper, lead, zinc, gold, s i l v e r , and molybdenum.
3 ) Geochemistry i s an invaluable prbspecting tool i n the region because the ore zones do not crop out,
R E F E R E N C E S C I T E D
Alaska Division of Mines and Geology Fi les , 1952, Unpublished assay data.
Brooks, A. H . , 1901, Reconnaissance in the Cape Nome and Norton Bay regions, Alaska, i n 1900: Spec. publication, U. S. Geol. Survey

Brooks, A . H . , 1913, P l ace r mining i n Henshaw, F. Fey and Parker , G . L . , Sur face water supply of Seward peninsu la , Alaska: U . S. Geol. Survey Water Supply Paper 314, p 269-303 of 317 p
Ca thca r t , S. H . , 1922, Solomon d i s t r i c t i n Me ta l l i f e rous lodes i n southern Seward Peninsu la , Alaska: U. S. Geol. s u r v e y Bull 722-F, p 197-205
C o l l i e r , A . J . , 1904, The t i n d e p o s i t s of t h e York r eg ion , Alaska: U . S. Geol. Survey Bull 229, 61 p
C o l l i e r , A. J , , Hess, F. L . , Smith, P . S. and Brooks, A . H . , 1908, The gold p l ace r s of p a r t s of Seward Peninsu la , Alaska, inc lud ing t h e Nome, Counci l , Kougarok, Por t Clarence, and Good Hope p r e c i n c t s : U . S. Geol. Survey Bull 328, 343 p
Crow, E . L . , Davis, F. A . , and Maxfield, M . W . , 1960, S t a t i s t i c s manual: Dover publ i - c a t i o n s , New York, 288 p
Harbaugh, J . W . , 1964, A computer method f o r f o u r v a r i a b l e t r end a n a l y s i s i l l u s t r a t e d by a s tudy of o i l - g r a v i t y v a r i a t i o n s i n sou theas t e rn Kansas: S t a t e Geol. Survey of Kansas Bull 171 , 58 p
Hawkes, H. E . , 1963, Dithizone f i e l d tests: - i n Econ. Geology, vol 58, p 579-586
Hawkes, H . E . , and Webb, J . S . , 1962, Geochemistry i n mineral exp lo ra t i on : Harper and ROW, New York, 415 p
He l l e r i ch , George, 1954, Operat ing r e p o r t , Big Hurrah mine, June-October , 1954: P r i v a t e r e p o r t i n f i l e s of Alaska Divis ion of Mines and Geology
L u , F. C . J . , Heiner, L. E . , and DeVerle, P. H . , 1968, Known and p o t e n t i a l o r e r e se rves Seward Peninsu la , Alaska: Univ. of Alaska, Mineral Ind. Research Laboratory Report No. 18 , 105 p
Nackowski , M . P . , Mardirosian, C . A . , and Botbol , J . M . , Trend s u r f a c e a n a l y s i s of t r a c e chemical d a t a , Park C i ty d i s t r i c t , Utah: Econ. Geology, vol 62, p 1072-1087
Saunders, R . H . , 1964, Big Hurrah mine: Unpublished r e p o r t i n f i l e s of Divis ion of Mines and Geology, 3 p
S h a l l i t , A. B . , 1938, Map, Aneroid and Brunton ske t ch of Survey 324 and 1888, R . W . S i l v e r , owner: Unpublished map i n f i l e s of Division of Mines and Geology
Smith, P . S . , 1907, Gold f i e l d s of t h e Solomon and Niukluk River bas ins : U. S. Geol. Survey B u l l 314-H, p 146-156
, 1910, Geology and mineral resources of t h e Solomon and Casadepaga quad- r a n g l e s , Seward Peninsu la , Alaska: U . S. Geol. Survey Bull 433, 234 p
S tewar t , B. D . , 1935, Notes on t h e gold- lode proper ty of R . W . S i l v e r i n the Solomon River d i s t r i c t , Seward Peninsula: Unpublished r e p o r t i n f i l e s of Divis ion of Mines and Geology, 4 p
klahrhaftig , Clyde, 1965, ~ h i s i o ~ r a ~ h i c d i v i s i o n s of Alaska: U. S. Geol . Survey Prof . Paper 482, 52 p

APPENDIX I
Geochemical F ie ld d a t a , r e s u l t s of cold e x t r a c t a b l e metals t e s t ,
and comparison t o labora tory ana lyses f o r go ld , copper, l e a d , and z i n c
Concentrat ion (ppm) ( 1 ) APP Map Sample F ie ld Stream Bed- No. No. Au Cu Pb Z n Tes t (2 ) Width Rock(3) F loa t a t sample s i t e ( 3 , 4 ) - - - - -
13 223 .01 40 10 60 2 14 ' sh sh - q t z
14 222 .01 40 10 60 2 14' sh sh - q t z
( 1 ) Gold, copper, l ead , and z inc ana lyses by U.S.G.S. F ie ld Laboratory, Anchorage; values i n p a r t s per m i l l i o n (atomic absorpt ion f o r go ld , copper, z i n c ; spec t ro - graphic values f o r l ead ) 150 = anomalous va lue ; m* = th reshold va lue .
( 2 ) F ie ld test measured i n m i l l i l i t e r s of d i t h i z o n e , cold e x t r a c t a b l e metals t e s t (Hawkes , 1963).
(3 ) Symbols f o r rock types a r e a s fo l lows: cc = c a l c i t e , gs = greens tone , 1 s = l imestone, q t z = q u a r t s , sh = s c h i s t , s l = s l a t e
( 4 ) Percent of rock types a t each sample s t a t i o n shown i n f i g u r e s a f t e r t h e symbol.

Concentrat ion (ppm) ( 1 ) Map Sarnple F i e l d No. No. Au Cu Pb Zn Test (2) - - - - -
APP. Stream Bed Width Rock(? F l o a t a t sample s i t e ( 3 , 4 )
1s-50, sh-30, cc & qtz-20
sh-60, 1s-20, gs-20
sh w/qtz, q t z boulders

Concentrat ion (ppm) (1 ) Sampl e F i e l d No. & - - - Cu Pb Zn Tes t (2 )
APP* Stream Width
Bed Rock(3)
Map No. - F l o a t a t sample s i t e ( 3 , 4)
sh-60, qtz-40
sh-60, q tz -40
sh w/qtz
sh-70, gs-20, qtz-10
1s-50, sh-45, q tz -5
sh-70, qtz-30
1s-60, sh-40
1s-40, sh-60
1s-85, sh-15
1s-94, sh-4, q t z -2
sh-87, gs-10, qtz-3
sh-98, q tz -2
sh-98, q t z -2
sh-88, gs-5, 1s-5, q tz -2
sh w/qtz-100
s l -50 , sh-40, 1s-10
1s-50, sh-30, qtz-20
sh-100
sh w / q t z
s h y t r a c e gs
sh-80, 1s-20, sm. amt. q t z
1s-60, sh-30, qtz-10
1s 81 sm. amt. sh
1s-80, sh-20, sin. amt. q t z

Concentrat ion (ppm) ( 1 ) Map Sample F i e l d No. No. - - - - - Au Cu Pb Zn Test(2)
7 1 142 .01 30 20 80 1
72 143 .5 30 20 80 1
73 144 .O1 25 30 60 3
74 145 .01 25 10 60 1
75 146 .O1 30 30 90 1
76 147 .O1 35 30 110 8
77 211 .O1 25 15 50 2
78 119 .01 55 70 130 1
79 210 .O1 25 30 60 2
80 209 .01 35 30 70 2
81 171 .01 20 15 50 1
82 172 .01 20 20 60 2
83 173 .O1 45 10 80 3
84 170 .01 25 15 40 2
85 169 .01 25 15 40 1
86 168 ,01 25 15 40 1
87 167 3 0 1
88 166 .01 30 15 90 2
89 165 .01 30 15 90 2
90 164 .01 20 5 80 2
91 206 .01 45 30 80 2
92 207 .01 25 15 50 2
93 208 .01 20 5 40 2
94 186 .01 25 15 70 1
95 187 .01 45 10 100 1
96 188 .01 40 15 60 3
APP Stream Bed Width Rock(3)
-2 ' 1 s
-2 ' 1 s
6 ' 1 s
6 '
-2 '
-2 '
14'
-2 ' 1 s
14 '
14'
6 '
6 '
6 '
6 '
6 '
6 '
6 '
14'
14'
14'
6 '
6 '
14'
6 '
6 '
6 '
F l o a t a t sample s i t e ( 3 , 4)
1s-95, sh-5, sm. amt. q t z
1s-60, sh-35, q tz -5
brush
I s - sh
sh-100
1s-30, sh-65, q tz -5
1s-70, sh-20, qtz-10
1s-30, sh-65, qtz-5
1s-30, sh-65, q tz -5
sh-95, gs-5
sh-95, gs-5
gs-60, sh-38, q tz -2
9s-23, sh-75, q t z -2
gs-23, sh-75, q tz -2
gs-20, sh-79, q t z -1
sh-98, q t z -2
sh-64, CJS-30, qtz-4, s l - 2
sh-50, 1s-30, gs-17, q tz -3
sh-48, 1s-40, gs-10, q tz -2
sh-98, q t z -2
sh-68, 1s-30, q t z -2
sh-63, 1s-30, marble-5, q tz -2
sh-98, q t z -2
sh-98, q t z -2
sh-99, q t z -1

Map No. -
Concentrat ion (ppm) (1 ) APP . Sample Field Stream Bed
No. Au Cu Pb Zn Test(?) Width Rock(3) - - - - r- F l o a t a t sample s i te(3, 4)
sh-99, q tz -1
brush
sh-70, sl-20, qtz-10
sh-60, 1s-30, qtz-10
IS -sh
sh-98, qtz-2
sh-99, q tz -1
sh-78, 1s-20, qtz-2
sh-79, ls-10, marble-10
sh-96, gs-1, s l -2 , q tz -1
sh-98, qtz-2
sh-77, qtz-3, s l -20
sh-83, qtz-2, s l -15
sh-86, s l -10 , gs-2, qtz-2
sh-86, sl-10, gs-2, qtz-2
qtz-96, sh-2, 1s-2
sh-100
sh-82, 1s-15, q tz -3
sh-100
sh-93, gs-5, q tz -2
sh-96, gs-2, qtz-2
sh-96, gs-2, qtz-2
sh-96, gs-2, qtz-2
sh-96, C~S-2, qtz-2
sh-72, IS-25, qtz-3
sh-78, 1s-20, qtz-2

Map No. -
Concentrat ion (ppm) ( 1 ) Sample F i e l d
No. - Au 9 Pb &I Tes t (2 )
APP Stream Bed Width Rock(3)
6 ' $h
14 '
14'
6 '
14 '
14'
-2 '
-2 '
-2 '
14'
-2 '
6 '
-2 '
dry
d ry
-2'
dry
d r y
d r y
-2 '
d ry
6 '
14' s h
F l o a t a t sample s i t e ( 3 , 4)
~ h - 7 8 , 1s-20, qtz-2
sh-94, 1s-3, s l -2 , q tz -1
sh-94, 1s-3, s l -2 , q tz -1
sh-96, 1s-2, qtz-2
sh-94, 1s-3, s l -2 , q tz -1
sh-64, gs-30, qtz-4, s l - 2
sh-82, 1s-15, q tz -3
sh-82, 1s-15, q tz -3
sh-82, 1s-15, qtz-3
sh-94, 1s-3, s l -2 , q t z -1
sh-80, s l -20
sh w/qtz-70, s l -30
sand
sand
1s-100
sh-80, s l -20
sh-60, ~ 1 - 4 0
sh-60, s l -40
sh-70, sl-20, gs-10
sh-100
1s-90, sh-10
sh-40, qtz-30, 1s-30
sh-99, q tz -1
sh-99, q tz -1
sh-99, q tz -1
sh-99, q tz -1 +
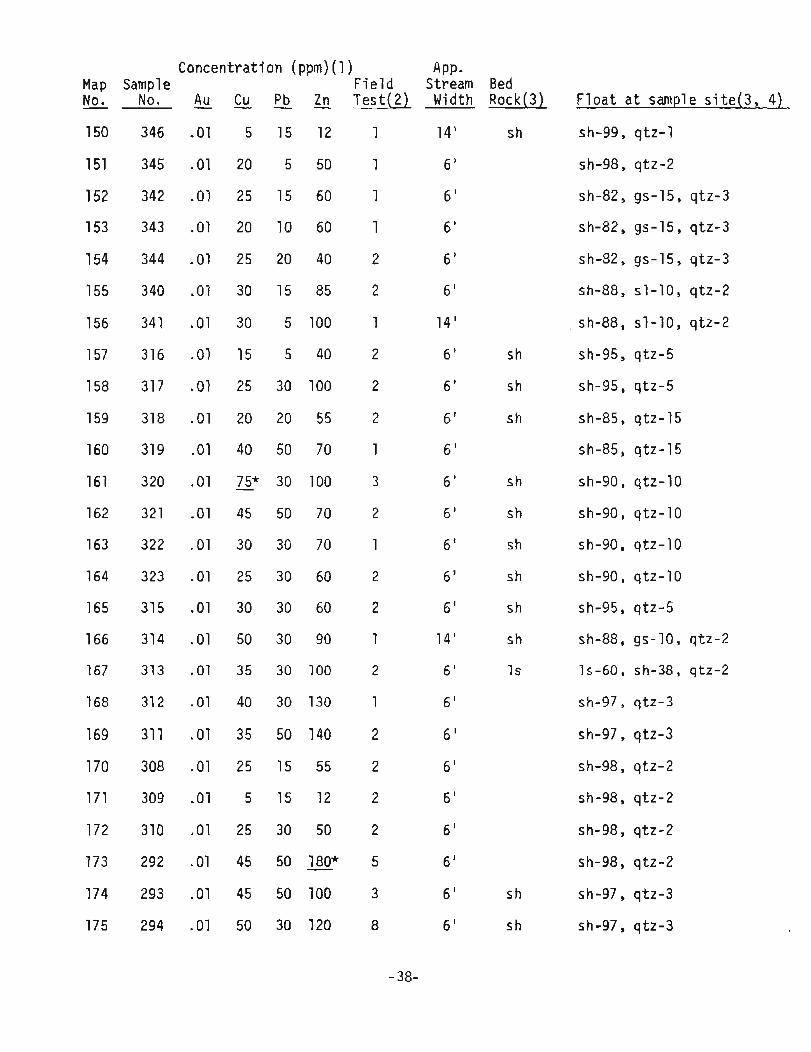
Concentrat ion ( P P ~ ) ( 1 ) . . . . . .
Map Sample F i e l d No. No. Au Cu Pb Zn Tes t (2 ) - - - - -
APP. Stream Bed Width Rock(3) F l o a t a t sample s i t e ( 3 , 4)
sh-99, q tz -1
sh-98, q tz -2
sh-82, gs-15, q tz -3
sh-82, gs-15, q tz -3
sh-82, gs-15, q tz -3
sh-88, s l -10 , q t z -2
sh-88, s l -10 , q tz -2
sh-95, qtz-5
sh-95, q tz -5
sh-85, qtz-15
sh-85, qtz-15
sh-90, qtz-10
sh-90, q tz -10
sh-90, qtz-10
sh-90, qtz-10
sh-95, q tz -5
sh-88, gs-10, q t z -2
1s-60, sh-38, q tz -2
sh-97, q tz -3
sh-97, q tz -3
sh-98, q tz -2
sh-98, q tz -2
sh-98, q t z -2
sh-98, q t z -2
sh-97, q tz -3
sh-97, q tz -3

Map No. -
Concentrat ion (ppm) (1 ) Sample F i e l d
No. Au C u Pb T e s t ( 2 ) - APP
Stream Bed Width Rock(3) F l o a t a t sample s i t e ( 3 , 4)
sh-97, q t z -3
sh-97, q tz -3
sh-98, qtz-2
sh-94, q tz -1 , gs-5
sh-94, q t z -1 , gs-5
sh-79, gs-20, qtz-1
sh-68, gs-30, q tz -2
sh-79, gs-20, qtz-1
sh-79, gs-20, qtz-1
sh-100
sh-89, gs-10, q tz -1
sh-78, gs-20, q tz -2
sh-78, gs-20, q tz -2
sh-78, gs-20, q tz -2

Map No. -
Concentrat ion (ppm) (1 ) APP Sample F i e ld Stream Bed No. - - - Au Cu Pb T e s t ( 2 ) Width Rock(3) F l o a t a t sample s i t e ( 3 , 4)
sh-75, gs-25

Ma P No. -
Concentration (ppm) (1 ) Sample Field No. A u - - Cu Pb & Test(2)
536 .01 30 15 95 2
535 .O1 35 20 135 4
537 .O1 45 15 150 3
534 .01 35 15 90 1
99 s* 27 15 55 2
533 .01 45 15 190 7
532 .01 40 15 140 3
529 $01 44 15 120 2
530 .O1 60 20 140 8
531 .O1 60 30 100 1
528 .O1 95 30 210 1
527 .01 58 20 m* 3
525 .01 32 20 56 1
526 .01 35 30 64 1
524 .O1 38 20 78 3
83 .O1 19 20 30 1
523 .01 45 30 80 2
522 .01 44 10 110 3
521 .O1 48 50 100 1
520 .O1 39 15 80 1
517 .01 30 15 66 2
518 .O1 30 30 60 1
82 .O1 41 5 90 1
80 23 10 60 1
79 .01 22 30 150 1
519 .01 30 20 90 3
APP Stream Width
Bed Roc k,(3 )
IS-sh
s 1 -s h
sl-sh
s h
Float a t sample s i t e ( 3 , 4) -
sh-78, s l -20, qtz-2
sh-78, s l -20, qtz-2
sh-53, s l -45, qtz-2
sh-48, sl-40, 1s-10, qtz-2
s l -60, sh-10, 1s-30
sh-48, sI-40, gs-10, q t z - 2
sh-48, sl-40, gs-10, qtz-2
sh-72, 1s-25, qtz-3
sh-94, 1s-5, qtz-1
sh-94, 1s-5, qtz-1
1s-65, sh-33, qtz-2
sh-98, qtz-2
sh-89, gs-10, qtz-1
sh-88, gs-10, qtz-2
sh-99, qtz-1
sh-100
sh-99, q t t -1
sh-73, 1s-25, qtz-2
sh-99, qtz-1
sh-99, qtz-1
sh-98, qtz-2
sh-99, qtz-1
sh-100 w/qtz
gs-60, sh-30, qt t-10
sh-100 w/qtz
sh-98, g t t -2

Ma P No. -
concentrat ion (ppm) ( 1 ) Sample F i e l d
No. Au Cu Pb Zn Test(2) - - - - APP *
Stream Width
Bed Rock(3) F loa t a t sample s i t e (3 , 4)
brush
sh sh-95, qtz-5
s h sh-90, q t t -10
s h sh-97, qtz-3
sh sh-98, qtz-2
sh-99, qtz-1
sh-99, qtz-1
sh-99, qtz-1
sh-99, qtz-1
sh-98, qtz-2
sh-98, qtz-2
sh-99, qtz-1
sh-99, qtz-1
sh-99, q tz -1
sh-99, qtz-1
sh-88, gs-10, qtz-2
sh-88, gs-10, qtz-2
sh-73, gs-25, qtz-2
sh-73, gs-25, q t z -2
sh-88, gs-10, qtz-2
sh-88, gs-10, qtz-2
sh-88, gs-10, qtz-2
sh-99, qtz-1
sh-83, gs-15, qtz-2
sl-50, sh-50
sh-85, ls -5 , qtz-10

Map No. -
Concentrat ion (ppm) ( 1 ) Sample F i e l d
No. Cu Pb ~ e s e ( 2 )
72 .01 24 30 38 1
69 .91 24 50 55 2
68 .O1 22 10 58 3
70 .01 24 30 48 1
71 .Q1 43 30 70 2
75 ,01 54 50 100 2
63 .O1 22 30 100
96 .O1 50 28 83 1
97 .O1 40 30 65 3
98 .01 25 10 40 1
64 .O1 15 30 60 6
50 .O1 11 10 66 1
51 .08 39 20 80 12
49 .O1 25 10 70 10
48 .O1 22 10 110 2
52 .01 30 20 140 18
65 36 5 150 1
66 .O1 21 30 80 1
67 .O1 20 30 95 1
53 .01 17 15 92 2
62 ,01 20 15 68 4
54 .01 20 5 88 1
55 .O1 20 5 110 2
56 .O1 35 20 130 3
57 ,01 25 15 150 1
58 .O1 15 10 '66 1
APP Stream Bed Width Rock(3)
6 '
6'
Float a t sample ai te(3, 4)
sh-95, qtz-5
sh-95, qtz-5
sh-98, qtz-2
sh-95, qtz-5
sh-100
sh-100
brush
sh-100
sh-100
sh-100
sh-80, qtz-20
sh-80, qtz-10, sl-10
brush
sh-50, 1s-30, sl-10, qtz-10
sh-50, 1s-30, sl-10, qtz-10
sh-70, 1s-15, sl-10, qtz-5
sh-90, qtz-10
sh-90, qtz-10
sh-100
sh-85, qtz-15
sh-70, 1s-10, sI-10, qtz-10
sh-50, sl-50
sl-80, sh-15, qtz-5
sl-85, sh-15
sl-95, sh-5
sI-50, sh-50

Map No. -
Concentrat ion (ppm) (1 ) APP. Sample F i e ld Stream Bed
No. A u C u Pb Zn T e s t ( ? ) Width Rock(3) - - - - F l o a t a t sample s i t e ( 3 , 4 )
brush
sh-75, s l -20 , q t z -5
s l - 5 0 , sh-30, gs-20
gs-60, sh-40
gs-50, sh-50
sh-84, gs-15, qtz-1
sh-88, gs-10, q t z -2
sh-88, gs-10, q t z -2
sh-88, gs-10, q tz -2
sh-99, qtz-1
sh-98, q t z -2
sh-98, q tz -2
sh-98, q tz -2
sh-84, gs-15, qtz-1
sh-84, gs-15, q t z -1
sh-84, gs-15, q tz -1
sh-84, gs-15, q tz -1
sh-50, 1s-50
sh-100
sh-100
sh-100
sand
sh-45, 1s-45, gs-10
gs-50, sh-50
sh-100
s h w/qtz-100

Concent ra t ion (ppm) ( 1 ) APP. Map Sample F i e l d Stream Bed No. -- -- No. Au - - Cu -- Pb 2 T e s t ( 2 ) Width Rock(3) F l o a t a t sample s i t e ( 3 , 4)
334 414 .01 21 30 56 1 6 ' s i l t
gs-60, sh w/qtz-40
gs-40, sh-60
gs-10, sh-90
sh-90, gs-3, s l - 7
sh-90, s l - 1 0
sh-100
sand
sh w / q t z
brush
brush
sh-100
sh w/qtz-100
sh-80, 1s-20
sh w/qtz-100
sh-90, s l - 1 0
sh-100
sh-90, 1s-10
sh-90, 1s-10
sh-90, 1s-10
brush
sh w/qtz-100

Concentration (ppm) (1 ) Sample Field
No. Au C u Pb Zn Tes t (2 ) - - - - APP.
Stream Width
Bed Rock(3) Float a t sample s i t e ( 3 , 4)
Ma P No. - 3 58
359
sand
s l -60 , sh-38, qtz-2
sand
s h sh-70, qtz-30
sh-100
sh-100
s l -1s s l -70, 1s-20, sh-10
s l - s h sh-55, s l -30, gs-10, qtz-5
sh-90, s l - 8 , qtz-2
s l w/qtz-100
sands
sands
1s-100
1s-70, s l -15, sh-15
sh-50, qtz-30, s l -20
1 S-s 1 sh-50, s l -25, 1s-15, qtz-10
sl-100
s i l t
sand
sand
sl-100%

Concentration (ppm) ( 1 ) Map Sample F i e l d No. - No- - - Au Cu - Pb & Test(2)
384 116 ,01 30 32 80 2
385 115 .01 58 30 300 10
386 114 .01 19 10 120 2
387 113 .O1 32 30 70 2
388 410 .01 25 30 110 7
389 409 .01 24 30 100 9
390 408 ,01 20 20 70 1
391 407 .O1 25 30 94 2
392 406 .01 33 50 64 2
393 368 .01 27 20 68 3
394 367 .01 13 15 40 2
395 366 .01 21 20 56 4
396 365 .O1 18 30 52 3
397 362 .O1 16 15 44 3
398 363 .O1 21 15 46 4
399 364 .01 13 20 30 2
400 369 ,01 32 30 40 7
401 370 .01 25 50 80 18
402 373 .01 17 20 54 2
403 374 .01 13 15 28 2
404 371 .01 22 15 58 2
405 372 .O1 25 30 42 3
406 428 .01 27 15 60 1
407 427 .01 23 15 84 3
408 424 .01 30 20 80 3
409 425 .O1 18 5 66 2
APP Stream Bed Width Rock(3) F l oa t a t sample s i te (3 , 4)
s l -100%
sl-55, sh-45
sl-100
sl-100
sh w/qtz-100
sh w/qtz-100
sh w/qtz-100
sh-100
sh-90, gs-5, qtz-5
sh-94, gs-3, q t t -2 , s l - 1
sh-94, gs-3, qtz-2, s l - 1
sh-73, 1s-25, qtz-2
sh-99, q t t - 1
sh-99, qtz-1
sh-99, q tz -1
sh-99, qtz-1
sh-98, q t t - 2
sh-98, q t t - 2
sh-97, qtz-3
sh-97, q t t - 3
sh-98, qtz-2
sh-98, qtz-2
sh-100
s i 1 t
s i l t slump
sh-100

Map No. -
Concentration (ppm) (1 ) Sample F i e l d
No. Au Cu Pb ~ e s t ( 2 ) - - - APP.
Stream Bed Width Rock(3) F l oa t a t sample s i te(3, 4) -
sh-98, qtz-2
sh-98, qtz-2
sh-98, q t z -2
sh-70, qtz-30
sh-70, s l -30
sand
sh-100
sh-100
sand
sand

APPENDIX I 1
In terva ls o f estimation and detection 1 i m i t s semiquantitative spectrographic analyses
Copper ppm* 20,000 10,000 5,000 2,000 1,000
500 200 100 50 2 0 10 5 2 L**
Lead ppm
20,000 10,000 5,000 2,000 1,000
500 200 100 50 2 0 10 L
Barium * 2,000 1,000
500 200 100 50 20 L
Zinc ppm
10,000 5,000 2,000 1,000
500 200
L
Strontium ppm
5,000 2,000 1,000
500 200 100 50 L
Molybdenum ppm
2,000 1,000
500 200 100 50 20 10 5 L
Boron ppm 2,000 1 ,000
500 200 100 50 20 10 L
S i 1 ver ppm
5,000 2,000 1,000
500 200 100 50 20 10 5 2 1
0.5
Cobalt ppm
2,000 1,000
500 200 100 50 2 0 10 5 L
Chromium ppm 5,000 2,000 1,000
500 200 100 50 20 10 5 L
Nickel ppm
5,000 2,000 1,000
500 100 50 20 10 5 L
Manganese ppm
5,000 2,000 1,000
500 200 100 50 20 L
Beryl 1 i um ppm
1,000 500 200 100 50 20 10 5 2 1 L
T in ppm
1,000 500 200 100 50 20 10 5
Tungsten ppm
10,000 5,000 2,000 1,000
500 200 100 50 L
Z i rconi urn ppm
1,000 500 200 100 50 2 0 10 L
Lanthanum ppm
1,000 500 200 100 50 20 L
T i tan i urn 0
1 .o 0.5 0.2 0.1 0.05 0.02 0.01 0.005 0.002 0.001
L
Magnesium 0
10 5 2 1
0.5 0.2 0.1 0.05 0.02
Niobium ppm
2,000 1,000
500 200 100 50 20 10 L
Scandium Yttrium Vanadium ppm
100 ppmppm
200 10,000 50 100 5,000 20 50 1,000 10 20 500 5 10 200 L 5 100
L 50 20 10 L
* ppm indicates parts per m i 1 l i o n * L = Lowest l i m i t o f detection

O O O O O O O O O O O O O O O O O O O O O O O O O O O O O O O O O O O O O O O O O O O O O O G O O O O O C O O O O O ( ~ ) ~ " C u e l L l C C m + C O C O " C C C ' ~ m C ~ O o C C O O m O ~ ~ m O O C O C m C O m m o O O O m O O O O O O O O O O O C o * - C . . . . . . . . . . . . . . . . . . . . . . . . . . . . . . . . . . . . . . . . . . . . . . . . . . . . . . . . . .
0 0 0 ~ 0 - 0 - 0 0 0 0 0 0 0 0 0 - - 0 0 - - O - O O O - - C - O O O - o c - N - ~ o - - d N N ~ - - - - o a - O o

I , - - - - - - F - - ~ - - - P - - Y F - - - F - ? - W ~ ~ N L - - - - - - - - - - - - ~ F - - - ~ F - - - - - - - - - - F - F - - - W N N C W h Y ~ Y h W U h W Y N ~ d h Y Y N N W U W W Y y l U y l y l h i W W W Y N V Y W N l y N N N N W ~ W W W W N N W W W W W W N b N W ~ N O 9 ~ . . . . . . . . . . . . . . . . . . . . . . . . . . . . . . . . . . . . . . . . . . . . . . . . . . . . . . . . . . . . . . . . . . , 0 0 O c 0 0 3 c 0 " 0 3 c C C 3 C C 0 3 0 0 0 0 O o 0 0 c 0 3 1 0 0 o o 0 o C O 9 o o o 0 0 c o o o o o a o O o o o O
Lead (1 ) C 3 C c Z ~ C - c 5 S 3 O C = C C 3 0 0 5 C 0 0 O 3 C C s c o 3 O o 3 c C c 3 ~ 3 3 c c o c ~ o O C c o s O O o o o o a o o o o o 3
1 - L i U . - r A\=-- u - - - - * - - - - 4 - - I - - - - L - r r r - U J - r b L Y ~ ~ b i r . . & W h N w - ' ~ P C ~ ~ ~ ~ ~ ~ ~ ~ O ~ ~ Z J S ~ ~ C ~ ~ J I O ~ ~ ~ O J ~ ~ P ~ O J O ~ S C J C ~ ~ L ~ ~ O ~ ~ O O O > C O O ~ O O O ~ ~ O ~ ~ > O O O ~ O ~ I . . . . . . . . . . . . . . . . . . . . . . . . . . . . . . . . . . . . . . . . . . . . . . . . . . . . . . . . . . . . . . . L . .
" ~ 0 3 3 - 0 0 0 0 3 C 3 - ~ G 0 0 3 5 0 0 a 3 0 0 3 0 ^ 1 ~ 3 0 3 C 9 C o 3 3 7 ~ ~ 3 O 0 0 0 a 0 0 0 0 0 0 0 3 0 0 0 0 ' ~ 0 ~ 0 0 3 0 Lead I ~ o ~ ~ ~ ~ o o o ~ ~ o o ~ o o ~ c o ~ o ~ ~ ~ o c ~ o ~ ~ ~ ~ ~ ~ ~ o ~ c ~ ~ ~ ~ ~ ~ ~ ~ ~ ~ ~ ~ ~ ~ o o c c o o ~ o ~ a o o c ~
- w - ~ ~ ~ 3 ~ 3 N 0 0 3 N ~ ~ W 3 ~ 3 ~ ~ 0 5 ~ C ~ O 5 . U O C ) C ) T U U J I ~ O 3 Y Y O W W ~ 3 W ~ ~ ~ 0 W O W O C ~ W 0 O 3 3 N ~ O O ~ O ~ . . . . . . . . . . . . . . . . . . . . . . . . . . . . . . . . . . . . . . . . . . . . . . . . . . . . . . . . . . . . . . . . . . ~ ~ ~ O ~ ~ C ~ ~ O ~ O ~ ~ O ~ ~ ~ ~ ~ ~ ~ ~ ~ ~ ~ ~ ~ ~ ~ ~ ~ ~ ~ ~ ~ ~ ~ ~ ~ ~ ~ ~ ~ ~ ~ ~ ~ ~ ~ ~ ~ ~ ~ ~ ~ ~ ~ ~ ~ ~ ~ ~ ~ ~ ~ ~ Mclybdenum J C O C ? C O C C C C C C C - O C O C C 3 C C O C C C 3 0 0 C C 3 0 C 0
- - - - r - c - - -I-- -.- ---,-- r - - - - -,- - w .. - - * I . r O ~ D ~ ~ * 4 ~ ~ o o * ~ 0 ~ I ~ S O O O > ~ ~ r ~ O O O ~ W O o 1 S ~ ~ O o T 4 ~ c ~ ~ O Y * o * * a i l l * o O * * ~ ~ . ~ ~ o * O ~ 0 t i 0 O O C 3 3 0 C ~ O 0 Q 0 5 0 3 3 O O O 0 0 0 3 0 0 0 3 0 0 0 0 0 3 0 3 ~ 0 0 ~ 0 3 ~ 0 0 0 0 0 3 0 0 0 0 3 0 0 0 0 0 0 0 0 0 0 ~ 0 N i cke l . . . . . . . . . . . . . . . . . . . . . . . . . . . . . . . . . . . . . . . . . . . . . . . . . . . . . . . . . . . . . . . . . . 1 Z 5 8 " " Z 8 8 8 : Z 8 : 5 ~ 8 8 R 8 Z g Z ~ Z Z 8 " 0 g Z S ~ 8 8 8 8 Z ~ $ 8 " 0 Z ~ ~ E Z Z Z Z ~ 2 2 ~ Z 8 ~ Z Z 8 S Z Z Z 8 Z Z ~

o c o i 3 3 3 s 3 c c j = c a COCU 0 3 0 0 0 0 0 0 0 O O C O 0 O c o o c 3 c u n " a p q ~ l o ~ c " o " c ' c " O c 3 0 0 c C " 0 c 0 o C C c O C c . c . 9 O c o O C C O O O O o O O O O O O 0 O O O O O o O c O O O O C c C O O C - ~ ~ ~ . . . . . . . . . . . . . . . . . . . . . . . . . . . . . . . . . . . . . . . . . . . . . . . . . . . . . . . . . . . . . . . . . .
o ~ ~ ~ h c ~ ~ ~ ~ h ? c ~ h ~ h ~ ~ h ~ ~ 0 ~ ~ ~ ' ~ ~ ~ ~ c ~ ~ 1 ~ 1 ~ ~ ~ ~ 0 c 0 0 0 o 0 0 ~ 0 o ~ ~ ~ o ~ o o m ~ w ~ ~ o o o h ~ n o o h c c h ~ ~ - d


0 0 a O o O O O O O O O O O O C D 1 0 0 0 0 0 0 o C ) c 3 O O O O C a O C C ) o O O G o o O o o o o o ~ o c ~ ~ c c o o o o o a o ~ o " o O O O O O O o O O O O O O O o c O O O 0 0 o o C O o O O O O O O c O O o O O O o o o o o o o o o o o o ~ ~ o c o o o o o o o o o o
a s a u ~ 6 u ~ ~ dddd;d;;;;;d;dd;d;;;;;ddddddd;;;dgddd;ddddd;&;;ddd;;r;;d;;;;;g;;;;; O O O O O O O O O O O O O O O C O O O O O o O O O O O O o O o O O O C O O O O O o o o o o o O c o o o o o o o o o o o o o o o o o 3 ~ + + ~ ~ m - + m + m m - - ~ ~ ~ ~ m + ~ m m m c ~ ~ ~ + ~ ~ ~ + m m ~ ~ m ~ m o m ~ + ~ o m ~ ~ o + + ~ m o m o ~ w m + o ~ o ~ m
4 d P N r . 4 N - 43- c d h N - in- 4 4 4 4 d d 4 4
o o o c o c 0 0 0 0 0 0000 c 0 0 0 0 0 0 0 0 0 0 0 0 0 O 0 3 3 3 0 c 0 0 0 c 0 0 0 0 0 0 0 0 o c c o 0 3 0 O O O O O O O O C O O O O O o O O O O c O O O O O O c O O O O O o o c o o o o o o o o o o o o o o o o o a o o o o ~ o o o o O o ~ o . . . . . . . . . . . . . . . . . . . . . . . . . . . . . . . . . . . . . . . . . . . . . . . . . . . . . . . . . . . . . . . . > u l ~ o o o o o o o o o o o o o o o o o o o o o o o o o o o o o o o o o o o o o ~ o o o o o o o o d o o o o d o o o o c o o o o c . o o o c , c "22 "222 " 2 2 2 2 22222222o:2o2"""""z22222,022l i , ,02~,04122222 2 2 2 2 2 2 2

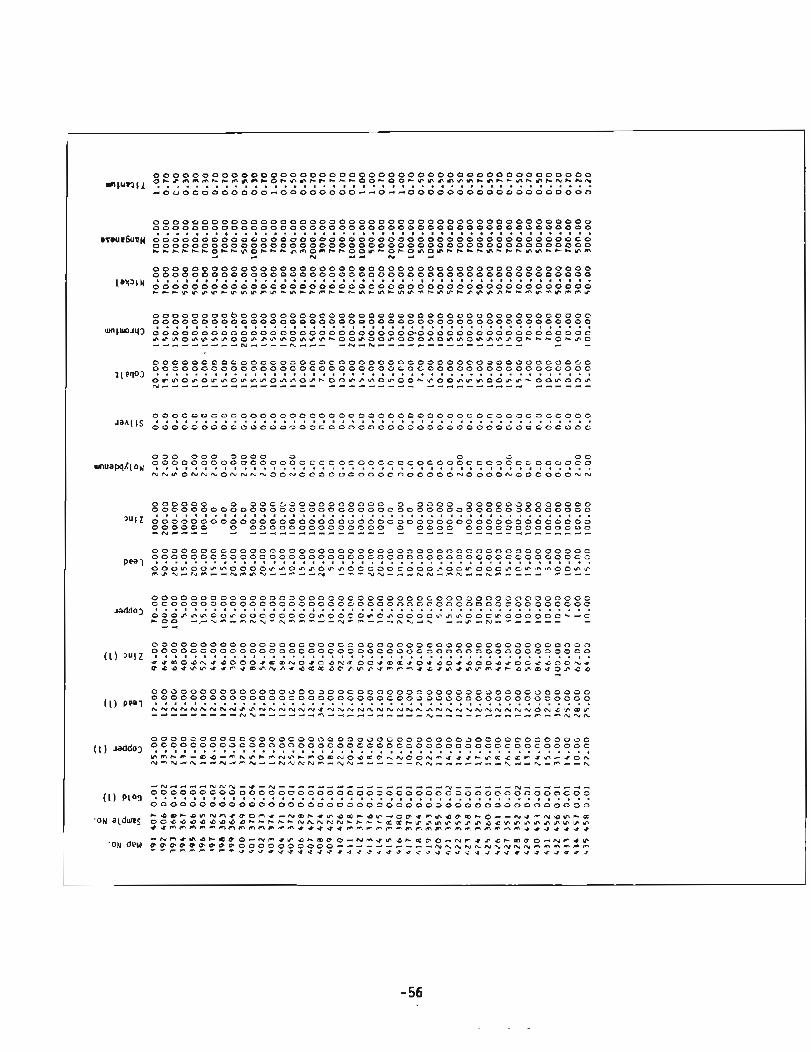
8 8 8 8 8 8 0 0 8 0 8 8 8 8 8 8 8 8 8 8 8 8 8 8 0 8 0 8 8 8 ~ 0 8 8 0 " 8 8 8 8 8 ~ 8 ~ 8 8 JULZ d d d d d d d d d d d d d d d d d d d d d d d d d d d d d d d d d d d d d 0 ' d d ; d d ; g
0 0 0 0 0 0 0 O O O O O O O O O O O O O O 0 0000 O O O O O O O O O O O O O .......................................
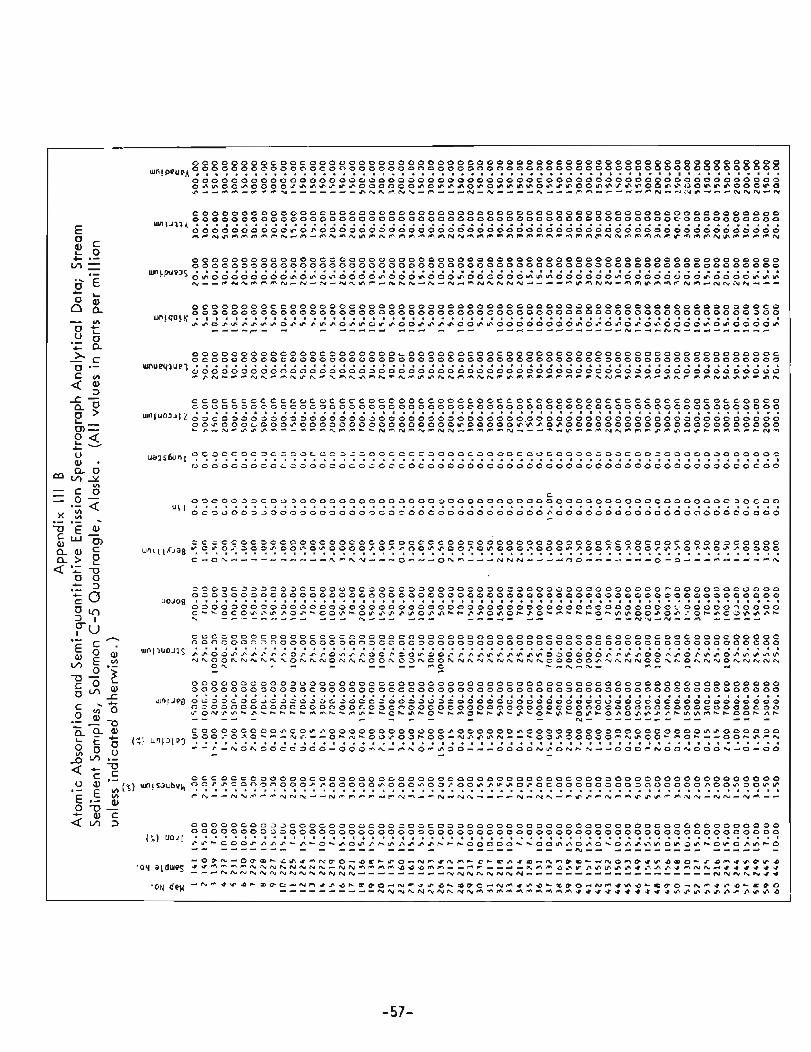
pi, C O c o O O O C c O C O C C C C C o c O O c O o O O O O o O O o O o o o c o v o o o c o o o o o o o ~ o o o o o o o o o S o o 0 0 o 0 3 3 0 o 0 0 0 0 0 0 o 3 C 0 0 0 0 0 o 0 0 o 0 0 0 0 0 0 o o 0 o o o o o o o o o o o o o o o o o o o o o o o o o o
un~iuo~is;,g;;;,;:;j;~;;;;;j;;j;;j;;;;S;;S;;;;;~;;;;;;;;+;dg+;;;;;~;;;;;; W h 0 O & h N & ~ & O & h N ~ N N & 0 0 ~ C 3 & O O % N N N N N N N N ~ O O O O C S , N ~ N N O O ~ ~ O N N N O ~ N N ~ ~ 0 * , d - - d - 4 C d N d ? r - pld d d
d " t,


c ~ ~ ~ ~ ~ ~ ~ ~ ~ ~ ~ c ~ c ~ o o ~ ~ ~ ~ ~ ~ ~ ~ ~ o ~ ~ ~ c ~ ~ ~ o o o ~ c o o o o o c o o o c o o o o ~ o o o o o o o o o o a 000000000000000000000C00000000000000000000000000000000000000000000 . . . . . . I....................................................
~ ~ u o u & Z o a o o o o o o o o o o o o o o o o o o o o o o o o o o o o o o o o o o o o o o o o o o o o o o o o o o o o o o o o o o o o o o o o 0 0 0 0 0 m 0 0 0 0 0 0 0 0 o 0 0 0 o 0 0 0 0 0 0 0 0 0 0 0 0 o O O O O m O O Q o o m o o - - o o o o m m o o m m ~ o o o o o o o o m ~ ~ m m ~ m ~ ~ - ~ ~ ~ m m m m m m m m ~ m - m m m m m m v ~ ~ ~ i m m m ~ m m m - N + ~ - + - N - - - N N ~ N I A ~
O O O O O O O O O O O O O O O O O O O O O O O O O O O O C C G 0 0 0 0 0 0 0 0 0 0 0 3 0 0 0 0 0 0 0 0 0 0 3 0 0 0 0 0 0 0 0 0 0 0 0 0 0 0 ~ 0 0 ~ z ~ 2 s ~ ~ ~ z z s ~ ~ 0 z s z ~ 2 ~ z z z s 2 ~ W " J U O . l J s d d d d d d d d d d d d d ; d Y ; ; d ; ~ ~ ~ ; A ~ A g J : A ~ ~ d ~ d d d d ; d d ~ ~ d ; ~ ; d d d d ~ > A j > j ; ~ d ~ ~ ~ ~ < ~ ~
m 0 0 o 0 0 0 m 0 0 0 0 0 N 0 N N O N N N N N N N * N N N N N N - r a - m m m - h ~ ~ ~ *
N N N m w N N O O O Y N N N h 0 N 0 0 0 0 0 0 w o 0 d " - N O N - y - m - m 4 4 N
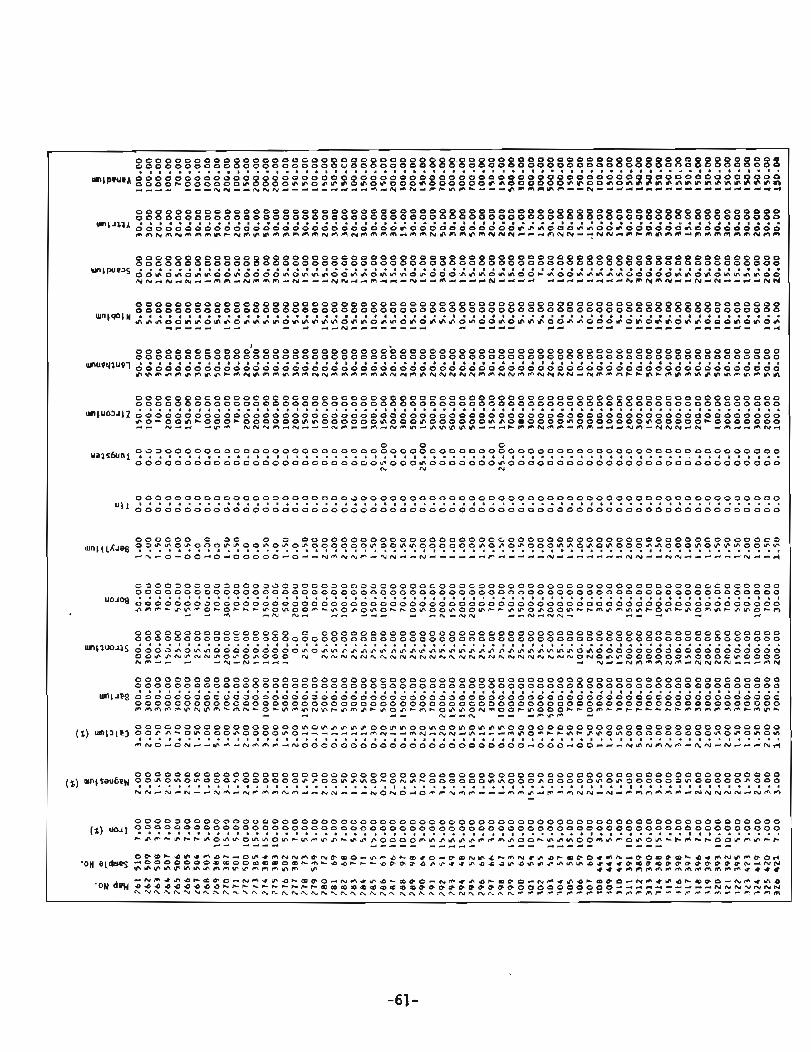
O O O C O O C 3 0 0 0 O O o O O O O o O O O O O O O O O O O O O o o O O O O O o O O O O O o O O O O O o c o o o o o c ~ w n ~ ~ 1 K ~ ~ g 3 ? " . " . ? ~ ~ ? ~ " . ~ : ? ? ? " . ~ " . ? ~ ? ? ? ? " . ? ? ~ ~ ~ ? ? ? ~ : ~ ? ~ ? " . ? ? ? ~ ~ ? T ? ~ ? ? ? T $ ? ? ? q ? " . " . q ? ~ " . ~ . .
- ~ - o - o o - o - o o o o o - o + - N m N ( v v - N p u - f N - ~ - - - - m c I - - - ~ ~ - ~ - ~ ~ ~ - ~ N + - ~ ~ ~ - ~ - + ~ N - - ~

8 8 8 8 8 8 8 8 8 8 8 8 Z 8 Z 8 8 8 8 8 8 8 Z 8 Z 8 8 8 Z ~ 8 Z Z X 8 Z 8 Z 8 8 Z Z E ~ 8 ~ ~ Z ~ Z Z 8 Z 8 ~ ~ 8 8 Z Z 8 Z Z 8 Z ~ . . . . . . . . . . . . . . . . . . . . . . . . . . . . . . . . . . . . . . . . . . . . . I . . . . . . . . . . . . . . . . . .
",,,pwe* 0 0 0 0 0 0 0 0 0 0 0 0 0 0 0 0 0 0 0 0 0 0 0 0 0 0 0 0 0 0 0 0 0 0 0 0 0 0 0 0 0 0 Q ~ 0 0 3 0 0 0 0 0 3 0 0 0 0 0 0 0 0 0 0 0 0 0 m m m * ~ m O m m m O m m m m m m m m ~ O m m m m O O m o m m o o m m o o o o m m o o o o o o o m o m o o o m m o m o m m m m m ~ m - - e - - - - - ~ + - - - ~ - - ~ - - - ~ - - - - m ~ - ~ - - r ~ ~ n n n n h m ~ i - - w ~ n ~ r n m * - w - f i ~ m ~ ~ ~ - ~ - - - - - - ~

C C O C O O O C O O U O O 0 O O O o O O O O O O O C O O C ; 0 O O C O O O O C O O O O 0 0 0 q q 0 0 0 0 . . . . . . . . . . . . . . . . . . . . . . . . . . . . . . . . . 4 q000q0000q000000q0000000000000qO0 wnluoxhZ ~ ~ ~ ~ ~ O ~ O O ~ ~ O O ~ O O O O ~ O O ~ ~ ~ O O O ~ O O ~ O O O O O O ~ ~ O O ~ ~
2~2:X::~:z,:2~~2:~f:z:::::z:~,"f2::",~~::~:25:fI?2~z
O C O O 0 0 0 0 0 0 0 0 0 0 0 0 0 0 0 0 0 0 0 0 0 0 0 0 0 0 0 0 0400003000000000000000000i300000000000000000 . . . . . . . . . . . . . . . . . . . . . . . . . . . . . . . . '"Cauo'7S d ~ d ~ d d d , ' d , ' m m o m ~ o ~ o m f i m r o o o o m ~ a m ~ n m ~ ~ o m V \ ~ ~ ~ ~ ~ O h m N 4 d
N N N N n N 3 0 0 0 h N N N d d d - 4
N N N N N N O O N N N N N O d d d

APPENDIX I 1 1 C
Averages and standard deviat ions o f r esu l t s o f analyses stream sediment samples, Solomon C-5 quadrangle, Alaska
(l=Atomic Absorption; values i n par ts per m i l l i o n , unless ind icated otherwise)
EL EMENT
Gold (1) Copper (1 Lead (1) Zinc (1) Copper Lead Zinc Molybdenum S i 1 ver Cobalt Chromium Nickel Manganese Titanium (%) I r o n (%)
AVERAGE STANDARD
DEVIATION
0.37 17.55 6.91
40.88 50.96 13.90 60.70 3.08 3.79 6.88
65.36 35.32
705.73 0.31 3.72
ELEMENT
~ a g n e s i um (%) Calcium (%) Bar i urn S t ron t i um Boron Beryl 1 ium T i n Tungsten Zirconium Lanthanum Niobium Scandi um Ytt r ium Vanadium
AVERAGE
2 ,oo 1.27
804.62 95 -86
101.79 1.58 0.00 0.00
243.21 39.28 10.40 18.62 29.75
183.63
STANDARD DEVIAT ION
0.09 1.61
591.18 183.46 75.03
1.49 0.00 0.00
146.87 18.39 4.03 6.18
10.92 95.31