Embed Size (px)
Citation preview
Alaska Energy Statistics
1960‐2010 Preliminary Data
By
Ginny Fay, Alejandra Villalobos Meléndez, and Amber Converse
Institute of Social and Economic Research University of Alaska Anchorage
in collaboration with
Alaska Energy Authority
September 2011
Acknowledgments We thank representatives of numerous electric utilities, AEA program managers and staff, and many other colleagues who shared information, reviewed this report, and provided valuable feedback. Suggested citation: Fay, Ginny, Alejandra Villalobos Meléndez, and Amber Converse, 2011, Alaska Energy Statistics 1960‐2010, Preliminary Data, prepared for Alaska Energy Authority, September 2011, 31 pages.

Fay, Ginny, Alejandra Villalobos Meléndez and Amber Converse, 2011, Alaska Energy Statistics, 1960‐2010, Preliminary Data, prepared for Alaska Energy Authority, September 2011
3
TABLE OF CONTENTS
INTRODUCTION ........................................................................................................................................... 4
SUMMARY AND HIGHLIGHTS ..................................................................................................................... 6
Electric Utilities Summary Tables.........................................................................................................7 Table 1.a Utilities/Communities Participating in Power Cost Equalization Program, 2010 .................. 7
Figure 1. PCE Eligible Communities....................................................................................................... 8
Table 1.b Installed Capacity (kW), 2010................................................................................................ 9
Table 1.c Net Generation (MWh), 2010 .............................................................................................. 10
Table 1.d Net Generation by Fuel Type (MWh), 2010 ........................................................................ 11
Figure 2. Alaska Utilities Net Generation by Fuel Type, 2010 ............................................................. 11
Table 1.e Fuel Use for Power Generation, 2010 ................................................................................. 12
Figure 3. Distribution of Fuel Used by Utilities for Power Generation in Alaska................................. 13
Figure 4. Barrels of Oil Used for Electricity Generation by Utilities, by Energy Regions ..................... 13
Table 1.f Sales (MWh), 2010 ............................................................................................................... 14
Table 1.g Revenue ($000), 2010.......................................................................................................... 15
Table 1.h Customers (Accounts), 2010................................................................................................ 16
Figure 5. Distribution of Utility Sales, Revenue and Customers by Customer Type............................ 17
Utility Installed Capacity and Net Generation over time .................................................................. 17
Figure 6. Installed Capacity by Prime Mover over Time...................................................................... 18
Figure 7. Net Generation by Fuel Type over Time............................................................................... 18
Appendix A. Glossary of Terms ........................................................................................................... 19
Appendix B. Maps of Energy Regions.................................................................................................. 26
Appendix C. Data Sources for Electric Energy Statistics ...................................................................... 28
Appendix D. Reporting Requirements................................................................................................. 30

Fay, Ginny, Alejandra Villalobos Meléndez and Amber Converse, 2011, Alaska Energy Statistics, 1960‐2010, Preliminary Data, prepared for Alaska Energy Authority, September 2011
4
INTRODUCTION This report has had various publishers. Before 1985, the federal Alaska Power Administration published Alaska Electric Power Statistics. Then, the Alaska Energy Authority (formerly the Alaska Power Authority) began gathering statistical data and publishing this annual report. In 1988, the Alaska Electric Power Statistics report became a combined effort of the Alaska Systems Coordinating Council and the Alaska Energy Authority. Beginning in 1993, the report became a joint effort of the Alaska Systems Coordinating Council and the Alaska Department of Community and Regional Affairs, Division of Energy. After the 1995 report, no reports were issued until 2003, when the Institute of Social and Economic Research (ISER) at the University of Alaska Anchorage (UAA), published a report, with funding from the Alaska Energy Authority (AEA), the Regulatory Commission of Alaska (RCA), and the Denali Commission. ISER prepared this preliminary report of the twenty‐fifth edition of the Alaska Electric Energy Statistics in collaboration with the Alaska Energy Authority. Continuing the new 2009 format, data tables are presented solely in digital form in an MS Excel file. The workbook with the data tables is available on the ISER website at: http://iser.uaa.alaska.edu/Publications/AlaskaEnergyStatisticsCY2010Tables.xlsx) and the AEA website (http://www.akenergyauthority.org/). The tables are presented in a dataset format for convenient use and manipulation. All data presented are identified by the geographic regions used in previous Alaska Electric Energy Statistics reports,1 as well as AEA energy regions, Alaska Native corporation regions, and U.S. census areas. The data tables available in the workbook are listed below.
Table Description Summary Tables By AEA Energy Regions Table 1.a Utilities Participating in the Power Cost Equalization program Table 1.b Installed Capacity (kW) Table 1.c Net Generation (MWh) Table 1.d Net Generation by Fuel Type (MWh) Table 1.e Fuel Use for Power Generation (Physical Units, MMBtu) Table 1.f Sales (MWh) Table 1.g Revenue ($000) Table 1.h Customers (Accounts) Detailed Tables Installed Capacity Table 2.1a Installed Capacity by Prime Mover by Plant Table 2.1b Installed Capacity by Prime Mover (Percent Distribution) Net Generation and Disposition Table 2.2a Net Generation and Total Disposition (MWH) Table 2.3a Net Generation by Prime Mover Table 2.3b Net Generation by Fuel Type and Fuel Use Table 2.3c Net Generation, Fuel Use, and Fuel Cost by Plant Table 2.4a Utility CO2 Emissions
1 The regions are Arctic Northwest, Southcentral, Southeast, Southwest and Yukon.
Fay, Ginny, Alejandra Villalobos Meléndez and Amber Converse, 2011, Alaska Energy Statistics, 1960‐2010, Preliminary Data, prepared for Alaska Energy Authority, September 2011
5
Revenue, Customers and Prices Table 2.5a Utility Sales, Revenue, and Customers Table 2.5b Average Annual Energy Use and Rates Table 2.5c Residential Rates and PCE payments Electric Utility Historical Tables Table 3.1 Utility Installed Capacity by Prime Mover Table 3.2 Utility Installed Capacity by Region Table 3.3 Utility Net Generation by Fuel Table 3.4 Utility Net Generation by Region Table 3.5 Utility Sales, Revenue, and Customers Table 3.6 Average Annual Energy Use and Rates
The report provides a brief introduction, highlights, and summary tables only. The summary tables use the AEA Energy Pathway publication regions. There are several appendixes. Appendix A is a glossary of terms; B has maps showing the energy regions; C lists data sources; and D cites reporting requirements. The methodology for this preliminary report differs from that of earlier reports. The 2008 data, published in May 2011, reports military and industrial generation. That information is not yet available for 2010. We gathered information on utility electricity capacity, generation, and other characteristics from survey forms filed with the U.S. Department of Energy’s Energy Information Administration (EIA). Data from those forms are not yet available on the EIA website, but the Alaska Energy Authority directly collected copies of the EIA survey forms 860, 861, and 923 from some utilities. Also, we used data collected by the Alaska Energy Authority through its Power Cost Equalization (PCE) program, and made a limited number of direct contacts with electric power producers. This preliminary report will be revised in the first quarter of 2012, once full datasets for 2010 are available through the EIA website. All utilities with installed capacity greater than one megawatt are required by law to report their operations to the federal government. A number of utilities in Alaska fall below that threshold. Information for these smaller utilities came primarily from the PCE program. The installed capacity table (Table 2.1a in the Excel workbook) includes all utilities for which data are available. Also, in many parts of the state, there are no utilities producing electricity, and all electricity is self‐generated at small installations. There are a large number of such installations (for example, Point Baker, Port Protection, and Telida); it would be very expensive to identify and contact each one individually. Keep in mind that this publication is meant as a general reference and broad overview of electric power in Alaska. Because data come from various sources and have imperfections, the reader may find inconsistencies across tables. For example, Table 2.5b shows average rate per kilowatt‐hour as calculated using the reported revenue, sales, and customers; Table 2.5c shows average rate per kilowatt hour as reported by the utility to the PCE program; these two rates are sometimes slightly different.2 Data in different tables may include different cases, or may be guided by slightly different concept definitions, depending on the source. Still, we believe the information presented provides a reasonable and valuable overview of electric power and energy across Alaska.
2 Only for PCE communities. Communities for which the data source is EIA report the same calculated rate as in Table 2.5b.
Fay, Ginny, Alejandra Villalobos Meléndez and Amber Converse, 2011, Alaska Energy Statistics, 1960‐2010, Preliminary Data, prepared for Alaska Energy Authority, September 2011
6
SUMMARY AND HIGHLIGHTS
This report presents electric power reference data for Alaska. It is not intended to provide detailed analysis of energy production, consumption, or uses. Still, in this section we highlight information that may be of particular interest to readers.
Scope of Report The Alaska Energy Authority and the Institute of Social and Economic Research at the University of Alaska Anchorage prepared this report, which primarily presents 2010 data on electricity produced by utilities in Alaska, including summary and detailed tables showing:
• Installed capacity by: type of utility prime mover plant
• Net generation: type of utility prime mover fuel type
• Fuel use cost CO2 emissions
• Utility sales revenue customers
average annual electricity use average annual electricity price
Electricity Generation and Cost • Alaska had about 2,188 megawatts of utility installed capacity that generated about 6.5 million
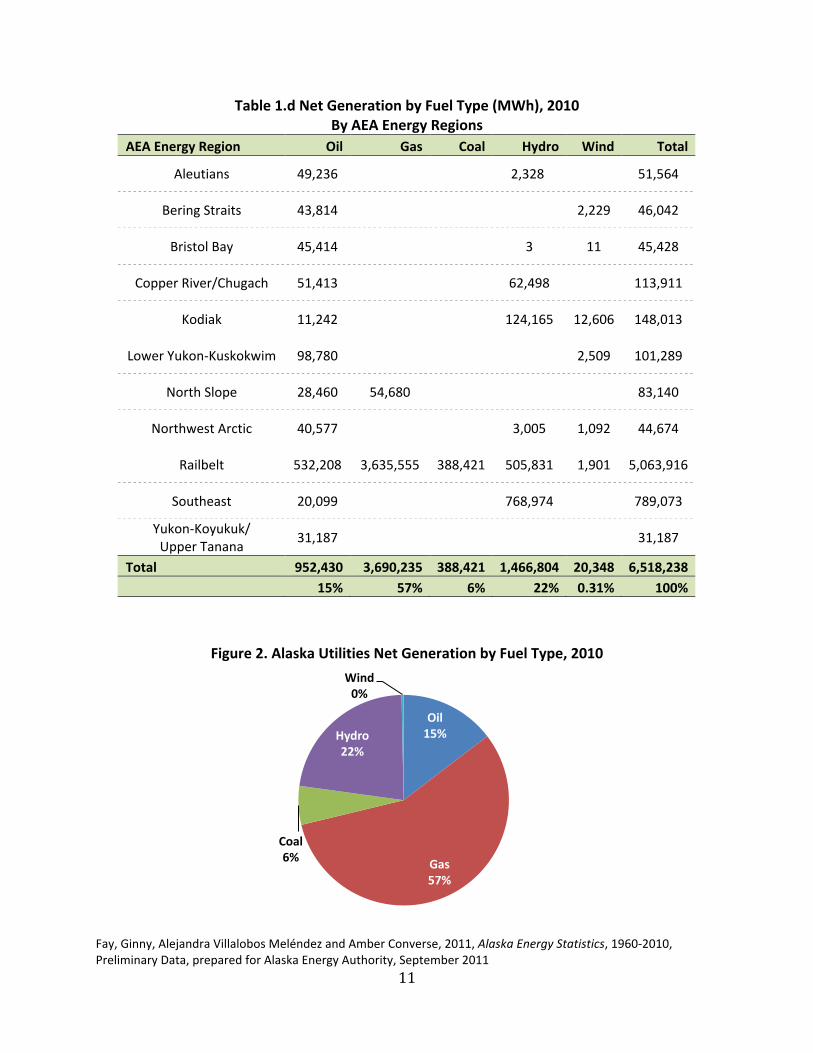
megawatt‐hours of electricity in 2010. • Statewide, the share of electricity generated by natural gas increased from 55% in 2009 to 57%
in 2010; the share generated by hydroelectric power increased from 20% to 22%. By contrast, oil products generated 18% of electricity in 2009 but 15% in 2010; the share generated by coal also dropped, from 7% to 6%. Wind still generated remained less than 1% of electricity, but that share increased from about 0.14% in 2009 to 0.32% in 2010.
• Sources of electricity vary sharply by region. Most of the state’s population is in the Railbelt region, and that region uses most (about 78%) of electricity statewide. Natural gas is used to generate most of the electricity for the Railbelt, but some is generated by hydropower.
• Many—but not all—communities in Southeast Alaska generate electricity with hydropower; some rely on diesel. Most use diesel for back‐up generation.
• Rural communities in Western and Interior Alaska rely primarily on diesel to generate electricity, but wind power is being added in a growing number of rural locations, financed largely by the Alaska Renewable Energy Fund. Since 2008, the amount of electricity generated annually by wind increased nearly 10 fold, from just over 2 MWh to 20,348 MWh.
• Wood was used to generate heat in 2010 in community‐level thermal facilities in about ten communities, mostly in Southeast, where wood resources are abundant.
• The average annual residential use of electricity statewide in 2010 was about 7,670 kilowatt‐hours. But that ranged from around 1,100 kilowatt‐hours in places where electricity is most expensive, to more than 13,800 where it is cheapest. Nationwide, the average annual use is about 11,000 kilowatt‐hours.
Fay, Ginny, Alejandra Villalobos Meléndez and Amber Converse, 2011, Alaska Energy Statistics, 1960‐2010, Preliminary Data, prepared for Alaska Energy Authority, September 2011
7
• Communities in Southeast Alaska that rely primarily on hydroelectric power to generate electricity had the lowest rates in 2010 (as little as 10 cents per kilowatt‐hour).3 Residents of Anchorage and other places in Southcentral Alaska that rely mostly on natural gas for generation paid around 13 cents per kilowatt hour. Alaskans in small remote rural places that rely on diesel had the most expensive electricity, from roughly 50 cents per kilowatt‐hour to more than $1.50 in 2010. The state helps reduce the price of electricity in most of those remote rural communities through the Power Cost Equalization program, but electric bills still remain much higher in remote rural areas than in urban communities.
ELECTRIC UTILITY SUMMARY TABLES
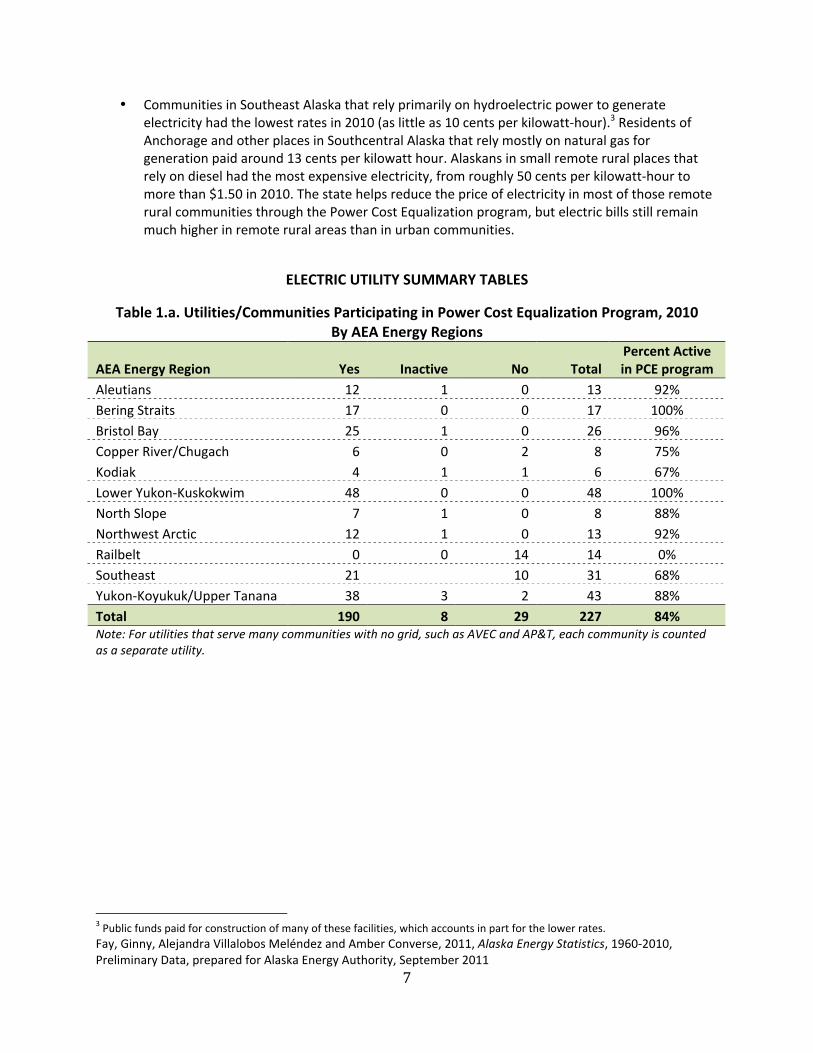
Table 1.a. Utilities/Communities Participating in Power Cost Equalization Program, 2010 By AEA Energy Regions
AEA Energy Region Yes Inactive No Total Percent Active in PCE program
Aleutians 12 1 0 13 92% Bering Straits 17 0 0 17 100% Bristol Bay 25 1 0 26 96% Copper River/Chugach 6 0 2 8 75% Kodiak 4 1 1 6 67% Lower Yukon‐Kuskokwim 48 0 0 48 100% North Slope 7 1 0 8 88% Northwest Arctic 12 1 0 13 92% Railbelt 0 0 14 14 0% Southeast 21 10 31 68% Yukon‐Koyukuk/Upper Tanana 38 3 2 43 88% Total 190 8 29 227 84% Note: For utilities that serve many communities with no grid, such as AVEC and AP&T, each community is counted as a separate utility.
3 Public funds paid for construction of many of these facilities, which accounts in part for the lower rates.
Fay, Ginny, Alejandra Villalobos Meléndez and Amber Converse, 2011, Alaska Energy Statistics, 1960‐2010, Preliminary Data, prepared for Alaska Energy Authority, September 2011
8
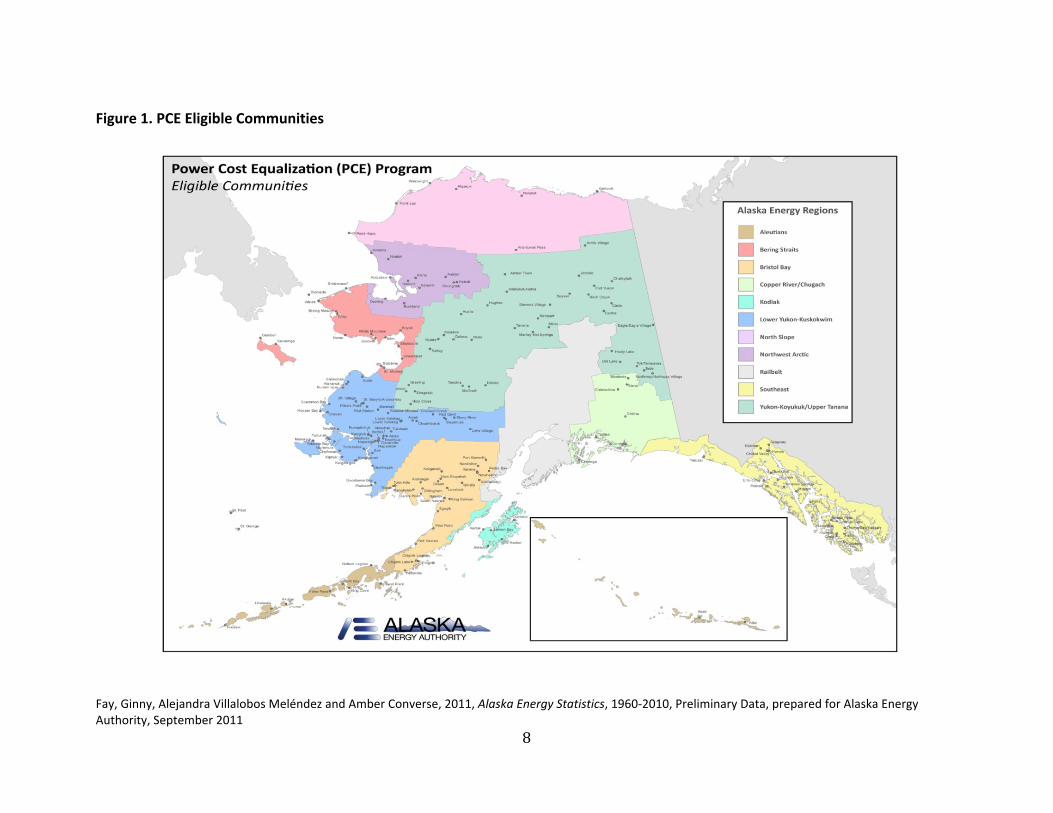
Figure 1. PCE Eligible Communities
Fay, Ginny, Alejandra Villalobos Meléndez and Amber Converse, 2011, Alaska Energy Statistics, 1960‐2010, Preliminary Data, prepared for Alaska Energy Authority, September 2011
9
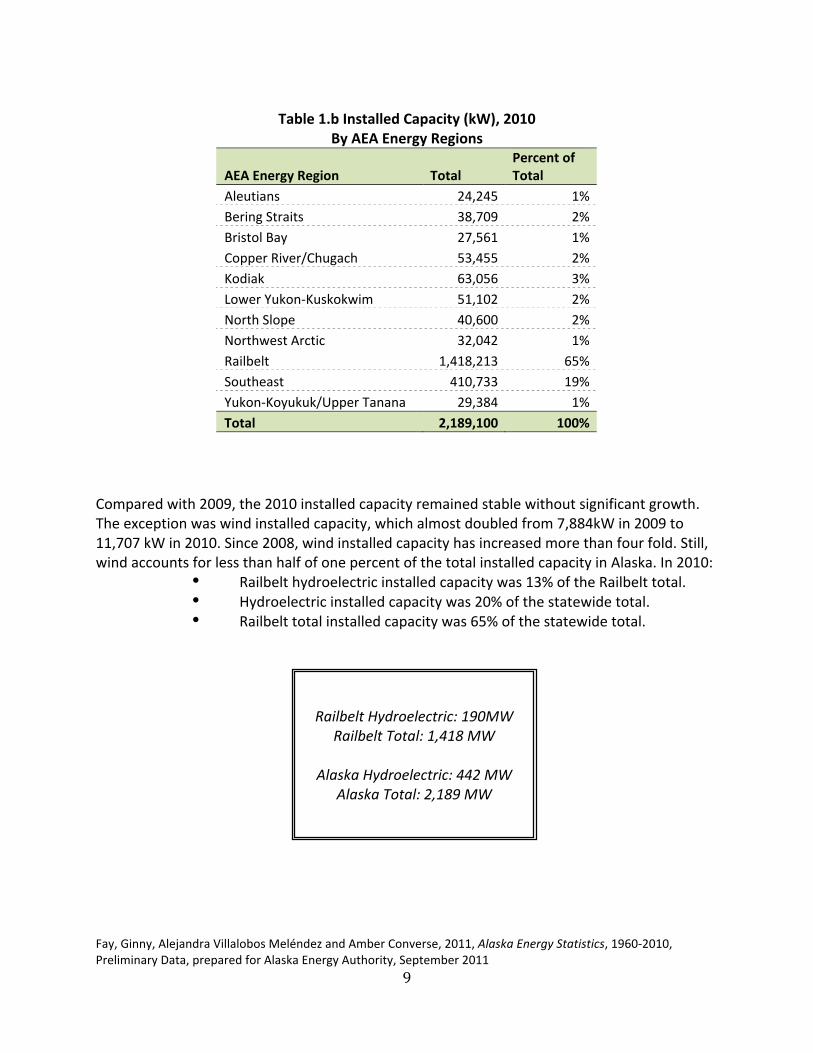
Table 1.b Installed Capacity (kW), 2010 By AEA Energy Regions
AEA Energy Region Total Percent of Total
Aleutians 24,245 1% Bering Straits 38,709 2% Bristol Bay 27,561 1% Copper River/Chugach 53,455 2% Kodiak 63,056 3% Lower Yukon‐Kuskokwim 51,102 2% North Slope 40,600 2% Northwest Arctic 32,042 1% Railbelt 1,418,213 65% Southeast 410,733 19% Yukon‐Koyukuk/Upper Tanana 29,384 1% Total 2,189,100 100%
Compared with 2009, the 2010 installed capacity remained stable without significant growth. The exception was wind installed capacity, which almost doubled from 7,884kW in 2009 to 11,707 kW in 2010. Since 2008, wind installed capacity has increased more than four fold. Still, wind accounts for less than half of one percent of the total installed capacity in Alaska. In 2010:
• Railbelt hydroelectric installed capacity was 13% of the Railbelt total. • Hydroelectric installed capacity was 20% of the statewide total. • Railbelt total installed capacity was 65% of the statewide total.
Railbelt Hydroelectric: 190MW
Railbelt Total: 1,418 MW
Alaska Hydroelectric: 442 MW Alaska Total: 2,189 MW
Fay, Ginny, Alejandra Villalobos Meléndez and Amber Converse, 2011, Alaska Energy Statistics, 1960‐2010, Preliminary Data, prepared for Alaska Energy Authority, September 2011
10
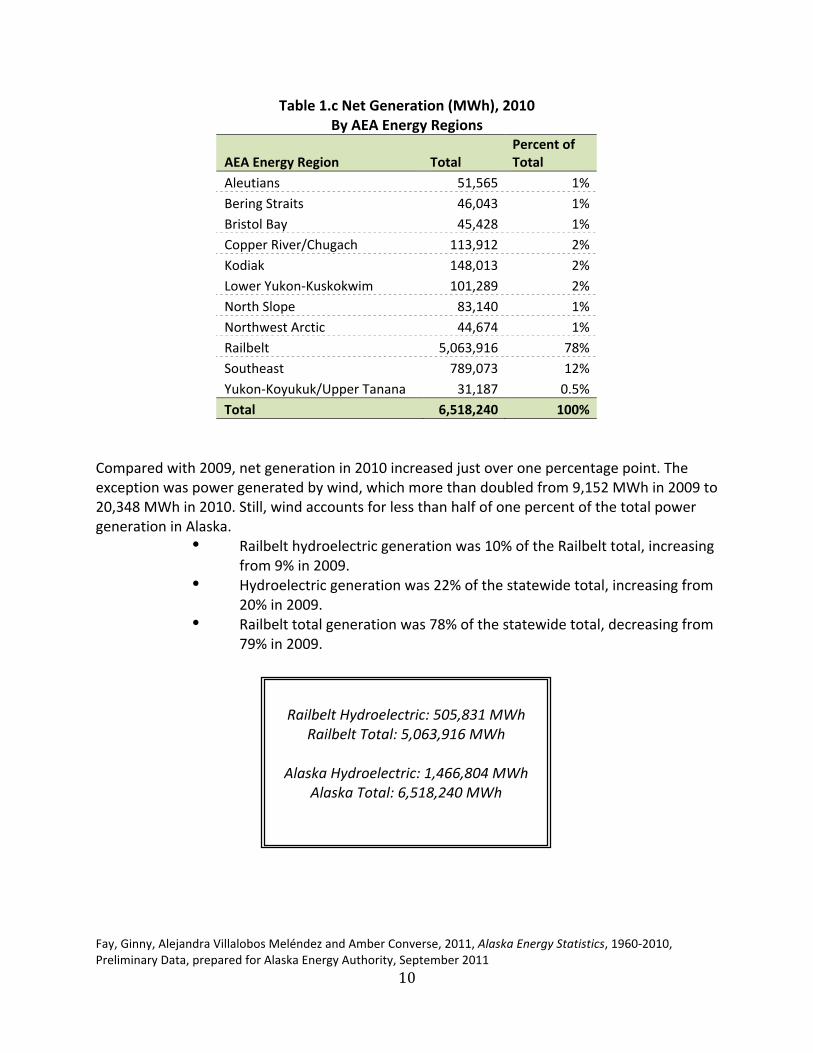
Table 1.c Net Generation (MWh), 2010 By AEA Energy Regions
AEA Energy Region Total Percent of Total
Aleutians 51,565 1% Bering Straits 46,043 1% Bristol Bay 45,428 1% Copper River/Chugach 113,912 2% Kodiak 148,013 2% Lower Yukon‐Kuskokwim 101,289 2% North Slope 83,140 1% Northwest Arctic 44,674 1% Railbelt 5,063,916 78% Southeast 789,073 12% Yukon‐Koyukuk/Upper Tanana 31,187 0.5% Total 6,518,240 100%
Compared with 2009, net generation in 2010 increased just over one percentage point. The exception was power generated by wind, which more than doubled from 9,152 MWh in 2009 to 20,348 MWh in 2010. Still, wind accounts for less than half of one percent of the total power generation in Alaska.
• Railbelt hydroelectric generation was 10% of the Railbelt total, increasing from 9% in 2009.
• Hydroelectric generation was 22% of the statewide total, increasing from 20% in 2009.
• Railbelt total generation was 78% of the statewide total, decreasing from 79% in 2009.
Railbelt Hydroelectric: 505,831 MWh Railbelt Total: 5,063,916 MWh
Alaska Hydroelectric: 1,466,804 MWh
Alaska Total: 6,518,240 MWh
Fay, Ginny, Alejandra Villalobos Meléndez and Amber Converse, 2011, Alaska Energy Statistics, 1960‐2010, Preliminary Data, prepared for Alaska Energy Authority, September 2011
11
Table 1.d Net Generation by Fuel Type (MWh), 2010 By AEA Energy Regions
AEA Energy Region Oil Gas Coal Hydro Wind Total
Aleutians 49,236 2,328 51,564
Bering Straits 43,814 2,229 46,042
Bristol Bay 45,414 3 11 45,428
Copper River/Chugach 51,413 62,498 113,911
Kodiak 11,242 124,165 12,606 148,013
Lower Yukon‐Kuskokwim 98,780 2,509 101,289
North Slope 28,460 54,680 83,140
Northwest Arctic 40,577 3,005 1,092 44,674
Railbelt 532,208 3,635,555 388,421 505,831 1,901 5,063,916
Southeast 20,099 768,974 789,073
Yukon‐Koyukuk/ Upper Tanana 31,187 31,187
Total 952,430 3,690,235 388,421 1,466,804 20,348 6,518,238 15% 57% 6% 22% 0.31% 100%
Figure 2. Alaska Utilities Net Generation by Fuel Type, 2010
Oil 15%
Gas 57%
Coal 6%
Hydro 22%
Wind 0%
Fay, Ginny, Alejandra Villalobos Meléndez and Amber Converse, 2011, Alaska Energy Statistics, 1960‐2010, Preliminary Data, prepared for Alaska Energy Authority, September 2011
12
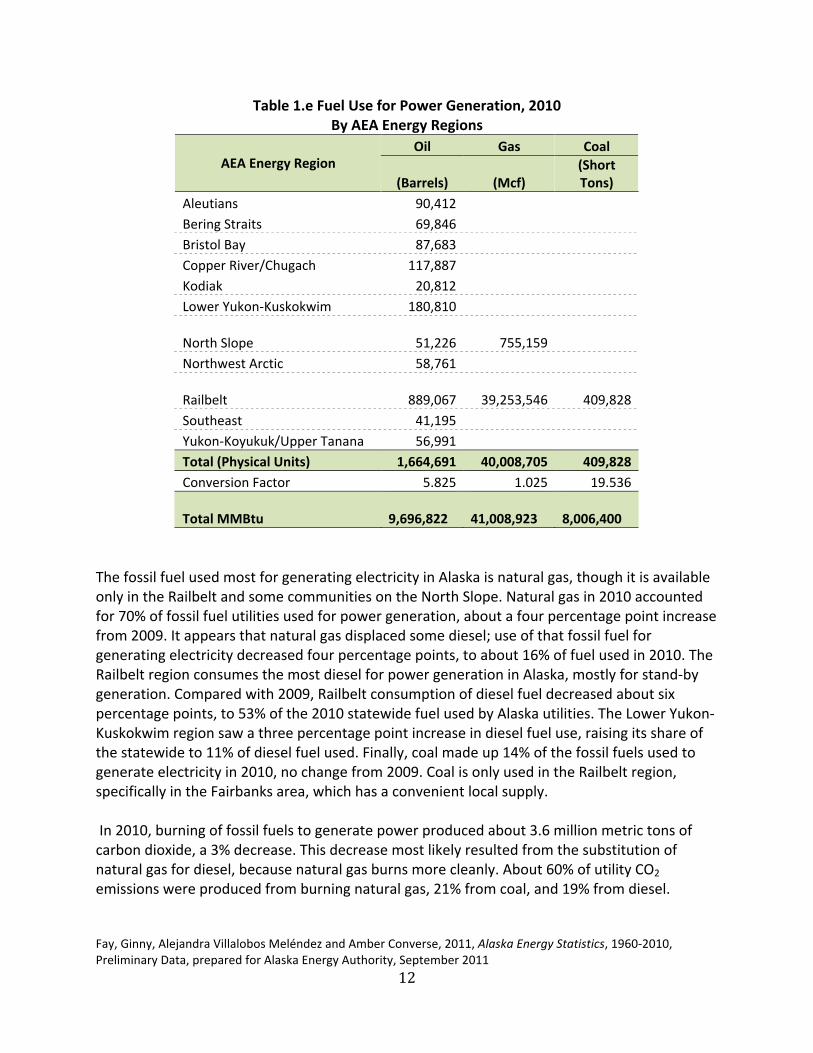
Table 1.e Fuel Use for Power Generation, 2010 By AEA Energy Regions
Oil Gas Coal AEA Energy Region
(Barrels) (Mcf) (Short Tons)
Aleutians 90,412 Bering Straits 69,846 Bristol Bay 87,683 Copper River/Chugach 117,887 Kodiak 20,812 Lower Yukon‐Kuskokwim 180,810
North Slope 51,226
755,159 Northwest Arctic 58,761
Railbelt 889,067
39,253,546
409,828 Southeast 41,195 Yukon‐Koyukuk/Upper Tanana 56,991 Total (Physical Units) 1,664,691 40,008,705 409,828 Conversion Factor 5.825 1.025 19.536
Total MMBtu 9,696,822
41,008,923
8,006,400
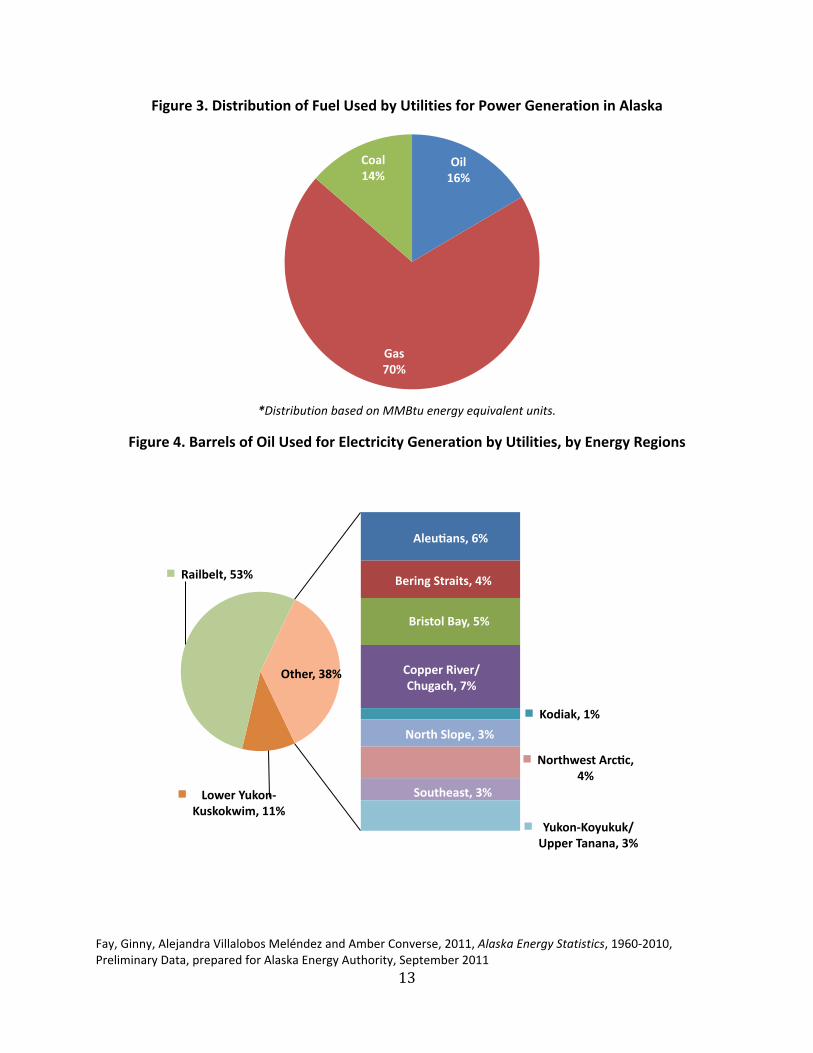
The fossil fuel used most for generating electricity in Alaska is natural gas, though it is available only in the Railbelt and some communities on the North Slope. Natural gas in 2010 accounted for 70% of fossil fuel utilities used for power generation, about a four percentage point increase from 2009. It appears that natural gas displaced some diesel; use of that fossil fuel for generating electricity decreased four percentage points, to about 16% of fuel used in 2010. The Railbelt region consumes the most diesel for power generation in Alaska, mostly for stand‐by generation. Compared with 2009, Railbelt consumption of diesel fuel decreased about six percentage points, to 53% of the 2010 statewide fuel used by Alaska utilities. The Lower Yukon‐Kuskokwim region saw a three percentage point increase in diesel fuel use, raising its share of the statewide to 11% of diesel fuel used. Finally, coal made up 14% of the fossil fuels used to generate electricity in 2010, no change from 2009. Coal is only used in the Railbelt region, specifically in the Fairbanks area, which has a convenient local supply. In 2010, burning of fossil fuels to generate power produced about 3.6 million metric tons of carbon dioxide, a 3% decrease. This decrease most likely resulted from the substitution of natural gas for diesel, because natural gas burns more cleanly. About 60% of utility CO2 emissions were produced from burning natural gas, 21% from coal, and 19% from diesel.
Fay, Ginny, Alejandra Villalobos Meléndez and Amber Converse, 2011, Alaska Energy Statistics, 1960‐2010, Preliminary Data, prepared for Alaska Energy Authority, September 2011
13
Figure 3. Distribution of Fuel Used by Utilities for Power Generation in Alaska
*Distribution based on MMBtu energy equivalent units.
Figure 4. Barrels of Oil Used for Electricity Generation by Utilities, by Energy Regions
Oil 16%
Gas 70%
Coal 14%
AleuWans, 6%
Bering Straits, 4%
Bristol Bay, 5%
Copper River/Chugach, 7%
Kodiak, 1%
Lower Yukon‐Kuskokwim, 11%
North Slope, 3%
Northwest ArcWc, 4%
Railbelt, 53%
Southeast, 3%
Yukon‐Koyukuk/Upper Tanana, 3%
Other, 38%
Fay, Ginny, Alejandra Villalobos Meléndez and Amber Converse, 2011, Alaska Energy Statistics, 1960‐2010, Preliminary Data, prepared for Alaska Energy Authority, September 2011
14
Table 1.f Sales (MWh), 2010 By AEA Energy Regions
AEA Energy Region Residential Commercial Other4 Total Percent of Total Aleutians 8,752 34,008 10,065 52,826 1% Bering Straits 14,124 16,924 10,519 41,567 1% Bristol Bay 14,923 25,751 11,193 51,868 1% Copper River/Chugach 23,507 61,069 4,721 89,297 1% Kodiak 34,586 21,828 84,901 141,315 2% Lower Yukon‐Kuskokwim 31,302 35,914 21,725 88,942 1% North Slope 17,199 58,556 1,465 77,221 1% Northwest Arctic 12,699 12,017 8,138 32,853 1% Railbelt 1,620,958 2,129,265 1,036,081 4,786,304 77% Southeast 308,371 310,686 176,606 795,663 13% Yukon‐Koyukuk/Upper Tanana
11,334 8,087 8,445 27,866 0%
Total 2,097,755 2,714,105 1,373,861 6,185,721 Percent of Total 34% 44% 22% 100%
For this preliminary report, it is difficult to establish if 2010 electricity sales actually decreased, as the summary figures above show—about a 2% decrease compared with 2009. Though some regions appeared to have significant drops in reported sales (North Slope, Bering Straits, Yukon‐Koyukuk/Upper Tanana regions), these differences likely result from unavailable data or utilities with only partial reporting at this time.5 As expected, most of the 2010 power sales were in the Railbelt region. The Southeast and Railbelt regions had the highest annual average use per residential customer, at about 9,620 kWh and 7,676 kWh, respectively. The Yukon‐Koyukuk/Upper Tanana and Bering Straits regions had the lowest annual average use per residential customer, at about 3,822 kWh and 4,200 kWh, respectively. Slightly less than half, about 44%, of the electricity produced in Alaska was sold to commercial customers in 2010. The North Slope and Railbelt regions had the highest annual average use per commercial customer, at about 72,010 kWh and 71,358 kWh, respectively. The Yukon‐Koyukuk/Upper Tanana and Kodiak regions had the lowest annual average use per commercial customer, at about 13,113 kWh and 20,115 kWh, respectively.
4 The significant differences between 2009 are 2010 figures are methodological. In 2010, industrial sales are included in the “Other” category. In 2009, industrial customers were included in the commercial category and “Other” included sales to community, governmental facilities, and others. 5 For example, for the North Slope region, data for commercial sales from Deadhorse (TDX) are not yet available. For the Bering Straits region, only partial reporting is available for Nome Utilities (missing 4 months of data). For the Yukon‐Koyukuk/Upper Tanana region, data for Galena is not yet available.
Fay, Ginny, Alejandra Villalobos Meléndez and Amber Converse, 2011, Alaska Energy Statistics, 1960‐2010, Preliminary Data, prepared for Alaska Energy Authority, September 2011
15
Table 1.g Revenue ($000), 2010 By AEA Energy Regions
AEA Energy Region Residential Commercial Other Total Percent of Total
Aleutians
3,816
13,924
4,726
22,466 2%
Bering Straits
6,258
6,751
4,727
17,736 2%
Bristol Bay
6,543
11,310
5,011
22,865 2%
Copper River/Chugach
6,093
13,936
1,747
21,776 2%
Kodiak
6,368
3,932
13,782
24,081 3%
Lower Yukon‐Kuskokwim
16,222
17,276
11,354
44,852 5%
North Slope
2,213
6,857
221
9,291 1%
Northwest Arctic
6,523
5,661
4,594
16,778 2%
Railbelt
245,338
245,401
147,352
638,091 69%
Southeast
37,064
35,742
18,506
91,312 10%
Yukon‐Koyukuk/Upper Tanana
5,913
4,344
4,607
14,864 2% Total 342,351 365,136 216,626 924,113 Percent of Total 37% 40% 23% 100%
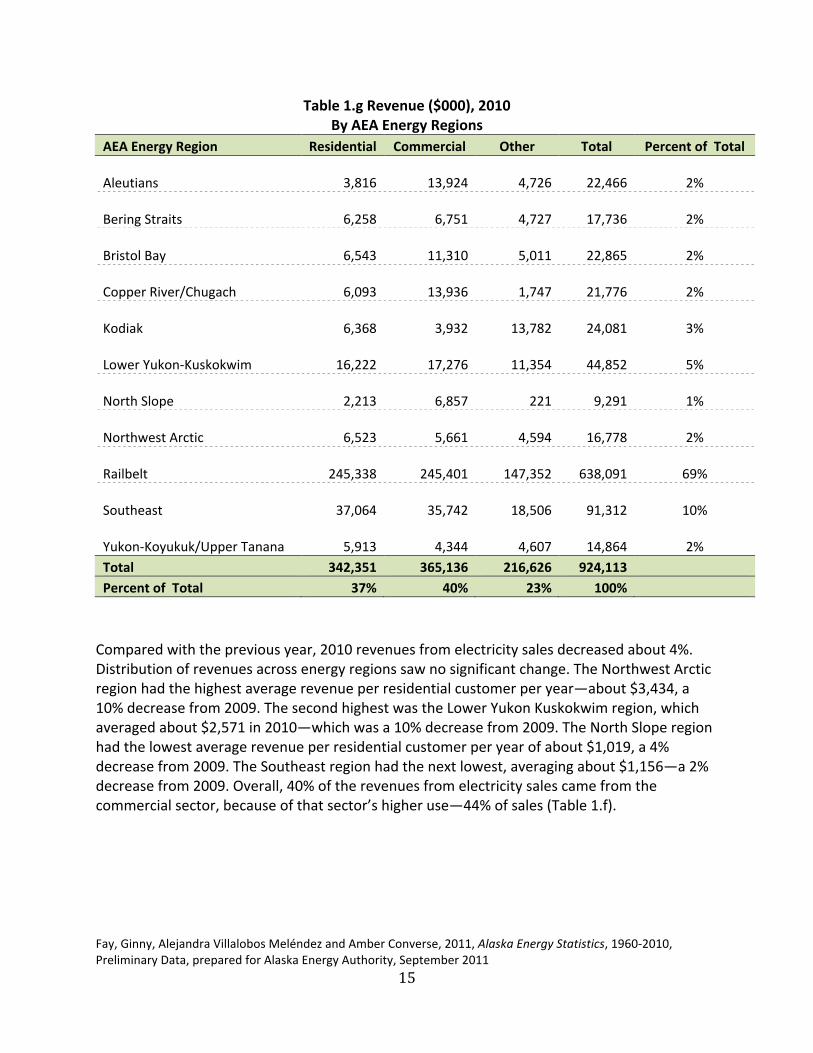
Compared with the previous year, 2010 revenues from electricity sales decreased about 4%. Distribution of revenues across energy regions saw no significant change. The Northwest Arctic region had the highest average revenue per residential customer per year—about $3,434, a 10% decrease from 2009. The second highest was the Lower Yukon Kuskokwim region, which averaged about $2,571 in 2010—which was a 10% decrease from 2009. The North Slope region had the lowest average revenue per residential customer per year of about $1,019, a 4% decrease from 2009. The Southeast region had the next lowest, averaging about $1,156—a 2% decrease from 2009. Overall, 40% of the revenues from electricity sales came from the commercial sector, because of that sector’s higher use—44% of sales (Table 1.f).
Fay, Ginny, Alejandra Villalobos Meléndez and Amber Converse, 2011, Alaska Energy Statistics, 1960‐2010, Preliminary Data, prepared for Alaska Energy Authority, September 2011
16
Table 1.h Customers (Accounts), 2010 By AEA Energy Regions
AEA Energy Region Residential Commercial Other Total Percent of Total
Aleutians
1,531
710
353
2,594 1%
Bering Straits
3,363
511
401
4,275 1%
Bristol Bay
3,008
1,006
505
4,519 1%
Copper River/Chugach
3,984
1,493
155
5,632 2%
Kodiak
4,895
1,085
139
6,118 2%
Lower Yukon‐Kuskokwim
6,309
1,663
743
8,715 3%
North Slope
2,172
813
40
3,025 1%
Northwest Arctic
1,900
218
243
2,361 1%
Railbelt
211,176
29,839
615
241,630 75%
Southeast
32,057
8,273
784
41,114 13%
Yukon‐Koyukuk/Upper Tanana
2,965
617
469
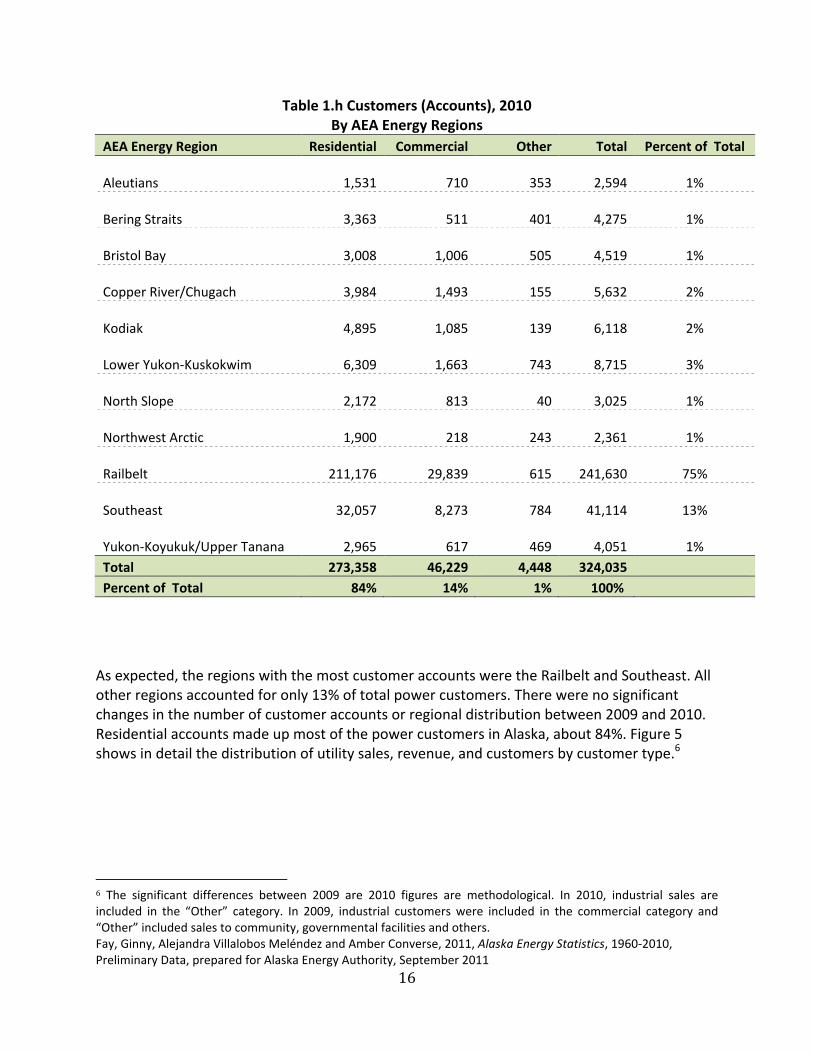
4,051 1% Total 273,358 46,229 4,448 324,035 Percent of Total 84% 14% 1% 100% As expected, the regions with the most customer accounts were the Railbelt and Southeast. All other regions accounted for only 13% of total power customers. There were no significant changes in the number of customer accounts or regional distribution between 2009 and 2010. Residential accounts made up most of the power customers in Alaska, about 84%. Figure 5 shows in detail the distribution of utility sales, revenue, and customers by customer type.6
6 The significant differences between 2009 are 2010 figures are methodological. In 2010, industrial sales are included in the “Other” category. In 2009, industrial customers were included in the commercial category and “Other” included sales to community, governmental facilities and others.
Fay, Ginny, Alejandra Villalobos Meléndez and Amber Converse, 2011, Alaska Energy Statistics, 1960‐2010, Preliminary Data, prepared for Alaska Energy Authority, September 2011
17
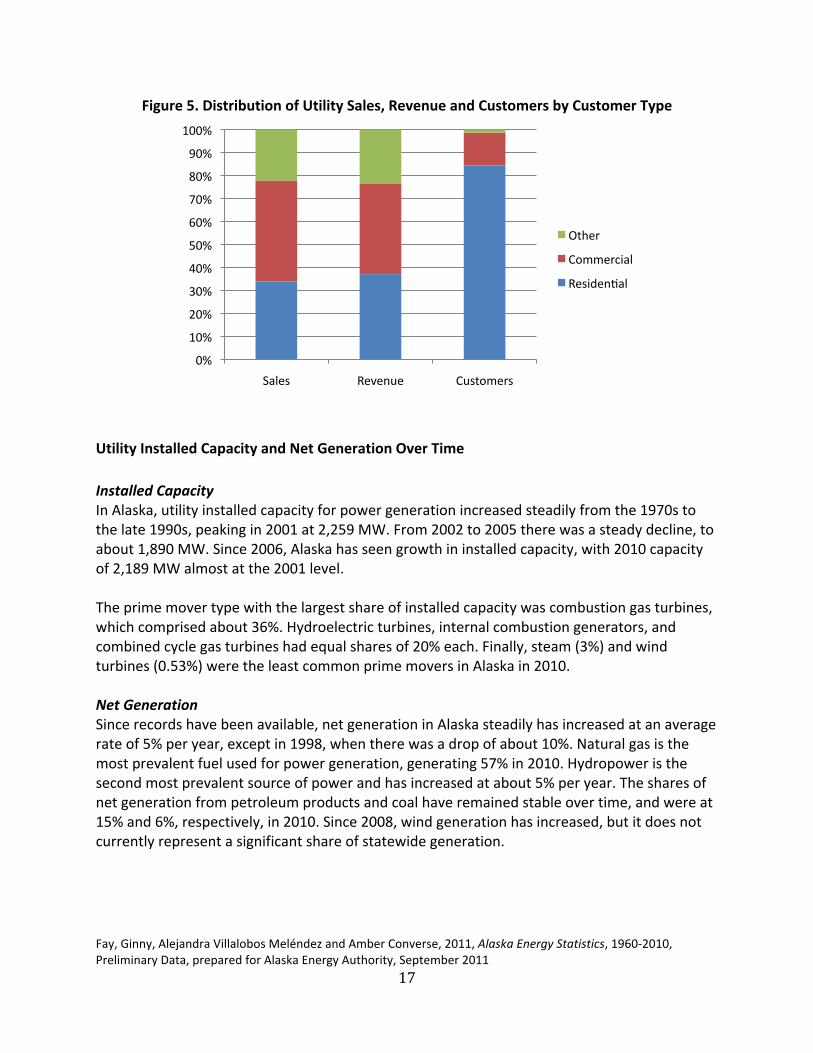
Figure 5. Distribution of Utility Sales, Revenue and Customers by Customer Type
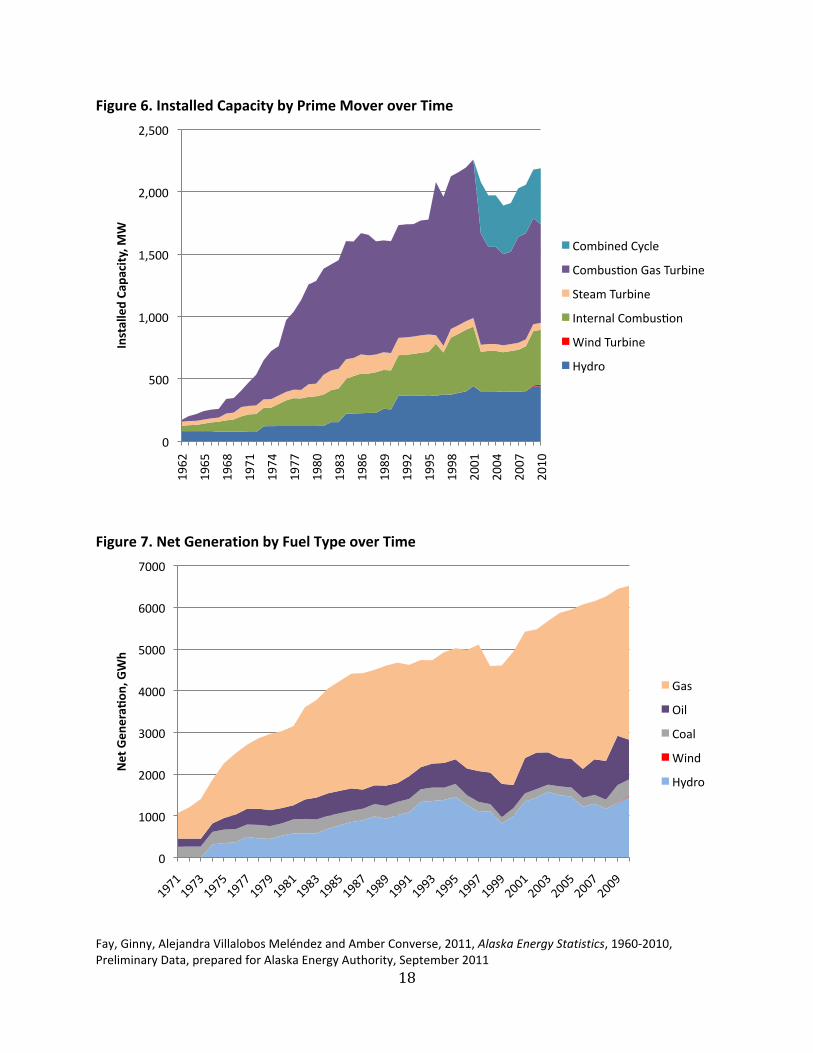
Utility Installed Capacity and Net Generation Over Time Installed Capacity In Alaska, utility installed capacity for power generation increased steadily from the 1970s to the late 1990s, peaking in 2001 at 2,259 MW. From 2002 to 2005 there was a steady decline, to about 1,890 MW. Since 2006, Alaska has seen growth in installed capacity, with 2010 capacity of 2,189 MW almost at the 2001 level. The prime mover type with the largest share of installed capacity was combustion gas turbines, which comprised about 36%. Hydroelectric turbines, internal combustion generators, and combined cycle gas turbines had equal shares of 20% each. Finally, steam (3%) and wind turbines (0.53%) were the least common prime movers in Alaska in 2010. Net Generation Since records have been available, net generation in Alaska steadily has increased at an average rate of 5% per year, except in 1998, when there was a drop of about 10%. Natural gas is the most prevalent fuel used for power generation, generating 57% in 2010. Hydropower is the second most prevalent source of power and has increased at about 5% per year. The shares of net generation from petroleum products and coal have remained stable over time, and were at 15% and 6%, respectively, in 2010. Since 2008, wind generation has increased, but it does not currently represent a significant share of statewide generation.
0%
10%
20%
30%
40%
50%
60%
70%
80%
90%
100%
Sales Revenue Customers
Other
Commercial
Residenlal
Fay, Ginny, Alejandra Villalobos Meléndez and Amber Converse, 2011, Alaska Energy Statistics, 1960‐2010, Preliminary Data, prepared for Alaska Energy Authority, September 2011
18
Figure 6. Installed Capacity by Prime Mover over Time
Figure 7. Net Generation by Fuel Type over Time
0
500
1,000
1,500
2,000
2,500
1962
1965
1968
1971
1974
1977
1980
1983
1986
1989
1992
1995
1998
2001
2004
2007
2010
Installed Ca
pacity, M
W
Combined Cycle
Combuslon Gas Turbine
Steam Turbine
Internal Combuslon
Wind Turbine
Hydro
0
1000
2000
3000
4000
5000
6000
7000
Net Gen
eraW
on, G
Wh
Gas
Oil
Coal
Wind
Hydro
Fay, Ginny, Alejandra Villalobos Meléndez and Amber Converse, 2011, Alaska Energy Statistics, 1960‐2010, Preliminary Data, prepared for Alaska Energy Authority, September 2011
19
Appendix A. Glossary of Terms7 Alaska Energy Authority (AEA): A public corporation of the state with a separate and independent legal existence with the mission to construct, finance, and operate power projects and facilities that utilize Alaska’s natural resources to produce electricity and heat. http://www.akenergyauthority.org/
Auxiliary Generator: A generator at the electric plant site that provides power for the operation of the electrical generating equipment itself, including related demands such as plant lighting, during periods when the electric plant is not operating and power is unavailable from the grid. A black start generator used to start main central station generators is considered to be an auxiliary generator.
Backup (Standby) Generator: A generator that is used only for test purposes, or in the event of an emergency, such as a shortage of power needed to meet customer load requirements.
Barrel (bbl): A unit of volume equal to 42 U.S. gallons.
Bituminous coal: A dense coal, usually black, sometimes dark brown, often with well‐defined bands of bright and dull material, used primarily as fuel in steam‐electric power generation, with substantial quantities also used for heat and power applications in manufacturing and to make coke. Bituminous coal is the most abundant coal in active U.S. mining regions. Its moisture content usually is less than 20%. The heat content of bituminous coal ranges from 21 to 30 million BTU per ton on a moist, mineral‐matter‐free basis. The heat content of bituminous coal consumed in the United States averages 24 million BTU per ton, on the as‐received basis (i.e. containing both inherent moisture and mineral matter).
British Thermal Unit: The British thermal unit (BTU or Btu) is a traditional unit of energy equal to about 1.06 kilojoules. It is approximately the amount of energy needed to heat 1 pound (0.454 kg) of water1 °F (0.556 °C). It is used in the power, steam generation, heating and air conditioning industries. In North America, the term “BTU” is used to describe the heat value (energy content) of fuels, and also to describe the power of heating and cooling systems. When used as a unit of power, BTU per hour (BTU/h) is the correct unit, though this is often abbreviated to just “BTU”.
Capital Cost: The cost of field development, plant construction, and the equipment required for industry operations.
Climate Change: A term used to refer to all forms of climatic inconsistency, but especially to significant change from one prevailing climatic condition to another. In some cases, “climate change” has been used synonymously with the term “global warming”; scientists, however, tend to use the term in a wider sense inclusive of natural changes in climate, including climatic cooling.
7 U.S. Energy Information Administration glossary posted at www.eia.doe.gov/ plus multiple sources for additional Alaska specific terms.
Fay, Ginny, Alejandra Villalobos Meléndez and Amber Converse, 2011, Alaska Energy Statistics, 1960‐2010, Preliminary Data, prepared for Alaska Energy Authority, September 2011
20
Coal: A readily combustible black or brownish‐black rock whose composition, including inherent moisture, consists of more than 50% by weight and more than 70% by volume of carbonaceous material. It is formed from plant remains that have been compacted, hardened, chemically altered, and metamorphosed by heat and pressure over geologic time. It is estimated that Alaska holds about 15% of the world’s coal resources, amounting to 170 billion identified short tons. Major coal provinces include Northern Alaska, the Nenana area, Cook Inlet – Matanuska Valley, the Alaska Peninsula, and in the Gulf of Alaska and the Bering River. Alaska coals exhibit low metallic trace elements, good ash‐fusion characteristics, and low nitrogen content making them favorable for meeting environmental constraints on combustion in power plants.
Cogeneration system: A system using a common energy source to produce both electricity and thermal energy for other uses, resulting in increased fuel efficiency.
Combined Cycle: An electric generating technology in which electricity is produced from otherwise lost waste heat exiting from one or more gas (combustion) turbines. The exiting heat is routed to a conventional boiler or to a heat recovery steam generator for utilization by a steam turbine in the production of electricity. This process increases the efficiency of the electric generating unit.
Combustion: Chemical oxidation accompanied by the generation of light and heat.
Commercial Sector: An energy‐consuming sector that consists of service‐providing facilities and equipment of businesses; Federal, State, and local governments; and other private and public organizations, such as religious, social, or fraternal groups. The commercial sector includes institutional living quarters. It also includes sewage treatment facilities. Common uses of energy associated with this sector include space heating, water heating, air conditioning, lighting, refrigeration, cooking, and running a wide variety of other equipment. Note: This sector includes generators that produce electricity and/or useful thermal output primarily to support the activities of the above‐mentioned commercial establishments.
Consumer (energy): Any individually metered dwelling, building, establishment, or location.
Diesel #1: Also known as DF1 or Jet A. Diesel #1 is commonly used as heating fuel throughout most of northern rural AK. Diesel #1 has a lower gel temperature than Diesel #2 which is sold for heating fuel in warmer climates. Diesel #1 is same fuel the refineries sell as Jet fuel (Jet A), and in many tank farms it is stored as Jet A until sold as DF1.
Diesel #2: Is commonly used throughout the US. In Alaska it is used for marine and highway diesel as well as heating fuel in warmer regions. Diesel #2 is preferred over #1 where it is warm enough as it has higher energy content.
Diesel Fuel: A fuel composed of distillates obtained in petroleum refining operation or blends of such distillates with residual oil used in motor vehicles. The boiling point and specific gravity are higher for diesel fuels than for gasoline.
Distillate Fuel Oil: A generic name for a refined petroleum product. It can refer to diesel, heating fuel or jet fuel.
Electricity: A form of energy characterized by the presence and motion of elementary charged particles generated by friction, induction, or chemical change.
Fay, Ginny, Alejandra Villalobos Meléndez and Amber Converse, 2011, Alaska Energy Statistics, 1960‐2010, Preliminary Data, prepared for Alaska Energy Authority, September 2011
21
Energy Balance: The difference between the total incoming and total outgoing energy. When the energy budget is balanced, the system neither gains nor loses energy.
Energy Information Agency (EIA): An independent agency within the U.S. Department of Energy that develops surveys, collects energy data, and analyzes and models energy issues. http://www.eia.doe.gov/
Exports: Shipments of goods from within the 50 States and the District of Columbia to U.S. possessions and territories or to foreign countries.
Fuel: Any material substance that can be consumed to supply heat, power, or mechanical energy. Included are petroleum, coal, and natural gas (the fossil fuels), and other consumable materials, such as uranium, biomass, and hydrogen.
Furnished without payment (power): The amount of electricity furnished by the electric utility without charge, such as a municipality under a franchise agreement or for public street and highway lighting. It does not included energy consumed by the utility.
Gallon: A volumetric measure equal to four quarts (231 cubic inches) used to measure fuel oil.
Gas: A non‐solid, non‐liquid combustible energy source that includes natural gas, coke‐oven gas, blast‐furnace gas, and refinery gas.
Grid: The layout of an electrical distribution system.
Gross Domestic Disposition: The total amount of energy available for sale in the domestic region, i.e. energy produced for sale in the domestic region in addition to energy imported for sale within the domestic region.
Gross Extraction: The total amount of fuel obtained or produced by a power production plant.
Gross Generation: The total amount of electric energy produced by generating units and measured at the generating terminal in kilowatt‐hours (kWh) or megawatt hours (MWh).
Heating Degree Days (HDD): A measure of how cold a location is over a period of time relative to a base temperature, most commonly specified as 65 degrees Fahrenheit. The measure is computed for each day by subtracting the average of the day’s high and low temperatures from the base temperature (65 degrees), with negative values set equal to zero. Each day’s heating degree days are summed to create a heating degree day measure for a specified reference period. Heating degree days are used in energy analysis as an indicator of space heating energy requirements or use.
Hydroelectric Power: The use of flowing water to produce electrical energy.
Imports: Receipts of goods into the 50 States and the District of Columbia from U.S. possessions and territories or from foreign countries.
Industrial Sector: An energy‐consuming sector that consists of all facilities and equipment used for producing, processing, or assembling goods. The industrial sector encompasses the following types of activity: manufacturing, agriculture, timber harvest and wood processing, fishing and fish processing, hunting, mining, oil and gas extraction, and construction. Overall energy use in this sector is largely for process heat and cooling and powering machinery, with lesser amounts used for facility heating, air conditioning, and lighting. Fossil fuels are also used
Fay, Ginny, Alejandra Villalobos Meléndez and Amber Converse, 2011, Alaska Energy Statistics, 1960‐2010, Preliminary Data, prepared for Alaska Energy Authority, September 2011
22
as raw material inputs to manufactured products. Note: This sector includes generators that produce electricity and/or useful thermal output primarily to support the above‐mentioned industrial activities.
Injections: Natural gas injected into storage reservoirs.
Installed Capacity: The maximum theoretical production output of a plant, based either on nameplate capacity or actual (practically determined) capacity.
Internal Combustion: The process where fuel is burned, or combusted, inside a cylinder, such as a diesel engine, producing power directly as opposed to fuel burning externally, such as in a steam engine. The term internal combustion engine usually refers to an engine in which combustion is intermittent, such as the more familiar four‐stroke and two‐stroke piston engines. A second class of internal combustion engines uses continuous combustion: gas turbines, jet engines and most rocket engines.
Kilowatt‐hour (kWh): A unit of energy equal to one kW applied for one hour; running a one kW hair dryer for one hour would dissipate one kWh of electrical energy as heat. Also, one kWh is equivalent to one thousand watt hours.
Kilowatt (kW): One thousand watts of electricity (See Watt).
Load (Electric): Amount of electricity required to meet customer demand at any given time.
MCF: One thousand cubic feet.
Megawatt (MW): One million watts of electricity (See Watt).
Mining: An energy‐consuming subsector of the industrial sector that consists of all facilities and equipment used to extract energy and mineral resources.
Nameplate Capacity: The maximum rated output of an electric power production unit (i.e. generator, prime mover) under specific conditions designated by the manufacturer. Capacity is usually indicated on a nameplate physically attached to the generator.
Natural Gas: Gas in place at the time that a reservoir was converted to use as an underground storage reservoir in contrast to injected gas volumes.
Net Capacity: The maximum load that an electrical apparatus (i.e. generating unit or station) can carry, not including use by the electrical apparatus.
Net Domestic Disposition: The total amount of energy produced in the domestic region that is available for sale within the domestic region, i.e. not including energy use by producers or energy exported for sale outside of the domestic region.
Net Extraction: The total amount of fuel obtained or produced by a power production plant, not including electric energy use by the plants.
Net Generation: The amount of gross generation not including the electrical energy consumed at the generating station(s) for station service or auxiliaries. Note: Electricity required for pumping at pumped‐storage plants is regarded as electricity for station service and is deducted from gross generation.
Fay, Ginny, Alejandra Villalobos Meléndez and Amber Converse, 2011, Alaska Energy Statistics, 1960‐2010, Preliminary Data, prepared for Alaska Energy Authority, September 2011
23
Oil: A mixture of hydrocarbons usually existing in the liquid state in natural underground pools or reservoirs. Gas is often found in association with oil (See Petroleum).
O&M: Operations and maintenance
Other: The “other” category is defined as representing electricity consumers not elsewhere classified. This category includes public street and highway lighting service, public authority service to public authorities, railroad and railway service, and interdepartmental services.
Peak: The amount of electricity required to meet customer demand at its highest. The summer peak period begins June 1st and ends September 30th, and the winter peak period begins December 1st and ends March 31st.
Petroleum: A broadly defined class of liquid hydrocarbon mixtures. Included are crude oil, lease condensate, unfinished oils, refined products obtained from the processing of crude oil, and natural gas plant liquids. Note: Volumes of finished petroleum products include non‐hydrocarbon compounds, such as additives and detergents, after they have been blended into the products.
Petroleum Products: Petroleum products are obtained from the processing of crude oil (including lease condensate), natural gas, and other hydrocarbon compounds. Petroleum products include unfinished oils, liquefied petroleum gases, pentanes plus, aviation gasoline, motor gasoline, naphtha‐type jet fuel, kerosene‐type jet fuel, kerosene, distillate fuel oil, residual fuel oil, petrochemical feedstocks, special naphthas, lubricants, waxes, petroleum coke, asphalt, road oil, still gas, and miscellaneous products
Plant: A term commonly used either as a synonym for an industrial establishment or a generating facility or to refer to a particular process within an establishment.
Power: The rate of producing, transferring, or using energy that is capable of doing work, most commonly associated with electricity. Power is measured in watts and often expressed in kilowatts (kW) or megawatts (MW).
Power Cost Equalization Program (PCE): Participating utilities receive state funding to reduce the charge to consumers in rural areas where prices can be three to five times higher than prices in urban areas.
Prime Mover: The engine, turbine, water wheel, or similar machine that drives an electric generator; or, for reporting purposes, a device that converts energy to electricity directly (e.g. photovoltaic solar and fuel cells).
Prime Mover
Code Prime Mover Description (U.S. EIA)
ST……….. Steam Turbine, including nuclear, geothermal and solar steam (does not include combined cycle)
GT……….. Combustion (Gas) Turbine (includes jet engine design)
IC……….. Internal Combustion Engine (diesel, piston)
Fay, Ginny, Alejandra Villalobos Meléndez and Amber Converse, 2011, Alaska Energy Statistics, 1960‐2010, Preliminary Data, prepared for Alaska Energy Authority, September 2011
24
CA……….. Combined Cycle Steam Part CT……….. Combined Cycle Combustion Turbine Part CS……….. Combined Cycle Single Shaft (combustion turbine
and steam turbine share a single generator) CC……….. Combined Cycle ‐ Total Unit HY……….. Hydraulic Turbine (includes turbines associated
with delivery of water by pipeline) PS……….. Hydraulic Turbine – Reversible (pumped storage) BT……….. Turbines used in a binary cycle such as geothermal PV……….. Photovoltaic WT……….. Wind Turbine CE……….. Compressed Air Energy Storage FC……….. Fuel Cell OT……….. Other NA……….. Unknown at this time (use only for
plants/generators in planning stage)
Pro Forma: A Latin term means “for the sake of form,” it describes a method of calculating financial results in order to emphasize either current or projected figures.
Purchased Capacity: The amount of energy and capacity available for purchase from outside the system.
Railbelt: The portion of Alaska that is near the Alaska Railroad, generally including Fairbanks, Anchorage, the communities between these two cities, and the Kenai Peninsula.
Refinery: An installation that manufactures finished petroleum products from crude oil, unfinished oils, natural gas liquids, other hydrocarbons, and oxygenates.
Reinjected: The forcing of gas under pressure into an oil reservoir in an attempt to increase recovery.
Renewable Energy Fund (REF): Established by the Alaska State Legislature and administered by the Alaska Energy Authority to competitively award grants to qualified applicants for renewable energy projects.
Renewable Energy Resources: Energy resources that are naturally replenishing but flow‐limited. They are virtually inexhaustible in duration but limited in the amount of energy that is available per unit of time. Renewable energy resources include biomass, hydro, geothermal, solar, wind, ocean thermal, wave action, and tidal action.
Residential Sector: An energy‐consuming sector that consists of living quarters for private households. Common uses of energy associated with this sector include space heating, water heating, air conditioning, lighting, refrigeration, cooking, and running a variety of other appliances. The residential sector excludes institutional living quarters.
Residual Fuel Oil: A general classification for the heavier oils that remain after the distillate fuel oils and lighter hydrocarbons are distilled away in refinery operations. It is used in steam‐
Fay, Ginny, Alejandra Villalobos Meléndez and Amber Converse, 2011, Alaska Energy Statistics, 1960‐2010, Preliminary Data, prepared for Alaska Energy Authority, September 2011
25
powered vessels in government service and inshore power plants, and can be issued for the production of electric power, space heating, vessel bunkering, and various industrial purposes.
Revenue (Electricity): The total amount of money received by an entity from sales of its products and/or services; gains from the sales or exchanges of assets, interest, and dividends earned on investments; and other increases in the owner’s equity, except those arising from capital adjustments.
Short Ton: A unit of weight equal to 2,000 pounds.
Space Heating: The use of energy to generate heat for warmth in housing units using space‐heating equipment. It does not include the use of energy to operate appliances (such as lights, televisions, and refrigerators) that give off heat as a byproduct.
Steam: Water in vapor form; used as the working fluid in steam turbines and some heating systems.
Transmission System (Electric): An interconnected group of electric transmission lines and associated equipment for moving or transferring electric energy in bulk between points of supply and points at which it is transformed for delivery over the distribution system lines to consumers, or is delivered to other electric systems.
Tonne (Ton): A unit of mass equal to 1,000 kilograms or 2,204.6 pounds, also known as a metric ton.
Total Disposition: The total amount of sold or transferred energy.
Turbine: A machine for generating rotary mechanical power from the energy of a moving force (such as water, hot gas, wind, or steam). Turbines convert the kinetic energy to mechanical energy through the principles of impulse and reaction, or a mixture of the two.
U.S. Department of Energy (DOE): Oversees programs, such as Wind Powering America, with the mission to advance national, economic, and energy security; promote innovation; and ensure environmental responsibility. http://www.energy.gov/
Watt (Electric): The electrical unit of power. The rate of energy transfer equivalent to one ampere of electric current flowing under a pressure of one volt at unity power factor.
Watt (Thermal): A unit of power in the metric system, expressed in terms of energy per second, equal to the work done at a rate of one joule per second.
Watt hour (Wh): The electrical energy unit of measure equal to one watt of power supplied to, or taken from, an electric circuit steadily for one hour.
Fay, Ginny, Alejandra Villalobos Meléndez and Amber Converse, 2011, Alaska Energy Statistics, 1960‐2010, Preliminary Data, prepared for Alaska Energy Authority, September 2011
26
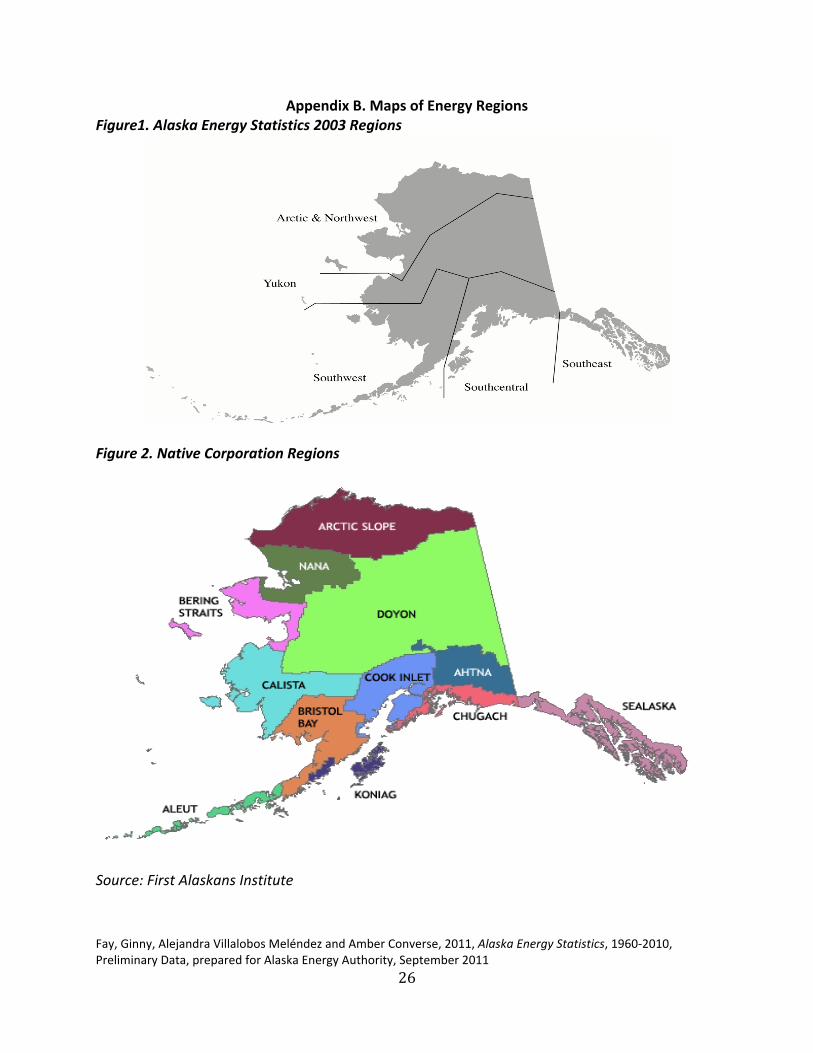
Appendix B. Maps of Energy Regions Figure1. Alaska Energy Statistics 2003 Regions
Figure 2. Native Corporation Regions
Source: First Alaskans Institute
Fay, Ginny, Alejandra Villalobos Meléndez and Amber Converse, 2011, Alaska Energy Statistics, 1960‐2010, Preliminary Data, prepared for Alaska Energy Authority, September 2011
27
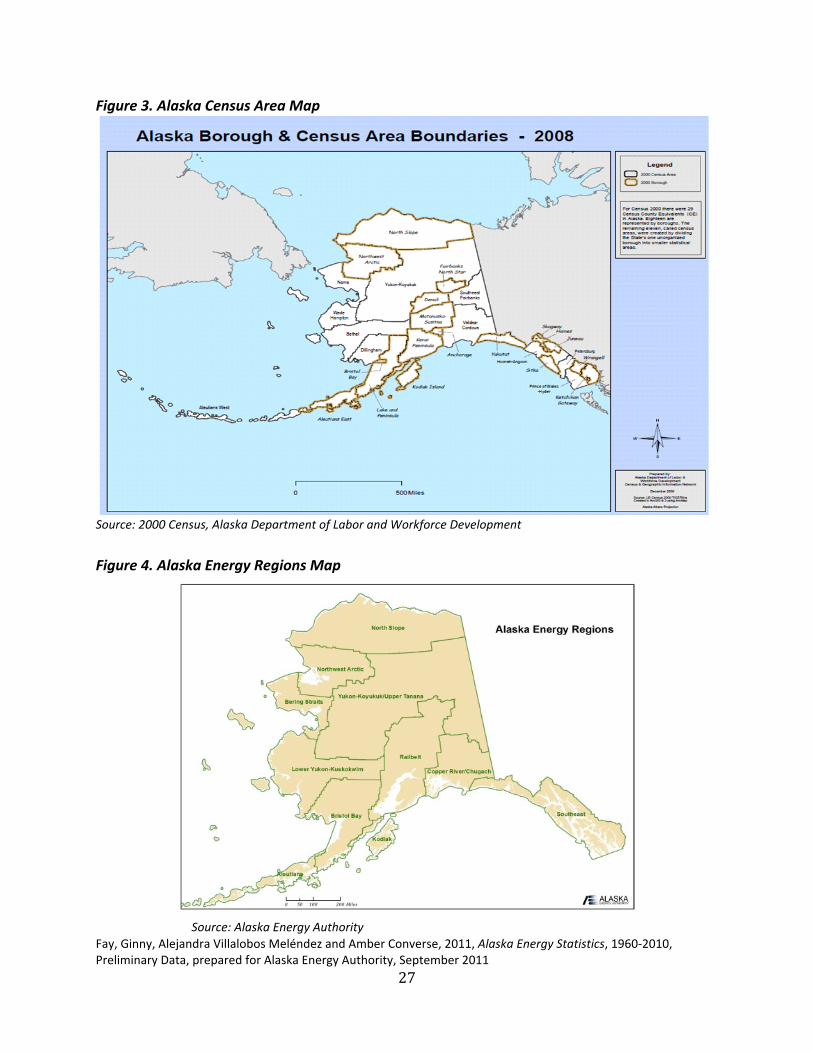
Figure 3. Alaska Census Area Map
Source: 2000 Census, Alaska Department of Labor and Workforce Development
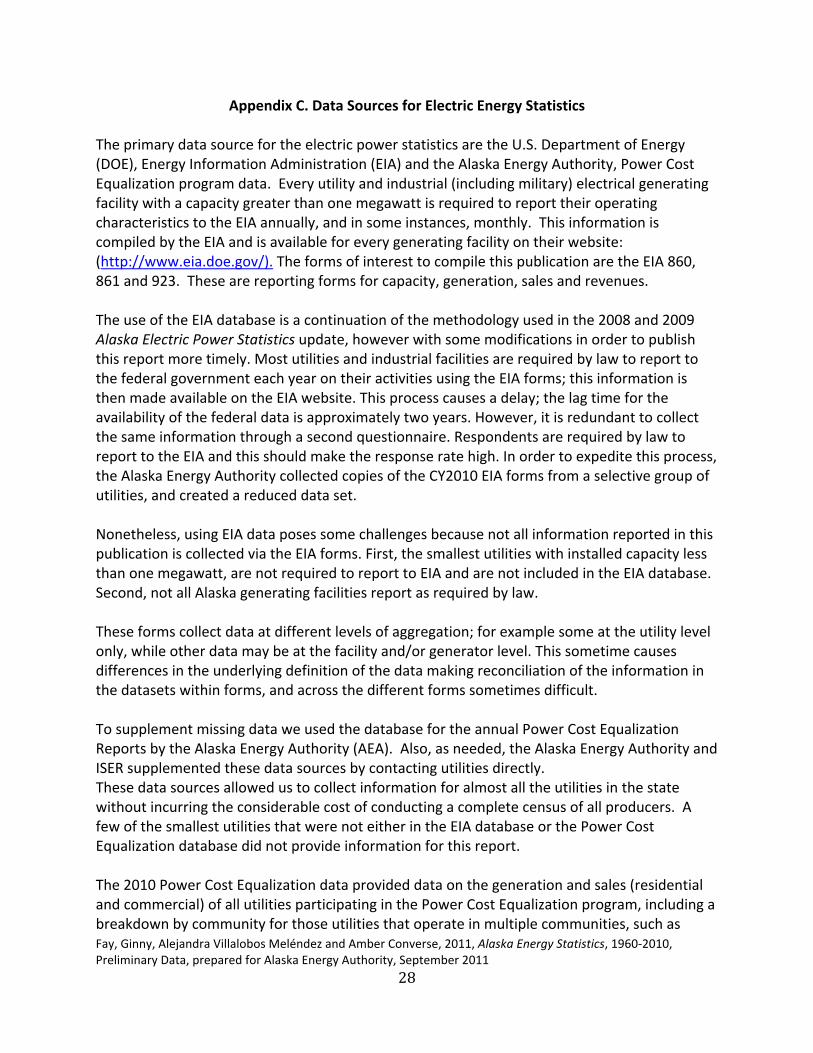
Figure 4. Alaska Energy Regions Map
Source: Alaska Energy Authority
Fay, Ginny, Alejandra Villalobos Meléndez and Amber Converse, 2011, Alaska Energy Statistics, 1960‐2010, Preliminary Data, prepared for Alaska Energy Authority, September 2011
28
Appendix C. Data Sources for Electric Energy Statistics The primary data source for the electric power statistics are the U.S. Department of Energy (DOE), Energy Information Administration (EIA) and the Alaska Energy Authority, Power Cost Equalization program data. Every utility and industrial (including military) electrical generating facility with a capacity greater than one megawatt is required to report their operating characteristics to the EIA annually, and in some instances, monthly. This information is compiled by the EIA and is available for every generating facility on their website: (http://www.eia.doe.gov/). The forms of interest to compile this publication are the EIA 860, 861 and 923. These are reporting forms for capacity, generation, sales and revenues. The use of the EIA database is a continuation of the methodology used in the 2008 and 2009 Alaska Electric Power Statistics update, however with some modifications in order to publish this report more timely. Most utilities and industrial facilities are required by law to report to the federal government each year on their activities using the EIA forms; this information is then made available on the EIA website. This process causes a delay; the lag time for the availability of the federal data is approximately two years. However, it is redundant to collect the same information through a second questionnaire. Respondents are required by law to report to the EIA and this should make the response rate high. In order to expedite this process, the Alaska Energy Authority collected copies of the CY2010 EIA forms from a selective group of utilities, and created a reduced data set. Nonetheless, using EIA data poses some challenges because not all information reported in this publication is collected via the EIA forms. First, the smallest utilities with installed capacity less than one megawatt, are not required to report to EIA and are not included in the EIA database. Second, not all Alaska generating facilities report as required by law. These forms collect data at different levels of aggregation; for example some at the utility level only, while other data may be at the facility and/or generator level. This sometime causes differences in the underlying definition of the data making reconciliation of the information in the datasets within forms, and across the different forms sometimes difficult. To supplement missing data we used the database for the annual Power Cost Equalization Reports by the Alaska Energy Authority (AEA). Also, as needed, the Alaska Energy Authority and ISER supplemented these data sources by contacting utilities directly. These data sources allowed us to collect information for almost all the utilities in the state without incurring the considerable cost of conducting a complete census of all producers. A few of the smallest utilities that were not either in the EIA database or the Power Cost Equalization database did not provide information for this report.
The 2010 Power Cost Equalization data provided data on the generation and sales (residential and commercial) of all utilities participating in the Power Cost Equalization program, including a breakdown by community for those utilities that operate in multiple communities, such as
Fay, Ginny, Alejandra Villalobos Meléndez and Amber Converse, 2011, Alaska Energy Statistics, 1960‐2010, Preliminary Data, prepared for Alaska Energy Authority, September 2011
29
Alaska Village Electric Cooperative (AVEC) and Alaska Power and Telephone (AP&T). The EIA data for these utilities was in some cases reported only as a total across all communities, and we used this as control totals. AEA, AVEC, AP&T and NSPL provided helpful assistance in supplying installed capacity information for each plant not originally included in the PCE database. In this case we were able to publish information taken directly from the utility reflecting statistics from each of its serviced communities. The PCE database contains information collected through AEA’s PCE Utility Monthly Report which PCE participants must file. Utilities also report to the RCA annually for fuel cost adjustments. Reporting to both entities should be consistent, however discrepancies are not unusual. These discrepancies may be due to high turnover in small utilities, poor reporting and limited staff to verify the utilities’ self reported data.
In addition, there are data (energy loss, use by facility and energy provided without charges) that is not included in the PCE report. Because of this, the values found in table 2.2a may not reflect a summation of all AP&T communities as reported in the PCE report. Rather they reflect what was reported to the EIA directly as prepared by the utility itself. This same methodology was implemented in the sales and revenues tables (2.4a) when deemed appropriate. The intent is to create as comprehensive of a table as possible. The summary information in the historical tables was calculated from the same sources mentioned above. Data from these sources was calculated and re‐formatted where appropriate and consolidated into master data files from which all the tables in this report where built. Inevitably the use of multiple data sources introduces some inconsistencies in reporting. Notwithstanding, we believe that the Alaska Electric Power Statistics 2010 update report provides useful information on the state of electric power generation in Alaska.
Fay, Ginny, Alejandra Villalobos Meléndez and Amber Converse, 2011, Alaska Energy Statistics, 1960‐2010, Preliminary Data, prepared for Alaska Energy Authority, September 2011
30
Appendix D. Reporting Requirements
Energy Information Administration Every utility facility with a capacity greater than one megawatt (MW) is required to report their operating characteristics to the US Department of Energy (DOE), Energy Information Administration (EIA) annually, and in some instances, monthly. This information is compiled by the EIA and is available for every generating facility on their website (http://www.eia.doe.gov/). Specific reporting requirements are determined by the Department of Energy but collected, assembled, and evaluated by the EIA according to the Federal Energy Administration Act of 1974. We obtained data for year 2010. Three EIA forms were used in this report:
• EIA‐860 Annual Electric Generator Report. This report contains information on capacity and types of fuel used. It is completed by all existing plants and proposed (5‐year plans) plants that: 1) have a total generator nameplate capacity (sum for all generators at a single site) of one MW or greater; and 2) where the plant is connected to the local or regional electric power grid and has the ability to draw power from the grid or deliver power to the grid.
• EIA ‐860M Monthly Update to the Annual Electric Generator Report. This report
contains monthly updates to the EIA‐860. It is completed by those who also completed EIA‐860 and additionally indicated a proposed change in generator production within one month of the report period. The proposed change may be due to: 1) a new generator scheduled to start commercial operation; 2) an existing generator scheduled to retire from service; or 3) an existing generator with a proposed modification scheduled.
• EIA‐861 Annual Electric Power Industry Report. This report contains information on
peak production, net generation, sales, and revenues. It is completed by electric industry distributors including: electric utilities, wholesale power marketers (registered with the Federal Energy Regulatory Commission), energy service providers (registered with the Regulatory Commission of Alaska), and electric power producers.
• EIA‐923 Power Plant Operations Report. This report contains information on electric
power generation, fuel consumption, fossil fuel stocks, and fossil fuel cost and quality. It is completed by all electric power plants that: 1) have a total generator nameplate capacity (sum for generators at a single site) of one MW or greater; and 2) where the plant is connected to the local or regional electric power grid and has the ability to draw power from the grid or deliver power to the grid.

Fay, Ginny, Alejandra Villalobos Meléndez and Amber Converse, 2011, Alaska Energy Statistics, 1960‐2010, Preliminary Data, prepared for Alaska Energy Authority, September 2011
31
Power Cost Equalization Program and Regulatory Commission of Alaska Participants of the Power Cost Equalization (PCE) program report to the Regulatory Commission of Alaska (RCA) for fuel cost adjustments to their rates. The RCA has authority to maintain accounts and records of public utilities that fall under its jurisdiction, under Alaska Statute 42.05.451. This responsibility allows the Regulatory Commission of Alaska to obtain information from regulated utilities. Additionally, all utilities that serve ten or more customers must obtain an operating certificate, which describes the authorized service area and scope of operations of the utility. The RCA will issue a certificate when it finds the utility to be fit, willing, and able to provide the service. The RCA maintains a list of both regulated and unregulated certified utilities. Utilities report annually to the RCA, but file a PCE Utility Monthly Report with AEA.


![e-Learning Report › ak › alaska › Board.nsf › files › A4ZNMM609E9…Awards Earned from Distance and Hybrid Programs UAA UAF UAS 5 Out-of-state 11% [CATEGOR Y NAME] 2% Alaska](https://img.pdfslide.us/doc/110x75/5f1bc7ed54212b313e140362/e-learning-a-ak-a-alaska-a-boardnsf-a-files-a-a4znmm609e9-awards-earned.jpg)