Embed Size (px)
Citation preview

Alabama Historic Rehabilitation Tax Credit Program Comprehensive Economic Impact Study
Prepared For
Alabama Historical Commission ATTN: Lisa Jones
468 South Perry Street Montgomery, AL 36104
January 26, 2016
Prepared By
Novogradac & Company LLP
4520 East West Highway, Suite 615 Bethesda, MD 20814
240.235.1701 (Phone) 240.235.1702 (Fax)

4520 EAST-WEST HIGHWAY, SUITE 615, BETHESDA, MD 20814 T: (240)235-1701 F: (240)235-1702 www.novoco.com
January 26, 2016 Lisa Jones Alabama Historical Commission 468 South Perry Street Montgomery, AL 36104 Subject: Alabama Historic Rehabilitation Tax Credit Program Comprehensive Economic Impact Study Dear Ms. Jones: At your request, Novogradac & Company LLP has performed an Economic Impact Analysis of the above referenced project. The analysis examined the Alabama Historic Rehabilitation Tax Credit Program and modeled the past and future impacts of program. The data source, provided by Alabama Historical Commission (AHC), has been analyzed by Novogradac & Company LLP and developed into reasonable inputs for the IMPLAN software. The IMPLAN software, developed by MIG Inc., is an industry standard economic impact tool utilized in this analysis. We have not examined the data provided by AHC in accordance with the standards prescribed by the American Institute of Certified Public Accountants (AICPA) and, accordingly, do not express an opinion or any other form of assurance on the data estimates obtained for use in our economic impact analysis. Further, this analysis is subject to the Assumptions and Limiting Conditions found in Addendum B of this report. Please do not hesitate to contact us if there are any questions regarding the report or if Novogradac & Company LLP can be of further assistance. It has been our pleasure to assist you with this project. If you have any questions, please do not hesitate to contact Brad Weinberg, the principal in charge, at 240.235.1701. Respectfully submitted, Brad Weinberg, MAI, CVA, CCIM Partner

IMPLAN Economic Impact Analysis – Alabama Historic Rehabilitation Tax Credit Program
Novogradac & Company LLP 3
EXECUTIVE SUMMARY The Alabama Historic Rehabilitation Tax Credit is responsible for 2,133 direct
construction jobs and 1,373 operational-phase jobs. The operation jobs are expected to grow over time.
Projects utilizing the Alabama HRTC can be considered anchor tenants for several development districts, and provide significant “halo effects” in downtown areas.
A model of the program’s tax impact demonstrates that for every one dollar of tax credit allocation the state invests in the program, $3.90 is returned to state/local tax collections over a 20-year period.
The modeled tax impacts demonstrate that by 2019, the State of Alabama will break even on its current investment of $60 million in tax credit allocation.
According to the Alabama Department of Revenue, $630,281 of tax credits were claimed in the 2014 tax year out of the $2,249,101 of tax credits authorized through tax credit certificates issued by the Alabama Historical Commission for projects completed in the 2014 tax year.
The program demonstrates the ability to leverage large amounts of private investment. The program is responsible for over $384 million in investment in the state. Upon interview with several developers, each expressed that the rehabilitation would not have been possible but for the credit.
The types of projects utilizing the Alabama HRTC have a significant effect on the tax outcome of the model. Alabama’s investment pipeline includes a large percentage of Mixed-Use development, which generate significant tax impacts.
It is our opinion that the Historic Rehabilitation Tax Credit is beneficial to the State of Alabama and should be extended. The tax return on the state exceeds the cost over a 20-year period at the state/local level. The model also demonstrates significant job impacts, during both the construction phase and operation phase. An extension of the program would continue to provide strong tax revenue to the state, as well as provide strong anchor development for projects in need. Anecdotally, it is evident that many completed projects have provided for a strong “halo” effect and have spurred nearby development. Several projects have become strong “anchor” tenants for downtown development.
IMPLAN Economic Impact Analysis – Alabama Historic Rehabilitation Tax Credit Program
Novogradac & Company LLP 4
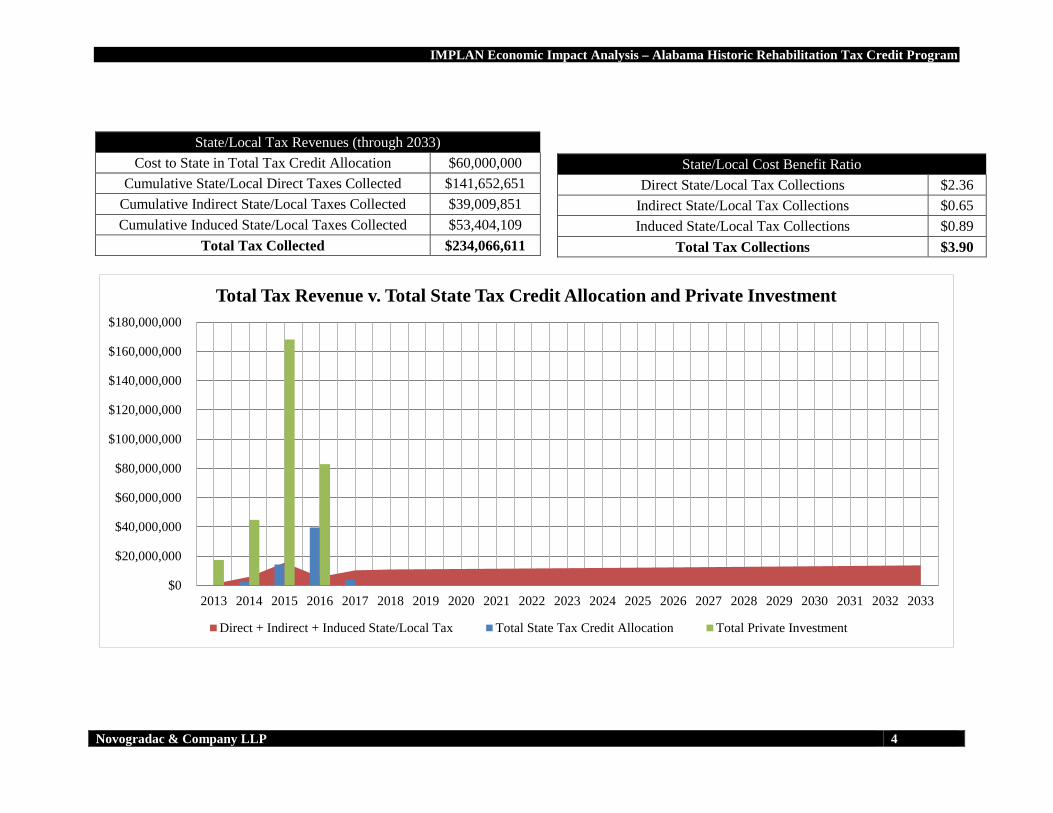
State/Local Tax Revenues (through 2033) Cost to State in Total Tax Credit Allocation $60,000,000
Cumulative State/Local Direct Taxes Collected $141,652,651 Cumulative Indirect State/Local Taxes Collected $39,009,851 Cumulative Induced State/Local Taxes Collected $53,404,109
Total Tax Collected $234,066,611
$0
$20,000,000
$40,000,000
$60,000,000
$80,000,000
$100,000,000
$120,000,000
$140,000,000
$160,000,000
$180,000,000
2013 2014 2015 2016 2017 2018 2019 2020 2021 2022 2023 2024 2025 2026 2027 2028 2029 2030 2031 2032 2033
Total Tax Revenue v. Total State Tax Credit Allocation and Private Investment
Direct + Indirect + Induced State/Local Tax Total State Tax Credit Allocation Total Private Investment
State/Local Cost Benefit Ratio Direct State/Local Tax Collections $2.36
Indirect State/Local Tax Collections $0.65 Induced State/Local Tax Collections $0.89
Total Tax Collections $3.90

IMPLAN Economic Impact Analysis – Alabama Historic Rehabilitation Tax Credit Program
Novogradac & Company LLP 5
Contents Executive Summary .................................................................................................................... 3
Background ................................................................................................................................. 6
Definitions................................................................................................................................... 8
Project Workflow ........................................................................................................................ 9
Data collection ........................................................................................................................ 9
Model Construction and Data Runs ...................................................................................... 10
Data Results .......................................................................................................................... 10
Interviews and Case Studies ................................................................................................. 11
Project Assumptions ................................................................................................................. 12
Construction-phase Assumptions.......................................................................................... 12
Operating-phase assumptions ............................................................................................... 12
Summary of Results .................................................................................................................. 14
Construction Phase................................................................................................................ 14
Operation Phase .................................................................................................................... 14
State/Local Tax Revenue vs. State Tax Expenditures .......................................................... 17
Waiting List Projects – Potential Impact .................................................................................. 19
Program Halo Effect ................................................................................................................. 20
Conclusion ................................................................................................................................ 20
Bibliography ............................................................................................................................. 22
Case Studies .................................................................................................................................. 23
Addendum A ................................................................................................................................. 39
List of Projects ...................................................................................................................... 39
Projects receiving reservation ............................................................................................... 40
Projects on the Waiting List .................................................................................................. 41
Addendum B ................................................................................................................................. 43
Detailed Annual Results ....................................................................................................... 43
Addendum C ................................................................................................................................. 45
Net Present Value Calculations ............................................................................................ 45
Addendum D ................................................................................................................................. 47
Background ............................................................................................................................... 48
Technical Information ............................................................................................................... 49

IMPLAN Economic Impact Analysis – Alabama Historic Rehabilitation Tax Credit Program
Novogradac & Company LLP 6
BACKGROUND The Alabama Historical Commission (the “Sponsor”) has engaged Novogradac & Company LLP to analyze the impacts of the Alabama Historic Rehabilitation Tax Credit Program. The Sponsor has engaged us to estimate these impacts, which include short term and long term direct, indirect and induced employment, as well as additional tax revenues to the state and federal governments. The impacts are the result of modeling each individual Alabama Historic Rehabilitation Tax Credit Program project to produce estimated revenues and employment. The estimates were totaled by year to help understand the program’s impact on the state. The Alabama Historic Rehabilitation Tax Credit (AL HRTC) Program provides a tax credit to owners and long-term lessees of historic buildings to complete rehabilitation projects. The Alabama State Legislature enacted the program on May 15, 2013, in House Bill 140 and amended it in the 2014 Legislative Session in House Bill 509. After composing and approving an administrative code for the program, the Alabama Historical Commission (AHC) began accepting applications on October 1, 2013. Alabama is one of thirty-four (34) states nationwide offering a historic rehabilitation tax credit program. The AL HRTC program provides a tax credit of up to 25% of Qualified Rehabilitation Expenditures incurred as part of the certified rehabilitation of an historic property eligible for listing in the National Register of Historic Places. The program is available to owners of both commercial/income producing properties and to owner-occupied residential properties. Qualified Rehabilitation Expenditures include both hard and soft costs, generally consisting of improvements made to the building structure, interior and systems, as well as design and engineering services. Oftentimes projects are able to leverage the Federal Historic Preservation Tax Credit, which provides a federal tax credit up to 20% of Qualified Rehabilitation Expenditures, and can be combined with other tax credit programs, such as New Markets Tax Credits (NMTC) and Low Income Housing Tax Credits (LIHTC). In the current legislation, the state has set aside $20 million annual in tax credit reservations per calendar year for three years, not to exceed $60 million. The program also caps credits available to commercial projects at $5 million and credits available to owner-occupied projects at $50,000. The current AL HRTC Program expires in May 2016.
Interested property owners must apply through the Alabama Historical Commission to receive a tax credit reservation. The AHC reviews projects in the order they are received and no preference is given to any particular project type or location. If more than one application is received on the same day, the AHC holds a lottery to determine the review order of the applications. The AHC only reserves a tax credit allocation if an application is complete and approved. The first round of credit reservations was made on December 6, 2013. The AHC collects a review fee for each project that is equal to 1% of the qualified rehabilitation expenditures, not to exceed $10,000. As of January 20, 2016, the Commission has collected $281,317 in review fees.
The taxpayer may claim the credit in the tax year the property is placed into service. If the tax credit exceeds the amount of taxes owed, the taxpayer will not receive a refund, but can claim any portion of the unused credit for up to ten tax years. If requested by the taxpayer, the Alabama Department of Revenue can allow for a one-time transfer of tax credits.
IMPLAN Economic Impact Analysis – Alabama Historic Rehabilitation Tax Credit Program
Novogradac & Company LLP 7
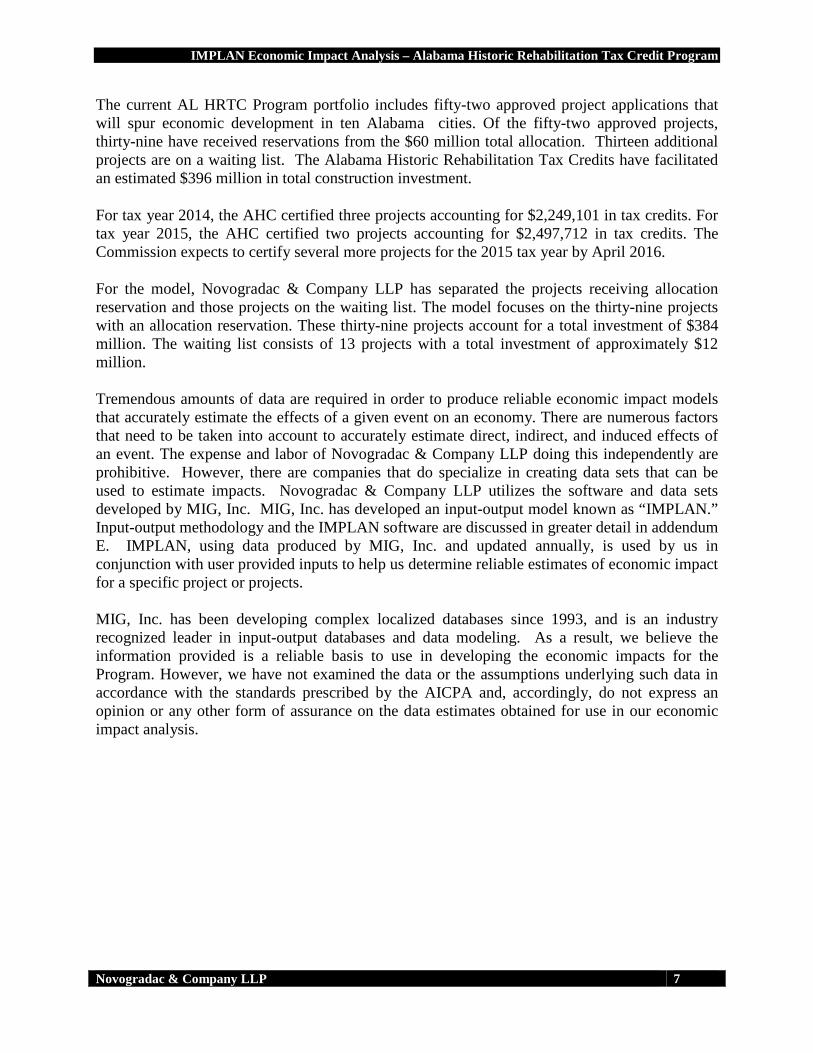
The current AL HRTC Program portfolio includes fifty-two approved project applications that will spur economic development in ten Alabama cities. Of the fifty-two approved projects, thirty-nine have received reservations from the $60 million total allocation. Thirteen additional projects are on a waiting list. The Alabama Historic Rehabilitation Tax Credits have facilitated an estimated $396 million in total construction investment.
For tax year 2014, the AHC certified three projects accounting for $2,249,101 in tax credits. For tax year 2015, the AHC certified two projects accounting for $2,497,712 in tax credits. The Commission expects to certify several more projects for the 2015 tax year by April 2016.
For the model, Novogradac & Company LLP has separated the projects receiving allocation reservation and those projects on the waiting list. The model focuses on the thirty-nine projects with an allocation reservation. These thirty-nine projects account for a total investment of $384 million. The waiting list consists of 13 projects with a total investment of approximately $12 million. Tremendous amounts of data are required in order to produce reliable economic impact models that accurately estimate the effects of a given event on an economy. There are numerous factors that need to be taken into account to accurately estimate direct, indirect, and induced effects of an event. The expense and labor of Novogradac & Company LLP doing this independently are prohibitive. However, there are companies that do specialize in creating data sets that can be used to estimate impacts. Novogradac & Company LLP utilizes the software and data sets developed by MIG, Inc. MIG, Inc. has developed an input-output model known as “IMPLAN.” Input-output methodology and the IMPLAN software are discussed in greater detail in addendum E. IMPLAN, using data produced by MIG, Inc. and updated annually, is used by us in conjunction with user provided inputs to help us determine reliable estimates of economic impact for a specific project or projects. MIG, Inc. has been developing complex localized databases since 1993, and is an industry recognized leader in input-output databases and data modeling. As a result, we believe the information provided is a reliable basis to use in developing the economic impacts for the Program. However, we have not examined the data or the assumptions underlying such data in accordance with the standards prescribed by the AICPA and, accordingly, do not express an opinion or any other form of assurance on the data estimates obtained for use in our economic impact analysis.
IMPLAN Economic Impact Analysis – Alabama Historic Rehabilitation Tax Credit Program
Novogradac & Company LLP 8
DEFINITIONS The following provides summarized definitions for IMPLAN concepts used throughout the report1. Construction Phase Impacts Construction phase impacts refer to the impacts of the rehabilitation activity. These impacts do not repeat—they are measured only during the life of the construction period. Operational Phase Impacts Operational phase impacts represent the on-going operation of the business or building. For instance, upon the completion of a project, the real estate will house an operating business which will have continued impact on the study areas as long as the business remains open. Direct Impacts IMPLAN defines direct impacts as “The set of expenditures applied to the predictive model (i.e., Input/Output multipliers) for impact analysis. It is a series (or single) of production changes or expenditures made by producers/consumers as a result of an activity or policy. These initial changes are determined by an analyst to be a result of this activity or policy. Applying these initial changes to the multipliers in an IMPLAN model will then display how the region will respond, economically to these initial changes.” In short, direct impacts represent on-site activity. Indirect Impacts IMPLAN defines indirect impacts as “The impact of local industries buying goods and services from other local industries. The cycle of spending works its way backward through the supply chain until all money leaks from the local economy, either through imports or by payments to value added. The impacts are calculated by applying Direct Impacts to the Type I Multipliers.” In short, indirect impacts are business-to-business impacts. Induced Impacts IMPLAN defines induced impacts as “the response by an economy to an initial change (direct effect) that occurs through re-spending of income received by a component of value added. IMPLAN's default multiplier recognizes that labor income (employee compensation and proprietor income components of value added) is not a leakage to the regional economy. This money is recirculated through the household spending patterns causing further local economic activity.” In short, induced impacts are spending a result of new household income. Output Output refers to the total economic value of the project in the local economy.
1 Further definitions are in Addendum E.

IMPLAN Economic Impact Analysis – Alabama Historic Rehabilitation Tax Credit Program
Novogradac & Company LLP 9
PROJECT WORKFLOW Data collection To begin this project, the Alabama Historical Commission contracted with Novogradac & Company, LLP. At this time, a list of projects was sent to Novogradac & Company. The list included the following detail, as provided by AHC and was completed to the best of their ability.2
• Project Description • Project City, State, ZIP • Project Categorization/NAICS code • Total Investment • Total Qualified Investment • Year Completed • Investor/Business Entity • Transaction Notes • Year operations begin • Anticipated revenue at site • Anticipated Full Time Employees at site • Any additional notes or details
Figure 1 – Locations of all 52 projects
2 See Addenda A for a list of projects and a brief project description, as provided by AHC.

IMPLAN Economic Impact Analysis – Alabama Historic Rehabilitation Tax Credit Program
Novogradac & Company LLP 10
Model Construction and Data Runs In order to understand the multiplier effects of the Alabama HRTC, each of the thirty nine projects with tax credit allocation reservations was run through the IMPLAN model. Each project was divided between a “construction phase” and an “operation phase.” The construction phase represents impacts that occur over the life of the construction. One job in the construction phase represents one job that occurs strictly over the time-frame of construction. Construction impacts were based on Qualified and Non-Qualified spending by year. These year-by-year impacts were imported individually for each project into the IMPLAN multiplier system. The NAICS code used was an IMPLAN-adjusted NAICS 23: Maintenance and Repair Construction code. Operation phase jobs and impacts are intended to demonstrate sustained impact. The model assumes that the business will remain open over the 20-year period. The 20-year impact model takes into account growth rates and inflation rates over that period. Each individual project was modeled based on square footage and an expected tenant. For instance, a renovated retail space will be modeled using an assumed employee per square foot in the retail sector. These assumptions are described later in the document. To model the increase in value associated with a renovation for owner-occupied residential housing, Novogradac & Company LLP compared pre and post-renovated assessment values3. The growth in tax revenue was included as new revenue to the State. Data Results Each individual project data was exported via the IMPLAN system. Each model run includes results at the Direct, Indirect and Induced level. See Addendum D Technical Information for further detail. Direct Impacts refer to the dollar value of economic activity available to circulate through the economy. In the case of new residential development, the direct impacts are equal to the new households’ discretionary spending. Indirect Impacts refer to the inter-industry impacts of the input-output analysis. Induced Impacts refer to the impacts of household spending by the employees generated by the direct and indirect impacts. In other words, induced impacts result from the household spending of employees of business establishments that the new households patronize (direct) and their suppliers (indirect). The data points from IMPLAN, on a per project basis include:
• Job Impacts • Total Economic Output • Total Labor Income
3 AHC requires a post-renovated appraisal to be completed.

IMPLAN Economic Impact Analysis – Alabama Historic Rehabilitation Tax Credit Program
Novogradac & Company LLP 11
• Total Tax Impacts o State/Local
Employee Compensation Proprietor Income Taxes on Production and Imports Household Tax Corporate Tax
o Federal Employee Compensation Proprietor Income Taxes on Production and Imports Household Tax Corporate Tax
Interviews and Case Studies To better understand the program, we examined several historic tax credit projects throughout the state of Alabama. Fieldwork was conducted for several projects, as well as interviews with developers and local stakeholders. Each case study demonstrates the use of the Historic Rehabilitation Tax Credit and how each nearby areas has improved. These final case studies can be seen in the Case Study section of the report. For the final report, we included four case studies.

IMPLAN Economic Impact Analysis – Alabama Historic Rehabilitation Tax Credit Program
Novogradac & Company LLP 12
PROJECT ASSUMPTIONS Construction-phase Assumptions Construction phase impacts were realized in the final year of construction. The QRE and Non-QRE expenditures by year are provided by each project’s developer. These results are current as of December 2015. Many of the construction budgets fees have not been finalized, especially those where construction has not yet begun. These figures were reported specifically for this study.
Spending Type 2013 2014 2015 2016 2017
Qualified Construction $6,572,663 $32,725,944 $123,871,509 $101,434,134 $0
Non-Qualified Construction $10,757,574 $14,315,190 $58,686,182 $21,096,585 $15,268,000
Total $17,330,237 $47,041,134 $182,557,691 $122,530,719 $15,268,000
Table 1 - Construction Spending by Year
The model imports 100% of the Qualified Expenditures into the IMPLAN system. Qualified Expenditures include architectural fees, materials, and labor. Non-QRE spending is not all hard construction dollars. For the purpose of the model, it is assumed that 33% of Non-QRE spending will be attributed to soft costs that do not circulate impact. This ratio was derived by examining Historic Tax Credit transactions in the Southeast region, over the last 5 years. The remaining 66% was added to the Qualified Expenditures when modeling the construction-phase impact. Operating-phase assumptions To complete operational-phase impacts Novogradac & Company LLP developed several square footage assumptions for operating revenue and employment based on square footage and project type. These assumptions are based on several sources of data, as well as Novogradac-benchmarked industry data.4
Business Type Assumption IMPLAN Code
Restaurant 450 sq. ft./employee 413: Food services and drinking places
Office 650 sq. ft./employee
380: All miscellaneous professional, scientific, and technical services
Retail 350 sq. ft./employee 330: Retail Stores - Miscellaneous
Bank 600 sq. ft./employee 354: Monetary Services
Alabama, Median HH Income $43,253 ACS 2014 Data Hotel 0.5 employees/room 411: Hotels
4 Source: South Florida Regional Planning Council, 2006, US Green Building Council, 2008

IMPLAN Economic Impact Analysis – Alabama Historic Rehabilitation Tax Credit Program
Novogradac & Company LLP 13
Nursing Home/Elderly Care 0.5 employees/room 398: Nursing and residential care facilities
Table 2 - Employees per Sq./Ft.
It is also assumed that new households will have a direct operating impact on the state. The household impacts are measured by IMPLAN’s household spending patterns. It is assumed one household will occupy one apartment or house. Operating impacts are realized one year after construction is complete. This is meant to estimate a reasonable buffer period for projects to begin their hiring and stabilize revenues after construction. Growth Rates and Inflation To create a more accurate model both a growth rate and inflation rate were applied to the operational-phase impacts over time. These help temper the forecast for tax impacts over a 20-year period.
Annual Growth Rate5 3.91% Inflation Rate6 2.36% Table 3 - Growth and Inflation Rates
State and Local Taxes The IMPLAN model does not allow for distinction between State and Local (municipality or county) taxes. For this model, we maintained the results per the IMPLAN model, and combined the effects of state and local taxes. The model will, therefore, combined state and local taxes.
5 Source Federal Reserve Bank of St. Louis 6 Source: CoinNews

IMPLAN Economic Impact Analysis – Alabama Historic Rehabilitation Tax Credit Program
Novogradac & Company LLP 14
SUMMARY OF RESULTS Construction Phase The following table demonstrates the model’s predicted employment and tax revenue at the direct, indirect, and induced levels. This represents the model for both completed and in-progress projects from 2014-2017 for projects receiving tax credit allocation reservation. These impacts do not compound on each other. It is assumed that a construction period is one year.
CONSTRUCTION PHASE Completed Projects In-Progress Projects Sum 2014 2015 2016 2017 - Direct Jobs 90 531 1,356 156 2,133 Direct Output $14,487,512 $86,264,168 $222,350,081 $25,743,086 $348,844,847 Direct State/Local Tax $206,307 $1,229,173 $3,163,319 $365,581 $4,964,380 Direct Federal Tax $779,590 $4,870,819 $11,953,548 $1,381,460 $18,985,417
Indirect Jobs 49 288 736 85 1,158 Indirect Output $6,329,297 $37,556,227 $96,469,543 $11,136,297 $151,491,364 Indirect State/Local Tax $483,519 $2,872,889 $7,389,396 $853,986 $11,599,790 Indirect Federal Tax $462,677 $2,885,972 $7,070,861 $817,173 $11,236,684
Induced Jobs 36 215 548 63 862 Induced Output $4,709,878 $27,999,364 $72,054,687 $8,331,033 $113,094,962 Induced State/Local Tax $294,553 $1,750,119 $4,501,504 $520,236 $7,066,412 Induced Federal Tax $351,951 $2,195,322 $5,378,701 $621,611 $8,547,585
Table 4 - Construction Phase Impacts
Operation Phase Nominal Figures As described in the Project Workflow section, the following represents annual impact of the operational phase. This is a nominal figure, meaning it is not making growth adjustments to account for continuing operations of the businesses and households. The growth scenario presents the job and tax impacts over time, with growth and inflation applied (see next section) The model assumes that the operational employment will begin one year after construction has begun. Therefore, there is no operational-phase impact in the years 2013 and 2014.
Operation Employment (Nominal)
2013 2014 2015 2016 2017 2018 Sum Direct Job - - 80 433 781 79 1,373
Indirect Jobs - - 10 133 133 11 287 Induced Jobs - - 15 128 171 21 335
TOTAL - - 105 694 1,085 111 1,995 Table 5 - Operational Employment

IMPLAN Economic Impact Analysis – Alabama Historic Rehabilitation Tax Credit Program
Novogradac & Company LLP 15
Federal Tax (Nominal)
2013 2014 2015 2016 2017 2018 Sum Direct Federal Tax $0 $0 $368,355 $3,573,376 $4,366,273 $684,514 $8,992,518
Indirect Federal Tax $0 $0 $91,327 $1,130,985 $1,208,187 $88,888 $2,519,387 Induced Federal Tax $0 $0 $134,347 $1,120,898 $1,495,950 $186,674 $2,937,869
TOTAL $0 $0 $594,029 $5,825,259 $7,070,410 $960,076 $14,449,774 Table 6 - Operational Federal Tax
State/Local Tax (Nominal)
2013 2014 2015 2016 2017 2018 Sum Direct State/Local Tax $0 $0 $279,386 $2,084,385 $4,327,913 $235,701 $6,927,385
Indirect State/Local Tax $0 $0 $61,750 $570,769 $695,646 $50,102 $1,378,267 Induced State/Local Tax $0 $0 $106,864 $892,364 $1,190,933 $148,638 $2,338,799
TOTAL $0 $0 $448,000 $3,547,518 $6,214,492 $434,441 $10,644,451 Table 7 - State/Local Tax
Growth Scenario To produce a 20-year scenario on both existing and in-progress historic development, a growth scenario was constructed. A 20-year period is approximately half the length of the 39.5 years in the depreciation schedule for commercial property. A 20-year period is also consistent with comparable impact studies for Historic Tax Credits. The growth scenario builds upon the nominal figures derived from the IMPLAN model. This model accounts for an assumed growth rate and an inflation over time. The impacts for such a scenario represent a compounding return on investment. The model was grown by an average growth rate and tempered by a deflation rate.7 Growth scenario complete results can be seen in Addendum B. These are summarized by Year and include job and tax output. Growth scenario results are used to model net present value and total tax collections. The following chart shows projects 20 years after the program begins in a growth scenario. The Tax impacts shows are cumulative and include both operational-phase tax impacts and construction-phase tax impacts.
7 See discussion of growth and inflation rates presented in the Assumption section.

IMPLAN Economic Impact Analysis – Alabama Historic Rehabilitation Tax Credit Program
Novogradac & Company LLP 16
Summary of Impacts at 2033
Growth Rate Scenario Direct Jobs in 2033 1,767
Indirect Jobs in 2033 370 Induced Jobs in 2033 432
Direct Output $153,742,733 Indirect Output $44,837,890
Induced Output $48,680,719 Cumulative State/Local Tax Impact through 2033 $234,066,611 Cumulative Federal Tax Impact through 2033 $325,235,721
0200400600800
1,0001,2001,4001,6001,8002,000
Total Jobs Construction and Operating Phases
Direct Jobs Indirect Jobs Induced Jobs
$0
$2,000,000
$4,000,000
$6,000,000
$8,000,000
$10,000,000
$12,000,000
$14,000,000
Total Tax Impact
Direct State/Local Tax Direct Federal Tax

IMPLAN Economic Impact Analysis – Alabama Historic Rehabilitation Tax Credit Program
Novogradac & Company LLP 17
State/Local Tax Revenue vs. State Tax Expenditures The following chart demonstrates the cost to the state of Alabama against revenues modeled by the HRTC development. The cost to the state is up to 25% of Qualified Expenditures, not to exceed $60 million in total aggregate tax credit allocation available between 2013 and 2015. According to the model, the total direct tax revenue will exceed the total expenditures by the state by 2033. This includes both construction and operating phases. Based on this model, the cumulative state/local tax collections will exceed the $60 million investment by the state in 2019. The following chart includes total private development costs compared against state tax expenditures and state/local tax revenue.
$0
$20,000,000
$40,000,000
$60,000,000
$80,000,000
$100,000,000
$120,000,000
$140,000,000
$160,000,000
$180,000,000
2013 2014 2015 2016 2017 2018 2019 2020 2021 2022 2023 2024 2025 2026 2027 2028 2029 2030 2031 2032 2033
Total Tax Revenue v. Total State Tax Credit Allocation and Private Investment
Direct + Indirect + Induced State/Local Tax Total State Tax Credit Allocation Total Private Investment

IMPLAN Economic Impact Analysis – Alabama Historic Rehabilitation Tax Credit Program
Novogradac & Company LLP 18
The following table demonstrates cumulative tax impact. The tax benefit ratio is calculated based on total tax collections over the 20-year period (through 2033). The cost to state is $60 million. These credits can be taken between 2014 and 2017. The model results are based off the full project spending, inclusive of total QRE and total non-QRE.
State/Local Tax Revenues (through 2033) Cost to State in Total Tax Credit Allocation $60,000,000
Cumulative State/Local Direct Taxes Collected $141,652,651 Cumulative Indirect State/Local Taxes Collected $39,009,851 Cumulative Induced State/Local Taxes Collected $53,404,109
Total Tax Collected $234,066,611 Table 8 - Total Tax Collections
State/Local Cost Benefit Ratio Direct State/Local Tax Collections $2.36
Indirect State/Local Tax Collections $0.65 Induced State/Local Tax Collections $0.89
Total Tax Collections $3.90 Table 9 - Statewide Cost/Benefit Ratio
When solely comparing total tax collections at the direct level, the model demonstrates the program will pay for itself over a 20-year period. When combining all levels of impact—direct, indirect, and induced—for every dollar the state spends, it will return $3.90. This figure is the cumulative tax impact over the 20-year period, compared against the total cost of the state. This result is similar to other historic tax credit studies. For instance, a similar model completed by Novogradac & Company LLP applied to the Louisiana Historic Tax Credit yielded a result of $2.77 per dollar of spending. In Tennessee, a similar study on a projected historic tax credit program yielded a statewide result of $3.86 per dollar spent.8 A Georgia study yielded $3.49 benefit per dollar spent.9
Summary of Historic Tax Credit Studies’ Return Ratio State Author Dollar for Dollar Impact Alabama Novogradac & Company LLP (2016) $3.90 Georgia (extension) Georgia Tech Research Institute (2015) $3.49 Louisiana Novogradac & Company LLP (2014) $2.77 Louisiana Tim Ryan (2011) $3.22 Tennessee (proposed program) Economic Impact Group, LLC (2014) $3.86 Wisconsin Baker Tilly Virchow Krause, LLP (2015) 133% return after 10 years
Table 10 - Comparable Cost Benefit Ratio
It is important to note that a significant driver of a project’s impact is the project type. The following chart compares Alabama and Louisiana’s project types by total project cost. Mixed-
8 Source: Economic Impact Group, LLC, 2014 9 Source: Georgia Tech Research Institute, 2013

IMPLAN Economic Impact Analysis – Alabama Historic Rehabilitation Tax Credit Program
Novogradac & Company LLP 19
use developments tend to have very strong job and tax impacts. Alabama’s HRTC program has several large investments in these types of deals, yielding strong tax revenue. The Louisiana data is from the 2014 report. Alabama also has several large hotels, which have significant job and tax impacts.
Louisiana Alabama Total Project Cost Total Project Cost
Arts 3% 3% Community Services 1% 0%
Educational 5% 0% Health 4% 0% Hotel 17% 17%
Housing 30% 21% Manufacturing 0% 0%
Mixed Use Developments 18% 54% Office 3% 3%
Personal Services 0% 0% Restaurant 14% 2%
Retail 4% 0% Transportation/Warehousing 1% 0%
Total 100% 100% Table 11 - Total Project Cost by State
WAITING LIST PROJECTS – POTENTIAL IMPACT Currently, there are 13 projects on the waiting list. Should the program be extended, these projects would be immediately funded and impacts would begin upon construction. The model includes a result at 2033, to demonstrate on-going operations.
Summary of Impacts - Construction Phase Total Direct Jobs 76
Total Indirect Jobs 41 Total Induced Jobs 31
Total State/Local Tax $588,649 Total Federal Tax $1,592,071
Table 12 - Construction Phase Impacts of Waiting List projects
Summary of Impacts - Operation Phase (in 2033) Total Direct Jobs 175
Total Indirect Jobs 102 Total Induced Jobs 74
Total State/Local Tax $1,670,585 Total Federal Tax $3,405,545
Table 13 - Nominal Operation Phase Impacts for Waiting List projects

IMPLAN Economic Impact Analysis – Alabama Historic Rehabilitation Tax Credit Program
Novogradac & Company LLP 20
PROGRAM HALO EFFECT To assess the “Halo” effect of the 39 projects in the program, we utilized an objective approach that models business spending patterns, as well as household spending impacts as a result of new revenue. IMPLAN spending matrices model the indirect and induced output from a given industry activity. For instance, construction spending will yield purchases in relevant industries, such as fuel, hard construction materials, warehousing and storage, etc. These impacts are considered “indirect,” and are focused on business-to-business purchases. Induced impacts model the increase in household spending as a result of a given activity. The same $1MM in construction spending will yield a number of jobs over the construction period. These workers will have personal spending patterns in establishments like restaurants, bars, grocery stores, and health care facilities. When combined, these impacts are an objective proxy to the program’s “Halo effect.” The following table shows the total operation-phase indirect and induced impacts, which is modeled off the growth scenario.
Operation Phase (2033) Indirect Jobs 370 Indirect State/Local Tax $1,775,314 Indirect Federal Tax $3,246,096
Induced Jobs 432 Induced State/Local Tax $3,009,889 Induced Federal Tax $3,780,859
Table 14 - Indirect and Induced Impacts
The case studies later in the report provide anecdotal information demonstrating the “halo effect” of the program. As an example, the Lyric Theater in Birmingham is currently spurring the development of several businesses in downtown Birmingham. These include a restaurant, coffee shop, and a retail space. The Lyric Theater can be considered an “anchor development” to the area, one that allows other business endeavors to consider location to the area with the idea that the ongoing shows and events at the theater will aid in producing positive outcomes for their businesses.
CONCLUSION It is our opinion that the Historic Rehabilitation Tax Credit is beneficial to the State of Alabama. By comparing the total value of direct taxes, the return to state and local governments exceeds the cost, when modeled over a 20-year period. The model demonstrates a positive impact to the state of Alabama. If indirect and induced are included in the assessment, the dollar for dollar cumulative impact is $3.90. When comparing to analysis of programs in nearby states, the return on investment is very similar. The modeled federal impacts are also significant and demonstrate significant return on tax collections. It is estimated that the state of Alabama will break even on its current $60 million investment in 2019. The impact model demonstrates noteworthy job impacts, during both the construction phase and operation phase. These jobs will generate household spending and generate lasting tax impact, as long as the projects remain active. The program provides rehabbed housing, which is likely to

IMPLAN Economic Impact Analysis – Alabama Historic Rehabilitation Tax Credit Program
Novogradac & Company LLP 21
keep residents within the state of Alabama, and potentially attract new residents into downtown areas. Anecdotally, it is evident that the completed projects have provided for a strong “halo” effect in their surrounding areas. Many of the projects are likely to become anchor tenants to improve downtown business districts. It is also clear, from speaking with developers, that many of these projects received vital “bridge financing,” making the deal unlikely to proceed without the ability to leverage tax credits. Several developers explicitly stated the tax credit provided the project with the financing needed to overcome difficult development costs associated with the certified rehabilitation of historic buildings. An extension of the program would continue to provide tax revenue to the state, as well as provide strong anchor projects for areas in need of development. The extension may consider some updated amendments, in order to maximize potential revenue for the state, such as removing the aggregate cap. There are currently projects on the waiting list, demonstrating a demand for the credit.

IMPLAN Economic Impact Analysis – Alabama Historic Rehabilitation Tax Credit Program
Novogradac & Company LLP 22
BIBLIOGRAPHY CoinNews. (n.d.). Annual Inflation Rates Charts. Retrieved from US Inflation Calculator:
http://www.usinflationcalculator.com/inflation/current-inflation-rates/ Economic Impact Group, LLC. (2014). The Projected Economic and Fiscal Impacts of a
Tennessee Historic Rehabiliations Investment Incentive. Retrieved from http://www.preservationnation.org/take-action/advocacy-center/additional-resources/Tennessee-Historic-Rehabilitation-Investment-Incentive-Economic-and-Fiscal-Impacts-Full-Report.pdf
Federal Reserve Bank of St. Louis. (n.d.). Total Gross Domestic Product for Alabama. Retrieved from FRED Economic Data: https://research.stlouisfed.org/fred2/series/ALNGSP
Georgia Tech Research Institute. (2013). The Projected Economic and Fiscal Impacts of Improvements to Georgia’s Historic Rehabilitation Investment Incentive. Atlanta, GA.
South Florida Regional Planning Council. (2006). Fiscal Impact Analysis Model (FIAM). Hollywood, Florida: South Florida Regional Planning Council. Retrieved from http://www.sfrpc.com/fiam.htm
U.S. Census Bureau. (2013). State and Local Govermnent Finances by Level of Goverment and by State: 2012-13. Retrieved from State & Local Government Finance: http://www.census.gov/govs/local/
US Green Building Council. (2008). Building Area Per Emploee by Business Type. Retrieved from http://usgbc.org/Docs/Archive/General/Docs4111.pdf

CASE STUDIES

IMPLAN Economic Impact Analysis – Alabama Historic Rehabilitation Tax Credit Program
Novogradac & Company LLP 24
Name The Pizitz Building
Address 1821 Second Avenue North, Birmingham
Developer Bayer Properties
Project Category Mixed-Use (Apartments/Retail/Office; 143 apartments; 280,273 total square feet)
Total Project Costs $67,444,285
Total Qualified Investment
$36,205,729
Total Non-Qualified Investment
$31,238,556
Original Year Built 1923

IMPLAN Economic Impact Analysis – Alabama Historic Rehabilitation Tax Credit Program
Novogradac & Company LLP 25
BACKGROUND/PROJECT DESCRIPTION The property is the former flagship department store for Pizitz, which originally was known as the Louis Pizitz Dry Goods Co., and was a major regional department store chain based in Alabama. The building was designed by Harry B. Wheelock and completed in two stages, one in 1923 and one in 1926, while the adjacent parking deck was constructed in 1965. The entire property has been vacant since 1988, when the store closed operations. The Pizitz Department Store Building was listed in the National Register of Historic Places in 1989 as a contributing resource in the Downtown Birmingham Retail and Theatre Historic District. Its defining architectural features include exterior cladding of ivory-colored terra cotta and a double height interior to accommodate the mezzanine. The developer of the project, Bayer Properties, purchased the building in 1999 for future development. Tom Walker, a Development Manager for Bayer Properties who is overseeing the project, indicated a number of development scopes had been considered over the 15 years since Bayer acquired the property but none were able to come to fruition due to cost-feasibility issues that resulted in negative project economics. Construction at the project began in late 2014, with significant work still ongoing, as evidenced by the photos found on the following pages. Upon completion of the substantial rehabilitation to the Pizitz, the project will consist of 143 apartment units as well as 42,661 square feet of commercial space. The property will feature 55 market rate one-bedroom units ranging in size from 732 to 914 square feet, 59 two-bedroom, two-bath units ranging in size from 992 to 1,351 square feet, as well as 29 one-bedroom units restricted to households earning at or below 80 percent of the Area Median Income (AMI), or less. The commercial portion of the property is contained to the first and second floors, with the first floor currently proposed to contain restaurant users, while the second floor mezzanine will feature a co-work space available for daily, weekly, or monthly rental. Standard unit amenities will include 9 foot ceilings, wood floors, granite countertops, upgraded appliances, European cabinetry and full-size washer/dryers. Property amenities will include on-site management and maintenance, a doorman, a swimming pool with hot tub, a fitness center with steam room and sauna, a clubroom, covered dedicated parking, and elevators.
“BUT FOR” ANALYSIS (BENEFIT OF TAX CREDITS) After the inception of the Alabama Historic Rehabilitation Tax Credit program, Mr. Walker reported the tax credit equity raised as a result of the Alabama program were almost exactly equal to the amount of the financial gap in the project development costs, most all of which were related to the significant costs associated with abating environmental hazards at the property, such as asbestos and lead paint.
IMPACTS Due to the relative infancy of the project in terms of where it stands with construction, direct impacts are challenging to gauge. However, we reached Gray Construction to discuss their decision to locate their new headquarters in downtown Birmingham through redevelopment of a vacant building nearby. Daniel Pittman, regional manager of Gray’s Southeast Office, indicated the decision to purchase the former department store building, which is across from the Lyric Theater, another project that utilized the state rehabilitation tax credit and discussed later in the report, was largely a

IMPLAN Economic Impact Analysis – Alabama Historic Rehabilitation Tax Credit Program
Novogradac & Company LLP 26
financial decision. However, Mr. Pittman further added the presence of the various projects ongoing in downtown Birmingham, of which the Pizitz is one, made him more comfortable about investing in downtown Birmingham.

IMPLAN Economic Impact Analysis – Alabama Historic Rehabilitation Tax Credit Program
Novogradac & Company LLP 27
PHOTOS OF THE PIZITZ BUILDING
View of ongoing façade work at Pizitz
View from rooftop looking west, with Thomas
Jefferson in the foreground
View of interior lightwell added to center of structure
by cutting through each floor plate to add required windows to the new residential units
View of unit framing of residential units
View looking north towards downtown
Birmingham from third floor
View of first floor entry & retail area from second floor mezzanine (future co-work space)

IMPLAN Economic Impact Analysis – Alabama Historic Rehabilitation Tax Credit Program
Novogradac & Company LLP 28
Name The Lyric Theater
Address 1800 Third Avenue North, Birmingham
Developer Birmingham Landmarks, Inc.
Project Category Theater (750 seats; 43,000 square feet for entertainment, office, and business and community event space)
Total Project Costs $11,612,000
Total Qualified Investment
$11,156,000
Total Non-Qualified Investment
$456,000
Original Year Built 1913

IMPLAN Economic Impact Analysis – Alabama Historic Rehabilitation Tax Credit Program
Novogradac & Company LLP 29
BACKGROUND/PROJECT DESCRIPTION The Lyric Theater opened as a vaudeville venue in 1914 that saw acts such as Mae West, the Marx Brothers, Roy Rogers, and Gene Autry. The theater was a popular draw for the residents of Birmingham, with Monday night shows routinely sold out and considered the “place to be” in the early part of the century. While events and various shows were conducted at the Lyric from the 1930s through the late-1950s, the property closed in 1958. The office building that immediately adjoins the theater continued to house tenants. Various groups examined the possibility of reopening the theater in the 1980s and 1990s but ultimately the costs associated with restoring the property and abating the hazardous materials in the property proved too large to allow for cost feasible development. The Lyric Theatre and its adjacent office building were listed in the National Register of Historic Places in 1989 as contributing resources in the Downtown Birmingham Retail and Theatre Historic District. One of its significant character defining architectural features is the original entrance beneath massive stone arches on the corner of 3rd Avenue and 18th Street. It is the only extant vaudeville house in the city. Begun in 2014, the project is nearing completion. The main room, known as the Regions Auditorium, will seat approximately 750 patrons. This stage is designed ideally for performing arts such as theater, symphonies, ballet, and opera. A new state-of-the-art rigging system for the stage was installed to allow for a range of shows to have the ability to perform as the theater.
“BUT FOR” ANALYSIS (BENEFIT OF TAX CREDITS) As discussed above, the theater drew interest from a number of groups looking to restore the property to its former condition. However, the condition of the property was such that significant capital raising was required to address the asbestos and lead paint abatement, as well as the necessary experts to restore much of the detailed woodwork and artwork in the property. According to Brant Beene, the director of Birmingham Landmarks, Inc. which owns the property, the combination of the federal and state rehabilitation tax credits made it possible to raise the necessary capital to undertake the project.
IMPACTS • Birmingham Landmarks, Inc. also owns a theater across the street known as the Alabama
Theatre. During a discussion with Mr. Beene about the Lyric project, Mr. Beene indicated that in 2012, the Alabama Theatre was home to four shows. In 2014, the Alabama Theatre had more than 50 shows. According to Mr. Beene, interest in attending shows increased significantly after the announcement of the proposed renovation to the Lyric, which he believes resulted in those patrons attending shows at the Alabama Theatre, which in turn allowed the Alabama to attract enough acts to meet the demand.
• During our time in the neighborhood surrounding the Lyric, we observed several new businesses opened in the area.
o Revelator Coffee – Opened in late 2014 in the ground-floor of the Whitmire Lofts building, approximately 300 feet from the Lyric, the craft coffee retailer based in New Orleans, LA occupies 1,877 square feet. According to an article from February 17, 2015 on AL.com, Revelator is now moving its headquarters from New Orleans to Birmingham

IMPLAN Economic Impact Analysis – Alabama Historic Rehabilitation Tax Credit Program
Novogradac & Company LLP 30
and will be opening a 10,000 square foot roasting facility at 730 1st Ave North, approximately 1.1 miles west of the location downtown.
o A small retail shop has occupied a small space adjacent to the Alabama Theater and across from the Lyric Theater that sells locally made artisan goods such as t-shirts, shoes, and beauty products.
o Gray Construction – A full-service engineering, architecture, and construction firm purchased a vacant building at 1782 Third Ave N for $1,200,000 in 2015 and will be converting the 57,101 square foot building and adjacent 160-space parking garage into its new regional headquarters.

IMPLAN Economic Impact Analysis – Alabama Historic Rehabilitation Tax Credit Program
Novogradac & Company LLP 31
PHOTOS OF THE LYRIC THEATRE
View of Lyric Theatre from opposite corner
View of theatre seating and balconies
Close up of balcony and upper level seating
View of new stage area – structure steel for state-of-the-art rigging system is seen on back wall
Revelator Coffee location located approximately 300
feet from The Lyric Theatre (opened 2014)
View of ongoing construction across the street at
new Gray Construction regional HQ

IMPLAN Economic Impact Analysis – Alabama Historic Rehabilitation Tax Credit Program
Novogradac & Company LLP 32
Name Thomas Jefferson Tower
Address 1631 and 1623 2nd Avenue N, Birmingham
Developer TJTOWER, LLC
Project Category Mixed-Use (Apartments/Retail; 100 apartments; 149,607 total square feet)
Total Project Costs $20,400,000
Total Qualified Investment
$19,900,000
Total Non-Qualified Investment
$500,000
Original Year Built 1929

IMPLAN Economic Impact Analysis – Alabama Historic Rehabilitation Tax Credit Program
Novogradac & Company LLP 33
BACKGROUND/PROJECT DESCRIPTION The property is a 20-story building that was originally constructed in 1929 as the Thomas Jefferson Hotel and later became known as The Cabana Hotel in 1972. During its tenure as the Cabana Hotel, celebrities such as Mickey Rooney and Ethel Merman stayed at the property, while Bear Bryant, the legendary coach of University of Alabama football program, was known to have converted the entirety of the top floor to a suite that he used when Alabama played Auburn University at Legion Field in Birmingham in the annual Iron Bowl. As the market in Birmingham changed and other hotels opened, the then-Cabana was purchase by a developer for conversion to luxury condominiums to be known as the Leer Tower but that project did not come to fruition. The Thomas Jefferson Hotel was listed in the National Register of Historic Places in 1989 as a contributing resource in the Downtown Birmingham Retail and Theatre Historic District. It was the last hotel to be built before the Great Depression and was designed by local architect, D.O. Whilldin. The first and second floors are faced entirely in terracotta, while a combination of terracotta and buff brick are used on the upper stories to create the Renaissance Revival motifs that characterize this building architecturally. Finally, prior to its acquisition by the current owner and developer, the property was operating as apartment units in poor condition until it was condemned by the city. Construction at the project began in early 2015, with significant work still ongoing, as evidenced by the photos found on the following pages. Upon completion of the substantial rehabilitation to the Thomas Jefferson Tower, the project will consist of 100 apartment units as well as 23,700 square feet of commercial space. The commercial space will be divided into six retail spaces, a 5,000 square foot restaurant, and a 14,000 square foot event space that will be available for the general public. The multifamily units at the project will consist of 81 one-bedroom units and 19 two-bedroom units, with one-bedrooms ranging from 499 to 786 square. Seventeen of the two-bedroom units will be 808 square feet, while two two-bedroom units will be 1,626 square feet. Amenities of the multifamily units will include a range, oven, refrigerator, garbage disposal, microwave, dishwasher, in-unit washer and dryer, and carpeting. Property amenities will include on-site management and maintenance, covered dedicated parking, a theatre, billiards room, conference room, fitness center, rooftop pool and elevators. The developer of the project, TJTOWER, LLC, has secured a lease for the 5,000 square foot restaurant with a local chef and expects to utilize the event space for parties and weddings, which will be supported by the adjacent restaurant.
“BUT FOR” ANALYSIS (BENEFIT OF TAX CREDITS) Brian Beshara, the lead member of the development team, indicated the project was in the works for a while but the rents that would have needed to have been charged for the project exceeded what was achievable in the market. The presence of the tax credit equity associated with the state rehabilitation tax credit allowed the project to keep rents, both multifamily and commercial, in line with the market and allow it to move forward.
IMPACTS Due to the relative infancy of the project in terms of where it stands with construction, direct impacts are challenging to gauge. However, we reached Gray Construction to discuss their decision to locate their new headquarters in downtown Birmingham through redevelopment of a vacant building.

IMPLAN Economic Impact Analysis – Alabama Historic Rehabilitation Tax Credit Program
Novogradac & Company LLP 34
Daniel Pittman, regional manager of Gray’s Southeast Office, indicated the decision to purchase the former department store building, which is across from the Lyric Theater, was largely a financial decision. However, Mr. Pittman further added the presence of the various projects ongoing in downtown Birmingham, of which the Thomas Jefferson Tower is one, made him more comfortable about investing in downtown Birmingham.

IMPLAN Economic Impact Analysis – Alabama Historic Rehabilitation Tax Credit Program
Novogradac & Company LLP 35
PHOTOS OF THE THOMAS JEFFERSON HOTEL
View of front of building
View of rear of building and annex
View of space that will be converted to event space
adjacent to the restaurant on second floor
View of entrance
View of large two-bedroom unit
View of downtown Birmingham from balcony off the
future event space
IMPLAN Economic Impact Analysis – Alabama Historic Rehabilitation Tax Credit Program
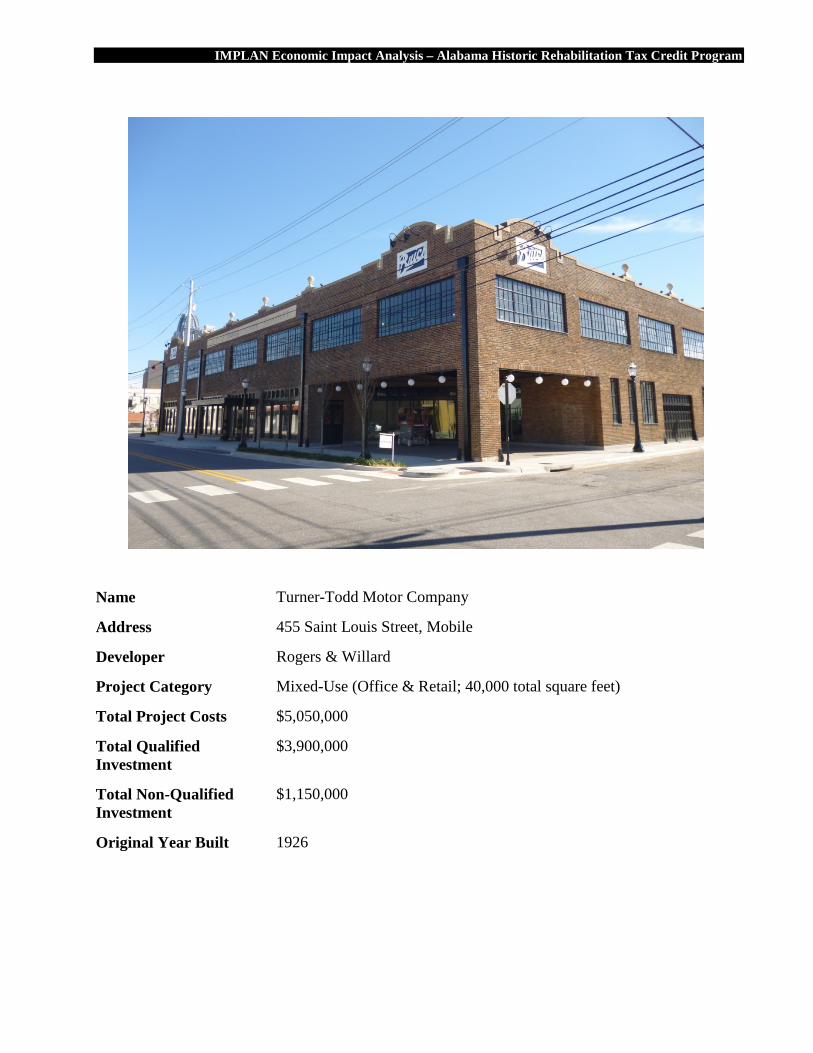
Name Turner-Todd Motor Company
Address 455 Saint Louis Street, Mobile
Developer Rogers & Willard
Project Category Mixed-Use (Office & Retail; 40,000 total square feet)
Total Project Costs $5,050,000
Total Qualified Investment
$3,900,000
Total Non-Qualified Investment
$1,150,000
Original Year Built 1926

IMPLAN Economic Impact Analysis – Alabama Historic Rehabilitation Tax Credit Program
BACKGROUND/PROJECT DESCRIPTION Constructed in 1926, the Turner Todd Motor Company Building is a former automotive dealership. It was added to in the 1940s and again in the 1950s. The building was individually listed in the National Register of Historic Places in 2008 as an excellent example of early 20th century commercial architecture in Mobile that was adapted to serve the needs of the city's fast-growing automobile industry. Originally a Buick dealership, the Turner Todd Motor Company Building is located in the potential Automobile Alley Historic District, a commercial area along St. Louis Street with a high concentration of automobile dealerships that developed in the mid-1920s as demand for the automobile increased in Mobile. The building was vacant for nearly 13 years prior to the purchase of the property by Rogers & Willard, who ultimately redeveloped the building. The last tenant of the property was CarQuest Auto Parts. During the 1920s, Tuner Todd Motor Company Building’s location and the building itself were key factors for the success of new dealerships in Mobile. The design of the Turner Todd Motor Company Building was modified to include large open interior space with a highly visible storefront to show-off the new models of Buick automobiles. Offices were located near the front of the building, and large openings were added to the design to allow for vehicular access on to the on-premises service center. This building also used the second floor for automobile storage, which as unusual for the time. Turner-Todd Motor Company relied on a concrete ramp, which is still extant, to move cars to and from the second floor storage area. Rogers & Willard are using federal and state rehabilitation tax credits to transform the building into commercial and restaurant space while maintaining the character-defining features of the building. Its rehabilitation has sparked interest in additional rehabilitation projects in the area.
“BUT FOR” ANALYSIS (BENEFIT OF TAX CREDITS) While project-specific information related to the challenges of redeveloping the Turner-Todd Building was not available, it is likely significant financial issues impeded the redevelopment or re-leasing of the property, as it was vacancy since 2002.
IMPACTS • The building was redeveloped by Rogers & Willard, a construction company that relocated its
offices to the building along with 30 full-time employees. • Another company, Rural Sourcing, occupies much of the first-floor. The company was
previously in temporary space after opening a Mobile office and opted to move to permanent space when this space was created. A representative of the company that we spoke with while in the field indicated the company typically seeks out unique space like that of the Turner-Todd Motor Company Building, usually in historic buildings or in areas of opportunity and development.
• Across the street from the Turner-Todd Motor Company Building, a series of buildings have been purchased by Precision Engineering, a full-service engineering firm that is currently located in Theodore, Alabama, approximately 14 miles south of Mobile. An article on alabamanewscenter.com in November of 2015 featured an interview with Joe Kenny, president of Precision, indicated the location was chosen to be part of the revitalization going on in Mobile.

IMPLAN Economic Impact Analysis – Alabama Historic Rehabilitation Tax Credit Program
PHOTOS OF TURNER-TODD MOTOR COMPANY
Pre rehab exterior
Pre rehab interior
View of building at corner
View of façade with downtown Mobile in
background
View of façade with restored nameplate
View of back of building and parking lot

IMPLAN Economic Impact Analysis – Alabama Historic Rehabilitation Tax Credit Program
ADDENDUM A List of Projects

IMPLAN Economic Impact Analysis – Alabama Historic Rehabilitation Tax Credit Program
Novogradac & Company LLP 40
Projects receiving reservation
Project City Categorization
Total Qualified Investment Total Project Size Year
Redmont Hotel Birmingham, 35203 Hotel $ 10,450,000 $ 20,538,691 2015
951 Government Street Building Mobile, 36604 Mixed Use $ 5,000,000 $ 5,300,000 2015
Fort McClellan HQ and Barracks Anniston, 36205 Housing $ 18,057,177 $ 23,664,687 2017
Norton-Cochrane-Fitts Residence Tuscaloosa, 35401 Housing $ 140,321 $ 215,321 2016
First National Bank of Tuscaloosa Tuscaloosa, 35401 Mixed Use $ 10,009,226 $ 29,786,341 2015
Edwards Brothers Furniture Company Building Mobile, 36602 Mixed Use $ 426,412 $ 445,612 2015
Florentine Building Birmingham, 35203 Restaurant $ 4,315,718 $ 5,920,616 2014
Pizitz Birmingham, 35203 Mixed Use $ 36,205,729 $ 67,444,285 2016
Thomas Jefferson Hotel Birmingham, 35203 Mixed Use $ 19,900,000 $ 20,400,000 2016
Tuscaloosa VA Building #33 Tuscaloosa, 35404 Housing $ 4,698,519 $ 10,549,821 2014 Davis House Huntsville, 35801 Housing $ 135,000 $ 135,000 2015
Anvondale Fire Station #10 Birmingham, 35222 Office $ 269,257 $ 279,336 2015
Hunter House Mobile, 36608 Housing $ 195,732 $ 301,573 2014 Carson Place (Cox-Mayfield-Sutley House) Tuscaloosa, 35401 Housing $ 157,609 $ 196,899 2016
Empire Building Birmingham, 35203 Hotel $ 17,760,000 $ 26,810,000 2016
First Federal Savings and Loan Association of Alabama
Birmingham, 35203 Office $ 6,006,744 $ 6,496,457 2015
Empire Parking Garage Birmingham, 35203 Retail $ 326,272 $ 422,572 2015
Temerson Building Tuscaloosa, 35401 Mixed Use $ 892,627 $ 922,646 2016 Dortch-Hunter Residence Mobile, 36607 Housing $ 184,835 $ 223,150 2015 Drish House Tuscaloosa, 35401 Arts $ 444,426 $ 460,471 2015 Anniston Hardware Company Building Anniston, 36205 Retail $ 210,000 $ 274,787 2016
Turner-Todd Motor Company Mobile, 36602 Mixed Use $ 3,900,000 $ 5,050,000 2015
Mack Truck Garage Building
Birmingham, 35233 Office $ 2,830,819 $ 3,805,819 2017
Admiral Semmes Mobile, 36602 Hotel $ 9,997,063 $ 16,164,747 2015
Bell Building Montgomery, 36104 Mixed Use $ 12,567,791 $ 21,899,884 2016
Howell School Dothan, 36303 Housing $ 11,680,458 $ 11,863,458 2016 Freeny Building Mobile, 36602 Restaurant $ 300,000 $ 300,000 2016

IMPLAN Economic Impact Analysis – Alabama Historic Rehabilitation Tax Credit Program
Novogradac & Company LLP 41
Project City Categorization
Total Qualified Investment Total Project Size Year
C.L. Ruth & Sons Jewelry Company Building
Montgomery, 36104 Mixed Use $ 700,000 $ 700,000 2016
Brown-Marx Building Birmingham, 35203 Mixed Use $ 25,000,000 $ 29,500,000 2016
Shepherd-Sloss Birmingham, 35205 Retail $ 1,096,897 $ 1,096,897 2016
Lyric Theater Birmingham, 35203 Arts $ 11,156,000 $ 11,612,000 2015
Cain Furniture Company Building
Birmingham, 35203 Housing $ 5,556,800 $ 7,131,800 2016
Old Shell Road School Mobile, 36604 Housing $ 3,000,000 $ 3,300,000 2016 Russell School Mobile, 36603 Housing $ 3,000,000 $ 3,250,000 2016
Powell School Birmingham, 35203 Housing $ 7,139,903 $ 7,676,323 2016
Federal Reserve Bank of Atlanta
Birmingham, 35203 Mixed Use $ 20,147,170 $ 22,067,170 2016
Jefferson Davis Apartments Montgomery, 36104 Housing $ 5,031,000 $ 11,638,846 2016
Emanuel Staples Pake Building Mobile, 36602 Mixed Use $ 4,682,940 $ 5,743,000 2016
Decatur Post Office Decatur, 35601 Office $ 1,031,806 $ 1,139,572 2015 TOTAL $264,604,251 $384,727,781
Projects on the Waiting List
Project City Categorization
Total Qualified Investment Total Project Size Year
Age Building Birmingham, 35203
Mixed Use $757,499 $757,499 2016
Stuart-Hostetter House Montgomery, 36104
Housing $157,507 $193,725 2017
Shady Dell Tuscumbia, 35674 Housing $105,000 $120,000 2016 St Francis Street Methodist Church
Mobile, 36603 Retail $1,500,000 $1,500,000 2016
Orlando Apartments Birmingham, 35205
Housing $165,779 $176,085 2015
Meyers Brothers General Store - Robertson Banking Company
Demopolis, 36732 Monetary Services
$226,312 $226,312 2015
1501 Dearing Place Tuscaloosa, 35401 Housing $300,000 $335,000 2015 265 Warren Street Mobile, 36603 Housing $125,000 $150,000 2017 263 Warren Street Mobile, 36603 Housing $125,000 $150,000 2017 267 Warren Street Mobile, 36603 Housing $125,000 $150,000 2017 Roberts & Son's Printing and Binding Company Building
Birmingham, 35203-3102
Mixed Use $4,000,000 $4,000,000 2017
Graves Building - West Birmingham, Mixed Use $4,000,000 $4,000,000 2017

IMPLAN Economic Impact Analysis – Alabama Historic Rehabilitation Tax Credit Program
Novogradac & Company LLP 42
Project City Categorization
Total Qualified Investment Total Project Size Year
35203-3102 Dixie Coffee Company Building
Birmingham, 35203
Mixed Use $367,000 $367,000 2015
TOTAL $11,954,097 $12,125,621

ADDENDUM B Detailed Annual Results
IMPLAN Economic Impact Analysis – Alabama Historic Rehabilitation Tax Credit Program
Novogradac & Company LLP 44
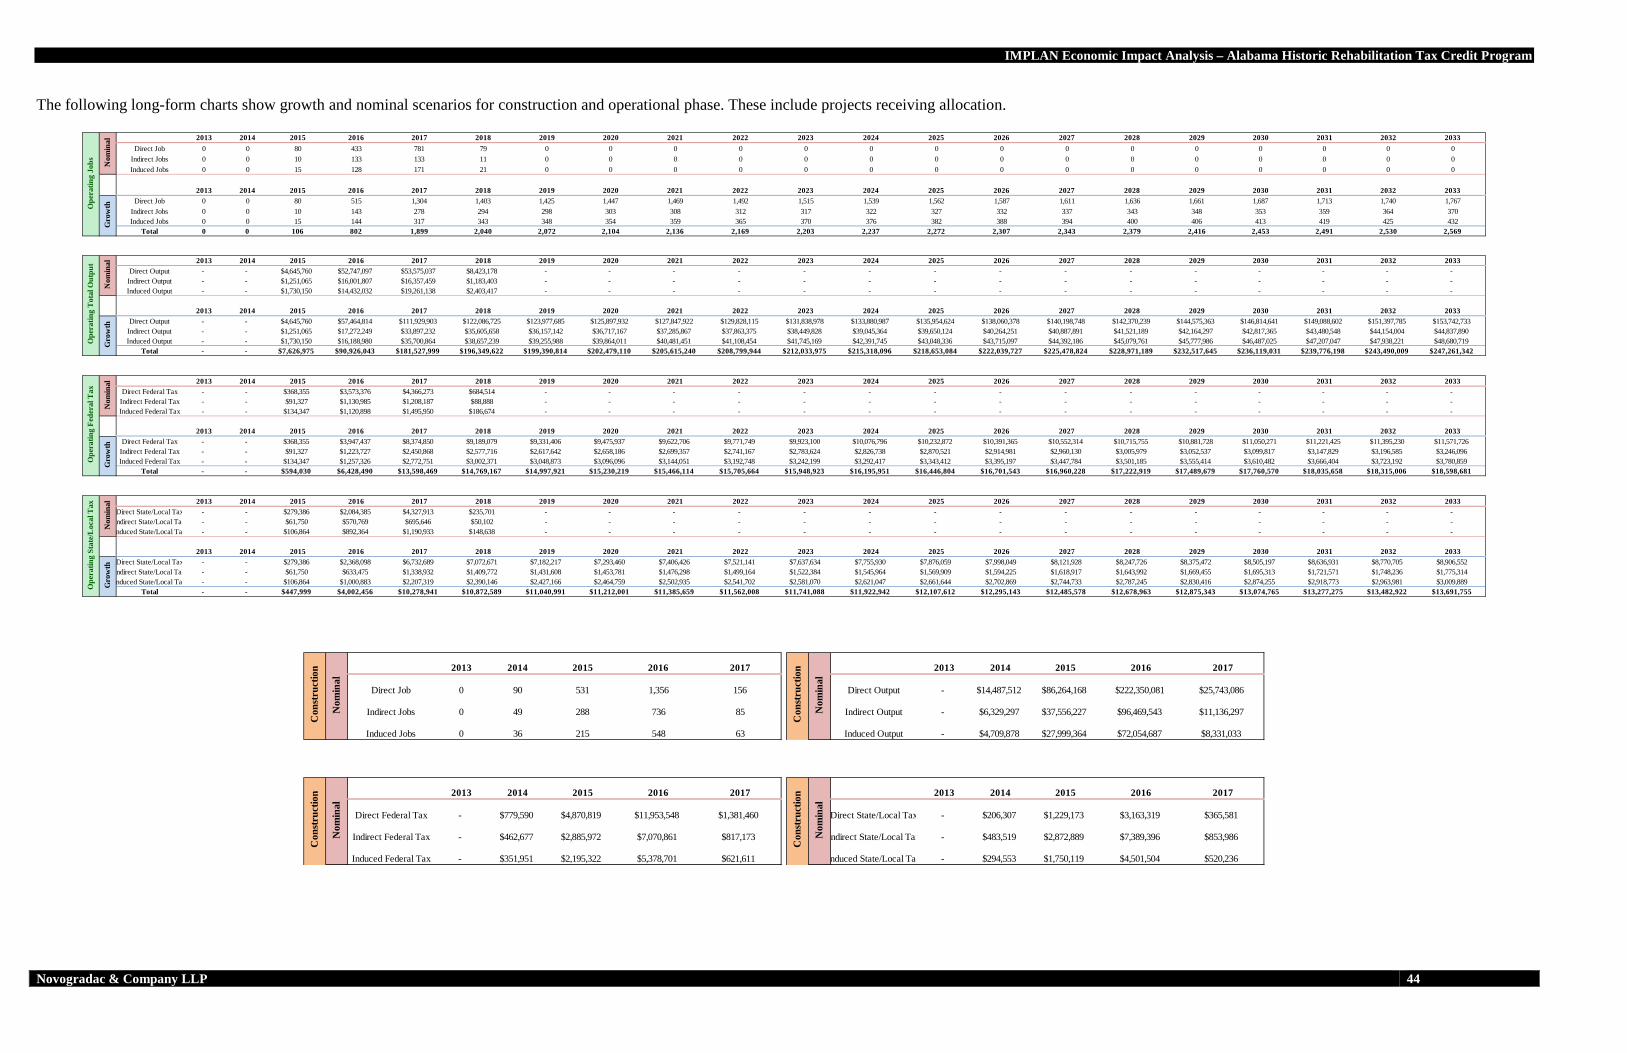
The following long-form charts show growth and nominal scenarios for construction and operational phase. These include projects receiving allocation.
2013 2014 2015 2016 2017 2018 2019 2020 2021 2022 2023 2024 2025 2026 2027 2028 2029 2030 2031 2032 2033Direct Job 0 0 80 433 781 79 0 0 0 0 0 0 0 0 0 0 0 0 0 0 0
Indirect Jobs 0 0 10 133 133 11 0 0 0 0 0 0 0 0 0 0 0 0 0 0 0Induced Jobs 0 0 15 128 171 21 0 0 0 0 0 0 0 0 0 0 0 0 0 0 0
2013 2014 2015 2016 2017 2018 2019 2020 2021 2022 2023 2024 2025 2026 2027 2028 2029 2030 2031 2032 2033Direct Job 0 0 80 515 1,304 1,403 1,425 1,447 1,469 1,492 1,515 1,539 1,562 1,587 1,611 1,636 1,661 1,687 1,713 1,740 1,767
Indirect Jobs 0 0 10 143 278 294 298 303 308 312 317 322 327 332 337 343 348 353 359 364 370Induced Jobs 0 0 15 144 317 343 348 354 359 365 370 376 382 388 394 400 406 413 419 425 432
Total 0 0 106 802 1,899 2,040 2,072 2,104 2,136 2,169 2,203 2,237 2,272 2,307 2,343 2,379 2,416 2,453 2,491 2,530 2,569
Ope
ratin
g Jo
bs Nom
inal
Gro
wth
2013 2014 2015 2016 2017 2018 2019 2020 2021 2022 2023 2024 2025 2026 2027 2028 2029 2030 2031 2032 2033Direct Output - - $4,645,760 $52,747,097 $53,575,037 $8,423,178 - - - - - - - - - - - - - - -
Indirect Output - - $1,251,065 $16,001,807 $16,357,459 $1,183,403 - - - - - - - - - - - - - - -Induced Output - - $1,730,150 $14,432,032 $19,261,138 $2,403,417 - - - - - - - - - - - - - - -
2013 2014 2015 2016 2017 2018 2019 2020 2021 2022 2023 2024 2025 2026 2027 2028 2029 2030 2031 2032 2033Direct Output - - $4,645,760 $57,464,814 $111,929,903 $122,086,725 $123,977,685 $125,897,932 $127,847,922 $129,828,115 $131,838,978 $133,880,987 $135,954,624 $138,060,378 $140,198,748 $142,370,239 $144,575,363 $146,814,641 $149,088,602 $151,397,785 $153,742,733
Indirect Output - - $1,251,065 $17,272,249 $33,897,232 $35,605,658 $36,157,142 $36,717,167 $37,285,867 $37,863,375 $38,449,828 $39,045,364 $39,650,124 $40,264,251 $40,887,891 $41,521,189 $42,164,297 $42,817,365 $43,480,548 $44,154,004 $44,837,890Induced Output - - $1,730,150 $16,188,980 $35,700,864 $38,657,239 $39,255,988 $39,864,011 $40,481,451 $41,108,454 $41,745,169 $42,391,745 $43,048,336 $43,715,097 $44,392,186 $45,079,761 $45,777,986 $46,487,025 $47,207,047 $47,938,221 $48,680,719
Total - - $7,626,975 $90,926,043 $181,527,999 $196,349,622 $199,390,814 $202,479,110 $205,615,240 $208,799,944 $212,033,975 $215,318,096 $218,653,084 $222,039,727 $225,478,824 $228,971,189 $232,517,645 $236,119,031 $239,776,198 $243,490,009 $247,261,342
Ope
ratin
g T
otal
Out
put
Nom
inal
Gro
wth
2013 2014 2015 2016 2017 2018 2019 2020 2021 2022 2023 2024 2025 2026 2027 2028 2029 2030 2031 2032 2033Direct Federal Tax - - $368,355 $3,573,376 $4,366,273 $684,514 - - - - - - - - - - - - - - -
Indirect Federal Tax - - $91,327 $1,130,985 $1,208,187 $88,888 - - - - - - - - - - - - - - -Induced Federal Tax - - $134,347 $1,120,898 $1,495,950 $186,674 - - - - - - - - - - - - - - -
2013 2014 2015 2016 2017 2018 2019 2020 2021 2022 2023 2024 2025 2026 2027 2028 2029 2030 2031 2032 2033Direct Federal Tax - - $368,355 $3,947,437 $8,374,850 $9,189,079 $9,331,406 $9,475,937 $9,622,706 $9,771,749 $9,923,100 $10,076,796 $10,232,872 $10,391,365 $10,552,314 $10,715,755 $10,881,728 $11,050,271 $11,221,425 $11,395,230 $11,571,726
Indirect Federal Tax - - $91,327 $1,223,727 $2,450,868 $2,577,716 $2,617,642 $2,658,186 $2,699,357 $2,741,167 $2,783,624 $2,826,738 $2,870,521 $2,914,981 $2,960,130 $3,005,979 $3,052,537 $3,099,817 $3,147,829 $3,196,585 $3,246,096Induced Federal Tax - - $134,347 $1,257,326 $2,772,751 $3,002,371 $3,048,873 $3,096,096 $3,144,051 $3,192,748 $3,242,199 $3,292,417 $3,343,412 $3,395,197 $3,447,784 $3,501,185 $3,555,414 $3,610,482 $3,666,404 $3,723,192 $3,780,859
Total - - $594,030 $6,428,490 $13,598,469 $14,769,167 $14,997,921 $15,230,219 $15,466,114 $15,705,664 $15,948,923 $16,195,951 $16,446,804 $16,701,543 $16,960,228 $17,222,919 $17,489,679 $17,760,570 $18,035,658 $18,315,006 $18,598,681
Ope
ratin
g Fe
dera
l Tax
Nom
inal
Gro
wth
2013 2014 2015 2016 2017 2018 2019 2020 2021 2022 2023 2024 2025 2026 2027 2028 2029 2030 2031 2032 2033Direct State/Local Tax - - $279,386 $2,084,385 $4,327,913 $235,701 - - - - - - - - - - - - - - -
Indirect State/Local Tax - - $61,750 $570,769 $695,646 $50,102 - - - - - - - - - - - - - - -nduced State/Local Tax - - $106,864 $892,364 $1,190,933 $148,638 - - - - - - - - - - - - - - -
2013 2014 2015 2016 2017 2018 2019 2020 2021 2022 2023 2024 2025 2026 2027 2028 2029 2030 2031 2032 2033Direct State/Local Tax - - $279,386 $2,368,098 $6,732,689 $7,072,671 $7,182,217 $7,293,460 $7,406,426 $7,521,141 $7,637,634 $7,755,930 $7,876,059 $7,998,049 $8,121,928 $8,247,726 $8,375,472 $8,505,197 $8,636,931 $8,770,705 $8,906,552
Indirect State/Local Tax - - $61,750 $633,475 $1,338,932 $1,409,772 $1,431,608 $1,453,781 $1,476,298 $1,499,164 $1,522,384 $1,545,964 $1,569,909 $1,594,225 $1,618,917 $1,643,992 $1,669,455 $1,695,313 $1,721,571 $1,748,236 $1,775,314nduced State/Local Tax - - $106,864 $1,000,883 $2,207,319 $2,390,146 $2,427,166 $2,464,759 $2,502,935 $2,541,702 $2,581,070 $2,621,047 $2,661,644 $2,702,869 $2,744,733 $2,787,245 $2,830,416 $2,874,255 $2,918,773 $2,963,981 $3,009,889
Total - - $447,999 $4,002,456 $10,278,941 $10,872,589 $11,040,991 $11,212,001 $11,385,659 $11,562,008 $11,741,088 $11,922,942 $12,107,612 $12,295,143 $12,485,578 $12,678,963 $12,875,343 $13,074,765 $13,277,275 $13,482,922 $13,691,755Ope
ratin
g St
ate/
Loc
al T
ax
Gro
wth
Nom
inal
2013 2014 2015 2016 2017
Direct Job 0 90 531 1,356 156
Indirect Jobs 0 49 288 736 85
Induced Jobs 0 36 215 548 63
Con
stru
ctio
n
Nom
inal
2013 2014 2015 2016 2017
Direct Output - $14,487,512 $86,264,168 $222,350,081 $25,743,086
Indirect Output - $6,329,297 $37,556,227 $96,469,543 $11,136,297
Induced Output - $4,709,878 $27,999,364 $72,054,687 $8,331,033
Con
stru
ctio
n
Nom
inal
2013 2014 2015 2016 2017
Direct Federal Tax - $779,590 $4,870,819 $11,953,548 $1,381,460
Indirect Federal Tax - $462,677 $2,885,972 $7,070,861 $817,173
Induced Federal Tax - $351,951 $2,195,322 $5,378,701 $621,611
Con
stru
ctio
n
Nom
inal
2013 2014 2015 2016 2017
Direct State/Local Tax - $206,307 $1,229,173 $3,163,319 $365,581
Indirect State/Local Tax - $483,519 $2,872,889 $7,389,396 $853,986
nduced State/Local Tax - $294,553 $1,750,119 $4,501,504 $520,236
Nom
inal
Con
stru
ctio
n

IMPLAN Economic Impact Analysis – Alabama Historic Rehabilitation Tax Credit Program
Novogradac & Company LLP 45
ADDENDUM C Net Present Value Calculations

IMPLAN Economic Impact Analysis – Alabama Historic Rehabilitation Tax Credit Program
Novogradac & Company LLP 46
Net Present Value of State/Local Taxes The following represents a basic net present value analysis (NPV). To calculate a discount rate, we researched municipal bond rates and other statewide investments. A discount rate of 7.5% was applied to the model. The NPV calculation utilizes tax impacts through 2033, and includes the nominal construction phase tax impacts and the growth-scenario operational phase impacts.
Construction and Operational Phases Net Present Value Cost to State (Tax Expenditures) $45,796,347 Direct State/Local Tax $60,264,704 Direct + Indirect State/Local Tax $81,111,742 Direct + Indirect + Induced State/Local Tax $106,014,768
$0$5,000,000
$10,000,000$15,000,000$20,000,000$25,000,000$30,000,000$35,000,000$40,000,000$45,000,000
Total Tax Revenue v. Expenditures
Tax Expenditures Direct + Indirect + Induced State/Local Tax

ADDENDUM D IMPLAN and Input Output Modeling

IMPLAN Economic Impact Analysis – Alabama Historic Rehabilitation Tax Credit Program
Novogradac & Company LLP 48
BACKGROUND It is important to note there is the potential for rounding errors within the data. We have done our best to round the figures as we see fit. The direct impacts are the total financial equivalents of the number of employees in a given industry. Indirect impacts are impacts caused by the iteration of industries purchasing from other industries. Induced impacts are the impacts on all local industries caused by the expenditures of new household income generated by the direct and indirect impacts. Input-output accounting describes commodity flows from producers to intermediate and final consumers. The total industry purchases of commodities, services, employment compensation, value added, and imports are equal to the value of the commodities produced. Purchases for final use (final demand) drive the model. Industries produce goods and services for final demand and purchase goods and services from other producers. These other producers, in turn, purchase goods and services. This buying of goods and services (indirect purchases) continues until leakages from the region (imports and value added) stop the cycle. These indirect and induced impacts (the impacts of household spending) can be mathematically derived. The derivation is called the Leontief inverse. The resulting sets of multipliers describe the change of output for each and every regional industry caused by a one dollar change in final demand for any given industry. Creating regional input-output models require a tremendous amount of data. The costs of surveying industries within each region to derive a list of commodity purchases (production functions) are prohibitive. IMPLAN was developed as a cost-effective means to develop regional input-output models. The IMPLAN accounts closely follow the accounting conventions used in the "Input-Output Study of the U.S. Economy" by the Bureau of Economic Analysis (1980) and the rectangular format recommended by the United Nations. The IMPLAN system was designed to serve three functions: 1) data retrieval, 2) data reduction and model development, and 3) impact analysis. Comprehensive and detailed data coverage of the entire U.S. by county, and the ability to incorporate user-supplied data at each stage of the model building process, provides a high degree of flexibility both in terms of geographic coverage and model formulation. The IMPLAN database consists of two major parts: a national-level technology matrix; and estimates of sectorial activity for final demand, final payments, industry output and employment for each county in the U.S. along with state and national totals. New databases are developed annually by MIG, Inc., the developer of IMPLAN.

IMPLAN Economic Impact Analysis – Alabama Historic Rehabilitation Tax Credit Program
Novogradac & Company LLP 49
TECHNICAL INFORMATION The notion of a multiplier rests upon the difference between the initial effect of a change in final demand and the total impacts of that change. Total impacts can be calculated either as direct and indirect impacts, or as direct, indirect, and induced impacts. Direct impacts are production changes associated with the immediate impacts or final demand changes. Indirect impacts are production changes in backward-linked industries caused by the changing input needs of directly affected industries (for example, additional purchases to produce additional output). Induced impacts are the changes in regional household spending patterns caused by changes in household income generated from the direct and indirect impacts. Five different sets of multipliers are estimated by IMPLAN corresponding to five measures of regional economic activity: total industry output; personal income; total income; value added; and employment. For each set of multipliers, three types of multipliers are generated, Type I, Type II and Type SAM. Type I Multiplier A Type I multiplier is the direct effect, produced by a change in final demand, plus the indirect effect divided by the direct effect. Increased demands are assumed to lead to increased employment and population with the average income level remaining constant. The Leontief inverse (Type I multipliers matrix) is derived by inverting the direct coefficients matrix. The result is a matrix of total requirement coefficients, the amount each industry must produce in order for the purchasing industry to deliver one dollar's worth of output to final demand. Type II Multiplier Type II multipliers incorporate “induced” effects resulting from the household expenditures from new labor income. The linear relationship between labor income and household expenditure can be customized in the IMPLAN Professional® software: The default relationship is PCE (personal consumption expenditures) and total household expenditures. Each dollar of work-place based income is spent based on the SAM relationship generated by IMPLAN. The second possibility is a RIMS II style of Type II multiplier, where PCE is adjusted to represent only the spending of the disposable income portion of labor income. In this way there is a direct one-to-one relationship to labor income and PCE. Then a ratio, which the user can specify, is applied to convert total income to disposable income before the rounds of induced impacts are calculated. Type SAM Type SAM multipliers are the direct, indirect, and induced impacts where the induced effect is based on information in the social account matrix. This relationship accounts for social security and income tax leakage, institution savings, and commuting. It also accounts for inter-institutional transfers. Other Definitions
• Output refers to the total economic value of the project in the local economy. • Employment shows the number of employees needed to support the economic activity in the
local economy. It should be noted that for annual impacts of ongoing operations, the employment figure shown represents the amount of employment needed to support that

IMPLAN Economic Impact Analysis – Alabama Historic Rehabilitation Tax Credit Program
Novogradac & Company LLP 50
activity for a year. Furthermore, IMPLAN reports the number of jobs based on average output per employee for a given industry within the geography. This is not the same as the number of full-time positions.
• Value Added shows the total income that the event generates in the local economy. This income includes:
o Employee Compensation – total payroll costs, including benefits. o Proprietary Income – payments received by self-employed individuals as income o Other Property Type Income – payments for rents, royalties, and dividends. o Indirect Business Taxes – excise taxes, property taxes, fees, and sales taxes paid by
businesses. These taxes occur during the normal operation of businesses, but do not include taxes on profits or income.
• Regional Commodity Demand for Construction Sector. The absorption detail goes to over 200 industries. A short sample is shown.
Code
Description Gross Absorption
Gross Inputs
RPC Regional Absorption
Regional Inputs
3000
Total Commodity Demand 54.15% 1,784,579,558
49.09%
26.58% 875,996,513
3369
Architectural, engineering, and related services
6.06% 199,633,709
87.52%
5.30% 174,717,786
3115
Refined petroleum products 3.47% 114,444,477
3.26% 0.11% 3,724,633
3319
Wholesale trade distribution services 2.09% 68,962,326
73.33%
1.53% 50,572,816
3025
Natural stone 1.99% 65,635,502
34.15%
0.68% 22,415,634
3365
Commercial and industrial machinery and equipment rental and leasing services
1.97% 64,755,837
60.06%
1.18% 38,894,015
3367
Legal services 1.59% 52,528,245
70.26%
1.12% 36,905,965
3335
Truck transportation services 1.56% 51,275,484
84.39%
1.31% 43,271,935
3149
Other plastics products 1.36% 44,757,317
13.83%
0.19% 6,188,949
3117
Asphalt shingles and coating materials 1.31% 43,176,029
31.97%
0.42% 13,804,958
3095
Dimension lumber and preserved wood products
1.25% 41,312,922
78.48%
0.98% 32,421,702
3187
Ornamental and architectural metal products 1.24% 40,897,196
21.46%
0.27% 8,777,356
3116
Asphalt paving mixtures and blocks 1.08% 35,718,132
0.16% 0.00% 58,364
3216
Air conditioning, refrigeration, and warm air heating equipment
1.05% 34,717,089
5.58% 0.06% 1,937,326
3351
Telecommunications 1.04% 34,146,630
73.14%
0.76% 24,974,345
3354
Monetary authorities and depository credit intermediation services
1.02% 33,504,143
97.18%
0.99% 32,560,057
3161
Ready-mix concrete 0.86% 28,464,828
61.09%
0.53% 17,388,399

ASSUMPTIONS AND LIMITING CONDITIONS

IMPLAN Economic Impact Analysis – Alabama Historic Rehabilitation Tax Credit Program
Novogradac & Company LLP 52
ASSUMPTIONS AND LIMITING CONDITIONS 1. The economic impact analysis contained herein relies on databases and software developed
by MIG, Inc. MIG Inc. has been developing complex localized databases since 1993, and is an industry recognized leader in input-output databases and data modeling. As a result, we believe the information provided is a reliable basis to use in developing the economic impacts for the Project (s). However, we have not examined the data or the assumptions underlying such data in accordance with the standards prescribed by the AICPA and, accordingly, do not express an opinion or any other form of assurance on the data estimates obtained for use in our economic impact analysis.
2. All information contained in the report which was furnished by others was assumed to be
true, correct, and reliable. A reasonable effort was made to verify such information, but the author assumes no responsibility for its accuracy.
3. The report was made assuming responsible ownership and capable management of the
Project. 4. Possession of the report, or a copy thereof, does not carry with it the right of publication,
nor may it be reproduced in whole or in part, in any manner, by any person, without the prior written consent of Novogradac & Company LLP. Neither all nor any part of the report, or copy thereof shall be disseminated to the general public by the use of advertising, public relations, news, sales, or other media for public communication without the prior written consent and approval of Novogradac & Company LLP.
5. The author of this report is not required to give testimony or attendance in legal or other
proceedings relative to this report or to the Subject unless satisfactory additional arrangements are made prior to the need for such services.
6. The opinions contained in this report are those of the author and no responsibility is
accepted by the author for the results of actions taken by others based on information contained herein.
7. Acceptance of and/or use of this report constitutes acceptance of all assumptions and the
above conditions.