Embed Size (px)
Citation preview

Al-Tameemi, Mohammed Ridha Jawad (2019) Thermal analysis of combined Organic Rankine-Vapour compression system for heating and cooling applications. PhD thesis.
https://theses.gla.ac.uk/75112/
Copyright and moral rights for this work are retained by the author
A copy can be downloaded for personal non-commercial research or study, without prior permission or charge
This work cannot be reproduced or quoted extensively from without first obtaining permission in writing from the author
The content must not be changed in any way or sold commercially in any format or medium without the formal permission of the author
When referring to this work, full bibliographic details including the author, title, awarding institution and date of the thesis must be given
Enlighten: Theses https://theses.gla.ac.uk/
Thermal analysis of combined Organic
Rankine-Vapour compression system for
heating and cooling applications
By
Mohammed Ridha Jawad Al-Tameemi
Submitted in fulfilment of the requirements for the degree of
Doctor of Philosophy (PhD)
System, Power & Energy Research Division
School of Science and Engineering
College of Engineering
University of Glasgow
Glasgow, UK
September 2019
Copyright © 2019 by Mohammed Al-Tameemi
All Rights Reserved
Abstract
ii
Abstract
Climate change due to global warming is a matter of major global concern. Greenhouse gases
emissions are a key culprit in this process. It is therefore important to reduce energy consump-
tion in order to protect the environment. The decarbonisation of the heating sector would have
a significant positive impact on the environment.
A wide range of heating technologies have been investigated and developed, such as gas boilers,
electric restrictive heaters, heat pumps (HP), and others. In order to reduce fossil fuel consump-
tion and greenhouse gas emissions, researchers have focused on improving the performance of
the existing technologies as well as on developing new fuel-efficient systems such as cogener-
ation and trigeneration cycles. These integrated technologies allow the production of multi-
mode energies including heating, cooling, and/or mechanical power from the same primary
energy source. The energy source can be a fossil fuel, or renewable energy such as solar, geo-
thermal, biomass or wasted heat. Waste heat utilization (from a data centre, internal combustion
engine, chamber exhaust stream, etc.) also has the potential of enhancing the system perfor-
mance by reducing fuel consumption.
In this thesis, an innovative gas fuelled heating system based on a combined heat engine and its
reverse heat pump cycle is proposed and investigated. This system consists of a gas burner, an
organic Rankine cycle power generator, and an air source heat pump vapour compression cycle.
For the theoretical analysis, in-house MATLAB code is developed, and the steady state results
are compared with the results acquired from ASPEN PLUS as a benchmark. Both software
programs use REFPROP as the database for working fluid thermophysical properties. In order
to identify a suitable working fluid for each cycle, a comparative study on various working
fluids was initially carried out. The selection of refrigerant was based on performance and
environmental safety profile. The proposed cycle is designed for domestic hot water supply and
utilizes gas burner flue gases and ambient air to enhance the system overall fuel to heat
efficiency while maintaining the heat pump cycle in a frost free state at low ambient
temperature. The combined cycle shows promising performance, with a fuel to heat efficiency
of 136%. However, the results also show that ambient air temperature fluctuations can have a
significant impact on the combined system’s performance. To tackle this, various control
strategies are proposed and investigated. Also, a dynamic model has been built using ASPEN
PLUS software to simulate and validate the control strategy.
Abstract
iii
Waste heat can offer a steadier heat source than ambient air. Chapter six proposes a combined
system where the waste heat from the data centre is recovered to provide a cooling effect for
the data centre, with the recovered heat used for central heating. The results show that the
system can maintain the data center (DC) room temperature at between 18-25 oC and heat the
returnee water from 50-80 oC. The obtained fuel to heat efficiency is 137%. In addition, various
control strategies have been proposed to tackle the variations in the DC workload. A dynamic
model is used to display the control strategies parameters with respect to time.
Another intended application for the proposed system is the production of refrigeration load by
waste heat recovery from a diesel engine exhaust stream, as presented in chapter seven. The
results show that 47% of the wasted heat can be converted by the combined cycle into useful
refrigeration, with an outlet air temperature of -18 oC. A control strategy (in steady and dynamic
modes) is proposed to simulate the combined cycle under variable diesel engine speed and load.

Acknowledgements
iv
Acknowledgements
First and foremost, I wish to offer this endeavour to Allah (Almighty God), the most merciful,
for the wisdom, strength, peace of mind and good health he bestowed upon me which allowed
me to finish this thesis.
I would like to express my sincere gratitude to my supervisor, Dr. Zhibin Yu, for his continuous
support and guidance during my PhD study, and for his patience, motivation, enthusiasm and
immense knowledge.
My sincere thanks also to the Iraqi government, especially the Ministry of Higher Education
and Scientific Research, and to the University of Diyala and its School of Engineering for giving
me this scholarship opportunity and supporting me and my family by all necessary means.
I am forever in debt to my family, especially my loving mother (Najiyah Hussein) who blessed
me with her continuous prayers and encouraged me throughout my study. To the spirit of my
beloved father who has passed away. Also, to my kind and supportive wife, who was always by
my side when I needed her most and helped me so much in completing this thesis, and also to
my kids (Farah and Yasameen) who were my inspiration during this journey. Last but not least,
to my sisters and my relatives for believing in me.
My thanks and appreciation go to my colleagues, friends and department staff who have helped
me in various ways, with special thanks to Dr. Youcai Liang, Dr. Guopeng Yu, and Dr. Peter
Collings.
Finally, I would like to thank all the lovely staff at the University of Glasgow including those
at the Language Centre, the administration team, library and IT staff, and all the other university
people who made my studies at the University of Glasgow such a great experience.

Author’s Declaration
v
Author’s Declaration
I declare that, unless explicitly stated to be the contribution of others, that this thesis is entirely
my own work and has not been submitted for any other degree, at the University of Glasgow or
elsewhere.
Mohammed Al-Tameemi
September 2019
Preface
vi
Preface
Publications
1. Collings, P., Al-Tameemi, M., Yu, Z., A Combined Organic Rankine Cycle-Heat Pump System
for Domestic Hot Water Applications. 12th International Conference on Heat Transfer, Fluid
Mechanics and Thermodynamics, Malaga, Spain, 11 - 13 Jul 2016.
2. Liang, Y., Al-Tameemi M., Yu Z., Investigation of a gas-fuelled water heater based on
combined power and heat pump cycles. Applied Energy, 2018. 212: pp. 1476-1488.
3. Al-Tameemi M., Liang, Y., Yu, Z., Numerical analysis of a heat pump based on combined
thermodynamic cycles using ASPEN plus software. HEAT POWERED CYCLES, 2018,
Conference Proceedings, pp. 412.
4. Al-Tameemi M., Liang, Y., Yu, Z., Combined ORC-HP thermodynamic cycles for DC cooling
and waste heat recovery for central heating. Energy Procedia, 2019. 158: pp. 2046-2051
Table of contents
vii
Table of Contents
Abstract……………………………………………………………………………….........ii
Acknowledgements…………………………..………….………………………………...iv
Author’s Declaration………………………………………………….…………………...v
Preface……………………………………………………………………………………...vi
Table of Contents……………………….………………..……………………………….vii
List of Tables………………………………………………………………………………xv
List of Figures…………………………….……………………….……………………..xvii
List of Symbols…………………………….……………………………..……………...xxvi
Abbreviations…………………………………………………………………………..xxviii
Chapter 1 Introduction……………………………………………………………………1
1.1 Overview…………………………………………...…………………………………..1
1.2 Available heating technologies………………………….……...……………………..1
1.2.1 Electric heaters……………………………………………………………………….1
1.2.2 Gas boilers…………………………………………………………………….……...2
1.2.3 Heat pump systems………………………………………………………….………...3
1.2.4 Combined heat and power systems (CHP) …...…………………………….………...4
1.3 Types of heat sources……………….……………………………….……….…….….5
1.3.1 Air source……………………………………………………………....…….……….5
1.3.2 Waste heat sources………………………………………………………….………...6
1.3.3 Ground or geothermal source………….………………………………….…..….…..7
1.3.4 Water source……………………………………………………………..…………...9
Table of contents
viii
1.3.5 Solar source……………………………………………………………………...…...9
1.4 Challenges in existing hating technologies...………………………...……………...11
1.5 Motivation for the present work……………………………………………………..12
1.6 Aims of this research……………….………………………………………………...13
1.7 Outline of the thesis…………………………………………………………………..13
Chapter 2 Literature review……………………………………………………………..15
2.1 Introduction…………………………………………………………………………..15
2.2 Types of prime movers for CHP systems……………………………..………….…16
2.2.1 Steam turbine……………………………………………………………………..…16
2.2.2 Gas turbine…………………………………………………………………………..16
2.2.3 Reciprocating internal combustion engines…………………………………………17
2.2.4 Stirling engines………………………………………………………………….…...18
2.2.5 Organic Rankine cycle………………………………………………….……………19
2.3 Literature review on combined technologies …….………………………………...21
2.3.1 Combined heat pump systems………………………………………………………..21
2.3.1.1 Gas turbine powered HP system…………………………………………………...21
2.3.1.2 Gas powered HP system (GPHP) ………………………………………………….23
2.3.2 Combined gas burner-ORC system…………………………………………………..25
2.3.3 Diesel engine driven ORC cycle……………………………………………………...27
2.3.4 Combined Organic Rankine cycle-Vapour Compression Cycle…..………………….38
2.4 Literature review on modelling VCC and ORC cycles……..………………..……..45
2.5 Summary and discussion of literatures related to ORC and VCC cycles …………57
Table of contents
ix
2.6 Justifications for the current research………………………………………………59
Chapter 3 Theory of the combined ORC-VCC cycles…………………………………61
3.1 Introduction…………………………………………………………………………..61
3.2 Vapour compression heat pump cycle (VCC-HP)…………………………………61
3.2.1 HP evaporation process………………………………………………………….....62
3.2.2 HP compression process……………………………………………………..……..63
3.2.3 HP condensation process……………………………………………………….......63
3.2.4 HP expansion process……………………………………..………………………..63
3.2.5 Heat pump first law of thermodynamic………………………….……………….....64
3.3 Organic Rankine cycle (ORC)……………………………………………………...65
3.3.1 ORC evaporator……………………………………………………………..……...66
3.3.2 ORC expander…………………………………………………………………..…..66
3.3.3 ORC condenser……………………………………………...………………….…..66
3.3.4 ORC liquid pump……………………………………………………………..…….67
3.3.5 ORC first law of thermodynamic…………………………………………………...67
3.4 Thermal balance model across the ORC-VCC (HXs)…………………………....68
3.5 Pinch point temperature difference approach (PPTD)………………………......70
3.6 Isentropic efficiency of the ORC expander and the HP compressor……………72
3.7 Modelling the gas burner…………………………………………………………..73
3.7.1 Chemical combustion equation……………………………………………….……73
3.7.2 First law of combustion……………………………………………………………73
3.8 Evaluation of the combined system performance………………………………..74
Table of contents
x
3.9 Heat exchanger areas……………………………………………………………..75
3.10 Second law efficiency and exergy destruction………………………………….80
3.11 Modelling the combined ORC and HP cycles …………………………............82
3.11.1 Thermophysical properties software……………………………………………82
3.11.2 Assumptions adopted in the modelling process…………………………...…….83
3.12 MATALB code………………………………………...........................................84
3.12.1 Steady state model…………………………………………….………………...84
3.12.1.1 HP cycle model……………………………………………………………….84
3.12.1.2 ORC cycle model……………………………………………………………..87
3.12.1.3 Gas burner model…………………………………………………………….89
3.12.1.4 Modelling the post heater…………………………………………………….90
3.12.2 Varying one or two parameters in the combined system……….……………....90
3.12.3 Pinch point temperature difference (PPTD) model ..……………………….….91
3.13 Dynamic modelling by ASPEN PLUS……………………………………….…92
3.14 Modelling the PID controller by ASPEN PLUS……………………..…….….96
Chapter 4 Selection of working fluids……………………………………………….98
4.1 Introduction………………………………………………………………………..98
4.2 Classification of working fluids…………………………………………………...98
4.3 Working fluid selection for the heat pump cycle……………………….………..101
4.3.1 First approach to the HP cycle………………………………………….………...101
4.3.2 Second approach to the HP cycle…………………………………………………107
4.4 Working fluid selection for the ORC cycle………………………………....…....110
Table of contents
xi
4.4.1 First approach to the ORC cycle…………………………………………….…...111
4.4.2 Second approach to the ORC cycle…………………………………….………...113
4.5 Environmental and safety profiles of the working fluids……………………….116
4.6 Conclusion…………………………………………………………………..……..118
Chapter 5 Combining ORC-HP cycles to provide hot water for domestic use…...119
5.1 Introduction…………………………………………………………………….…119
5.2 The thermodynamic concept……………………………………………………..119
5.3 Preliminary design of the combined cycle………………………………………120
5.3.1 Modelling HP cycle for steady state……………………………………………..121
5.3.2 Modelling ORC cycle for steady state…………………………………………...122
5.3.3 Steady state results for combined ORC-HP system for the preliminary design...123
5.3.4 Modelling the gas burner and post heater for steady state mode…………..…...124
5.4 Effects of evaporation temperature of HP and ORC cycles on combined system
performance……………………………………………………………………….….127
5.5 Comparison between two layout designs………………………………………..136
5.5.1 First layout: water heated by HP cycle first……………………………………..137
5.5.1.1 Pinch point temperature difference in the HP and ORC condensers………….144
5.5.1.2 Comparison between MATLAB and ASPEN PLUS models…………………...149
5.5.1.3 Modelling the combined cycle with practical ORC evaporation
pressure…………………………………………………………………………..….…152
5.5.1.4 Modelling the combined cycle under PPTD of 10 oC………………………….153
5.5.1.5 Validation of theoretical results with experimental data………………..…….155
5.5.2 Second approach: water heated by ORC cycle first……………………………..157
Table of contents
xii
5.6 Exergy destruction analysis and the second law efficiency………………..……….158
5.7 Control strategies in the combined system when the ambient temperature
varies……………………………………………………………………………………….161
5.7.1 First control strategy…………………………………………………………………161
5.7.2 Second control strategy………………………………………………………………167
5.8 Dynamic modelling to verify the control strategies…………………………...........168
5.8.1 Modelling and results of control strategy one…………………….………………....168
5.8.2 Modelling and results of control strategy two…………………………………..…...172
5.9 Conclusion………………………………………………………………………….....174
Chapter 6 Utilizing the wasted heat from a data centre to cool and heat applications via
the combined ORC-HP system…………………………………………………………..176
6.1 Introduction…………………………………………………………………..………176
6.2 Thermodynamic concept……………………………………………….……….……176
6.3 Modelling of the combined system……………………………………………..……177
6.3.1 Heat pump cycle optimization……………………………………………….…..…...178
6.3.2 ORC cycle optimization…………………………………………………….……..…181
6.3.3 Optimization of the combined cycle under the minimum PPT approach……….…...185
6.4 Superheating the R134a at the compressor inlet……………………………….…..189
6.5 Control strategies for the combined cycle under a variable DC workload…….…189
6.5.1 Strategy one: using the ambient air as a supplementary heat source…………..…...190
6.5.2 Strategy two: using an exhaust stream as a supplementary heat source…………....195
6.5.3 Strategy three: adjusting the combined cycle heating capacity……………….….…199
6.5.4 Strategy four: Optimizing indoor air mass flow………………………………….....204
Table of contents
xiii
6.6 Conclusion………………………………………………………………………..…..209
Chapter 7 Bottoming ORC-HP cycles with DE for refrigeration effects………….…210
7.1 Introduction…………………………………………………………………….….…210
7.2 The concept……………………………………………………………………..…….210
7.3 Modelling the combined system for diesel engine rated condition…………..……210
7.3.1 Modelling the heat source……………………………………………………..…….211
7.3.2 Optimizing the combined system under variable ORC mass flow…………….……..212
7.3.3 The effects of superheating the refrigerant at the ORC evaporator exit…….…........215
7.4 Combining the DE, ORC and HP cycles in the steady state working
condition…………………………………………………………………………………..219
7.5 Modelling the ORC cycle with different working fluids…………………..……….220
7.6 Modelling the combined cycle for variable diesel engine speed and loads………..224
7.6.1 Modelling a diesel engine exhaust stream with an ORC cycle……………….……...224
7.6.2 Utilizing the output expansion net-power in a vapour compression refrigeration
cycle………………………………………………………………………………….…….228
7.6.3 Varying the mass flow rate in the heat pump system…………………………..…….230
7.6.4 Superheating the refrigerant at the evaporator exit……………………….…..…….230
7.7 Optimizing the evaporator cooling load…………………………………..…..…….231
7.7.1 Optimizing the HP evaporator cooling load by varying the air temperature at the
evaporator inlet………………………………………………………………..……..…….231
7.7.2 Optimizing the evaporator cooling load by varying the air mass under a constant
evaporator inlet air temperature……………………………………………….……..........232
7.8 The percentage of cooling load obtained from the DE rejected thermal
energy………………………………………………………………………………….......234
Table of contents
xiv
7.9 Dynamic behaviour and control strategy for the HP employing a TXV
valve……………………………………………………………………………………….234
7.10 Utilizing the oil thermal circuit…………………………………………………….237
7.10.1 Modelling the combined cycle with a thermal oil circuit……………….………….238
7.11 Conclusion……………………………………………………………………….......241
Chapter 8 Conclusion and future work…………………………………………………242
8.1 Summary………………………………………………………………………………242
8.2 Suggested future work………………………………………………………….…......244
8.2.1 Theoretical work.………………………………………………………….…….……244
8.2.2 Experimental work…………………………………………………………..……......245
Appendix A: Combined Gas burner-ORC-HP cycle by ASPENLUS…………….........247
Appendix B: Diesel engine experimental results [178]………..………………………...248
List of References………………………………………………………………………….249
List of Tables
xv
List of Tables
Table 2.1: Comparison of combined DE-ORC cycles at rated condition or maximum DE load
as reported in the literature……………………………………………………………………37
Table 2.2: Summary of previous simulation studies on combined ORC-VCC system………48
Table 2.3: Summary of experimental studies on standalone HP cycle………........................53
Table 2.4: Summary of experimental studies on standalone ORC cycle……........................55
Table 4.1: Working conditions for HP cycle for different working fluids (first
approach)………………………………………………………………………….................105
Table 4.2: Working conditions of the HP cycle for different working fluids (second
approach)…………………………………………………………………..………..……….109
Table 4.3: Working conditions for the ORC cycle for different working fluids (first
approach)………………………………………………………………………….................113
Table 4.4: Working conditions for ORC cycle for different working fluids (second
approach)…………………………………………………………………………………….116
Table 4.5: Environmental indices for the working fluids [67,172]….………………………117
Table 5.1: HP and ORC refrigerant thermophysical properties from MATLAB and ASPEN
PLUS……………...………………………………………………………………….……...123
Table 5.2: HP and ORC cycles design parameters from MATLAB and ASPEN
PLUS………………………………………………………………………………..……….123
Table 5.3: HP and ORC cycles efficiencies…………….….……………………….……….124
Table 5.4: Thermophysical properties of other working fluids in the combined cycle by
MATLAB and ASPEN………………………………………………………………………126
Table 5.5: Combined cycle efficiency parameters and performance…………………………127
Table 5.6: Combined cycle parameters as per ASPEN and MATLAB code………………..150
Table 5.7: Cycle efficiency (first layout)……..……………………………………………..150
Table 5.8: Gas burner design parameters……………………………………........................150
List of Tables
xvi
Table 5.9: Combined cycle results at ORC evaporation pressure of 20 bar….......................153
Table 5.10: Comparison results of the combined cycle parameters at different PPTD……..154
Table 5.11: Combined cycle efficiency at different PPTD…………………………………154
Table 5.12: Validation of theoretical model for the HP cycle………………………………155
Table 5.13: Validation of theoretical model for the ORC cycle…….………………………156
Table 5.14: Steady state results for the second approach………………………......................157
Table 5.15: Combined cycle performance second approach………………………………...157
Table 5.16: Heat, power and exergy loss in the combined system…………………..….…...159
Table 6.1: Combined cycle operating parameters…………………………………………...188
Table 6.2: Cycle efficiency (Data center application)……………………………………….188
Table 6.3: Combined cycle design parameters for control strategy one……………………..195
Table 6.4: Combined system results in control strategy 3 for DC temperature below 20 oC………………………………………………………………………….…………………204
Table 7.1: Steady state results for the combined system bottoming DE…..………….……..219
Table 7.2: Diesel engine working conditions………………………………………………..220
Table 7.3: Different ORC working fluids at different evaporation and condensation
pressures………………………………………………………….………………………….220
Table 7.4: Steady state for the combined cycle utilizing the thermal oil HX
circuit………………………………………………………………………………………..230
List of Figures
xvii
List of Figures
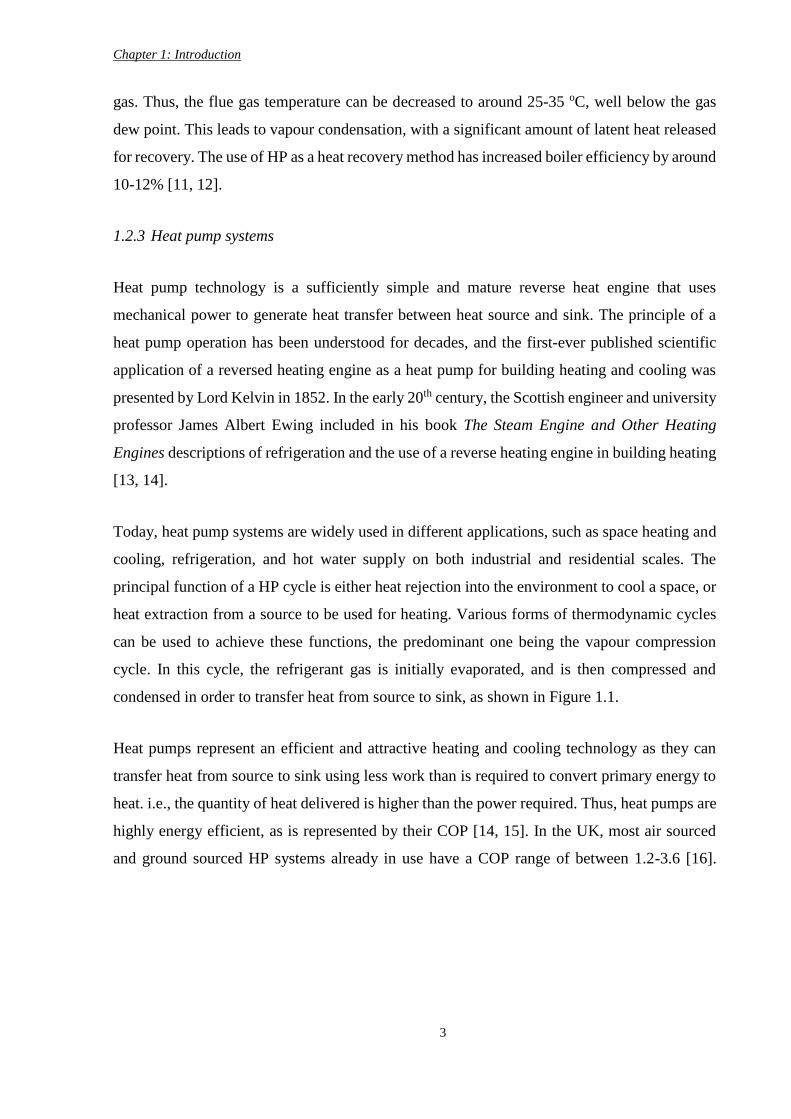
Figure 1.1: A conceptual model of a heat pump (left) and an idealized cycle represented on an
enthalpy-pressure (right) [13]……………………………………………………….………….4
Figure 1.2: Ground source heat pump schematic diagram [24]………………………….……7
Figure 2.1: Schematic of a gas turbine combined CHP cycle [43]……………………………17
Figure 2.2: A packaged internal combustion engine CHP system [44]………………….........18
Figure 2.3: Configuration of the CCHP system with an SE prime mover [46]……………….19
Figure 2.4: Block diagram of the Organic Rankine cycle [48]……………………………….20
Figure 2.5: Schematic diagram of the bottoming ORC of a diesel engine [45]……..…….….28
Figure 2.6: Schematic diagram of combined ORC-VCC refrigeration system [74]…………..38
Figure 2.7: ORC integrated cascade vapor compression-absorption refrigeration system
[81]……………………………………………………………………….…………………...42
Figure 3.1: T-s diagram for a typical refrigeration or (heat pump) cycle [127]…….…………62
Figure 3.2: T-s diagram for water as a working fluid in a conventional Rankine cycle
[127]……………………………………………………………………………………..........65
Figure 3.3: Pinch point in a counterflow heat exchanger……………………………..……...70
Figure 3.4: An example of typical expander performance [97]……………………..…….....72
Figure 3.5: Schematic diagram of the proposed natural gas fuelled water heater system…...85
Figure 3.6 (a): T-s diagram for HP cycle; (b) T-s diagram for ORC cycle………………….85
Figure 3.7: Discretisation scheme for the evaporator and condenser………….…………….93
Figure 3.8: Block diagram of the PID controller of a closed loop…………………….…….97
Figure 4.1: T-s diagram for wet fluids (e.g., R32), isentropic fluids (e.g., R125), and dry fluids
(e.g., R245fa)…………………………………………………………………………….…..99
Figure 4.2: T-s diagram for the HP cycle working fluids…………………………………...101
List of Figures
xviii
Figure 4.3: Effects of condensation temperature on HP-COPh for different working
fluids………………………………………………………………………………….…….102
Figure 4.4: HP-COPh for CO2 under different gas-cooler pressures and exit
temperatures………………………………………………………………………….…….103
Figure 4.5: HP-Condenser heating duty for CO2…………………………………………...103
Figure 4.6: HP-Condenser heating capacity for different refrigerants with condensation
temperature………………………………………………………………………..………..104
Figure 4.7: HP-Condenser heating capacity of ammonia with different condensation
temperature………………………………………………………………………………....104
Figure 4.8: HP-evaporator cooling capacity of different working fluids…………………..106
Figure 4.9: HP-evaporator cooling capacity of CO2………………………………………..106
Figure 4.10: HP-COPc for various refrigerants under various evaporation temperature….107
Figure 4.11: HP-evaporator cooling capacity of various working fluids…………………..108
Figure 4.12: HP-evaporator heating capacity of various refrigerants……………………..109
Figure 4.13: T-s diagram for the ORC cycle working fluids………………………………110
Figure 4.14: ORC-thermal efficiency for various refrigerants………………………….…111
Figure 4.15: ORC-Condenser heating capacity for various refrigerants under different conden-
sation temperatures………………………………………………………………………...112
Figure 4.16: ORC-evaporator heating capacity for various refrigerants under different conden-
sation temperatures………………………………………………………………………...112
Figure 4.17: ORC-thermal efficiency for various refrigerants under different evaporation
temperatures………………………………………………………………………..……....114
Figure 4.18: ORC-evaporator heating capacity for various refrigerants under different
evaporation temperatures…………………………………………………………..….…...115
Figure 4.19: ORC-condenser heating capacity for various refrigerants under different
evaporation temperatures………………………………………………….…………..…...115
Figure 5.1: Schematic diagram of the proposed natural gas fuelled water heater
system…………………………………………………………………………………..….120
List of Figures
xix
Figure 5.2: Temperature-Entropy diagrams of both the ORC (Hexane) and heat pump cycle
(R134a)………………………………………………………………………………………121
Figure 5.3: CH4 and O2 mass fraction in the burner exhaust under variable air mass flow entering
the burner………………………………………………………………………….…….......125
Figure 5.4: Increasing air mass flow against burner thermal capacity and air to fuel
ratio……………………………………………………………………………………….....126
Figure 5.5: Effect of changing HP evaporation temperature on compressor work and
COPh…………………………………………………………………………………………128
Figure 5.6: Effect of changing HP evaporation pressure on HP heating capacities…..…....128
Figure 5.7: Varying the Hexane mass flow as a function of varying the HP evaporation
temperature and the ORC evaporation pressure……………………………………......……129
Figure 5.8: Effect of changing the HP evaporation temperature and the ORC pressure on the
ORC condenser’s thermal capacity………………………………………………..…….......130
Figure 5.9: Effect of changing the HP evaporation temperature and the ORC pressure on the
final water temperature ……………………………………………………….. …….…......131
Figure 5.10: ORC thermal efficiency as a function of ORC evaporation pressure…….……132
Figure 5.11: Variation in natural gas needed due to changes in evaporation temperatures and
pressure of HP and ORC cycles……………………………………………………….……..132
Figure 5.12: Fuel to heat efficiency as a function of varying HP and ORC evaporation
temperature and pressure……………………………………………………………….……133
Figure 5.13: Heat capacities of the three heat exchangers………………………………......134
Figure 5.14 (a,b,c and d): Share of heat supply by the three heat exchangers under different
operational conditions………………………………………………………………….……135
Figure 5.15: Combined cycle configuration for hot water supply………………………......137
Figure 5.16: HP-condenser heating duty and condensation pressure………………………...138
Figure 5.17: PH diagram for R134a HP cycle under variable condensation pressure….......138
Figure 5.18: Effects of increasing HP condensation pressure on COPh and water temperature
leaving the cycle………………………………………………………………….………….139
List of Figures
xx
Figure 5.19: R245fa mass flow under variable ORC and HP condensation
pressure…………………………………………………………………………………..140
Figure 5.20: ORC-Condenser heating duty under variable ORC and HP condensation
pressure…………………………………………………………………………………...140
Figure 5.21: ORC-thermal efficiency under variable ORC-condensation pressure……..141
Figure 5.22: Water temperature at ORC exit under variable ORC and HP condensation
pressures………………………………………………………………………………….142
Figure 5.23: Combined cycle total heating capacity under variable ORC and HP condensation
pressure……………………………………………………………………….……….…142
Figure 5.24: CH4 mass flow under variable ORC and HP condensation pressure………143
Figure 5.25: Fuel to heat efficiency under variable ORC and HP condensation
pressures………………………………………………………………………………….144
Figure 5.26: HP condensation temperature and pressure under variable Tw-exit-HP………145
Figure 5.27: HP compressor work and COPh under variable Tw-exit-HP…………………..146
Figure 5.28: R134a and R245fa mass flow under variable Tw-exit-HP…………………….146
Figure 5.29: Effects of varying Tw-exit-HP on the ORC condenser pressure and thermal
efficiency…………………………………………………………………………………147
Figure 5.30: Total system thermal capacity and final water temperature under variable Tw-exit-
HP………………………………………………………………………………….………148
Figure 5.31: Fuel to heat efficiency and CH4 mass flow under variable Tw-exit-HP………148
Figure 5.32: T-Q curve across the HP condenser………………………………………...151
Figure 5.33: T-Q curve across the ORC condenser………………………………………152
Figure 5.34: Exergy destruction in each component of the HP cycle……………………158
Figure 5.35: Exergy destruction in each component of the ORC cycle………………….159
Figure 5.36: Second law of efficiency for the HP cycle under variable HP condensation
pressures………………………………………………………………………………….160
List of Figures
xxi
Figure 5.37: Second law of efficiency for the ORC cycle under variable ORC condensation
pressure……………………………………………………………………………………161
Figure 5.38: Effects of ambient temperature on evaporator design parameters………….162
Figure 5.39: Effects of air temperature on Methane mass flow…………………………..163
Figure 5.40: Effects of increasing ambient air mass on the HP evaporator and condenser
thermal duties…………………………………………………………………………….163
Figure 5.41: Effects of increasing ambient air mass flow on compressor work and superheat
degree…………………………………………………………………………………….164
Figure 5.42: Temperature difference between hot and cold streams across the HP
evaporator………………………………………………………………………………...165
Figure 5.43: Effects of decreasing ambient air temperature on system design
parameters………………………………………………………………………………..166
Figure 5.44: Effects of ambient air temperature on outlet water temperature and fuel to heat
efficiency…………………………………………………………………………………166
Figure 5.45: Effects of ambient temperature below 6 oC on Methane mass flow……….167
Figure 5.46: Schematic diagram of the dynamic model for control strategy one…….….169
Figure 5.47: Variation of the ambient air temperature over the time lapse……………...169
Figure 5.48: PID controller performance for ambient temperature range 6-15 oC………170
Figure 5.49: Variations in suction line temperature over the time lapse…………………171
Figure 5.50: Variations in evaporator cooling capacity over the time lapse……………..171
Figure 5.51: Schematic diagram of the dynamic model for control strategy two………..172
Figure 5.52: PID controller performance for ambient temperature range -5 to 5 oC…….173
Figure 5.53: Variations of the ambient air temperature over the time lapse……………..173
Figure 5.54: Variation in burner exhaust temperature over the time lapse………………174
Figure 6.1: Combined cycle configuration for DC application.………………………….177
List of Figures
xxii
Figure 6.2: Effects of variations in R134a mass and condensation temperature on HP
evaporator capacity………………………………………………………………………178
Figure 6.3: Effects of variations in R134a mass and condensation temperature on HP
condenser capacity……………………………………………………………………….179
Figure 6.4: Effects of variations in R134a mass and condensation pressure on compressor
network…………………………………………………………………………………..180
Figure 6.5: Effects of HP discharged pressure on COPc and COPh……………………..180
Figure 6.6: Effects of HP discharged pressure on COPc and COPh……………………..181
Figure 6.7: Effects of increasing R245fa mass flow and HP condensation temperature on ORC
condenser heating duty………………………………………………………………..…182
Figure 6.8: Effects of increasing R245fa mass flow and HP condensation temperature on total
heat capacity added to water……………………………………………………….…….183
Figure 6.9: Fuel to heat efficiency of the combined cycle under variable HP condensation
temperature………………………………………………………………………………183
Figure 6.10: Methane mass flow of the combined cycle under variable ORC mass flow and
HP condensation temperatures…………………………………………………………..184
Figure 6.11: Effect of HP condensation temperature on water temperature and mass flow
rate……………………………………………………………………………………….185
Figure 6.12: Optimization results across the ORC condenser…………………………..186
Figure 6.13: Effect of ORC condenser pressure on CH4 mass flow and fuel to heat
efficiency………………………………………………………………………………..187
Figure 6.14: Evaporator cooling duty under variable evaporator inlet temperature…….189
Figure 6.15: Combined cycle configuration with double HP evaporator……………….191
Figure 6.16: Split mass fraction for R134a through the indoor evaporator……………..191
Figure 6.17: Thermal capacities for both HP cycle evaporators………………………...192
Figure 6.18: Total HP evaporators capacity and total heat added to the water in control
strategy one……………………………………………………………………………....193
List of Figures
xxiii
Figure 6.19: Fuel to heat efficiency and final water temperature in control strategy
one……………………………………………………………………………………….194
Figure 6.20: Evaporator outlet temperature to DC inlet temperature control strategy
one……………………………………………………………………………………….194
Figure 6.21: Combined cycle configuration with superheat heat exchanger…………….196
Figure 6.22: PID controller performance in control strategy two………………………..196
Figure 6.23: HP cycle heat exchangers capacities in control strategy two………………197
Figure 6.24: DC inlet and outlet temperature in control strategy two……………………198
Figure 6.25: Fuel to heat efficiency in control strategy two………………………….….198
Figure 6.26: R134a mass flow optimization in control strategy three…………………...199
Figure 6.27: HP compressor work and condenser heat capacity in control strategy
three………………………………………………………………………………………200
Figure 6.28: Optimization of R245fa mass flow and ORC expansion power in control strategy
three………………………………………………………………………………..……..201
Figure 6.29: Total system heating capacity and water mass in control strategy three…...202
Figure 6.30: Outlet water temperature and air temperature as per variations in the inlet
evaporator temperature…………………………………………………………………..203
Figure 6.31: Effects of optimizing air mass flow on suction line temperature in strategy
four………………………………………………………………………………………205
Figure 6.32: DC room temperatures obtained from the fourth approach………………..206
Figure 6.33: Evaporator and superheat heat exchanger thermal capacities for fourth
approach………………………………………………………………………………….207
Figure 6.34: Methane mass flow and fuel to heat efficiency for the fourth approach…..208
Figure 7.1: Combined system configuration for recovering heat from the diesel engine exhaust
stream……………………………………………………………………………………211
Figure 7.2: Relation between vapour fraction and ORC evaporator capacity under variable
temperatures of the DE exhaust stream out………………………………………………212
List of Figures
xxiv
Figure 7.3: Relation between ORC expander power and thermal efficiency under variable
ORC mass flow…………………………………………………………………………..213
Figure 7.4: Relation between ORC turbine temperature and condenser thermal capacity under
variable ORC mass flow………………………………………………………………….213
Figure 7.5: Relation between HP condenser thermal capacity and R134a mass flow under
variable ORC mass flow………………………………………………………………….214
Figure 7.6: Relation between HP evaporator thermal capacity and conversion ratio under
variable ORC mass flow………………………………………………………………….215
Figure 7.7: Effects of superheating ORC refrigerant at expander inlet on turbine power and
ORC mass flow…………………………………………………………………………..216
Figure 7.8: Effects of superheating the ORC refrigerant at the expander inlet on turbine power
and ORC mass flow………………………………………………………………..…….217
Figure 7.9: Effects of superheating the ORC refrigerant at the expander inlet on HP condenser
thermal capacity and working fluid mass flow……………………………………….….217
Figure 7.10: Effects of superheating the ORC refrigerant at the expander inlet on HP
evaporator thermal capacity and the heat to refrigeration conversion ratio……………...218
Figure 7.11: Comparison results of expander power for different ORC working fluids when
the temperature at the turbine inlet is increased………………………………………….221
Figure 7.12: Comparison results of thermal efficiency for different ORC working fluids when
temperature at turbine inlet is increased………………………………………………....222
Figure 7.13: Comparison results of mass flow for different ORC working fluids when
temperature at turbine inlet is increased………………………………………………….222
Figure 7.14: Comparison results of percentage of thermal heat recovered to refrigeration
effect for different ORC working fluids when temperature at the turbine inlet is
increased………………………………………………………………………………….223
Figure 7.15: Variable DE exhaust stream temperature under variable engine load
percentages……………………………………………………………………………….224
Figure 7.16: Variable DE exhaust stream mass flow under variable engine load
percentages……………………………………………………………………………….225
Figure 7.17: T-Q curve for the ORC evaporator for variable exhaust stream outlet
temperatures……………………………………………………………………………..226
List of Figures
xxv
Figure 7.18: Variations in ORC turbine net-power under variable diesel engine load and
rotation speed……………………………………………………………………………227
Figure 7.19: Variations in ORC R123 mass flow under variable diesel engine load and
rotation speed……………………………………………………………………………227
Figure 7.20: Variations in the R134a mass flow rate due to variable diesel engine power and
rotation speeds…………………………………………………………………….…….229
Figure 7.21: HP evaporator cooling capacity via variable diesel engine load and
speeds…………………………………………………………………………………….229
Figure 7.22: HP evaporator inlet air temperature via variable diesel engine loads and
speeds…………………………………………………………………………………….231
Figure 7.23: HP evaporator air mass flow via variable DE loads………………………..232
Figure 7.24: The effect of DE load on the percentage of thermal energy converted into cooling
load………………………………………………………………………………………233
Figure 7.25: Configuration of the control strategy for a variable HP load………………234
Figure 7.26: PID controller performance………………………………..………………235
Figure 7.27: Variable evaporator cooling loads in dynamic mode………………………236
Figure 7.28: Air temperature at evaporator inlet and exit in dynamic evaluation……….236
Figure 7.29: Combined system configuration for recovering heat from the diesel engine
exhaust stream with a thermal oil circuit………………………………………..…….….237
Figure 7.30: ORC evaporator thermal capacity and turbine power under variable thermal oil
mass flow………………………………………………………………………….……..238
Figure 7.31: T-Q curve for the thermal oil HX under variable thermal oil mass flows….239
List of Symbols
xxvi
List of Symbols
Symbols Description
𝐴𝑟𝑐𝑠 Refrigerant cross section area
Bo Boiling Number
C Kinetic energy
Co Convection Number
Cp Specific heat
D Pipe diameter
f Friction Factor
Frl Froude Number
g Gravity
h Specific Enthalpy
ℎ Molar Enthalpy of substance
ℎ𝑜 Molar Enthalpy of substance at reference state
ℎ𝑓𝑜 Molar Enthalpy of combustion
I Exergy destruction
k Thermal Conductivity
�� Mass flow rate
N Number of Moles
Nu Nusselt Number
P Pressure
Pcr Critical pressure
Pr Prandtl Number
Re Reynolds Number
s Specific Entropy
Q Heat
t Wall thickness
T Temperature
U Total heat coefficient
Vr Refrigerant volume
List of Symbols
xxvii
W Work
x Quality
Zg Potential energy
α Heat Transfer Coefficient
β Plate Chevron Angle
μ Dynamic Viscosity
ν Kinematic Viscosity
ρ Density
𝜇 Efficiency
Subscripts
evap Evaporator
ref Refrigerant
cond Condenser
mix Mixture
P Products
R Reactants
w Water
cw Cold water
cs Cold stream
HS Hot stream
inj Injection
suc Suction
exh Exhaust
Abbreviations
xxviii
Abbreviations
AC Air conditioner
ALT Atmospheric lifetime
AR Absorption Refrigeration
CCHP Combined cooling, heating and power
CHP Combined heat and power
COP Coefficient of performance
COPS Coefficient of performance of a system
CRS Cascade refrigeration system
DC Data center
DE Diesel engine
GSHP Ground source heat pump
GPHP Gas powered heat pump
GWP Global warming potential
HP Heat pump
HPGHP Hybrid powered gas engine heat pump
HXs Heat exchangers
ICE Internal combustion engine
LMTD Logarithm means temperature difference
LPG Liquefied petroleum gas
ORC Organic Rankin cycle
PCM Phase change material
PEMFC Proton exchange membrane fuel cell
PPTD Pinch point temperature difference
ODP Ozone depletion potential
SE Stirling Engine
Chapter 1: Introduction
1
Chapter 1: Introduction
1.1 Overview
Over the last decade, dependence on fossil fuel as an energy source has increased remarkably.
It is estimated that overall global oil consumption in 2010 was around 86.4 million barrel/day.
However, the daily demand for crude oil has been predicted to reach over 100 million barrel/day
by 2019 [1]. This growth in demand leads to various environmental and economic challenges,
as fossil fuel usage has numerous major impacts such as acid precipitation, ozone layer damage,
resource depletion, and global warming [2]. Fossil fuel combustion contributes to around 65%
of total global greenhouse gas emissions. Coal, oil, and natural gas produce 45%, 35% and 20%
of these emissions respectively [3]. The depletion of fossil fuel reserves and ever-increasing
prices are further future challenges. To overcome these challenges, two main approaches can
be taken: to develop and enhance the use of alternative energy sources, especially renewable
energy sources such as solar, geothermal, wind, biomass and waste heat, and to enhance the
energy efficiency of existing technologies [4].
1.2 Available heating technologies
1.2.1 Electric heaters
Electric heaters are among the most readily available heating technologies that produce heat
from electricity by thermal resistance. Although their use is gradually declining due to more
advanced heating technology, they are still a viable option in areas where electricity production
is both low cost, and comes with low greenhouse gas emissions. For instance, in
Québec/Canada, 98% of electricity produced by hydro-electric dams, so electric heaters are an
attractive low-cost residential heating choice [5].
It is well known that electric heaters can convert nearly 100% of the supplied electricity into
heat. Balke, E. et al. [6] conducted an experimental and theoretical study on various residential
water heating technologies including solar thermal, heat pump (HP), electric resistive heaters,
and combinations of them. Although the results showed that electric heaters achieved the lowest
coefficient of performance (COP) of 0.95, they achieved quite steady performance over the
Chapter 1: Introduction
2
course of a year, with mild decline in performance during summer months due to the reduction
in heat load with the higher input water temperature and without a proportional change in total
energy consumption. In contrast, a solar thermal preheat tank supplying HP water heater
achieved a COP of 2.87 compared to 1.9 for HP alone.
1.2.2 Gas Boilers
A gas boiler is a popular choice for district heating, particularly in countries where natural gas
represents a significant energy source. For instance, in Europe, 80% of energy is provided by
natural gas [7], while in Beijing/China, 11.6 billion cubic meters of natural gas were utilised in
2015 for district heating in winter [8]. Conventional gas boilers have an energy efficiency of
around 90%, with a significant amount of heat rejected in the form of flue gases [9]. The
emission flue gas temperature ranges between 150-200 oC, which holds about 10-12% of the
fuel’s lower caloric value [9, 10]. Recovering heat from the boiler exhaust stream (in a
condensing boiler) therefore has the potential to improve the boiler’s efficiency and decrease
CO2 emissions by reducing natural gas consumption. Since natural gas is a high hydrogen
compound, its combustion will generate water vapour with a latent heat occupying
approximately 70-80% of the overall exhaust heat [8, 10]. However, to recover heat from this
latent heat loss, the flue gases need to be cooled down to a temperature below the dew point,
which is around 55 oC.
Three main heat recovery methods have been proposed in the literature: economizer, air
preheater, and heat pump. Economizers use the boiler’s returnee water as a cold source with
which to exchange heat with the exhaust stream. However, the boiler feed water temperature
usually ranges between 45-60 oC, which is close to the flue gas condensation point, thus limiting
the amount of heat recovery [8, 10]. Since most latent heat is still in the flue gas, the boiler
efficiency improvement achieved is small, at about 2%, making overall efficiency
approximately 93% [9, 10]. An air preheater is another method for flue gas heat recovery. It
uses a boiler’s oxidising air to cool the flue gas. In addition to heat exchange, the flue gas
undergoes phase change, while the air has no phase change. This leads to incompatible thermal
capacity between the two streams, which will limit the heat recovery capacity [8, 10]. The most
promising method for flue gas heat recovery is the use of HPs. The heat pump is used to generate
cold water at between 20-30 oC, which is used as a cold source to exchange heat with the flue
Chapter 1: Introduction
3
gas. Thus, the flue gas temperature can be decreased to around 25-35 oC, well below the gas
dew point. This leads to vapour condensation, with a significant amount of latent heat released
for recovery. The use of HP as a heat recovery method has increased boiler efficiency by around
10-12% [11, 12].
1.2.3 Heat pump systems
Heat pump technology is a sufficiently simple and mature reverse heat engine that uses
mechanical power to generate heat transfer between heat source and sink. The principle of a
heat pump operation has been understood for decades, and the first-ever published scientific
application of a reversed heating engine as a heat pump for building heating and cooling was
presented by Lord Kelvin in 1852. In the early 20th century, the Scottish engineer and university
professor James Albert Ewing included in his book The Steam Engine and Other Heating
Engines descriptions of refrigeration and the use of a reverse heating engine in building heating
[13, 14].
Today, heat pump systems are widely used in different applications, such as space heating and
cooling, refrigeration, and hot water supply on both industrial and residential scales. The
principal function of a HP cycle is either heat rejection into the environment to cool a space, or
heat extraction from a source to be used for heating. Various forms of thermodynamic cycles
can be used to achieve these functions, the predominant one being the vapour compression
cycle. In this cycle, the refrigerant gas is initially evaporated, and is then compressed and
condensed in order to transfer heat from source to sink, as shown in Figure 1.1.
Heat pumps represent an efficient and attractive heating and cooling technology as they can
transfer heat from source to sink using less work than is required to convert primary energy to
heat. i.e., the quantity of heat delivered is higher than the power required. Thus, heat pumps are
highly energy efficient, as is represented by their COP [14, 15]. In the UK, most air sourced
and ground sourced HP systems already in use have a COP range of between 1.2-3.6 [16].
Chapter 1: Introduction
4
Various types of heat source are used in the HP cycle, such as air, ground source, water, and
solar, as will be discussed in more detail later in this chapter.
1.2.4 Combined heat and power systems (CHP)
Combined heat and power (CHP) are integrated systems which simultaneously produce
electricity and heating from a single energy source. The energy source can be from fossil fuels
(e.g. natural gas or coal), nuclear fuel, or renewable sources (e.g. geothermal, solar, or biomass).
Combined cooling, heating and power (CCHP) is slightly different from CHP in that it also
produces an additional cooling effect. A CHP system can convert 60-80% of the primary energy
source into useful thermal energy [17, 18]. Generally, there are two types of CHP: topping cycle
and bottoming cycle. In a topping cycle, the fuel is used to mainly generate electricity, with the
additional heat generated used for additional applications such as industrial processes if high
grade heat is generated, or space heating and hot water supply using low grade heat. In the
bottoming cycle, heat production is the primary application and any extra-energy not used for
heating is converted into electricity. CHP usually consist of a prime mover such as an Organic
Rankine cycle (ORC) or a Stirling engine (SE), etc. and a heat recovery system (usually a heat
exchanger) [19]. The different types of prime mover used in CHP systems are discussed in
chapter two.
Figure 1.1: A conceptual model of a heat pump (left) and an idealized
cycle represented on an enthalpy-pressure (right) [13].
Chapter 1: Introduction
5
1.3 Types of heat sources
Various types of environmental heat source have been used in HP, ORC and CHP cycles, such
as air, water, ground, waste heat and solar.
Ideally, a heat source should have the following properties:
• High and stable temperature during the various seasons
• Widely available
• Not corrosive or pollutant
• Favourable thermophysical properties
• Low investment and operation costs
1.3.1 Air source
Air is an attractive heat source as it is free and readily available, and when used as a heat source,
the heat exchanger can be compact, with low thermal resistance. Thus, the system can be more
economical in terms of capital cost. However, some challenges arise when air is used; for
instance, air is more volatile than other heat sources, leading to fluctuations in system
performance with ambient temperature variations. Furthermore, in a HP cycle, the moisture in
ambient air can lead to frost formation on the evaporator, particularly when temperatures fall
below 2-5 oC. This will require a reversal of the heat pump cycle or the use of other energy
consuming means to defrost the exchanger, leading to degraded performance [13, 14]. In a cold
climate, the capacity of the HP can decline dramatically with colder outdoor temperatures,
particularly for ambient temperatures in the sub-zero region where the heating load is required
the most. In this situation, an alternative heating source is frequently required, such as exhaust
air.
Chapter 1: Introduction
6
1.3.2 Waste heat sources
Waste heat is a viable heat source which can offer various temperature ranges. It is also a free
energy source that would otherwise be wasted in the environment. Its recovery is capable not
only of enhancing system performance, but also aiding the reduction of greenhouse gas
emissions.
Various forms of waste heat have been used in the literature, such as exhaust air from a
ventilation system, flue gases from combustion process, data centre (DC) waste heat, and
others. Hebenstreit, B. et al. [12] showed that using HP cycle for waste heat recovery from a
biomass boiler has both environmental and economic benefits. The study showed that operation
costs decreased by approximately 2-13 %. Likewise, waste heat recovered from a coal fired
power plant flue gases via a condensing heat exchanger has the advantage of increasing the
longevity of the equipment and reducing the dust (residual particles) in the flue gases, which
can have a positive environmental impact [20]. Wei, M. et al. [10] conducted an experimental
study on a vapour compression heat pump for waste heat recovery from a boiler’s exhaust
stream. The use of vapour HP improved boiler efficiency by over 10%, with the flue gas
temperature reduced to below 30 oC.
Oró, E., et al [21] proposed the use of DC wasted heat to heat water in a nearby swimming pool.
In this design, the heat is transferred through water to water heat exchangers and the returnee
water temperature is used to cool the DC. The results showed that recycling wasted heat can
reduce natural gas consumption by approximately 54%, with an associated redaction in
operational expenses of 16%. In another study, a vapour compression heat pump system was
proposed for DC waste heat recovery [22]. The HP cycle is used to upgrade the temperature of
the wasted heat up to 70 oC, which could be convenient for domestic hot water and district
heating networks. The COP achieved ranged between 3-6 for different wasted heat stages
recovered by various heat pump configurations.
Ebrahimi, K. et al. [23] conducted a thermodynamic and economic analysis of an ORC module
for DC waste heat recovery for electricity production. The results show that R134a and R245fa
as IT server coolant and ORC refrigerant respectively had the best thermal efficiency for the
selected DC operating conditions.
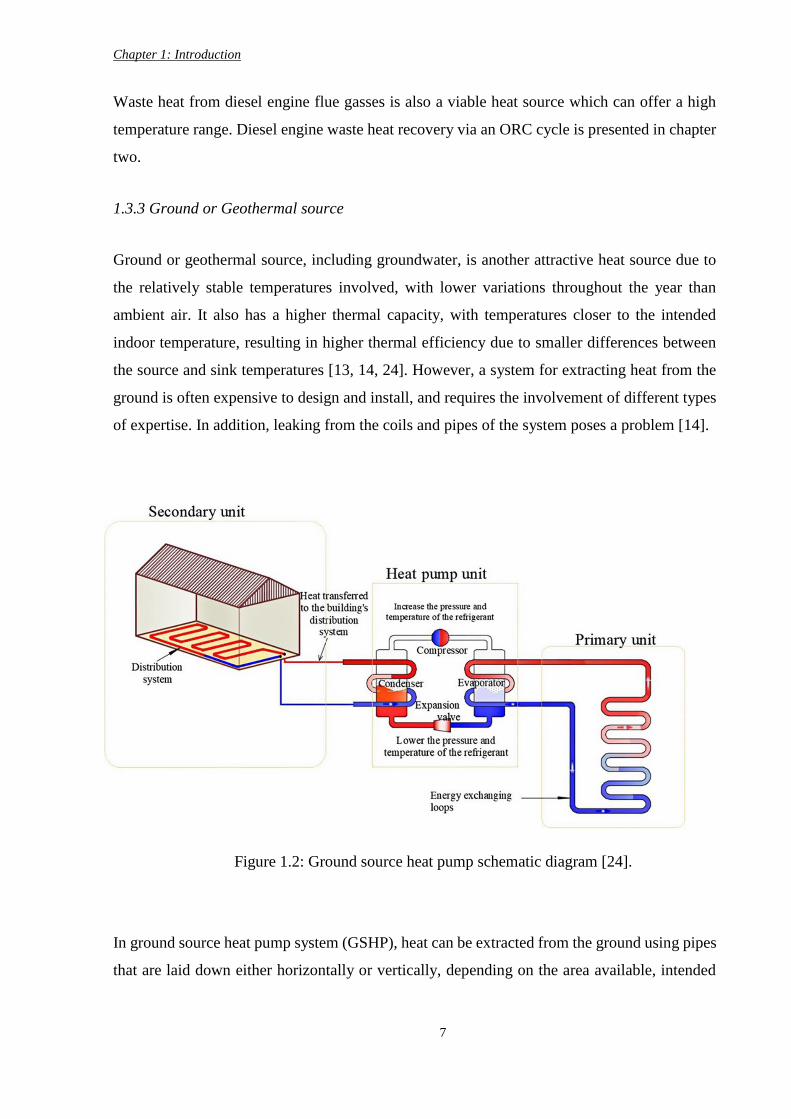
Chapter 1: Introduction
7
Waste heat from diesel engine flue gasses is also a viable heat source which can offer a high
temperature range. Diesel engine waste heat recovery via an ORC cycle is presented in chapter
two.
1.3.3 Ground or Geothermal source
Ground or geothermal source, including groundwater, is another attractive heat source due to
the relatively stable temperatures involved, with lower variations throughout the year than
ambient air. It also has a higher thermal capacity, with temperatures closer to the intended
indoor temperature, resulting in higher thermal efficiency due to smaller differences between
the source and sink temperatures [13, 14, 24]. However, a system for extracting heat from the
ground is often expensive to design and install, and requires the involvement of different types
of expertise. In addition, leaking from the coils and pipes of the system poses a problem [14].
In ground source heat pump system (GSHP), heat can be extracted from the ground using pipes
that are laid down either horizontally or vertically, depending on the area available, intended
Figure 1.2: Ground source heat pump schematic diagram [24].
Chapter 1: Introduction
8
system use, and cost. GSHP system can utilise a geothermal source temperature of up to 73 oC
for district heating [25]. Generally, GSHP is composed of a primary unit (heat exchanger), a
secondary unit (network of underfloor pipes for heat distribution), and a heat pump unit, as
shown in Figure 1.2 [24]. GSHP can also be classified into open loop and closed loop systems
based on the connection between the ground heat exchanger and the HP unit. In an open loop
system, groundwater is pumped through the HP to extract heat, while in a closed loop system,
a heat carrier fluid is used as intermediate medium between the ground and the working fluid,
for example water, water with biocide, antifreeze, or a saline solution [24, 26].
Zhen, J. et al. [27] carried out field measurements on a groundwater sourced heat pump system
designed for an airport on the Tibetan plateau, and compared the results with an existing HP in
the same region. The results showed that GSHP can achieve a higher and more stable COP of
around 5 compared to a COP of between 1.98-2.89 for an air sourced heat pump. Three years
of data from a large scale GSHP for a building at De Montfort University/UK showed
satisfactory system performance with a seasonal performance factor of between 2.49-2.97. In
addition, the fluctuations in the ground loop average fluid temperature were relatively minimal
compared to air temperature variations over the course of the year [28].
For a geothermally driven ORC cycle, the cycle configuration can be either a binary or a single
cycle design. In a binary geothermal power plant, heat from the geothermal fluid is exchanged
with the ORC working fluid via the evaporator. While in a single cycle, the ORC working fluid
draw the heat directly from the geothermal heat source. Liu X. et al [29] investigate the
performance of an ORC cycle with R245fa under difference geothermal heat source inlet
temperature (80-180 oC). The results showed that the ORC cycle can produce a net power output
between 0.473-17.05 kW and an overall efficiency of around 8%. The performance of an ORC
cycle with R245fa and two stage evaporation designed for geothermal power production is
presented by Li, T. et al [30].The results showed that two stage ORC can produce more power
output than single stage evaporation process, particularly for the intermediate geothermal water
temperature of 105 oC.
Chapter 1: Introduction
9
1.3.4 Water source
Water is another good heat source with relatively steady temperature compared to air. Various
source of water can be used, such as surface water, groundwater (which can be considered a
geothermal source), seawater, and wastewater. Surface water sources such as rivers and lakes
are good heat sources in principle, but have the limitation of low temperatures in winter months
(between 2-4 oC), with a risk of freezing and consequent frosting on the evaporator. In contrast,
seawater can have a temperature of around 5-8 oC, with a very low risk of freezing. However,
its use is usually limited to medium-large scale heat pump installations. Fouling is another
drawback of seawater use, which requires the use of corrosion-resistant heat pump parts [14,
31].
Wastewater is another attractive source due to its relatively high and constant temperature
performance over the course of a year. Examples of wastewater are public sewage water,
industrial effluents, cooling water from power plants or industrial processes, etc. [32, 33].
Similar to seawater, wastewater can also cause fouling deposits on the heat exchangers resulting
in reductions in performance, and it may even block the heat exchanger [32].
Liu, Z. et al. [34] conducted an evaluation of a river water sourced HP system used in an energy
station in Shanghai/China. The results supported a linear relationship between river water and
air temperature throughout the year. In winter heating mode, the COP of the HP unit alone and
the overall COP of the system (including the river water pump power consumption) were 7.4
and 5.2, respectively. In cooling mode, the COP values were 6.5 and 2.6, respectively.
Similarly, Zou and Xie [35] also reported that lake water temperature has a linear relationship
with air temperature. In their experimental study, a lake water sourced HP used in a university
building achieved average COP values of 4.27 and 3.81 for cooling and heating modes,
respectively.
1.3.5 Solar source
Solar heat source systems can have similar behaviour to air source systems in terms of
variability of performance and low efficiency in certain circumstances. However, in contrast to
air, which is free source, solar heat is usually costly to obtain. In addition, an additional back-
up or storage system is often required with solar source due to its dependency on daily
Chapter 1: Introduction
10
irradiation levels. It is therefore mostly used as a supporting system to an existing heating
technology [36, 37].
Energy and exergy analysis has been carried out on a novel solar driven combined heat and
power system [38]. The combined ORC- absorption HP system is totally dependent on solar as
the primary energy source. The results showed that the cooling power increased by 48.5% by
adopting the double effect absorption chiller. Simultaneously, in spite of a fall in net power
production by 27%, the combined system heat and power efficiency increased by 96% as a
result of the 20.5% rise in heating power. Also, the solar collectors had the highest exergy
destruction rate among all system components.
A thermal energy storage (TES) system integrated with an ORC power cycle driven by a non-
concentrated solar array collector has also been designed and examined [39]. A mathematical
evaluation was carried out to compare and contrast the climates of Cyprus and the UK over
specific months (January, April and July). The results showed that by using evacuated flat-plate
collectors, the solar-CHP system achieved 4.4-6.4% solar to electricity conversion efficiency
in the UK, and 6.3-7.3% in the Cyprus.
A hybrid combined heating and power system was proposed by Wang and Yang [40]. The
system consists of a biomass gasification subsystem to power an internal combustion engine
for electricity generation. Exhaust gas from the ICE is used to drive an absorption chiller, which
is used to produce chilled water while the wasted heat from the biomass gasification process
and ICE assisted by the solar evacuated collector are used to supply hot water. The results
showed that the proposed combined system achieved a primary energy ratio and exergy
efficiency of 57.9% and 16.1%, respectively. In addition, the reduction in carbon dioxide
emissions was 95.7%.
Chapter 1: Introduction
11
1.4 Challenges in existing heating technologies
The main challenges encountered in existing heating technologies can be summarized as follow:
1. Electric heaters can achieve a maximum COP of 1 with limited options of development due
to the simplicity in design and work concept.
2. In a gas burner, a significant amount of heat is rejected in the flue gases, which will limit
the system thermal efficiency to around 90% for most condensed gas boilers.
3. The main challenge faced by an air source HP system can be summarized as follow:
• The fluctuation in system performance with ambient air variations on daily and
seasonal bases. As ambient temperature declines, the temperature lift across the HP
cycle will rise, leading to a reduction in the COP.
• A low ambient temperature can result in frost formation on the HP evaporator,
leading to further reductions in performance.
• Furthermore, in a HP cycle used for hot water supply, the required water temperature
is often high (usually above 65 oC to ensure the death of any legionella bacteria).
Such a high temperature will reduce the COP of the system, as high discharge
pressure is required.
• An electrically driven HP system experiences energy losses during electricity
transmission through the power grid. This will reduce the system’s overall fuel to
heat efficiency.
4. In a standalone ORC power plant, not all the heat produced can be converted into useful
mechanical work because part of the heat should be rejected into the environment as wasted
heat in order to satisfy the second law of thermodynamic.
Chapter 1: Introduction
12
5. In CHP system producing multi energy modes such as power, heating and cooling demands,
can face challenges in balancing between these energy modes particularly during the various
seasons of the year.
1.5 Motivation for the present work
The motivation behind the current study is to design and investigate a combined system that
can overcome the challenges faced by standalone HP, ORC and gas burner as follow:
• To overcome ambient temperature fluctuation in HP system, a mixture of ambient air and
gas burner flue gases is used to feed the heat pump evaporator. This can also ensure that
frost formation on the evaporator is prevented.
• To avoid the high temperature lift in the HP system, water heating is designed to occur in
two stages, through HP and ORC condensers respectively. This will reduce the discharge
pressure required for the HP cycle and maintain a high COP.
• In the combined system, all the mechanical power produced from the ORC power plant
will be transferred by direct coupling with the HP cycle to be transformed into heat energy.
This will eliminate both the electric generator of the ORC system and the electric motor of
the HP, thereby avoiding electrical transmission losses.
• By recovering all the heat rejected in the gas burner exhaust stream, the gas burner
efficiency is expected to improve. In addition, the rejected heat from the ORC cycle is
totally recovered. This will improve the overall fuel to heat efficiency of the combined
system.
Chapter 1: Introduction
13
1.6 Aims of this research
The aims of this research is to theoretically investigate a gas driven combined ORC-HP system
as follow:
• Comparing different working fluids for HP and ORC cycles respectively in terms of
efficiency, safety and environmental aspects.
• Investigating and comparing the combined system performance using different
configurations, including combined system with and without post heater, a combined
system with HP condenser as the first heating stage and a system with ORC condenser
as the first heating stage.
• Investigating the combined system for the following applications: domestic hot water
supply, data centre cooling with simultaneous central heating, and providing
refrigeration load from diesel engine waste heat.
• Implementing various control strategies to achieve the maximum obtainable combined
system thermal efficiency when working conditions varies. These working conditions
includes variations in ambient air temperature, Data centre workload, and diesel engine
power production.
To achieve these, the combined cycle has been thermodynamically analysed in terms of the first
and second laws of thermodynamics. An in-house MATALB code is developed for this purpose
and the results are compared and validate with that obtained from ASPEN PLUS software [41].
In both simulation models, REFPROP database [42] is used to obtain the thermophysical
properties of the working fluids to ensure accurate comparison of the obtained results.
1.7 Outline of the thesis
A brief introduction of the available heating technologies with their used heat sources and prime
movers has been provided in this chapter. An extensive literature review of the various
combined heat and power cycles that have been used in different applications is presented in
Chapter 1: Introduction
14
chapter two. This literature review is used as guidance with which to understand the
thermodynamic principles and concepts behind each of these technologies, their design
methodology and optimisation approaches, and as verification for the current research. Chapter
three demonstrates the theoretical laws and mathematical equations adopted in this work.
Chapter four presents a comparative assessment of various working fluids for both ORC and
HP cycles in terms of system performance in heating and cooling modes, and their respective
environmental impacts. Chapter five describes the design and efficiency performance of the
proposed combined system used for domestic hot water supply. It also discusses the proposed
control strategy to tackle the effects of ambient temperature variation on the system
performance. The results of these strategies have been verified by a dynamic model using
ASPEN PLUS software.
Chapter six focuses on the use of the combined system for waste heat recovery from a small-
scale data centre to provide cooling. The recovered heat is used to produce hot water for a
central heating application. To tackle the variations in data centre cooling load, various control
strategies were proposed and investigated.
Chapter seven discusses the use of the combined ORC-HP cycle as a bottoming cycle for a
diesel engine. The heat recovered from the diesel engine flue gases is used to power the ORC
cycle which then mechanically drive the HP cycle to provide refrigeration load. The simulation
is conducted under the diesel engine rated condition. In addition, the effects of various diesel
engine power and rotation speed on the combined system performance are studied.
Finally, chapter eight presents a summary of the work presented in this thesis with a plan for
future work.
Chapter 2: Literature review
15
Chapter 2: Literature review
2.1 Introduction
In cold countries such as the UK, heating applications consume approximately 50% of the
energy produced, which is heavily reliant on burning fossil fuels such as natural gas and coal.
Such consumption accounts for nearly one third of carbon emission. In addition, the ever-
increasing demand for, and cost of, fossil fuel, along with tighter environmental regulations
regarding CO2 gas emissions, have motivated researchers to focus on innovative fuel-efficient
technologies. Cogeneration, trigeneration and multigeneration technologies have gained great
attention in recent years due to their potential to provide more efficient usage of available
energy sources. Cogeneration technology generally involves combined heat and power,
combined cooling and power, and combined cooling and heating. Trigeneration involves the
combination of cooling, heating and power. These integrated technologies allow the
simultaneous production of heating, cooling and/or electrical or mechanical energy (power)
from the same energy source. The energy source can be a non-renewable one such as oil, coal,
or natural gas, or a renewable one such as solar, geothermal, biomass, wasted heat, or other
types of renewable energy sources.
The essential part of any combined heat and power system is the prime mover, which means an
engine that provides the CHP system with its mechanical power. This can be achieved by
converting the chemical energy contained in fossil fuels into mechanical work such as
reciprocating internal combustion engines, steam or gas turbines. In additions to the heat
generated from combustion, ORC and Stirling engine can be powered by renewable energy
sources. Fuel cells can also be used as a prime mover for the CHP due to its ability to supply
power as a form of direct current in an electrochemical process similar to batteries [19]. In the
following section, a brief description of the main prime movers will be presented.
Chapter 2: Literature review
16
2.2 Types of prime movers for CHP systems
2.2.1 Steam turbine
The steam turbine (also called the Rankine cycle) is one of the oldest and most established heat
engines. Water, as the working fluid for this cycle, is boiled and superheated using a high energy
heat source such as fossil fuels or nuclear reaction. This high energy fluid is then expanded
through the turbine in a single or multiple stages to generate mechanical power. The turbine
shaft is connected to the electrical generator to transform the mechanical work into electrical
power, while the high-temperature and low-pressure water vapour is condensed through the
condenser by a heat sink. This latent thermal energy is used for heating applications. A high
pressure liquid pump is used to pump the condensed water to the boiler to continue the cycle
over [19].
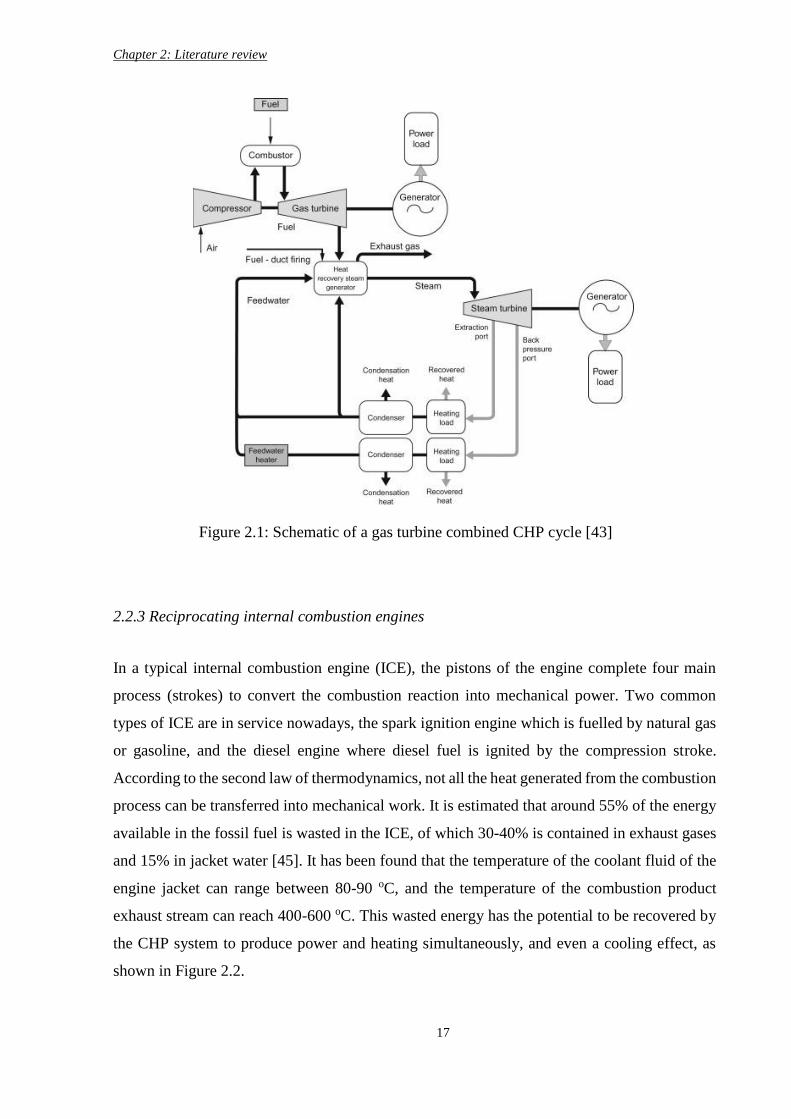
2.2.2 Gas turbine
A gas turbine cycle works on the thermodynamic principle of the Brayton cycle. It mainly
consists of a compressor, a turbine, a combustion chamber, and an electric generator as shown
in Figure 2.1. The ambient air is compressed by the compressor then mixed with the fuel inside
the combustion chamber. A combustion process takes place to generate high pressure and
temperature gases. The combustion products are expanded through the turbine to generate
mechanical power which is used to generate electricity via a motor generator. The high
temperature exhaust gas stream at the turbine outlet (450-600 oC) has the potential to be
recovered for heating applications or power production [43, 44].
Chapter 2: Literature review
17
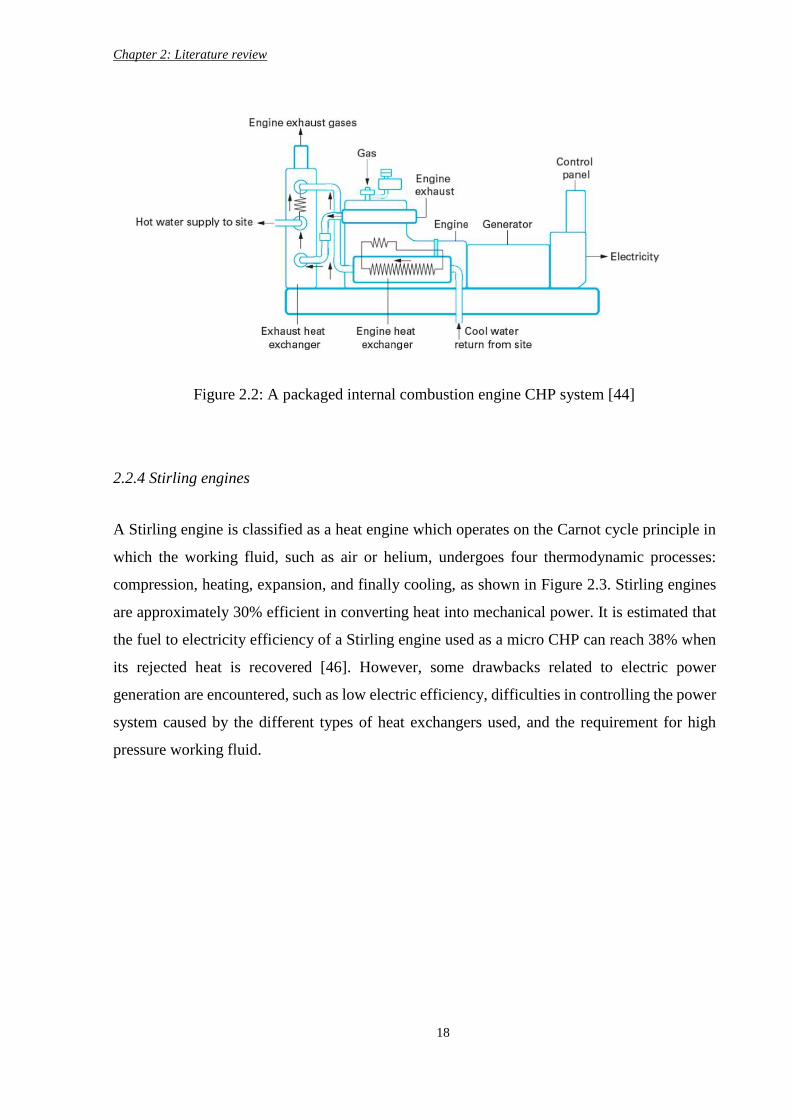
2.2.3 Reciprocating internal combustion engines
In a typical internal combustion engine (ICE), the pistons of the engine complete four main
process (strokes) to convert the combustion reaction into mechanical power. Two common
types of ICE are in service nowadays, the spark ignition engine which is fuelled by natural gas
or gasoline, and the diesel engine where diesel fuel is ignited by the compression stroke.
According to the second law of thermodynamics, not all the heat generated from the combustion
process can be transferred into mechanical work. It is estimated that around 55% of the energy
available in the fossil fuel is wasted in the ICE, of which 30-40% is contained in exhaust gases
and 15% in jacket water [45]. It has been found that the temperature of the coolant fluid of the
engine jacket can range between 80-90 oC, and the temperature of the combustion product
exhaust stream can reach 400-600 oC. This wasted energy has the potential to be recovered by
the CHP system to produce power and heating simultaneously, and even a cooling effect, as
shown in Figure 2.2.
Figure 2.1: Schematic of a gas turbine combined CHP cycle [43]
Chapter 2: Literature review
18
2.2.4 Stirling engines
A Stirling engine is classified as a heat engine which operates on the Carnot cycle principle in
which the working fluid, such as air or helium, undergoes four thermodynamic processes:
compression, heating, expansion, and finally cooling, as shown in Figure 2.3. Stirling engines
are approximately 30% efficient in converting heat into mechanical power. It is estimated that
the fuel to electricity efficiency of a Stirling engine used as a micro CHP can reach 38% when
its rejected heat is recovered [46]. However, some drawbacks related to electric power
generation are encountered, such as low electric efficiency, difficulties in controlling the power
system caused by the different types of heat exchangers used, and the requirement for high
pressure working fluid.
Figure 2.2: A packaged internal combustion engine CHP system [44]
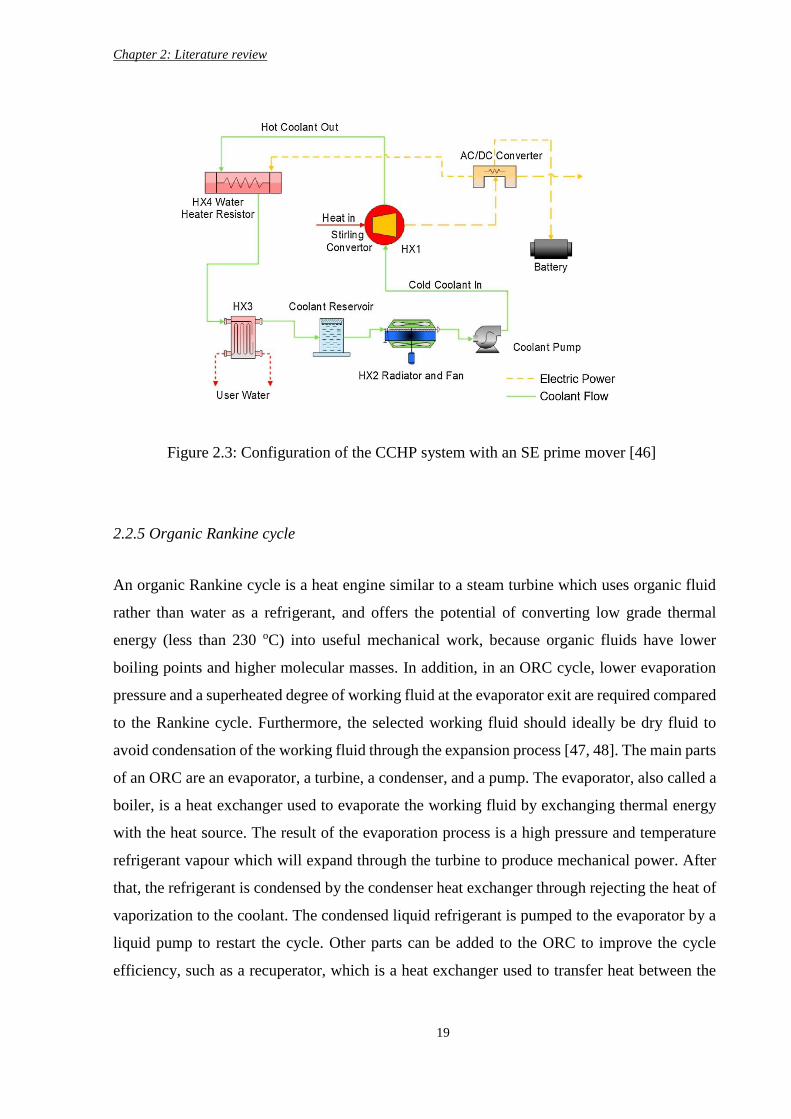
Chapter 2: Literature review
19
2.2.5 Organic Rankine cycle
An organic Rankine cycle is a heat engine similar to a steam turbine which uses organic fluid
rather than water as a refrigerant, and offers the potential of converting low grade thermal
energy (less than 230 oC) into useful mechanical work, because organic fluids have lower
boiling points and higher molecular masses. In addition, in an ORC cycle, lower evaporation
pressure and a superheated degree of working fluid at the evaporator exit are required compared
to the Rankine cycle. Furthermore, the selected working fluid should ideally be dry fluid to
avoid condensation of the working fluid through the expansion process [47, 48]. The main parts
of an ORC are an evaporator, a turbine, a condenser, and a pump. The evaporator, also called a
boiler, is a heat exchanger used to evaporate the working fluid by exchanging thermal energy
with the heat source. The result of the evaporation process is a high pressure and temperature
refrigerant vapour which will expand through the turbine to produce mechanical power. After
that, the refrigerant is condensed by the condenser heat exchanger through rejecting the heat of
vaporization to the coolant. The condensed liquid refrigerant is pumped to the evaporator by a
liquid pump to restart the cycle. Other parts can be added to the ORC to improve the cycle
efficiency, such as a recuperator, which is a heat exchanger used to transfer heat between the
Figure 2.3: Configuration of the CCHP system with an SE prime mover [46]
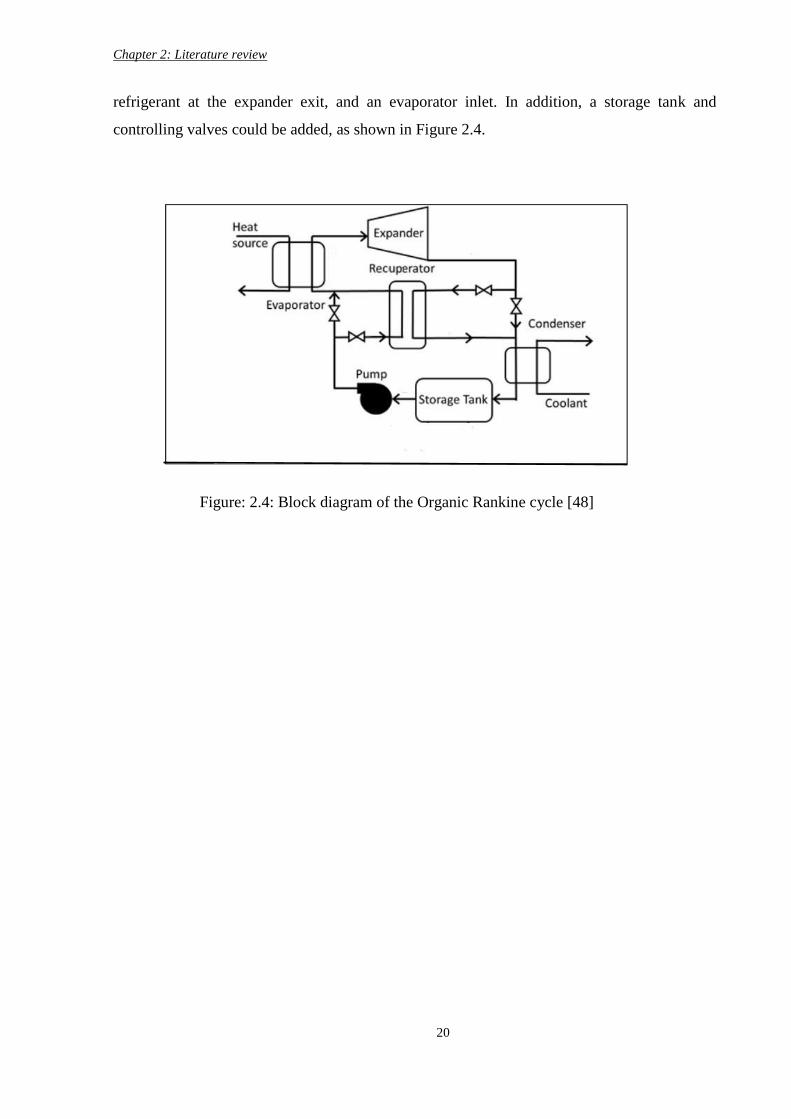
Chapter 2: Literature review
20
refrigerant at the expander exit, and an evaporator inlet. In addition, a storage tank and
controlling valves could be added, as shown in Figure 2.4.
Figure: 2.4: Block diagram of the Organic Rankine cycle [48]
Chapter 2: Literature review
21
2.3 literature review on combined technologies
Different integrated systems have been proposed and investigated in the literature. Those which
are of particular interest to this thesis are presented below:
2.3.1 Combined heat pump systems
Various heat pump cycles have been integrated in the literature using different prime movers
such as gas turbine, internal combustion engine and ORC cycle. These combined systems that
are designed for heating and cooling applications are presented below:
2.3.1.1 Gas turbine powered HP system
The use of a gas turbine as a prime mover in a CHP system has been proposed by a number of
researchers. The integration involves a gas turbine powered by natural gas being used to drive
various heat recovery technologies, such as absorption HP system, GSHP, absorption chiller,
or conventional heat exchanger.
Zhao, X., et al. [49] presented a flue gas recovery system for a CHP gas turbine power plant
driven by natural gas for a district heating application. The proposed system involves an
absorption HP system to reduce the return water temperature for further heat recovery and hence
enhance the overall system thermal efficiency. Furthermore, the new system layout was
compared with a traditional gas boiler district heating system. The results showed that the new
design configuration can secure a heating utility by area of 660 thousand m2 greater than the
gas boiler. The new technology can reduce the flue gas temperature to 11 oC, meaning that the
flue gas thermal capacity is greater than the old design by 69 MW. In addition, the energy
consumption is reduced by 6% and the HP achieved a COP of 25 which can be considered a
significant improvement over the electrical HP. Moreover, the new design configuration can
reduce CO2 and NOx emissions by 16.2 thousand and 6 tons per year, respectively.
Kang, S., et al. [50] proposed a combined heat and power system involving integrating a gas
turbine with a ground source heat pump cycle to provide domestic hot water. The new proposed
system was compared with the traditional combined CHP-GSHP system. The reference system
consists of a gas turbine powered by natural gas to produce electrical power; the wasted heat is
Chapter 2: Literature review
22
recovered by a heat exchanger to generate the first domestic hot water steam at a temperature
of 55 oC, while some of the electricity generated from the gas-turbine is used to power the
GSHP compressor and liquid pump. The GSHP is used to produce a second hot water stream
at the same temperature as the first stream. In contrast to the original combined CHP-GSHP
system, the new proposed integrated system generates only one domestic hot water flow, but in
two separated heating stages. The first heating stage is carried out in the GSHP condenser to
warm the cold tap water to around 35 oC. After that, the water reaches its desired and final
temperature (55 oC) at the outlet of the heat exchanger by recovering heat from the gas turbine
exhaust flue gas, which has a temperature of 508 oC. The results for the new integrated approach
showed that reducing the HP condenser pressure to generate warm water of 35 oC leads to a
lower pressure ratio and therefore better COP. This improves the overall combined system
efficiency. The performance comparison between the two approaches can be summarized as
follows: for the new proposed system, the total system energy efficiency is higher by 3.9%, and
the GSHP COP increased from 5.06 to 6.95. In addition, the net output power is greater than
the original cycle by 669 kW.
Cai, B., et al. [51] proposed a new novel CHP coupled with a ground source heat pump system
for further heat recovery from the natural gas exhaust stream. The new system configuration
was analysed thermodynamically, tested experientially and compared with a traditional
cogeneration system. In the traditional CHP-GSHP system, the high-grade heat contained in
the exhaust stream rejected from a gas turbine power plant is used to heat cold water. The
remaining heat in the stream is rejected into the environment at a temperature of around 140
oC. Some of the power generated from the gas turbine is used to drive the compressor of a
GSHP system. This HP system is used to generate another hot water stream using a vapour
compression HP cycle. In the proposed system, the exhaust stream that would otherwise be
rejected into the environment is directed to a geothermal well for further heat extraction,
reducing the exhaust stream temperature to around 50 oC. This heat can be transferred and
stored via a polyethylene material heat exchanger. The advantages of this new system
arrangement are that it improves the COP by reducing HP cycle condensation pressure, and
solves the imbalance problem of heat being added and removed from and to the soil in the
GSHP system. In addition, by adapting the polyethylene heat exchanger, the exhaust stream
temperature will drop below the dew point. Thus, the condensed exhaust stream will accumulate
acid and therefore minimise sulphur emissions into the environment. The analytical results
Chapter 2: Literature review
23
showed that the first and second thermodynamic laws of the new proposed cycle can be
improved by 10.7% and 10.4% respectively compared with conventional systems.
Lei, H., et al. [52] conducted a comparative study of different supplementary heat strategies on
CHP comprised of a micro gas turbine coupled with an absorption chiller driven by flue gas
energy. The function of such a small-scale system is to provide cooling, heating and power
energy. This study addressed one of the main practical challenges of any CHP system, which
is when the CHP system has to work in partial load conditions due to an imbalance between the
user demand for power and thermal energy and the maximum system output. Four different
heat supplementary strategies are proposed and analysed when the exhaust flue gases of the gas
turbine are insufficient to drive the absorption chiller. In strategy one, the flue gas temperature
is increased at a constant flue gas mass flow rate while in strategy two, only the exhaust mass
flow is increased. Increased gas turbine power is the approach adopted in strategy three, and
the fourth method involves adjusting flue gas mass flow and temperature taking into
consideration the absorption chiller cooling capacity and the COP. The results showed that the
first control strategy achieved better system performance than the other methods.
2.3.1.2 Gas powered HP system (GPHP)
Recently, scientific researchers have focused on designing and improving heating and cooling
technologies with the advantage of waste heat recovery. Among these devices is the gas-
powered heat pump cycle (GPHP), which consists of conventional vapour compression cycle
driven by a gas fuelled internal combustion engine. The wasted heat from the gas engine
(exhaust gas and engine cylinder jacket) is recovered by the HP cycle to enhance system heating
efficiency.
An experimental and theoretical research was conducted by Yang, Z., et al. [53] to study the
performance of the GPHP as a water heater applicant. The HP cycle in that study utilizes the
ambient air temperature as a heat source for its evaporator. The water is separately heated and
stored in two tanks by the heat rejected from the heat pump condenser and by utilizing the waste
heat from the gas engine cylinder and exhaust. The recovered waste heat from the gas engine
is proposed to solve the evaporator frosting issue when the system works at low temperatures
and in a high humidity climate. The results illustrated that heating capacity rises with increasing
Chapter 2: Literature review
24
shaft engine rotation speed and water flow, but drops with rising water temperature. Moreover,
three different defrost processes were proposed and analysed. Method one uses wasted heat
only; method two reverses the HP cycle and the third approach involves a combination of both.
The experimental test showed that although method one takes more time, it increases the water
temperature in the storage tank through the operating time; the other two methods showed the
opposite trend.
Hu, B., et al. [54] carried out an experimental and theoretical study centring around a GPHP
system for heating purposes. In this study’s system, the heat source for the HP evaporator is a
mixture of ambient air and flue gases. The heat contained in the engine jacked coolant is used
to superheat the working fluid at HP compressor inlet. The results showed that the combined
system operational performance is highly dependent on ambient air temperature and gas engine
speed. It also concluded that the gas engine speed should be set as low as possible to achieve
the required heating capacity for optimum engine thermal efficiency.
In order to explore the stability and reliability of a combined gas engine air to water HP system
for domestic hot water application, Liu, F., et al. [55] built and tested an experimental prototype.
In this system, the engine waste heat (jacket and exhaust) is recovered to heat the water. Another
hot water stream is generated from the HP cycle by utilizing a low-grade heat source (ambient
air temperature). The results showed that the system can produce a range of hot water at between
40-60 oC. Moreover, in winter, it is recommended to meet the demand for high temperature
water from the recovered wasted heat engine rather than the HP condenser to ensure that the
gas engine speed and the HP temperature lift can operate constantly and at as low a level as
possible to achieve the highest efficiency of performance.
Another experimental study by Liu, F., et al. [56] was carried out on a combined system
designed to provide hot and cold water simultaneously. The hot water is produced by utilizing
the wasted heat from the gas engine case and exhaust, and the HP cycle is used as a water cooler
by absorbing heat from the cold tank water and rejecting it to the environment. The results
showed that the evaporator water inlet temperature and the engine speed are the main
parameters affecting both the system primary energy ratio (PER) and heat pump COP. The
ambient air temperature has a direct effect on cooling capacity and hence on total capacity. The
Chapter 2: Literature review
25
proposed system can provide hot water at between approximately 40-62 oC, and cold water
between 6.7-19.3 oC.
It is evident that the gas engine speed has a significant impact on engine performance. In the
gas engine HP system, the engine speed should be adjusted to satisfy the variation in heating
and cooling loads. Therefore, various studies have proposed hybrid powered gas engine HP
systems (HPGHP) which feature a dual energy source to tackle this problem. This new type of
system is based on combining the gas engine with an electric motor powered by a battery pack.
The electric motor works as a generator to charge the battery, and when it is fully charged it
can act as a prime mover for the compressor. By efficiently switching between both power
sources modes, i.e., distributing the required compressor torque between the engine, motor or
both, fuel consumption can be kept to a minimum. The proposed HPGHP system shows
superior thermal, economic and environmental performance compared with traditional GPHP
[57, 58].
2.3.2 Combined gas burner-ORC system
A gas burner is a primitive technology that mainly relies on burning natural gas, crude oil, and
coal. The heat generated from the burner can be used to thermally drive a power cycle such as
an ORC cycle. In addition, the wasted heat contained in the exhaust stream as a combustion by-
product has high thermal energy. This wasted heat has attracted the attention of many
researchers who have suggested recovery methods using various technologies such as CHP
systems.
A small scale micro CHP consisting of an ORC power plant powered by natural gas-fired was
designed and tested experientially [59]. The intended design for this system is a miscellaneous
heating application, while the electricity generated is considered as a beneficial by-product. The
cold tap water is heated to 65-85 oC in the gas burner, then this heat is transferred to the working
fluid in the evaporator. The return water can be used for space heating, hot water supply, and
domestic washing. In addition, the sink water in the condenser is also used in mixed heating
applications. Isopentane is selected as the working fluid due to its proper thermophysical
properties and environmentally friendly behaviour. An in-house vane expander was designed
and manufactured specifically for the study. Thermodynamic analysis was carried out on the
Chapter 2: Literature review
26
combined CHP system in terms of the first and second laws of thermodynamics. The results
showed that the maximum achievable expander output power is 77.4 W when the heat source
temperature is 84 oC. In addition, the net cycle electrical efficiency is 1.66%. The combined
system heating efficiency varied slightly at different heat source temperatures, but it is highly
dependent on the water heating device.
An experimental research was conducted by Zhou, N., et al. [47] to design and construct an
ORC cycle for low temperature flue gas waste heat recovery from an industrial process. In this
system, typical ORC cycle components including a fin-tubes evaporator, a double tube sides
condenser, a scroll expander and a liquid pump are used. In addition, R123 is used as the
working fluid for its merits such as non-flammability, non-toxicity, low cost and environmental
friendliness. The heat source for the test rig is an exhaust gas stream of low temperatures
varying between (90-250 oC), from burning liquefied petroleum gas (LPG) mixed with ambient
air in a stove. The heat sink is cold water circulated from a storage tank to condensate the
refrigerant in the condenser. The study investigated the relations between the main cycle design
parameters, including evaporator pressure, heat source temperature, R123 superheat degree,
expander output power, cycle efficiency, heat recovery efficiency, and exergy efficiency. The
main findings showed that increasing evaporator pressure results in a rise in turbine output
power, cycle thermal efficiency and exergy efficiency. Increasing the heat source temperature
leads to higher expander output power, greater energy recovery, and a rise in exergy efficiency.
Increasing the refrigerant superheat degree reduces the cycle performance. Overall, the cycle
produced net mechanical power of 0.645 kW with a total thermal efficiency of 8.5%.
Peris, B., et al. [60] conducted an experimental study on a regenerative ORC power cycle for
the combined purpose of electrical power and thermal heat production. The combined cycle is
thermally fed by a thermal oil close loop heated by a gas boiler to simulate the heat capturing
process from low grads heat source temperatures in the range of 90-150 oC. In addition, the
rejected heat from the cycle condenser is used to produce hot water at between 30-90 oC.
Moreover, R245fa refrigerant is used as the working fluid and the volumetric expander is
measured in the test bench. The results showed that increasing the thermal oil inlet temperature
and cycle pressure ratio will result in higher thermal energy being captured by the ORC
evaporator. This in turn increases the net power output from the expander. However, at each
heat source temperature, the hot water outlet temperature declines as the cycle pressure ratio
Chapter 2: Literature review
27
increases, due to the decline in the ORC condenser pressure which is responsible for the final
water temperature. Therefore, in this test, the cycle achieved a maximum thermal energy input
of 390 kW, a thermal energy output of 350 kW, and a hot water temperature of 90 oC. In
addition, the highest obtainable net electrical power and gross electric power were reported as
30.91 kW and 36.58 kW, respectively. More results showed that the cycle thermal efficiency
increases with the pressure ratio, reaching a value of 7.92% at the maximum gross electric
power and 9.4% at the highest net electric power. At a cycle pressure ratio of between 2-3, the
expander isentropic efficiency achieved its highest value of 70%.
2.3.3 Diesel engine driven ORC cycle
Various studies in the open literature have investigated the use of the ORC thermodynamic
cycle for waste heat recovery (WHR) from diesel engines. It has been established that a typical
diesel engine (DE) rejects around half of the total energy it consumes through the exhaust and
coolant streams in order to produce useful mechanical work [45, 61, 62]. These thermal fluids
(exhaust and coolant streams) have the potential to be reused as a heat source for an ORC cycle
for power production.
Yu, G., et al. [45] presented a simulation model to evaluate the performance of a real ORC
cycle bottoming diesel engine for waste heat recovery from the engine jacket cylinder and
exhaust. A schematic diagram of this system is shown in Figure 2.5. Extensive thermodynamic
analysis was carried out on the waste heat recovered, ORC output power, system efficiency,
exergy destruction, and efficiency. DE working conditions such as engine load and speed, and
exhaust mass flow rate and temperature, were collected experimentally from a heavy-duty
turbocharged six-cylinder DE used in a generator plan.
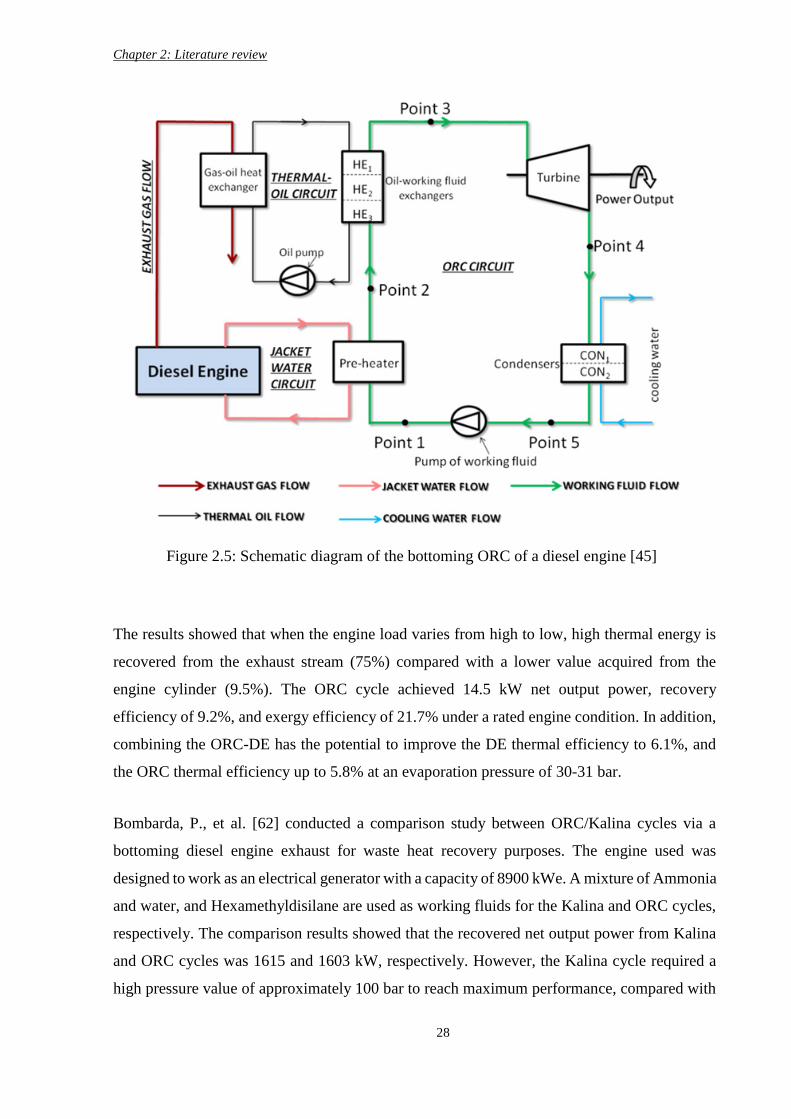
Chapter 2: Literature review
28
The results showed that when the engine load varies from high to low, high thermal energy is
recovered from the exhaust stream (75%) compared with a lower value acquired from the
engine cylinder (9.5%). The ORC cycle achieved 14.5 kW net output power, recovery
efficiency of 9.2%, and exergy efficiency of 21.7% under a rated engine condition. In addition,
combining the ORC-DE has the potential to improve the DE thermal efficiency to 6.1%, and
the ORC thermal efficiency up to 5.8% at an evaporation pressure of 30-31 bar.
Bombarda, P., et al. [62] conducted a comparison study between ORC/Kalina cycles via a
bottoming diesel engine exhaust for waste heat recovery purposes. The engine used was
designed to work as an electrical generator with a capacity of 8900 kWe. A mixture of Ammonia
and water, and Hexamethyldisilane are used as working fluids for the Kalina and ORC cycles,
respectively. The comparison results showed that the recovered net output power from Kalina
and ORC cycles was 1615 and 1603 kW, respectively. However, the Kalina cycle required a
high pressure value of approximately 100 bar to reach maximum performance, compared with
Figure 2.5: Schematic diagram of the bottoming ORC of a diesel engine [45]
Chapter 2: Literature review
29
the ORC cycle which required only 10 bar. The Kalina cycle achieved slightly higher cycle
performance, however this was only achievable at low logarithmic mean temperature
differences in the heat recovery exchanger, which requires a large exchanger surface area. In
addition, using a high pressure Kalina cycle could add more challenges to the basic cycle
configuration in which the cycle should work either using high turbine rotational speeds or a
multistage configuration. Also, to avoid possible corrosion in the Kalina cycle components,
expensive materials are required.
Steady and transient simulations were carried out by Zhao, M., et al. [61] to evaluate the
performance of a diesel engine combined with an ORC power cycle for WHR. The results for
a diesel engine operating in different working conditions were experimentally tested. The
engine performance was evaluated and compared both with and without the ORC cycle. The
results showed that the main important performance parameters for the DE combined with ORC
cycle improved; the net power output increased by 4.13 kW, the fuel consumption fell by 3.61
g/ (kW h), and the thermal efficiency improved by 0.66%. The transient results also support the
benefits of using the ORC cycle, which obtained total combined cycle output power of 168.24
kW.
The ORC evaporator can have a significant impact on system performance. Therefore, a number
of studies have focused on this part. An experimental and theoretical study on combined ORC-
DE was conducted by Koppauer, H., et al. [63]. In this study, two heat exchangers (HXs) instead
of one for an ORC evaporator were set in the test rig. One is placed after the exhaust
aftertreatment, and the other is installed in the exhaust recirculation. Water mass flow is
proposed to maintain the ORC condenser pressure below atmospheric pressure to maximize the
turbine output power and hence the system recovering efficiency. In this study, steady and
dynamic mathematical models were drawn from the literature with further development. The
results of both models were validated with those obtained from the experimental rig. The results
revealed that the evaporator steady state model achieved good accuracy with only a small
fraction of error. In addition, the dynamic simulation results were in agreement with those
acquired from the transit behaviour of the test rig. Furthermore, a control and optimization
method has been developed which utilizes the steady state model and takes into account the
practical design parameters, such as the decomposition temperature of Ethanol as the ORC
Chapter 2: Literature review
30
working fluid. This method can be directly used to identify the operating points in the combined
ORC-DE cycle in order to maximize the energy recovered and the expansion power output.
A dynamic model of a 2-phase heat exchanger for use in a DE-ORC system has also been
developed [64]. The system is designed to recover waste heat mainly from the main exhaust
and gas recirculation streams. Mass and energy balance equations were used to describe the
two-phase heat exchanger model. The finite difference method and moving boundary approach
were adopted in this model and it was compared with other dynamic models available in the
literature. The modified model is based on simulating the phase change of the Ethanol as the
ORC working fluid and the moving boundary approach of the multi-phase across the heat
exchanger during the heat transfer process. The results were verified with experimental data
from a combined DE-ORC system. The results showed that the developed model has the
potential of predicting the working fluid and exhaust gas temperature with an average error of
less than 4%. This can provide the confidence needed to use the modified model in the dynamic
evaluation and control strategy of a complete waste heat recovery system.
A thermodynamic model of a dual loop ORC system for waste heat recovery from a compressed
natural gas engine was proposed [65]. The study conducted a comparison of the thermodynamic
and economic performance of this system using various working fluids. In addition, the effects
of various ORC parameters on system performance were investigated, including superheat
degree, evaporation pressure, the condensation temperature of high- and low temperature loops
of the ORC cycle, and the exhaust temperature. The results showed that higher evaporator
pressure and condensation temperature in both loops have positive impacts on the
thermodynamic performance of the system, while variations in superheat degree and exhaust
temperature have no significant impact on the thermo-economic performance. In addition,
R245fa in both loops achieved better ORC performance than the other working fluids examined
in this study. The study also supported that this system can achieve a maximum net power
output of 23.62 kW at the rated condition with a low electricity production cost. The dual loop
ORC system also achieved thermal efficiency in the range of 8.97-10.19% in the selected
operating conditions.
Some researchers have studied which ORC configuration layouts could be suitable for DE
waste heat recovery. Four different small-scale ORC power cycle layouts using R245fa as
Chapter 2: Literature review
31
working fluids were investigated on one study [66]. The difference between these is only in the
management of the recovery mechanism from the engine coolant and exhaust streams. The aim
is to recover wasted heat from internal combustion engine coolant and exhaust streams. The
study was carried out on a small Yanmar diesel engine, model number TF120M. It consists of
a one-cylinder engine with 8.8 kW rated power at 2400 RPM. The study investigated design
and performance parameters such as refrigerant superheat degree, expander rotational speed,
and brake specific fuel consumption for the four proposed configurations under the rated
condition of the DE. The four configurations can be described as follows: a simple structure
ORC (ORC-simp) where both coolant and exhaust stream are used as a heat source to evaporate
the R245fa. In the ORCR-1 configuration, a recuperator is adapted between a liquid pump and
a coolant heater. In this case, the recuperator acts as a preheater to recapture the heat available
in the R245fa flow leaving the expander. In ORCR-2, recuperator is installed between the
coolant heater and the exhaust heater as an additional heat exchanger. The last configuration is
ORC-pre, in which the refrigerant is preheated by the coolant heat exchanger before the
evaporation process. A thermal oil circuit is used in the exhaust heater to protect the ORC
refrigerant from the high temperature exhaust gases.
The results showed that increasing the degree of refrigerant superheat at the ORC evaporator
exit will result in keeping the ORC-simp thermal efficiency nearly constant (6.4%), while
slightly improving the other three cycles’ efficiency. In addition, the results indicated that when
R245fa is superheated below 110 oC, this could lower ORCR-2’s efficiency compared with
ORC-simp. This happens because the efficiency in the ORC-2 layout depends on the
temperature of the refrigerant at the expander exit which in this case is lower than the engine
coolant temperature. Also, the study found that the superheating degree has limited effect on
the ORC power output, recording average values of 0.59 kW for ORC-simp and 0.5 kW for
ORC-pre. The comparison results between the four configurations prove that the ORC-pre cycle
has a better thermal performance but generates less power. As a result, the simple ORC
configuration for waste heat recovery from coolant and the exhaust of the internal combustion
engine has the potential to produce the highest power but has slight thermal efficiency.
However, this can be reversed if the ratio between the engine coolant and exhaust is in the range
of 0.5-0.7, because the ORC-pre is unable to recover all the heat available in the coolant stream.
Therefore, it is recommended that the ORC-simp should be modified into ORC-pre in this ratio
range. In addition to the higher power output, the scroll turbine rotation speed of the ORC-simp
Chapter 2: Literature review
32
(3200 RPM) is higher than that of the ORC-pre (1000 RPM) in the superheat degree range of
80-160 oC. Moreover, the ORC-simp cycle rejects less heat to the environment via the
condenser compared with the other proposed configurations, which means it has a valuable
advantage in waste heat recovery technology from ICE. The analysis of the engine fuel
consumption under the engine rated condition showed that the ORC-simp has a lower fuel
consumption ratio by 6.1% compared with ORCR-1 and ORC-pre which increases the fuel
savings by 7.4% and 5.2%, respectively. In addition, the overall cycle efficiency of the ORC-
simp, ORCR-1 and ORC-pre could be enhanced by 6.5%, 8.0% and 5.4%, respectively.
The selection of working fluid for an ORC to be used as a waste heat recovery system with DE
is also important. Many studies have supported that using alkane-based working fluids in the
ORC cycle can achieve better performance in medium-high temperature waste heat recovery
from a diesel engine. However, their use is also associated with difficulties in selecting and
designing proper expanders due to their over-large expansion ratio. To overcome this problem,
Liu, P., et al. [67] proposed a two-stage expansion with interheating for ORC working with
alkanes to achieve multi-stage heat recovery from exhaust gas, EGR gas (Exhaust Gas
Recirculation) and engine coolant in a truck DE. A comparison study for the system
performance using different alkane working fluids was conducted and the proposed system was
compared with a preheating-regenerative ORC system for DE waste heat recovery. The results
showed that cyclic alkanes performed better than linear alkanes in terms of net power output,
thermal efficiency, and exergy losses; however, they recover less heat from engine coolant. In
addition, the proposed system can generate 6.7% more output power than the preheating-
regenerative ORC system as it can recover 100% of waste heat from exhaust gas and 71.8%
from ERG gas.
It has been found that pure hydrocarbon refrigerants have good efficiency compared with other
working fluids; however, flammability and explosivity are the main drawbacks to their use. To
reduce these drawbacks, Song and Gu [68] suggested mixing them with a retardant in an ORC
system for engine WHR. Refrigerants such as R141b and R11 are proposed as retardants to
form zeotropic mixtures with hydrocarbon fluids. In addition to suppressing flammability, the
zeotropic mixture offers better temperature matches between the refrigerant and the heat source
and sink, which can reduce the rate of exergy destruction in the heat exchangers. The simulation
results showed that the zeotropic mixture (50% cyclohexane and 50% R141b) can improve the
Chapter 2: Literature review
33
ORC output expansion power by 13.3% compared with pure cyclohexane. In addition, exergy
destruction is reduced in both the evaporator and condenser, by 30% and 14%, respectively.
The mechanical output power of the combined ORC-DE cycle can be used in different
applications. Salek, F., et al. [69] carried out a thermodynamic simulation to investigate the
potential of recovering the wasted thermal energy available in the DE exhaust stream for use as
a cooling load. In this system, the mechanical energy generated in the ORC power unit drives
an Ammonia absorption refrigeration cycle. The three thermodynamic cycles are integrated as
a combined cooling, heating and power technology. The results show that adopting the
Ammonia absorption refrigeration cycle increases the bottoming ORC cycle efficiency, leading
to a further rise in the output power of the entire system. In addition, DE efficiency improves
by 4.65%. From the literature, DE coupled with ORC can only recover 7-8% of the thermal
energy contained in the exhaust stream; however, this study’s proposed system can recover 2%
more than the compared cycle. Increasing the engine load leads to further energy being rejected
from the exhaust stream, which can lead to a higher cooling load. By adding a preheat heat
exchanger at the thermal interface point between the ORC-HP cycle, a 5 kW increment in the
ORC feeding power is reported, which will boost the ORC output turbine expansion power.
The interface point is where the R24fa liquid stream exiting the pump is in thermal contact with
the Ammonia fluid leaving the heat exchanger. The exhaust stream temperature is set to 100 oC
to avoid possible condensation of formation of sulfuric and nitric acid. The study also found
that maintaining the exhaust gases temperature at below the 220 oC at the HP heat exchanger
exit can avoid degradation in the HP COP. Using two HXs between the exhaust gas flue and
both the ORC working fluid and HP refrigerant causes 0.5% mechanical power loss; however,
the recovered energy from integrating these cycles has the potential to cover that loss.
Some researchers have suggested that coupling ORC-DE can have some drawbacks, including
a rise in back pressure and ORC refrigerant decomposition. Turbocharged diesel engine type
IVECO F1C 3.0 L combined with ORC power plan has been tested experimentally in this
context [70]. This study discussed the following design assessment points: the effects of back
pressure as a consequence of bottoming an ORC power unit on the engine exhaust stream, and
the effects of increasing the mobile DE system weight due to adding the ORC unit. The
proposed mechanical control mechanism, an Inlet Guide Vane (IGV), is used in this study to
Chapter 2: Literature review
34
ease the back-pressure problem. The recovery evaluation is carried out on an existing ORC
cycle based on an off-design mode, and the expander is evaluated under variable engine speed.
The results show that engine back pressure can significantly affect the thermal interface process
between the ORC evaporator and the engine exhaust. In addition, the shell and finned tube heat
exchangers are favoured over a plate type for this application. Despite a small impact on the
brake specific fuel consumption (less than 1%), the back pressure can be reduced to 175 mbar
for an exhaust stream flow rate equal to 500 kg/h, by adopting the IGV control system on the
turbocharger. By using a plate HX for an ORC evaporator designed for a pressure drop of
350mbar and an exhaust mass flow rate of 500 kg/h, engine boost pressure increases, causing a
rise in the turbocharged speed at different DE speeds. Although engine fuel consumption
unexpectedly increases by 2-5 % with the increase in the gas mass flow, the shell and finned
tube heat exchangers can keep the fuel consumption rate below 1% at all engine speeds.
From the off-design results, and during the steady refrigerant flow rate in the ORC evaporator,
thermos-fluid consequences such as an incomplete evaporation process and a fluid stability
problem can occur. These drawbacks could have consequences in relation to the performance
parameters of the expander, in terms of its volumetric efficiency and recoverable mechanical
power. These drawbacks in the off-design mode can be minimized by adapting the multivariable
mechanism control system in which the ORC working fluid density and mass flow rate, turbine
speed, and exhaust mass flow can all be varied. Extra weight of 50 kg from the ORC power
unit is added to the original track vehicle weight (3350 kg). In addition, a larger radiator surface
area is needed for the DE to reject heat from the ORC condenser to the environment. An
increment of 1% of fuel consumption is required to compensate to the increase in the track
weight. In this study, utilizing the ORC power as a recovery unit shows a gross benefit of 4-5%
and presents the potential of the cycle improvement in terms of proper design and control
mechanisms.
In order to prevent the decomposition of the ORC working fluid, Shu, G., et al. [71] suggested
adapting the thermal oil circuit as intermediate oil storage (OS) between the DE exhaust stream
and the ORC cycle. They experimentally tested a standalone DE (without an OS system) with
a capacity of 240 kW to investigate the variable exhaust stream properties. After that, the
performance of a combined DE with OS/ORC cycle was also measured when exposed to a
Chapter 2: Literature review
35
variable high temperature exhaust stream. The results showed that in standalone mode, the
temperature of the ORC working fluid can reach 202-480 oC. This could put the refrigerant at
a high risk of decomposition. In this case, the maximum ideal thermal energy obtained from the
engine exhaust is 142.2 kW at an engine speed and load of 2000 RPM and 100% respectively.
In the combined DE-OS/ORC system, even when the temperature of the exhaust stream is in
the range of 200-480 oC, the OS system maintains R123 temperature of between 81-222.5 oC
which is safely away from the decomposition range. Thus, the maximum heat recovered by the
OS system is reduced to 72.63 kW, leading to net output power of 9.67 kW. In addition to
reducing the decomposition problem, adapting the oil storage approach can bring significant
inertia to the response of the combined system when the DE operates with a fluctuating
performance. The combined ORC/OS show a roughly steady net power output even when the
engine is shut down. Furthermore, in this mode, evaporator and condenser pressure is found to
be almost constant throughout variable DE working conditions, which supports system safety
and performance.
Since the combined ORC-DE system works under highly transient operation conditions due to
variable DE output power demand which consequently produces transient exhaust streams in
terms of both quantity and quality, a number of studies have focused on the dynamic modelling
of the combined ORC-DE cycle.
Xu, B., et al. [72] developed a dynamic model to predict the transient behaviour of the combined
ORC-DE system for heat recovery purposes. This model implemented individually the four
basic ORC components in addition to control valves, junctions, and a reservoir. The heat
transfer process in the heat exchangers is modelled based on energy, mass and momentum
equations, and correlations of heat transfer coefficient and pressure drop across the heat
exchangers are derived. Then, the model is employed for the entire combined system. The
combined dynamic model is validated in terms of step-changes in the engine working
conditions (speed-torque). The results showed that the vapour refrigerant temperature and
pressure at ORC evaporator outlet can be successfully predicted with mean errors of around 2%
-3%, respectively.
Huster, W., et al. [73] performed a dynamic evaluation of an ORC cycle driven by thermal
energy rejected from the DE. The ORC targeted components are the evaporator and the

Chapter 2: Literature review
36
condenser. The adapted two-phase heat transfer method takes the moving boundary approach.
The validation of this model is carried out with different experimental data. The results showed
a mean temperature error for all measured temperatures of less than 4%. In addition, the mean
relative error for the refrigerant temperature exiting the evaporator is less than 1%, and only
increases to 5.5% at high-pressure levels.
Table 2.1 shows a summary of the available literature on the combined DE-ORC cycle for heat
recovery. It is clear that the single stage ORC layout is the most commonly adopted
configuration and that various working fluids have been used, with R245fa being frequently
used.
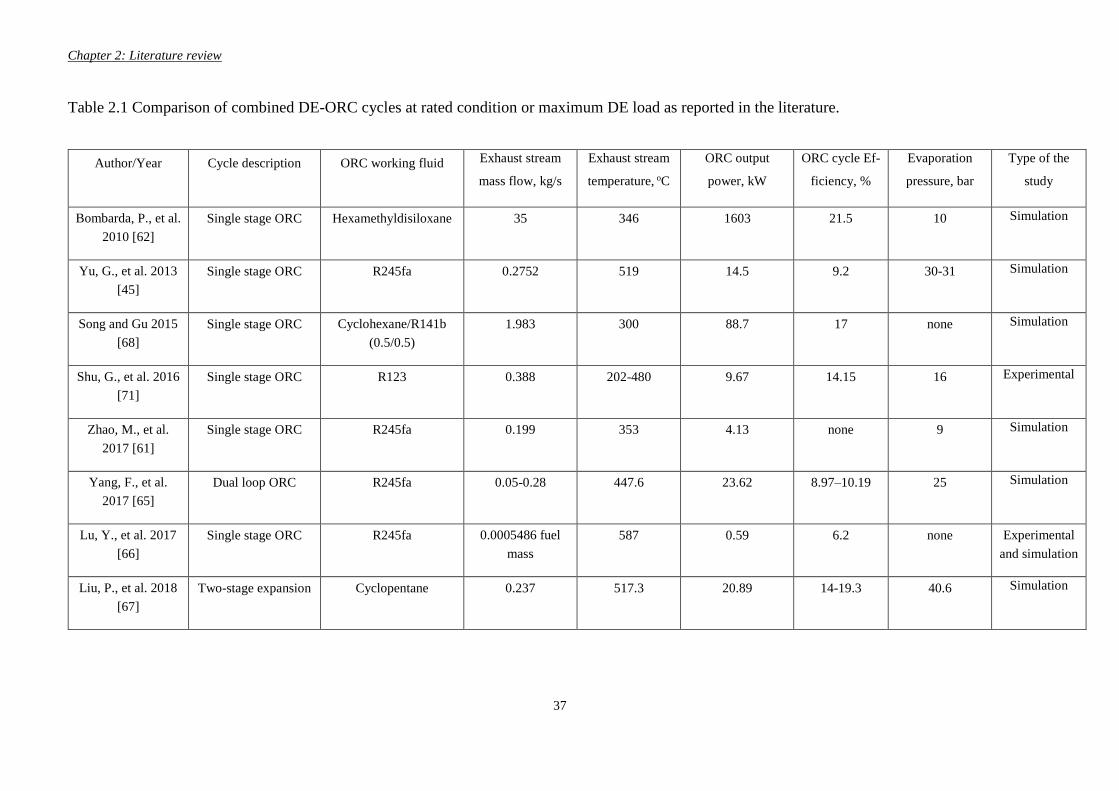
Chapter 2: Literature review
37
Table 2.1 Comparison of combined DE-ORC cycles at rated condition or maximum DE load as reported in the literature.
Author/Year Cycle description ORC working fluid Exhaust stream
mass flow, kg/s
Exhaust stream
temperature, oC
ORC output
power, kW
ORC cycle Ef-
ficiency, %
Evaporation
pressure, bar
Type of the
study
Bombarda, P., et al.
2010 [62]
Single stage ORC Hexamethyldisiloxane 35 346 1603 21.5 10 Simulation
Yu, G., et al. 2013
[45]
Single stage ORC R245fa 0.2752 519 14.5 9.2 30-31 Simulation
Song and Gu 2015
[68]
Single stage ORC Cyclohexane/R141b
(0.5/0.5)
1.983 300 88.7 17 none Simulation
Shu, G., et al. 2016
[71]
Single stage ORC R123 0.388 202-480 9.67 14.15 16 Experimental
Zhao, M., et al.
2017 [61]
Single stage ORC R245fa 0.199 353 4.13 none 9 Simulation
Yang, F., et al.
2017 [65]
Dual loop ORC R245fa 0.05-0.28 447.6 23.62 8.97–10.19 25 Simulation
Lu, Y., et al. 2017
[66]
Single stage ORC R245fa 0.0005486 fuel
mass
587 0.59 6.2 none Experimental
and simulation
Liu, P., et al. 2018
[67]
Two-stage expansion Cyclopentane 0.237 517.3 20.89 14-19.3 40.6 Simulation
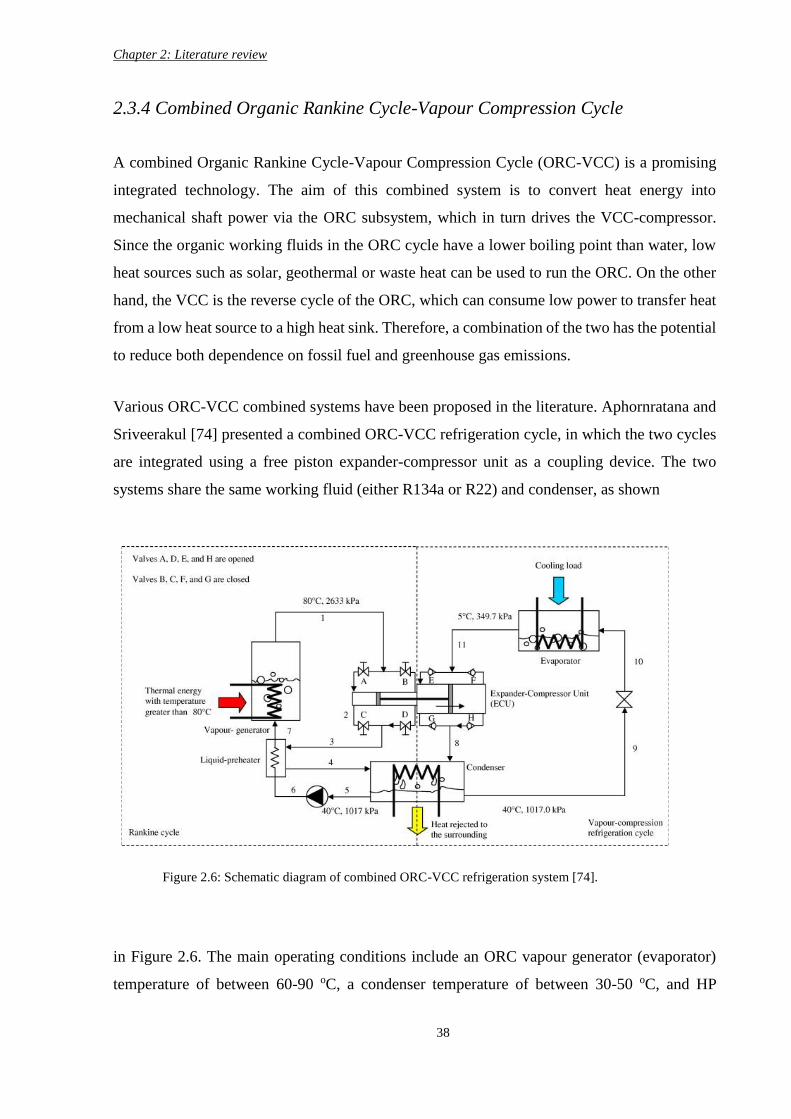
Chapter 2: Literature review
38
2.3.4 Combined Organic Rankine Cycle-Vapour Compression Cycle
A combined Organic Rankine Cycle-Vapour Compression Cycle (ORC-VCC) is a promising
integrated technology. The aim of this combined system is to convert heat energy into
mechanical shaft power via the ORC subsystem, which in turn drives the VCC-compressor.
Since the organic working fluids in the ORC cycle have a lower boiling point than water, low
heat sources such as solar, geothermal or waste heat can be used to run the ORC. On the other
hand, the VCC is the reverse cycle of the ORC, which can consume low power to transfer heat
from a low heat source to a high heat sink. Therefore, a combination of the two has the potential
to reduce both dependence on fossil fuel and greenhouse gas emissions.
Various ORC-VCC combined systems have been proposed in the literature. Aphornratana and
Sriveerakul [74] presented a combined ORC-VCC refrigeration cycle, in which the two cycles
are integrated using a free piston expander-compressor unit as a coupling device. The two
systems share the same working fluid (either R134a or R22) and condenser, as shown
in Figure 2.6. The main operating conditions include an ORC vapour generator (evaporator)
temperature of between 60-90 oC, a condenser temperature of between 30-50 oC, and HP
Figure 2.6: Schematic diagram of combined ORC-VCC refrigeration system [74].
Chapter 2: Literature review
39
evaporator temperature of between -10 to 10 oC. The results showed that this combined system
can achieve a COP value of between 0.1 to 0.6. In addition, the system with R22 as the working
fluid shows better COP performance than R134a for all operating temperature ranges.
Wang, H., et al. [75] proposed a combined ORC-VCC as a thermally activated cooling
technology. The cycle can be powered by solar-thermal, geothermal or waste heat to produce a
cooling effect and/or mechanical power if needed. These authors proposed that the cycle can
be used solely for cooling during summer months, whereas in winter, all the heat can be
converted to electricity. During spring and autumn, both cooling and electricity will be
produced based on the demand. The effects of various cycle configurations on the overall
system performance in terms of the gross coefficient of performance were studied. The results
showed that the system can achieve an overall COP of 0.54 (basic cycle design), 0.63 (with
sub-cooling) and 0.66 (with sub-cooling and recuperation). Thus, the advanced cycles with sub-
cooling or cooling-recuperation achieve a 22% improvement on the overall COP compared to
the basic cycle design.
The effects of various working fluids and their thermophysical properties on the cycle
performance have also been studied. Kim and Perez-Blanco [76] conducted a thermodynamic
analysis of a combined ORC-VCC system for the cogeneration of power and refrigeration using
a low-grade sensible heat source. Various working fluids were investigated, including R143a,
R22, R134a, R152a, Propane, Ammonia, Isobutane and Butane. The system performance was
analysed in terms of net power production, refrigeration capacity, and thermal and exergy
efficiencies. The results showed that for the pure refrigeration case, higher thermal efficiency
and refrigeration per unit mass are achieved when working fluids are at high critical
temperatures, with the exception of Ammonia. Both Butane and Isobutane show good
refrigeration capacity at low turbine inlet pressure, but they are flammable. In contrast, R134a
and R152a enhance refrigeration load at a higher turbine inlet pressure. In terms of
cogeneration, increasing the turbine inlet temperature results in a significant increase in the net
power production with a concomitant slight reduction in refrigeration duty. Thus, the exergy
efficiency has a peak value with respect to the turbine inlet temperature and pressure. Although
a higher exergy efficiency is favourable regarding power production, the study’s authors
concluded that a higher refrigeration capacity can be more advantageous from the energy point
of view, both of which are irrespective of economic considerations.
Chapter 2: Literature review
40
Another thermodynamic analysis of a combined ORC-VCC system using different low Global
Warming Potential (GWP) working fluids was conducted [77]. In this study, the selected
working fluids are HFO-1336mzz or HCFO-1233zd (for ORC cycle) and HFO-1234yf or HFO-
1234ze (for VCC cycle). Both the ORC-evaporation temperature and the ORC-VCC
recuperator efficiency have a positive effect on ORC efficiency, while the VCC evaporation
temperature and the condensation temperature have a negative effect on the ORC cycle
efficiency. Overall, HFO-1336mzz achieves higher thermal and electrical efficiency under the
selected operating conditions. Similarly, using HFO-1234ze in the VCC results in greater ORC
thermal and ORC-VCC recuperator efficiencies due to the associated higher compressor
discharge pressure. Overall, the ORC cycle achieves a thermal efficiency of between 10.6%
and 15%, while the VCC COP ranges between 2.7 and 8. The gross combined cycle thermal
and electrical COPs range between (0.3-1.1 thermal) and (15-110 electrical) respectively. If the
system is used purely for electric generation with no cooling load, the annual energy saving is
estimated to be 118,637 kWh. The expected payback time for this system is 3.3 years.
Asim, M., et al. [78] proposed an integrated ORC-VCC in which the VCC is an air conditioner
(AC). Both cycles share a heat exchanger which acts as a condenser in the VCC and an
evaporator in the ORC cycle. The waste heat rejected by the air-conditioning system is
converted into electricity by the ORC cycle. Twelve different working fluids (6 for the ORC
cycle and 6 for the VCC) are compared under a constant VCC condensation temperature of 50
oC. R600a-R123 pairs (as a working fluid for the AC and ORC cycles, respectively) achieve
the best combined cycle performance. The ORC cycle can generate 1.41 kW of electricity from
the recovering heat rejected by the VCC condenser. The thermal and exergy efficiencies of the
ORC cycle are 3.05% and 39.3%, respectively. The overall system efficiency can be improved
from 3.1 for a standalone AC to 3.54 for the combined system.
Saleh [79] conducted an extensive investigation into a combined ORC-VCC systems in terms
of energy and exergy analysis, system performance under various working fluids, and working
parameters. The results indicated that the higher the critical temperature of the working fluid,
the better the COP and exergy efficiency achieved. R602 had the best performance with an
overall COP of 0.596 and exergy efficiency of 31.03%. Both COP and exergy efficiency
increase with a rising ORC boiler temperature and drop with increases in condenser
temperature. Increasing the HP evaporator temperature has a negative impact on exergy
Chapter 2: Literature review
41
efficiency and a positive influence on the overall COP. Similarly, increasing the turbine and
compressor efficiencies from 60% to 90% enhances both COP and exergy efficiency by
approximately 50%.
Yu, H., et al. [80] investigated the integration of an ORC with an HP cycle to enhance net power
output through waste heat recovery. The results showed that system performance is dependent
on the ORC evaporation temperature, the working fluid latent to sensible heat ratio, and waste
heat inlet temperature. The integration is assumed to be profitable when the following
conditions are satisfied: the ORC working fluid critical temperature is lower than the waste heat
inlet temperature, the latent to sensible heat ratio is small, and the COP of the HP is satisfactory.
The resultant improvement in net power output and waste heat recovery were 9.37% and
12.04%, respectively.
Different designs and applications of the combined ORC-VCC system have been proposed in
the literature. Patel, B., et al. [81, 82] presented an integrated ORC with a cascade VCC and
vapour absorption refrigeration system, as shown in Figure 2.7. The ORC cycle is used to power
the vapour compression refrigeration system and to provide the thermal requirements of the
vapour absorption refrigeration system by utilising the high temperature working fluid at the
ORC-expander outlet. The thermal efficiency achieved by the ORC subsystem and the
combined system are 7% and 79%, respectively. The calculated COP of the vapour
compression, vapour absorption and cascade system are 4.41, 0.75, and 0.54, respectively. The
thermos-economic evaluation reveals that the system can achieve energy efficiency of 22.3%
for the cooling mode and 79% for cogeneration mode (i.e., cooling and heating). The calculated
simple payback period thus ranges between 5.26 years (for the base case) and 4.5 years (for the
optimised case).
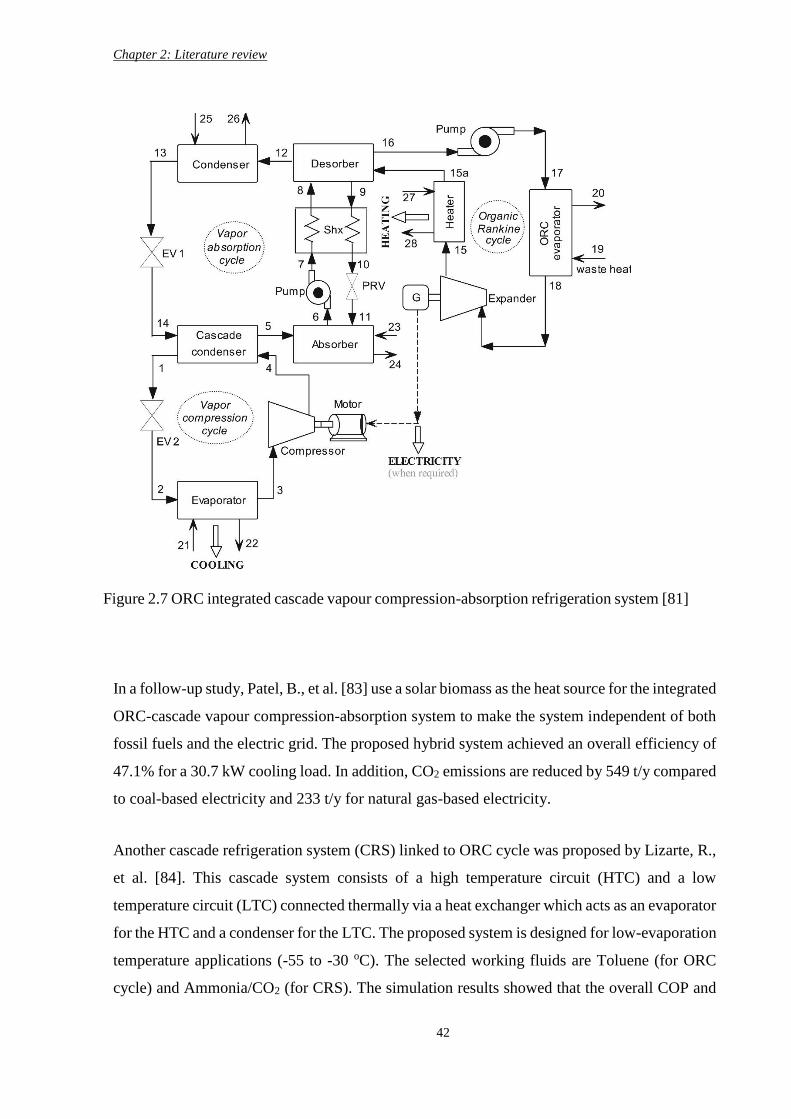
Chapter 2: Literature review
42
In a follow-up study, Patel, B., et al. [83] use a solar biomass as the heat source for the integrated
ORC-cascade vapour compression-absorption system to make the system independent of both
fossil fuels and the electric grid. The proposed hybrid system achieved an overall efficiency of
47.1% for a 30.7 kW cooling load. In addition, CO2 emissions are reduced by 549 t/y compared
to coal-based electricity and 233 t/y for natural gas-based electricity.
Another cascade refrigeration system (CRS) linked to ORC cycle was proposed by Lizarte, R.,
et al. [84]. This cascade system consists of a high temperature circuit (HTC) and a low
temperature circuit (LTC) connected thermally via a heat exchanger which acts as an evaporator
for the HTC and a condenser for the LTC. The proposed system is designed for low-evaporation
temperature applications (-55 to -30 oC). The selected working fluids are Toluene (for ORC
cycle) and Ammonia/CO2 (for CRS). The simulation results showed that the overall COP and
Figure 2.7 ORC integrated cascade vapour compression-absorption refrigeration system [81]
Chapter 2: Literature review
43
exergy efficiency are mainly affected by the evaporation temperature of the ORC cycle, the
LTC temperature, and the condensation temperatures. The system can achieve a maximum COP
of 0.79 (at an ORC evaporation temperature of 315 oC) and a peak exergy efficiency of 31.6%
(at an ORC evaporation temperature of 255 oC).
Bounefour and Ouadha [85] studied a combined system with a cascade evaporation in the ORC
cycle, with the aim of improving power production. The new design was compared to a standard
ORC-VCC combined system. A rang of working fluids were also compared in terms of both
design performances. Waste heat from a marine diesel engine is used to drive the ORC cycle in
both designs. The results showed that the addition of the cascade evaporation did improve the
ORC cycle performance; however, the overall combined system performance was comparable
to a standard ORC-VCC. In addition, Butane and Isobutane achieved better refrigerating effects
than R134a.
A similar cycle configuration was used to aid Claude liquefaction by cooling hydrogen gas
before entering liquefaction [86]. In this study, geothermal water is used as the heat source for
the ORC cycle. The combined system can cool hydrogen gas to -40 oC before entering the
liquefaction process with no extra work consumption. This proposed geothermally assisted
hydrogen liquefaction cycle can produce a reduction in hydrogen liquefaction production cost
of approximately 34% compared to the values cited in the literature.
An ORC-VCC cycle has also been combined with a hybrid proton exchange membrane fuel
cell (PEMFC) and solar energy in a residential micro-CCHP system [87]. The function of this
ORC cycle is to produce domestic hot water and mechanical power, while the VCC cycle
produces cooling/heating capacity. The proposed system can produce up to 14.5 kW of
heating/cooling capacity and around 8 kW of electricity based on the operating conditions.
Collings, P., et al. [88] investigated a gas driven ORC-vapour compression HP for domestic hot
water supply. This system has a direct coupling between the ORC-turbine and the HP-
compressor. The heat generated from natural gas combustion in the boiler is transferred to the
ORC cycle to produce the required mechanical power for the HP cycle. Cold tap water is
assumed to be heated from 10 to 60 oC, in three stages: HP-condenser, ORC-condenser and post
heater heat exchanger. The waste heat contained in the flue gases is recovered by the post heater
Chapter 2: Literature review
44
heat exchanger to lift the water temperature to the designated target. R134a and Hexane are the
working fluids selected for the HP and ORC cycles, respectively. The results showed that the
COP and thermal efficiency of the HP and ORC cycles are approximately 5 and 20%,
respectively. In addition, the combined system can achieve an overall fuel to heat efficiency of
between 136%-164% for an ambient temperature range of (-5 to 15 oC).
A similar gas driven ORC-HP integrated system has been investigated under various operating
conditions for hot water supply [89]. The main parameters that affect the combined system
performance were studied. Two system designs, one with a post-heater heat exchange and one
without it, were proposed and compared. In addition, a comparison of the system performance
under three ORC working fluids (R123, R 245fa and Hexane) was conducted. The results
showed that ambient air temperature and ORC-condensation temperature have significant
impacts on system performance. As ambient temperature increases from -5 to 5 oC, the heating
capacities of the HP-condenser and post heater heat exchanger increase. In addition, the HP
COP increases with the rise in ambient temperature, reaching a maximum value of 5.56 at an
air temperature of 5 oC. In contrast, a higher ORC-condensation temperature leads to lower
ORC thermal efficiency. At an ORC-condenser temperature of 61 oC, the system achieves its
optimum performance, with an ORC thermal efficiency of 15.34% and a fuel to heat efficiency
of 147.1%. Hexane, as an ORC working fluid, achieves better ORC thermal efficiency and
overall fuel to heat efficiency than R123 and R245fa. The comparative results for systems with
or without the post-heater heat exchanger showed that the role of the post-heater to the water
heating is limited as it can only add 0.28 kW of heat to the water. Furthermore, a combined
system without post-heater showed comparable results with a minimal effect on system
performance and fuel to heat efficiency (134% to 147% with post heater -132% to 145%
without post-heater).
Chapter 2: Literature review
45
2.4 Literature review on modelling of VCC and ORC cycles
In general, HP and ORC systems modelling can vary in complexity based on the intended
application and system design. The aim of the modelling can include; energy analysis, design
configuration, performance with various working fluid, performance over time and control
system design. The most commonly used modelling approaches are summarized as follow:
1. Balanced energy method: This modelling approach could be either theoretical or empirical
and it is mainly used for seasonal energy use and economics. In this method, the system
performance is assumed constant and can be obtained from either the manufacturer or
experimental or field measurement. In addition, there is no limitation on heat source
availability. The heating demand for the HP cycle is assumed to be fully satisfied. However,
the limitations of this modelling method is the lack of accuracy and utility [90].
2. Steady state method: It is a theoretical evaluation used for system design and sizing. This
approach usually begins by adopting the mass conservation principle, in which refrigerant mass
flow across the cycle components is equal. Next, the energy conservation principle is applied
which involved applying the first law of thermodynamic to each cycle part and on the overall
cycle with the assumption of neglecting the kinetic and potential energies. Then a non-
conservation of entropy principle is used to identify the entropy rate balance for the system
components. Exergy analysis usually follows with the aim of estimating the exergy destruction
rate and exergy efficiency of individual cycle components and the overall system [91].
Number of simulation studies in the open literature have adopted the steady state model to
investigate the performance of the HP and ORC cycles in terms of energy and exergy analysis.
Mikielewicz, D. and Wajs, J. [92] have conducted a study on a single stage and cascade HP
system employing a high heat source and condensation temperatures. Wang, G-B. and Zhang
X-R. [93] carried out thermoeconomic evaluation of a transcritical CO2 HP system for district
heating and cooling. Another thermoeconomic study is conducted using steady state model to
investigate a HP cycle coupled with desalination system [94]. An energy and exergy analysis
is also conducted on a HP cycle integrated with vapor injection system and an economizer [95].
Chapter 2: Literature review
46
For an ORC cycle, many studies have investigated the performance of an ORC cycle as a waste
heat recovery system from an internal combustion engine. These studies were mainly conducted
using the steady state model in terms of mass, energy and entropy conservation laws [45, 68,
96].
For a combined ORC-VCC system, most of the studies mentioned in the literature review
(section 2.3.4) have adopted the steady state model to evaluate the system performance.
3. Fitted (regression) model: It is an empirical approach for seasonal energy use and economics
evaluation. This method is based on using equations or curve fitting if detailed performance
data for the device is known from experimental or manufacturer source. It have the advantage
of being easy to generate and use with high accuracy. Yet, the accuracy of the results is limited
to the range of data available for the fitted model [97].
Underwood, C., et al. [97] have adopted the fitted model to investigate the performance of three
scroll compressor for domestic air source HP water heater. Woodland, B., et al. [98] have
conducted an experimental study on a small-scale organic Rankine cycle with R134a as
working fluid. The performance curve of a compressor rotating in reverse as an expander was
used in their mathematical model. Similarly, expander performance curve for an ORC cycle
with R245fa refrigerant is used in another research by Declaye, S., et al. [99]. Experimental test
was conducted on an automotive electric scroll compressor using empirical equation [100].
4. Dynamic state method: It is theoretical method to study the variation in cycle performance
with respect to time, particularly when independent variables and boundary conditions are not
constant. For most thermal cycles, steady state evaluation is considered satisfactory if the
system dependent parameters are thermally stabilised within the relevant time-step for that
system. For instance, in a heat pump cycle, if the response to the input variable occurs within
seconds up to a few minutes, then the steady state simulation (also called the quasi steady state)
satisfies the performance evaluation process. However, when more detailed information about
the system performance is required or when control strategies are investigated, then a dynamic
model is likely to be needed [90].
Underwood [90] has illustrated a steady state and a full dynamic model for a heat pump cycle
used in a ground source heat pump system. The evaporator and condenser dynamic model was

Chapter 2: Literature review
47
conducted under the assumptions of no momentum conservation or pressure losses, with axial
variation in flow direction. Another dynamic simulation of an air sourced HP system is
conducted with the aim of keeping the evaporator frost-free. The mathematical model was
compared with experimental results which showed good agreement [101].
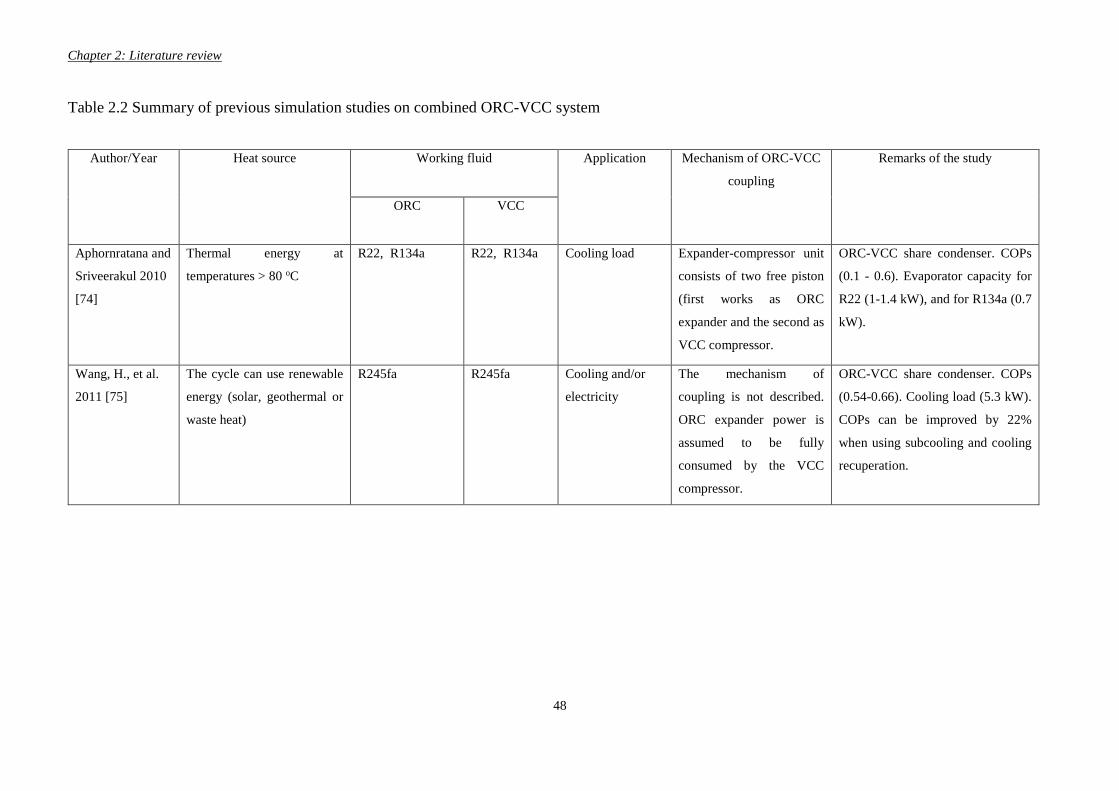
Chapter 2: Literature review
48
Table 2.2 Summary of previous simulation studies on combined ORC-VCC system
Author/Year Heat source Working fluid Application Mechanism of ORC-VCC
coupling
Remarks of the study
ORC VCC
Aphornratana and
Sriveerakul 2010
[74]
Thermal energy at
temperatures > 80 oC
R22, R134a R22, R134a Cooling load Expander-compressor unit
consists of two free piston
(first works as ORC
expander and the second as
VCC compressor.
ORC-VCC share condenser. COPs
(0.1 - 0.6). Evaporator capacity for
R22 (1-1.4 kW), and for R134a (0.7
kW).
Wang, H., et al.
2011 [75]
The cycle can use renewable
energy (solar, geothermal or
waste heat)
R245fa R245fa Cooling and/or
electricity
The mechanism of
coupling is not described.
ORC expander power is
assumed to be fully
consumed by the VCC
compressor.
ORC-VCC share condenser. COPs
(0.54-0.66). Cooling load (5.3 kW).
COPs can be improved by 22%
when using subcooling and cooling
recuperation.

Chapter 2: Literature review
49
Kim and Perez-
Blanco 2015 [76]
Low grade sensible heat: 150
oC.
R143a, R22,
R134a, R152a,
propane,
ammonia,
isobutane and
Butane
R143a, R22,
R134a, R152a,
propane,
ammonia,
isobutane and
Butane
Refrigeration only
when all the
power generated
is consumed
within the cycle,
or refrigeration
and electricity
The mechanism of
coupling is not described.
The net power production
is equal to the subtraction
of compressor and pump
power from expander
power.
ORC-VCC share condenser. Pure
refrigeration capacity: Butane or
Isobutane (140 kW), R134a or
R152a (170 kW). Cogeneration
mode (Isobutane): thermal
efficiency (50-75%), net power (25-
30 kW), refrigeration capacity (140-
160 kW).
Molés, F., et al.
2015 [77]
Low temperature heat source 1336mzz 1234ze Cooling load or
electricity when
cooling is not
required.
The mechanism of
coupling is not described.
ORC expander power is
assumed to be fully
consumed by the VCC
compressor.
ORC efficiency 12.4%, VCC COP
6.16. Cooling load 100 kW,
electricity 16.23 kW.
Asim, M., et al.
2017 [78]
Waste heat from AC air
conditioner
R123 R600a Electricity VCC is not driven by the
ORC.
COPs improved from (3.1-3.54).
ORC electric output power 1.41 kW
and thermal efficiency 3.05%. AC
cooling capacity 35 kW.
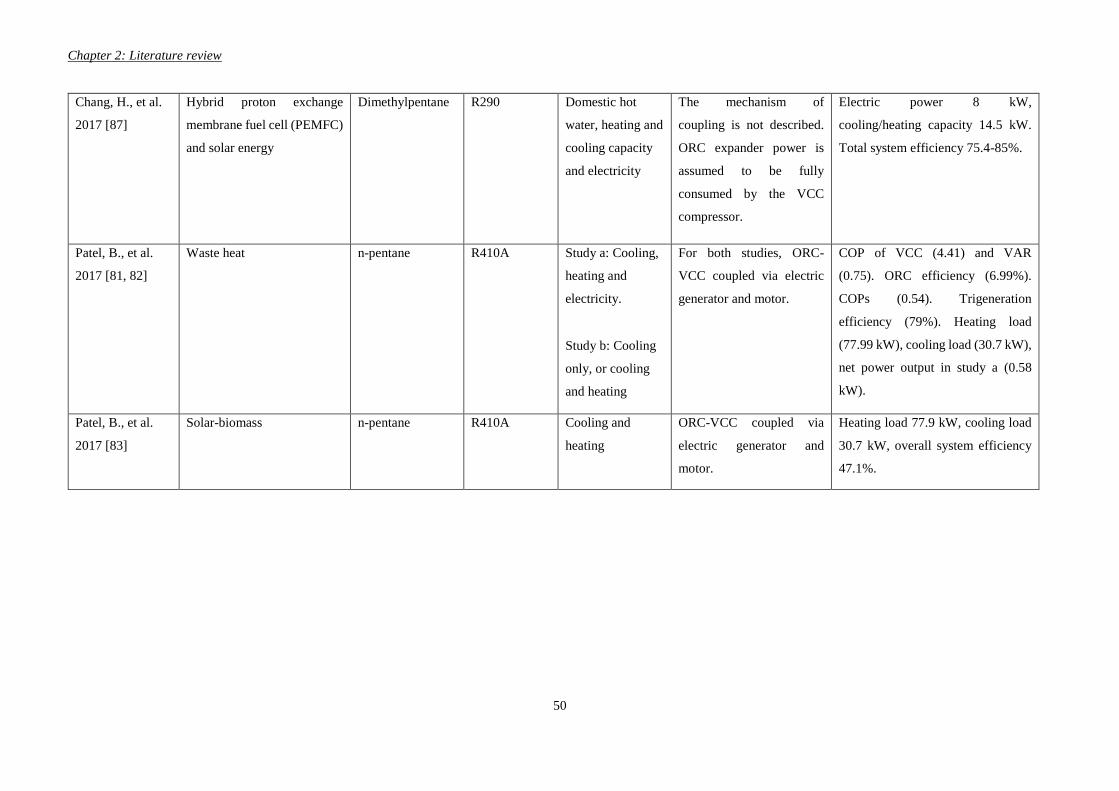
Chapter 2: Literature review
50
Chang, H., et al.
2017 [87]
Hybrid proton exchange
membrane fuel cell (PEMFC)
and solar energy
Dimethylpentane R290 Domestic hot
water, heating and
cooling capacity
and electricity
The mechanism of
coupling is not described.
ORC expander power is
assumed to be fully
consumed by the VCC
compressor.
Electric power 8 kW,
cooling/heating capacity 14.5 kW.
Total system efficiency 75.4-85%.
Patel, B., et al.
2017 [81, 82]
Waste heat n-pentane R410A Study a: Cooling,
heating and
electricity.
Study b: Cooling
only, or cooling
and heating
For both studies, ORC-
VCC coupled via electric
generator and motor.
COP of VCC (4.41) and VAR
(0.75). ORC efficiency (6.99%).
COPs (0.54). Trigeneration
efficiency (79%). Heating load
(77.99 kW), cooling load (30.7 kW),
net power output in study a (0.58
kW).
Patel, B., et al.
2017 [83]
Solar-biomass n-pentane R410A Cooling and
heating
ORC-VCC coupled via
electric generator and
motor.
Heating load 77.9 kW, cooling load
30.7 kW, overall system efficiency
47.1%.
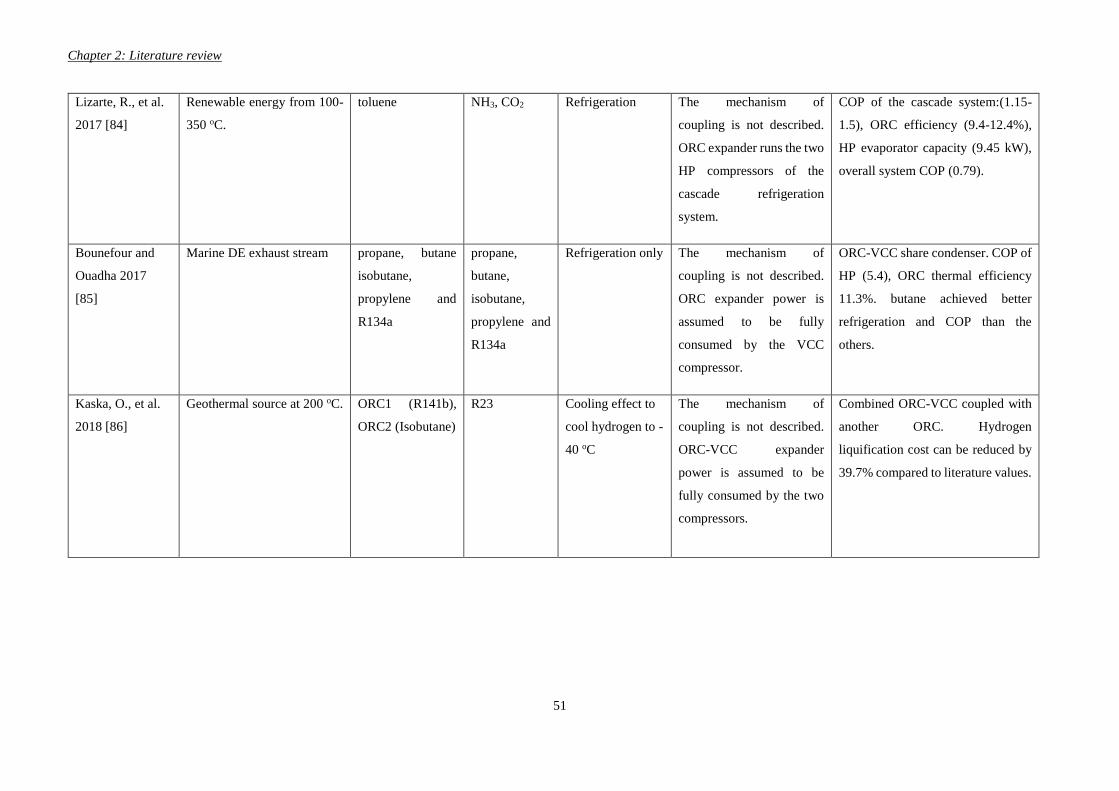
Chapter 2: Literature review
51
Lizarte, R., et al.
2017 [84]
Renewable energy from 100-
350 oC.
toluene NH3, CO2 Refrigeration The mechanism of
coupling is not described.
ORC expander runs the two
HP compressors of the
cascade refrigeration
system.
COP of the cascade system:(1.15-
1.5), ORC efficiency (9.4-12.4%),
HP evaporator capacity (9.45 kW),
overall system COP (0.79).
Bounefour and
Ouadha 2017
[85]
Marine DE exhaust stream propane, butane
isobutane,
propylene and
R134a
propane,
butane,
isobutane,
propylene and
R134a
Refrigeration only The mechanism of
coupling is not described.
ORC expander power is
assumed to be fully
consumed by the VCC
compressor.
ORC-VCC share condenser. COP of
HP (5.4), ORC thermal efficiency
11.3%. butane achieved better
refrigeration and COP than the
others.
Kaska, O., et al.
2018 [86]
Geothermal source at 200 oC. ORC1 (R141b),
ORC2 (Isobutane)
R23 Cooling effect to
cool hydrogen to -
40 oC
The mechanism of
coupling is not described.
ORC-VCC expander
power is assumed to be
fully consumed by the two
compressors.
Combined ORC-VCC coupled with
another ORC. Hydrogen
liquification cost can be reduced by
39.7% compared to literature values.
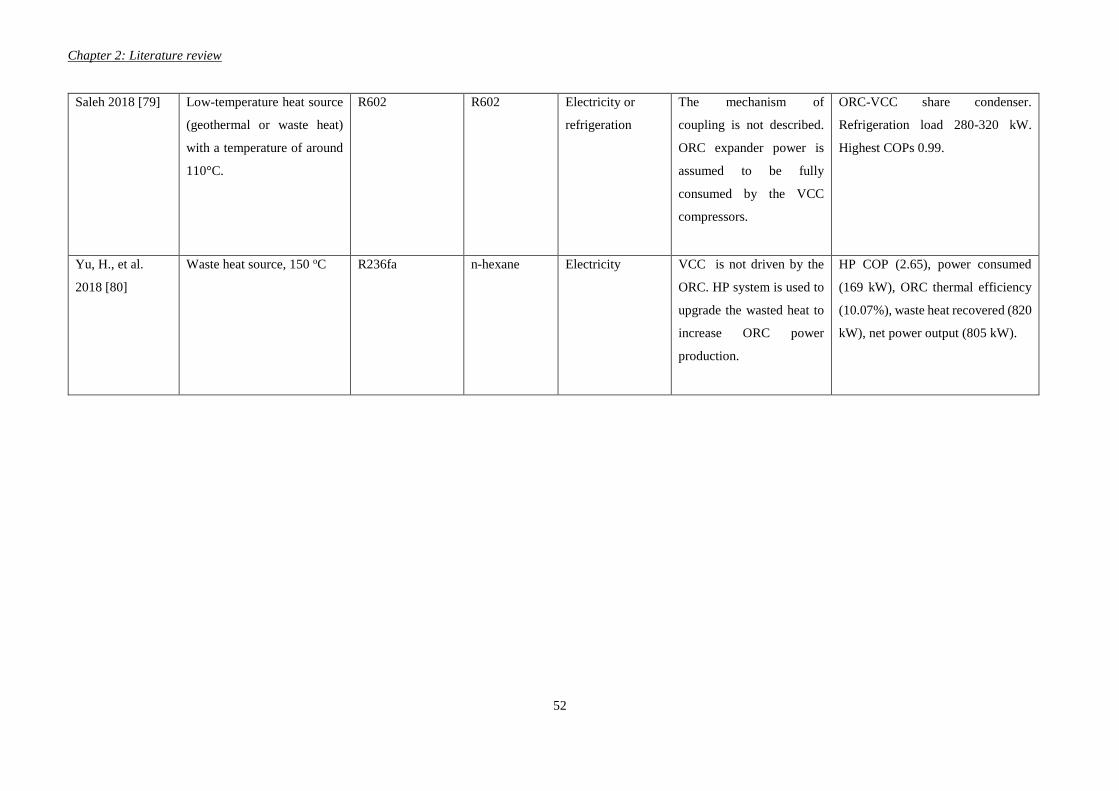
Chapter 2: Literature review
52
Saleh 2018 [79] Low-temperature heat source
(geothermal or waste heat)
with a temperature of around
110°C.
R602 R602 Electricity or
refrigeration
The mechanism of
coupling is not described.
ORC expander power is
assumed to be fully
consumed by the VCC
compressors.
ORC-VCC share condenser.
Refrigeration load 280-320 kW.
Highest COPs 0.99.
Yu, H., et al.
2018 [80]
Waste heat source, 150 oC R236fa n-hexane Electricity VCC is not driven by the
ORC. HP system is used to
upgrade the wasted heat to
increase ORC power
production.
HP COP (2.65), power consumed
(169 kW), ORC thermal efficiency
(10.07%), waste heat recovered (820
kW), net power output (805 kW).
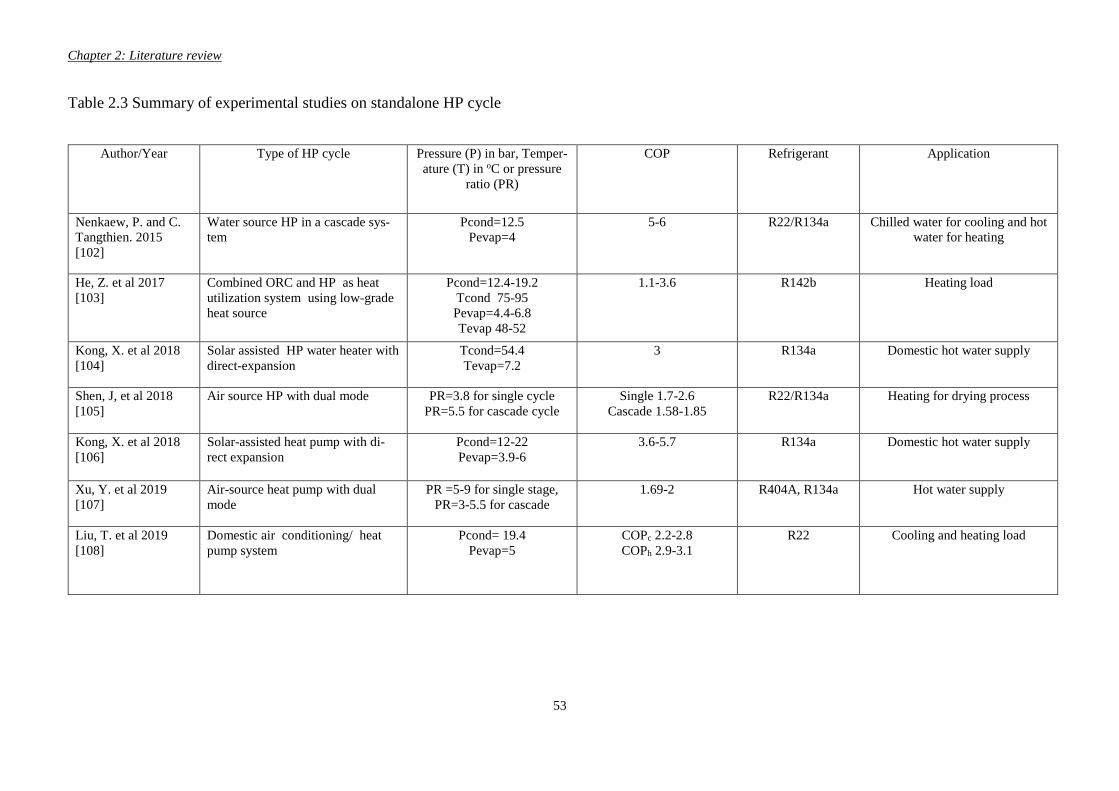
Chapter 2: Literature review
53
Table 2.3 Summary of experimental studies on standalone HP cycle
Author/Year Type of HP cycle Pressure (P) in bar, Temper-
ature (T) in oC or pressure
ratio (PR)
COP Refrigerant Application
Nenkaew, P. and C.
Tangthien. 2015
[102]
Water source HP in a cascade sys-
tem
Pcond=12.5
Pevap=4
5-6 R22/R134a Chilled water for cooling and hot
water for heating
He, Z. et al 2017
[103] Combined ORC and HP as heat
utilization system using low-grade
heat source
Pcond=12.4-19.2
Tcond 75-95 Pevap=4.4-6.8
Tevap 48-52
1.1-3.6 R142b Heating load
Kong, X. et al 2018
[104] Solar assisted HP water heater with
direct-expansion
Tcond=54.4
Tevap=7.2
3 R134a Domestic hot water supply
Shen, J, et al 2018
[105] Air source HP with dual mode PR=3.8 for single cycle
PR=5.5 for cascade cycle
Single 1.7-2.6
Cascade 1.58-1.85
R22/R134a Heating for drying process
Kong, X. et al 2018
[106] Solar-assisted heat pump with di-
rect expansion
Pcond=12-22
Pevap=3.9-6
3.6-5.7 R134a Domestic hot water supply
Xu, Y. et al 2019
[107] Air-source heat pump with dual
mode
PR =5-9 for single stage,
PR=3-5.5 for cascade
1.69-2 R404A, R134a Hot water supply
Liu, T. et al 2019
[108] Domestic air conditioning/ heat
pump system
Pcond= 19.4
Pevap=5
COPc 2.2-2.8 COPh 2.9-3.1
R22 Cooling and heating load
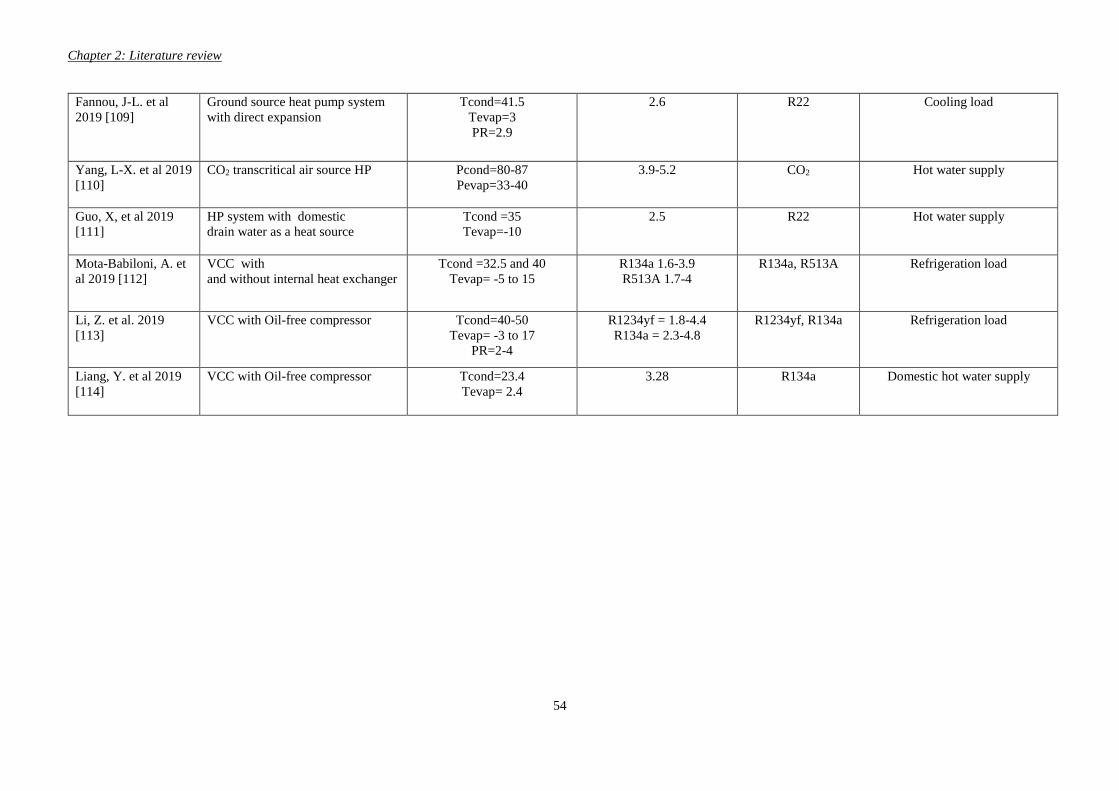
Chapter 2: Literature review
54
Fannou, J-L. et al
2019 [109] Ground source heat pump system
with direct expansion
Tcond=41.5
Tevap=3
PR=2.9
2.6 R22 Cooling load
Yang, L-X. et al 2019
[110] CO2 transcritical air source HP Pcond=80-87
Pevap=33-40
3.9-5.2 CO2 Hot water supply
Guo, X, et al 2019
[111] HP system with domestic
drain water as a heat source
Tcond =35
Tevap=-10
2.5 R22 Hot water supply
Mota-Babiloni, A. et
al 2019 [112] VCC with
and without internal heat exchanger
Tcond =32.5 and 40
Tevap= -5 to 15
R134a 1.6-3.9
R513A 1.7-4
R134a, R513A Refrigeration load
Li, Z. et al. 2019
[113] VCC with Oil-free compressor Tcond=40-50
Tevap= -3 to 17
PR=2-4
R1234yf = 1.8-4.4
R134a = 2.3-4.8
R1234yf, R134a Refrigeration load
Liang, Y. et al 2019
[114] VCC with Oil-free compressor Tcond=23.4
Tevap= 2.4
3.28 R134a Domestic hot water supply
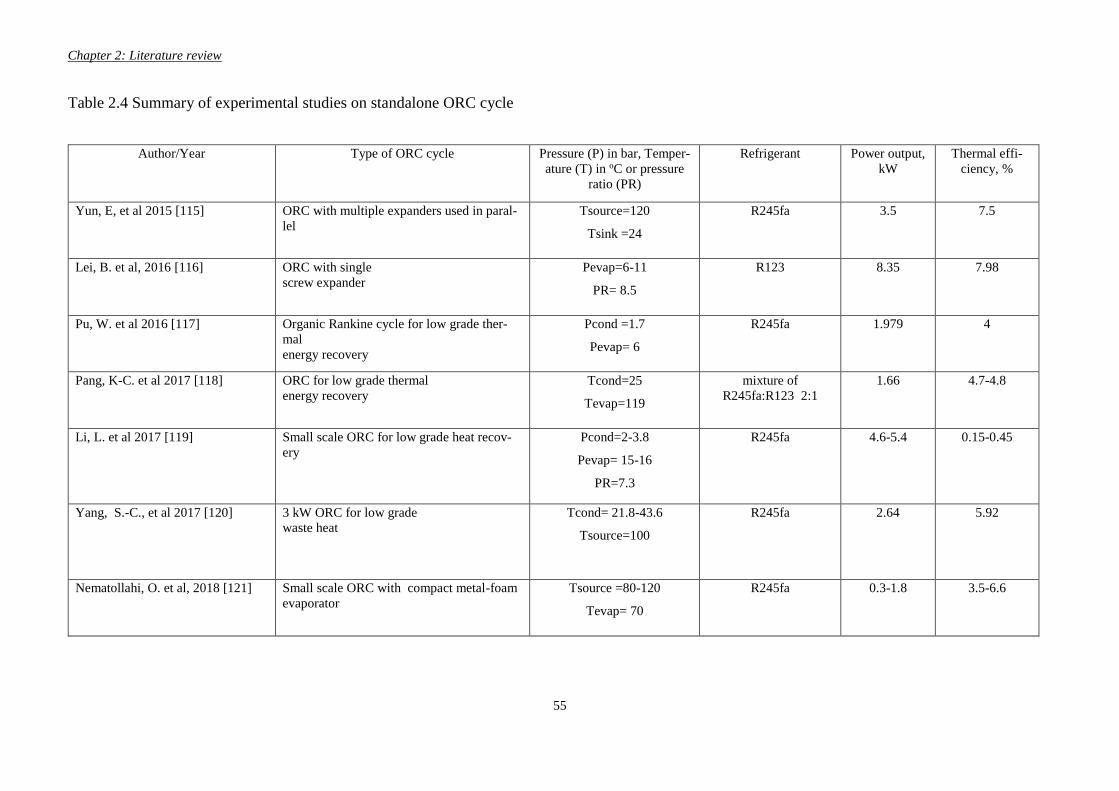
Chapter 2: Literature review
55
Table 2.4 Summary of experimental studies on standalone ORC cycle
Author/Year Type of ORC cycle Pressure (P) in bar, Temper-
ature (T) in oC or pressure
ratio (PR)
Refrigerant Power output,
kW
Thermal effi-
ciency, %
Yun, E, et al 2015 [115] ORC with multiple expanders used in paral-
lel
Tsource=120
Tsink =24
R245fa 3.5 7.5
Lei, B. et al, 2016 [116] ORC with single
screw expander
Pevap=6-11
PR= 8.5
R123 8.35 7.98
Pu, W. et al 2016 [117] Organic Rankine cycle for low grade ther-
mal
energy recovery
Pcond =1.7
Pevap= 6
R245fa 1.979 4
Pang, K-C. et al 2017 [118] ORC for low grade thermal
energy recovery
Tcond=25
Tevap=119
mixture of
R245fa:R123 2:1
1.66 4.7-4.8
Li, L. et al 2017 [119] Small scale ORC for low grade heat recov-
ery
Pcond=2-3.8
Pevap= 15-16
PR=7.3
R245fa 4.6-5.4 0.15-0.45
Yang, S.-C., et al 2017 [120] 3 kW ORC for low grade
waste heat
Tcond= 21.8-43.6
Tsource=100
R245fa 2.64 5.92
Nematollahi, O. et al, 2018 [121] Small scale ORC with compact metal-foam
evaporator
Tsource =80-120
Tevap= 70
R245fa 0.3-1.8 3.5-6.6
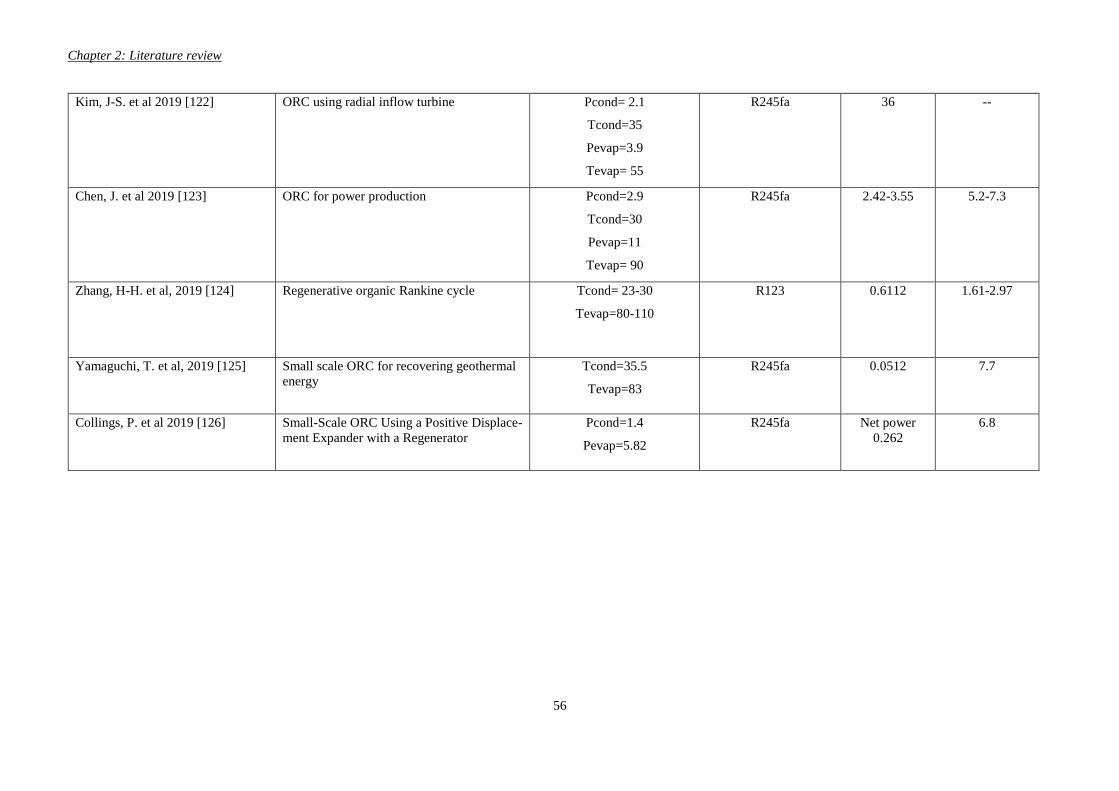
Chapter 2: Literature review
56
Kim, J-S. et al 2019 [122] ORC using radial inflow turbine Pcond= 2.1
Tcond=35
Pevap=3.9
Tevap= 55
R245fa 36 --
Chen, J. et al 2019 [123] ORC for power production Pcond=2.9
Tcond=30
Pevap=11
Tevap= 90
R245fa 2.42-3.55 5.2-7.3
Zhang, H-H. et al, 2019 [124] Regenerative organic Rankine cycle Tcond= 23-30
Tevap=80-110
R123 0.6112 1.61-2.97
Yamaguchi, T. et al, 2019 [125] Small scale ORC for recovering geothermal
energy
Tcond=35.5
Tevap=83
R245fa 0.0512 7.7
Collings, P. et al 2019 [126] Small-Scale ORC Using a Positive Displace-
ment Expander with a Regenerator
Pcond=1.4
Pevap=5.82
R245fa Net power
0.262
6.8
Chapter 2: Literature review
57
2.5 Summary and discussion of literatures related to ORC and VCC cycles
Various integrated designs of the combined ORC-VCC cycle have been proposed in the
literature. Table 2.2 summarizes the main findings related to this system. In terms of
applications, this combined cycle was mainly designed for cooling, refrigeration and/or
electricity generation [74-78, 80, 82, 84-86]. These is limited studies on the use of this
combined system for heating applications particularly on for domestic hot water and central
heating applications.
From design prospective, the mechanism of coupling between ORC and VCC cycles is not
described. Most researches have assumed that the power produced by the ORC expander is
fully consumed by the VCC compressor. This have the proposed advantage of eliminating the
conversion loses associated with use of electric generator and motor [77, 79]. Other studies
have proposed that the ORC power is used to electrically drive the HP cycle via a generator and
motor [81-83].
Working fluids have a significant impact on the performance of a combined ORC-VCC system.
Various working fluids have been selected and analysed in the literature. Kim and Perez-Blanco
[76] and Bounefour and Ouadha [85] conducted a comparison study involving different
working fluids used in a combined ORC-VCC cycle in which both cycles share the same
working fluids. The results supported that different refrigerants achieved high performance in
different applications. For example, R134a or R152a are found to be favourable for refrigeration
uses, while Isobutane shows better performance for cogeneration applications [85].
Various methods have been used in the literature to assess combined cycle performance,
including individual cycle efficiency as well as combined system efficiency. Some researchers
have defined combined system efficiency as the ratio of HP evaporator thermal energy to net
ORC evaporator thermal energy and pump work [74-77]. This ratio has mainly been used for
systems designed to produce cooling, refrigeration, or electricity production. The combined
cycle efficiency is highly dependent on the type of refrigerant and the working conditions. In
average, the combined system efficiency (COPs) ranged between 0.5-0.6 for most cooling and
refrigeration application. While for heating application, limit researches have shown the
combined system can achieved an overall efficiency of 0.7-0.8.
Chapter 2: Literature review
58
Table 2.3 summarizes the main outcome of a standalone VCC studied experimentally in the
literature. For heating and cooling applications, the VCC performance varied mainly with the
selected working fluid and evaporation and condensation pressure and temperature. Various
pure and mixed refrigerant are used including; R22, R134a, R142b, R404a, CO2, R1234yf and
R513a. The average coefficient of performance for most experimentally test VCC cycle is
approximately 3 for heating application and around 2.5 for cooling and refrigeration.
Table 2.4 listed some experimental researches conducted on standalone ORC cycle. Similar to
the VCC, ORC performance mainly influence by the refrigerant used and pressure ratio between
the evaporator and condenser. The main selected working fluids are R245fa and R123. On
average, the ORC can produce an output power between 2.5-3.5 kW and have thermal
efficiency in the range of 4-7%.
Chapter 2: Literature review
59
2.6 Justifications for the current research
The literature review in this chapter has illustrated that cogeneration and trigeneration
integrated systems are innovative technologies in which the primary energy source can be
converted into multi energy mode with the potential of recovering wasted heat to enhance the
overall system thermal performance. Therefore, these technologies have been used in a wide
spectrum of applications. Furthermore, they have the potential of reducing fossil fuel
consumption and greenhouse gas emissions.
An ORC heat engine and its reverse vapour compression cycle are mature and efficient cycles
that can be used on their own, combined with other cycles, or combined with each other.
Combining ORC with VCC system has the advantage of eliminating some of the limitations
encountered in a standalone HP and ORC cycles mentioned in chapter one. In addition, the
ORC cycle is different from other prime movers in that it rejects heat in the form of latent heat
through working fluid condensation rather than sensible heat. This means that more heat can be
recovered making the ORC a more efficient heat recovery system. The same concept is true for
the heat pump cycle. Based on these factors, an integrated ORC-VCC system have been
designed and investigated in this research.
Working fluids selection is shown to have a significant influence on thermodynamic cycle
performance. Some studies have suggested using different working fluids in each cycle rather
than sharing the same one. The advantage of this approach is that it can enhance system
efficiency and avoid the complexity involved in using controls and adjustment devices such as
expansion valves and mixing chambers. To investigate and select the most appropriate working
fluids for the ORC and VCC cycles proposed in our research, a list of working fluids have been
studied and compared in chapter four.
From an applications point of view, the combined ORC-VCC has mainly been investigated in
relation to cooling/refrigeration, electricity, or a combination of the two. Limited research is
available on the application of the combined cycle in heating applications. Thus, the combined
system designed in this research is investigated mainly for heating applications including
domestic hot water supply and central heating as well as cooling applications. Furthermore, the
use of combined ORC-VCC cycle as a waste heat recovery system from diesel engine wasted

Chapter 2: Literature review
60
heat is an interesting topic that has not been extensively investigated in the literature. This
investigation will allow to evaluate the effectiveness of the combined ORC-VCC system in
converting the wasted heat into useful refrigeration load.
The definition of combined system efficiency is necessarily influenced by the cycle design and
objective. In our study, in addition to the HP coefficient of performance and ORC thermal
efficiency, the concept of fuel to heat efficiency is used in the evaluation of the combined cycle
performance. The fuel to heat efficiency is defined as the total heating capacity of the system
added to water to the heat released from burning the fuel. This parameter is useful when the
primary energy source is the combustion of fossil fuels.
To the best of the author’s knowledge, based on the extensive literature review, the integrated
system investigated in this thesis has never been proposed before. In our research we therefore
propose a novel configuration of a gas fuelled ORC-VCC system with direct coupling between
the ORC turbine and HP compressor. The ORC output power and heat is fully utilized for heat
application. Furthermore, heat in ambient air is utilized in the HP cycle as a free energy source.
The system is designed to recover wasted heat from burner flue gases, diesel engine exhaust,
or data centre IT equipment to enhance system performance. Different working fluids are used
in each cycle based on their performance. The intended applications of this system include
domestic hot water, data centre cooling with simultaneous central heating, and providing a
refrigeration load.
Chapter 3: Theory of the combined ORC-VCC cycles
61
Chapter 3: Theory of the combined ORC-VCC cycles
3.1 Introduction
In this part of the thesis, the thermodynamic concept of the organic Rankine cycle and its reverse
heat pump cycle are described thermodynamically. The mathematical algorithm for the power
transferred between the two cycles and the thermal energy received and rejected in both cycles
are described theoretically. A performance evaluation of the combined cycle is described based
on first and second laws of thermodynamics. The thermal modelling of the gas burner and the
optimization procedure using the pinch point temperature approach for the heat exchangers are
also set out. The MATLAB code used in modelling the combined cycle is explained in detail
using the working fluid thermophysical properties software. This chapter also describes the
dynamic model and the PID controller used in the control strategy.
3.2 Vapour compression heat pump cycle (VCC-HP)
A vapour compression heat pump cycle is a reverse heat engine cycle which consumes
mechanical power to pump heat from a low grade heat source into a high temperature heat sink.
In addition to the working fluid, four main thermodynamic processes are essential to accomplish
this: the compression process state (1-2), the condensation process state (2-3), the expansion
process state (3-4), and the evaporation process state (4-1), as shown in the T-s (temperature
entropy) diagram in Figure (3.1) [127].
Each thermodynamic process can be mathematically analysed using the steady state flow
energy equation and by neglecting the changes in kinetic energy 𝐶2
2⁄ = 0 and potential energy
𝑍𝑔 = 0 as shown in Equation 3.1.
�� (ℎ1 +𝐶1
2
2+𝑍1𝑔) + �� + �� = �� (ℎ2 +
𝐶22
2+𝑍2𝑔) (3.1)
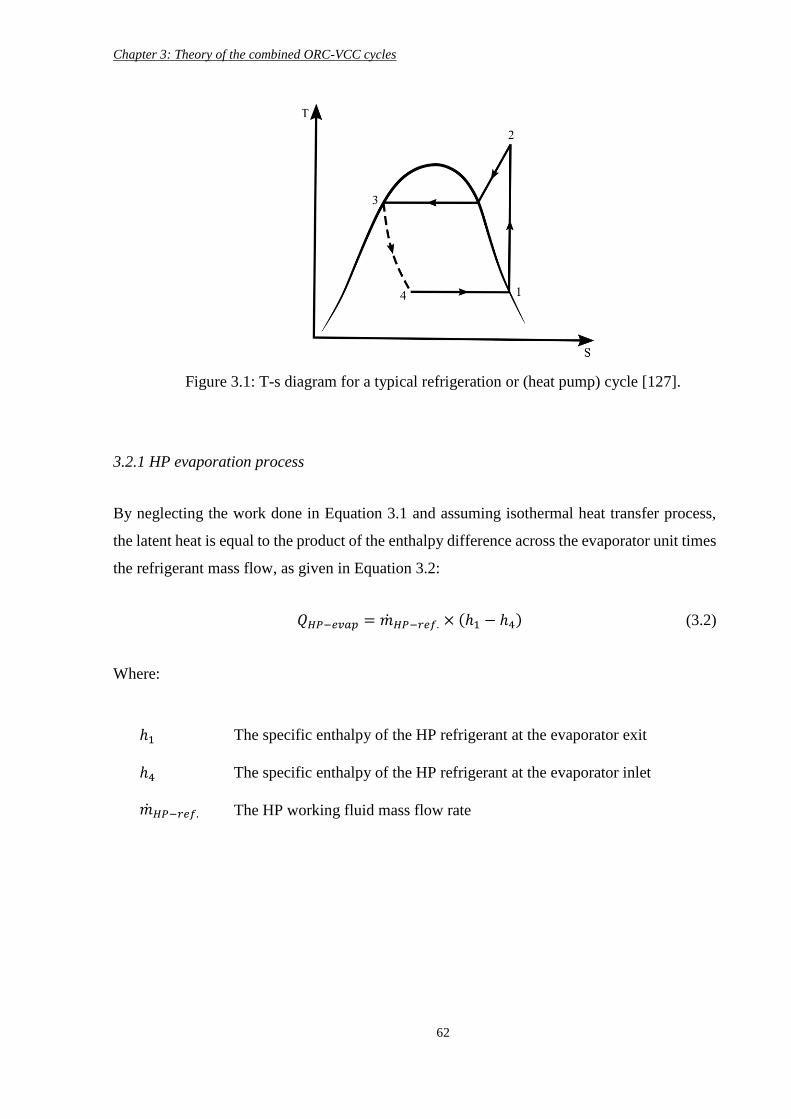
Chapter 3: Theory of the combined ORC-VCC cycles
62
3.2.1 HP evaporation process
By neglecting the work done in Equation 3.1 and assuming isothermal heat transfer process,
the latent heat is equal to the product of the enthalpy difference across the evaporator unit times
the refrigerant mass flow, as given in Equation 3.2:
𝑄𝐻𝑃−𝑒𝑣𝑎𝑝 = ��𝐻𝑃−𝑟𝑒𝑓. × (ℎ1 − ℎ4) (3.2)
Where:
ℎ1 The specific enthalpy of the HP refrigerant at the evaporator exit
ℎ4 The specific enthalpy of the HP refrigerant at the evaporator inlet
��𝐻𝑃−𝑟𝑒𝑓. The HP working fluid mass flow rate
Figure 3.1: T-s diagram for a typical refrigeration or (heat pump) cycle [127].
Chapter 3: Theory of the combined ORC-VCC cycles
63
3.2.2 HP compression process
By assuming an adiabatic thermodynamic process across the compressor (Q=0), the work
consumed by the compressor is the enthalpy difference at the compressor unit inlet (ℎ1) and the
outlet (ℎ2) multiplied by the working fluid mass flow; see Equation 3.3:
𝑊𝐻𝑃 = ��𝐻𝑃−𝑟𝑒𝑓. × (ℎ2 − ℎ1) (3.3)
This mechanical work is used to increase the working fluid pressure and hence the temperature
between the evaporator and the condenser. Therefore, the difference between the evaporation
and condensation temperatures is called the temperature lift across the HP cycle.
3.2.3 HP condensation process
In making the same assumptions regarding the heat and work used in the evaporator, the
condensation process is carried out by rejecting the latent heat to the sink source. The total
amount of the thermal energy is equal to the difference in the specific enthalpy at the condenser
inlet (ℎ2) and outlet (ℎ3) multiplied by the working fluid mass flow rate(��𝐻𝑃−𝑟𝑒𝑓.), as
demonstrated in Equation 3.4:
𝑄𝐻𝑃−𝑐𝑜𝑛𝑑. = ��𝐻𝑃−𝑟𝑒𝑓. × (ℎ2 − ℎ3) (3.4)
3.2.4 HP expansion process
The function of the expansion valve is to reduce the pressure of the refrigerant from the high
discharged pressure (condenser pressure) to the low suction pressure (evaporator pressure). This
process in the analytical evaluation is assumed to be an isenthalpic expansion process. In other
words, the enthalpy of the refrigerant before and after the expansion valve is equal.
ℎ3 = ℎ4 (3.5)
Chapter 3: Theory of the combined ORC-VCC cycles
64
3.2.5 Heat pump first law of thermodynamic
The Carnot law for a heat pump cycle states that the maximum theoretical efficiency is equal
to the ratio between the temperature of the hot reservoir over the temperature difference
between the hot and cold reservoirs. Therefore, the actual heating coefficient of performance
for a HP cycle is equal to the ratio between the total heat rejected by the condenser over the
work consumed by the compressor, which is given in Equation 3.6:
𝐶𝑂𝑃ℎ𝑒𝑎𝑡𝑖𝑛𝑔 =𝑄𝐻𝑃−𝑐𝑜𝑛𝑑.
𝑊𝐻𝑃 (3.6)
Meanwhile for the refrigerator, it is the ratio between the thermal energy absorbed by the
evaporator over the compressor power as shown in Equation 3.7:
𝐶𝑂𝑃𝑐𝑜𝑜𝑙𝑖𝑛𝑔 =𝑄𝐻𝑃−𝑒𝑣𝑎𝑝
𝑊𝐻𝑃 (3.7)
The coefficient of performance (COP) is used as an evaluation performance parameter for a
heat pump cycle. The COP reported in the literature for a vapour compression heat pump cycle
ranges between (2.5-5) however, it is dependent on the temperature lift across the HP cycle
(heat source and sink temperatures) and the working fluid used. Correa and Cuevas [128]
conducted a simulation study on an air-water heat pump, and their results showed that the
annual COP varied between 2.54 and 2.6. Ju, F., et al. [129] carried out an experimental study
on a heat pump water heater adopting an eco-friendly working fluid which was a mixture
(12%/88% by mass) of R744/R290 instead of R22. The results showed that the HP system with
the mixture working fluid achieved a COP of 4.731, 11% higher than that of R22. Willem, H.,
et al. [130] reported in their review study that most of the current heat pump water heat systems
achieve a COP of between 1.8-2.5; however, some innovative new technologies have been
implemented on a HP cycle that could enhance the COP to a range of 2.8-5.5. An example of
these technologies is the multi-functional (combined heating and cooling) application. Liang,
Y., et al. [89] investigated a combined ORC-HP gas fuelled water heater. The working fluid for
the HP cycle was R134a and the optimum COP obtained in their steady state simulation results
was around 5.
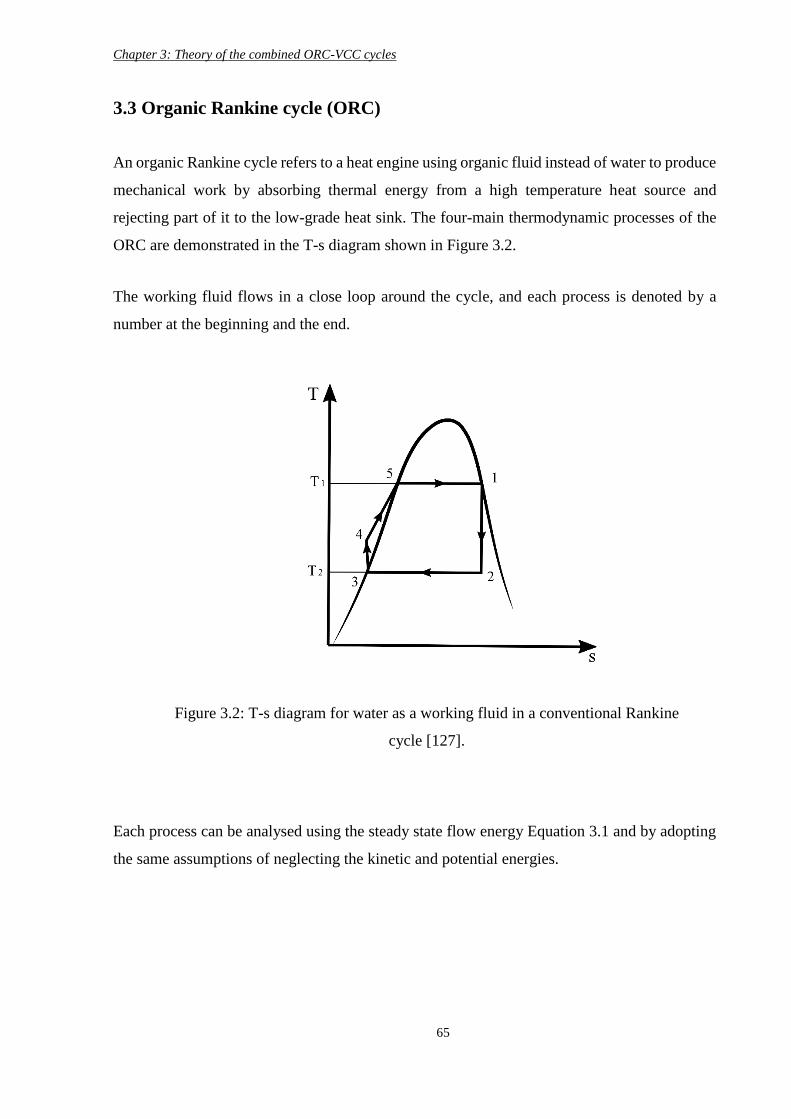
Chapter 3: Theory of the combined ORC-VCC cycles
65
3.3 Organic Rankine cycle (ORC)
An organic Rankine cycle refers to a heat engine using organic fluid instead of water to produce
mechanical work by absorbing thermal energy from a high temperature heat source and
rejecting part of it to the low-grade heat sink. The four-main thermodynamic processes of the
ORC are demonstrated in the T-s diagram shown in Figure 3.2.
The working fluid flows in a close loop around the cycle, and each process is denoted by a
number at the beginning and the end.
Each process can be analysed using the steady state flow energy Equation 3.1 and by adopting
the same assumptions of neglecting the kinetic and potential energies.
Figure 3.2: T-s diagram for water as a working fluid in a conventional Rankine
cycle [127].
Chapter 3: Theory of the combined ORC-VCC cycles
66
3.3.1 ORC evaporator
The latent thermal energy absorbed by the ORC working fluid in the evaporator (state 4-5-1 in
Figure 3.2) [127], is the product of the enthalpy difference across the evaporator multiplied by
the ORC refrigerant mass flow, as shown in Equation 3.8:
𝑄𝑂𝑅𝐶−𝑒𝑣𝑎𝑝 = ��𝑂𝑅𝐶−𝑟𝑒𝑓. × (ℎ1 − ℎ4) (3.8)
Where:
ℎ1 The specific enthalpy of the refrigerant at the evaporator exit
ℎ4 The specific enthalpy of the refrigerant at the evaporator inlet
��𝑂𝑅𝐶−𝑟𝑒𝑓. The working fluid mass flow rate
3.3.2 ORC expander
The mechanical power produced by the ORC expander is equal to the enthalpy difference at the
turbine inlet and outlet multiplied by the ORC refrigerant mass flow:
𝑊𝑡𝑢𝑟𝑏𝑖𝑛𝑒 = ��𝑂𝑅𝐶−𝑟𝑒𝑓. × (ℎ2 − ℎ1) (3.9)
In modelling the combined ORC and HP cycles in this thesis, it is assumed that all the power
produced by the ORC expander is fully transferred and consumed by the HP compressor.
3.3.3 ORC condenser
In the condenser, the condensation process is carried out by rejecting the latent heat to the sink
stream. The total amount of thermal energy is equal to the difference in the enthalpy at the
condenser inlet (ℎ2) and outlet (ℎ3) multiplied by the working fluid mass flow rate (��𝑂𝑅𝐶−𝑟𝑒𝑓.)
(state 2-3 in Figure 3.2):
𝑄𝑂𝑅𝐶−𝑐𝑜𝑛𝑑. = ��𝑂𝑅𝐶−𝑟𝑒𝑓. × (ℎ3 − ℎ2) (3.10)
Chapter 3: Theory of the combined ORC-VCC cycles
67
3.3.4 ORC liquid pump
After the working fluid is fully condensed, the pump is used to pump the refrigerant liquid at
high pressure to the evaporator to complete the cycle. The power consumed by the ORC liquid
pump is the enthalpy difference across the pump multiplied by the working fluid mass flow, as
given in Equation 3.11:
𝑊𝑂𝑅𝐶−𝑝𝑢𝑚𝑝 = ��𝑂𝑅𝐶−𝑟𝑒𝑓. × (ℎ3 − ℎ4) (3.11)
3.3.5 ORC first law of thermodynamic
The maximum theoretical efficiency of a Carnot cycle heat engine is equal to the ratio between
the difference in temperature between the hot and cold reservoirs over the temperature of the
hot reservoir. Therefore, the simplest form of the ORC thermal efficiency is the useful network
produced by the cycle divided by the thermal energy absorbed by the ORC evaporator:
𝜂𝑂𝑅𝐶 =𝑊𝑡𝑢𝑟𝑏𝑖𝑛𝑒−𝑊𝑂𝑅𝐶−𝑝𝑢𝑚𝑝
𝑄𝑂𝑅𝐶−𝑒𝑣𝑎𝑝 (3.12)
This equation is widely used in the steady state evaluation of the ORC. The range of values for
the 𝜂𝑂𝑅𝐶 reported in the open literature vary between 6-13 % depending on the heat source
temperature, the cycle configuration, the working fluid used, and the cycle application. A
regenerator ORC cycle was experimentally examined by Li, J., et al. [131]. In their study, ranges
of heat source of about (70, 80, 90, 100 oC) were used. R123 was the working fluid used in the
cycle. The results showed that the cycle achieved 7.4% thermal efficiency at a heat source of
80 oC. An experimental investigation was conducted on a 3 kW ORC cycle using R245fa as a
working fluid [120]. Thermal oil at temperature of 100 oC was used as a heat source. The
maximum thermal efficiency achieved by the cycle during the test was 5.87%. Chen, J., et al.
[123] conducted an experimental study on ORC using R245fa as a working fluid. The results
showed that the cycle can produce output power of between 2.42-3.55 kW, and the electrical
power consumed by the liquid pump ranged between 0.44-0.49 kW. Moreover, the overall
thermal efficiency achieved by the cycle varied between 5.2-7.3%. Another experimental study
conducted on a small ORC rig using R245fa refrigerant revealed that the cycle can achieve a
total thermal efficiency of 7.7% with a total output power of 51.2 W [125].
Chapter 3: Theory of the combined ORC-VCC cycles
68
3.4 Thermal balance model across the ORC-VCC heat exchangers
One of the general assumptions adopted in modelling the heat exchanger is that no heat is lost
between the hot and cold streams during the heat exchange process. In other words, this case
study assumes that all the sensible heat available in the heat source stream passing through the
evaporators will be transferred to the working fluid flow. Also, in the condenser, all the latent
heat contained in the working fluids will transfer to the sink stream.
As was demonstrated in chapter one, the heat sources for the HP cycle can be classified
according to availability, such as ambient air stream, geothermal energy, waste heat from
industrial process, flue exhaust gases from internal combustion engine, data centre rejected
heat, solar power, and even river, lake or ocean thermal energy.
In this thesis’s modelling, the heat source for the HP evaporator is ambient air, with or without
exhaust flue gas from the gas burner. Therefore, Equation 3.2 is modified as follows:
��𝐻𝑃−𝑟𝑒𝑓. × (ℎ1 − ℎ4) = ��𝑚𝑖𝑥 × 𝐶𝑃−𝑚𝑖𝑥 × (𝑇𝑚𝑖𝑥−𝑖𝑛 − 𝑇𝑚𝑖𝑥−𝑜𝑢𝑡) (3.13)
Where:
𝑇𝑚𝑖𝑥−𝑖𝑛 Temperature of the mixed stream at evaporator inlet
𝑇𝑚𝑖𝑥−𝑜𝑢𝑡 Temperature of the mixed stream at evaporator exit
𝐶𝑃−𝑚𝑖𝑥 Specific heat of the mixed stream
��𝑚𝑖𝑥 Mass flow of the mixed stream
The heat source of the ORC cycle can be classified according to type and availability, such as
waste heat from industrial processes, solar power, geothermal energy, ocean thermal energy,
and biomass energy [47, 48]. Furthermore, the heat source can also be named according to its
stream temperatures into low temperature (<230 oC), medium temperature (230-650 oC), and
high temperature (>650 oC) [47].

Chapter 3: Theory of the combined ORC-VCC cycles
69
For an ORC cycle adopting the heat source from burning natural gas, Equation 3.8 can be
written in the following form:
��𝑂𝑅𝐶−𝑟𝑒𝑓. × (ℎ1 − ℎ4) = (��𝐶𝐻4 + ��𝑎𝑖𝑟) × (∑ℎ𝑃 − ∑ℎ𝑅) (3.14)
Where:
∑ℎ𝑃 Summation of the combustion products enthalpies.
∑ℎ𝑅 Summation of the combustion reactants enthalpies.
��𝐶𝐻4 Mass flow of the natural gas.
��𝑎𝑖𝑟 Mass flow of air entering the burner.
In the condenser, the sink stream could be any fluid that is used to carry the rejected
condensation thermal energy, such as air or water. For the HP condenser (the first heating
stage), all the thermal energy rejected by the HP working fluid is assumed to be completely
transferred to the cold tap water. Therefore, Equation 3.4 is rewritten again:
��𝐻𝑃−𝑟𝑒𝑓. × (ℎ2 − ℎ3) = ��𝑤 × 𝐶𝑝𝑤 × (𝑇𝐶𝑤−𝑖𝑛−𝐻𝑃 − 𝑇𝐶𝑤−𝑜𝑢𝑡−𝐻𝑃) (3.15)
Where:
𝑇𝐶𝑤−𝑖𝑛−𝐻𝑃 Temperature of the cold tap water entering the HP condenser
𝑇𝐶𝑤−𝑜𝑢𝑡−𝐻𝑃 Temperature of the tap water leaving the HP condenser
𝐶𝑝𝑤 Specific heat of the water
��𝑤 Mass flow rate of the tap water
After that, the water enters the second heating stage (ORC condenser) with the same mass flow
and temperature at the HP condenser outlet. Equation 3.10 might be updated as follows:
��𝑂𝑅𝐶−𝑟𝑒𝑓. × (ℎ3 − ℎ2) = ��𝑤 × 𝐶𝑝𝑤 × (𝑇𝐶𝑤−𝑜𝑢𝑡−𝐻𝑃 − 𝑇𝐶𝑤−𝑜𝑢𝑡−𝑂𝑅𝐶) (3.16)
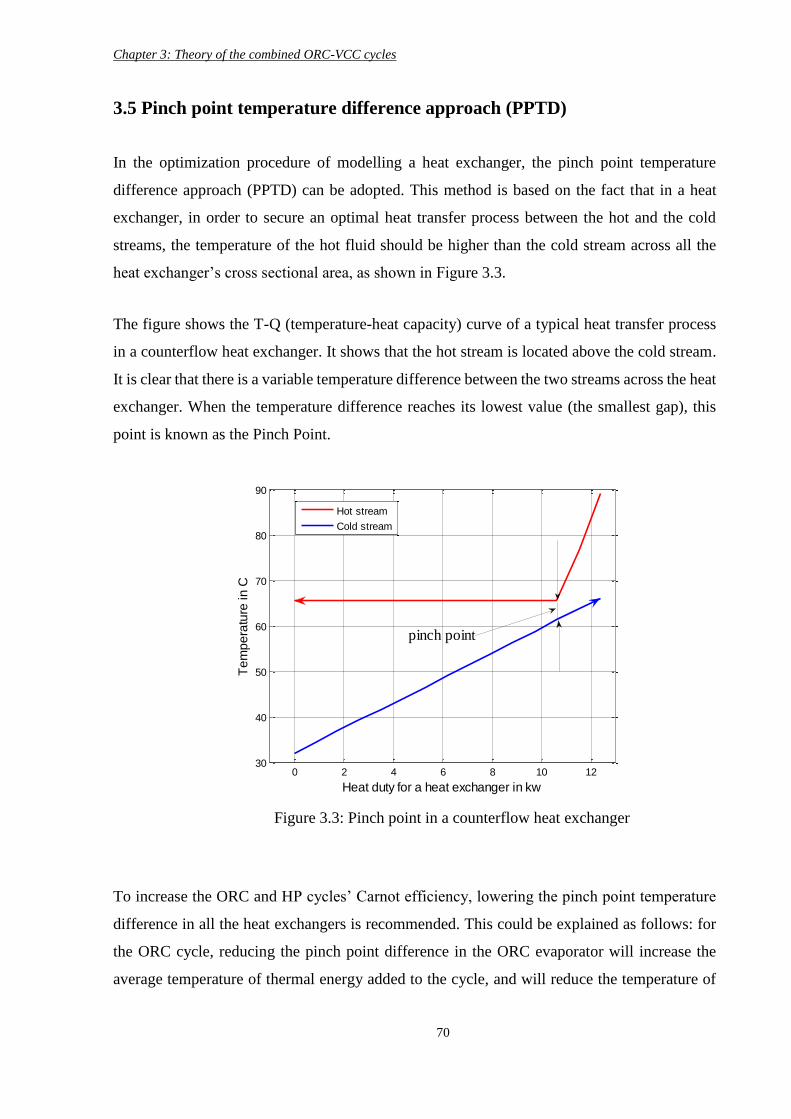
Chapter 3: Theory of the combined ORC-VCC cycles
70
3.5 Pinch point temperature difference approach (PPTD)
In the optimization procedure of modelling a heat exchanger, the pinch point temperature
difference approach (PPTD) can be adopted. This method is based on the fact that in a heat
exchanger, in order to secure an optimal heat transfer process between the hot and the cold
streams, the temperature of the hot fluid should be higher than the cold stream across all the
heat exchanger’s cross sectional area, as shown in Figure 3.3.
The figure shows the T-Q (temperature-heat capacity) curve of a typical heat transfer process
in a counterflow heat exchanger. It shows that the hot stream is located above the cold stream.
It is clear that there is a variable temperature difference between the two streams across the heat
exchanger. When the temperature difference reaches its lowest value (the smallest gap), this
point is known as the Pinch Point.
To increase the ORC and HP cycles’ Carnot efficiency, lowering the pinch point temperature
difference in all the heat exchangers is recommended. This could be explained as follows: for
the ORC cycle, reducing the pinch point difference in the ORC evaporator will increase the
average temperature of thermal energy added to the cycle, and will reduce the temperature of
0 2 4 6 8 10 1230
40
50
60
70
80
90
Heat duty for a heat exchanger in kw
Te
mp
era
ture
in
C
Hot stream
Cold stream
pinch point
Figure 3.3: Pinch point in a counterflow heat exchanger
Chapter 3: Theory of the combined ORC-VCC cycles
71
the energy rejected by the ORC condenser. Both effects will enhance cycle efficiency [132].
For the HP cycle, the opposite trend is expected because the VCC is the reverse cycle of the
ORC cycle. So, lower condensation and evaporation temperatures in the HP cycle can be
achieved by reducing the pinch point temperature difference in the HP condenser and
evaporator to increase HP cycle efficiency. However, reducing the pinch point temperature
difference will also increase the HX heat transfer area. Therefore, the optimum pinch point is
selected depending on the cycle’s working parameters, such as the evaporator inlet temperature,
the cycle’s practical application, and others.
To give a few examples, Cao, Y., et al. [133] selected >5 K as a pinch point in the evaporator
of an ORC cycle bottomed with a gas turbine to recover wasted heat. Andreasen, J., et al. [134]
adopted a 10 oC pinch point for an ORC boiler powered by heat source at a temperature of
between 120 and 90 oC, while for the condenser the pinch point was 5 oC. Dong, B., et al. [135]
used 20 oC for the ORC evaporator and 10 oC for the ORC condenser. Some of the reported
pinch points for the HP cycle can be summarized as follows: Ju, F., et al. [136] conducted an
experiential and simulation study on a heat pump water heater. They used a pinch point
temperature difference of 3 and 7 K in the counterflow condenser and evaporator respectively,
citing several references from the literature [137, 138]. Gu, Z., et al. [139] studied a combined
ORC and HP system theoretically and experimentally. The adopted pinch point for both cycles’
heat exchangers was 5 oC. Schimpf and Span [140] carried out a simulation study on a combined
ORC-GSHP system assisted by solar energy. The pinch point was selected depending on the
application of the combined system. For the space heating mode, and for the HP cycle,
∆𝑇𝑝𝑖𝑛𝑐ℎ−𝑒𝑣𝑎𝑝 and ∆𝑇𝑝𝑖𝑛𝑐ℎ−𝑐𝑜𝑛𝑑 were 5 K while for domestic hot water, the pinch points were
4.5 K for the evaporator and 4 K for the condenser. For the ORC cycle, the pinch points were
4 and 3 K for the evaporator and the condenser, respectively.
The optimization process of a heat exchanger model, including working fluids mass flow rate
and temperature, have to satisfy the pinch point condition, i.e., the minimum pinch point should
be secured.
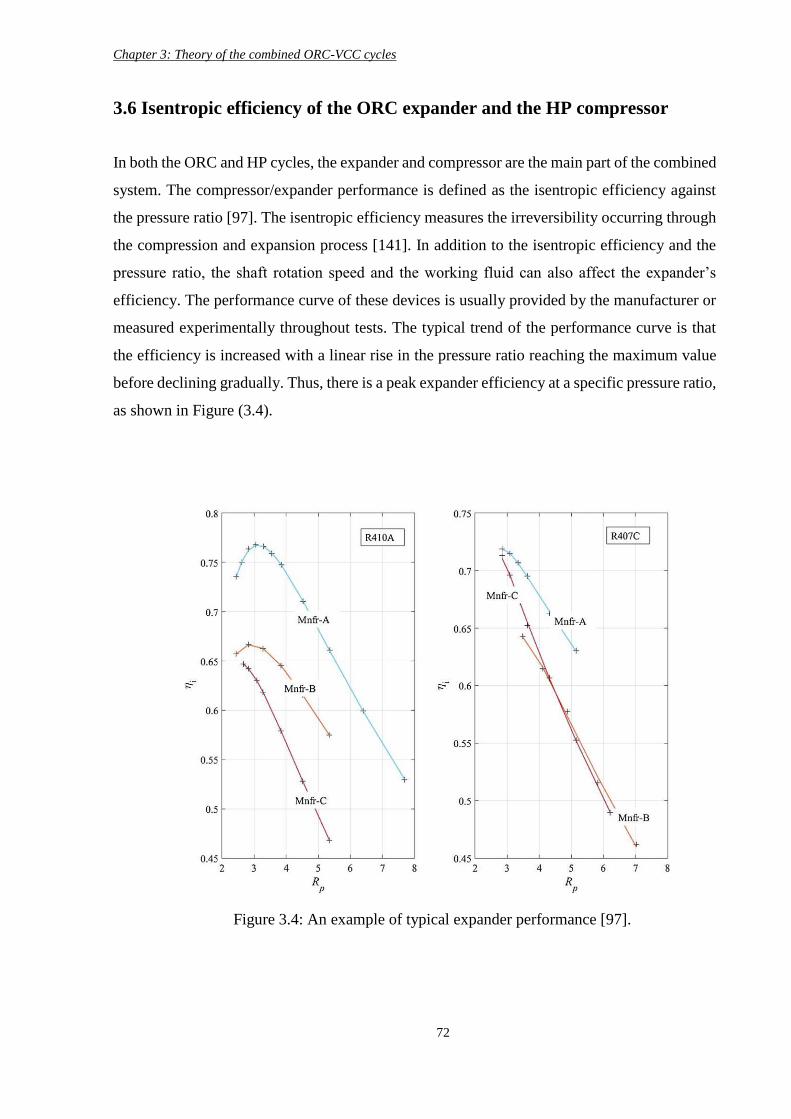
Chapter 3: Theory of the combined ORC-VCC cycles
72
3.6 Isentropic efficiency of the ORC expander and the HP compressor
In both the ORC and HP cycles, the expander and compressor are the main part of the combined
system. The compressor/expander performance is defined as the isentropic efficiency against
the pressure ratio [97]. The isentropic efficiency measures the irreversibility occurring through
the compression and expansion process [141]. In addition to the isentropic efficiency and the
pressure ratio, the shaft rotation speed and the working fluid can also affect the expander’s
efficiency. The performance curve of these devices is usually provided by the manufacturer or
measured experimentally throughout tests. The typical trend of the performance curve is that
the efficiency is increased with a linear rise in the pressure ratio reaching the maximum value
before declining gradually. Thus, there is a peak expander efficiency at a specific pressure ratio,
as shown in Figure (3.4).
Figure 3.4: An example of typical expander performance [97].
Chapter 3: Theory of the combined ORC-VCC cycles
73
3.7 Modelling the gas burner
3.7.1 Chemical combustion equation
In the gas burner, Methane reacts chemically with the Oxygen in the air to release thermal
energy. Since Nitrogen is already contained in the air, this gas should appear in the equation of
combustion. It is common in combustion calculation to consider air as consisting of 21% O2
and 79% N2. Thus, the combustion reaction equation is written as follows:
𝐶𝐻4 + 2(𝑂2 + 3.76𝑁2) ⟹ 𝐶𝑂2 + 2𝐻2𝑂 + 7.52𝑁2
The left-hand side of the above equation shows the chemical components entering the
combustion chamber (gas burner), while the right side represents the products of the combustion
which will appear in the exhaust gases. In addition, both sides of the equation involve the same
number of atoms of each element [127]. Also, it is clear that the left-hand side has the exact
amount of oxygen to combust all molecular of Methane; therefore, no Oxygen and/or Methane
is left in the product-side. This air to fuel ratio (𝐴𝑖𝑟𝐹𝑢𝑒𝑙⁄ ) is called the theoretical or
(Stoichiometric) ratio. If the fuel and air are mixed with a ratio less than the Stoichiometric ratio
then the mixture is called a rich mixture (it has no excess air). In contrast, it is called weak or
lean if it has excess air [142]. In real applications it is recommended to have excess air for the
combustion process.
The percentage of excess air can be calculated using the following equation:
𝑒𝑥𝑐𝑒𝑠𝑠 𝑎𝑖𝑟% =(𝐴𝑖𝑟
𝐹𝑢𝑒𝑙⁄ )𝑎𝑐𝑡𝑢𝑎𝑙
−(𝐴𝑖𝑟𝐹𝑢𝑒𝑙⁄ )
Stoichiometric
(𝐴𝑖𝑟𝐹𝑢𝑒𝑙⁄ )
𝑎𝑐𝑡𝑢𝑎𝑙
(3.17)
3.7.2 First law of combustion
The enthalpy of reaction can be estimated when the values of enthalpy of formation on the
molar base at the reference temperature for all elements of reactants and products are known.
Chapter 3: Theory of the combined ORC-VCC cycles
74
A simple definition of the enthalpy of formation is the rise in enthalpy when a substance is
formed from its basic natural elements and in the standard reference state. When a change in
enthalpy occurs due to the complete combustion of a substance at a constant pressure and
temperature, it is known as the enthalpy of combustion. In most cases, the reference state
temperature and pressure are 25 oC and 1bar, respectively [142].
By neglecting the changes in kinetic and potential energy, the first law of thermodynamic of
the combustion reaction process in a gas burner can be written as:
𝑄 = ∑ 𝑁𝑖(ℎ𝑓𝑜 + ℎ − ℎ𝑜)
𝑖− ∑ 𝑁𝑖(ℎ𝑓
𝑜 + ℎ − ℎ𝑜)𝑖𝑟𝑒𝑎𝑐𝑡𝑝𝑟𝑜𝑑 (3.18)
Where:
𝑁𝑖 Number of moles of substance i
ℎ𝑓𝑜 Molar enthalpy of combustion
ℎ Molar enthalpy of the substance
ℎ𝑜 Molar enthalpy of the substance at reference state
3.8 Evaluation of the combined system performance
The simple definition of any thermodynamic system’s efficiency is the ratio between the energy
gained over the energy expended. By interpolating this definition to the combined ORC-HP
system, the combined system efficiency can be defined as the ratio of energy added to the water
to the total energy released from burning the fuel in the gas burner, known as the fuel to heat
efficiency:
𝐹𝑢𝑒𝑙 𝑡𝑜 ℎ𝑒𝑎𝑡 𝑒𝑓𝑓𝑖𝑐𝑖𝑒𝑛𝑐𝑦 = (𝑄𝑇𝑜𝑡𝑎𝑙−𝑎𝑑𝑑𝑒𝑑− 𝑤𝑎𝑡𝑒𝑟
𝑄𝑇𝑜𝑡𝑎𝑙−𝑟𝑒𝑙𝑒𝑎𝑠𝑒𝑑) × 100 (3.19)
Where the total heat added to the water 𝑄𝑇𝑜𝑡𝑎𝑙−𝑎𝑑𝑑𝑒𝑑− 𝑤𝑎𝑡𝑒𝑟 also called the total system heating
capacity, is the summation of the thermal capacities of the HP condenser, the ORC condenser
and the post heater heat exchanger.
Chapter 3: Theory of the combined ORC-VCC cycles
75
𝑄𝑇𝑜𝑡𝑎𝑙−𝑎𝑑𝑑𝑒𝑑− 𝑤𝑎𝑡𝑒𝑟 = 𝑄𝐻𝑃−𝑐𝑜𝑛𝑑. + 𝑄𝑂𝑅𝐶−𝑐𝑜𝑛𝑑. + 𝑄𝑝𝑜𝑠𝑡 ℎ𝑒𝑎𝑡𝑒𝑟 (3.20)
While the total heat released from burning CH4 is given by:
𝑄𝑇𝑜𝑡𝑎𝑙−𝑟𝑒𝑙𝑒𝑎𝑠𝑒𝑑 = ��𝐶𝐻4 × 𝑀𝑒𝑡ℎ𝑎𝑛𝑒 ℎ𝑒𝑎𝑡𝑖𝑛𝑔 𝑣𝑎𝑙𝑢𝑒 (3.21)
At this stage, the final water temperature can be calculated as follows:
𝑇𝑤_𝑓𝑖𝑛𝑎𝑙 =(𝑄𝑇𝑜𝑡𝑎𝑙−𝑎𝑑𝑑𝑒𝑑− 𝑤𝑎𝑡𝑒𝑟+𝐶𝑝−𝑤𝑎𝑡𝑒𝑟×𝑇𝑤𝑖𝑛
×��𝑤𝑎𝑡𝑒𝑟)
(𝐶𝑝−𝑤𝑎𝑡𝑒𝑟×��𝑤𝑎𝑡𝑒𝑟) (3.22)
3.9 Heat exchanger areas
The process of heat transfer in heat exchanger areas such as the evaporator and condenser is a
complicated mechanism which mainly depends on the working fluid properties and flow
characteristics as well as the heat exchanger’s geometry. It is general practise in many
researches that the heat transfer process is usually modelled by adopting previously developed
sim-empirical correlations. However, the validity of these correlations is limited to certain
applications and ranges of boundary conditions.
The most commonly used correlation is as follows:
𝛼 = 𝑁𝑢𝑘
𝐷 (3.23)
Where:
𝛼 Overall heat transfer coefficient of the flow
𝑁𝑢 Nusselt number
𝐷 Pipe diameter or distance separation of the plates in the heat exchanger
𝑘 Flow thermal conductivity
Chapter 3: Theory of the combined ORC-VCC cycles
76
𝑁𝑢 is called the Nusselt number, which is the ratio of convective to conductive heat transfer
between the flow and the wall inside the heat exchanger. The above equation can be rewritten
as follows:
𝛼 = (𝑐1𝑅𝑒𝑐2𝑃𝑟
𝑐3 (𝜇𝑓
𝜇𝑤)
𝑐4
) ×𝑘
𝐷 (3.24)
Where:
𝑅𝑒 Reynolds number
𝑃𝑟 Prandtl number
𝜇𝑓 Dynamic viscosity of the bulk flow
𝜇𝑤 Dynamic viscosity of the wall
The Reynolds number is the ratio of inertial to viscous forces in the fluid flow, which is written
as:
𝑅𝑒 =𝜌𝑢𝐷
𝑘 (3.25)
Where 𝜌 and 𝑢 are the density and velocity of the fluid flow respectively.
The Prandtl number is the ratio of viscous to thermal diffusion, which is defined as:
𝑃𝑟 =𝐶𝑝𝜇
𝑘 (3.26)
Where 𝐶𝑝 is the fluid specific heat.
The overall heat transfer coefficient (U) can be calculated when the Nusselt numbers for cold
and hot steams inside the heat exchanger are identified, using the following equation:
1
𝑈=
1
𝛼𝑐𝑜𝑙𝑑+
𝑡
𝑘+
1
𝛼ℎ𝑜𝑡 (3.27)
Chapter 3: Theory of the combined ORC-VCC cycles
77
Where (t) is the wall thickness in the heat exchanger, and 𝛼𝑐𝑜𝑙𝑑 is the overall heat transfer
coefficient of the cold flow, while 𝛼ℎ𝑜𝑡 is the overall heat transfer coefficient of the hot flow.
The heat transfer area is calculated by the following equation:
𝐴𝑟𝑒𝑎 =𝑄
𝑈∆𝑇𝑚 (3.28)
Where 𝑄 is the total thermal capacity of the heat exchanger, and ∆𝑇𝑚 is the Logarithmic means
temperature difference (LMTD), which is given by:
∆𝑇𝑚 =(∆𝑇1−∆𝑇2)
ln (∆𝑇1∆𝑇2
) (3.29)
∆T1 and ∆T2 are the temperature differences between the hot and cold streams on the heat
exchanger exit and inlet, respectively.
Quoilin, S., et al. [143] adopted the following correlation for the single phase heat transfer
coefficient in a corrugated plate heat exchanger with a 30o Chevron angle:
𝑁𝑢 = 𝑐𝑅𝑒𝑚𝑃𝑟
𝑛 (3.30)
Where, m=0.5 for laminar flow (Re<400) and m=0.7 for turbulent flow (Re>400) and n=1/3 in
both cases. The coefficient C is identified experimentally as follows:
Condenser Evaporator
Turbulent vapor C=0.84 Turbulent vapor C=0.063
Turbulent water C=0.72 Turbulent air C=0.101
Laminar liquid C=0.4 Laminar liquid C=1.29
While for a boiling heat transfer coefficient, the correlation by Hsieh and Lin [144] is adopted:
𝛼𝑏𝑜𝑖𝑙𝑖𝑛𝑔−2𝑝ℎ = 𝐶𝛼𝑙𝐵𝑜0.5 (3.31)
Chapter 3: Theory of the combined ORC-VCC cycles
78
The subscript 2𝑝ℎ refers to two phase flows, 𝛼𝑙 is the all liquid non-boiling heat transfer
coefficient, and 𝐵𝑜 is the boiling number for the refrigerant.
In the condenser, the heat transfer coefficient is calculated using Kuo, W., et al.’s [145]
correlation, as follows:
𝛼𝑐𝑜𝑛𝑑𝑒𝑠𝑛𝑎𝑡𝑖𝑜𝑛−2𝑝ℎ = 𝐶𝛼𝑙(0.25𝐶𝑜−0.45𝐹𝑟𝑙
0.25 + 75𝐵𝑜0.75) (3.32)
𝐹𝑟𝑙 is the Froude number for the liquid phase refrigerant, and 𝐶𝑜 is the convective number.
Deutz, K., et al. [141] used the following correlations for their single phase heat transfer
coefficient, assuming a smooth condenser tube:
When Re < 2300,
Nu = 3.6568, reported in Baehr and Stephan [146].
When 2300 < Re < 10, 000, Gnielinski’s correlation is used [147]:
Where:
𝑓 =1
(0.79𝑙𝑛(𝑅𝑒)−1.64)2 (3.33)
When Re > 10000, the Dittus-Boelter correlation is used [148]
𝑁𝑢 = 0.023𝑅𝑒0.8𝑃𝑟
0.4 (3.34)
For a two phase condensation process, the Shah’s correlation [149] is adopted:
𝑁𝑢 = 0.023𝑅𝑒0.8𝑃𝑟
0.4 ((1 − 𝑥)0.8 +3.8(1−𝑥)0.04𝑥0.75
𝑃𝑟0.38 ) (3.35)
Where (x) is the vapour quality.
Chapter 3: Theory of the combined ORC-VCC cycles
79
Liang, Y., et al [89] used the following correlation for single phase heat transfer in a condenser
plate heat exchanger for both refrigerant and water:
1
√𝑓=
𝐶𝑂𝑆𝛽
√0.18𝑡𝑎𝑛𝛽+0.36𝑠𝑖𝑛𝛽+𝑓𝑜
𝐶𝑂𝑆𝛽
+(1−𝐶𝑂𝑆𝛽)
√3.8𝑓1 (3.36)
Where 𝛽 is the Chevron angle, the optimum value is 60o [150], and the coefficient 𝑓 is given
by:
When 𝑅𝑒<2000, 𝑓𝑜=64
𝑅𝑒, 𝑓1 =
579
𝑅𝑒+ 3.85
When 𝑅𝑒 ≥ 2000, 𝑓𝑜 = (1.8𝑙𝑜𝑔𝑅𝑒 − 1.5)−2, 𝑓1 =39
𝑅𝑒0.289
To calculate the heat transfer coefficient for a two-phase evaporation process, Cooper’s pool
[151] boiling correlation is used:
𝛼𝑒 = 1.5 × 55 × (𝑃𝑒
𝑃𝑐𝑟)
(0.12−0.2𝑙𝑛𝑃𝑅)
× (−𝑙𝑛 (𝑃𝑒
𝑃𝑐𝑟))
−0.55
× 𝑞0.67 × 𝑀−0.5 (3.37)
Where 𝑃𝑐𝑟 is the critical pressure of the working fluid, 𝑅𝑝 is the mean asperity height which is
taken as 0.3 𝜇𝑚 in this study, 𝑞 represents the heat flux, and M is the molar mass of the working
fluid.
For the condensation process, the following correlation is adopted:
𝛼𝑐𝑜𝑛𝑑 = 𝛼𝑙(0.25𝐶𝑜−0.45𝐹𝑟𝑙
0.25 + 75 × 𝐵𝑜0.75) (3.38)
Where the subscript ( 𝑙 ) denotes the liquid phase and (𝛼𝑙) is given by:
𝛼𝑙 = 0.2092 × (𝑘𝑙
𝐷) × 𝑅𝑒𝑙
0.78𝑃𝑟𝑙0.33 (
𝜇
𝜇𝑤)
0.14
(3.39)
𝐶𝑜 (convection number) is given by:
Chapter 3: Theory of the combined ORC-VCC cycles
80
𝐶𝑜 = (𝜌𝑣
𝜌𝑙) (
1
𝑥−1)
0.8
(3.40)
And 𝐹𝑟𝑙 and 𝐵𝑜 (boiling number) are given by:
𝐹𝑟𝑙 =𝐺2
(𝜌𝑙2𝑔𝑑𝑒)
(3.41)
𝐵𝑜 =𝑞
𝐺×𝑖𝑓𝑔 (3.42)
Where G (kg/m2s) is the refrigerant mass flux, 𝑔 is the gravity acceleration (m/s2), and 𝑖𝑓𝑔 is
the enthalpy of vaporization (kJ/kg).
𝑅𝑒𝑙 =𝐺×𝐷
𝜇𝑙 (3.43)
𝑃𝑟𝑙 =𝐶𝑝𝑙×𝜇𝑙
𝑘𝑙 (3.44)
3.10 Second law efficiency and exergy destruction
Second law efficiency is defined as the ratio between the actual cycle efficiency compared with
the maximum theoretical reversible cycle efficiency. Equation 3.45 shows the second law
efficiency of a heat pump cycle:
𝜂𝑠𝑒𝑐𝑜𝑛𝑑_𝑙𝑎𝑤 =𝐶𝑂𝑃
𝐶𝑂𝑃𝐶𝑎𝑟𝑛𝑜𝑡 (3.45)
Exergy, also called availability, is defined as the maximum theoretical (reversible work) that
can be obtained from a system in a given state, working under constant reservoir pressure and
temperature. However, in any real thermodynamic process, the exergy can be destroyed, unlike
the energy, to satisfy the second law of thermodynamic. The irreversibility or (exergy
destruction) is defined as the difference between the theoretical reversible work and the actual
work.
Chapter 3: Theory of the combined ORC-VCC cycles
81
In an actual thermodynamic system, once the irreversibilities of a component have been
estimated, the development and improvement process is guided towards that part in order to
reduce the exergy destruction. This has the consequence of improving the device efficiency and
hence the overall system performance.
In this thesis, both terms, irreversibility and second law efficiency, have been used to compare
the performance of proposed system components against the ideal one. The evaluation is carried
out as follows:
Irreversibility (𝐼) across a compressor, turbine, pump, and expansion valve is given by:
𝐼 = ��𝑟𝑒𝑓 × 𝑇𝑜 × (𝑠𝑜𝑢𝑡 − 𝑠𝑖𝑛) (3.46)
Where:
𝑇𝑜 Temperature in the reference state
𝑠 Entropy
��𝑟𝑒𝑓 Working fluid mass flow
In a heat exchanger there are two streams; one is the hot flow carrying the heat, and the other
is the cold stream which should receive the rejected heat.
The exergy destruction in the hot stream is expressed as follows:
𝐼𝐻𝑠 = ��𝐻𝑠 × (ℎ𝐻𝑆−𝑖𝑛 − ℎ𝐻𝑆−𝑜𝑢𝑡 − 𝑇𝑜 × (𝑠𝐻𝑆−𝑖𝑛 − 𝑠𝐻𝑆−𝑜𝑢𝑡)) (3.47)
While the exergy destruction in the cold stream is:
𝐼𝐶𝑆 = ��𝐶𝑆 × (ℎ 𝐶𝑆−𝑜𝑢𝑡 − ℎ 𝐶𝑆_𝑖𝑛 − 𝑇𝑜 × (𝑠 𝐶𝑆_𝑜𝑢𝑡 − 𝑠 𝐶𝑆_𝑖𝑛)) (3.48)
The total exergy destruction across a heat exchanger is the exergy destruction difference in both
streams.
Chapter 3: Theory of the combined ORC-VCC cycles
82
3.11 Modelling the combined ORC and HP cycles
The majority of studies in the open literature adopted the energy and exergy equations mentioned
above in the modelling of the ORC and HP cycles. In this thesis, a MATLAB code is developed
for this purpose. The rule of this code is to conduct optimization process by varying one or two
independent variables to achieve the pre-selected working conditions and design assumptions
targeted in this study. The outcome of this optimization approach is to identify the design
parameters for the steady state mode. This approach is called design mode which involves
identifying the refrigerant state at the inlet and outlet of each cycle components. MATLAB code
is also used to show the correlation between the different variables and their effect on the system
performance.
There are also a number of reliable software packages that were used to model various power and
thermal cycles. Keinath and Garimella [152] used Engineering Equation Solver software in their
study. Recently, ASPEN PLUS software in its newer version has been introduced to provide steady
and dynamic simulations. In our study, ASPEN PLUS software package is used to validate the
steady state results obtained from MATLB code. After obtaining the steady state results from both
models, ASPEN PLUS software has been used in the off design mode. This mode involve setting
the heat exchangers areas at constant values based on the steady state results in order to conducted
control strategies. The results of these control strategies have then been verified using the dynamic
mode.
3.11.1 Thermophysical properties software
To estimate the thermophysical properties of the working fluids, different software programs,
databases and subroutines have also been used by researchers and are claimed to have good
precision to some extent. The majority of them have used NIST REFPROP software [42] for
its accuracy and ability to link up with other programming language software such as the
MATLAB [97, 153-156]. Others have used different equations; for example, Saleh, B., et al.
[132] and Lai, N., et al. [156] used the BACKONE equation of state in modelling a low
temperature ORC cycle. Zhang, S., et al. [157] used a generalized Cubic Equation of State in
the theoretical modelling of a water to water heat pump system.
Chapter 3: Theory of the combined ORC-VCC cycles
83
In this thesis simulation work, REFPROP software has been linked with the MATLAB code to
estimate the transport properties of the working fluid. In addition, it has been adopted as a
property method in the ASPEN PLUS software.
3.11.2 Assumptions adopted in the modelling process
The main assumptions adopted in the modelling procedure can be summarized as follows:
1. In chapter five, the combined system is designed to heat water at constant total thermal
capacity. The typical total thermal capacity for a common household is 20 kW.
2. Tap water temperature ranges between 7-10 oC, therefore a constant value of 10 oC is
adopted.
3. No pressure drop is assumed across the cycle components and connected pipes.
4. In the gas burner, air has a mix ratio of 79% nitrogen and 21% oxygen by volume. The
combustion efficiency is assumed to be 100% and the total heat released from burning the
Methane is transferred to the ORC working fluid and the exhaust stream, with no heat lost
to the surrounding environment.
5. The temperature of the exhaust stream leaving the post heater (T15) is assumed to be a value
higher than the dew point to prevent corrosion.
6. Methane heating value in this model is taken as constant at the reference state, which is
equal to 55.5 kJ/kg.
7. The power produced by the ORC cycle directly drives the HP compressor, and mechanical
losses are negligible.
8. The pinch point temperature difference is set to 3 oC in both the HP and ORC condensers.
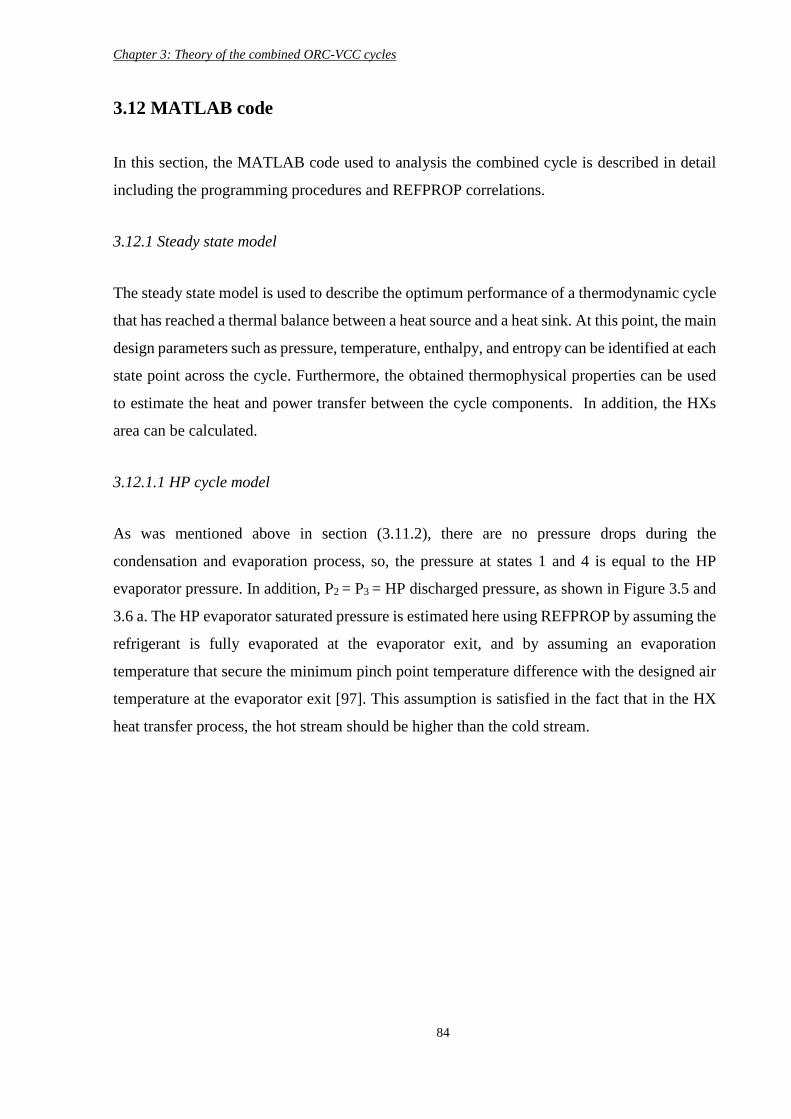
Chapter 3: Theory of the combined ORC-VCC cycles
84
3.12 MATLAB code
In this section, the MATLAB code used to analysis the combined cycle is described in detail
including the programming procedures and REFPROP correlations.
3.12.1 Steady state model
The steady state model is used to describe the optimum performance of a thermodynamic cycle
that has reached a thermal balance between a heat source and a heat sink. At this point, the main
design parameters such as pressure, temperature, enthalpy, and entropy can be identified at each
state point across the cycle. Furthermore, the obtained thermophysical properties can be used
to estimate the heat and power transfer between the cycle components. In addition, the HXs
area can be calculated.
3.12.1.1 HP cycle model
As was mentioned above in section (3.11.2), there are no pressure drops during the
condensation and evaporation process, so, the pressure at states 1 and 4 is equal to the HP
evaporator pressure. In addition, P2 = P3 = HP discharged pressure, as shown in Figure 3.5 and
3.6 a. The HP evaporator saturated pressure is estimated here using REFPROP by assuming the
refrigerant is fully evaporated at the evaporator exit, and by assuming an evaporation
temperature that secure the minimum pinch point temperature difference with the designed air
temperature at the evaporator exit [97]. This assumption is satisfied in the fact that in the HX
heat transfer process, the hot stream should be higher than the cold stream.
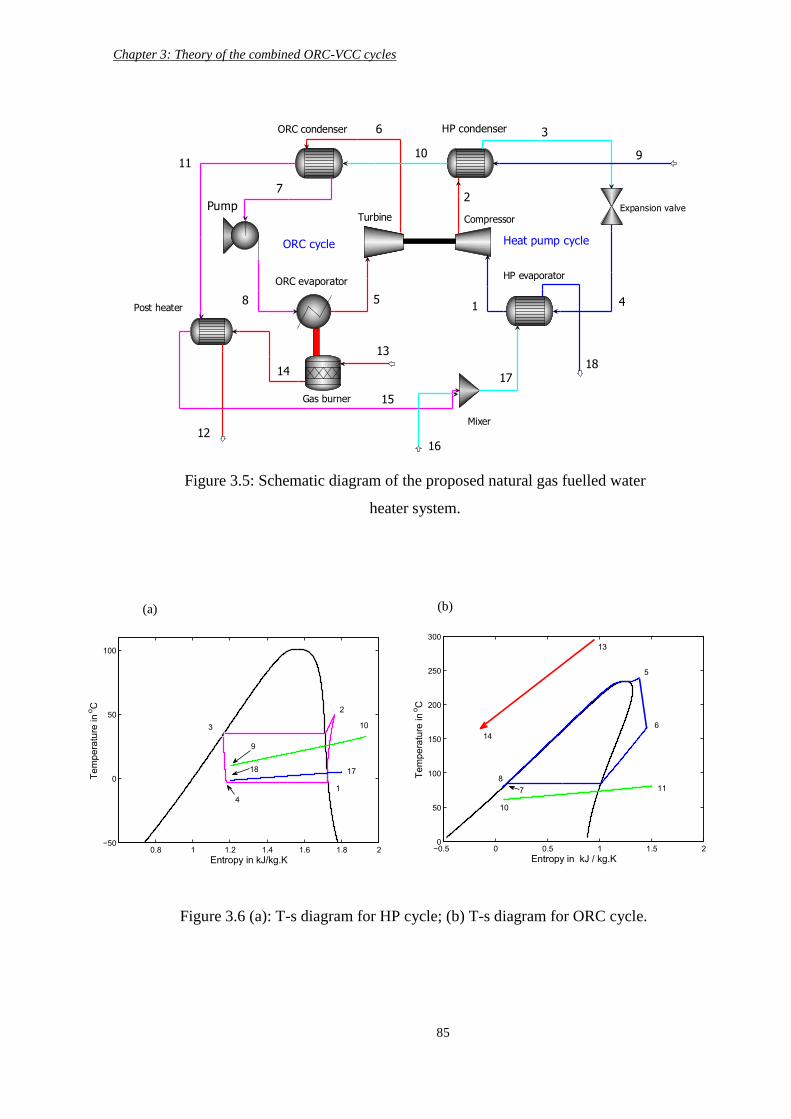
Chapter 3: Theory of the combined ORC-VCC cycles
85
Heat pump cycle
9
HP condenserORC condenser
ORC evaporator
Expansion valve
HP evaporator
PumpTurbine Compressor
ORC cycle
Gas burner
Post heater
Mixer
3
2
41
1011
12
7
8 5
6
13
14
15
16
1718
Figure 3.5: Schematic diagram of the proposed natural gas fuelled water
heater system.
Figure 3.6 (a): T-s diagram for HP cycle; (b) T-s diagram for ORC cycle.
(a) (b)
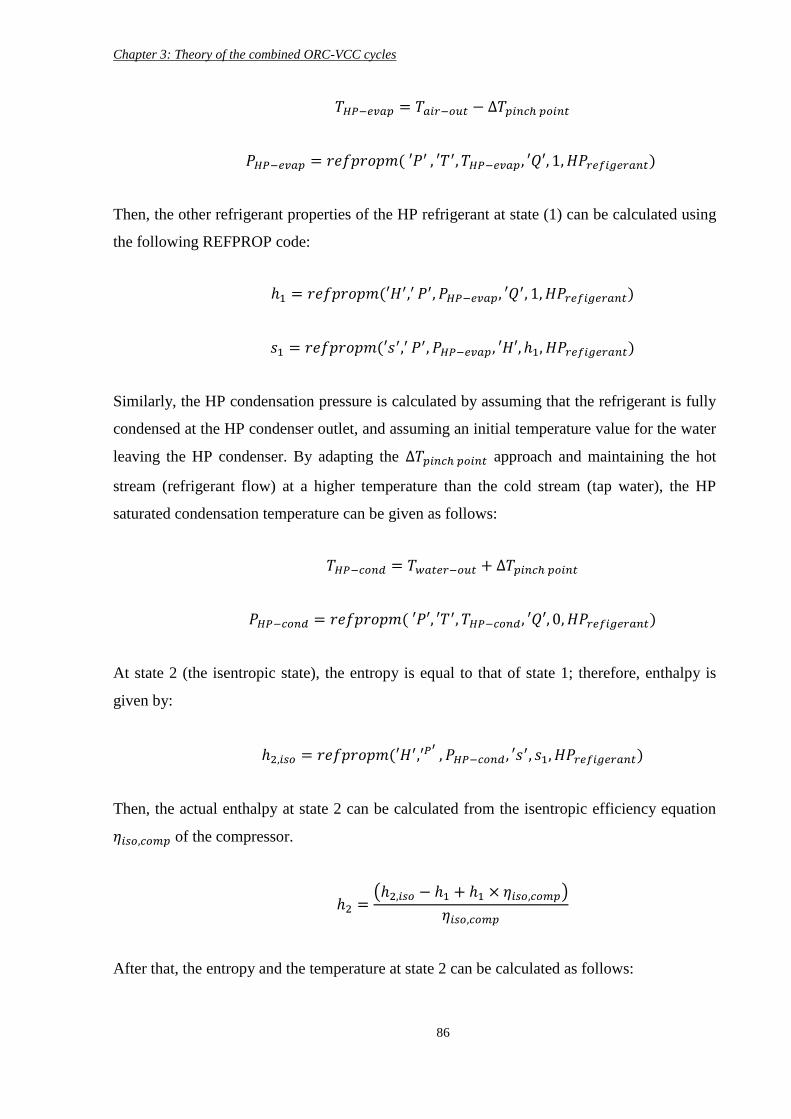
Chapter 3: Theory of the combined ORC-VCC cycles
86
𝑇𝐻𝑃−𝑒𝑣𝑎𝑝 = 𝑇𝑎𝑖𝑟−𝑜𝑢𝑡 − ∆𝑇𝑝𝑖𝑛𝑐ℎ 𝑝𝑜𝑖𝑛𝑡
𝑃𝐻𝑃−𝑒𝑣𝑎𝑝 = 𝑟𝑒𝑓𝑝𝑟𝑜𝑝𝑚( ′𝑃′ , ′𝑇′, 𝑇𝐻𝑃−𝑒𝑣𝑎𝑝, ′𝑄′, 1, 𝐻𝑃𝑟𝑒𝑓𝑖𝑔𝑒𝑟𝑎𝑛𝑡)
Then, the other refrigerant properties of the HP refrigerant at state (1) can be calculated using
the following REFPROP code:
ℎ1 = 𝑟𝑒𝑓𝑝𝑟𝑜𝑝𝑚(′𝐻′,′ 𝑃′, 𝑃𝐻𝑃−𝑒𝑣𝑎𝑝, ′𝑄′, 1, 𝐻𝑃𝑟𝑒𝑓𝑖𝑔𝑒𝑟𝑎𝑛𝑡)
𝑠1 = 𝑟𝑒𝑓𝑝𝑟𝑜𝑝𝑚(′𝑠′,′ 𝑃′, 𝑃𝐻𝑃−𝑒𝑣𝑎𝑝, ′𝐻′, ℎ1, 𝐻𝑃𝑟𝑒𝑓𝑖𝑔𝑒𝑟𝑎𝑛𝑡)
Similarly, the HP condensation pressure is calculated by assuming that the refrigerant is fully
condensed at the HP condenser outlet, and assuming an initial temperature value for the water
leaving the HP condenser. By adapting the ∆𝑇𝑝𝑖𝑛𝑐ℎ 𝑝𝑜𝑖𝑛𝑡 approach and maintaining the hot
stream (refrigerant flow) at a higher temperature than the cold stream (tap water), the HP
saturated condensation temperature can be given as follows:
𝑇𝐻𝑃−𝑐𝑜𝑛𝑑 = 𝑇𝑤𝑎𝑡𝑒𝑟−𝑜𝑢𝑡 + ∆𝑇𝑝𝑖𝑛𝑐ℎ 𝑝𝑜𝑖𝑛𝑡
𝑃𝐻𝑃−𝑐𝑜𝑛𝑑 = 𝑟𝑒𝑓𝑝𝑟𝑜𝑝𝑚( ′𝑃′, ′𝑇′, 𝑇𝐻𝑃−𝑐𝑜𝑛𝑑, ′𝑄′, 0, 𝐻𝑃𝑟𝑒𝑓𝑖𝑔𝑒𝑟𝑎𝑛𝑡)
At state 2 (the isentropic state), the entropy is equal to that of state 1; therefore, enthalpy is
given by:
ℎ2,𝑖𝑠𝑜 = 𝑟𝑒𝑓𝑝𝑟𝑜𝑝𝑚(′𝐻′,′𝑃′, 𝑃𝐻𝑃−𝑐𝑜𝑛𝑑, ′𝑠′, 𝑠1, 𝐻𝑃𝑟𝑒𝑓𝑖𝑔𝑒𝑟𝑎𝑛𝑡)
Then, the actual enthalpy at state 2 can be calculated from the isentropic efficiency equation
𝜂𝑖𝑠𝑜,𝑐𝑜𝑚𝑝 of the compressor.
ℎ2 =(ℎ2,𝑖𝑠𝑜 − ℎ1 + ℎ1 × 𝜂𝑖𝑠𝑜,𝑐𝑜𝑚𝑝)
𝜂𝑖𝑠𝑜,𝑐𝑜𝑚𝑝
After that, the entropy and the temperature at state 2 can be calculated as follows:
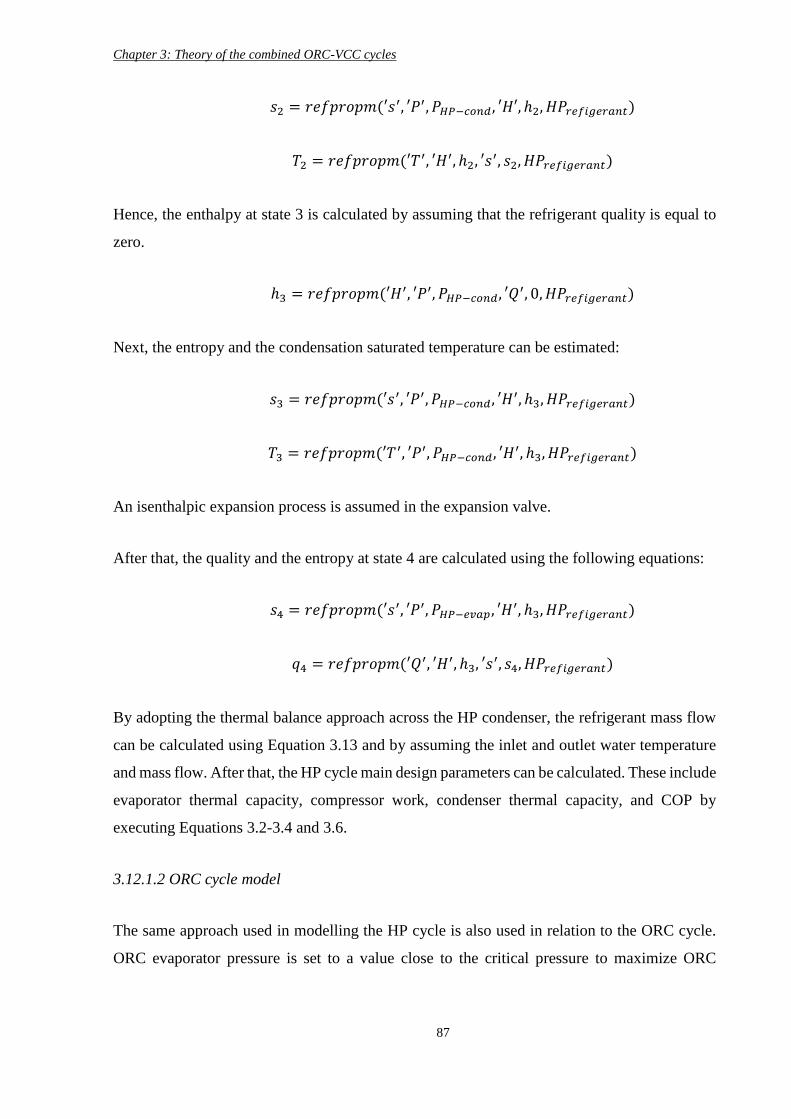
Chapter 3: Theory of the combined ORC-VCC cycles
87
𝑠2 = 𝑟𝑒𝑓𝑝𝑟𝑜𝑝𝑚(′𝑠′, ′𝑃′, 𝑃𝐻𝑃−𝑐𝑜𝑛𝑑, ′𝐻′, ℎ2, 𝐻𝑃𝑟𝑒𝑓𝑖𝑔𝑒𝑟𝑎𝑛𝑡)
𝑇2 = 𝑟𝑒𝑓𝑝𝑟𝑜𝑝𝑚(′𝑇′, ′𝐻′, ℎ2, ′𝑠′, 𝑠2, 𝐻𝑃𝑟𝑒𝑓𝑖𝑔𝑒𝑟𝑎𝑛𝑡)
Hence, the enthalpy at state 3 is calculated by assuming that the refrigerant quality is equal to
zero.
ℎ3 = 𝑟𝑒𝑓𝑝𝑟𝑜𝑝𝑚(′𝐻′, ′𝑃′, 𝑃𝐻𝑃−𝑐𝑜𝑛𝑑, ′𝑄′, 0, 𝐻𝑃𝑟𝑒𝑓𝑖𝑔𝑒𝑟𝑎𝑛𝑡)
Next, the entropy and the condensation saturated temperature can be estimated:
𝑠3 = 𝑟𝑒𝑓𝑝𝑟𝑜𝑝𝑚(′𝑠′, ′𝑃′, 𝑃𝐻𝑃−𝑐𝑜𝑛𝑑, ′𝐻′, ℎ3, 𝐻𝑃𝑟𝑒𝑓𝑖𝑔𝑒𝑟𝑎𝑛𝑡)
𝑇3 = 𝑟𝑒𝑓𝑝𝑟𝑜𝑝𝑚(′𝑇′, ′𝑃′, 𝑃𝐻𝑃−𝑐𝑜𝑛𝑑, ′𝐻′, ℎ3, 𝐻𝑃𝑟𝑒𝑓𝑖𝑔𝑒𝑟𝑎𝑛𝑡)
An isenthalpic expansion process is assumed in the expansion valve.
After that, the quality and the entropy at state 4 are calculated using the following equations:
𝑠4 = 𝑟𝑒𝑓𝑝𝑟𝑜𝑝𝑚(′𝑠′, ′𝑃′, 𝑃𝐻𝑃−𝑒𝑣𝑎𝑝, ′𝐻′, ℎ3, 𝐻𝑃𝑟𝑒𝑓𝑖𝑔𝑒𝑟𝑎𝑛𝑡)
𝑞4 = 𝑟𝑒𝑓𝑝𝑟𝑜𝑝𝑚(′𝑄′, ′𝐻′, ℎ3, ′𝑠′, 𝑠4, 𝐻𝑃𝑟𝑒𝑓𝑖𝑔𝑒𝑟𝑎𝑛𝑡)
By adopting the thermal balance approach across the HP condenser, the refrigerant mass flow
can be calculated using Equation 3.13 and by assuming the inlet and outlet water temperature
and mass flow. After that, the HP cycle main design parameters can be calculated. These include
evaporator thermal capacity, compressor work, condenser thermal capacity, and COP by
executing Equations 3.2-3.4 and 3.6.
3.12.1.2 ORC cycle model
The same approach used in modelling the HP cycle is also used in relation to the ORC cycle.
ORC evaporator pressure is set to a value close to the critical pressure to maximize ORC
Chapter 3: Theory of the combined ORC-VCC cycles
88
thermal efficiency. The appropriate values for different working fluids are available in a wide
range of textbooks and also from REFPROP.
The ORC evaporation temperature (state 5) is chosen according to the type of the working fluid
used. For wet and isentropic fluids no superheat degree is required, so the refrigerant is assumed
to be fully vaporized at the evaporation saturated temperature. In contrast, for dry working
fluids a degree of superheat is recommended to ensure that no wet fluid can damage the turbine
plates. However, in all cases, the superheat degree should be carefully checked, particularly on
the T-s diagram for further confirmation.
𝑇5 = 𝑇𝑐𝑟𝑖𝑡𝑖𝑐𝑎𝑙 + 𝐷𝑒𝑔𝑟𝑒𝑒 𝑜𝑓 𝑠𝑢𝑝𝑒𝑟ℎ𝑒𝑎𝑡
Next, other thermophysical properties of the working fluid can be calculated as follows:
ℎ5 = 𝑟𝑒𝑓𝑝𝑟𝑜𝑝𝑚(′𝐻′,′ 𝑇′, 𝑇5, ′𝑃′, 𝑃𝑂𝑅𝐶−𝑒𝑣𝑎𝑝, 𝑂𝑅𝐶𝑟𝑒𝑓𝑖𝑔𝑒𝑟𝑎𝑛𝑡)
𝑠5 = 𝑟𝑒𝑓𝑝𝑟𝑜𝑝𝑚(′𝑠′, ′𝑃′, 𝑃𝑂𝑅𝐶−𝑒𝑣𝑎𝑝, ′𝐻′, ℎ5, 𝑂𝑅𝐶𝑟𝑒𝑓𝑖𝑔𝑒𝑟𝑎𝑛𝑡)
The condensation temperature (𝑇7) is set to a value close to the final water heating temperature
value. Therefore, the condensation pressure is calculated by assuming that the vapour fraction
is equal to zero at the condenser exit.
𝑃𝑂𝑅𝐶−𝑐𝑜𝑛𝑑 = 𝑟𝑒𝑓𝑝𝑟𝑜𝑝𝑚(′𝑃′, ′𝑇′, 𝑇7, ′𝑄′, 0, 𝑂𝑅𝐶𝑟𝑒𝑓𝑖𝑔𝑒𝑟𝑎𝑛𝑡)
The enthalpy of the isentropic state at the turbine exit is given by:
ℎ6,𝑖𝑠𝑜 = 𝑟𝑒𝑓𝑝𝑟𝑜𝑝𝑚(′𝐻′, ′𝑃′, 𝑃𝑂𝑅𝐶−𝑐𝑜𝑛𝑑, ′𝑠′, 𝑠5, 𝑂𝑅𝐶𝑟𝑒𝑓𝑖𝑔𝑒𝑟𝑎𝑛𝑡)
Next, the enthalpy and other properties at the turbine exit (state 6) are estimated based on the
turbine isentropic efficiency equation:
ℎ6 = ℎ5 − ℎ5 × 𝜂𝑒𝑥𝑝𝑎𝑛𝑑𝑒𝑟𝑖𝑠𝑜+ ℎ6,𝑖𝑠𝑜 × 𝜂𝑒𝑥𝑝𝑎𝑛𝑑𝑒𝑟𝑖𝑠𝑜
𝑠6 = 𝑟𝑒𝑓𝑝𝑟𝑜𝑝𝑚(′𝑠′, ′𝑃′, 𝑃𝑂𝑅𝐶−𝑐𝑜𝑛𝑑, ′𝐻′, ℎ6, 𝑂𝑅𝐶𝑟𝑒𝑓𝑖𝑔𝑒𝑟𝑎𝑛𝑡)
Chapter 3: Theory of the combined ORC-VCC cycles
89
At state 7:
ℎ7 = 𝑟𝑒𝑓𝑝𝑟𝑜𝑝𝑚(′𝐻′, ′𝑃′, 𝑃𝑂𝑅𝐶−𝑐𝑜𝑛𝑑, ′𝑄′, 0, 𝑂𝑅𝐶𝑟𝑒𝑓𝑖𝑔𝑒𝑟𝑎𝑛𝑡)
𝑠7 = 𝑟𝑒𝑓𝑝𝑟𝑜𝑝𝑚(′𝑠′, ′𝑃′, 𝑃𝑂𝑅𝐶−𝑐𝑜𝑛𝑑, ′𝐻′, ℎ7, 𝑂𝑅𝐶𝑟𝑒𝑓𝑖𝑔𝑒𝑟𝑎𝑛𝑡)
The isentropic state at the pump outlet state 8, is:
ℎ8,𝑖𝑠𝑜 = 𝑟𝑒𝑓𝑝𝑟𝑜𝑝𝑚(′𝐻′, ′𝑃′, 𝑃𝑂𝑅𝐶−𝑒𝑣𝑎𝑝, ′𝑠′, 𝑠7, 𝑂𝑅𝐶𝑟𝑒𝑓𝑖𝑔𝑒𝑟𝑎𝑛𝑡)
By assuming a constant value for the liquid pump isentropic efficiency, the enthalpy at state 8
is given by:
And the entropy at state 8 is given by:
𝑠8 = 𝑟𝑒𝑓𝑝𝑟𝑜𝑝𝑚(′𝑠′, ′𝑃′, 𝑃𝑂𝑅𝐶−𝑒𝑣𝑎𝑝, ′𝐻′, ℎ8, 𝑂𝑅𝐶𝑟𝑒𝑓𝑖𝑔𝑒𝑟𝑎𝑛𝑡)
Due to the assumption of direct coupling between the ORC turbine and the HP compressor, the
ORC mass flow is calculated using Equation 3.9 by assuming (Wcomp= Wturbine).
At this point, ORC performance parameters such as evaporator and condenser thermal duties,
the first and second laws of thermodynamics, and the final water temperature can be evaluated
via Equations 3.8-3.11, 3.12, 3.16 and 3.45.
3.12.1.3 Gas burner model
In the gas burner code, the standard enthalpy of combustion (ℎ𝑓𝑜) for pure substances such as
O2 and N2 are equal to zero, while CH4, CO2 and H2O are set as constant values based on the
literature [142].
It is assumed that the term (ℎ − ℎ𝑜) is equal to zero for the reactants based on the assumption
that these products are entering the gas burner with the same temperature as the reference state.
Chapter 3: Theory of the combined ORC-VCC cycles
90
When calculating the enthalpy (ℎ) of CO2 and H2O, these gases are assumed to be ideal gases,
and thus their enthalpy values are a function of temperature only. The enthalpy values for these
products for a wide range of temperatures (0-1000 oC) has therefore been adapted from a
reliable source [142] and loaded into the MATLAB program as an external function code. This
code allows the recall of the enthalpy value when the exhaust temperature is entered. It also
provides the ability to adjust the enthalpy by an interpolation process when the exact exhaust
temperature is not available in the source data.
3.12.1.4 Modelling the post heater
The post heater is a simple heat exchange. Its thermal capacity is calculated by assuming a
constant temperature value at state 15 (T15). After that, the final water temperature is calculated
from the thermal balance across the post heater as follows:
��𝑒𝑥ℎ × (ℎ14 − ℎ15) = ��𝑤 × (ℎ12 − ℎ11) (3.49)
3.12.2 Varying one or two parameters in the combined system
The MATLAB code has been developed to model the combined cycle when one or two
independent parameters are optimized. A one and/or two nested loop technique has been used
to iterate the whole combined cycle parameters. For a single nested loop, the loop boundary is:
𝑓𝑜𝑟 𝑖 = 1: 𝑛, while for a double iteration loop the boundaries are: 𝑓𝑜𝑟 𝑖 = 1: 𝑛 for the first loop
and 𝑓𝑜𝑟 𝑗 = 1: 𝑛 for the second loop. Where (𝑛) is the final boundary value.
Therefore, the results could either be expressed as a one-dimensional vector as follows:
ℎ1 = (ℎ1(𝑖), … … … ℎ1(𝑖: 𝑛))
Chapter 3: Theory of the combined ORC-VCC cycles
91
Or as a two-dimensional matrix:
ℎ7 = [ℎ7(𝑖, 𝑗) ⋯ ℎ7(𝑖: 𝑛, 𝑗)
⋮ ⋱ ⋮ℎ7(𝑖, 𝑗: 𝑛) ⋯ ℎ7(𝑖: 𝑛, 𝑗: 𝑛)
]
3.12.3 Pinch point temperature difference (PPTD) model
A number of studies available in the open literature used a simplified pinch point approach by
securing a minimum pinch point of 3-5 oC at the HX exit. However, this procedure cannot
precisely predict the pinch point between the hot and cold streams across all the heat exchanger
sectional areas, as shown in Figure (3.3). Therefore, an in-depth investigation has been carried
out in the modelling of all heat exchangers in this thesis. A developed MATLAB sub-code is
used to calculate the temperature difference between the two streams along the entire length of
the heat exchangers.
The pinch point can be identified when the temperature, enthalpy, and entropy for both streams
across the heat exchanger have been calculated. The process of pinch point calculation for the
HP condenser is shown below. The same principle can be applied to the other heat exchangers.
The enthalpy of the refrigerant stream across the condenser is divided into the number of
segments between hin and hout. In MATALB, the (linspace) function can be used for this
purpose:
𝐻𝑠𝑒𝑔𝑚𝑒𝑛𝑡 = 𝑙𝑖𝑛𝑠𝑝𝑎𝑐𝑒(ℎ2, ℎ3, 𝑛) (3.50)
Where (n) is the number of segments.
The refrigerant entropy can be calculated using the same method as above, while the
temperature is calculated using the REFPROP call function (refpropm) which requires two
identified thermophysical properties, enthalpy and condenser pressure. This temperature code
Chapter 3: Theory of the combined ORC-VCC cycles
92
should be iterated, using a nested loop, from (1 to n) to cover the temperature range across the
condenser. The result is a vector of the refrigerant temperature through the HP condenser.
For the water stream, the water temperature is calculated from the sensitive heat equation by
dividing the condenser heating capacity into segments from 0 to n, as was explained in Equation
3.50. The water entropy is calculated using the refpropm function. The result is water
temperature as a vector. The minimum PPT can be estimated by subtracting the refrigerant and
water temperature vectors, and the minimum value is the PPT.
3.13 Dynamic modelling by ASPEN PLUS
The dynamic model in this work is limited to the role of control strategies adopted for the
combined system. Therefore, the mathematical model will be applied to specific parts such as
the HP evaporator and/or condenser.
The continuity and energy balance equations for evaporator and condenser are given as:
𝜕
𝜕𝑡(𝜌𝑟𝐴𝑟𝑐𝑠) +
𝜕𝑚𝑟
𝜕𝑧= 0 (3.51)
𝜕
𝜕𝑡(𝜌𝑟𝐴𝑟𝑐𝑠) +
𝜕
𝜕𝑧(𝑚𝑟ℎ𝑟) + 𝑈𝑟𝐿𝑟𝑝(𝑇𝑟– 𝑇𝑚) = 0 (3.52)
Where the following subscripts apply: r means refrigerant, Arcs denotes the cross section area,
Ur is the thermal transmittance of the working fluid, L is the effective length, and m is the wall
material.
The discretised form of the above continuity and energy equations for the nth zone as explained
in Figure (3.7) can written as:
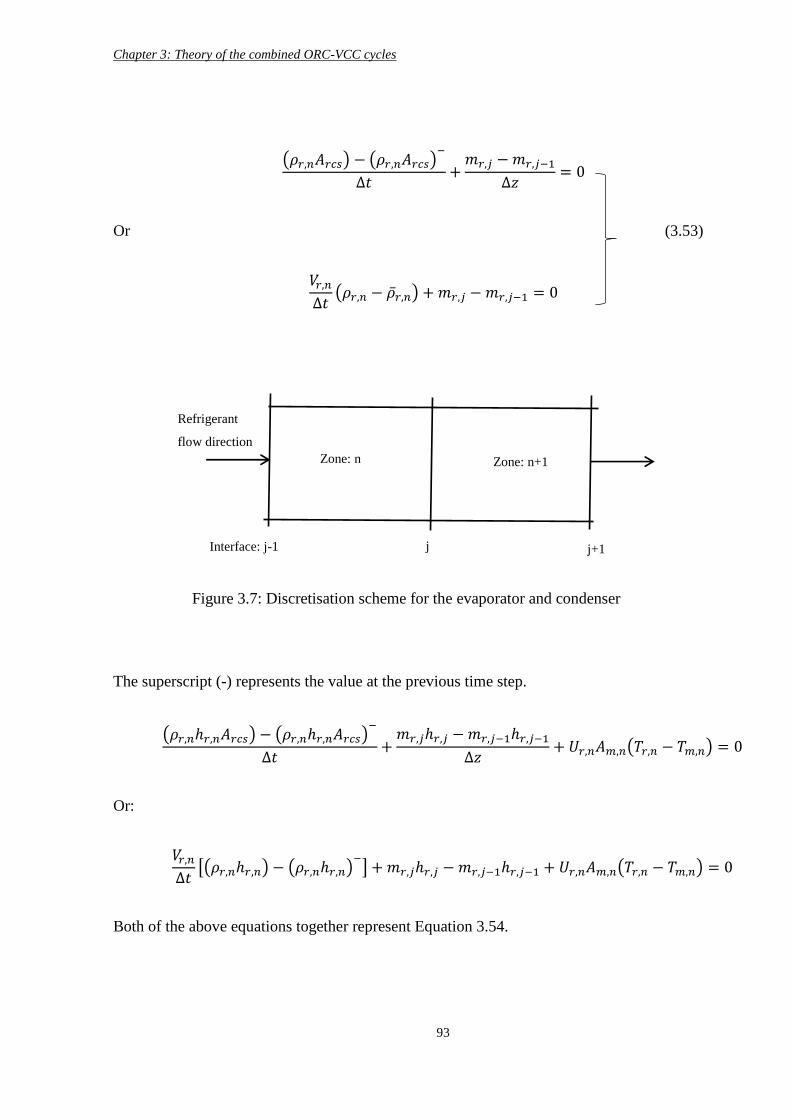
Chapter 3: Theory of the combined ORC-VCC cycles
93
(𝜌𝑟,𝑛𝐴𝑟𝑐𝑠) − (𝜌𝑟,𝑛𝐴𝑟𝑐𝑠)−
∆𝑡+
𝑚𝑟,𝑗 − 𝑚𝑟,𝑗−1
∆𝑧= 0
Or (3.53)
𝑉𝑟,𝑛
∆𝑡(𝜌𝑟,𝑛 − ��𝑟,𝑛) + 𝑚𝑟,𝑗 − 𝑚𝑟,𝑗−1 = 0
The superscript (-) represents the value at the previous time step.
(𝜌𝑟,𝑛ℎ𝑟,𝑛𝐴𝑟𝑐𝑠) − (𝜌𝑟,𝑛ℎ𝑟,𝑛𝐴𝑟𝑐𝑠)−
∆𝑡+
𝑚𝑟,𝑗ℎ𝑟,𝑗 − 𝑚𝑟,𝑗−1ℎ𝑟,𝑗−1
∆𝑧+ 𝑈𝑟,𝑛𝐴𝑚,𝑛(𝑇𝑟,𝑛 − 𝑇𝑚,𝑛) = 0
Or:
𝑉𝑟,𝑛
∆𝑡[(𝜌𝑟,𝑛ℎ𝑟,𝑛) − (𝜌𝑟,𝑛ℎ𝑟,𝑛)
−] + 𝑚𝑟,𝑗ℎ𝑟,𝑗 − 𝑚𝑟,𝑗−1ℎ𝑟,𝑗−1 + 𝑈𝑟,𝑛𝐴𝑚,𝑛(𝑇𝑟,𝑛 − 𝑇𝑚,𝑛) = 0
Both of the above equations together represent Equation 3.54.
Refrigerant
flow direction
Interface: j-1 j j+1
Zone: n Zone: n+1
Figure 3.7: Discretisation scheme for the evaporator and condenser
Chapter 3: Theory of the combined ORC-VCC cycles
94
By multiplying Equation 3.53 by ℎ𝑟,𝑛 to eliminate 𝜌𝑟,𝑛, then subtracting the results from
Equation 3.54, we arrive at Equation 3.55, below:
𝑉𝑟,𝑛��𝑟,𝑛
∆𝑡(ℎ𝑟,𝑛 − ℎ𝑟,𝑛) + 𝑚𝑟,𝑗(ℎ𝑟,𝑗 − ℎ𝑟,𝑛) + 𝑚𝑟,𝑗−1(ℎ𝑟,𝑛 − ℎ𝑟,𝑗−1) + 𝑈𝑟,𝑛𝐴𝑚,𝑛(𝑇𝑟,𝑛 −
𝑇𝑚,𝑛) = 0
By eliminating the interface variables ℎ𝑟,𝑗 and ℎ𝑟,𝑗−1, Equation 3.55 will become:
𝑉𝑟,𝑛��𝑟,𝑛
∆𝑡(ℎ𝑟,𝑛 − ℎ𝑟,𝑛) + ℎ𝑟,𝑛 max(𝑚𝑟,𝑗, 0) − ℎ𝑟,𝑛+1 max(−𝑚𝑟,𝑗, 0) − 𝑚𝑟,𝑗ℎ𝑟,𝑛)
+ 𝑚𝑟,𝑗−1ℎ𝑟,𝑛 − ℎ𝑟,𝑛max (𝑚𝑟,𝑗−1) + ℎ𝑟,𝑛 max(−𝑚𝑟,𝑗−1, 0)
+ 𝑈𝑟,𝑛𝐴𝑚,𝑛(𝑇𝑟,𝑛 − 𝑇𝑚,𝑛) = 0
This equation can be simplified as follows:
ℎ𝑟,𝑛 [𝑉𝑟,𝑛��𝑟,𝑛
∆𝑡+ max(𝑚𝑟,𝑗, 0) + max(−𝑚𝑟,𝑗−1, 0) + 𝑚𝑟,𝑗−1 − 𝑚𝑟,𝑗]
= ℎ𝑟,𝑛+1 max(−𝑚𝑟,𝑗 , 0)
+ ℎ𝑟,𝑛−1 max(𝑚𝑟,𝑗−1, 0) +𝑉𝑟,𝑛��𝑟,𝑛ℎ𝑟,𝑛
∆𝑡− 𝑈𝑟,𝑛𝐴𝑚,𝑛(𝑇𝑟,𝑛 − 𝑇𝑚,𝑛) = 0
Both of the above equations together represent Equation 3.56.
By assuming that max(𝑚𝑟,𝑗, 0) − 𝑚𝑟,𝑗 = max(−𝑚𝑟,𝑗, 0)
And max(−𝑚𝑟,𝑗−1, 0) + 𝑚𝑟,𝑗−1 = max(𝑚𝑟,𝑗−1, 0),
The final discretised equation for the refrigerant zone for the evaporator and condenser can be
written as:
𝐶𝑜𝑛𝑡𝑖𝑛𝑢𝑖𝑡𝑦: 𝑚𝑟,𝑗 = 𝑚𝑟,𝑗−1 −𝑉𝑟,𝑛
∆𝑇(𝜌𝑟,𝑛 − ��𝑟,𝑛) (3.57)
𝐸𝑛𝑒𝑟𝑔𝑦: ℎ𝑟,𝑛 =𝐴ℎ𝑟,𝑛−1+𝐵ℎ𝑟,𝑛+1−𝑈𝑟,𝑛𝐴𝑚,𝑛(𝑇𝑟,𝑛−𝑇𝑚,𝑛)+
𝑉𝑟,𝑛��𝑟,𝑛ℎ𝑟,𝑛∆𝑡
𝐶 (3.58)
Chapter 3: Theory of the combined ORC-VCC cycles
95
Where:
𝐴 = max(𝑚𝑟,𝑗−1, 0), 𝐵 = max(−𝑚𝑟,𝑗, 0), 𝐶 = 𝐴 + 𝐵 +𝑉𝑟,𝑛��𝑟,𝑛
∆𝑡
Xu, B., et al. [72] developed a transient dynamic model for an organic Rankine cycle bottoming
diesel engine for waste heat recovery. In the heat exchangers model, some vital assumptions
were adopted, such as neglecting the axial heat conduction between the working fluid and the
heat source through the wall. In addition, the temperature was assumed to be distributed
uniformly in the radial direction. The partial differential form of mass and energy balance
equations for the working fluid across the heat exchanger is given by:
𝜕��
𝜕𝑧+
𝜕𝐴𝜌
𝜕𝑡= 0 (3.59)
𝜕(𝐴𝜌ℎ−𝐴𝑝)
𝜕𝑡+
𝜕��ℎ
𝜕𝑧= 𝜋𝑑𝑈∆𝑇 (3.60)
Where:
m Refrigerant mass flow rate
A Cross sectional area
ρ Working fluid density
z Coordinate in the axial direction
𝑝 Working fluid pressure
𝑈 Heat transfer coefficient
𝑑 Working fluid effective path diameter
∆𝑇 Temperature difference between the working fluid and the wall
The above mass and energy equations are simplified to Ordinary Differential Equations as
follows:
𝑑𝑚
𝑑𝑡= ��𝑖𝑛 − ��𝑜𝑢𝑡 (3.61)
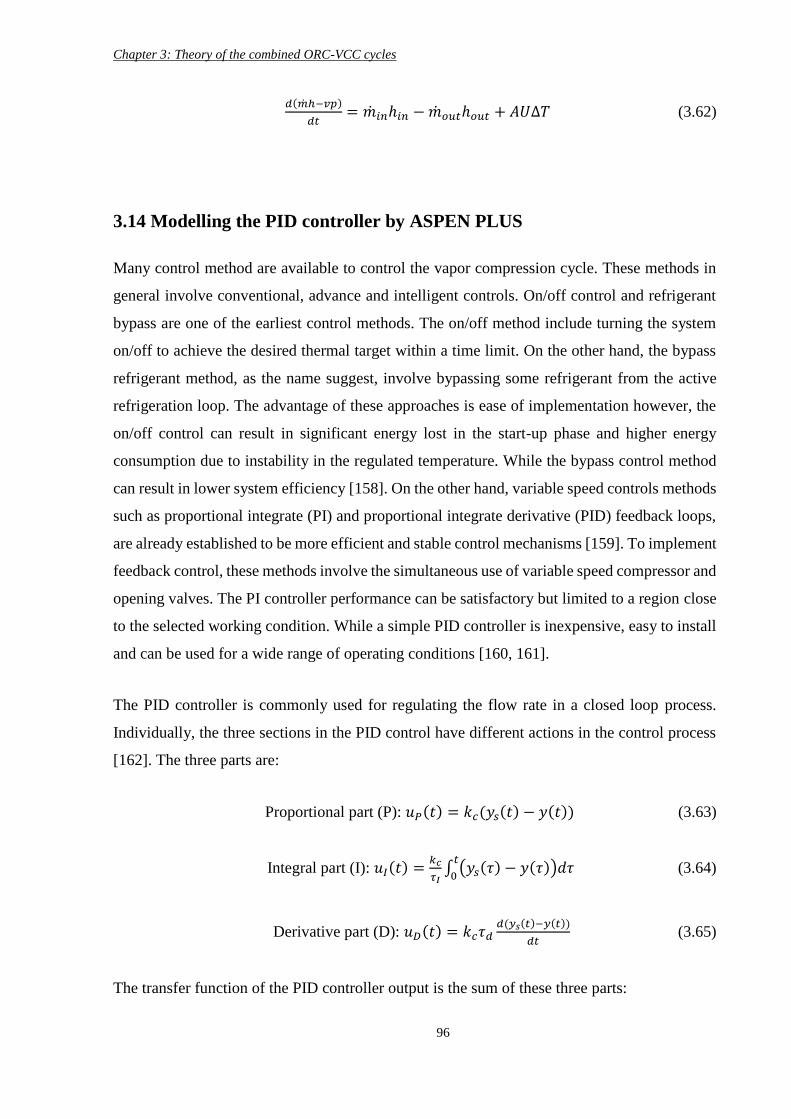
Chapter 3: Theory of the combined ORC-VCC cycles
96
𝑑(��ℎ−𝑣𝑝)
𝑑𝑡= ��𝑖𝑛ℎ𝑖𝑛 − ��𝑜𝑢𝑡ℎ𝑜𝑢𝑡 + 𝐴𝑈∆𝑇 (3.62)
3.14 Modelling the PID controller by ASPEN PLUS
Many control method are available to control the vapor compression cycle. These methods in
general involve conventional, advance and intelligent controls. On/off control and refrigerant
bypass are one of the earliest control methods. The on/off method include turning the system
on/off to achieve the desired thermal target within a time limit. On the other hand, the bypass
refrigerant method, as the name suggest, involve bypassing some refrigerant from the active
refrigeration loop. The advantage of these approaches is ease of implementation however, the
on/off control can result in significant energy lost in the start-up phase and higher energy
consumption due to instability in the regulated temperature. While the bypass control method
can result in lower system efficiency [158]. On the other hand, variable speed controls methods
such as proportional integrate (PI) and proportional integrate derivative (PID) feedback loops,
are already established to be more efficient and stable control mechanisms [159]. To implement
feedback control, these methods involve the simultaneous use of variable speed compressor and
opening valves. The PI controller performance can be satisfactory but limited to a region close
to the selected working condition. While a simple PID controller is inexpensive, easy to install
and can be used for a wide range of operating conditions [160, 161].
The PID controller is commonly used for regulating the flow rate in a closed loop process.
Individually, the three sections in the PID control have different actions in the control process
[162]. The three parts are:
Proportional part (P): 𝑢𝑃(𝑡) = 𝑘𝑐(𝑦𝑠(𝑡) − 𝑦(𝑡)) (3.63)
Integral part (I): 𝑢𝐼(𝑡) =𝑘𝑐
𝜏𝐼∫ (𝑦𝑠(𝜏) − 𝑦(𝜏))𝑑𝜏
𝑡
0 (3.64)
Derivative part (D): 𝑢𝐷(𝑡) = 𝑘𝑐𝜏𝑑𝑑(𝑦𝑠(𝑡)−𝑦(𝑡))
𝑑𝑡 (3.65)
The transfer function of the PID controller output is the sum of these three parts:
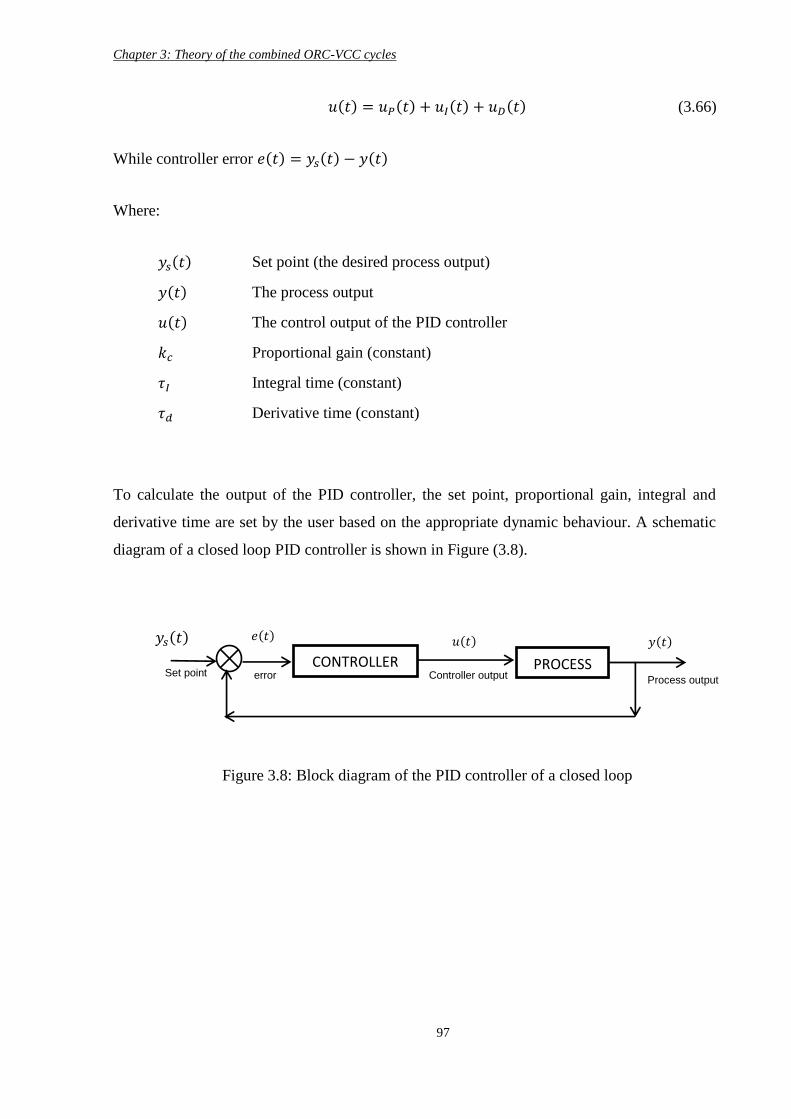
Chapter 3: Theory of the combined ORC-VCC cycles
97
𝑢(𝑡) = 𝑢𝑃(𝑡) + 𝑢𝐼(𝑡) + 𝑢𝐷(𝑡) (3.66)
While controller error 𝑒(𝑡) = 𝑦𝑠(𝑡) − 𝑦(𝑡)
Where:
𝑦𝑠(𝑡) Set point (the desired process output)
𝑦(𝑡) The process output
𝑢(𝑡) The control output of the PID controller
𝑘𝑐 Proportional gain (constant)
𝜏𝐼 Integral time (constant)
𝜏𝑑 Derivative time (constant)
To calculate the output of the PID controller, the set point, proportional gain, integral and
derivative time are set by the user based on the appropriate dynamic behaviour. A schematic
diagram of a closed loop PID controller is shown in Figure (3.8).
Set point
𝑒(𝑡)
CONTROLLER PROCESS
𝑦𝑠(𝑡)
Controller output Process output error
𝑢(𝑡) 𝑦(𝑡)
Figure 3.8: Block diagram of the PID controller of a closed loop
Chapter 4: Selection of working fluids
98
Chapter 4: Selection of working fluids
4.1 Introduction
One of the factors impacting upon the design and performance of any thermodynamic cycle is
the selection of an appropriate working fluid. Ideally, the working fluid should satisfy modern
design aspects such as system thermal efficacy and compatibility, system components’ size and
lifetime, safety and maintenance cost, and environmental impact [163, 164]. In addition, the
thermophysical properties of the chosen working fluid play a vital role in the selection process;
these include the critical temperature, the latent heat of vaporization, and the boiling point
[165]. Therefore, a properly studied and selected refrigerant can significantly enhance a sys-
tem’s thermal efficiency [166]. In practice, however, there is no single ideal fluid that can
achieve optimum levels in all these design aspects. The selection process is therefore a chal-
lenging task, and a trade-off approach is usually needed to achieve the best possible results for
a given case [167, 168].
4.2 Classification of working fluids
In general, organic working fluids can be categorized into three types according to the slope
value (𝑑𝑠
𝑑𝑡) of the saturated vapor curve on the T-s diagram, as shown in Figure (4.1). For a
slope of less than zero, the refrigerant is called a wet refrigerant, while if the slope is ∞ , it is
called an isentropic refrigerant. The third type is named dry refrigerant when the slope is above
zero [48, 169].
An ORC with an isentropic working fluid can achieve the highest thermal efficiency. In con-
trast, using a wet refrigerant could increase the possibility of refrigerant condensation during
the expansion process. This can cause damage to the turbine blades and also reduce the turbine’s
isentropic efficiency. If a wet refrigerant is to be selected, it is recommended that the refrigerant
is superheated at the turbine inlet to overcome the potential condensation problem. However,
excessive superheat can move the pressure ratio away from its optimum value, consequently
reducing the cycle efficiency.
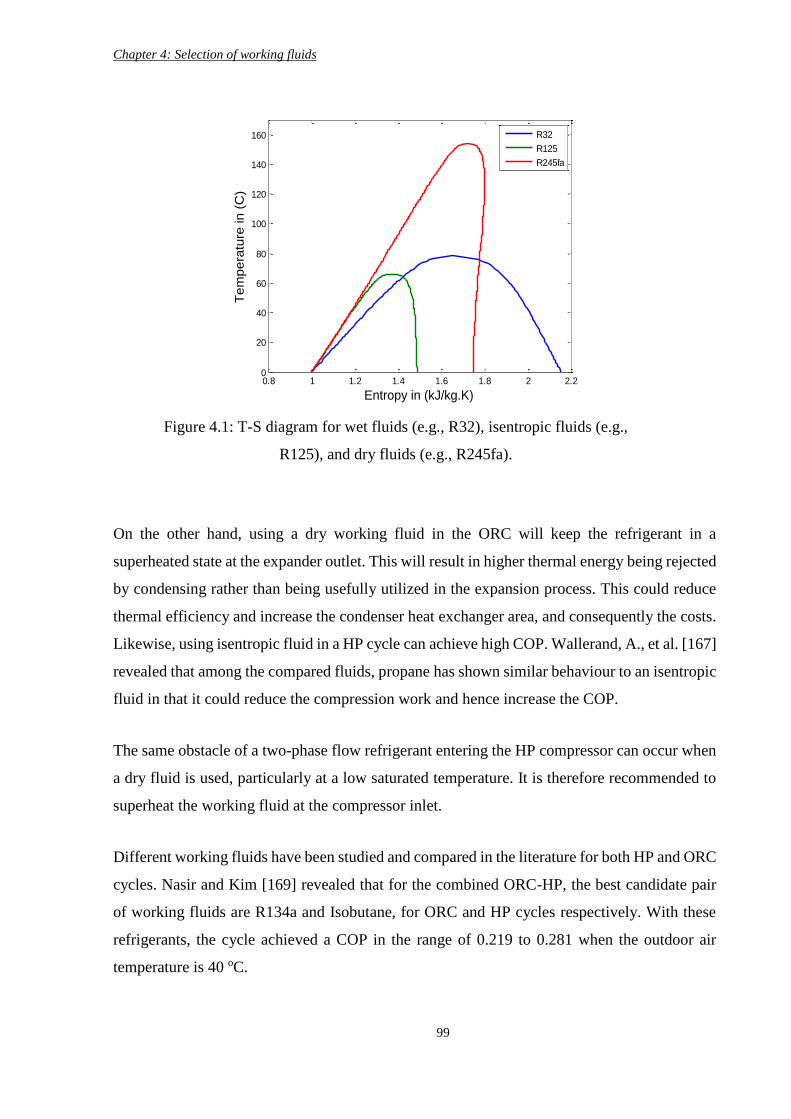
Chapter 4: Selection of working fluids
99
On the other hand, using a dry working fluid in the ORC will keep the refrigerant in a
superheated state at the expander outlet. This will result in higher thermal energy being rejected
by condensing rather than being usefully utilized in the expansion process. This could reduce
thermal efficiency and increase the condenser heat exchanger area, and consequently the costs.
Likewise, using isentropic fluid in a HP cycle can achieve high COP. Wallerand, A., et al. [167]
revealed that among the compared fluids, propane has shown similar behaviour to an isentropic
fluid in that it could reduce the compression work and hence increase the COP.
The same obstacle of a two-phase flow refrigerant entering the HP compressor can occur when
a dry fluid is used, particularly at a low saturated temperature. It is therefore recommended to
superheat the working fluid at the compressor inlet.
Different working fluids have been studied and compared in the literature for both HP and ORC
cycles. Nasir and Kim [169] revealed that for the combined ORC-HP, the best candidate pair
of working fluids are R134a and Isobutane, for ORC and HP cycles respectively. With these
refrigerants, the cycle achieved a COP in the range of 0.219 to 0.281 when the outdoor air
temperature is 40 oC.
Figure 4.1: T-S diagram for wet fluids (e.g., R32), isentropic fluids (e.g.,
R125), and dry fluids (e.g., R245fa).
0.8 1 1.2 1.4 1.6 1.8 2 2.20
20
40
60
80
100
120
140
160
Entropy in (kJ/kg.K)
Tem
pe
ratu
re in
(C
)
R32
R125
R245fa
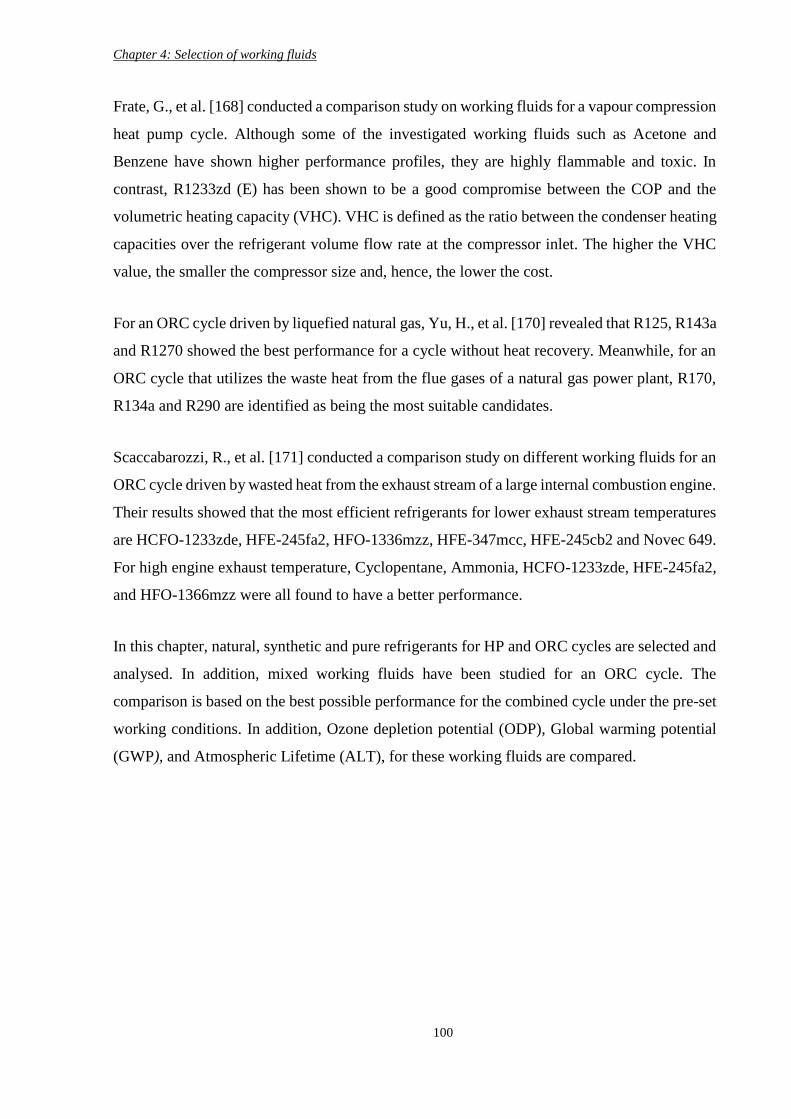
Chapter 4: Selection of working fluids
100
Frate, G., et al. [168] conducted a comparison study on working fluids for a vapour compression
heat pump cycle. Although some of the investigated working fluids such as Acetone and
Benzene have shown higher performance profiles, they are highly flammable and toxic. In
contrast, R1233zd (E) has been shown to be a good compromise between the COP and the
volumetric heating capacity (VHC). VHC is defined as the ratio between the condenser heating
capacities over the refrigerant volume flow rate at the compressor inlet. The higher the VHC
value, the smaller the compressor size and, hence, the lower the cost.
For an ORC cycle driven by liquefied natural gas, Yu, H., et al. [170] revealed that R125, R143a
and R1270 showed the best performance for a cycle without heat recovery. Meanwhile, for an
ORC cycle that utilizes the waste heat from the flue gases of a natural gas power plant, R170,
R134a and R290 are identified as being the most suitable candidates.
Scaccabarozzi, R., et al. [171] conducted a comparison study on different working fluids for an
ORC cycle driven by wasted heat from the exhaust stream of a large internal combustion engine.
Their results showed that the most efficient refrigerants for lower exhaust stream temperatures
are HCFO-1233zde, HFE-245fa2, HFO-1336mzz, HFE-347mcc, HFE-245cb2 and Novec 649.
For high engine exhaust temperature, Cyclopentane, Ammonia, HCFO-1233zde, HFE-245fa2,
and HFO-1366mzz were all found to have a better performance.
In this chapter, natural, synthetic and pure refrigerants for HP and ORC cycles are selected and
analysed. In addition, mixed working fluids have been studied for an ORC cycle. The
comparison is based on the best possible performance for the combined cycle under the pre-set
working conditions. In addition, Ozone depletion potential (ODP), Global warming potential
(GWP), and Atmospheric Lifetime (ALT), for these working fluids are compared.
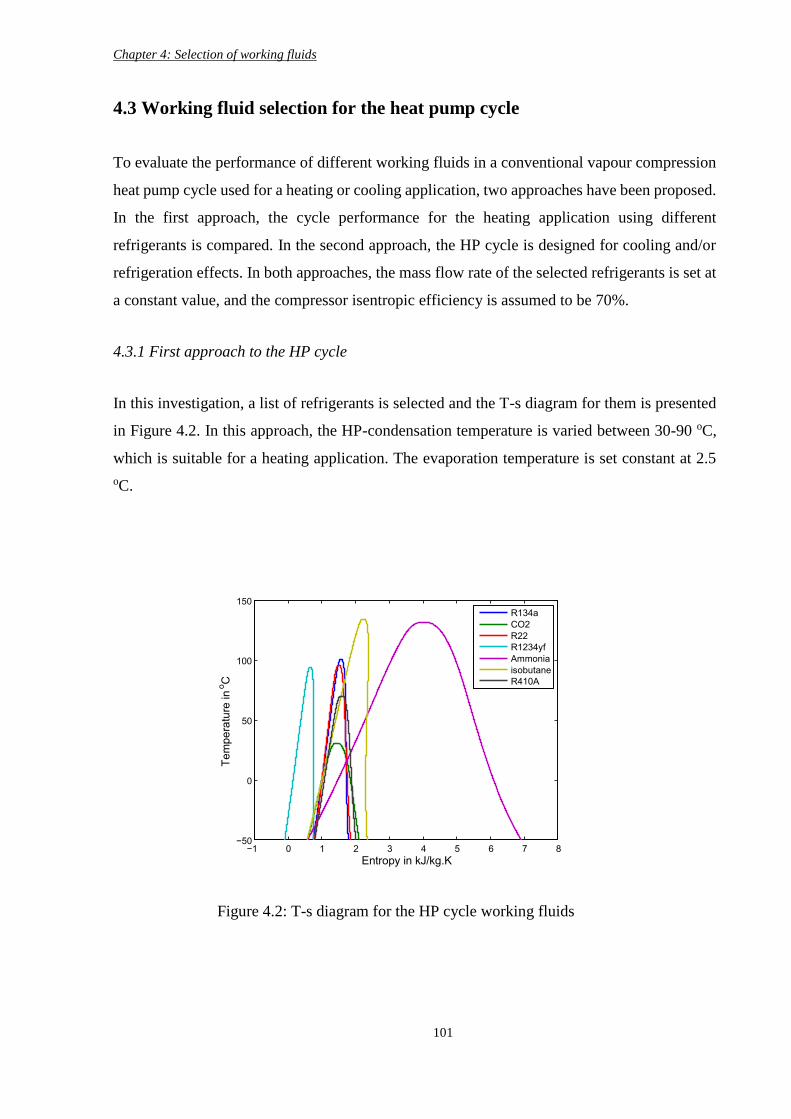
Chapter 4: Selection of working fluids
101
4.3 Working fluid selection for the heat pump cycle
To evaluate the performance of different working fluids in a conventional vapour compression
heat pump cycle used for a heating or cooling application, two approaches have been proposed.
In the first approach, the cycle performance for the heating application using different
refrigerants is compared. In the second approach, the HP cycle is designed for cooling and/or
refrigeration effects. In both approaches, the mass flow rate of the selected refrigerants is set at
a constant value, and the compressor isentropic efficiency is assumed to be 70%.
4.3.1 First approach to the HP cycle
In this investigation, a list of refrigerants is selected and the T-s diagram for them is presented
in Figure 4.2. In this approach, the HP-condensation temperature is varied between 30-90 oC,
which is suitable for a heating application. The evaporation temperature is set constant at 2.5
oC.
Figure 4.2: T-s diagram for the HP cycle working fluids
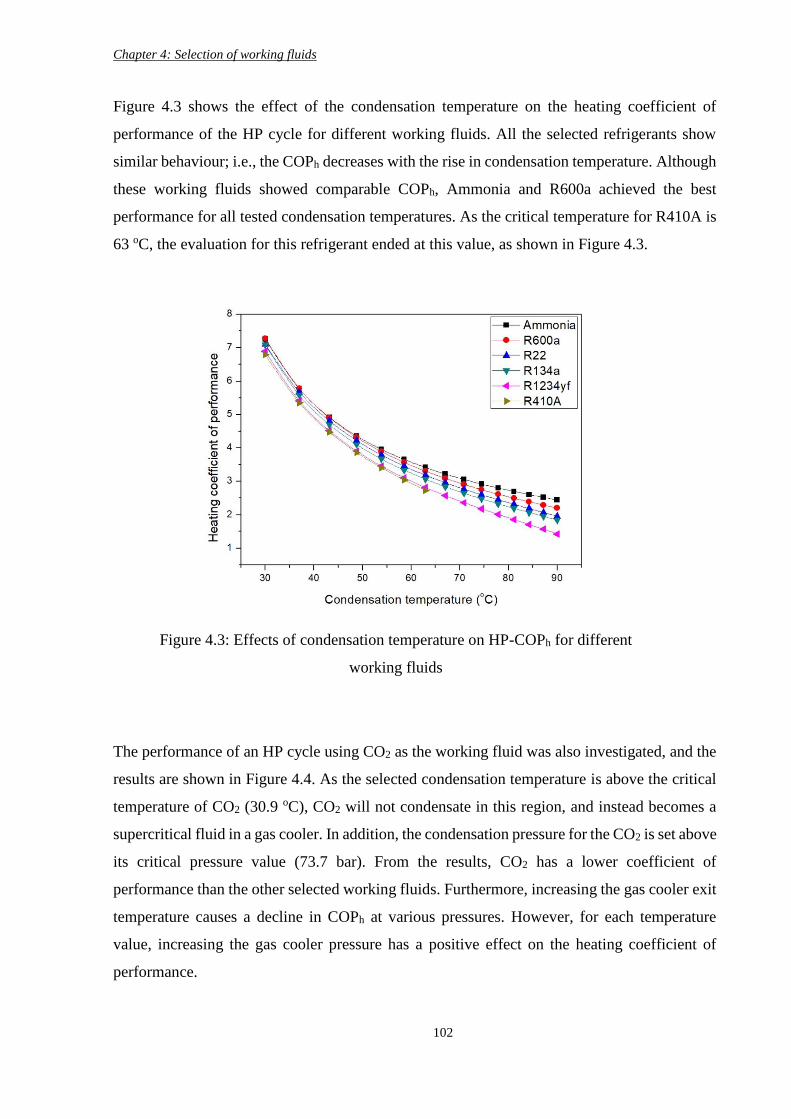
Chapter 4: Selection of working fluids
102
Figure 4.3 shows the effect of the condensation temperature on the heating coefficient of
performance of the HP cycle for different working fluids. All the selected refrigerants show
similar behaviour; i.e., the COPh decreases with the rise in condensation temperature. Although
these working fluids showed comparable COPh, Ammonia and R600a achieved the best
performance for all tested condensation temperatures. As the critical temperature for R410A is
63 oC, the evaluation for this refrigerant ended at this value, as shown in Figure 4.3.
The performance of an HP cycle using CO2 as the working fluid was also investigated, and the
results are shown in Figure 4.4. As the selected condensation temperature is above the critical
temperature of CO2 (30.9 oC), CO2 will not condensate in this region, and instead becomes a
supercritical fluid in a gas cooler. In addition, the condensation pressure for the CO2 is set above
its critical pressure value (73.7 bar). From the results, CO2 has a lower coefficient of
performance than the other selected working fluids. Furthermore, increasing the gas cooler exit
temperature causes a decline in COPh at various pressures. However, for each temperature
value, increasing the gas cooler pressure has a positive effect on the heating coefficient of
performance.
Figure 4.3: Effects of condensation temperature on HP-COPh for different
working fluids
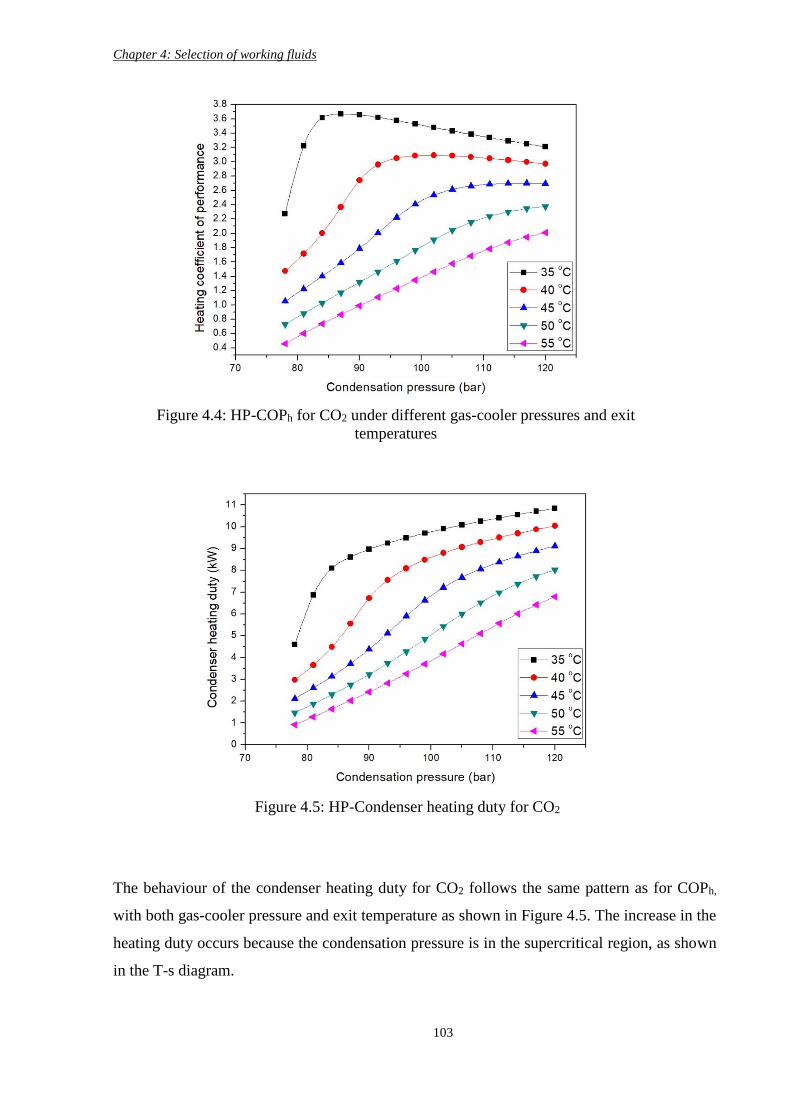
Chapter 4: Selection of working fluids
103
The behaviour of the condenser heating duty for CO2 follows the same pattern as for COPh,
with both gas-cooler pressure and exit temperature as shown in Figure 4.5. The increase in the
heating duty occurs because the condensation pressure is in the supercritical region, as shown
in the T-s diagram.
Figure 4.4: HP-COPh for CO2 under different gas-cooler pressures and exit
temperatures
Figure 4.5: HP-Condenser heating duty for CO2
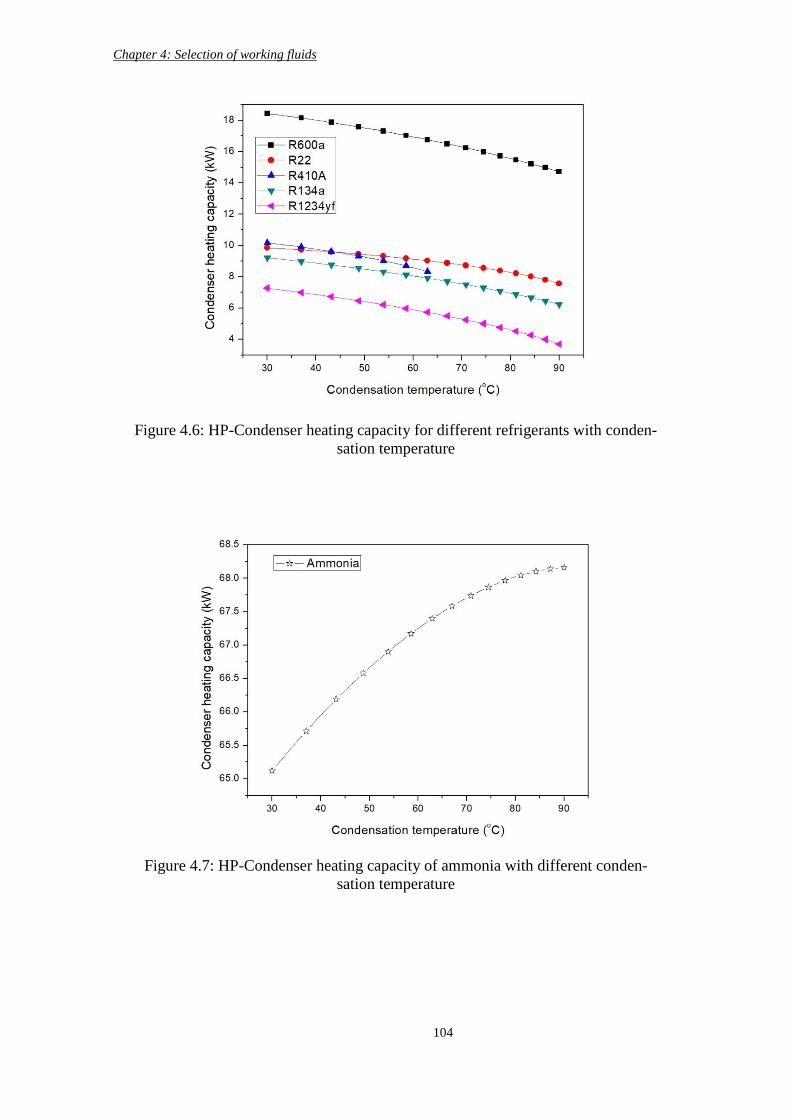
Chapter 4: Selection of working fluids
104
Figure 4.6: HP-Condenser heating capacity for different refrigerants with conden-
sation temperature
Figure 4.7: HP-Condenser heating capacity of ammonia with different conden-
sation temperature
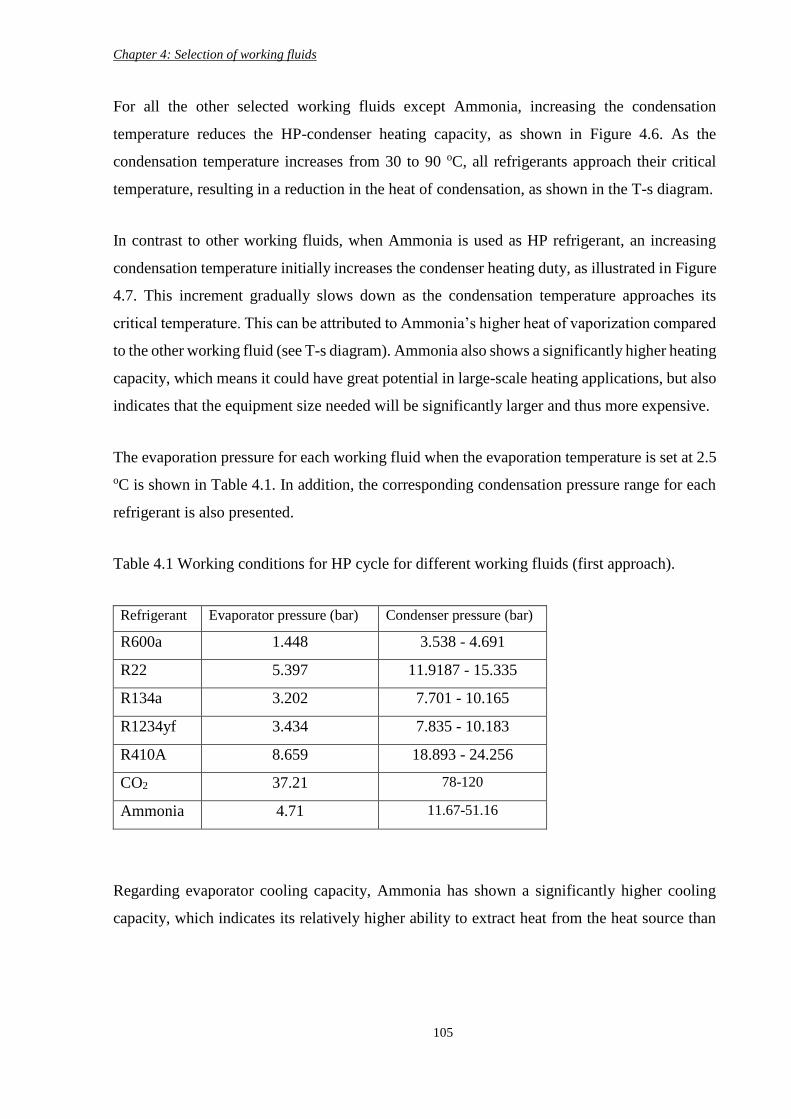
Chapter 4: Selection of working fluids
105
For all the other selected working fluids except Ammonia, increasing the condensation
temperature reduces the HP-condenser heating capacity, as shown in Figure 4.6. As the
condensation temperature increases from 30 to 90 oC, all refrigerants approach their critical
temperature, resulting in a reduction in the heat of condensation, as shown in the T-s diagram.
In contrast to other working fluids, when Ammonia is used as HP refrigerant, an increasing
condensation temperature initially increases the condenser heating duty, as illustrated in Figure
4.7. This increment gradually slows down as the condensation temperature approaches its
critical temperature. This can be attributed to Ammonia’s higher heat of vaporization compared
to the other working fluid (see T-s diagram). Ammonia also shows a significantly higher heating
capacity, which means it could have great potential in large-scale heating applications, but also
indicates that the equipment size needed will be significantly larger and thus more expensive.
The evaporation pressure for each working fluid when the evaporation temperature is set at 2.5
oC is shown in Table 4.1. In addition, the corresponding condensation pressure range for each
refrigerant is also presented.
Table 4.1 Working conditions for HP cycle for different working fluids (first approach).
Refrigerant Evaporator pressure (bar) Condenser pressure (bar)
R600a 1.448 3.538 - 4.691
R22 5.397 11.9187 - 15.335
R134a 3.202 7.701 - 10.165
R1234yf 3.434 7.835 - 10.183
R410A 8.659 18.893 - 24.256
CO2 37.21 78-120
Ammonia 4.71 11.67-51.16
Regarding evaporator cooling capacity, Ammonia has shown a significantly higher cooling
capacity, which indicates its relatively higher ability to extract heat from the heat source than
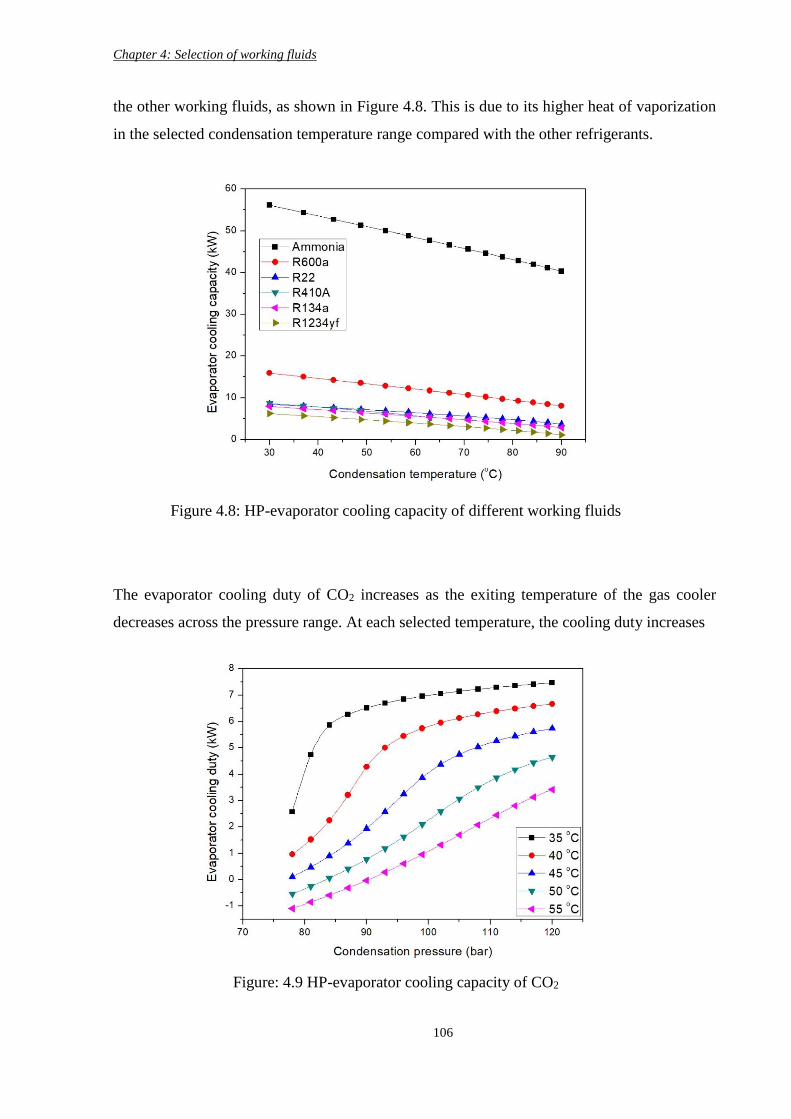
Chapter 4: Selection of working fluids
106
the other working fluids, as shown in Figure 4.8. This is due to its higher heat of vaporization
in the selected condensation temperature range compared with the other refrigerants.
The evaporator cooling duty of CO2 increases as the exiting temperature of the gas cooler
decreases across the pressure range. At each selected temperature, the cooling duty increases
Figure 4.8: HP-evaporator cooling capacity of different working fluids
Figure: 4.9 HP-evaporator cooling capacity of CO2
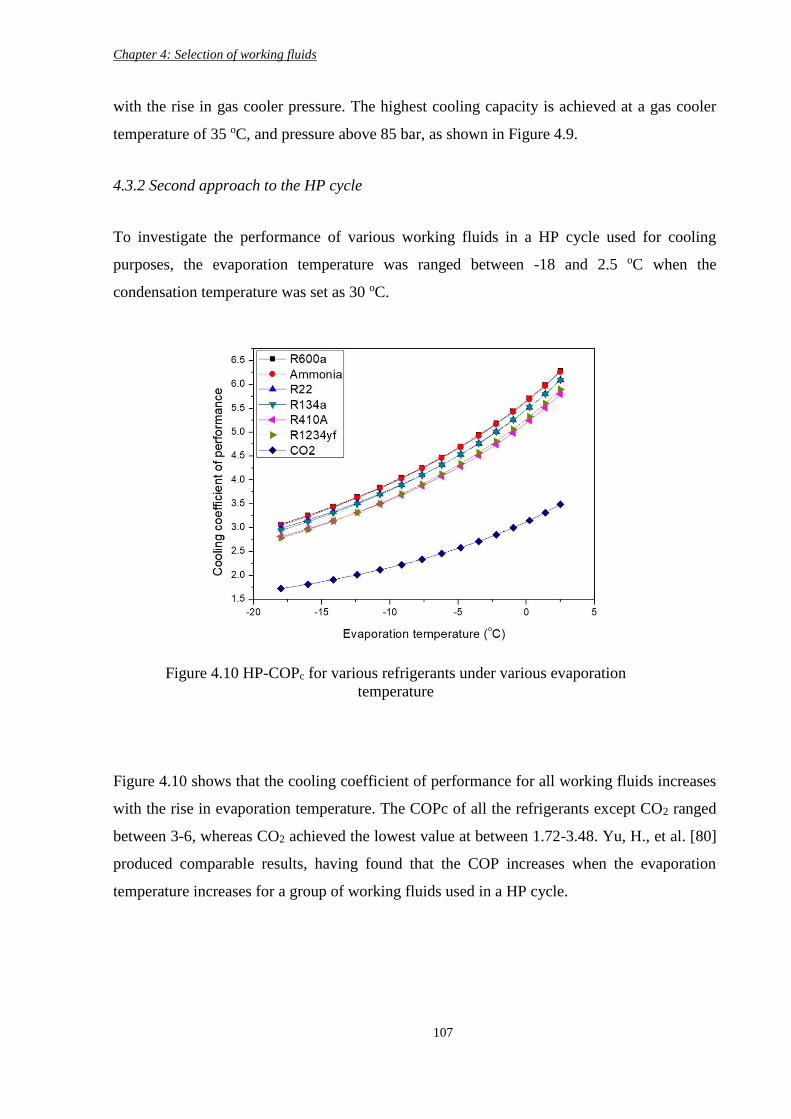
Chapter 4: Selection of working fluids
107
with the rise in gas cooler pressure. The highest cooling capacity is achieved at a gas cooler
temperature of 35 oC, and pressure above 85 bar, as shown in Figure 4.9.
4.3.2 Second approach to the HP cycle
To investigate the performance of various working fluids in a HP cycle used for cooling
purposes, the evaporation temperature was ranged between -18 and 2.5 oC when the
condensation temperature was set as 30 oC.
Figure 4.10 shows that the cooling coefficient of performance for all working fluids increases
with the rise in evaporation temperature. The COPc of all the refrigerants except CO2 ranged
between 3-6, whereas CO2 achieved the lowest value at between 1.72-3.48. Yu, H., et al. [80]
produced comparable results, having found that the COP increases when the evaporation
temperature increases for a group of working fluids used in a HP cycle.
Figure 4.10 HP-COPc for various refrigerants under various evaporation
temperature
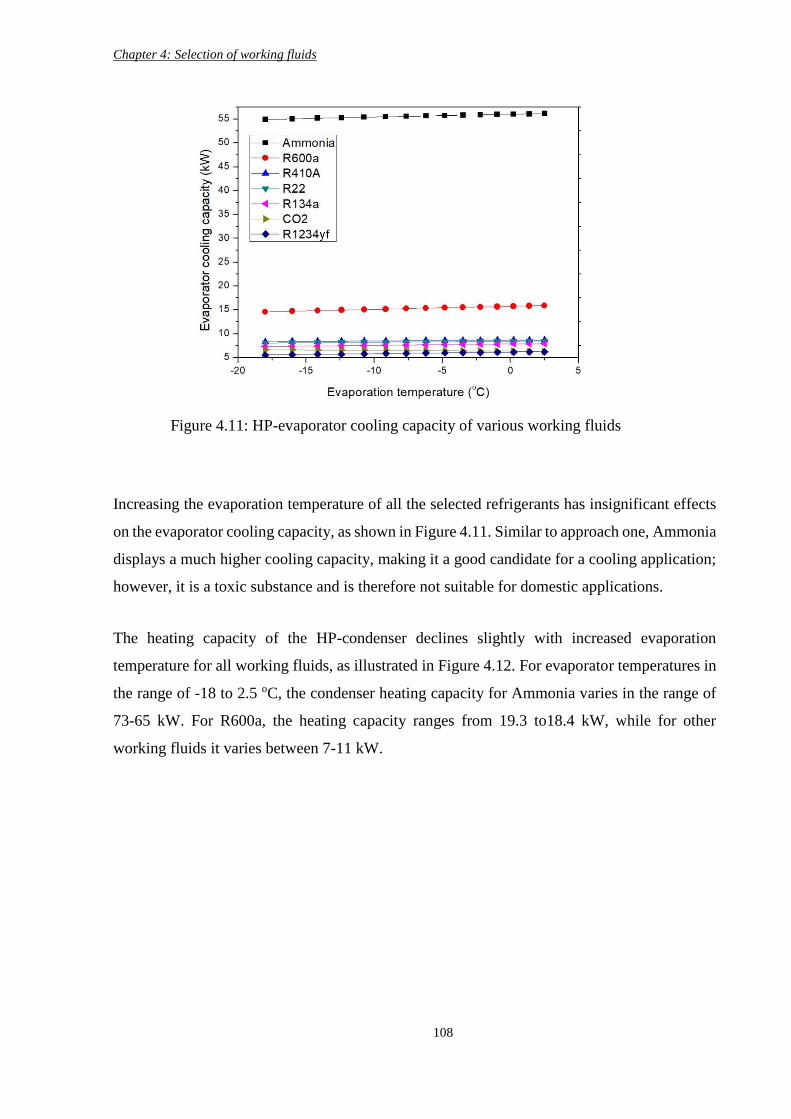
Chapter 4: Selection of working fluids
108
Increasing the evaporation temperature of all the selected refrigerants has insignificant effects
on the evaporator cooling capacity, as shown in Figure 4.11. Similar to approach one, Ammonia
displays a much higher cooling capacity, making it a good candidate for a cooling application;
however, it is a toxic substance and is therefore not suitable for domestic applications.
The heating capacity of the HP-condenser declines slightly with increased evaporation
temperature for all working fluids, as illustrated in Figure 4.12. For evaporator temperatures in
the range of -18 to 2.5 oC, the condenser heating capacity for Ammonia varies in the range of
73-65 kW. For R600a, the heating capacity ranges from 19.3 to18.4 kW, while for other
working fluids it varies between 7-11 kW.
Figure 4.11: HP-evaporator cooling capacity of various working fluids
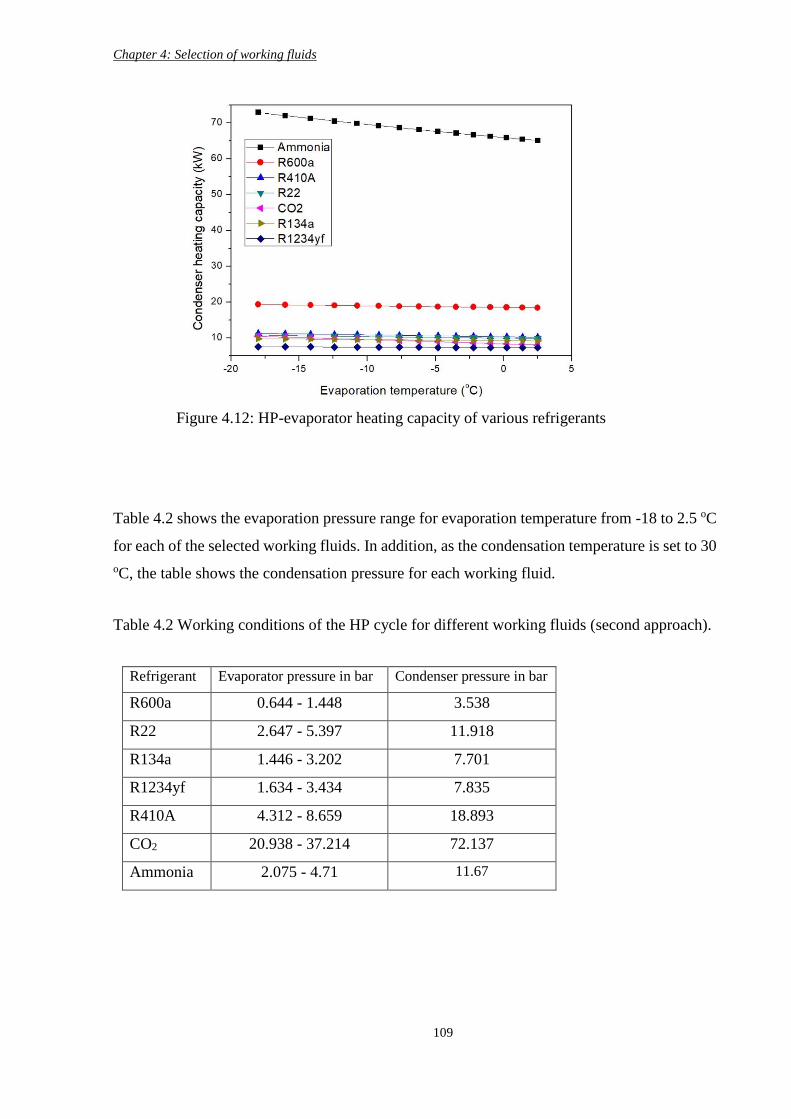
Chapter 4: Selection of working fluids
109
Table 4.2 shows the evaporation pressure range for evaporation temperature from -18 to 2.5 oC
for each of the selected working fluids. In addition, as the condensation temperature is set to 30
oC, the table shows the condensation pressure for each working fluid.
Table 4.2 Working conditions of the HP cycle for different working fluids (second approach).
Refrigerant Evaporator pressure in bar Condenser pressure in bar
R600a 0.644 - 1.448 3.538
R22 2.647 - 5.397 11.918
R134a 1.446 - 3.202 7.701
R1234yf 1.634 - 3.434 7.835
R410A 4.312 - 8.659 18.893
CO2 20.938 - 37.214 72.137
Ammonia 2.075 - 4.71 11.67
Figure 4.12: HP-evaporator heating capacity of various refrigerants
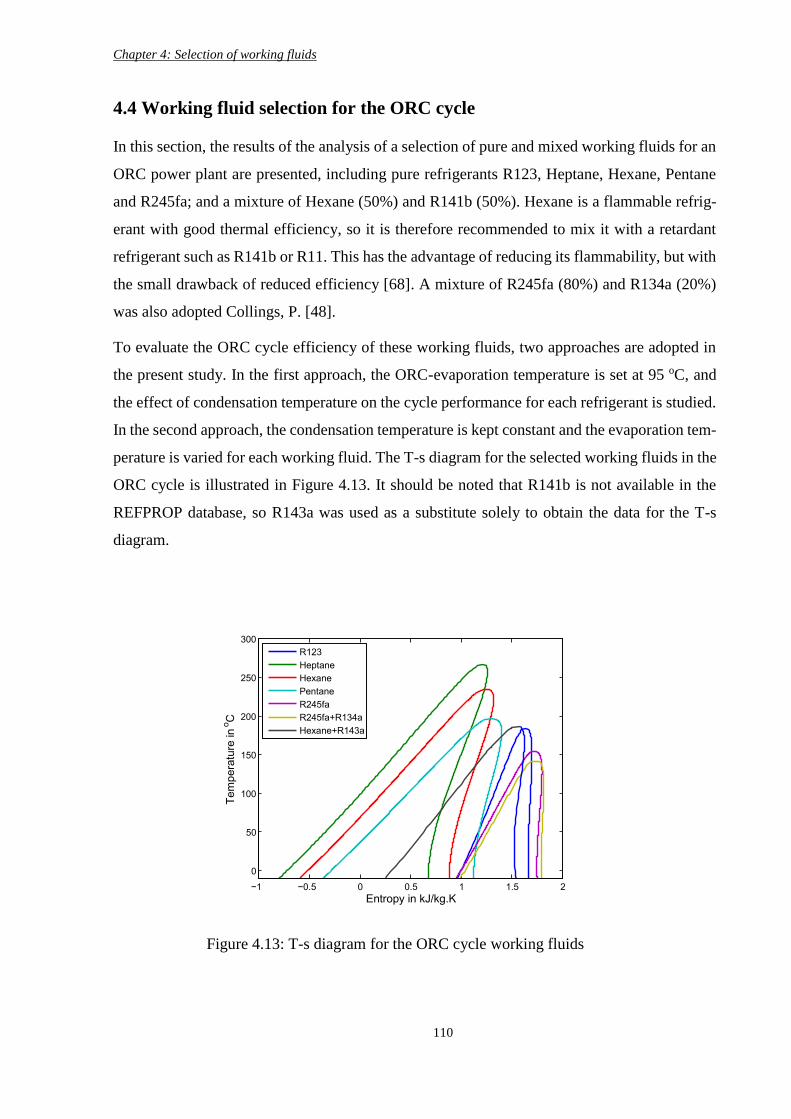
Chapter 4: Selection of working fluids
110
4.4 Working fluid selection for the ORC cycle
In this section, the results of the analysis of a selection of pure and mixed working fluids for an
ORC power plant are presented, including pure refrigerants R123, Heptane, Hexane, Pentane
and R245fa; and a mixture of Hexane (50%) and R141b (50%). Hexane is a flammable refrig-
erant with good thermal efficiency, so it is therefore recommended to mix it with a retardant
refrigerant such as R141b or R11. This has the advantage of reducing its flammability, but with
the small drawback of reduced efficiency [68]. A mixture of R245fa (80%) and R134a (20%)
was also adopted Collings, P. [48].
To evaluate the ORC cycle efficiency of these working fluids, two approaches are adopted in
the present study. In the first approach, the ORC-evaporation temperature is set at 95 oC, and
the effect of condensation temperature on the cycle performance for each refrigerant is studied.
In the second approach, the condensation temperature is kept constant and the evaporation tem-
perature is varied for each working fluid. The T-s diagram for the selected working fluids in the
ORC cycle is illustrated in Figure 4.13. It should be noted that R141b is not available in the
REFPROP database, so R143a was used as a substitute solely to obtain the data for the T-s
diagram.
Figure 4.13: T-s diagram for the ORC cycle working fluids
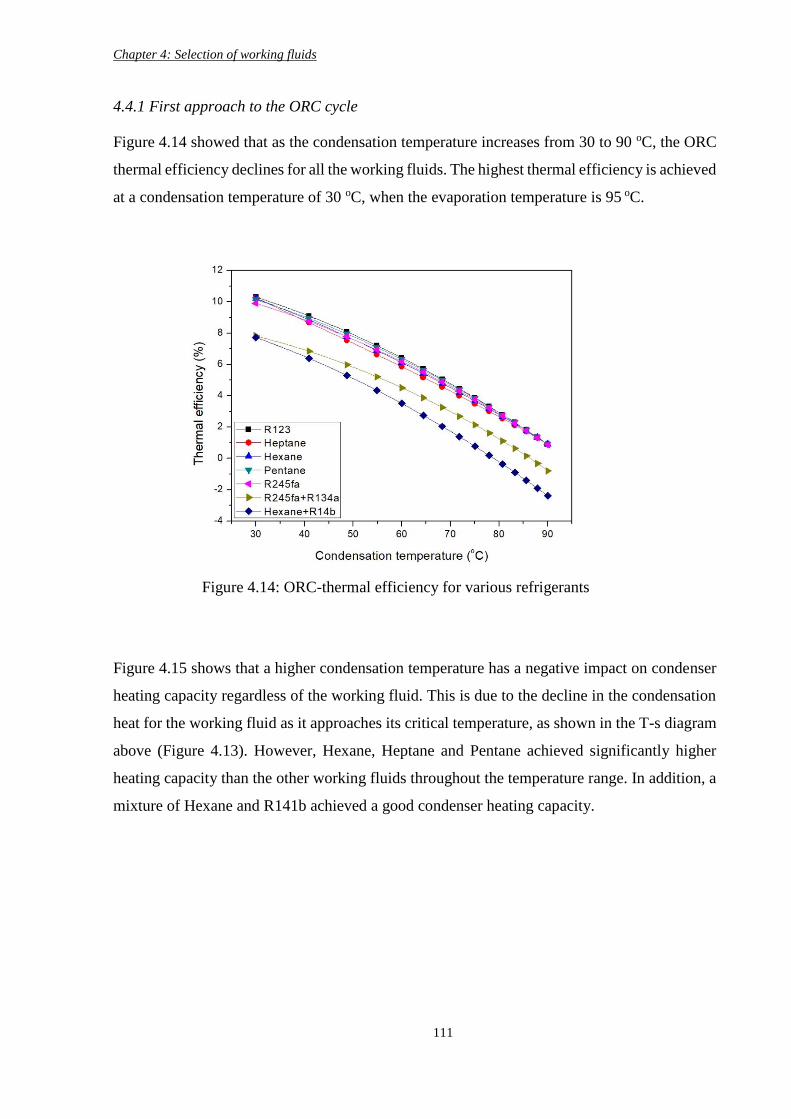
Chapter 4: Selection of working fluids
111
4.4.1 First approach to the ORC cycle
Figure 4.14 showed that as the condensation temperature increases from 30 to 90 oC, the ORC
thermal efficiency declines for all the working fluids. The highest thermal efficiency is achieved
at a condensation temperature of 30 oC, when the evaporation temperature is 95 oC.
Figure 4.15 shows that a higher condensation temperature has a negative impact on condenser
heating capacity regardless of the working fluid. This is due to the decline in the condensation
heat for the working fluid as it approaches its critical temperature, as shown in the T-s diagram
above (Figure 4.13). However, Hexane, Heptane and Pentane achieved significantly higher
heating capacity than the other working fluids throughout the temperature range. In addition, a
mixture of Hexane and R141b achieved a good condenser heating capacity.
Figure 4.14: ORC-thermal efficiency for various refrigerants
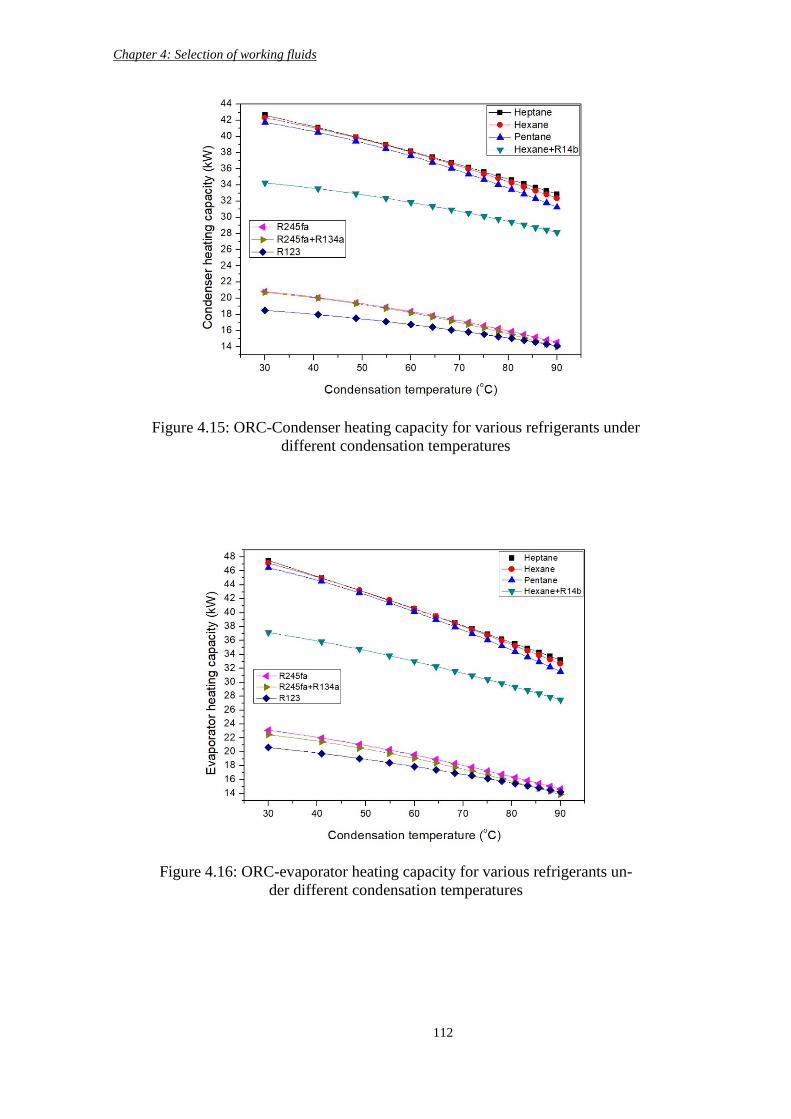
Chapter 4: Selection of working fluids
112
Figure 4.15: ORC-Condenser heating capacity for various refrigerants under
different condensation temperatures
Figure 4.16: ORC-evaporator heating capacity for various refrigerants un-
der different condensation temperatures
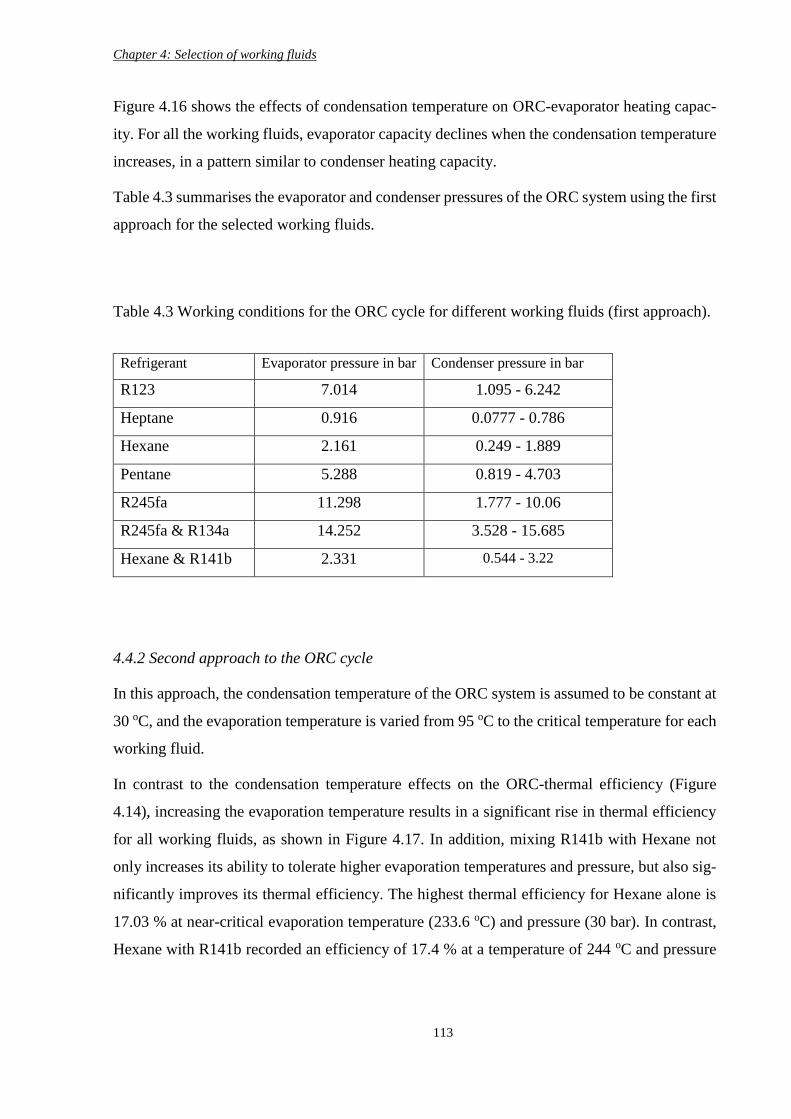
Chapter 4: Selection of working fluids
113
Figure 4.16 shows the effects of condensation temperature on ORC-evaporator heating capac-
ity. For all the working fluids, evaporator capacity declines when the condensation temperature
increases, in a pattern similar to condenser heating capacity.
Table 4.3 summarises the evaporator and condenser pressures of the ORC system using the first
approach for the selected working fluids.
Table 4.3 Working conditions for the ORC cycle for different working fluids (first approach).
Refrigerant Evaporator pressure in bar Condenser pressure in bar
R123 7.014 1.095 - 6.242
Heptane 0.916 0.0777 - 0.786
Hexane 2.161 0.249 - 1.889
Pentane 5.288 0.819 - 4.703
R245fa 11.298 1.777 - 10.06
R245fa & R134a 14.252 3.528 - 15.685
Hexane & R141b 2.331 0.544 - 3.22
4.4.2 Second approach to the ORC cycle
In this approach, the condensation temperature of the ORC system is assumed to be constant at
30 oC, and the evaporation temperature is varied from 95 oC to the critical temperature for each
working fluid.
In contrast to the condensation temperature effects on the ORC-thermal efficiency (Figure
4.14), increasing the evaporation temperature results in a significant rise in thermal efficiency
for all working fluids, as shown in Figure 4.17. In addition, mixing R141b with Hexane not
only increases its ability to tolerate higher evaporation temperatures and pressure, but also sig-
nificantly improves its thermal efficiency. The highest thermal efficiency for Hexane alone is
17.03 % at near-critical evaporation temperature (233.6 oC) and pressure (30 bar). In contrast,
Hexane with R141b recorded an efficiency of 17.4 % at a temperature of 244 oC and pressure
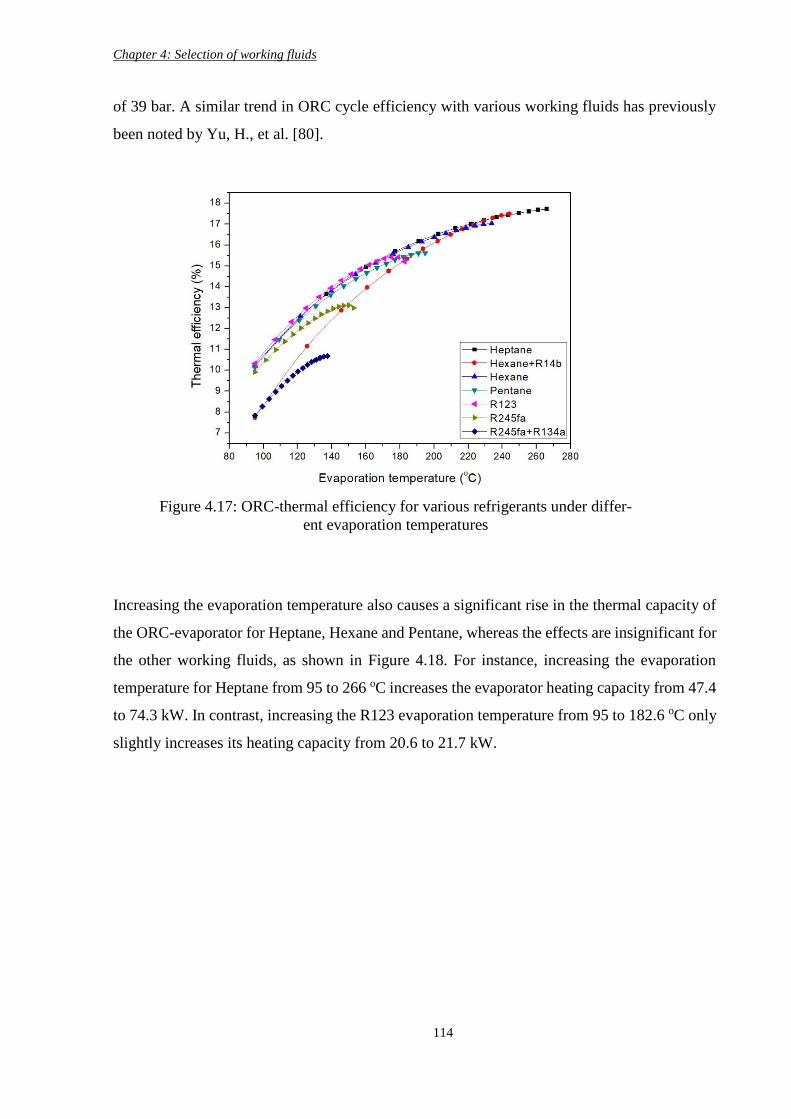
Chapter 4: Selection of working fluids
114
of 39 bar. A similar trend in ORC cycle efficiency with various working fluids has previously
been noted by Yu, H., et al. [80].
Increasing the evaporation temperature also causes a significant rise in the thermal capacity of
the ORC-evaporator for Heptane, Hexane and Pentane, whereas the effects are insignificant for
the other working fluids, as shown in Figure 4.18. For instance, increasing the evaporation
temperature for Heptane from 95 to 266 oC increases the evaporator heating capacity from 47.4
to 74.3 kW. In contrast, increasing the R123 evaporation temperature from 95 to 182.6 oC only
slightly increases its heating capacity from 20.6 to 21.7 kW.
Figure 4.17: ORC-thermal efficiency for various refrigerants under differ-
ent evaporation temperatures
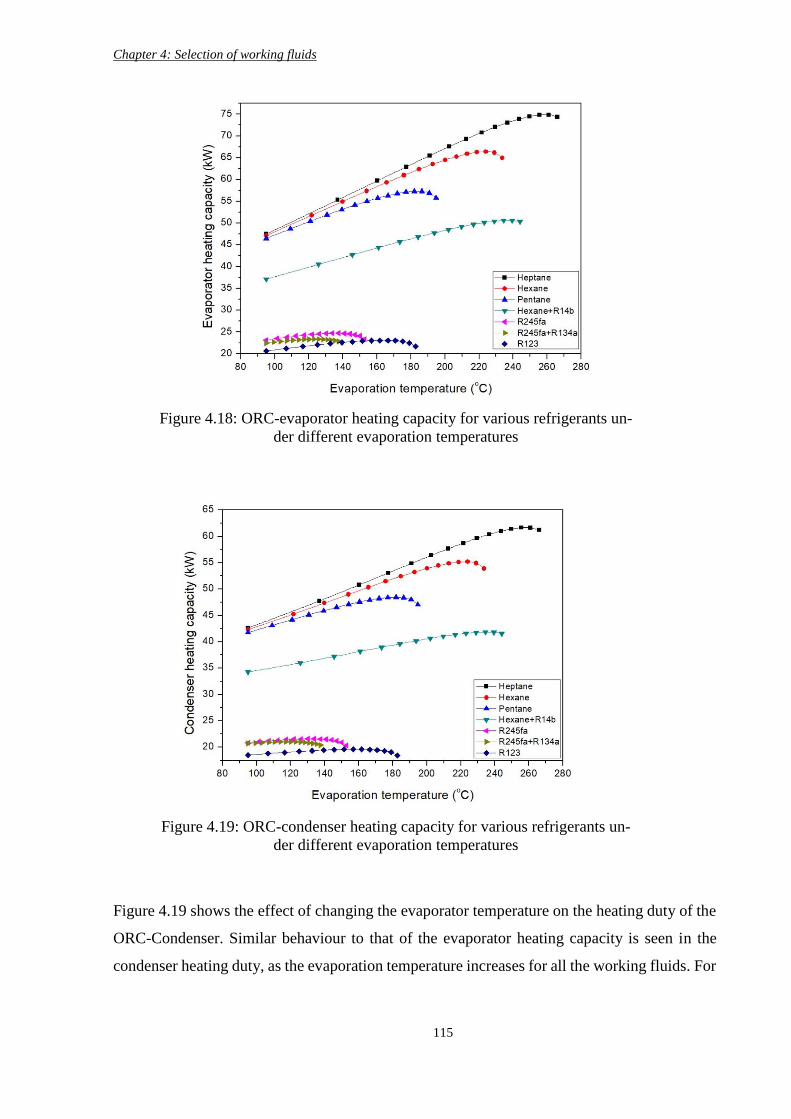
Chapter 4: Selection of working fluids
115
Figure 4.19 shows the effect of changing the evaporator temperature on the heating duty of the
ORC-Condenser. Similar behaviour to that of the evaporator heating capacity is seen in the
condenser heating duty, as the evaporation temperature increases for all the working fluids. For
Figure 4.18: ORC-evaporator heating capacity for various refrigerants un-
der different evaporation temperatures
Figure 4.19: ORC-condenser heating capacity for various refrigerants un-
der different evaporation temperatures
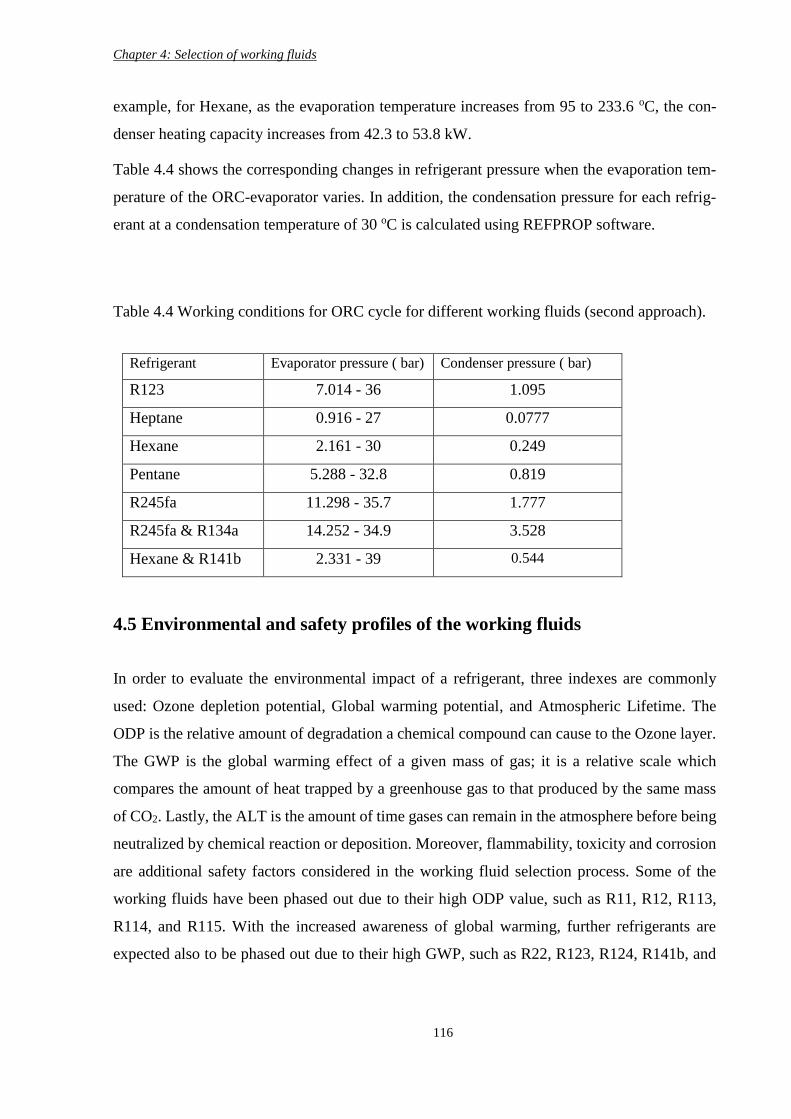
Chapter 4: Selection of working fluids
116
example, for Hexane, as the evaporation temperature increases from 95 to 233.6 oC, the con-
denser heating capacity increases from 42.3 to 53.8 kW.
Table 4.4 shows the corresponding changes in refrigerant pressure when the evaporation tem-
perature of the ORC-evaporator varies. In addition, the condensation pressure for each refrig-
erant at a condensation temperature of 30 oC is calculated using REFPROP software.
Table 4.4 Working conditions for ORC cycle for different working fluids (second approach).
Refrigerant Evaporator pressure ( bar) Condenser pressure ( bar)
R123 7.014 - 36 1.095
Heptane 0.916 - 27 0.0777
Hexane 2.161 - 30 0.249
Pentane 5.288 - 32.8 0.819
R245fa 11.298 - 35.7 1.777
R245fa & R134a 14.252 - 34.9 3.528
Hexane & R141b 2.331 - 39 0.544
4.5 Environmental and safety profiles of the working fluids
In order to evaluate the environmental impact of a refrigerant, three indexes are commonly
used: Ozone depletion potential, Global warming potential, and Atmospheric Lifetime. The
ODP is the relative amount of degradation a chemical compound can cause to the Ozone layer.
The GWP is the global warming effect of a given mass of gas; it is a relative scale which
compares the amount of heat trapped by a greenhouse gas to that produced by the same mass
of CO2. Lastly, the ALT is the amount of time gases can remain in the atmosphere before being
neutralized by chemical reaction or deposition. Moreover, flammability, toxicity and corrosion
are additional safety factors considered in the working fluid selection process. Some of the
working fluids have been phased out due to their high ODP value, such as R11, R12, R113,
R114, and R115. With the increased awareness of global warming, further refrigerants are
expected also to be phased out due to their high GWP, such as R22, R123, R124, R141b, and
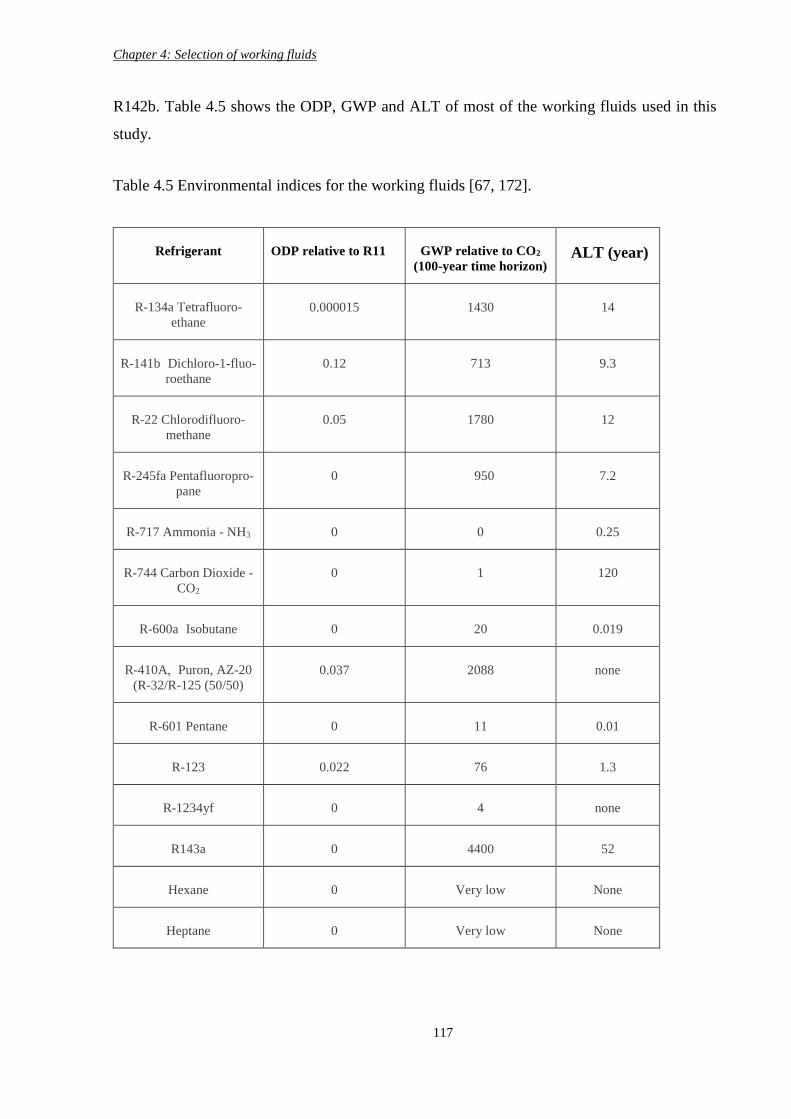
Chapter 4: Selection of working fluids
117
R142b. Table 4.5 shows the ODP, GWP and ALT of most of the working fluids used in this
study.
Table 4.5 Environmental indices for the working fluids [67, 172].
Refrigerant ODP relative to R11 GWP relative to CO2
(100-year time horizon) ALT (year)
R-134a Tetrafluoro-
ethane
0.000015 1430 14
R-141b Dichloro-1-fluo-
roethane 0.12 713 9.3
R-22 Chlorodifluoro-
methane
0.05 1780 12
R-245fa Pentafluoropro-
pane
0 950 7.2
R-717 Ammonia - NH3 0 0 0.25
R-744 Carbon Dioxide -
CO2 0 1 120
R-600a Isobutane 0 20 0.019
R-410A, Puron, AZ-20
(R-32/R-125 (50/50) 0.037 2088 none
R-601 Pentane 0 11 0.01
R-123 0.022 76 1.3
R-1234yf 0 4 none
R143a 0 4400 52
Hexane 0 Very low None
Heptane 0 Very low None
Chapter 4: Selection of working fluids
118
From the table, it is clear that natural refrigerants such as Ammonia and CO2 have excellent
environmental profiles; however, Ammonia is a toxic substance and therefore might not be
suitable for domestic applications. Likewise, refrigerants such as Hexane, Heptane, Propane
and Isobutane have good environmental indices, but they are all flammable. The other refriger-
ants selected in this chapter have comparable ODP results, while for GWP, R410A and R22
have the highest impacts.
4.6 Conclusion
In this chapter, various working fluids have been selected and analysed for heat pump and ORC
cycles. A comparison between the working fluids was conducted based on the efficiency of
their performance, thermal cooling and heating capacities, and environmental and safety
aspects. For the heat pump cycle, in terms of COPh, all the selected refrigerants have shown
comparable results with a condensation temperature of 30 oC. However, as the condensation
temperature increases, Ammonia, R600a, R22 and R134a have shown the highest performance.
Both Ammonia and R600a showed significantly higher condenser thermal capacity. For the
cooling application, increasing evaporation temperature causes a rise in COPc, with comparable
results for all the selected refrigerants. Regarding condenser and evaporator thermal capacity,
Ammonia has shown a significantly higher capacity, followed by R600a. For the ORC cycle,
the selected pure refrigerant showed a comparable result in terms of thermal efficiency and heat
exchanger capacities for the first approach. For the mixture of Hexane and R141b, the thermal
efficiency was shown to be comparable to that of pure Hexane at a higher evaporation
temperature. However, pure Hexane has a higher thermal capacity than the mixture. Apart from
pure R245fa and mixed R245fa with R134a, other working fluids obtained similar ORC thermal
efficiency. From a safety perspective, Ammonia, Hexane, Heptane, Pentane and R600a might
not be suitable for domestic applications due to their flammability and toxicity. For the HP
cycle, CO2 and R1234yf have lower environmental impacts, as they showed lower COP than
R134a. Meanwhile, for the ORC cycle, R123 and R245fa have comparable environmental
safety profiles and comparable thermal efficiency. Based on these results, R123 and R245fa
have been selected as the working fluids for the ORC cycle in this research. For the HP cycle,
R134a has been nominated as the working fluid based on its comparable performance to the
other working fluids for heating and cooling modes with a safe environmental profile.
Chapter 5: Combining ORC-HP cycles to provide hot water for domestic use
119
Chapter 5 Combining ORC-HP cycles to provide hot water for
domestic use
5.1 Introduction
In this chapter, a gas fuelled heating system based on combined heat engine and heat pump
cycles is proposed and investigated. This system consists of a gas burner, an organic Rankine
cycle power generator, and an air source heat pump cycle. The intended application of the sys-
tem proposed in this chapter is domestic hot water supply. Comprehensive simulation assess-
ments were carried out to investigate the combined system performance in terms of final water
temperature, total system thermal capacity, individual cycle efficiency, and overall fuel-to-heat
efficiency. In-house MATLAB code as well as ASPEN PLUS software were used, and the
REFPROP database was adopted for the working fluid thermophysical properties. The com-
bined cycle performance for domestic hot water supply was investigated under different work-
ing conditions, including varying evaporation and condensation pressures in both cycles. In
addition, the pinch point temperature approach was adopted in all the heat exchangers and ap-
plicable ORC evaporation pressure was used. The aim was to maximize the wasted heat recov-
ery and improve overall system efficiency. The best design configuration for water heating is
identified in the chapter, and steady state results are plotted. An exergy analysis and the second
law of thermodynamic efficiency were also included. In addition, control strategies were
adopted to tackle the effects of ambient temperature variation on system performance with the
aim of maintaining steady system performance while keeping the HP-evaporator frost free. A
dynamic model using ASPEN PLUS software was used to verify and validate these control
strategies.
5.2 The thermodynamic concept
The thermal energy generated from natural gas combustion in the burner is used to drive an
ORC cycle (assuming no heat is lost), and the resultant mechanical power is used to directly
drive a vapour compression heat pump cycle (assuming no power is lost). The ambient air
stream and the rejected thermal energy contained in the flue gases are mixed then used as a heat
source for the heat pump cycle. The rejected latent thermal energy from both cycles’ condenser
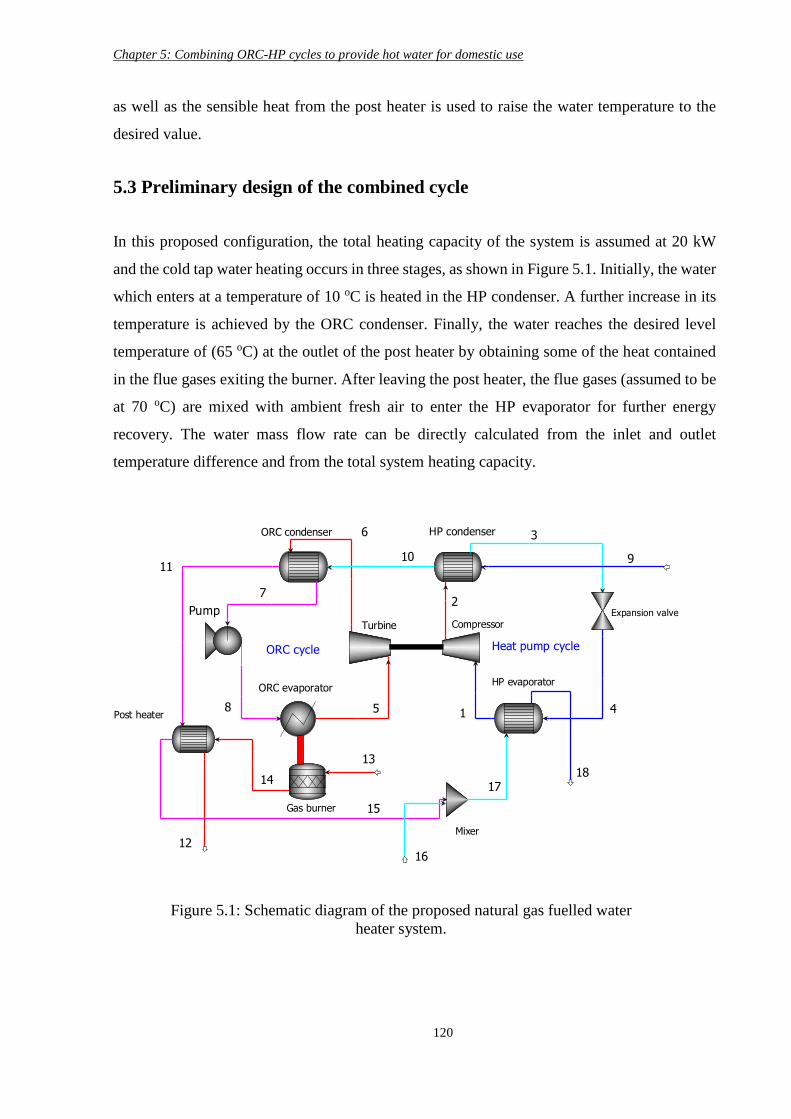
Chapter 5: Combining ORC-HP cycles to provide hot water for domestic use
120
as well as the sensible heat from the post heater is used to raise the water temperature to the
desired value.
5.3 Preliminary design of the combined cycle
In this proposed configuration, the total heating capacity of the system is assumed at 20 kW
and the cold tap water heating occurs in three stages, as shown in Figure 5.1. Initially, the water
which enters at a temperature of 10 oC is heated in the HP condenser. A further increase in its
temperature is achieved by the ORC condenser. Finally, the water reaches the desired level
temperature of (65 oC) at the outlet of the post heater by obtaining some of the heat contained
in the flue gases exiting the burner. After leaving the post heater, the flue gases (assumed to be
at 70 oC) are mixed with ambient fresh air to enter the HP evaporator for further energy
recovery. The water mass flow rate can be directly calculated from the inlet and outlet
temperature difference and from the total system heating capacity.
Figure 5.1: Schematic diagram of the proposed natural gas fuelled water
heater system.
Heat pump cycle
9
HP condenserORC condenser
ORC evaporator
Expansion valve
HP evaporator
PumpTurbine Compressor
ORC cycle
Gas burner
Post heater
Mixer
3
2
41
1011
12
7
8 5
6
13
14
15
16
1718
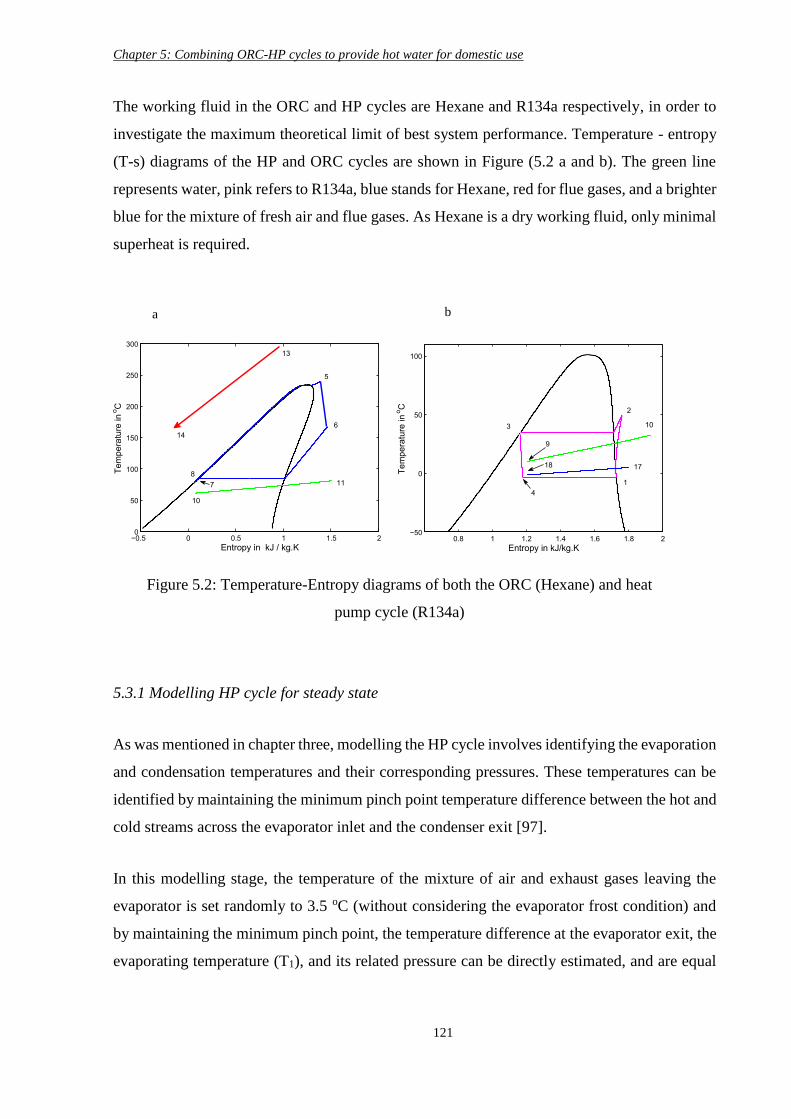
Chapter 5: Combining ORC-HP cycles to provide hot water for domestic use
121
The working fluid in the ORC and HP cycles are Hexane and R134a respectively, in order to
investigate the maximum theoretical limit of best system performance. Temperature - entropy
(T-s) diagrams of the HP and ORC cycles are shown in Figure (5.2 a and b). The green line
represents water, pink refers to R134a, blue stands for Hexane, red for flue gases, and a brighter
blue for the mixture of fresh air and flue gases. As Hexane is a dry working fluid, only minimal
superheat is required.
5.3.1 Modelling HP cycle for steady state
As was mentioned in chapter three, modelling the HP cycle involves identifying the evaporation
and condensation temperatures and their corresponding pressures. These temperatures can be
identified by maintaining the minimum pinch point temperature difference between the hot and
cold streams across the evaporator inlet and the condenser exit [97].
In this modelling stage, the temperature of the mixture of air and exhaust gases leaving the
evaporator is set randomly to 3.5 oC (without considering the evaporator frost condition) and
by maintaining the minimum pinch point, the temperature difference at the evaporator exit, the
evaporating temperature (T1), and its related pressure can be directly estimated, and are equal
a b
Figure 5.2: Temperature-Entropy diagrams of both the ORC (Hexane) and heat
pump cycle (R134a)
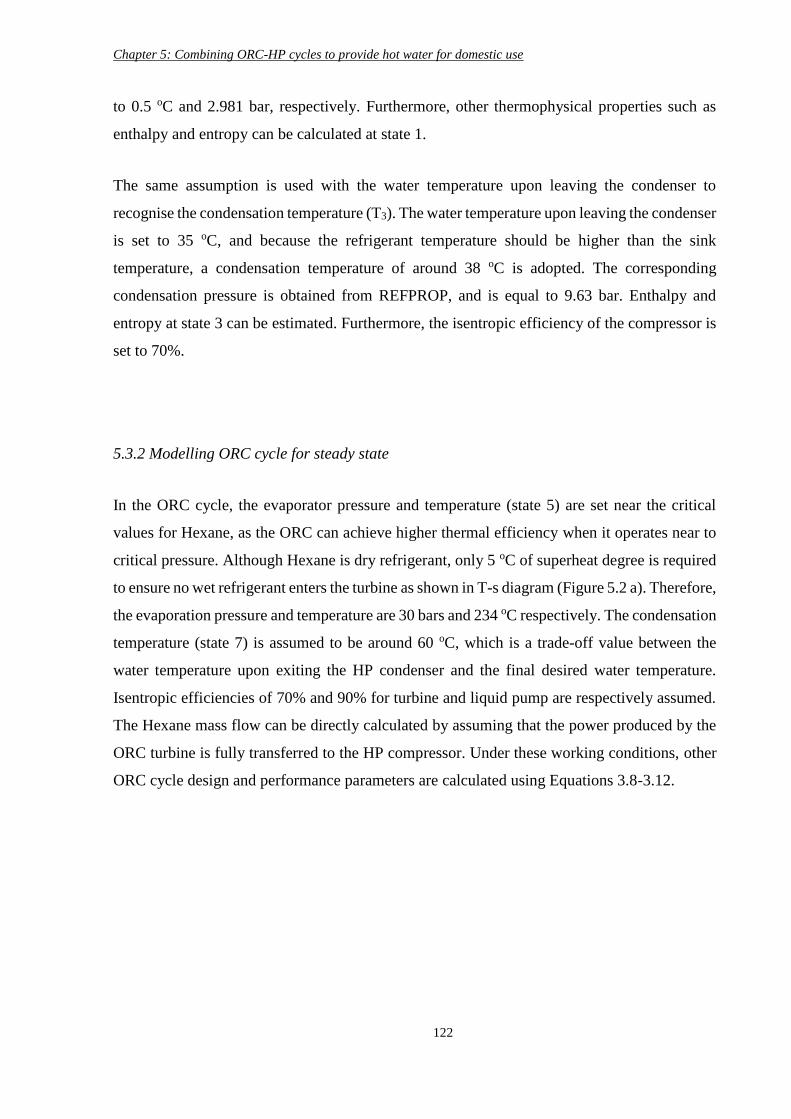
Chapter 5: Combining ORC-HP cycles to provide hot water for domestic use
122
to 0.5 oC and 2.981 bar, respectively. Furthermore, other thermophysical properties such as
enthalpy and entropy can be calculated at state 1.
The same assumption is used with the water temperature upon leaving the condenser to
recognise the condensation temperature (T3). The water temperature upon leaving the condenser
is set to 35 oC, and because the refrigerant temperature should be higher than the sink
temperature, a condensation temperature of around 38 oC is adopted. The corresponding
condensation pressure is obtained from REFPROP, and is equal to 9.63 bar. Enthalpy and
entropy at state 3 can be estimated. Furthermore, the isentropic efficiency of the compressor is
set to 70%.
5.3.2 Modelling ORC cycle for steady state
In the ORC cycle, the evaporator pressure and temperature (state 5) are set near the critical
values for Hexane, as the ORC can achieve higher thermal efficiency when it operates near to
critical pressure. Although Hexane is dry refrigerant, only 5 oC of superheat degree is required
to ensure no wet refrigerant enters the turbine as shown in T-s diagram (Figure 5.2 a). Therefore,
the evaporation pressure and temperature are 30 bars and 234 oC respectively. The condensation
temperature (state 7) is assumed to be around 60 oC, which is a trade-off value between the
water temperature upon exiting the HP condenser and the final desired water temperature.
Isentropic efficiencies of 70% and 90% for turbine and liquid pump are respectively assumed.
The Hexane mass flow can be directly calculated by assuming that the power produced by the
ORC turbine is fully transferred to the HP compressor. Under these working conditions, other
ORC cycle design and performance parameters are calculated using Equations 3.8-3.12.
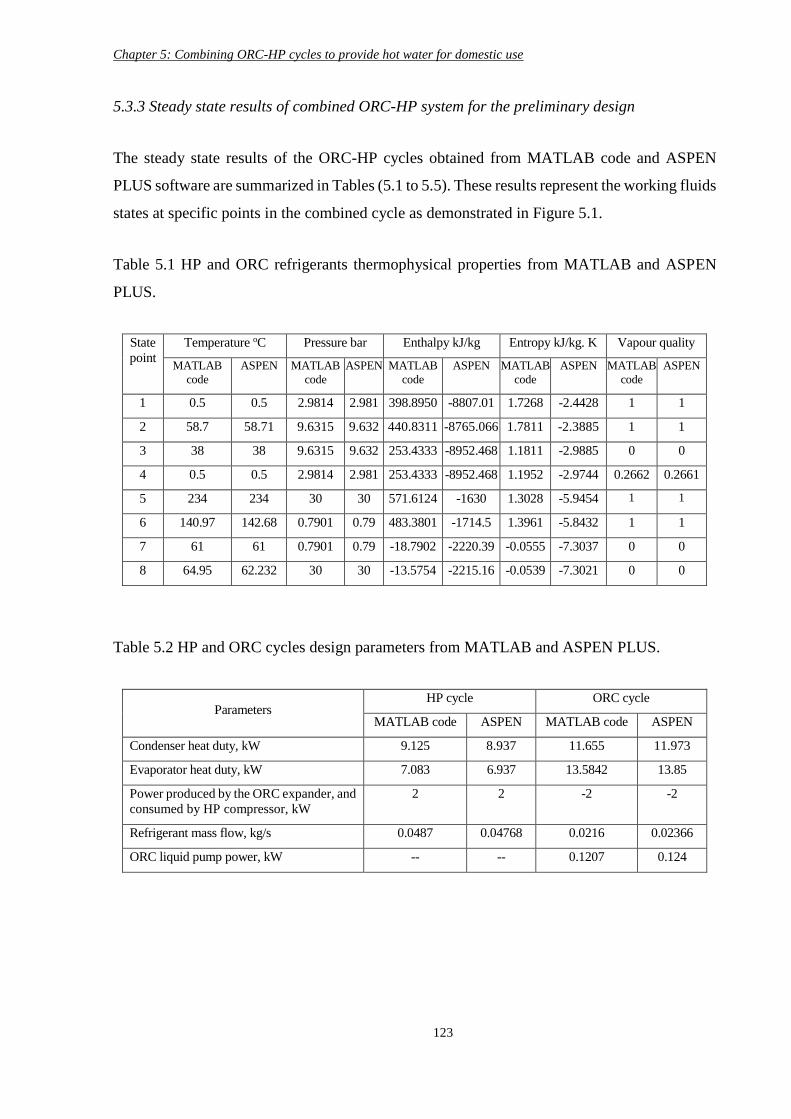
Chapter 5: Combining ORC-HP cycles to provide hot water for domestic use
123
5.3.3 Steady state results of combined ORC-HP system for the preliminary design
The steady state results of the ORC-HP cycles obtained from MATLAB code and ASPEN
PLUS software are summarized in Tables (5.1 to 5.5). These results represent the working fluids
states at specific points in the combined cycle as demonstrated in Figure 5.1.
Table 5.1 HP and ORC refrigerants thermophysical properties from MATLAB and ASPEN
PLUS.
State
point
Temperature oC Pressure bar Enthalpy kJ/kg Entropy kJ/kg. K Vapour quality
MATLAB
code
ASPEN MATLAB
code
ASPEN MATLAB
code
ASPEN MATLAB
code
ASPEN MATLAB
code
ASPEN
1 0.5 0.5 2.9814 2.981 398.8950 -8807.01 1.7268 -2.4428 1 1
2 58.7 58.71 9.6315 9.632 440.8311 -8765.066 1.7811 -2.3885 1 1
3 38 38 9.6315 9.632 253.4333 -8952.468 1.1811 -2.9885 0 0
4 0.5 0.5 2.9814 2.981 253.4333 -8952.468 1.1952 -2.9744 0.2662 0.2661
5 234 234 30 30 571.6124 -1630 1.3028 -5.9454 1 1
6 140.97 142.68 0.7901 0.79 483.3801 -1714.5 1.3961 -5.8432 1 1
7 61 61 0.7901 0.79 -18.7902 -2220.39 -0.0555 -7.3037 0 0
8 64.95 62.232 30 30 -13.5754 -2215.16 -0.0539 -7.3021 0 0
Table 5.2 HP and ORC cycles design parameters from MATLAB and ASPEN PLUS.
Parameters HP cycle ORC cycle
MATLAB code ASPEN MATLAB code ASPEN
Condenser heat duty, kW 9.125 8.937 11.655 11.973
Evaporator heat duty, kW 7.083 6.937 13.5842 13.85
Power produced by the ORC expander, and
consumed by HP compressor, kW 2 2 -2 -2
Refrigerant mass flow, kg/s 0.0487 0.04768 0.0216 0.02366
ORC liquid pump power, kW -- -- 0.1207 0.124
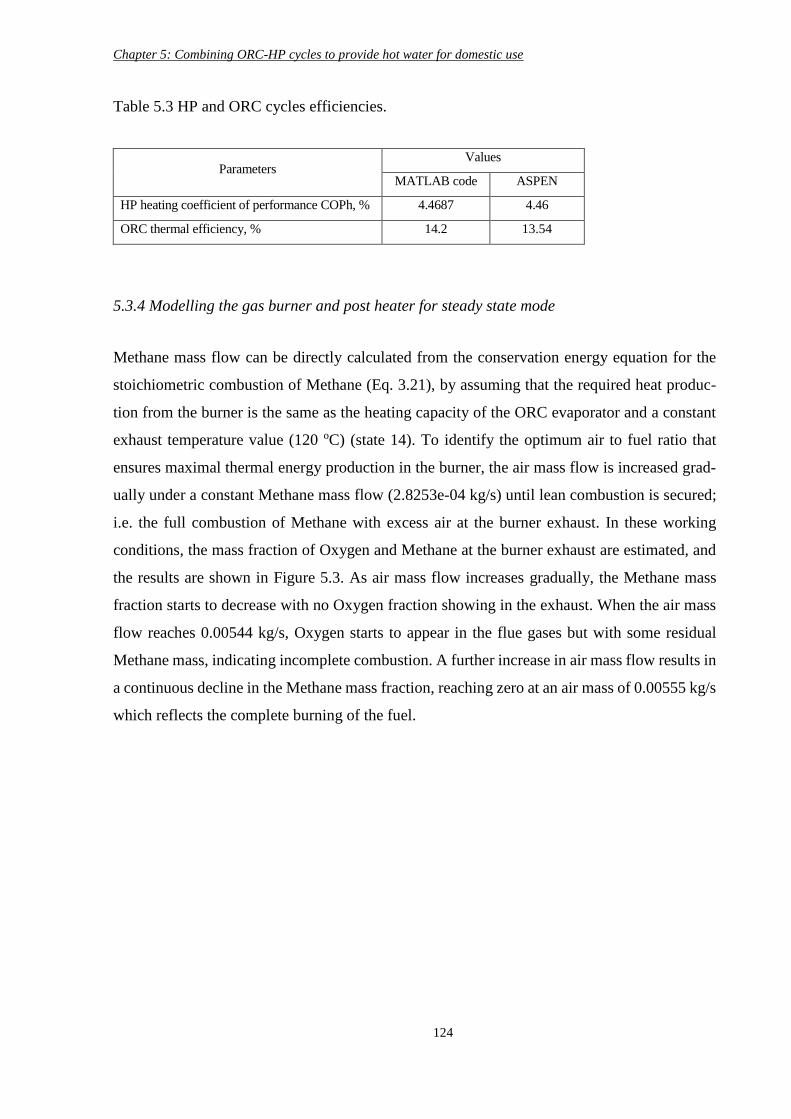
Chapter 5: Combining ORC-HP cycles to provide hot water for domestic use
124
Table 5.3 HP and ORC cycles efficiencies.
Parameters Values
MATLAB code ASPEN
HP heating coefficient of performance COPh, % 4.4687 4.46
ORC thermal efficiency, % 14.2 13.54
5.3.4 Modelling the gas burner and post heater for steady state mode
Methane mass flow can be directly calculated from the conservation energy equation for the
stoichiometric combustion of Methane (Eq. 3.21), by assuming that the required heat produc-
tion from the burner is the same as the heating capacity of the ORC evaporator and a constant
exhaust temperature value (120 oC) (state 14). To identify the optimum air to fuel ratio that
ensures maximal thermal energy production in the burner, the air mass flow is increased grad-
ually under a constant Methane mass flow (2.8253e-04 kg/s) until lean combustion is secured;
i.e. the full combustion of Methane with excess air at the burner exhaust. In these working
conditions, the mass fraction of Oxygen and Methane at the burner exhaust are estimated, and
the results are shown in Figure 5.3. As air mass flow increases gradually, the Methane mass
fraction starts to decrease with no Oxygen fraction showing in the exhaust. When the air mass
flow reaches 0.00544 kg/s, Oxygen starts to appear in the flue gases but with some residual
Methane mass, indicating incomplete combustion. A further increase in air mass flow results in
a continuous decline in the Methane mass fraction, reaching zero at an air mass of 0.00555 kg/s
which reflects the complete burning of the fuel.
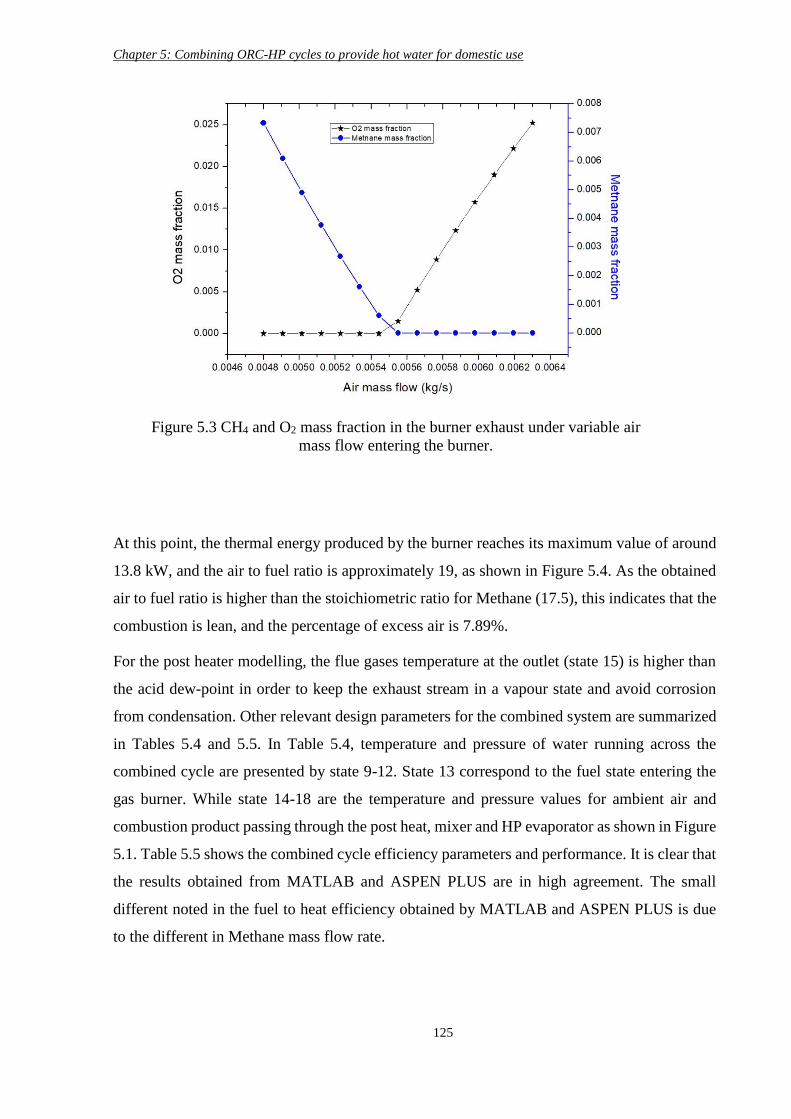
Chapter 5: Combining ORC-HP cycles to provide hot water for domestic use
125
At this point, the thermal energy produced by the burner reaches its maximum value of around
13.8 kW, and the air to fuel ratio is approximately 19, as shown in Figure 5.4. As the obtained
air to fuel ratio is higher than the stoichiometric ratio for Methane (17.5), this indicates that the
combustion is lean, and the percentage of excess air is 7.89%.
For the post heater modelling, the flue gases temperature at the outlet (state 15) is higher than
the acid dew-point in order to keep the exhaust stream in a vapour state and avoid corrosion
from condensation. Other relevant design parameters for the combined system are summarized
in Tables 5.4 and 5.5. In Table 5.4, temperature and pressure of water running across the
combined cycle are presented by state 9-12. State 13 correspond to the fuel state entering the
gas burner. While state 14-18 are the temperature and pressure values for ambient air and
combustion product passing through the post heat, mixer and HP evaporator as shown in Figure
5.1. Table 5.5 shows the combined cycle efficiency parameters and performance. It is clear that
the results obtained from MATLAB and ASPEN PLUS are in high agreement. The small
different noted in the fuel to heat efficiency obtained by MATLAB and ASPEN PLUS is due
to the different in Methane mass flow rate.
Figure 5.3 CH4 and O2 mass fraction in the burner exhaust under variable air
mass flow entering the burner.
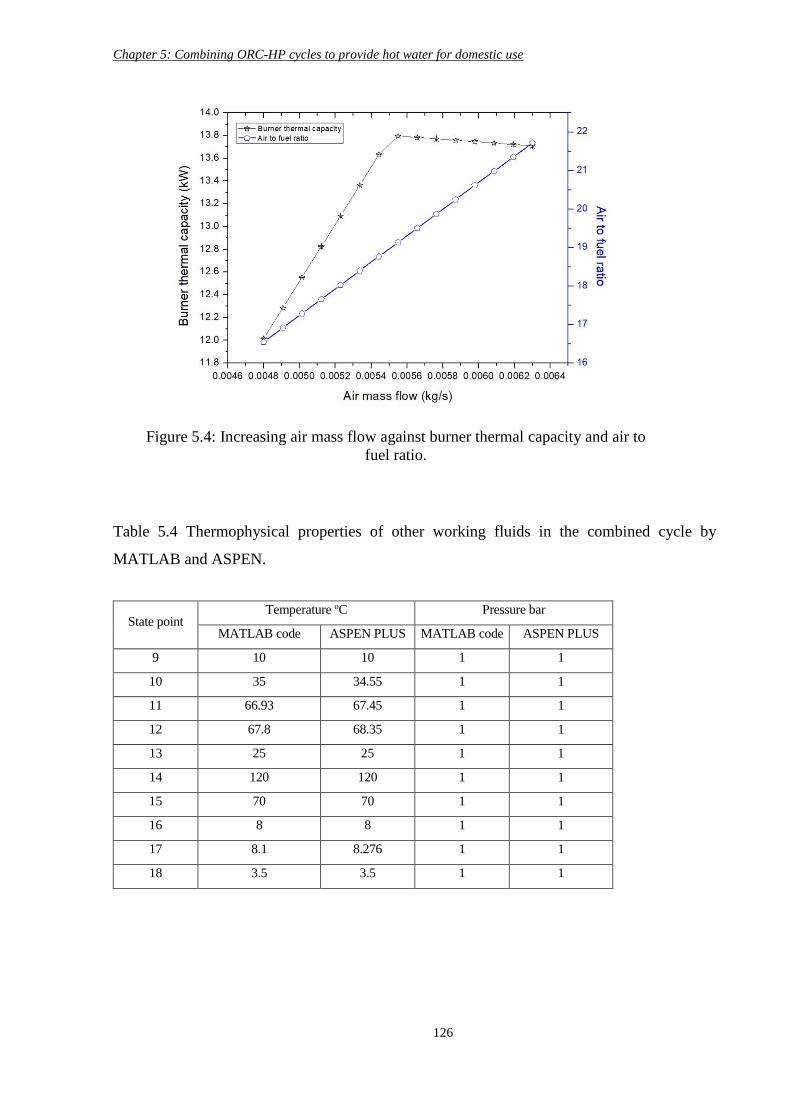
Chapter 5: Combining ORC-HP cycles to provide hot water for domestic use
126
Table 5.4 Thermophysical properties of other working fluids in the combined cycle by
MATLAB and ASPEN.
State point Temperature oC Pressure bar
MATLAB code ASPEN PLUS MATLAB code ASPEN PLUS
9 10 10 1 1
10 35 34.55 1 1
11 66.93 67.45 1 1
12 67.8 68.35 1 1
13 25 25 1 1
14 120 120 1 1
15 70 70 1 1
16 8 8 1 1
17 8.1 8.276 1 1
18 3.5 3.5 1 1
Figure 5.4: Increasing air mass flow against burner thermal capacity and air to
fuel ratio.
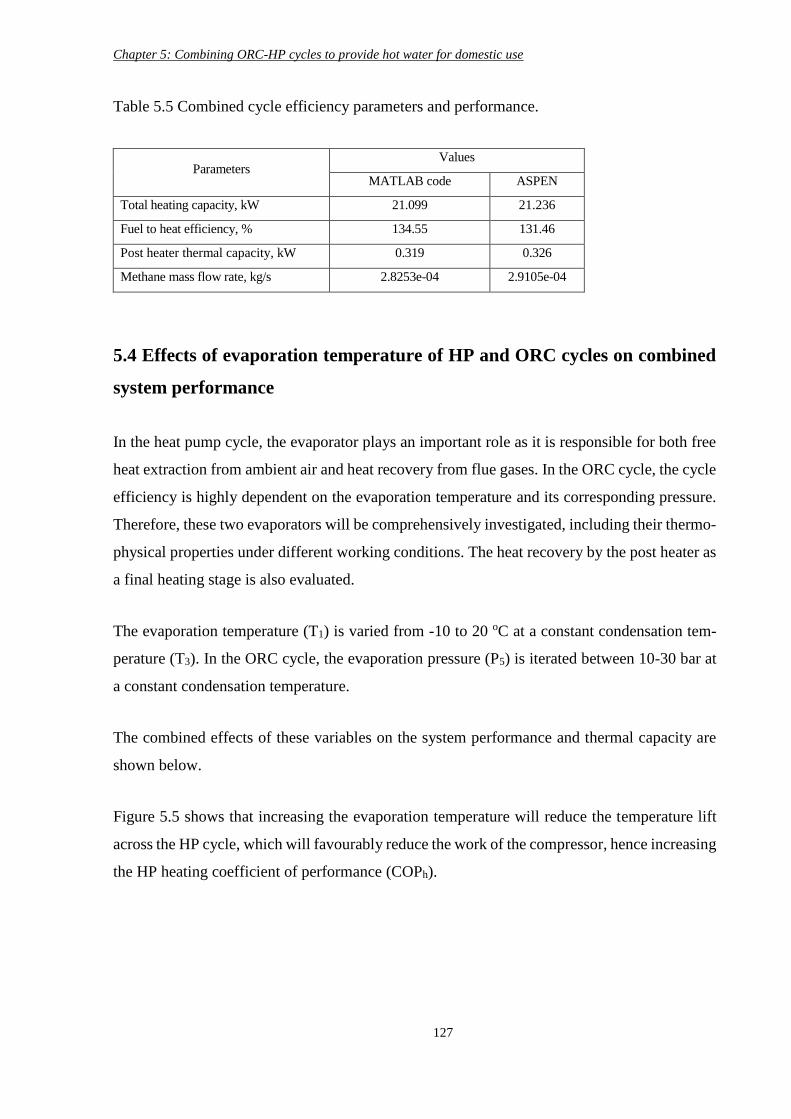
Chapter 5: Combining ORC-HP cycles to provide hot water for domestic use
127
Table 5.5 Combined cycle efficiency parameters and performance.
Parameters Values
MATLAB code ASPEN
Total heating capacity, kW 21.099 21.236
Fuel to heat efficiency, % 134.55 131.46
Post heater thermal capacity, kW 0.319 0.326
Methane mass flow rate, kg/s 2.8253e-04 2.9105e-04
5.4 Effects of evaporation temperature of HP and ORC cycles on combined
system performance
In the heat pump cycle, the evaporator plays an important role as it is responsible for both free
heat extraction from ambient air and heat recovery from flue gases. In the ORC cycle, the cycle
efficiency is highly dependent on the evaporation temperature and its corresponding pressure.
Therefore, these two evaporators will be comprehensively investigated, including their thermo-
physical properties under different working conditions. The heat recovery by the post heater as
a final heating stage is also evaluated.
The evaporation temperature (T1) is varied from -10 to 20 oC at a constant condensation tem-
perature (T3). In the ORC cycle, the evaporation pressure (P5) is iterated between 10-30 bar at
a constant condensation temperature.
The combined effects of these variables on the system performance and thermal capacity are
shown below.
Figure 5.5 shows that increasing the evaporation temperature will reduce the temperature lift
across the HP cycle, which will favourably reduce the work of the compressor, hence increasing
the HP heating coefficient of performance (COPh).
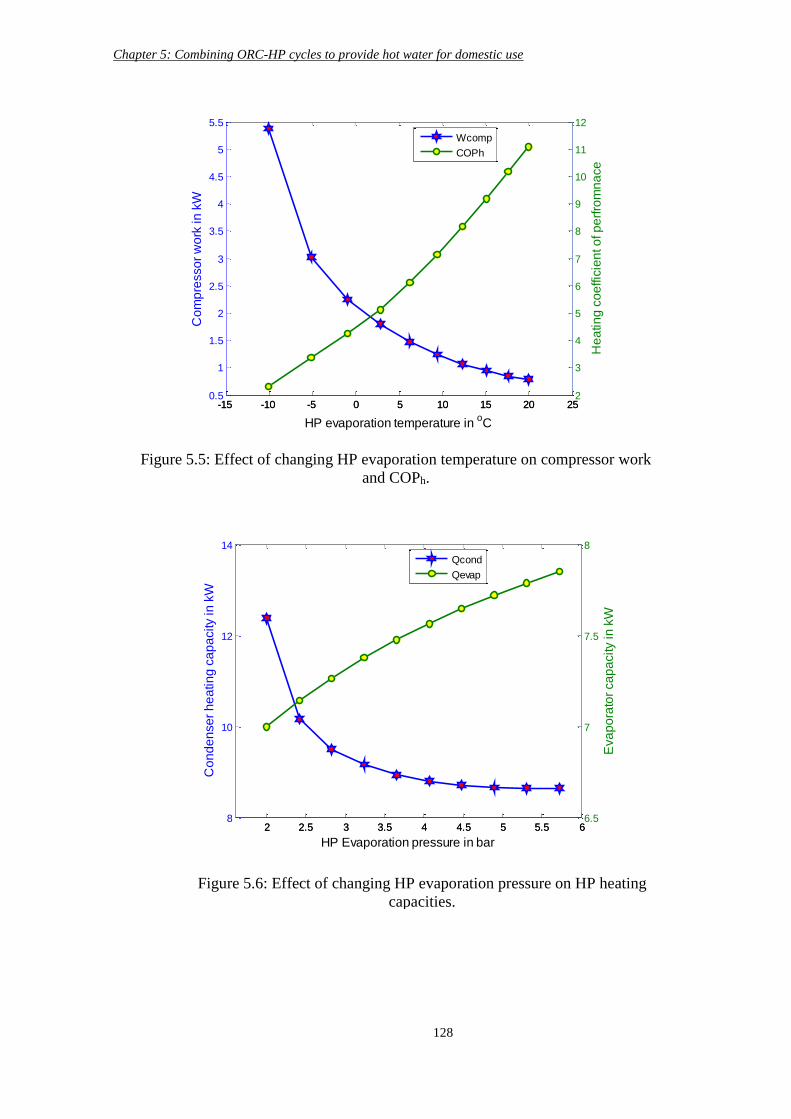
Chapter 5: Combining ORC-HP cycles to provide hot water for domestic use
128
Figure 5.5: Effect of changing HP evaporation temperature on compressor work
and COPh.
-15 -10 -5 0 5 10 15 20 250.5
1
1.5
2
2.5
3
3.5
4
4.5
5
5.5
Co
mp
resso
r w
ork
in
kW
HP evaporation temperature in oC
-15 -10 -5 0 5 10 15 20 252
3
4
5
6
7
8
9
10
11
12
He
atin
g c
oe
ffic
ien
t o
f p
erf
rom
na
ce
Wcomp
COPh
Figure 5.6: Effect of changing HP evaporation pressure on HP heating
capacities.
2 2.5 3 3.5 4 4.5 5 5.5 68
10
12
14
Co
nd
en
se
r h
ea
tin
g c
ap
acity in
kW
HP Evaporation pressure in bar
2 2.5 3 3.5 4 4.5 5 5.5 66.5
7
7.5
8
Eva
po
rato
r ca
pa
city in
kW
Qcond
Qevap
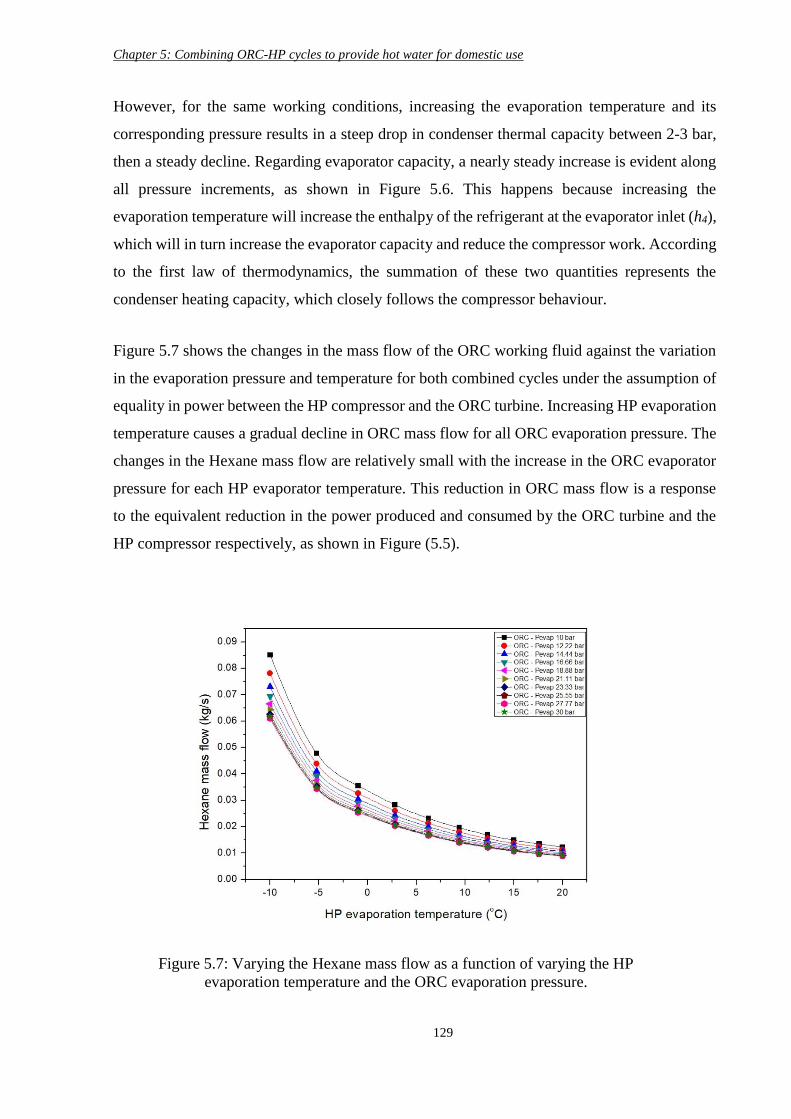
Chapter 5: Combining ORC-HP cycles to provide hot water for domestic use
129
However, for the same working conditions, increasing the evaporation temperature and its
corresponding pressure results in a steep drop in condenser thermal capacity between 2-3 bar,
then a steady decline. Regarding evaporator capacity, a nearly steady increase is evident along
all pressure increments, as shown in Figure 5.6. This happens because increasing the
evaporation temperature will increase the enthalpy of the refrigerant at the evaporator inlet (h4),
which will in turn increase the evaporator capacity and reduce the compressor work. According
to the first law of thermodynamics, the summation of these two quantities represents the
condenser heating capacity, which closely follows the compressor behaviour.
Figure 5.7 shows the changes in the mass flow of the ORC working fluid against the variation
in the evaporation pressure and temperature for both combined cycles under the assumption of
equality in power between the HP compressor and the ORC turbine. Increasing HP evaporation
temperature causes a gradual decline in ORC mass flow for all ORC evaporation pressure. The
changes in the Hexane mass flow are relatively small with the increase in the ORC evaporator
pressure for each HP evaporator temperature. This reduction in ORC mass flow is a response
to the equivalent reduction in the power produced and consumed by the ORC turbine and the
HP compressor respectively, as shown in Figure (5.5).
Figure 5.7: Varying the Hexane mass flow as a function of varying the HP
evaporation temperature and the ORC evaporation pressure.
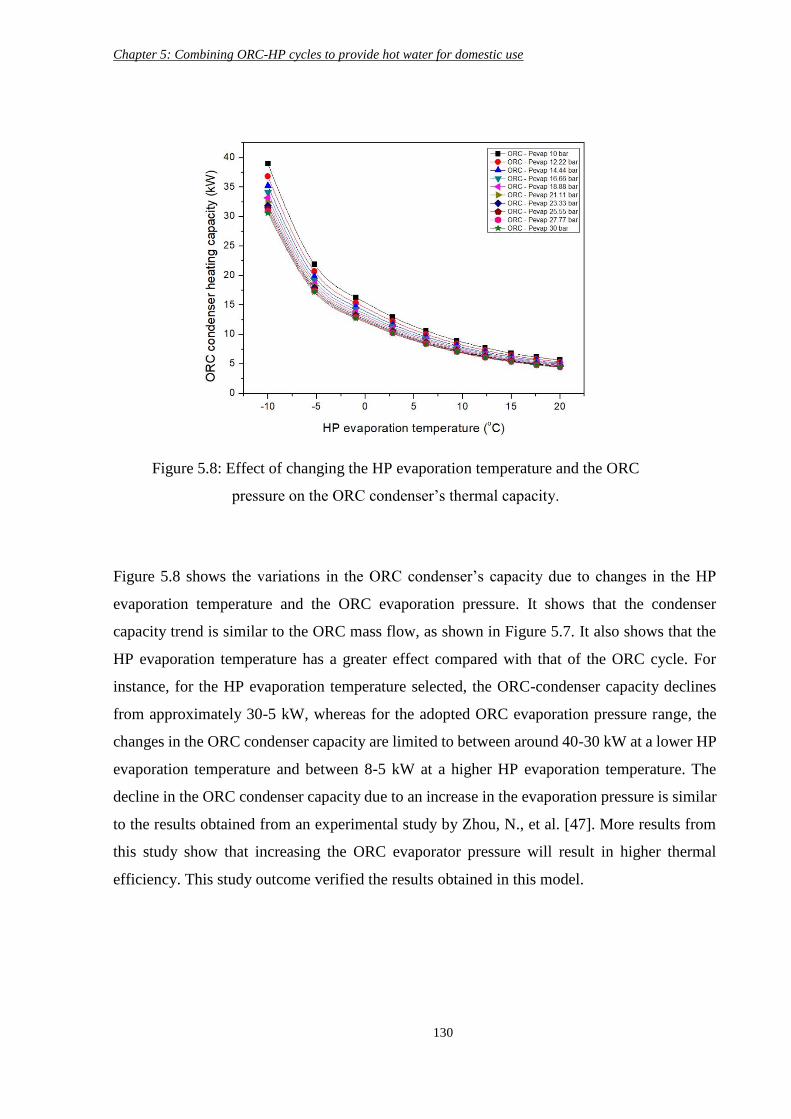
Chapter 5: Combining ORC-HP cycles to provide hot water for domestic use
130
Figure 5.8 shows the variations in the ORC condenser’s capacity due to changes in the HP
evaporation temperature and the ORC evaporation pressure. It shows that the condenser
capacity trend is similar to the ORC mass flow, as shown in Figure 5.7. It also shows that the
HP evaporation temperature has a greater effect compared with that of the ORC cycle. For
instance, for the HP evaporation temperature selected, the ORC-condenser capacity declines
from approximately 30-5 kW, whereas for the adopted ORC evaporation pressure range, the
changes in the ORC condenser capacity are limited to between around 40-30 kW at a lower HP
evaporation temperature and between 8-5 kW at a higher HP evaporation temperature. The
decline in the ORC condenser capacity due to an increase in the evaporation pressure is similar
to the results obtained from an experimental study by Zhou, N., et al. [47]. More results from
this study show that increasing the ORC evaporator pressure will result in higher thermal
efficiency. This study outcome verified the results obtained in this model.
Figure 5.8: Effect of changing the HP evaporation temperature and the ORC
pressure on the ORC condenser’s thermal capacity.
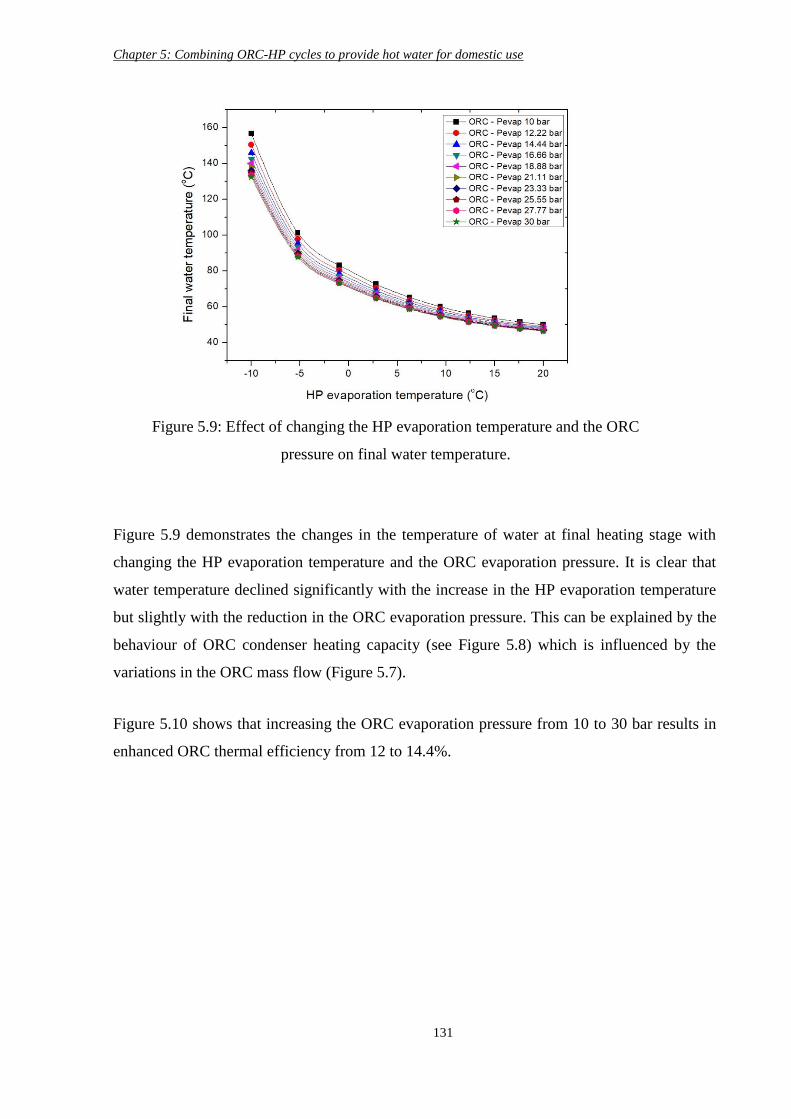
Chapter 5: Combining ORC-HP cycles to provide hot water for domestic use
131
Figure 5.9 demonstrates the changes in the temperature of water at final heating stage with
changing the HP evaporation temperature and the ORC evaporation pressure. It is clear that
water temperature declined significantly with the increase in the HP evaporation temperature
but slightly with the reduction in the ORC evaporation pressure. This can be explained by the
behaviour of ORC condenser heating capacity (see Figure 5.8) which is influenced by the
variations in the ORC mass flow (Figure 5.7).
Figure 5.10 shows that increasing the ORC evaporation pressure from 10 to 30 bar results in
enhanced ORC thermal efficiency from 12 to 14.4%.
Figure 5.9: Effect of changing the HP evaporation temperature and the ORC
pressure on final water temperature.
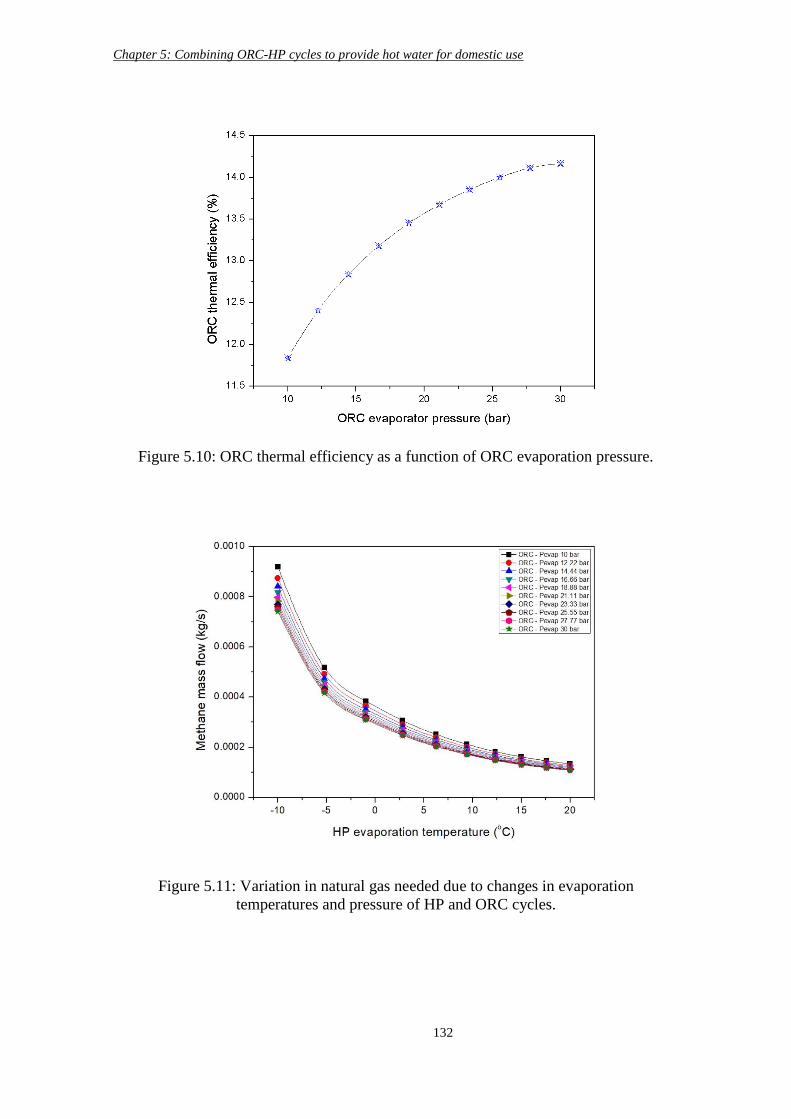
Chapter 5: Combining ORC-HP cycles to provide hot water for domestic use
132
Figure 5.10: ORC thermal efficiency as a function of ORC evaporation pressure.
Figure 5.11: Variation in natural gas needed due to changes in evaporation
temperatures and pressure of HP and ORC cycles.
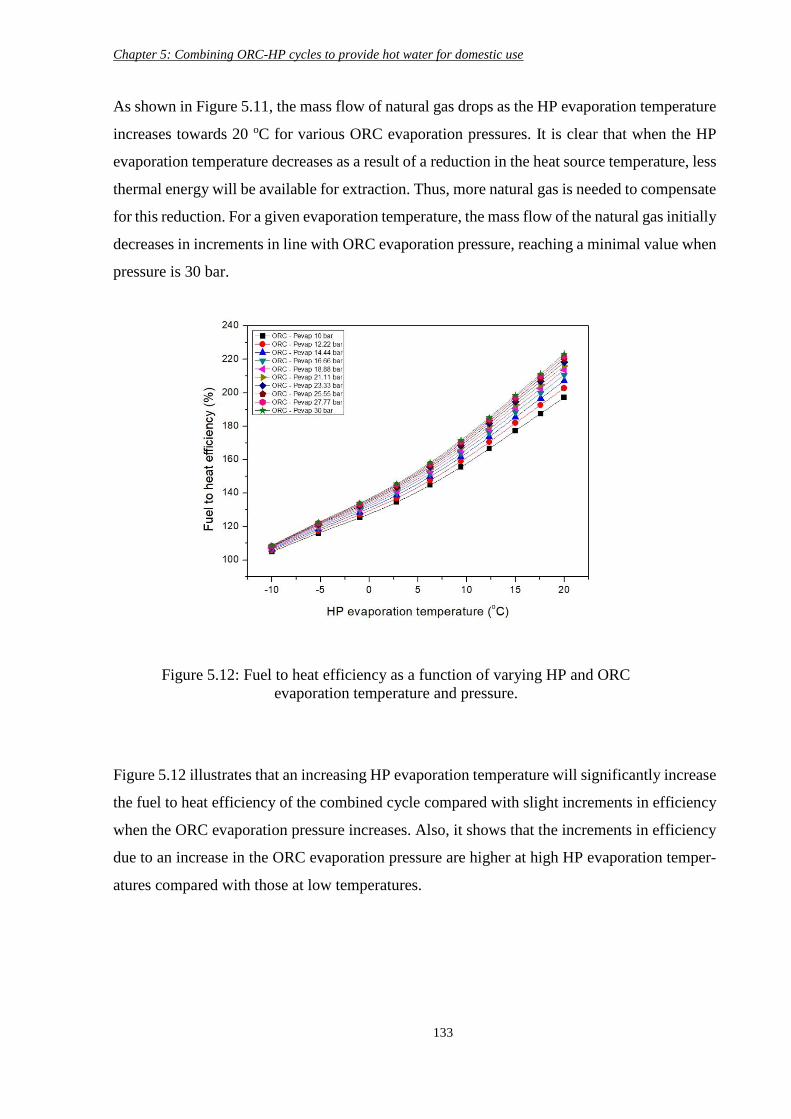
Chapter 5: Combining ORC-HP cycles to provide hot water for domestic use
133
As shown in Figure 5.11, the mass flow of natural gas drops as the HP evaporation temperature
increases towards 20 oC for various ORC evaporation pressures. It is clear that when the HP
evaporation temperature decreases as a result of a reduction in the heat source temperature, less
thermal energy will be available for extraction. Thus, more natural gas is needed to compensate
for this reduction. For a given evaporation temperature, the mass flow of the natural gas initially
decreases in increments in line with ORC evaporation pressure, reaching a minimal value when
pressure is 30 bar.
Figure 5.12 illustrates that an increasing HP evaporation temperature will significantly increase
the fuel to heat efficiency of the combined cycle compared with slight increments in efficiency
when the ORC evaporation pressure increases. Also, it shows that the increments in efficiency
due to an increase in the ORC evaporation pressure are higher at high HP evaporation temper-
atures compared with those at low temperatures.
Figure 5.12: Fuel to heat efficiency as a function of varying HP and ORC
evaporation temperature and pressure.
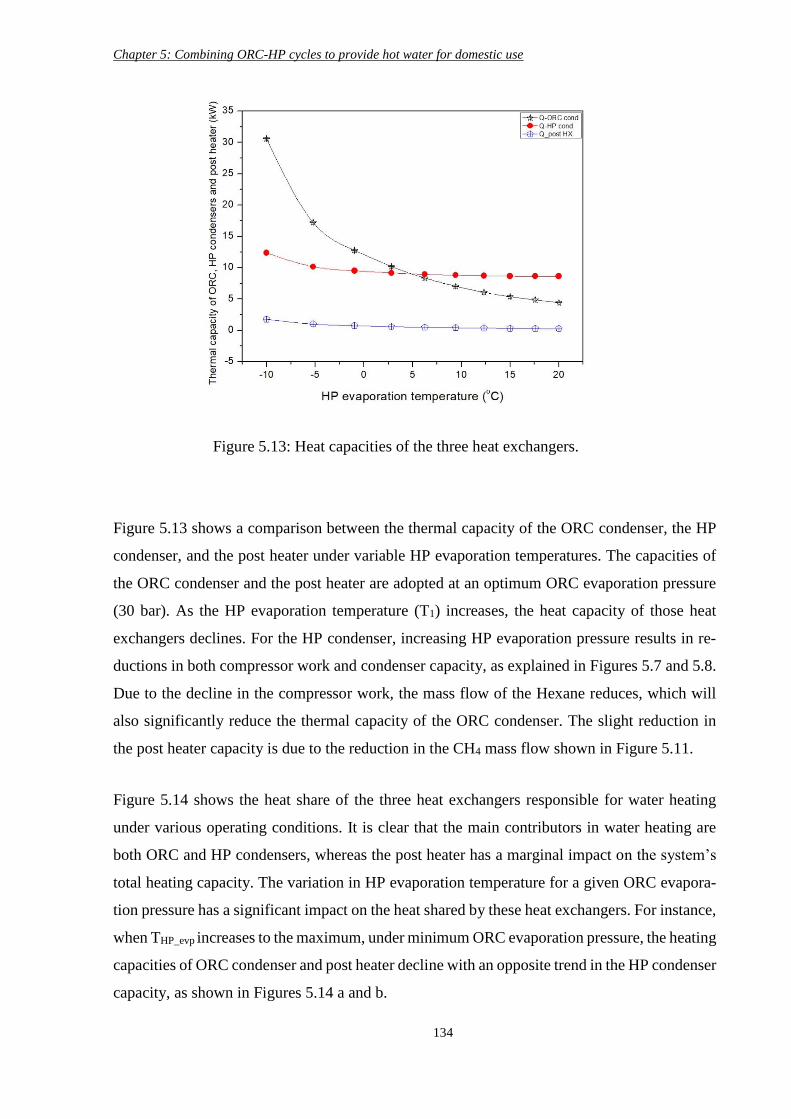
Chapter 5: Combining ORC-HP cycles to provide hot water for domestic use
134
Figure 5.13 shows a comparison between the thermal capacity of the ORC condenser, the HP
condenser, and the post heater under variable HP evaporation temperatures. The capacities of
the ORC condenser and the post heater are adopted at an optimum ORC evaporation pressure
(30 bar). As the HP evaporation temperature (T1) increases, the heat capacity of those heat
exchangers declines. For the HP condenser, increasing HP evaporation pressure results in re-
ductions in both compressor work and condenser capacity, as explained in Figures 5.7 and 5.8.
Due to the decline in the compressor work, the mass flow of the Hexane reduces, which will
also significantly reduce the thermal capacity of the ORC condenser. The slight reduction in
the post heater capacity is due to the reduction in the CH4 mass flow shown in Figure 5.11.
Figure 5.14 shows the heat share of the three heat exchangers responsible for water heating
under various operating conditions. It is clear that the main contributors in water heating are
both ORC and HP condensers, whereas the post heater has a marginal impact on the system’s
total heating capacity. The variation in HP evaporation temperature for a given ORC evapora-
tion pressure has a significant impact on the heat shared by these heat exchangers. For instance,
when THP_evp increases to the maximum, under minimum ORC evaporation pressure, the heating
capacities of ORC condenser and post heater decline with an opposite trend in the HP condenser
capacity, as shown in Figures 5.14 a and b.
Figure 5.13: Heat capacities of the three heat exchangers.
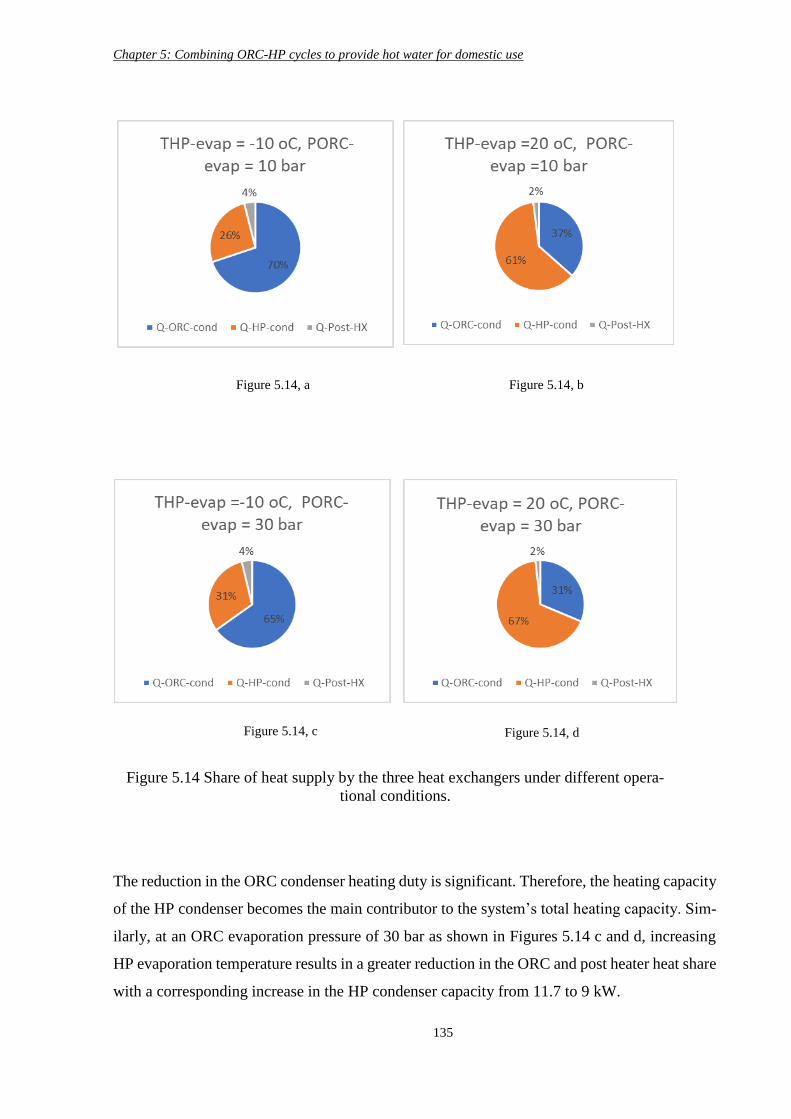
Chapter 5: Combining ORC-HP cycles to provide hot water for domestic use
135
The reduction in the ORC condenser heating duty is significant. Therefore, the heating capacity
of the HP condenser becomes the main contributor to the system’s total heating capacity. Sim-
ilarly, at an ORC evaporation pressure of 30 bar as shown in Figures 5.14 c and d, increasing
HP evaporation temperature results in a greater reduction in the ORC and post heater heat share
with a corresponding increase in the HP condenser capacity from 11.7 to 9 kW.
Figure 5.14, a Figure 5.14, b
Figure 5.14 Share of heat supply by the three heat exchangers under different opera-
tional conditions.
Figure 5.14, c Figure 5.14, d
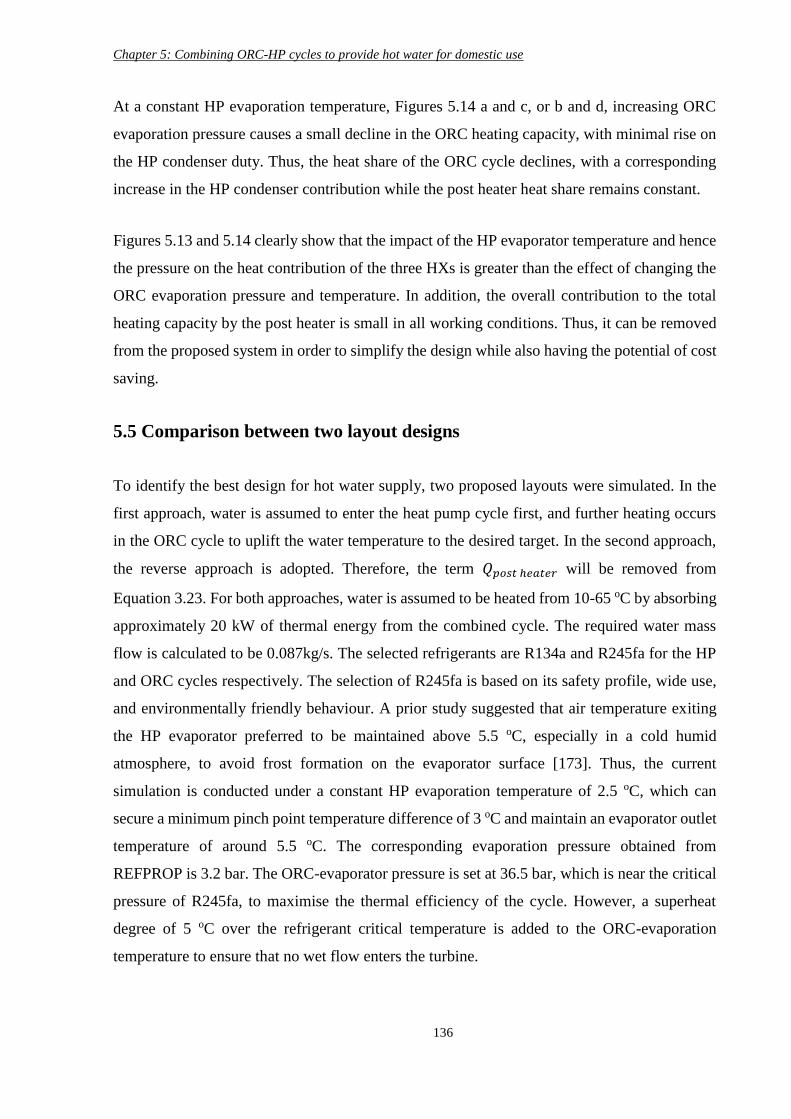
Chapter 5: Combining ORC-HP cycles to provide hot water for domestic use
136
At a constant HP evaporation temperature, Figures 5.14 a and c, or b and d, increasing ORC
evaporation pressure causes a small decline in the ORC heating capacity, with minimal rise on
the HP condenser duty. Thus, the heat share of the ORC cycle declines, with a corresponding
increase in the HP condenser contribution while the post heater heat share remains constant.
Figures 5.13 and 5.14 clearly show that the impact of the HP evaporator temperature and hence
the pressure on the heat contribution of the three HXs is greater than the effect of changing the
ORC evaporation pressure and temperature. In addition, the overall contribution to the total
heating capacity by the post heater is small in all working conditions. Thus, it can be removed
from the proposed system in order to simplify the design while also having the potential of cost
saving.
5.5 Comparison between two layout designs
To identify the best design for hot water supply, two proposed layouts were simulated. In the
first approach, water is assumed to enter the heat pump cycle first, and further heating occurs
in the ORC cycle to uplift the water temperature to the desired target. In the second approach,
the reverse approach is adopted. Therefore, the term 𝑄𝑝𝑜𝑠𝑡 ℎ𝑒𝑎𝑡𝑒𝑟 will be removed from
Equation 3.23. For both approaches, water is assumed to be heated from 10-65 oC by absorbing
approximately 20 kW of thermal energy from the combined cycle. The required water mass
flow is calculated to be 0.087kg/s. The selected refrigerants are R134a and R245fa for the HP
and ORC cycles respectively. The selection of R245fa is based on its safety profile, wide use,
and environmentally friendly behaviour. A prior study suggested that air temperature exiting
the HP evaporator preferred to be maintained above 5.5 oC, especially in a cold humid
atmosphere, to avoid frost formation on the evaporator surface [173]. Thus, the current
simulation is conducted under a constant HP evaporation temperature of 2.5 oC, which can
secure a minimum pinch point temperature difference of 3 oC and maintain an evaporator outlet
temperature of around 5.5 oC. The corresponding evaporation pressure obtained from
REFPROP is 3.2 bar. The ORC-evaporator pressure is set at 36.5 bar, which is near the critical
pressure of R245fa, to maximise the thermal efficiency of the cycle. However, a superheat
degree of 5 oC over the refrigerant critical temperature is added to the ORC-evaporation
temperature to ensure that no wet flow enters the turbine.
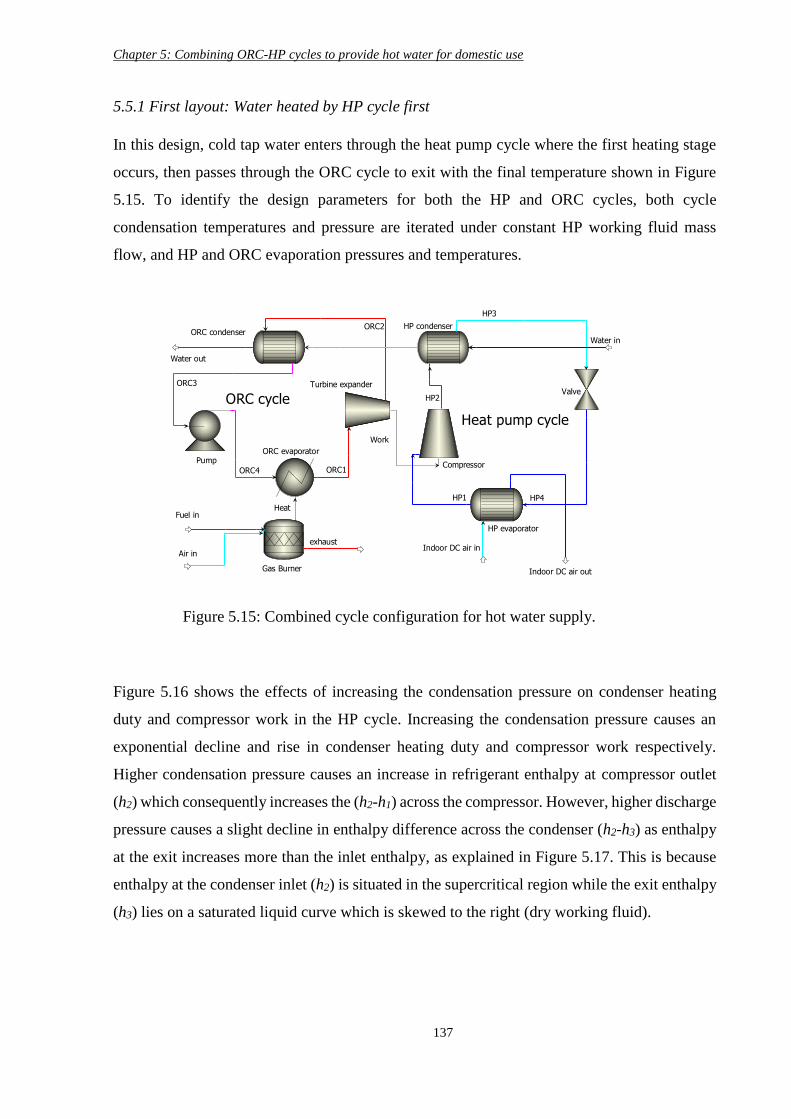
Chapter 5: Combining ORC-HP cycles to provide hot water for domestic use
137
5.5.1 First layout: Water heated by HP cycle first
In this design, cold tap water enters through the heat pump cycle where the first heating stage
occurs, then passes through the ORC cycle to exit with the final temperature shown in Figure
5.15. To identify the design parameters for both the HP and ORC cycles, both cycle
condensation temperatures and pressure are iterated under constant HP working fluid mass
flow, and HP and ORC evaporation pressures and temperatures.
Figure 5.16 shows the effects of increasing the condensation pressure on condenser heating
duty and compressor work in the HP cycle. Increasing the condensation pressure causes an
exponential decline and rise in condenser heating duty and compressor work respectively.
Higher condensation pressure causes an increase in refrigerant enthalpy at compressor outlet
(h2) which consequently increases the (h2-h1) across the compressor. However, higher discharge
pressure causes a slight decline in enthalpy difference across the condenser (h2-h3) as enthalpy
at the exit increases more than the inlet enthalpy, as explained in Figure 5.17. This is because
enthalpy at the condenser inlet (h2) is situated in the supercritical region while the exit enthalpy
(h3) lies on a saturated liquid curve which is skewed to the right (dry working fluid).
Heat pump cycle
ORC cycle
HP evaporator
HP condenser
Gas Burner
ORC evaporator
ORC condenser
Pump
Turbine expander
Compressor
Valve
Water in
Water out
HP1
HP2
HP3
HP4
Indoor DC air in
ORC1
ORC2
ORC3
ORC4
Indoor DC air out
Fuel in
exhaust
Heat
Work
Air in
Figure 5.15: Combined cycle configuration for hot water supply.
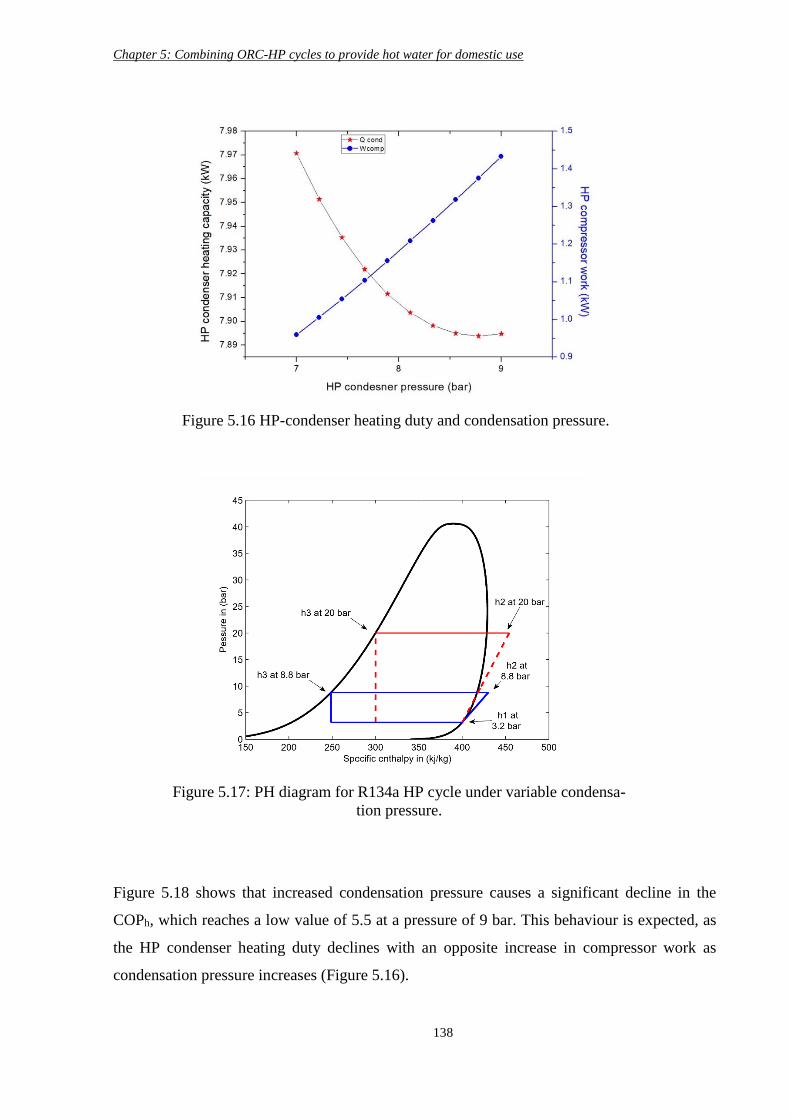
Chapter 5: Combining ORC-HP cycles to provide hot water for domestic use
138
Figure 5.18 shows that increased condensation pressure causes a significant decline in the
COPh, which reaches a low value of 5.5 at a pressure of 9 bar. This behaviour is expected, as
the HP condenser heating duty declines with an opposite increase in compressor work as
condensation pressure increases (Figure 5.16).
Figure 5.16 HP-condenser heating duty and condensation pressure.
Figure 5.17: PH diagram for R134a HP cycle under variable condensa-
tion pressure.
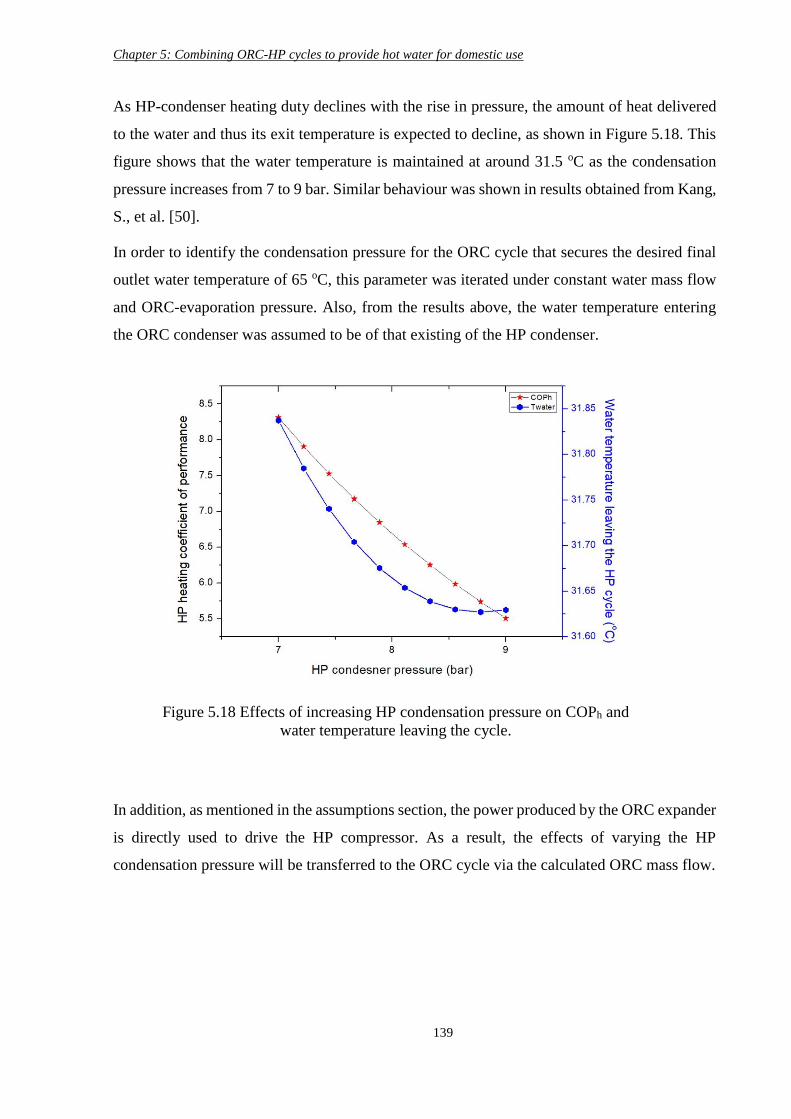
Chapter 5: Combining ORC-HP cycles to provide hot water for domestic use
139
As HP-condenser heating duty declines with the rise in pressure, the amount of heat delivered
to the water and thus its exit temperature is expected to decline, as shown in Figure 5.18. This
figure shows that the water temperature is maintained at around 31.5 oC as the condensation
pressure increases from 7 to 9 bar. Similar behaviour was shown in results obtained from Kang,
S., et al. [50].
In order to identify the condensation pressure for the ORC cycle that secures the desired final
outlet water temperature of 65 oC, this parameter was iterated under constant water mass flow
and ORC-evaporation pressure. Also, from the results above, the water temperature entering
the ORC condenser was assumed to be of that existing of the HP condenser.
In addition, as mentioned in the assumptions section, the power produced by the ORC expander
is directly used to drive the HP compressor. As a result, the effects of varying the HP
condensation pressure will be transferred to the ORC cycle via the calculated ORC mass flow.
Figure 5.18 Effects of increasing HP condensation pressure on COPh and
water temperature leaving the cycle.
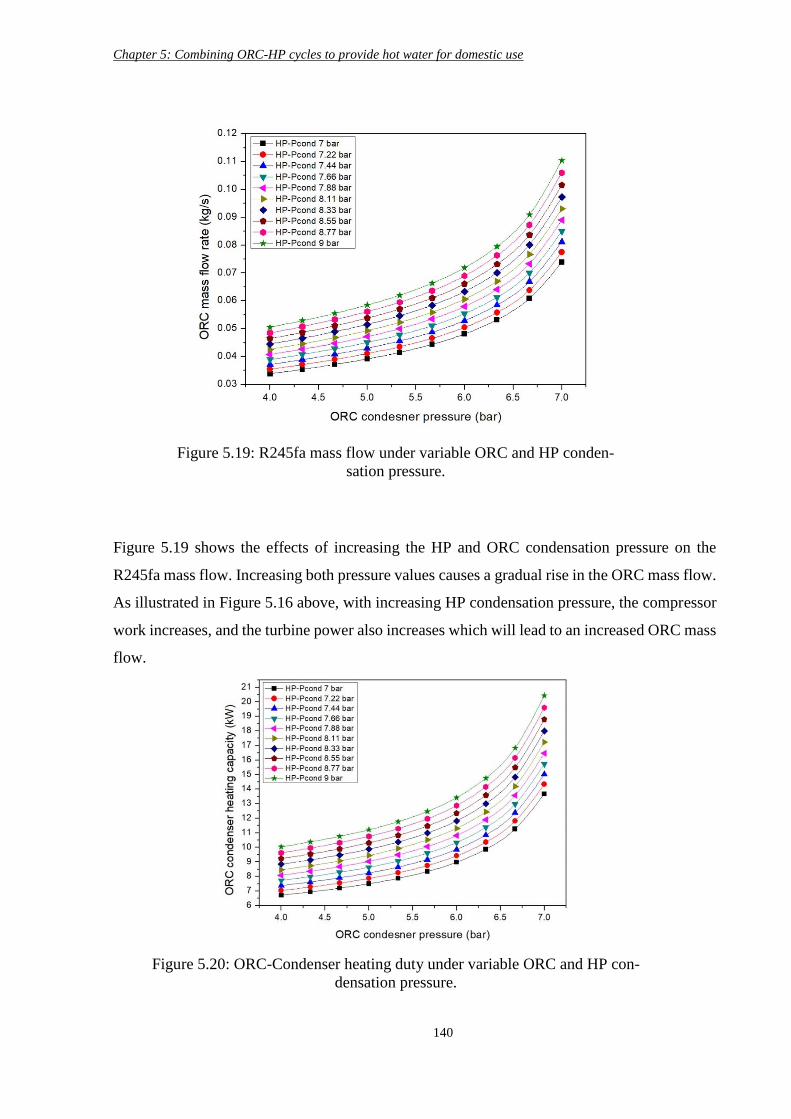
Chapter 5: Combining ORC-HP cycles to provide hot water for domestic use
140
Figure 5.19 shows the effects of increasing the HP and ORC condensation pressure on the
R245fa mass flow. Increasing both pressure values causes a gradual rise in the ORC mass flow.
As illustrated in Figure 5.16 above, with increasing HP condensation pressure, the compressor
work increases, and the turbine power also increases which will lead to an increased ORC mass
flow.
Figure 5.19: R245fa mass flow under variable ORC and HP conden-
sation pressure.
Figure 5.20: ORC-Condenser heating duty under variable ORC and HP con-
densation pressure.
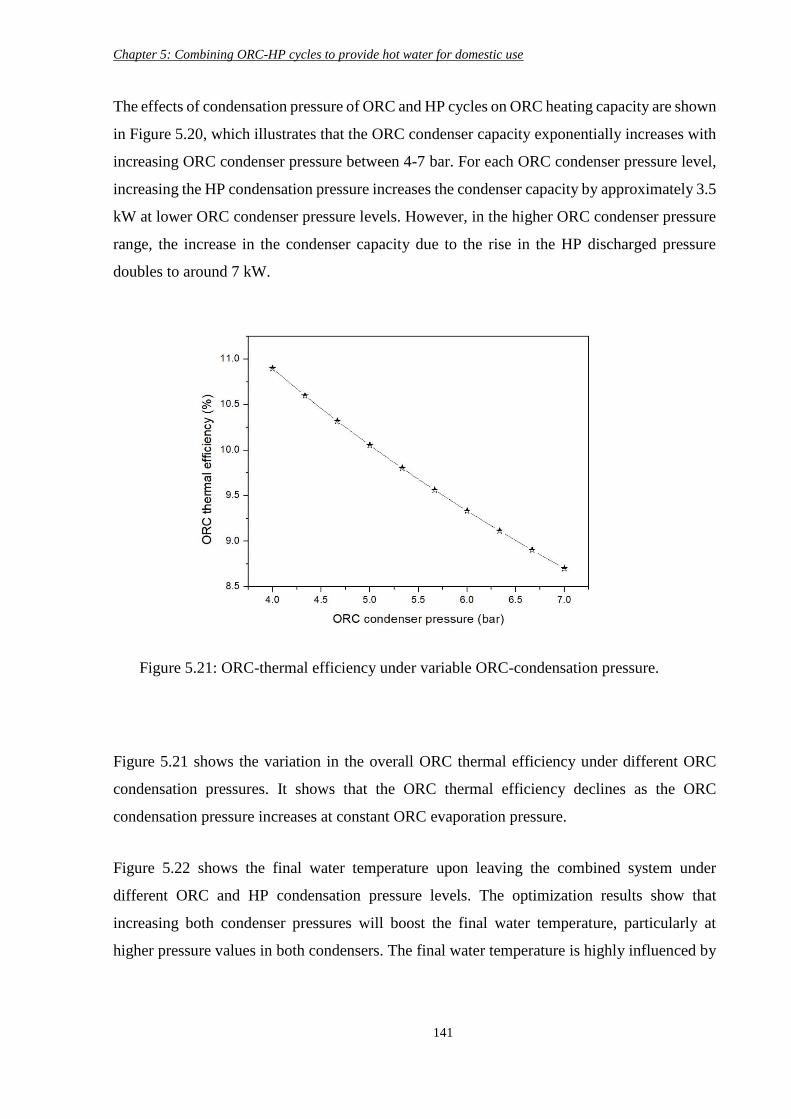
Chapter 5: Combining ORC-HP cycles to provide hot water for domestic use
141
The effects of condensation pressure of ORC and HP cycles on ORC heating capacity are shown
in Figure 5.20, which illustrates that the ORC condenser capacity exponentially increases with
increasing ORC condenser pressure between 4-7 bar. For each ORC condenser pressure level,
increasing the HP condensation pressure increases the condenser capacity by approximately 3.5
kW at lower ORC condenser pressure levels. However, in the higher ORC condenser pressure
range, the increase in the condenser capacity due to the rise in the HP discharged pressure
doubles to around 7 kW.
Figure 5.21 shows the variation in the overall ORC thermal efficiency under different ORC
condensation pressures. It shows that the ORC thermal efficiency declines as the ORC
condensation pressure increases at constant ORC evaporation pressure.
Figure 5.22 shows the final water temperature upon leaving the combined system under
different ORC and HP condensation pressure levels. The optimization results show that
increasing both condenser pressures will boost the final water temperature, particularly at
higher pressure values in both condensers. The final water temperature is highly influenced by
Figure 5.21: ORC-thermal efficiency under variable ORC-condensation pressure.
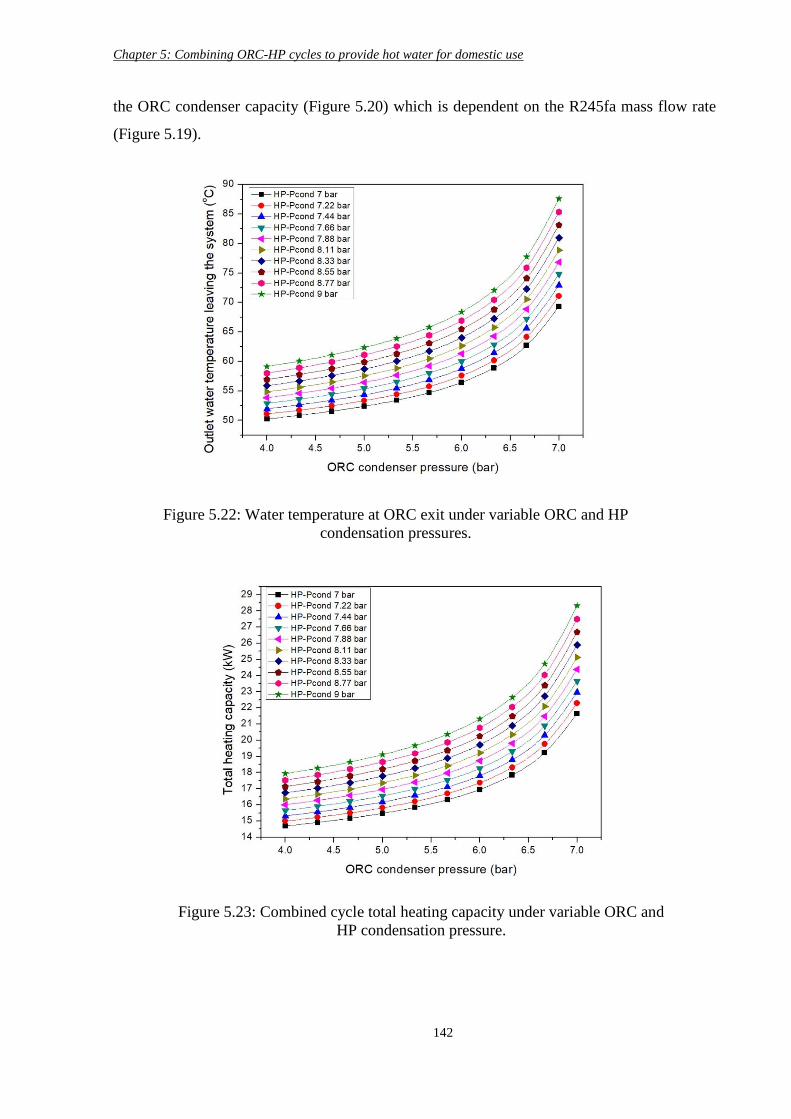
Chapter 5: Combining ORC-HP cycles to provide hot water for domestic use
142
the ORC condenser capacity (Figure 5.20) which is dependent on the R245fa mass flow rate
(Figure 5.19).
Figure 5.23: Combined cycle total heating capacity under variable ORC and
HP condensation pressure.
Figure 5.22: Water temperature at ORC exit under variable ORC and HP
condensation pressures.
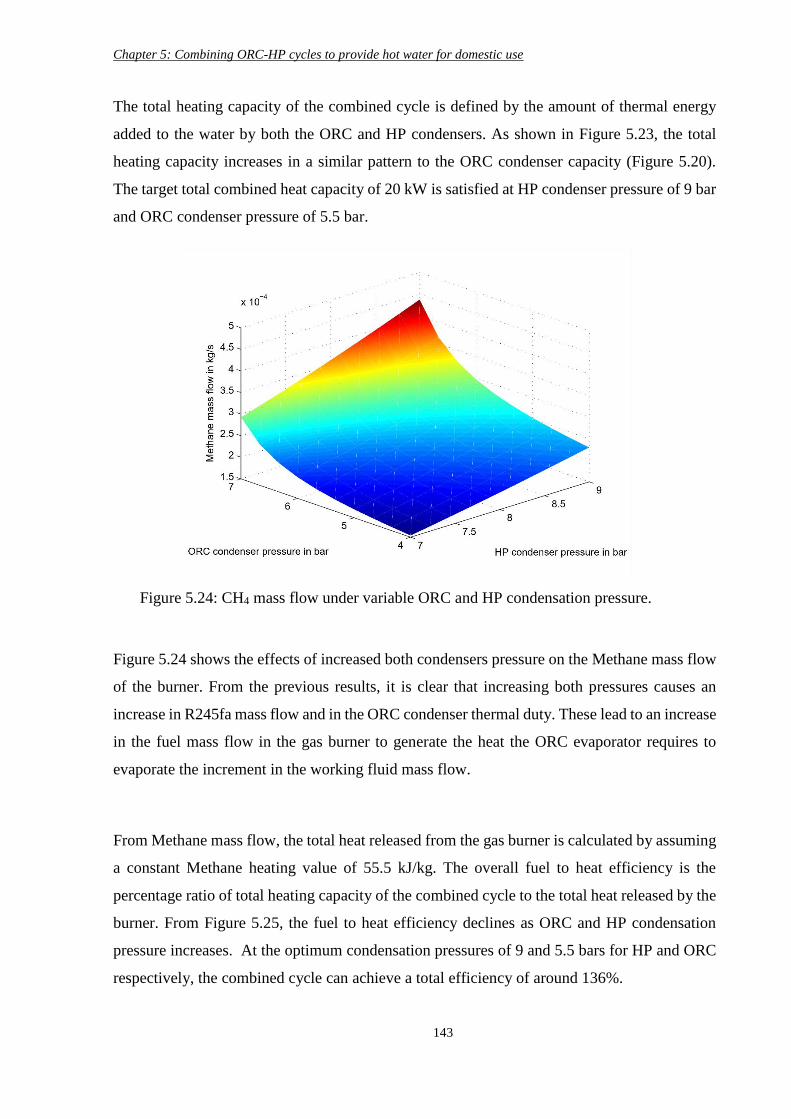
Chapter 5: Combining ORC-HP cycles to provide hot water for domestic use
143
The total heating capacity of the combined cycle is defined by the amount of thermal energy
added to the water by both the ORC and HP condensers. As shown in Figure 5.23, the total
heating capacity increases in a similar pattern to the ORC condenser capacity (Figure 5.20).
The target total combined heat capacity of 20 kW is satisfied at HP condenser pressure of 9 bar
and ORC condenser pressure of 5.5 bar.
Figure 5.24 shows the effects of increased both condensers pressure on the Methane mass flow
of the burner. From the previous results, it is clear that increasing both pressures causes an
increase in R245fa mass flow and in the ORC condenser thermal duty. These lead to an increase
in the fuel mass flow in the gas burner to generate the heat the ORC evaporator requires to
evaporate the increment in the working fluid mass flow.
From Methane mass flow, the total heat released from the gas burner is calculated by assuming
a constant Methane heating value of 55.5 kJ/kg. The overall fuel to heat efficiency is the
percentage ratio of total heating capacity of the combined cycle to the total heat released by the
burner. From Figure 5.25, the fuel to heat efficiency declines as ORC and HP condensation
pressure increases. At the optimum condensation pressures of 9 and 5.5 bars for HP and ORC
respectively, the combined cycle can achieve a total efficiency of around 136%.
Figure 5.24: CH4 mass flow under variable ORC and HP condensation pressure.
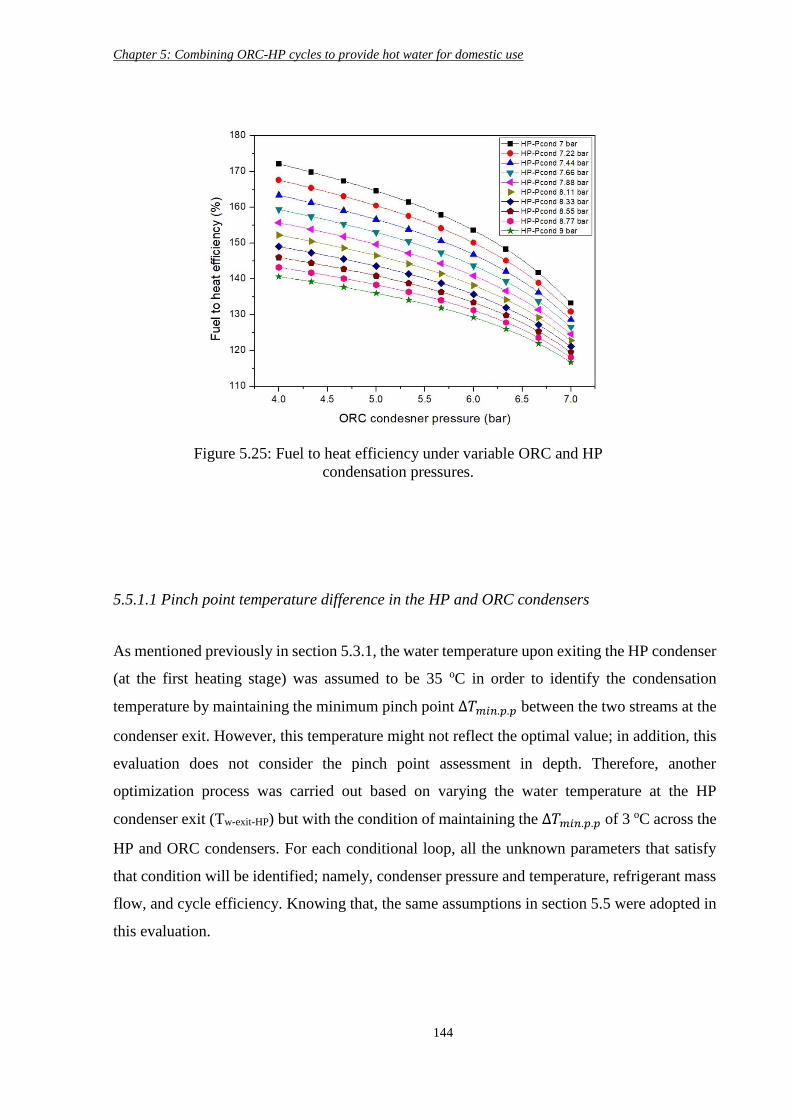
Chapter 5: Combining ORC-HP cycles to provide hot water for domestic use
144
5.5.1.1 Pinch point temperature difference in the HP and ORC condensers
As mentioned previously in section 5.3.1, the water temperature upon exiting the HP condenser
(at the first heating stage) was assumed to be 35 oC in order to identify the condensation
temperature by maintaining the minimum pinch point ∆𝑇𝑚𝑖𝑛.𝑝.𝑝 between the two streams at the
condenser exit. However, this temperature might not reflect the optimal value; in addition, this
evaluation does not consider the pinch point assessment in depth. Therefore, another
optimization process was carried out based on varying the water temperature at the HP
condenser exit (Tw-exit-HP) but with the condition of maintaining the ∆𝑇𝑚𝑖𝑛.𝑝.𝑝 of 3 oC across the
HP and ORC condensers. For each conditional loop, all the unknown parameters that satisfy
that condition will be identified; namely, condenser pressure and temperature, refrigerant mass
flow, and cycle efficiency. Knowing that, the same assumptions in section 5.5 were adopted in
this evaluation.
Figure 5.25: Fuel to heat efficiency under variable ORC and HP
condensation pressures.
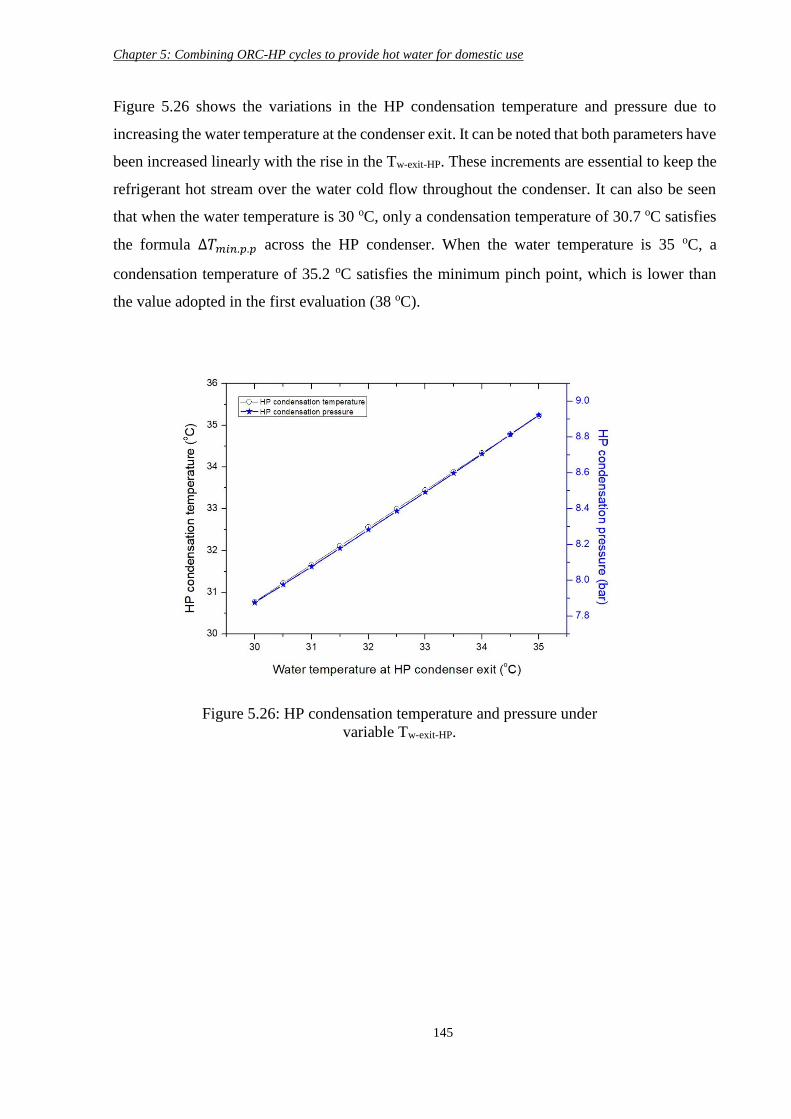
Chapter 5: Combining ORC-HP cycles to provide hot water for domestic use
145
Figure 5.26 shows the variations in the HP condensation temperature and pressure due to
increasing the water temperature at the condenser exit. It can be noted that both parameters have
been increased linearly with the rise in the Tw-exit-HP. These increments are essential to keep the
refrigerant hot stream over the water cold flow throughout the condenser. It can also be seen
that when the water temperature is 30 oC, only a condensation temperature of 30.7 oC satisfies
the formula ∆𝑇𝑚𝑖𝑛.𝑝.𝑝 across the HP condenser. When the water temperature is 35 oC, a
condensation temperature of 35.2 oC satisfies the minimum pinch point, which is lower than
the value adopted in the first evaluation (38 oC).
Figure 5.26: HP condensation temperature and pressure under
variable Tw-exit-HP.
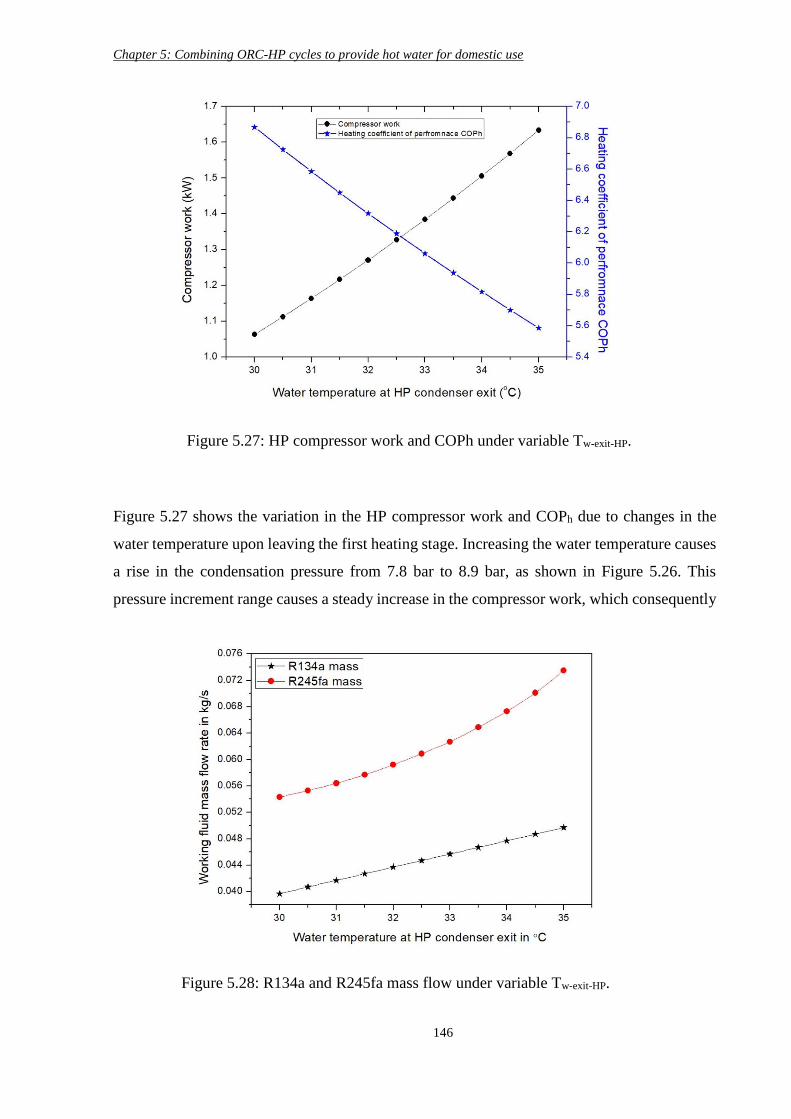
Chapter 5: Combining ORC-HP cycles to provide hot water for domestic use
146
Figure 5.27 shows the variation in the HP compressor work and COPh due to changes in the
water temperature upon leaving the first heating stage. Increasing the water temperature causes
a rise in the condensation pressure from 7.8 bar to 8.9 bar, as shown in Figure 5.26. This
pressure increment range causes a steady increase in the compressor work, which consequently
Figure 5.27: HP compressor work and COPh under variable Tw-exit-HP.
Figure 5.28: R134a and R245fa mass flow under variable Tw-exit-HP.
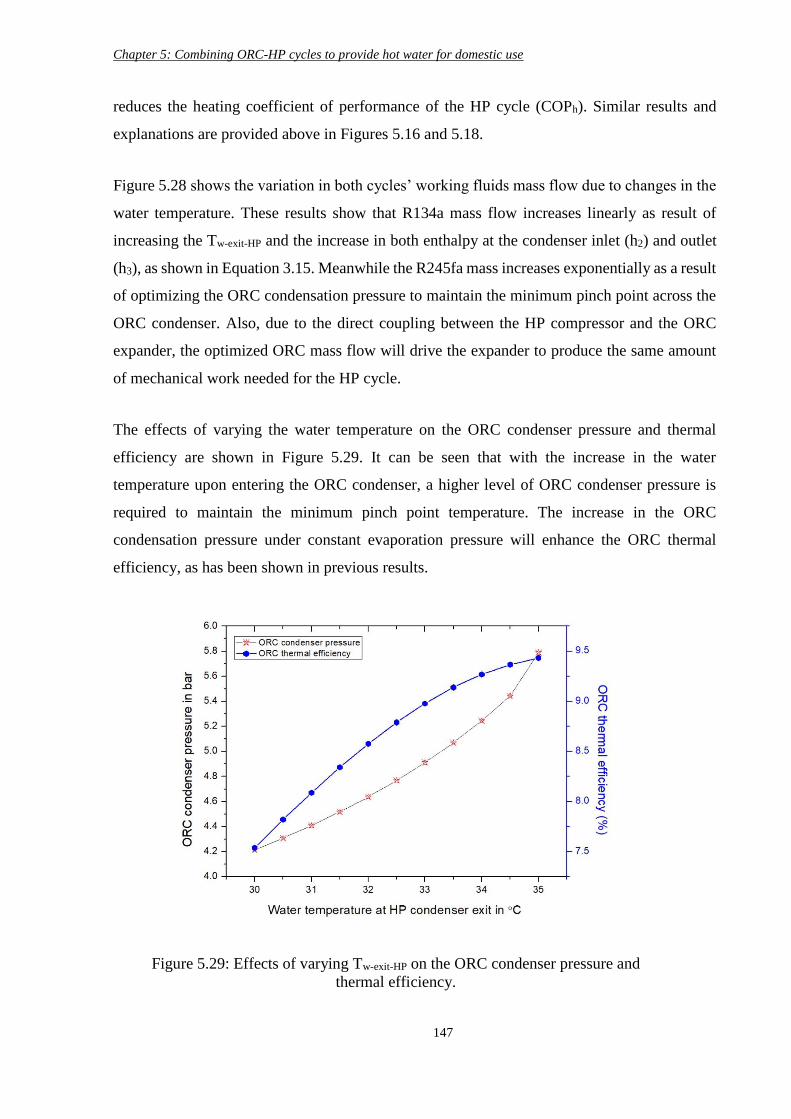
Chapter 5: Combining ORC-HP cycles to provide hot water for domestic use
147
reduces the heating coefficient of performance of the HP cycle (COPh). Similar results and
explanations are provided above in Figures 5.16 and 5.18.
Figure 5.28 shows the variation in both cycles’ working fluids mass flow due to changes in the
water temperature. These results show that R134a mass flow increases linearly as result of
increasing the Tw-exit-HP and the increase in both enthalpy at the condenser inlet (h2) and outlet
(h3), as shown in Equation 3.15. Meanwhile the R245fa mass increases exponentially as a result
of optimizing the ORC condensation pressure to maintain the minimum pinch point across the
ORC condenser. Also, due to the direct coupling between the HP compressor and the ORC
expander, the optimized ORC mass flow will drive the expander to produce the same amount
of mechanical work needed for the HP cycle.
The effects of varying the water temperature on the ORC condenser pressure and thermal
efficiency are shown in Figure 5.29. It can be seen that with the increase in the water
temperature upon entering the ORC condenser, a higher level of ORC condenser pressure is
required to maintain the minimum pinch point temperature. The increase in the ORC
condensation pressure under constant evaporation pressure will enhance the ORC thermal
efficiency, as has been shown in previous results.
Figure 5.29: Effects of varying Tw-exit-HP on the ORC condenser pressure and
thermal efficiency.
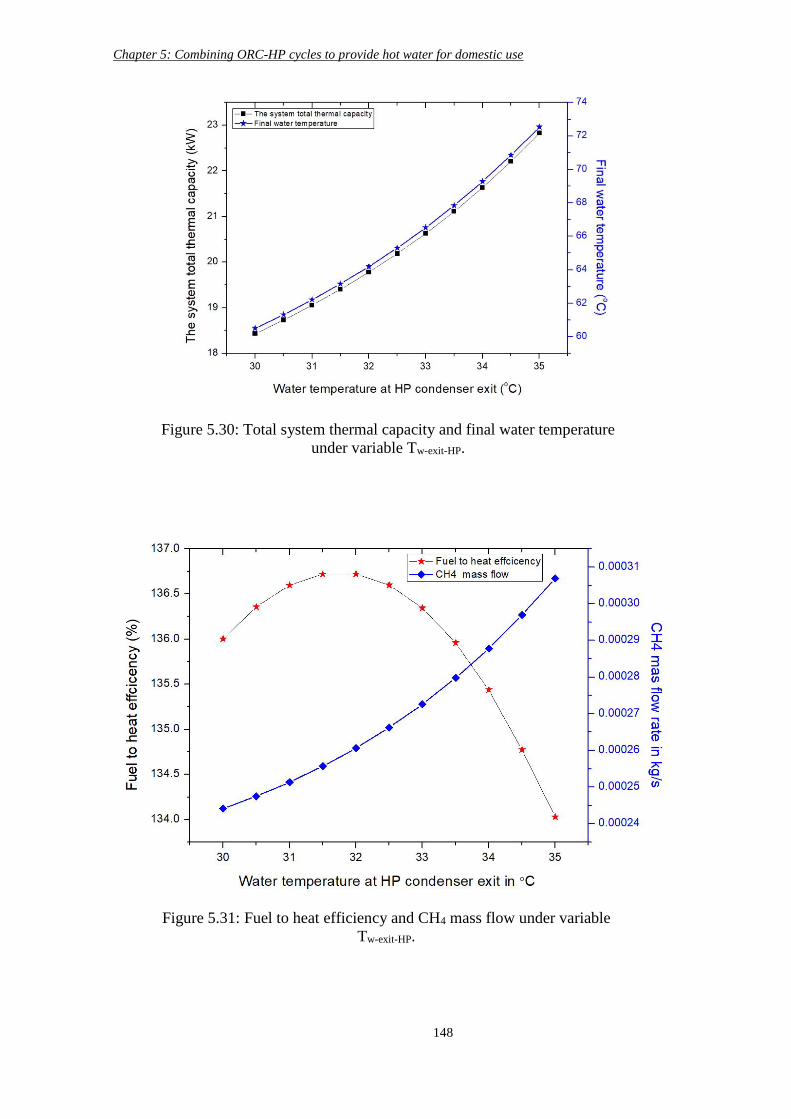
Chapter 5: Combining ORC-HP cycles to provide hot water for domestic use
148
Figure 5.30: Total system thermal capacity and final water temperature
under variable Tw-exit-HP.
Figure 5.31: Fuel to heat efficiency and CH4 mass flow under variable
Tw-exit-HP.
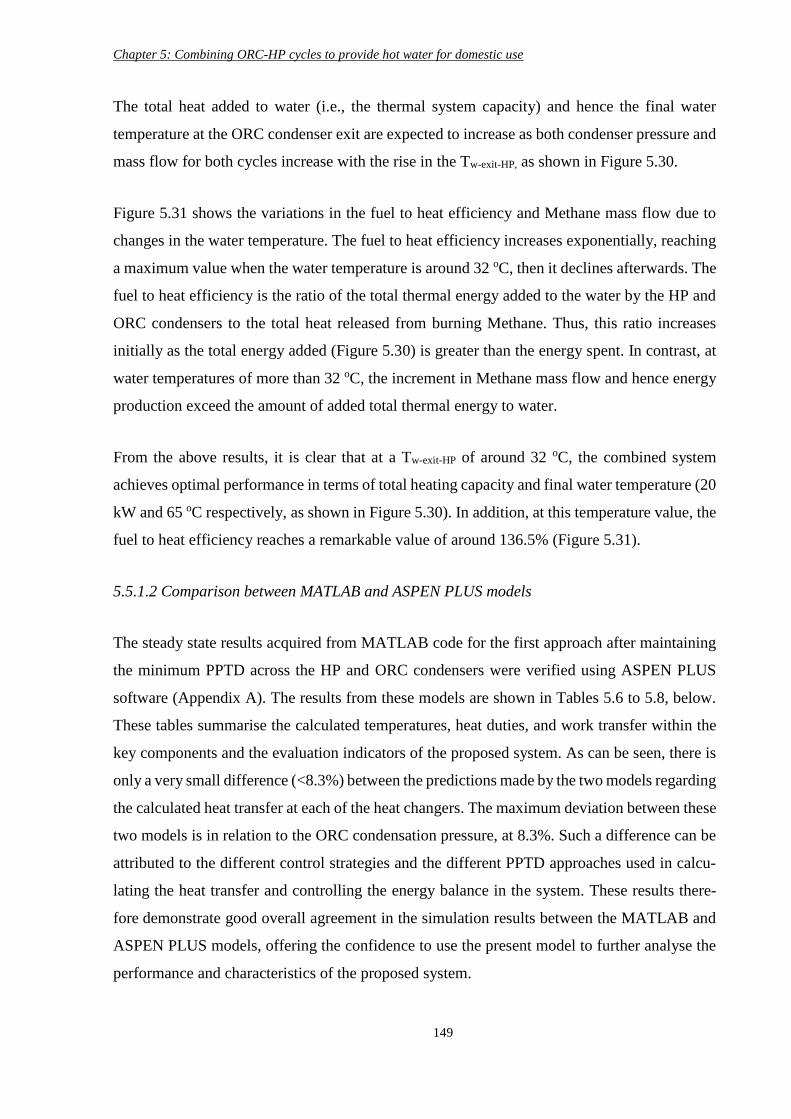
Chapter 5: Combining ORC-HP cycles to provide hot water for domestic use
149
The total heat added to water (i.e., the thermal system capacity) and hence the final water
temperature at the ORC condenser exit are expected to increase as both condenser pressure and
mass flow for both cycles increase with the rise in the Tw-exit-HP, as shown in Figure 5.30.
Figure 5.31 shows the variations in the fuel to heat efficiency and Methane mass flow due to
changes in the water temperature. The fuel to heat efficiency increases exponentially, reaching
a maximum value when the water temperature is around 32 oC, then it declines afterwards. The
fuel to heat efficiency is the ratio of the total thermal energy added to the water by the HP and
ORC condensers to the total heat released from burning Methane. Thus, this ratio increases
initially as the total energy added (Figure 5.30) is greater than the energy spent. In contrast, at
water temperatures of more than 32 oC, the increment in Methane mass flow and hence energy
production exceed the amount of added total thermal energy to water.
From the above results, it is clear that at a Tw-exit-HP of around 32 oC, the combined system
achieves optimal performance in terms of total heating capacity and final water temperature (20
kW and 65 oC respectively, as shown in Figure 5.30). In addition, at this temperature value, the
fuel to heat efficiency reaches a remarkable value of around 136.5% (Figure 5.31).
5.5.1.2 Comparison between MATLAB and ASPEN PLUS models
The steady state results acquired from MATLAB code for the first approach after maintaining
the minimum PPTD across the HP and ORC condensers were verified using ASPEN PLUS
software (Appendix A). The results from these models are shown in Tables 5.6 to 5.8, below.
These tables summarise the calculated temperatures, heat duties, and work transfer within the
key components and the evaluation indicators of the proposed system. As can be seen, there is
only a very small difference (<8.3%) between the predictions made by the two models regarding
the calculated heat transfer at each of the heat changers. The maximum deviation between these
two models is in relation to the ORC condensation pressure, at 8.3%. Such a difference can be
attributed to the different control strategies and the different PPTD approaches used in calcu-
lating the heat transfer and controlling the energy balance in the system. These results there-
fore demonstrate good overall agreement in the simulation results between the MATLAB and
ASPEN PLUS models, offering the confidence to use the present model to further analyse the
performance and characteristics of the proposed system.
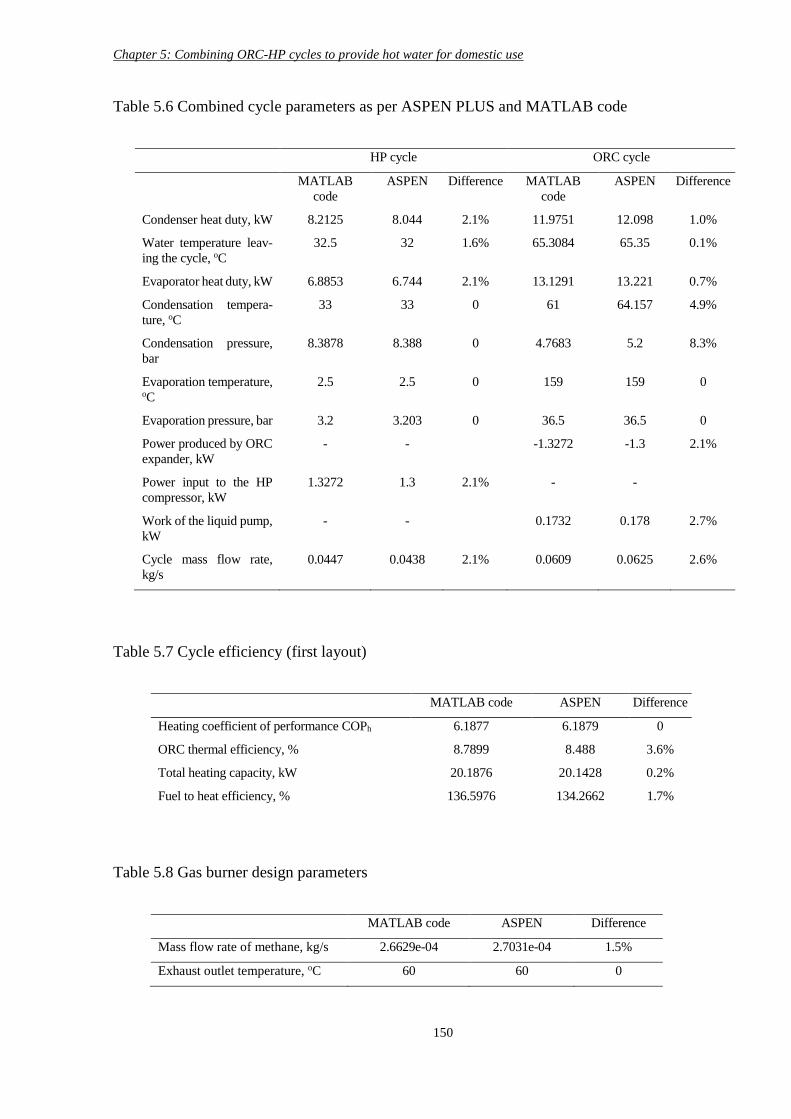
Chapter 5: Combining ORC-HP cycles to provide hot water for domestic use
150
Table 5.6 Combined cycle parameters as per ASPEN PLUS and MATLAB code
HP cycle ORC cycle
MATLAB
code
ASPEN Difference MATLAB
code
ASPEN Difference
Condenser heat duty, kW 8.2125 8.044 2.1% 11.9751 12.098 1.0%
Water temperature leav-
ing the cycle, oC 32.5 32 1.6% 65.3084 65.35 0.1%
Evaporator heat duty, kW 6.8853 6.744 2.1% 13.1291 13.221 0.7%
Condensation tempera-
ture, oC 33 33 0 61 64.157 4.9%
Condensation pressure,
bar
8.3878 8.388 0 4.7683 5.2 8.3%
Evaporation temperature, oC
2.5 2.5 0 159 159 0
Evaporation pressure, bar 3.2 3.203 0 36.5 36.5 0
Power produced by ORC
expander, kW
- - -1.3272 -1.3 2.1%
Power input to the HP
compressor, kW
1.3272 1.3 2.1% - -
Work of the liquid pump,
kW
- - 0.1732 0.178 2.7%
Cycle mass flow rate,
kg/s
0.0447 0.0438 2.1% 0.0609 0.0625 2.6%
Table 5.7 Cycle efficiency (first layout)
MATLAB code ASPEN Difference
Heating coefficient of performance COPh 6.1877 6.1879 0
ORC thermal efficiency, % 8.7899 8.488 3.6%
Total heating capacity, kW 20.1876 20.1428 0.2%
Fuel to heat efficiency, % 136.5976 134.2662 1.7%
Table 5.8 Gas burner design parameters
MATLAB code ASPEN Difference
Mass flow rate of methane, kg/s 2.6629e-04 2.7031e-04 1.5%
Exhaust outlet temperature, oC 60 60 0
Chapter 5: Combining ORC-HP cycles to provide hot water for domestic use
151
Figure 5.32 shows the T-Q curve (acquired from ASPEN) for the HP condenser (at the first
heating stage) after the optimization process in the HP cycle. It shows that cold tap water enters
the condenser at 10 oC, and after absorbing 8 kW of latent heat due to the condensation of
R134a, the water temperature increases to 32 oC at the condenser exit. The figure also shows
that the optimization has secured the required pinch point temperature difference between the
cold stream (water) and the heat stream (working fluid, R134a).
Figure 5.33 shows the T-Q curves for the ORC condenser (obtained from MATLAB code). It
shows that the R245fa condensation released 12 kW of latent heat to be absorbed by the water
to raise its temperature from 32 to 65 oC. Furthermore, the optimal ORC condenser pressure
maintained a 3 oC pinch point temperature difference between the two streams.
Figure 5.32: T-Q curve across the HP condenser.
Block HP-COND: TQ Curves
Duty kW
Tem
pera
ture
C
0 1 2 3 4 5 6 7 810
11
12
13
14
15
16
17
18
19
20
21
22
23
24
25
26
27
28
29
30
31
32
33
34
35
36
37
38
39
40
41
42
43
44
45
46
Water Cold stream
R134a Hot stream
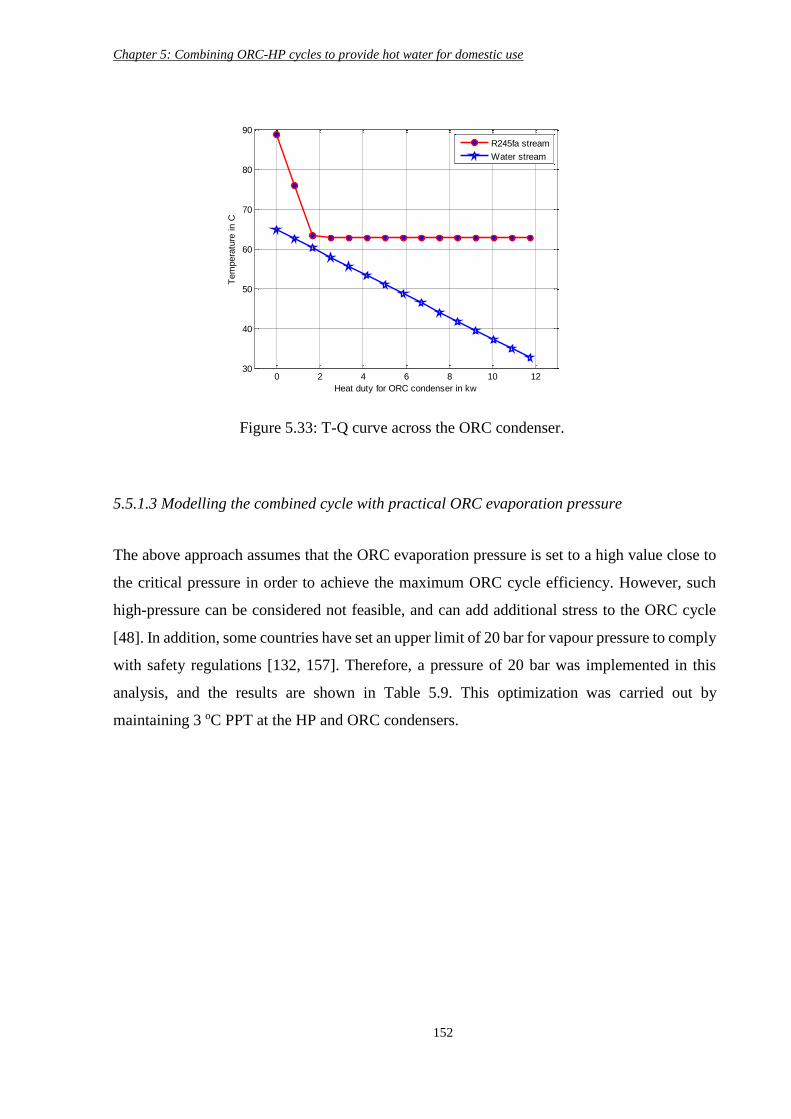
Chapter 5: Combining ORC-HP cycles to provide hot water for domestic use
152
5.5.1.3 Modelling the combined cycle with practical ORC evaporation pressure
The above approach assumes that the ORC evaporation pressure is set to a high value close to
the critical pressure in order to achieve the maximum ORC cycle efficiency. However, such
high-pressure can be considered not feasible, and can add additional stress to the ORC cycle
[48]. In addition, some countries have set an upper limit of 20 bar for vapour pressure to comply
with safety regulations [132, 157]. Therefore, a pressure of 20 bar was implemented in this
analysis, and the results are shown in Table 5.9. This optimization was carried out by
maintaining 3 oC PPT at the HP and ORC condensers.
Figure 5.33: T-Q curve across the ORC condenser.
0 2 4 6 8 10 1230
40
50
60
70
80
90
Heat duty for ORC condenser in kw
Tem
pera
ture
in C
R245fa stream
Water stream
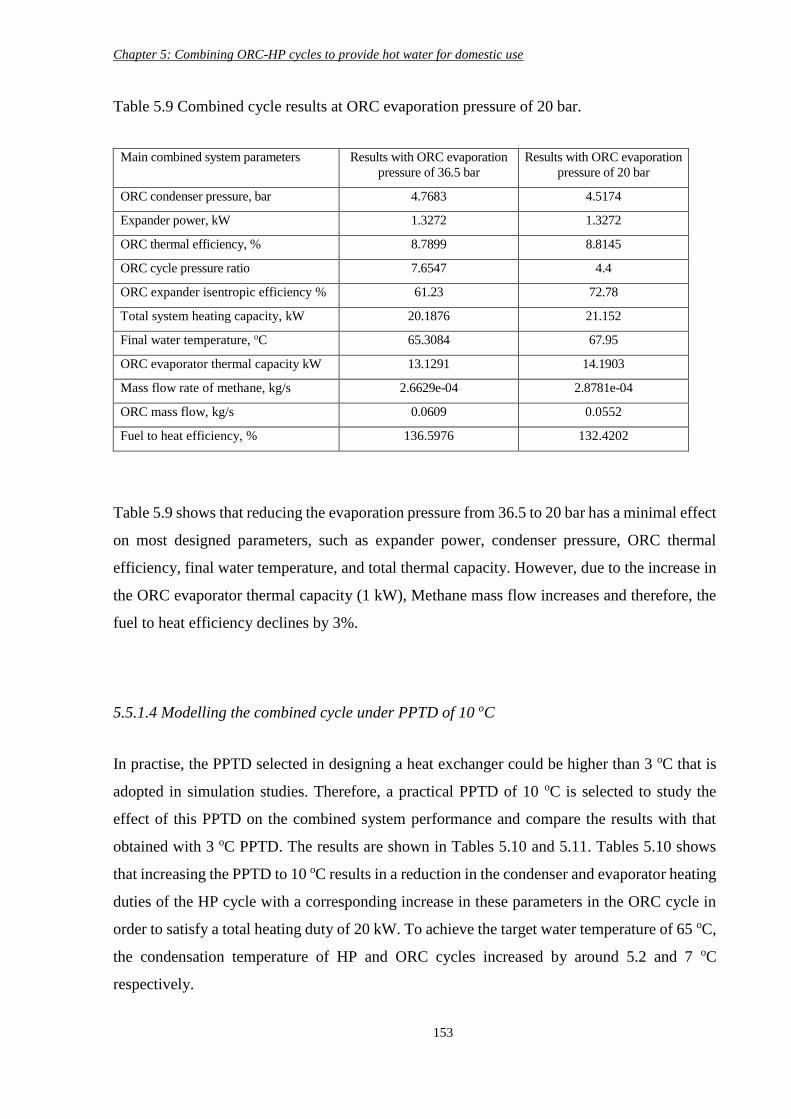
Chapter 5: Combining ORC-HP cycles to provide hot water for domestic use
153
Table 5.9 Combined cycle results at ORC evaporation pressure of 20 bar.
Main combined system parameters Results with ORC evaporation
pressure of 36.5 bar
Results with ORC evaporation
pressure of 20 bar
ORC condenser pressure, bar 4.7683 4.5174
Expander power, kW 1.3272 1.3272
ORC thermal efficiency, % 8.7899 8.8145
ORC cycle pressure ratio 7.6547 4.4
ORC expander isentropic efficiency % 61.23 72.78
Total system heating capacity, kW 20.1876 21.152
Final water temperature, oC 65.3084 67.95
ORC evaporator thermal capacity kW 13.1291 14.1903
Mass flow rate of methane, kg/s 2.6629e-04 2.8781e-04
ORC mass flow, kg/s 0.0609 0.0552
Fuel to heat efficiency, % 136.5976 132.4202
Table 5.9 shows that reducing the evaporation pressure from 36.5 to 20 bar has a minimal effect
on most designed parameters, such as expander power, condenser pressure, ORC thermal
efficiency, final water temperature, and total thermal capacity. However, due to the increase in
the ORC evaporator thermal capacity (1 kW), Methane mass flow increases and therefore, the
fuel to heat efficiency declines by 3%.
5.5.1.4 Modelling the combined cycle under PPTD of 10 oC
In practise, the PPTD selected in designing a heat exchanger could be higher than 3 oC that is
adopted in simulation studies. Therefore, a practical PPTD of 10 oC is selected to study the
effect of this PPTD on the combined system performance and compare the results with that
obtained with 3 oC PPTD. The results are shown in Tables 5.10 and 5.11. Tables 5.10 shows
that increasing the PPTD to 10 oC results in a reduction in the condenser and evaporator heating
duties of the HP cycle with a corresponding increase in these parameters in the ORC cycle in
order to satisfy a total heating duty of 20 kW. To achieve the target water temperature of 65 oC,
the condensation temperature of HP and ORC cycles increased by around 5.2 and 7 oC
respectively.
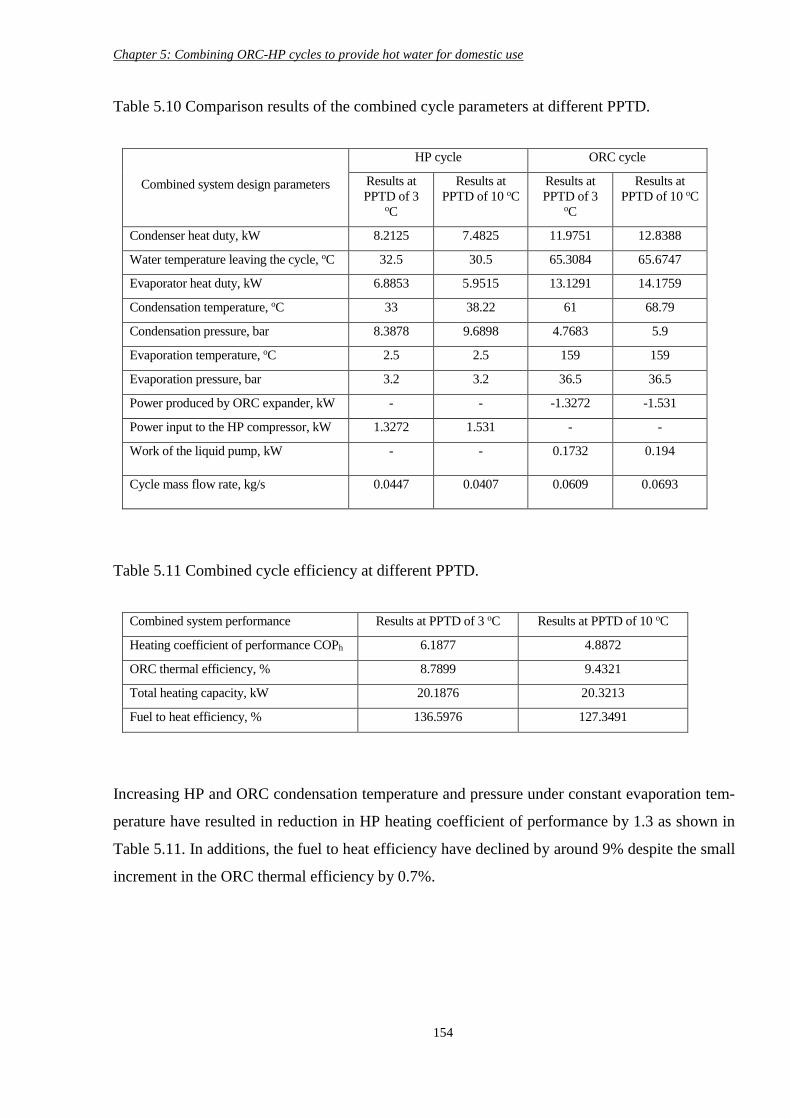
Chapter 5: Combining ORC-HP cycles to provide hot water for domestic use
154
Table 5.10 Comparison results of the combined cycle parameters at different PPTD.
Combined system design parameters
HP cycle ORC cycle
Results at
PPTD of 3 oC
Results at
PPTD of 10 oC Results at
PPTD of 3 oC
Results at
PPTD of 10 oC
Condenser heat duty, kW 8.2125 7.4825 11.9751 12.8388
Water temperature leaving the cycle, oC 32.5 30.5 65.3084 65.6747
Evaporator heat duty, kW 6.8853 5.9515 13.1291 14.1759
Condensation temperature, oC 33 38.22 61 68.79
Condensation pressure, bar 8.3878 9.6898 4.7683 5.9
Evaporation temperature, oC 2.5 2.5 159 159
Evaporation pressure, bar 3.2 3.2 36.5 36.5
Power produced by ORC expander, kW - - -1.3272 -1.531
Power input to the HP compressor, kW 1.3272 1.531 - -
Work of the liquid pump, kW - - 0.1732 0.194
Cycle mass flow rate, kg/s 0.0447 0.0407 0.0609 0.0693
Table 5.11 Combined cycle efficiency at different PPTD.
Combined system performance Results at PPTD of 3 oC Results at PPTD of 10 oC
Heating coefficient of performance COPh 6.1877 4.8872
ORC thermal efficiency, % 8.7899 9.4321
Total heating capacity, kW 20.1876 20.3213
Fuel to heat efficiency, % 136.5976 127.3491
Increasing HP and ORC condensation temperature and pressure under constant evaporation tem-
perature have resulted in reduction in HP heating coefficient of performance by 1.3 as shown in
Table 5.11. In additions, the fuel to heat efficiency have declined by around 9% despite the small
increment in the ORC thermal efficiency by 0.7%.
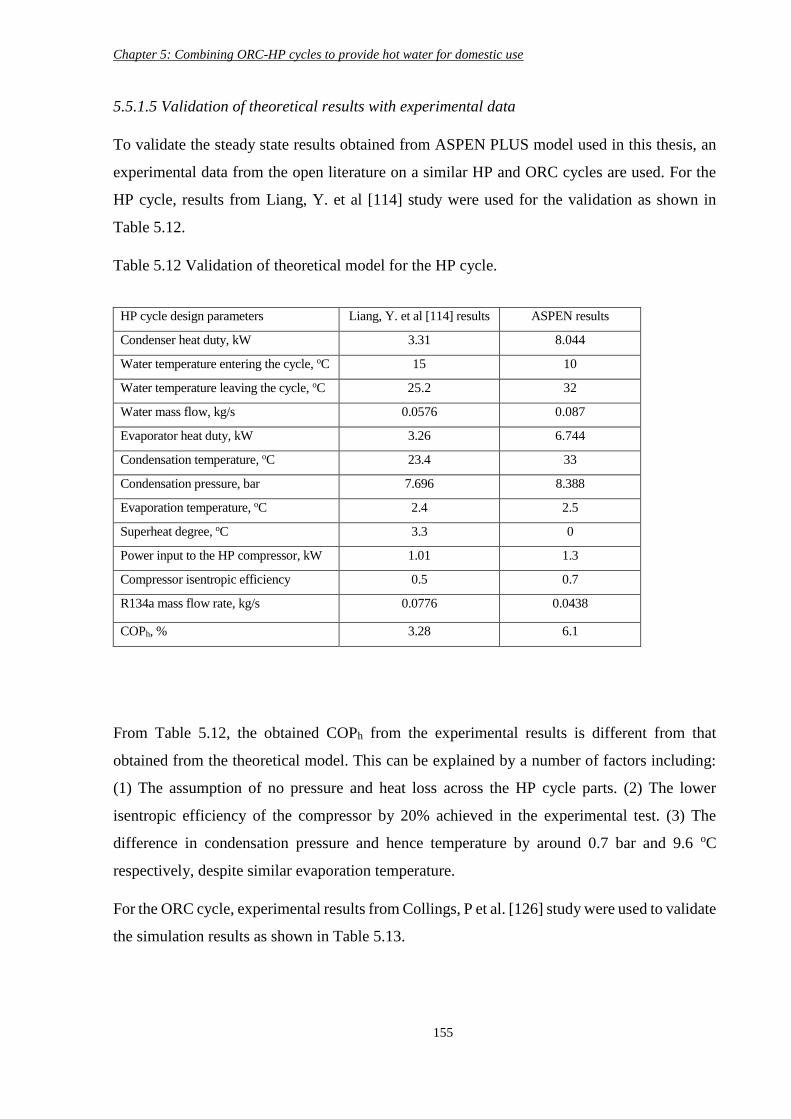
Chapter 5: Combining ORC-HP cycles to provide hot water for domestic use
155
5.5.1.5 Validation of theoretical results with experimental data
To validate the steady state results obtained from ASPEN PLUS model used in this thesis, an
experimental data from the open literature on a similar HP and ORC cycles are used. For the
HP cycle, results from Liang, Y. et al [114] study were used for the validation as shown in
Table 5.12.
Table 5.12 Validation of theoretical model for the HP cycle.
HP cycle design parameters Liang, Y. et al [114] results ASPEN results
Condenser heat duty, kW 3.31 8.044
Water temperature entering the cycle, oC 15 10
Water temperature leaving the cycle, oC 25.2 32
Water mass flow, kg/s 0.0576 0.087
Evaporator heat duty, kW 3.26 6.744
Condensation temperature, oC 23.4 33
Condensation pressure, bar 7.696 8.388
Evaporation temperature, oC 2.4 2.5
Superheat degree, oC 3.3 0
Power input to the HP compressor, kW 1.01 1.3
Compressor isentropic efficiency 0.5 0.7
R134a mass flow rate, kg/s 0.0776 0.0438
COPh, % 3.28 6.1
From Table 5.12, the obtained COPh from the experimental results is different from that
obtained from the theoretical model. This can be explained by a number of factors including:
(1) The assumption of no pressure and heat loss across the HP cycle parts. (2) The lower
isentropic efficiency of the compressor by 20% achieved in the experimental test. (3) The
difference in condensation pressure and hence temperature by around 0.7 bar and 9.6 oC
respectively, despite similar evaporation temperature.
For the ORC cycle, experimental results from Collings, P et al. [126] study were used to validate
the simulation results as shown in Table 5.13.
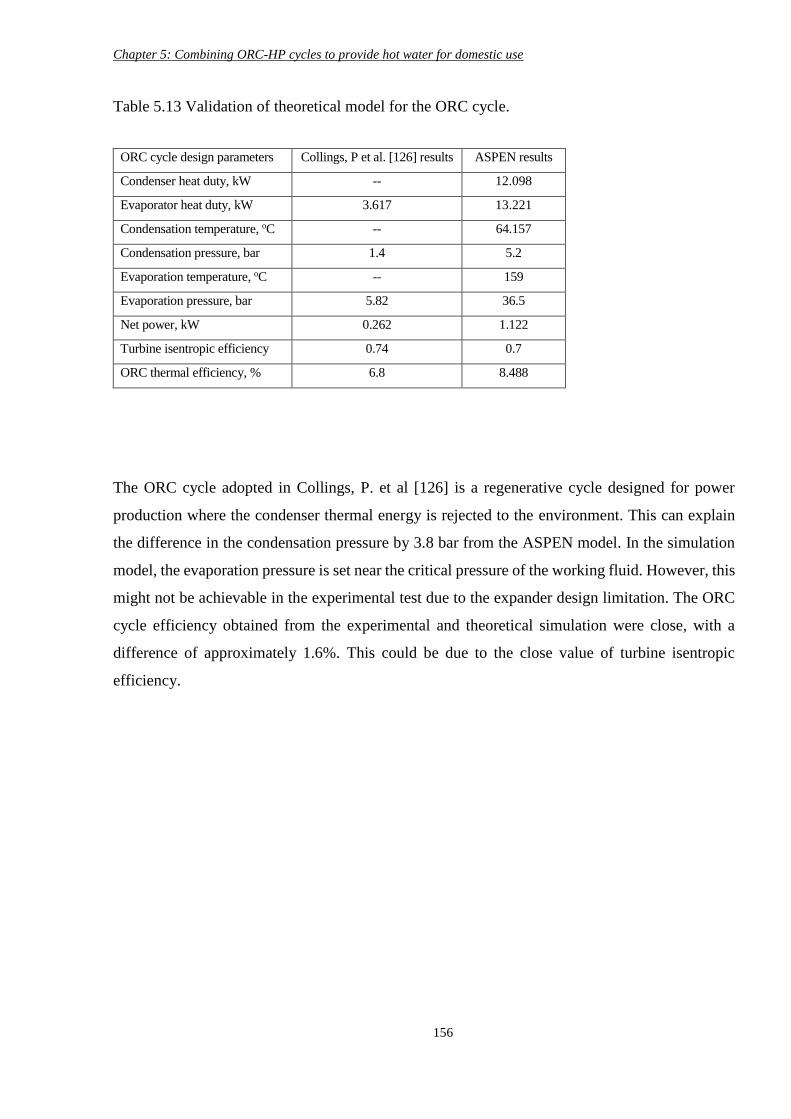
Chapter 5: Combining ORC-HP cycles to provide hot water for domestic use
156
Table 5.13 Validation of theoretical model for the ORC cycle.
ORC cycle design parameters Collings, P et al. [126] results ASPEN results
Condenser heat duty, kW -- 12.098
Evaporator heat duty, kW 3.617 13.221
Condensation temperature, oC -- 64.157
Condensation pressure, bar 1.4 5.2
Evaporation temperature, oC -- 159
Evaporation pressure, bar 5.82 36.5
Net power, kW 0.262 1.122
Turbine isentropic efficiency 0.74 0.7
ORC thermal efficiency, % 6.8 8.488
The ORC cycle adopted in Collings, P. et al [126] is a regenerative cycle designed for power
production where the condenser thermal energy is rejected to the environment. This can explain
the difference in the condensation pressure by 3.8 bar from the ASPEN model. In the simulation
model, the evaporation pressure is set near the critical pressure of the working fluid. However, this
might not be achievable in the experimental test due to the expander design limitation. The ORC
cycle efficiency obtained from the experimental and theoretical simulation were close, with a
difference of approximately 1.6%. This could be due to the close value of turbine isentropic
efficiency.
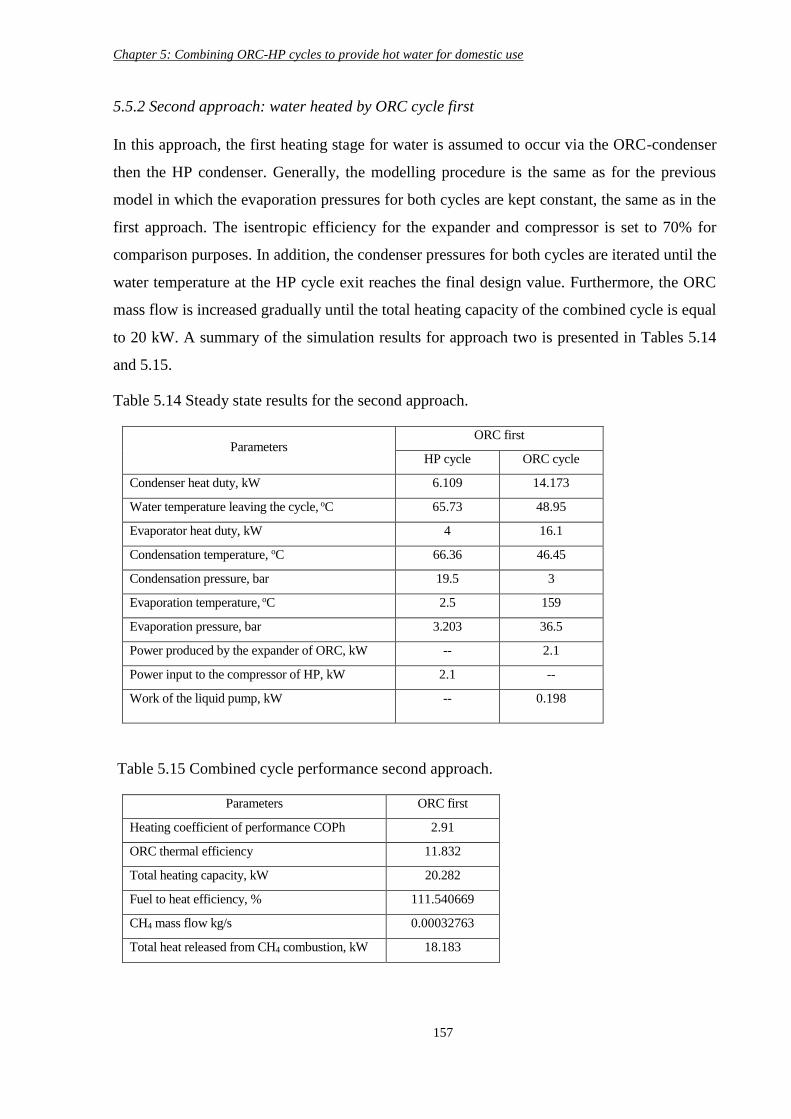
Chapter 5: Combining ORC-HP cycles to provide hot water for domestic use
157
5.5.2 Second approach: water heated by ORC cycle first
In this approach, the first heating stage for water is assumed to occur via the ORC-condenser
then the HP condenser. Generally, the modelling procedure is the same as for the previous
model in which the evaporation pressures for both cycles are kept constant, the same as in the
first approach. The isentropic efficiency for the expander and compressor is set to 70% for
comparison purposes. In addition, the condenser pressures for both cycles are iterated until the
water temperature at the HP cycle exit reaches the final design value. Furthermore, the ORC
mass flow is increased gradually until the total heating capacity of the combined cycle is equal
to 20 kW. A summary of the simulation results for approach two is presented in Tables 5.14
and 5.15.
Table 5.14 Steady state results for the second approach.
Parameters ORC first
HP cycle ORC cycle
Condenser heat duty, kW 6.109 14.173
Water temperature leaving the cycle, oC 65.73 48.95
Evaporator heat duty, kW 4 16.1
Condensation temperature, oC 66.36 46.45
Condensation pressure, bar 19.5 3
Evaporation temperature, oC 2.5 159
Evaporation pressure, bar 3.203 36.5
Power produced by the expander of ORC, kW -- 2.1
Power input to the compressor of HP, kW 2.1 --
Work of the liquid pump, kW -- 0.198
Table 5.15 Combined cycle performance second approach.
Parameters ORC first
Heating coefficient of performance COPh 2.91
ORC thermal efficiency 11.832
Total heating capacity, kW 20.282
Fuel to heat efficiency, % 111.540669
CH4 mass flow kg/s 0.00032763
Total heat released from CH4 combustion, kW 18.183
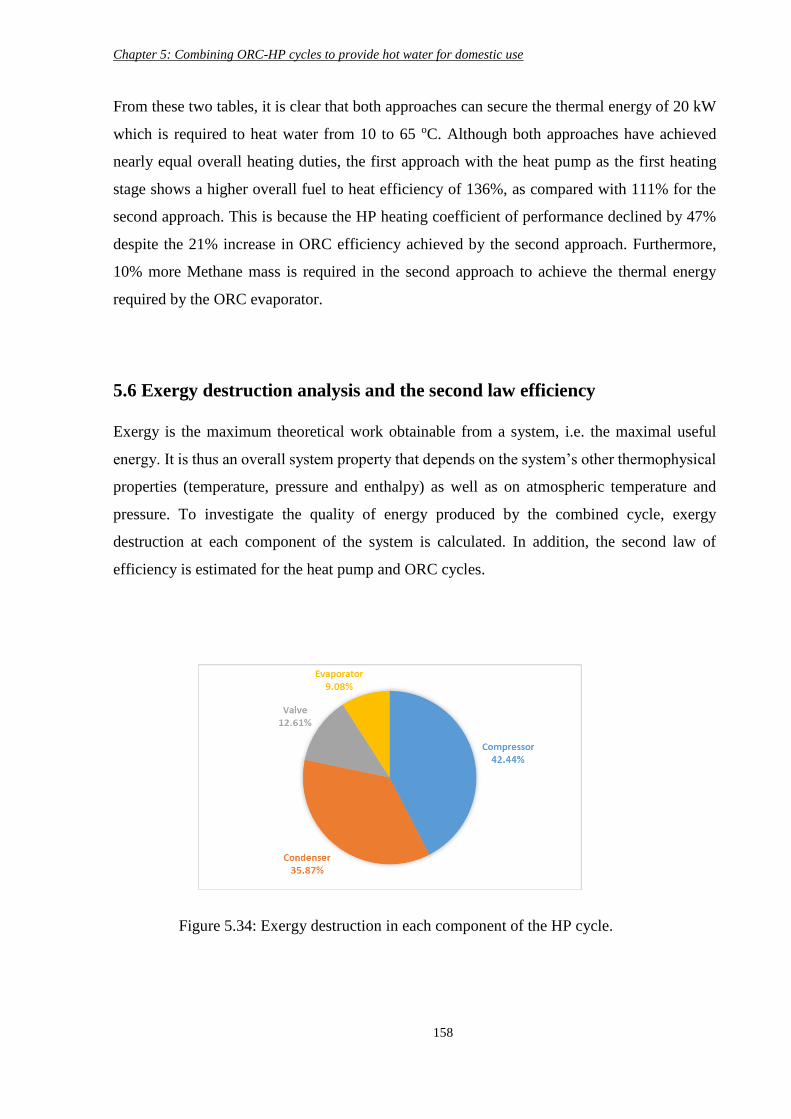
Chapter 5: Combining ORC-HP cycles to provide hot water for domestic use
158
From these two tables, it is clear that both approaches can secure the thermal energy of 20 kW
which is required to heat water from 10 to 65 oC. Although both approaches have achieved
nearly equal overall heating duties, the first approach with the heat pump as the first heating
stage shows a higher overall fuel to heat efficiency of 136%, as compared with 111% for the
second approach. This is because the HP heating coefficient of performance declined by 47%
despite the 21% increase in ORC efficiency achieved by the second approach. Furthermore,
10% more Methane mass is required in the second approach to achieve the thermal energy
required by the ORC evaporator.
5.6 Exergy destruction analysis and the second law efficiency
Exergy is the maximum theoretical work obtainable from a system, i.e. the maximal useful
energy. It is thus an overall system property that depends on the system’s other thermophysical
properties (temperature, pressure and enthalpy) as well as on atmospheric temperature and
pressure. To investigate the quality of energy produced by the combined cycle, exergy
destruction at each component of the system is calculated. In addition, the second law of
efficiency is estimated for the heat pump and ORC cycles.
Figure 5.34: Exergy destruction in each component of the HP cycle.
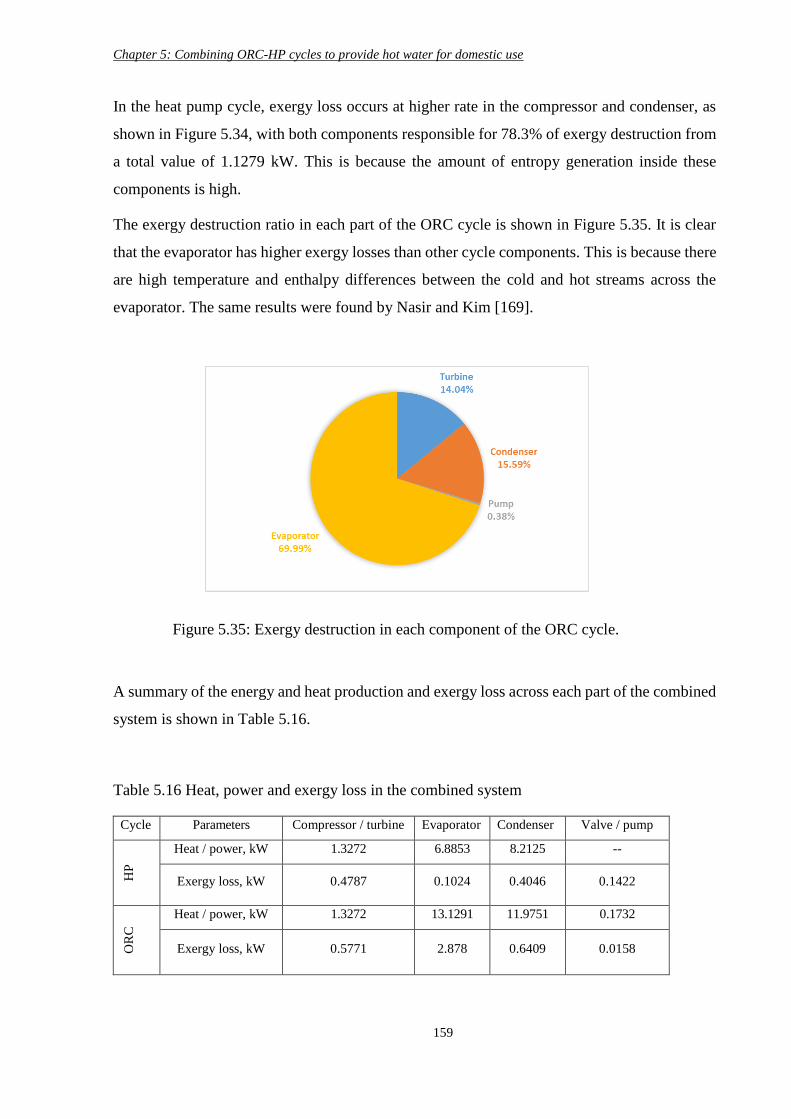
Chapter 5: Combining ORC-HP cycles to provide hot water for domestic use
159
In the heat pump cycle, exergy loss occurs at higher rate in the compressor and condenser, as
shown in Figure 5.34, with both components responsible for 78.3% of exergy destruction from
a total value of 1.1279 kW. This is because the amount of entropy generation inside these
components is high.
The exergy destruction ratio in each part of the ORC cycle is shown in Figure 5.35. It is clear
that the evaporator has higher exergy losses than other cycle components. This is because there
are high temperature and enthalpy differences between the cold and hot streams across the
evaporator. The same results were found by Nasir and Kim [169].
A summary of the energy and heat production and exergy loss across each part of the combined
system is shown in Table 5.16.
Table 5.16 Heat, power and exergy loss in the combined system
Cycle Parameters Compressor / turbine Evaporator Condenser Valve / pump
HP
Heat / power, kW 1.3272 6.8853 8.2125 --
Exergy loss, kW 0.4787 0.1024 0.4046 0.1422
OR
C
Heat / power, kW 1.3272 13.1291 11.9751 0.1732
Exergy loss, kW 0.5771 2.878 0.6409 0.0158
Figure 5.35: Exergy destruction in each component of the ORC cycle.
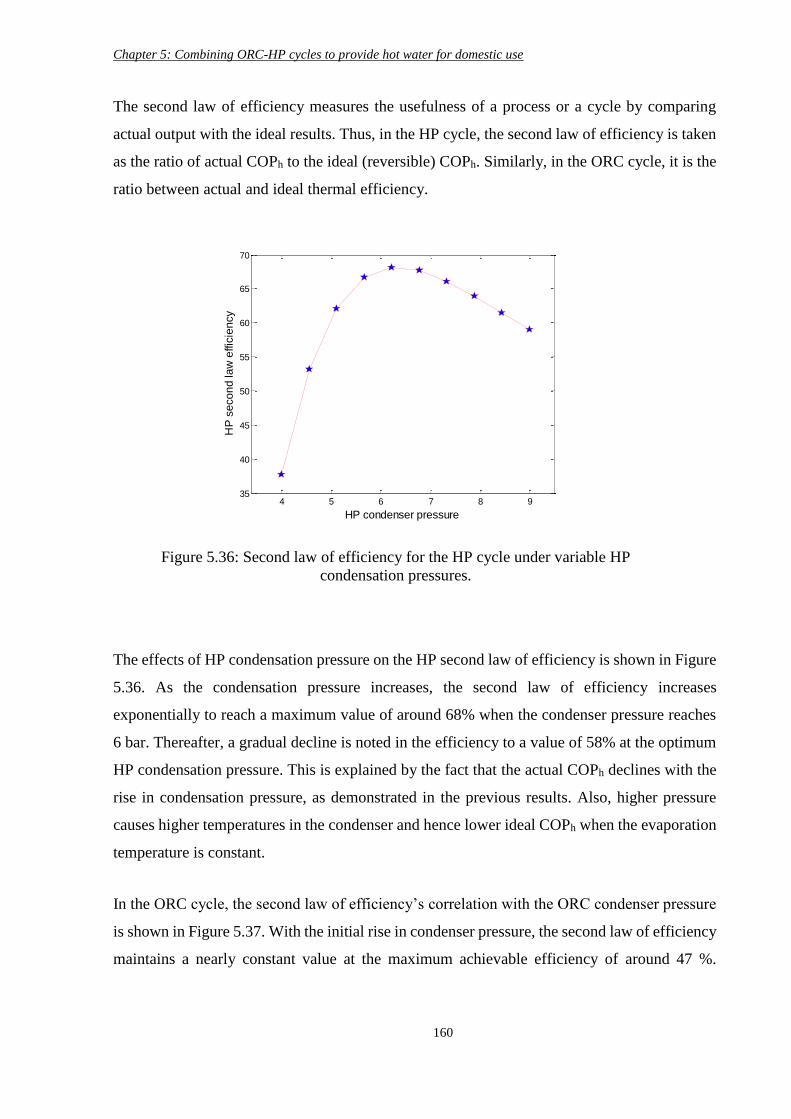
Chapter 5: Combining ORC-HP cycles to provide hot water for domestic use
160
The second law of efficiency measures the usefulness of a process or a cycle by comparing
actual output with the ideal results. Thus, in the HP cycle, the second law of efficiency is taken
as the ratio of actual COPh to the ideal (reversible) COPh. Similarly, in the ORC cycle, it is the
ratio between actual and ideal thermal efficiency.
The effects of HP condensation pressure on the HP second law of efficiency is shown in Figure
5.36. As the condensation pressure increases, the second law of efficiency increases
exponentially to reach a maximum value of around 68% when the condenser pressure reaches
6 bar. Thereafter, a gradual decline is noted in the efficiency to a value of 58% at the optimum
HP condensation pressure. This is explained by the fact that the actual COPh declines with the
rise in condensation pressure, as demonstrated in the previous results. Also, higher pressure
causes higher temperatures in the condenser and hence lower ideal COPh when the evaporation
temperature is constant.
In the ORC cycle, the second law of efficiency’s correlation with the ORC condenser pressure
is shown in Figure 5.37. With the initial rise in condenser pressure, the second law of efficiency
maintains a nearly constant value at the maximum achievable efficiency of around 47 %.
Figure 5.36: Second law of efficiency for the HP cycle under variable HP
condensation pressures.
4 5 6 7 8 935
40
45
50
55
60
65
70
HP condenser pressure
HP
se
co
nd
la
w e
ffic
ien
cy
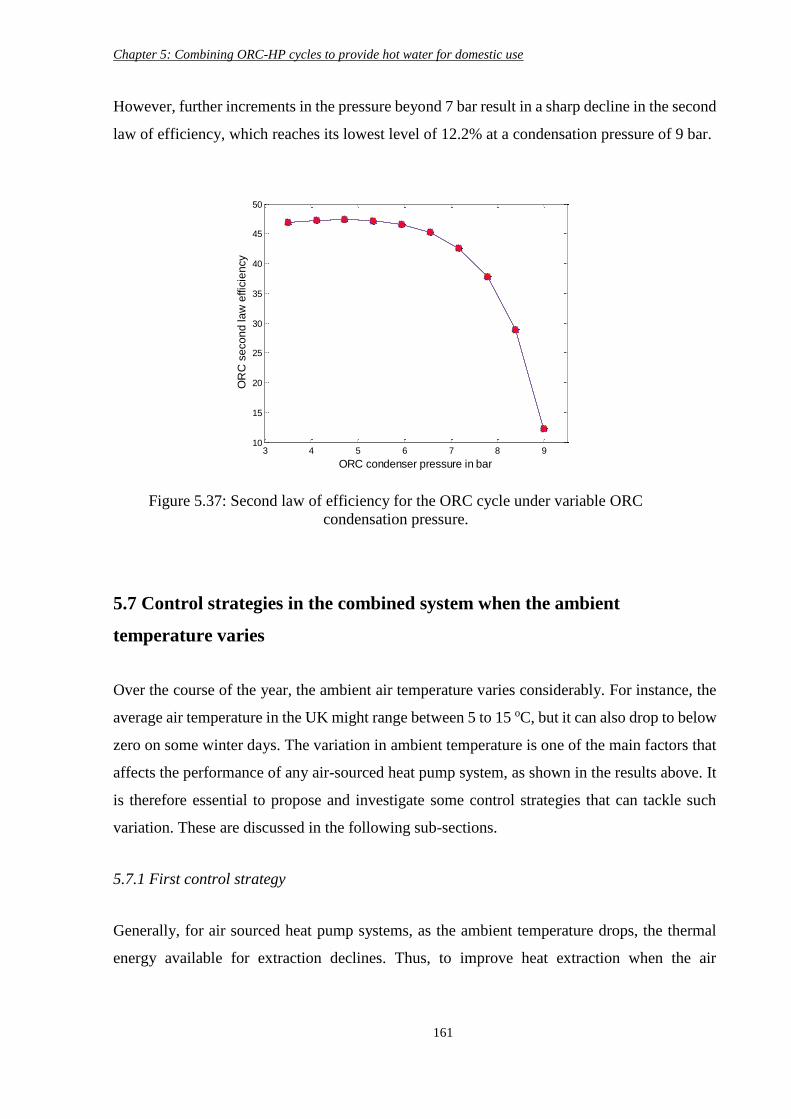
Chapter 5: Combining ORC-HP cycles to provide hot water for domestic use
161
However, further increments in the pressure beyond 7 bar result in a sharp decline in the second
law of efficiency, which reaches its lowest level of 12.2% at a condensation pressure of 9 bar.
5.7 Control strategies in the combined system when the ambient
temperature varies
Over the course of the year, the ambient air temperature varies considerably. For instance, the
average air temperature in the UK might range between 5 to 15 oC, but it can also drop to below
zero on some winter days. The variation in ambient temperature is one of the main factors that
affects the performance of any air-sourced heat pump system, as shown in the results above. It
is therefore essential to propose and investigate some control strategies that can tackle such
variation. These are discussed in the following sub-sections.
5.7.1 First control strategy
Generally, for air sourced heat pump systems, as the ambient temperature drops, the thermal
energy available for extraction declines. Thus, to improve heat extraction when the air
3 4 5 6 7 8 910
15
20
25
30
35
40
45
50
ORC condenser pressure in bar
OR
C s
eco
nd
la
w e
ffic
ien
cy
Figure 5.37: Second law of efficiency for the ORC cycle under variable ORC
condensation pressure.
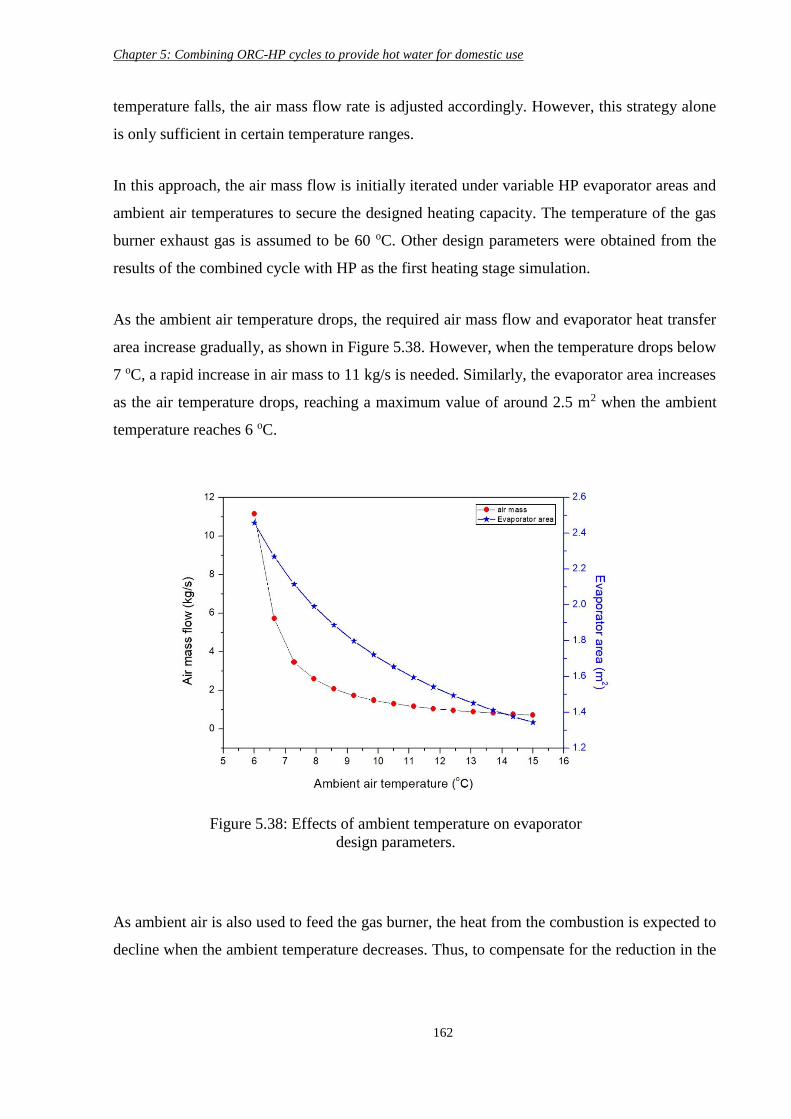
Chapter 5: Combining ORC-HP cycles to provide hot water for domestic use
162
temperature falls, the air mass flow rate is adjusted accordingly. However, this strategy alone
is only sufficient in certain temperature ranges.
In this approach, the air mass flow is initially iterated under variable HP evaporator areas and
ambient air temperatures to secure the designed heating capacity. The temperature of the gas
burner exhaust gas is assumed to be 60 oC. Other design parameters were obtained from the
results of the combined cycle with HP as the first heating stage simulation.
As the ambient air temperature drops, the required air mass flow and evaporator heat transfer
area increase gradually, as shown in Figure 5.38. However, when the temperature drops below
7 oC, a rapid increase in air mass to 11 kg/s is needed. Similarly, the evaporator area increases
as the air temperature drops, reaching a maximum value of around 2.5 m2 when the ambient
temperature reaches 6 oC.
As ambient air is also used to feed the gas burner, the heat from the combustion is expected to
decline when the ambient temperature decreases. Thus, to compensate for the reduction in the
Figure 5.38: Effects of ambient temperature on evaporator
design parameters.
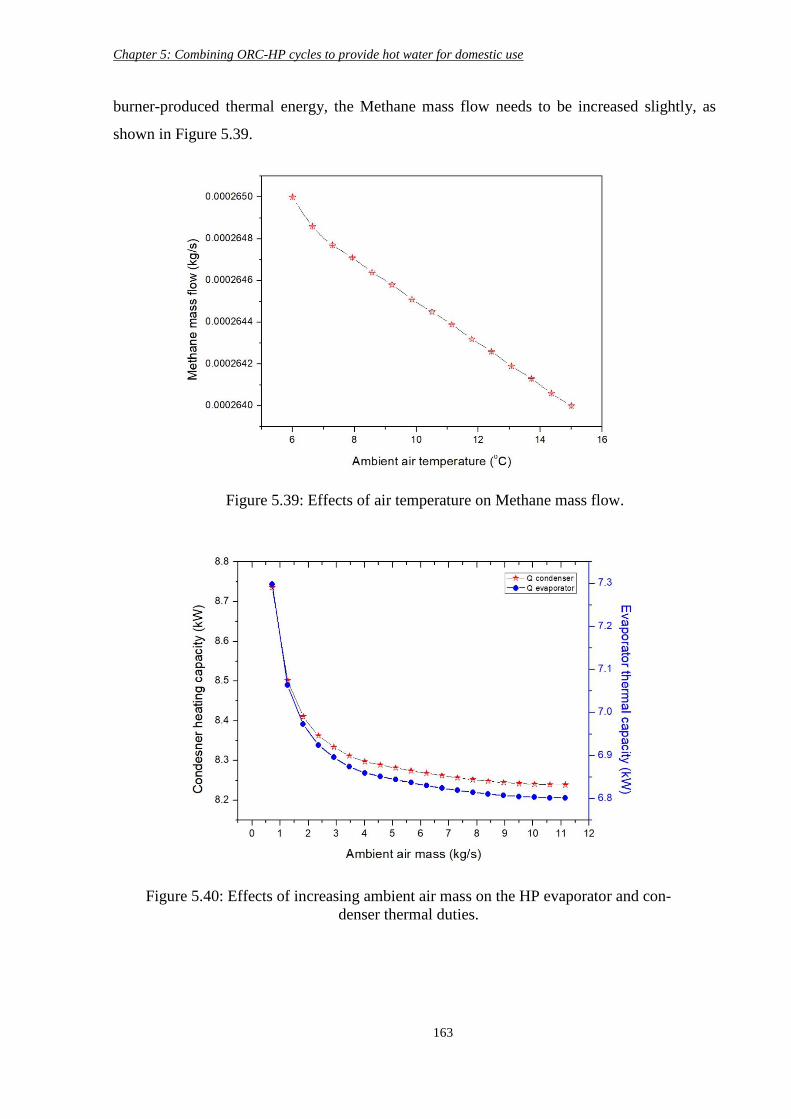
Chapter 5: Combining ORC-HP cycles to provide hot water for domestic use
163
burner-produced thermal energy, the Methane mass flow needs to be increased slightly, as
shown in Figure 5.39.
Figure 5.40: Effects of increasing ambient air mass on the HP evaporator and con-
denser thermal duties.
Figure 5.39: Effects of air temperature on Methane mass flow.
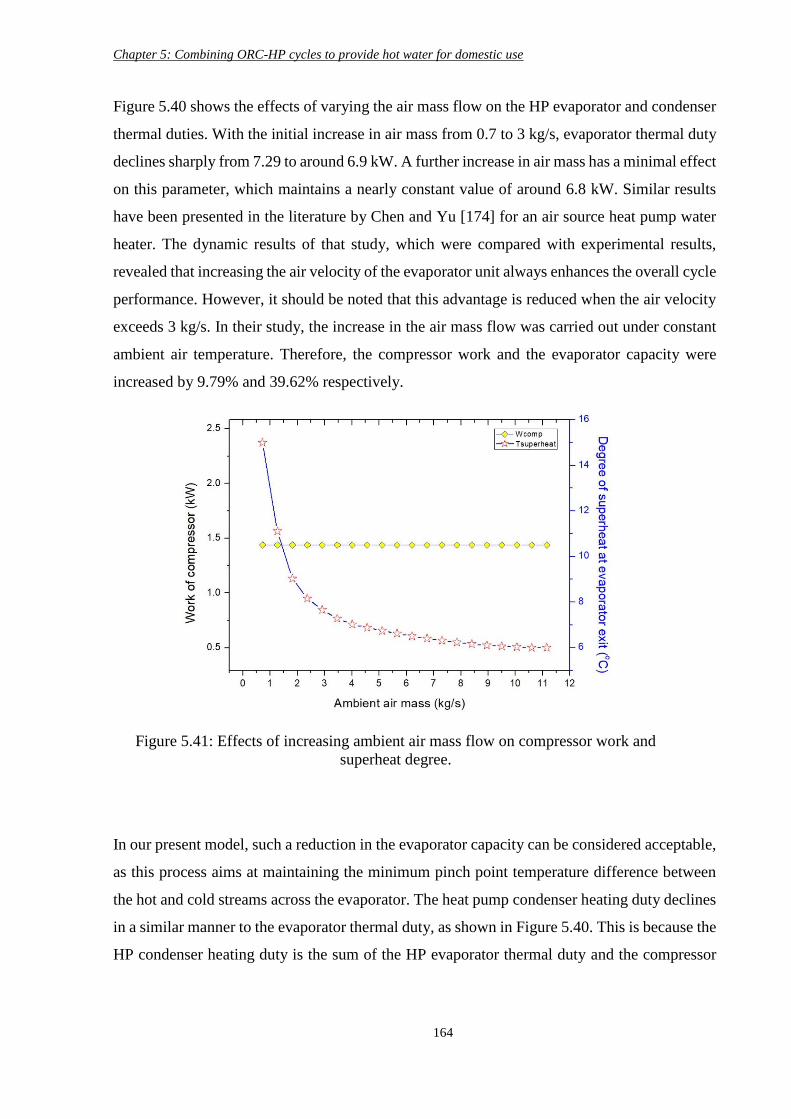
Chapter 5: Combining ORC-HP cycles to provide hot water for domestic use
164
Figure 5.40 shows the effects of varying the air mass flow on the HP evaporator and condenser
thermal duties. With the initial increase in air mass from 0.7 to 3 kg/s, evaporator thermal duty
declines sharply from 7.29 to around 6.9 kW. A further increase in air mass has a minimal effect
on this parameter, which maintains a nearly constant value of around 6.8 kW. Similar results
have been presented in the literature by Chen and Yu [174] for an air source heat pump water
heater. The dynamic results of that study, which were compared with experimental results,
revealed that increasing the air velocity of the evaporator unit always enhances the overall cycle
performance. However, it should be noted that this advantage is reduced when the air velocity
exceeds 3 kg/s. In their study, the increase in the air mass flow was carried out under constant
ambient air temperature. Therefore, the compressor work and the evaporator capacity were
increased by 9.79% and 39.62% respectively.
In our present model, such a reduction in the evaporator capacity can be considered acceptable,
as this process aims at maintaining the minimum pinch point temperature difference between
the hot and cold streams across the evaporator. The heat pump condenser heating duty declines
in a similar manner to the evaporator thermal duty, as shown in Figure 5.40. This is because the
HP condenser heating duty is the sum of the HP evaporator thermal duty and the compressor
Figure 5.41: Effects of increasing ambient air mass flow on compressor work and
superheat degree.
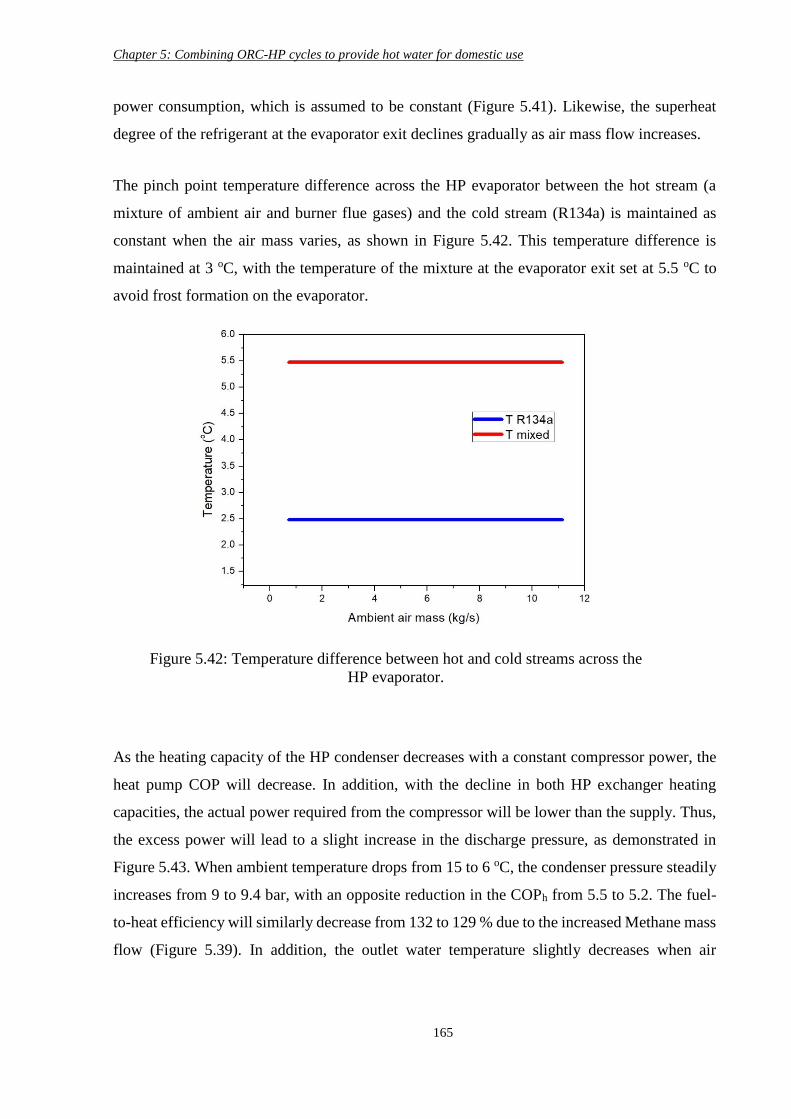
Chapter 5: Combining ORC-HP cycles to provide hot water for domestic use
165
power consumption, which is assumed to be constant (Figure 5.41). Likewise, the superheat
degree of the refrigerant at the evaporator exit declines gradually as air mass flow increases.
The pinch point temperature difference across the HP evaporator between the hot stream (a
mixture of ambient air and burner flue gases) and the cold stream (R134a) is maintained as
constant when the air mass varies, as shown in Figure 5.42. This temperature difference is
maintained at 3 oC, with the temperature of the mixture at the evaporator exit set at 5.5 oC to
avoid frost formation on the evaporator.
As the heating capacity of the HP condenser decreases with a constant compressor power, the
heat pump COP will decrease. In addition, with the decline in both HP exchanger heating
capacities, the actual power required from the compressor will be lower than the supply. Thus,
the excess power will lead to a slight increase in the discharge pressure, as demonstrated in
Figure 5.43. When ambient temperature drops from 15 to 6 oC, the condenser pressure steadily
increases from 9 to 9.4 bar, with an opposite reduction in the COPh from 5.5 to 5.2. The fuel-
to-heat efficiency will similarly decrease from 132 to 129 % due to the increased Methane mass
flow (Figure 5.39). In addition, the outlet water temperature slightly decreases when air
Figure 5.42: Temperature difference between hot and cold streams across the
HP evaporator.
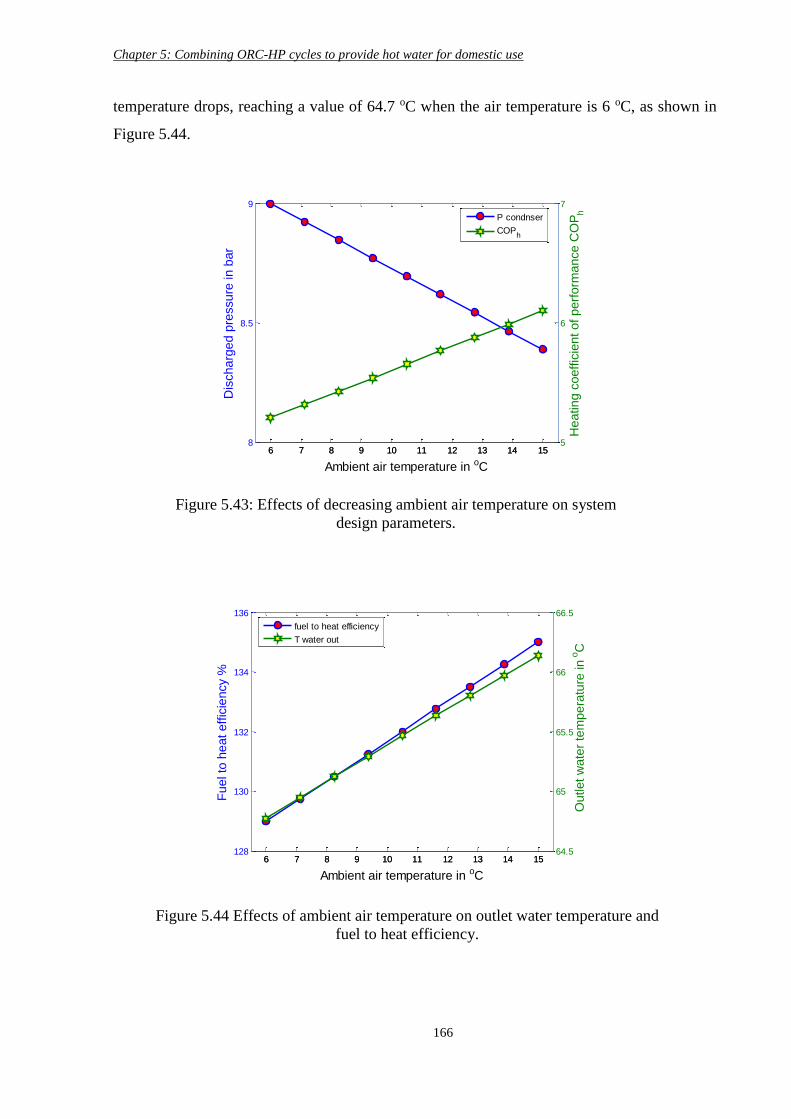
Chapter 5: Combining ORC-HP cycles to provide hot water for domestic use
166
temperature drops, reaching a value of 64.7 oC when the air temperature is 6 oC, as shown in
Figure 5.44.
Figure 5.43: Effects of decreasing ambient air temperature on system
design parameters.
6 7 8 9 10 11 12 13 14 158
8.5
9
Dis
charg
ed p
ressure
in b
ar
Ambient air temperature in oC
6 7 8 9 10 11 12 13 14 155
6
7
Heating c
oeffic
ient of perf
orm
ance C
OP
h
P condnser
COPh
Figure 5.44 Effects of ambient air temperature on outlet water temperature and
fuel to heat efficiency.
6 7 8 9 10 11 12 13 14 15128
130
132
134
136
Fue
l to
he
at
eff
icie
ncy %
Ambient air temperature in oC
6 7 8 9 10 11 12 13 14 1564.5
65
65.5
66
66.5
Ou
tlet
wa
ter
tem
pe
ratu
re in o
C
fuel to heat efficiency
T water out
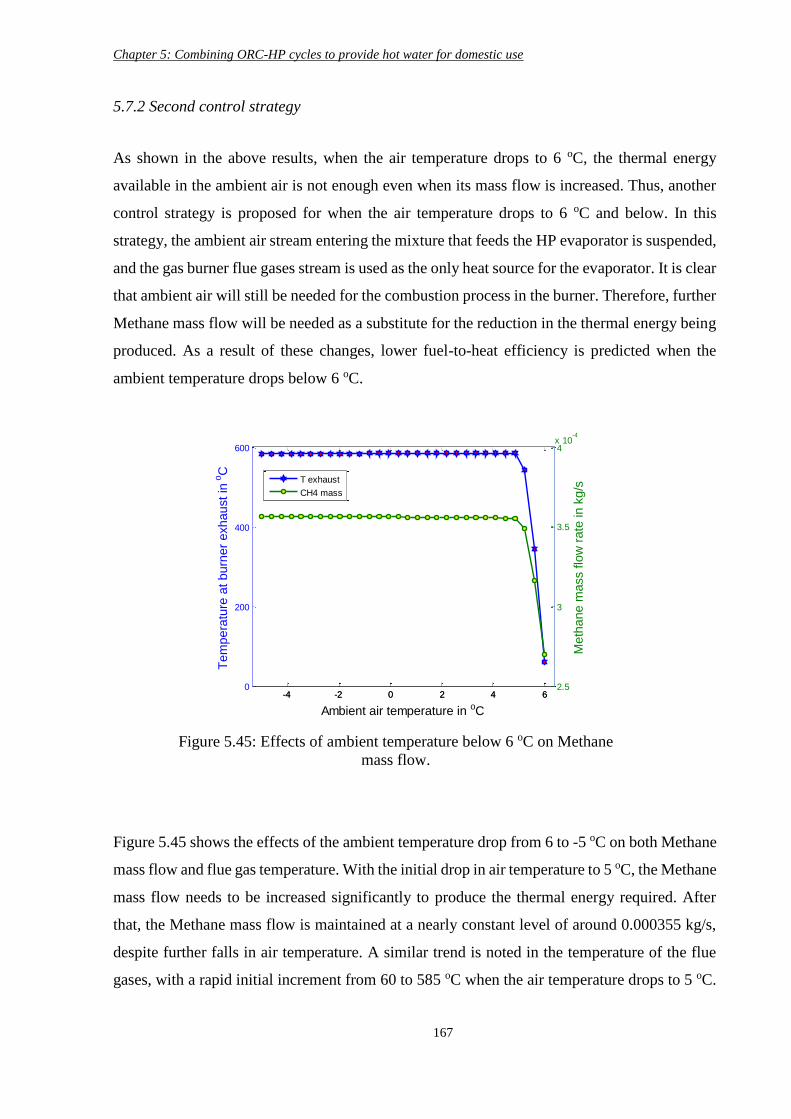
Chapter 5: Combining ORC-HP cycles to provide hot water for domestic use
167
5.7.2 Second control strategy
As shown in the above results, when the air temperature drops to 6 oC, the thermal energy
available in the ambient air is not enough even when its mass flow is increased. Thus, another
control strategy is proposed for when the air temperature drops to 6 oC and below. In this
strategy, the ambient air stream entering the mixture that feeds the HP evaporator is suspended,
and the gas burner flue gases stream is used as the only heat source for the evaporator. It is clear
that ambient air will still be needed for the combustion process in the burner. Therefore, further
Methane mass flow will be needed as a substitute for the reduction in the thermal energy being
produced. As a result of these changes, lower fuel-to-heat efficiency is predicted when the
ambient temperature drops below 6 oC.
Figure 5.45 shows the effects of the ambient temperature drop from 6 to -5 oC on both Methane
mass flow and flue gas temperature. With the initial drop in air temperature to 5 oC, the Methane
mass flow needs to be increased significantly to produce the thermal energy required. After
that, the Methane mass flow is maintained at a nearly constant level of around 0.000355 kg/s,
despite further falls in air temperature. A similar trend is noted in the temperature of the flue
gases, with a rapid initial increment from 60 to 585 oC when the air temperature drops to 5 oC.
Figure 5.45: Effects of ambient temperature below 6 oC on Methane
mass flow.
-4 -2 0 2 4 60
200
400
600
Tem
pe
ratu
re a
t b
urn
er
exh
au
st in
oC
Ambient air temperature in oC
-4 -2 0 2 4 62.5
3
3.5
4x 10
-4
Me
tha
ne
mass flo
w r
ate
in
kg
/s
T exhaust
CH4 mass
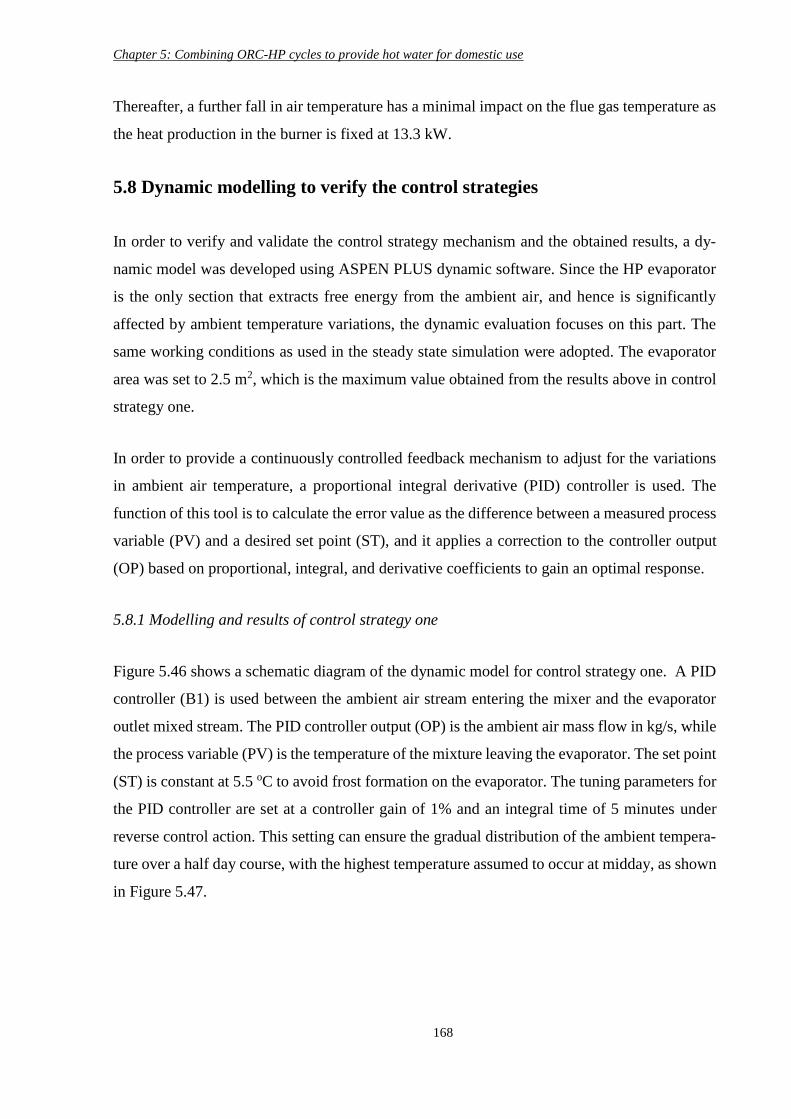
Chapter 5: Combining ORC-HP cycles to provide hot water for domestic use
168
Thereafter, a further fall in air temperature has a minimal impact on the flue gas temperature as
the heat production in the burner is fixed at 13.3 kW.
5.8 Dynamic modelling to verify the control strategies
In order to verify and validate the control strategy mechanism and the obtained results, a dy-
namic model was developed using ASPEN PLUS dynamic software. Since the HP evaporator
is the only section that extracts free energy from the ambient air, and hence is significantly
affected by ambient temperature variations, the dynamic evaluation focuses on this part. The
same working conditions as used in the steady state simulation were adopted. The evaporator
area was set to 2.5 m2, which is the maximum value obtained from the results above in control
strategy one.
In order to provide a continuously controlled feedback mechanism to adjust for the variations
in ambient air temperature, a proportional integral derivative (PID) controller is used. The
function of this tool is to calculate the error value as the difference between a measured process
variable (PV) and a desired set point (ST), and it applies a correction to the controller output
(OP) based on proportional, integral, and derivative coefficients to gain an optimal response.
5.8.1 Modelling and results of control strategy one
Figure 5.46 shows a schematic diagram of the dynamic model for control strategy one. A PID
controller (B1) is used between the ambient air stream entering the mixer and the evaporator
outlet mixed stream. The PID controller output (OP) is the ambient air mass flow in kg/s, while
the process variable (PV) is the temperature of the mixture leaving the evaporator. The set point
(ST) is constant at 5.5 oC to avoid frost formation on the evaporator. The tuning parameters for
the PID controller are set at a controller gain of 1% and an integral time of 5 minutes under
reverse control action. This setting can ensure the gradual distribution of the ambient tempera-
ture over a half day course, with the highest temperature assumed to occur at midday, as shown
in Figure 5.47.
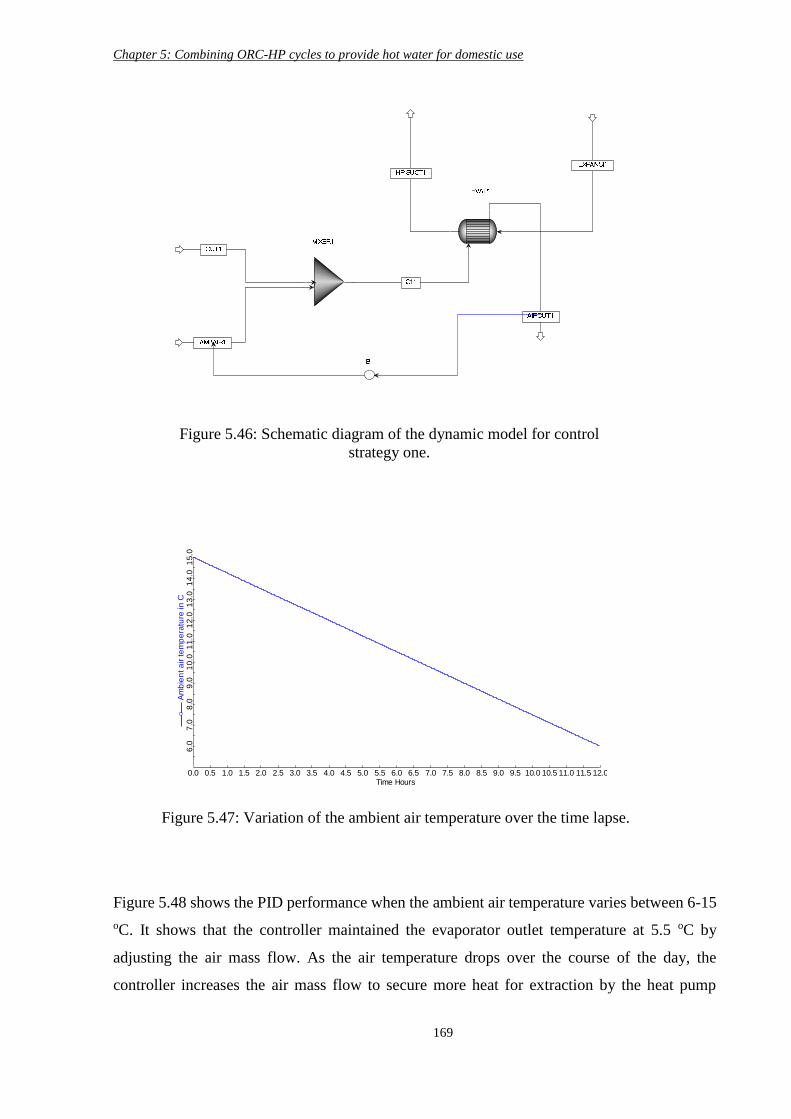
Chapter 5: Combining ORC-HP cycles to provide hot water for domestic use
169
Figure 5.48 shows the PID performance when the ambient air temperature varies between 6-15
oC. It shows that the controller maintained the evaporator outlet temperature at 5.5 oC by
adjusting the air mass flow. As the air temperature drops over the course of the day, the
controller increases the air mass flow to secure more heat for extraction by the heat pump
Figure 5.46: Schematic diagram of the dynamic model for control
strategy one.
Figure 5.47: Variation of the ambient air temperature over the time lapse.
Time Hours
Am
bie
nt a
ir te
mp
era
ture
in C
0.0 0.5 1.0 1.5 2.0 2.5 3.0 3.5 4.0 4.5 5.0 5.5 6.0 6.5 7.0 7.5 8.0 8.5 9.0 9.5 10.0 10.5 11.0 11.5 12.0
6.0
7.0
8.0
9.0
10.0
11.0
12.0
13.0
14.0
15.0
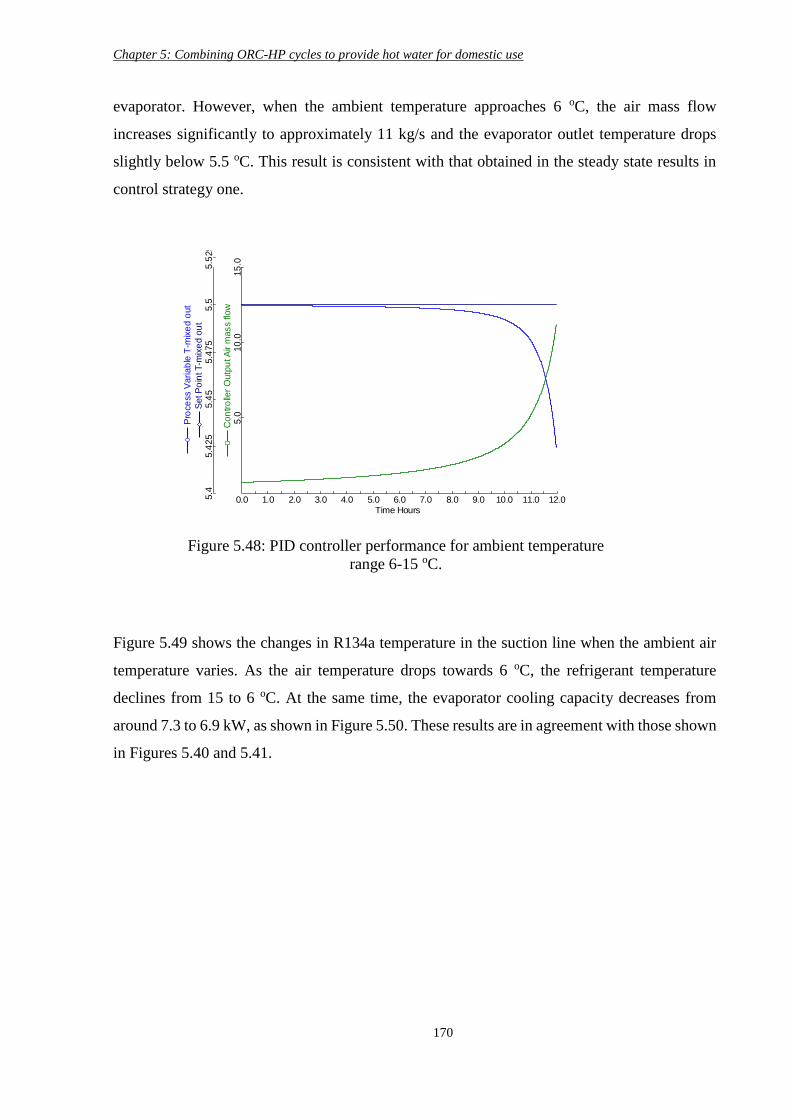
Chapter 5: Combining ORC-HP cycles to provide hot water for domestic use
170
evaporator. However, when the ambient temperature approaches 6 oC, the air mass flow
increases significantly to approximately 11 kg/s and the evaporator outlet temperature drops
slightly below 5.5 oC. This result is consistent with that obtained in the steady state results in
control strategy one.
Figure 5.49 shows the changes in R134a temperature in the suction line when the ambient air
temperature varies. As the air temperature drops towards 6 oC, the refrigerant temperature
declines from 15 to 6 oC. At the same time, the evaporator cooling capacity decreases from
around 7.3 to 6.9 kW, as shown in Figure 5.50. These results are in agreement with those shown
in Figures 5.40 and 5.41.
Time Hours
Set P
oin
t T-m
ixe
d o
ut
Con
tro
ller
Outp
ut A
ir m
ass flo
w
Pro
ce
ss V
ariab
le T
-mix
ed o
ut
0.0 1.0 2.0 3.0 4.0 5.0 6.0 7.0 8.0 9.0 10.0 11.0 12.0
5.0
10
.015
.0
5.4
5.4
25
5.4
55.4
75
5.5
5.5
25
Figure 5.48: PID controller performance for ambient temperature
range 6-15 oC.
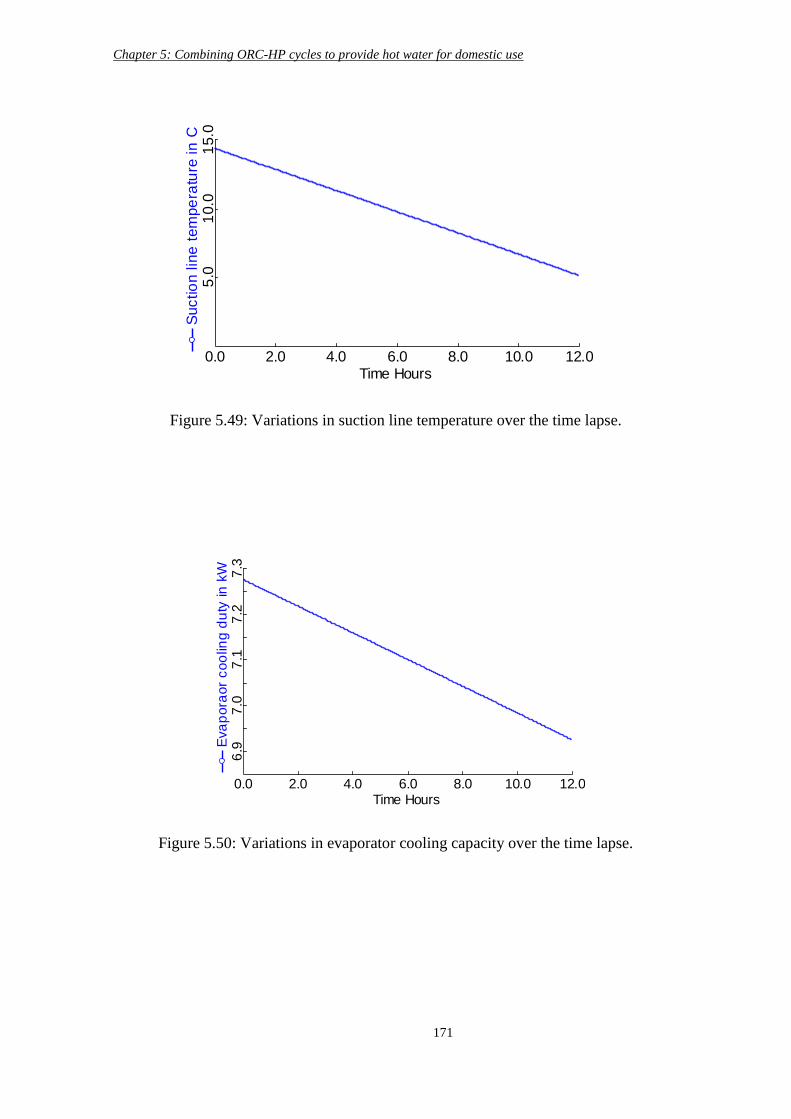
Chapter 5: Combining ORC-HP cycles to provide hot water for domestic use
171
Time Hours
Suctio
n lin
e t
em
pe
ratu
re in
C
0.0 2.0 4.0 6.0 8.0 10.0 12.0
5.0
10.0
15.0
Figure 5.49: Variations in suction line temperature over the time lapse.
Time Hours
Eva
pora
or
coo
ling
du
ty in
kW
0.0 2.0 4.0 6.0 8.0 10.0 12.0
6.9
7.0
7.1
7.2
7.3
Figure 5.50: Variations in evaporator cooling capacity over the time lapse.
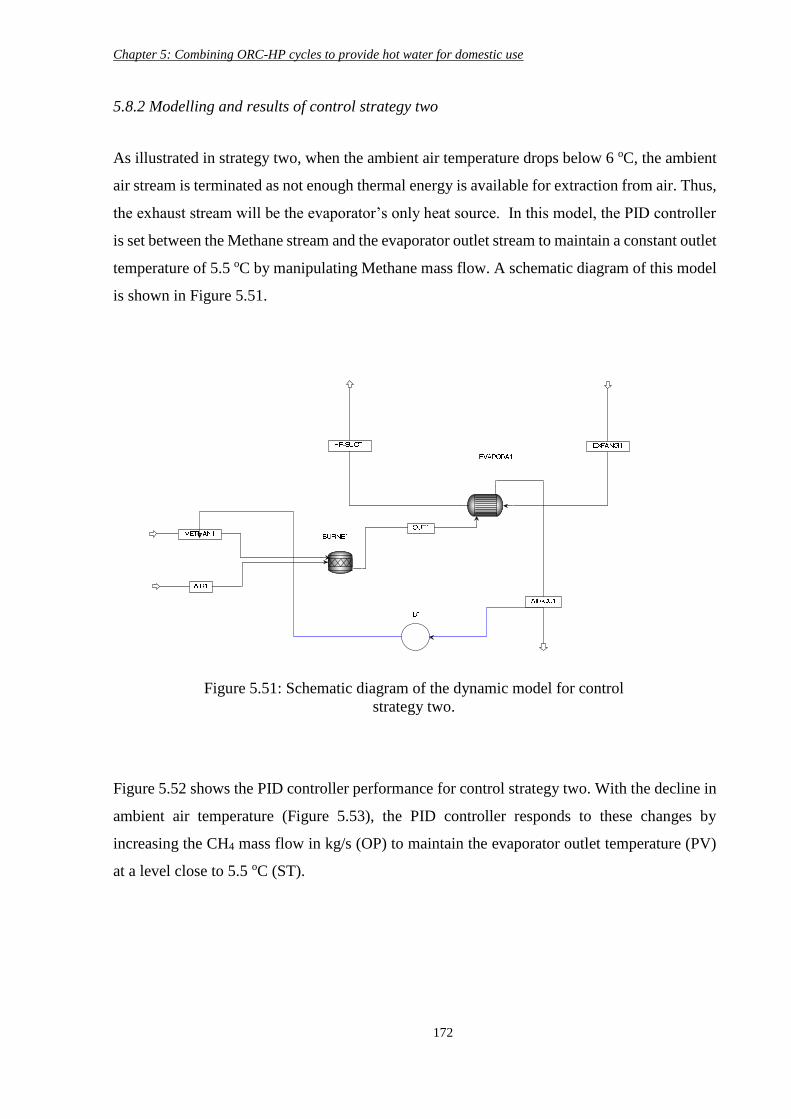
Chapter 5: Combining ORC-HP cycles to provide hot water for domestic use
172
5.8.2 Modelling and results of control strategy two
As illustrated in strategy two, when the ambient air temperature drops below 6 oC, the ambient
air stream is terminated as not enough thermal energy is available for extraction from air. Thus,
the exhaust stream will be the evaporator’s only heat source. In this model, the PID controller
is set between the Methane stream and the evaporator outlet stream to maintain a constant outlet
temperature of 5.5 oC by manipulating Methane mass flow. A schematic diagram of this model
is shown in Figure 5.51.
Figure 5.52 shows the PID controller performance for control strategy two. With the decline in
ambient air temperature (Figure 5.53), the PID controller responds to these changes by
increasing the CH4 mass flow in kg/s (OP) to maintain the evaporator outlet temperature (PV)
at a level close to 5.5 oC (ST).
Figure 5.51: Schematic diagram of the dynamic model for control
strategy two.
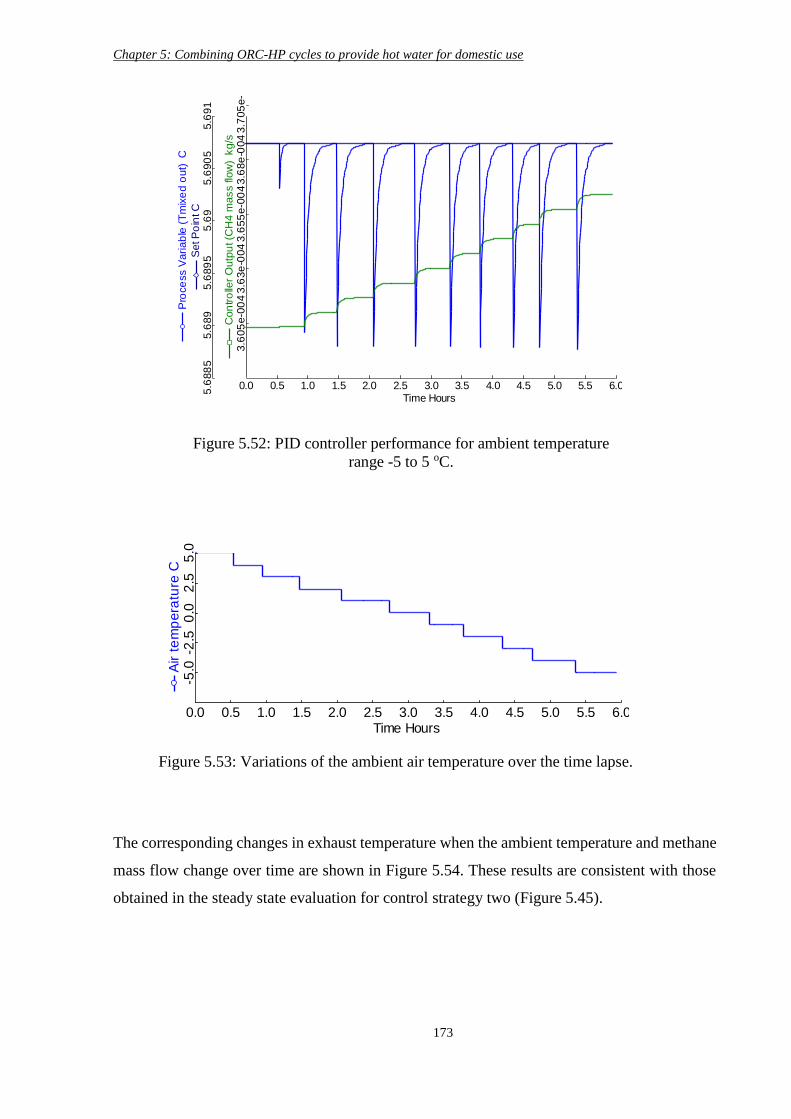
Chapter 5: Combining ORC-HP cycles to provide hot water for domestic use
173
The corresponding changes in exhaust temperature when the ambient temperature and methane
mass flow change over time are shown in Figure 5.54. These results are consistent with those
obtained in the steady state evaluation for control strategy two (Figure 5.45).
Time Hours
Se
t P
oin
t C
Co
ntro
ller
Ou
tpu
t (C
H4
ma
ss flo
w)
kg
/s
Pro
ce
ss V
aria
ble
(T
mix
ed
ou
t) C
0.0 0.5 1.0 1.5 2.0 2.5 3.0 3.5 4.0 4.5 5.0 5.5 6.0
3.6
05
e-0
04
3.6
3e
-00
43
.65
5e
-00
43
.68
e-0
04
3.7
05
e-0
04
5.6
88
55
.68
95
.68
95
5.6
95
.69
05
5.6
91
Figure 5.52: PID controller performance for ambient temperature
range -5 to 5 oC.
Time Hours
Air t
em
pera
ture
C
0.0 0.5 1.0 1.5 2.0 2.5 3.0 3.5 4.0 4.5 5.0 5.5 6.0
-5.0
-2.5
0.0
2.5
5.0
Figure 5.53: Variations of the ambient air temperature over the time lapse.
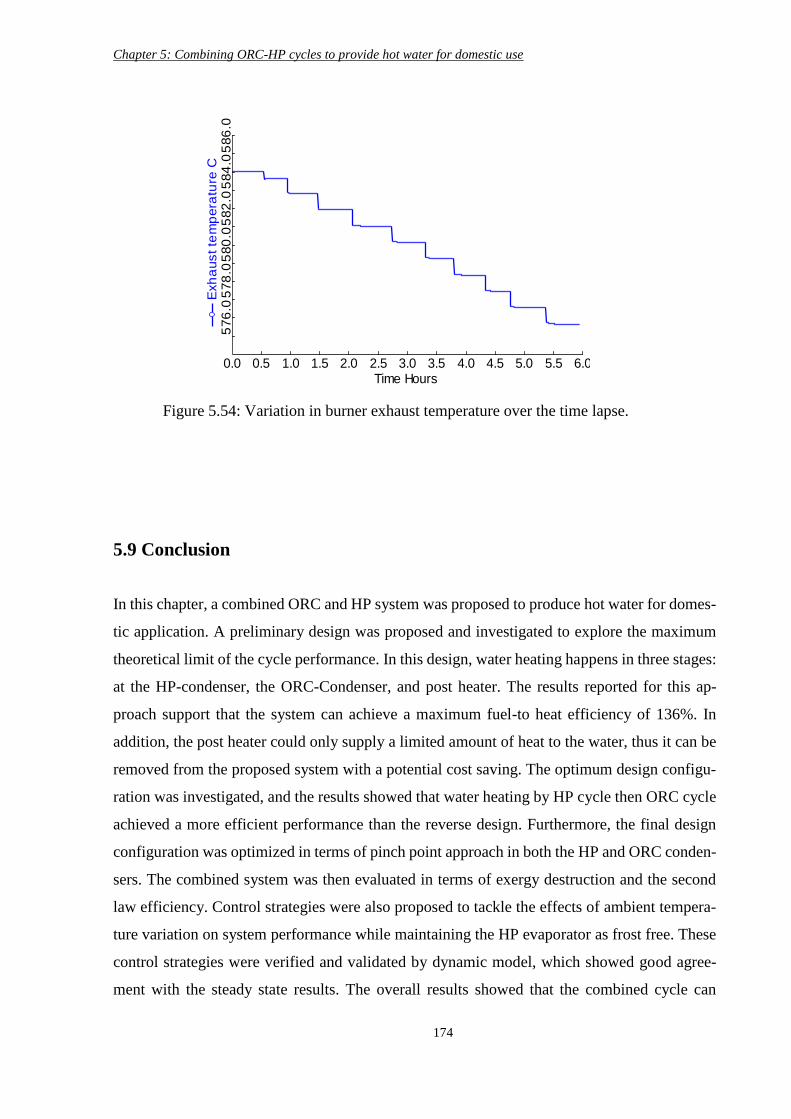
Chapter 5: Combining ORC-HP cycles to provide hot water for domestic use
174
5.9 Conclusion
In this chapter, a combined ORC and HP system was proposed to produce hot water for domes-
tic application. A preliminary design was proposed and investigated to explore the maximum
theoretical limit of the cycle performance. In this design, water heating happens in three stages:
at the HP-condenser, the ORC-Condenser, and post heater. The results reported for this ap-
proach support that the system can achieve a maximum fuel-to heat efficiency of 136%. In
addition, the post heater could only supply a limited amount of heat to the water, thus it can be
removed from the proposed system with a potential cost saving. The optimum design configu-
ration was investigated, and the results showed that water heating by HP cycle then ORC cycle
achieved a more efficient performance than the reverse design. Furthermore, the final design
configuration was optimized in terms of pinch point approach in both the HP and ORC conden-
sers. The combined system was then evaluated in terms of exergy destruction and the second
law efficiency. Control strategies were also proposed to tackle the effects of ambient tempera-
ture variation on system performance while maintaining the HP evaporator as frost free. These
control strategies were verified and validated by dynamic model, which showed good agree-
ment with the steady state results. The overall results showed that the combined cycle can
Time Hours
Exh
aust te
mp
era
ture
C
0.0 0.5 1.0 1.5 2.0 2.5 3.0 3.5 4.0 4.5 5.0 5.5 6.0
576
.05
78
.05
80
.05
82
.05
84
.05
86
.0
Figure 5.54: Variation in burner exhaust temperature over the time lapse.

Chapter 5: Combining ORC-HP cycles to provide hot water for domestic use
175
achieve a fuel to heat efficiency of around 129% for domestic hot water applications. Such
efficiency is competitive with the currently available heating technologies, such as Combi boil-
ers, which have an efficiency of around 90%.
Chapter 6 : Utilizing the wasted heat from a data centre to cool and heat applications via the combined ORC-HP
system
176
Chapter 6 Utilizing the wasted heat from a data centre to cool and
heat applications via the combined ORC-HP system
6.1 Introduction
Data centres are a pivotal facility of modern life that are expected to expand in numbers over
the coming years. However, the electricity consumption by these facilities is also expected to
rise at a rate of 20% per annum. Currently, it is estimated that 1.2-1.5% of all electricity being
produced is utilized by DCs worldwide [22]. Electricity is mainly used in the operation of IT
servers and to cool equipment due to the high heat flux generated as a by-product. The cooling
process can consume around 40% of the total electricity supplied [175]. The wasted thermal
energy from DC rooms has the potential to be recovered using various technologies such as
organic Rankine cycle (ORC), heat pump (HP), combined heat and power cycle (CHP), absorp-
tion refrigeration, thermosyphon, and combinations between them. The combined ORC-HP cy-
cle investigated in previous chapter showed the potential for efficient waste heat recovery from
gas burner flue gases and the ORC condenser. However, the results also showed that the system
performance fluctuates with ambient temperature changes. The prior literature supports that the
rejected heat from DCs is higher than the air or ground temperatures currently used as heat
sources for modern heat pump systems [22]. In this chapter, a combined system is designed to
provide a cooling effect and the recovered wasted heat is utilised in hot water supply or central
heating.
6.2 Thermodynamic concept
A schematic diagram of the proposed system is shown in Figure 6.1. The gas driven ORC cycle
provides the required mechanical work to run the vapour compression heat pump cycle. The
HP evaporator absorbs the heat from DC room to provide a cooling effect. The waste heat
rejected by both cycle condensers is used to heat water for central heating. The working condi-
tions and design parameters of a small DC were taken from an experimental study by Zhou, F.
et al. [175]. The maximum cooling load is 12 kW, to keep the DC indoor temperature between
18-25 oC in compliance with the regulations applied in most countries. In this chapter, to
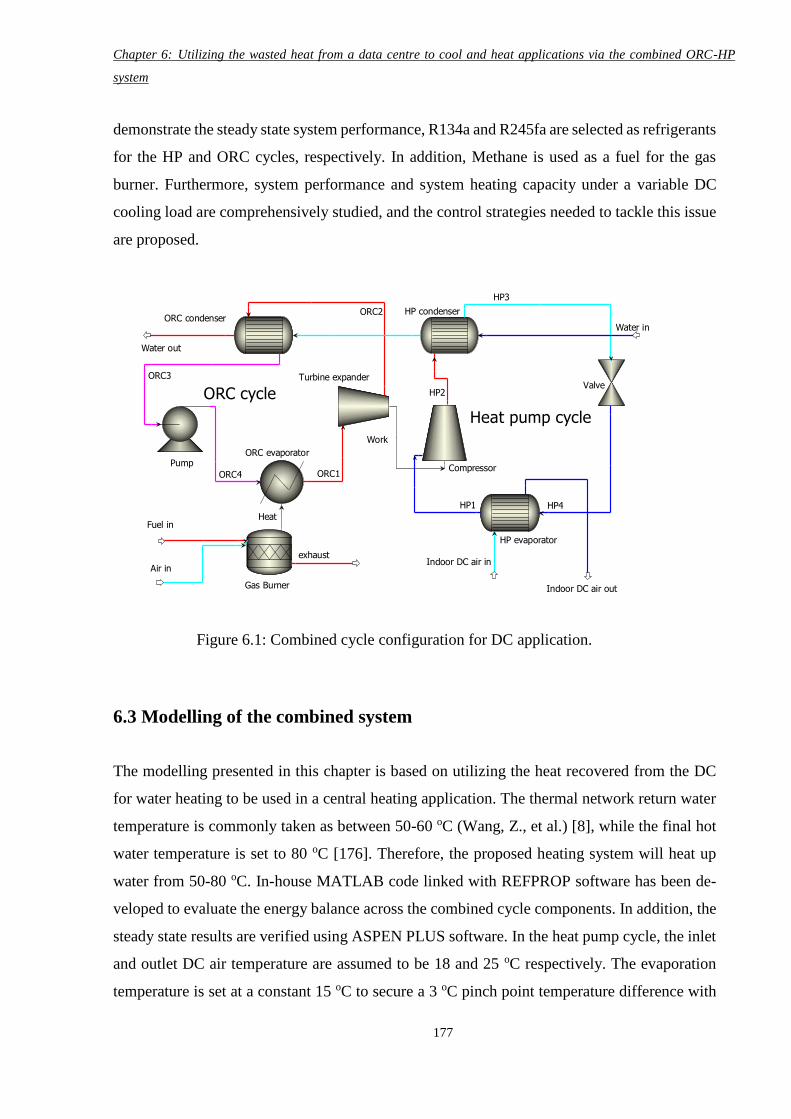
Chapter 6: Utilizing the wasted heat from a data centre to cool and heat applications via the combined ORC-HP
system
177
demonstrate the steady state system performance, R134a and R245fa are selected as refrigerants
for the HP and ORC cycles, respectively. In addition, Methane is used as a fuel for the gas
burner. Furthermore, system performance and system heating capacity under a variable DC
cooling load are comprehensively studied, and the control strategies needed to tackle this issue
are proposed.
6.3 Modelling of the combined system
The modelling presented in this chapter is based on utilizing the heat recovered from the DC
for water heating to be used in a central heating application. The thermal network return water
temperature is commonly taken as between 50-60 oC (Wang, Z., et al.) [8], while the final hot
water temperature is set to 80 oC [176]. Therefore, the proposed heating system will heat up
water from 50-80 oC. In-house MATLAB code linked with REFPROP software has been de-
veloped to evaluate the energy balance across the combined cycle components. In addition, the
steady state results are verified using ASPEN PLUS software. In the heat pump cycle, the inlet
and outlet DC air temperature are assumed to be 18 and 25 oC respectively. The evaporation
temperature is set at a constant 15 oC to secure a 3 oC pinch point temperature difference with
Heat pump cycle
ORC cycle
HP evaporator
HP condenser
Gas Burner
ORC evaporator
ORC condenser
Pump
Turbine expander
Compressor
Valve
Water in
Water out
HP1
HP2
HP3
HP4
Indoor DC air in
ORC1
ORC2
ORC3
ORC4
Indoor DC air out
Fuel in
exhaust
Heat
Work
Air in
Figure 6.1: Combined cycle configuration for DC application.
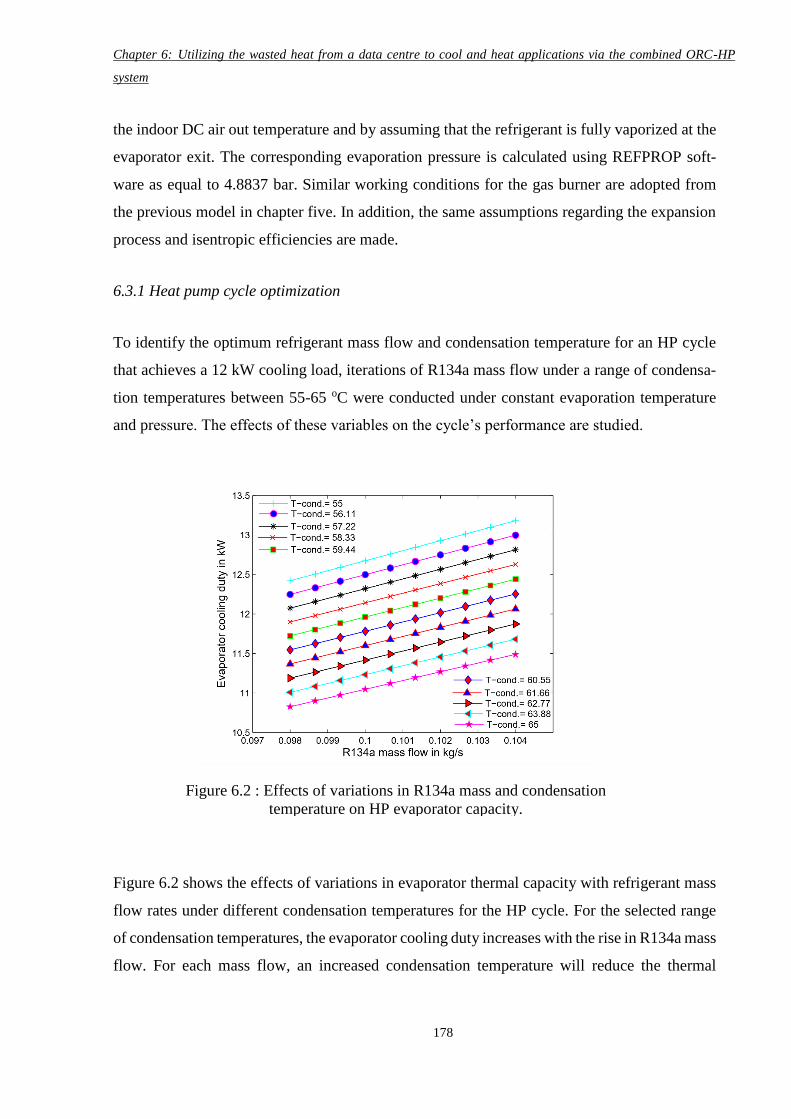
Chapter 6: Utilizing the wasted heat from a data centre to cool and heat applications via the combined ORC-HP
system
178
the indoor DC air out temperature and by assuming that the refrigerant is fully vaporized at the
evaporator exit. The corresponding evaporation pressure is calculated using REFPROP soft-
ware as equal to 4.8837 bar. Similar working conditions for the gas burner are adopted from
the previous model in chapter five. In addition, the same assumptions regarding the expansion
process and isentropic efficiencies are made.
6.3.1 Heat pump cycle optimization
To identify the optimum refrigerant mass flow and condensation temperature for an HP cycle
that achieves a 12 kW cooling load, iterations of R134a mass flow under a range of condensa-
tion temperatures between 55-65 oC were conducted under constant evaporation temperature
and pressure. The effects of these variables on the cycle’s performance are studied.
Figure 6.2 shows the effects of variations in evaporator thermal capacity with refrigerant mass
flow rates under different condensation temperatures for the HP cycle. For the selected range
of condensation temperatures, the evaporator cooling duty increases with the rise in R134a mass
flow. For each mass flow, an increased condensation temperature will reduce the thermal
Figure 6.2 : Effects of variations in R134a mass and condensation
temperature on HP evaporator capacity.
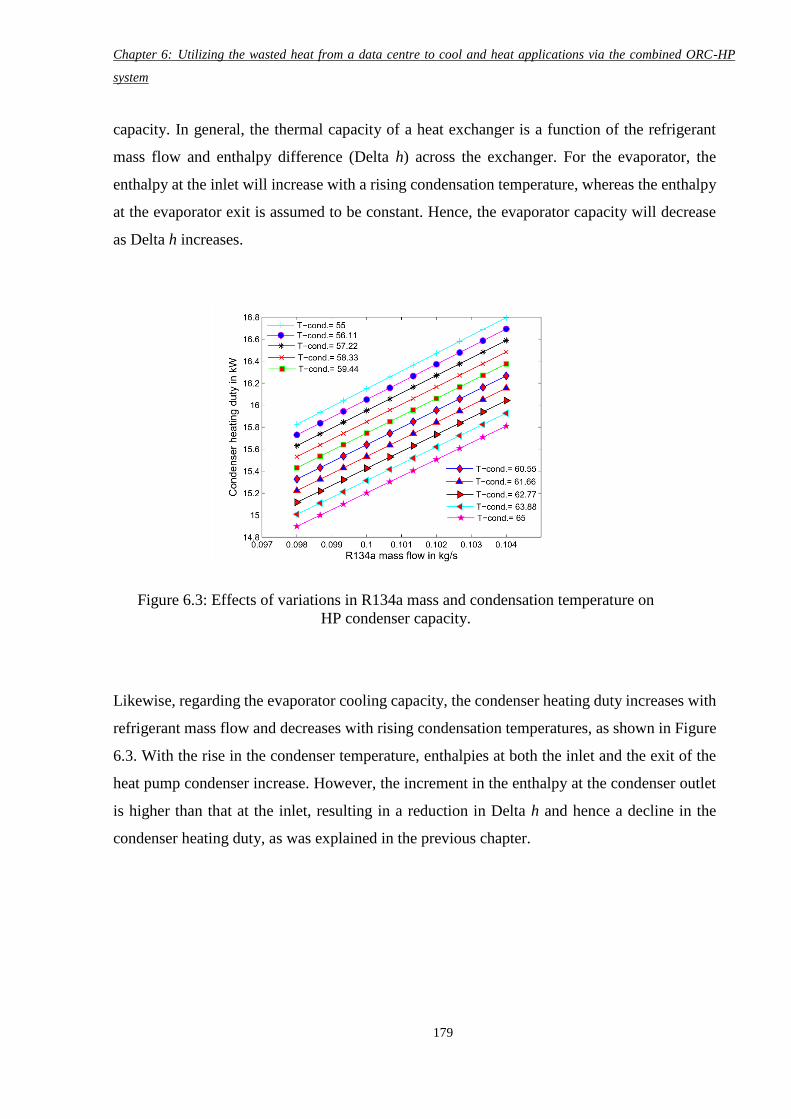
Chapter 6: Utilizing the wasted heat from a data centre to cool and heat applications via the combined ORC-HP
system
179
capacity. In general, the thermal capacity of a heat exchanger is a function of the refrigerant
mass flow and enthalpy difference (Delta h) across the exchanger. For the evaporator, the
enthalpy at the inlet will increase with a rising condensation temperature, whereas the enthalpy
at the evaporator exit is assumed to be constant. Hence, the evaporator capacity will decrease
as Delta h increases.
Likewise, regarding the evaporator cooling capacity, the condenser heating duty increases with
refrigerant mass flow and decreases with rising condensation temperatures, as shown in Figure
6.3. With the rise in the condenser temperature, enthalpies at both the inlet and the exit of the
heat pump condenser increase. However, the increment in the enthalpy at the condenser outlet
is higher than that at the inlet, resulting in a reduction in Delta h and hence a decline in the
condenser heating duty, as was explained in the previous chapter.
Figure 6.3: Effects of variations in R134a mass and condensation temperature on
HP condenser capacity.
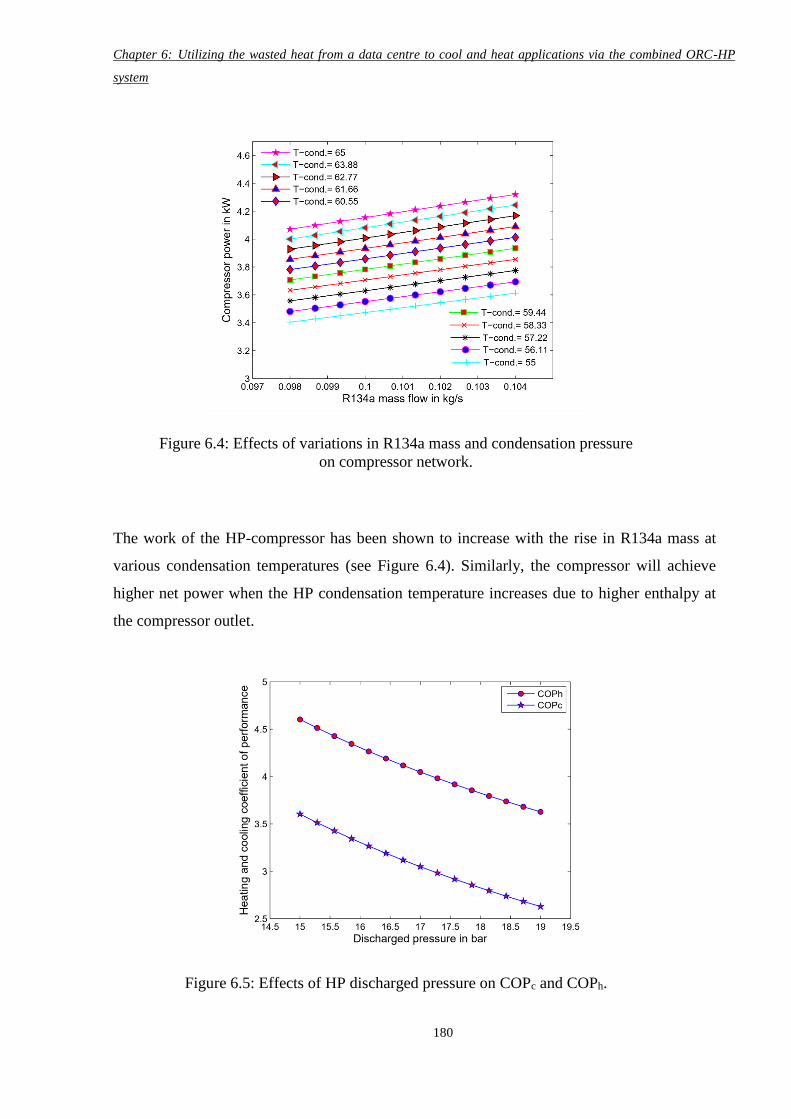
Chapter 6: Utilizing the wasted heat from a data centre to cool and heat applications via the combined ORC-HP
system
180
The work of the HP-compressor has been shown to increase with the rise in R134a mass at
various condensation temperatures (see Figure 6.4). Similarly, the compressor will achieve
higher net power when the HP condensation temperature increases due to higher enthalpy at
the compressor outlet.
Figure 6.4: Effects of variations in R134a mass and condensation pressure
on compressor network.
Figure 6.5: Effects of HP discharged pressure on COPc and COPh.
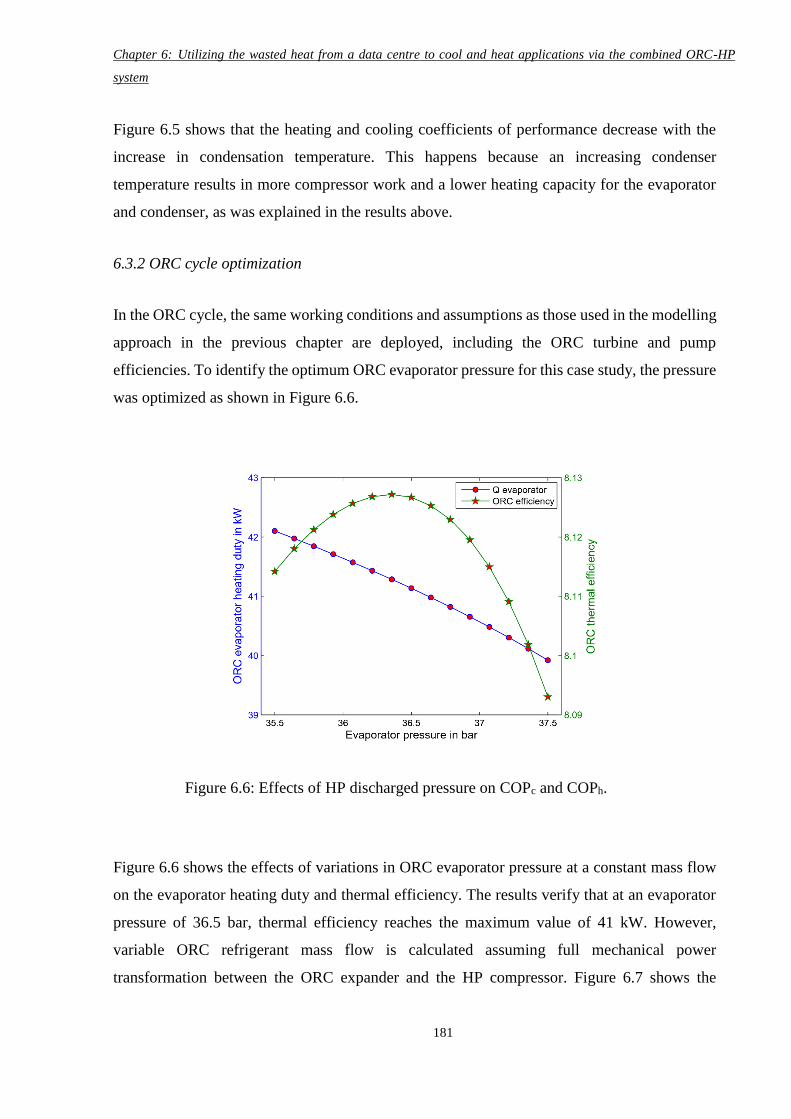
Chapter 6: Utilizing the wasted heat from a data centre to cool and heat applications via the combined ORC-HP
system
181
Figure 6.5 shows that the heating and cooling coefficients of performance decrease with the
increase in condensation temperature. This happens because an increasing condenser
temperature results in more compressor work and a lower heating capacity for the evaporator
and condenser, as was explained in the results above.
6.3.2 ORC cycle optimization
In the ORC cycle, the same working conditions and assumptions as those used in the modelling
approach in the previous chapter are deployed, including the ORC turbine and pump
efficiencies. To identify the optimum ORC evaporator pressure for this case study, the pressure
was optimized as shown in Figure 6.6.
Figure 6.6 shows the effects of variations in ORC evaporator pressure at a constant mass flow
on the evaporator heating duty and thermal efficiency. The results verify that at an evaporator
pressure of 36.5 bar, thermal efficiency reaches the maximum value of 41 kW. However,
variable ORC refrigerant mass flow is calculated assuming full mechanical power
transformation between the ORC expander and the HP compressor. Figure 6.7 shows the
Figure 6.6: Effects of HP discharged pressure on COPc and COPh.
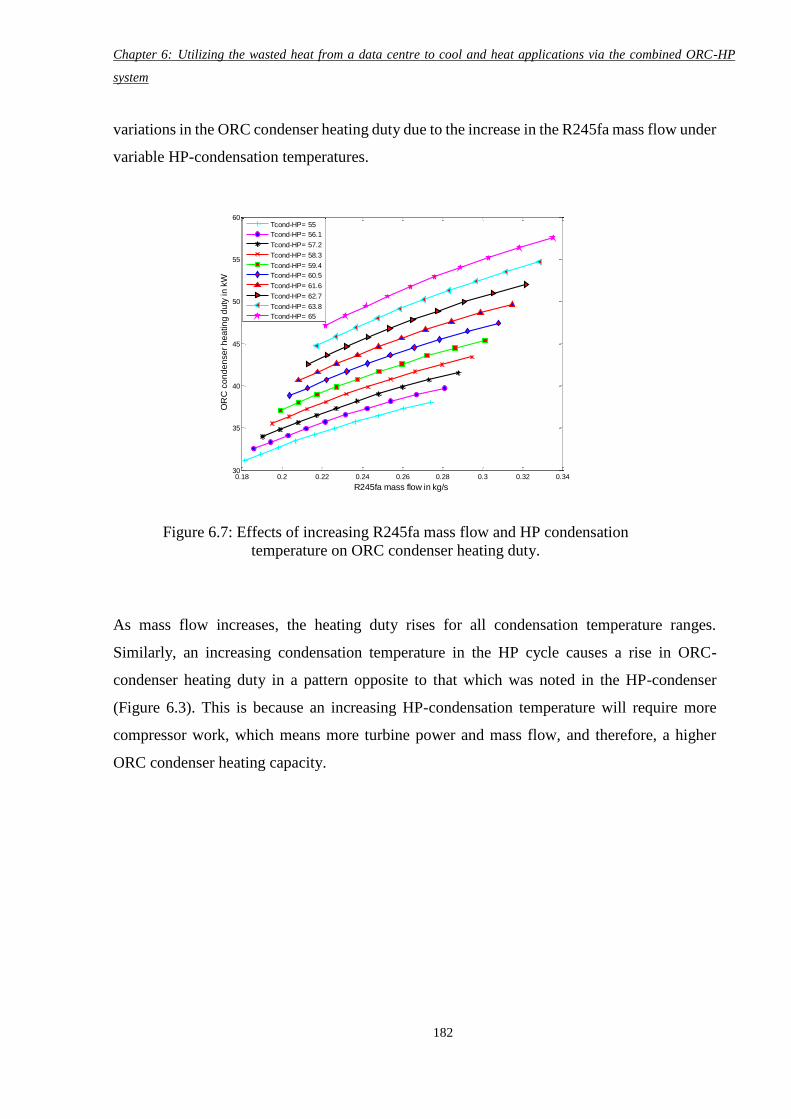
Chapter 6: Utilizing the wasted heat from a data centre to cool and heat applications via the combined ORC-HP
system
182
variations in the ORC condenser heating duty due to the increase in the R245fa mass flow under
variable HP-condensation temperatures.
As mass flow increases, the heating duty rises for all condensation temperature ranges.
Similarly, an increasing condensation temperature in the HP cycle causes a rise in ORC-
condenser heating duty in a pattern opposite to that which was noted in the HP-condenser
(Figure 6.3). This is because an increasing HP-condensation temperature will require more
compressor work, which means more turbine power and mass flow, and therefore, a higher
ORC condenser heating capacity.
Figure 6.7: Effects of increasing R245fa mass flow and HP condensation
temperature on ORC condenser heating duty.
0.18 0.2 0.22 0.24 0.26 0.28 0.3 0.32 0.3430
35
40
45
50
55
60
R245fa mass flow in kg/s
OR
C c
on
de
nse
r h
ea
tin
g d
uty
in
kW
Tcond-HP= 55
Tcond-HP= 56.1
Tcond-HP= 57.2
Tcond-HP= 58.3
Tcond-HP= 59.4
Tcond-HP= 60.5
Tcond-HP= 61.6
Tcond-HP= 62.7
Tcond-HP= 63.8
Tcond-HP= 65
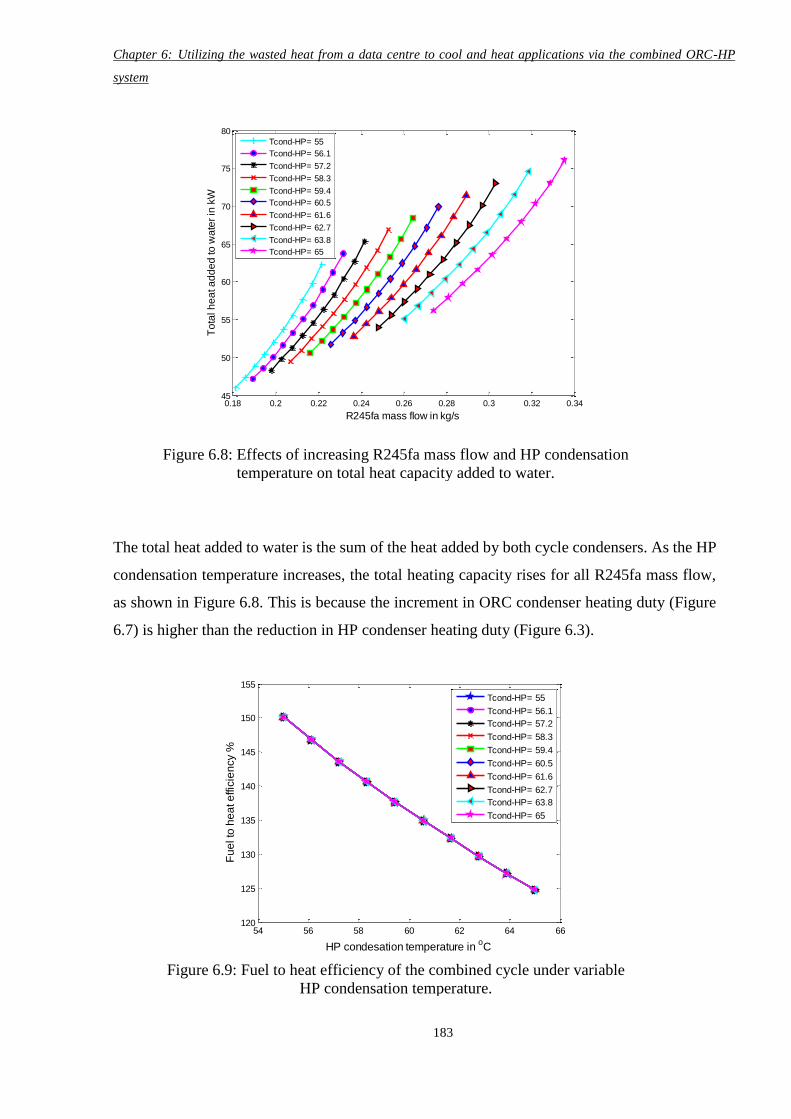
Chapter 6: Utilizing the wasted heat from a data centre to cool and heat applications via the combined ORC-HP
system
183
The total heat added to water is the sum of the heat added by both cycle condensers. As the HP
condensation temperature increases, the total heating capacity rises for all R245fa mass flow,
as shown in Figure 6.8. This is because the increment in ORC condenser heating duty (Figure
6.7) is higher than the reduction in HP condenser heating duty (Figure 6.3).
Figure 6.8: Effects of increasing R245fa mass flow and HP condensation
temperature on total heat capacity added to water.
0.18 0.2 0.22 0.24 0.26 0.28 0.3 0.32 0.3445
50
55
60
65
70
75
80
R245fa mass flow in kg/s
To
tal h
ea
t a
dd
ed
to
wa
ter
in k
W
Tcond-HP= 55
Tcond-HP= 56.1
Tcond-HP= 57.2
Tcond-HP= 58.3
Tcond-HP= 59.4
Tcond-HP= 60.5
Tcond-HP= 61.6
Tcond-HP= 62.7
Tcond-HP= 63.8
Tcond-HP= 65
Figure 6.9: Fuel to heat efficiency of the combined cycle under variable
HP condensation temperature.
54 56 58 60 62 64 66120
125
130
135
140
145
150
155
HP condesation temperature in oC
Fu
el to
he
at e
ffic
ien
cy %
Tcond-HP= 55
Tcond-HP= 56.1
Tcond-HP= 57.2
Tcond-HP= 58.3
Tcond-HP= 59.4
Tcond-HP= 60.5
Tcond-HP= 61.6
Tcond-HP= 62.7
Tcond-HP= 63.8
Tcond-HP= 65
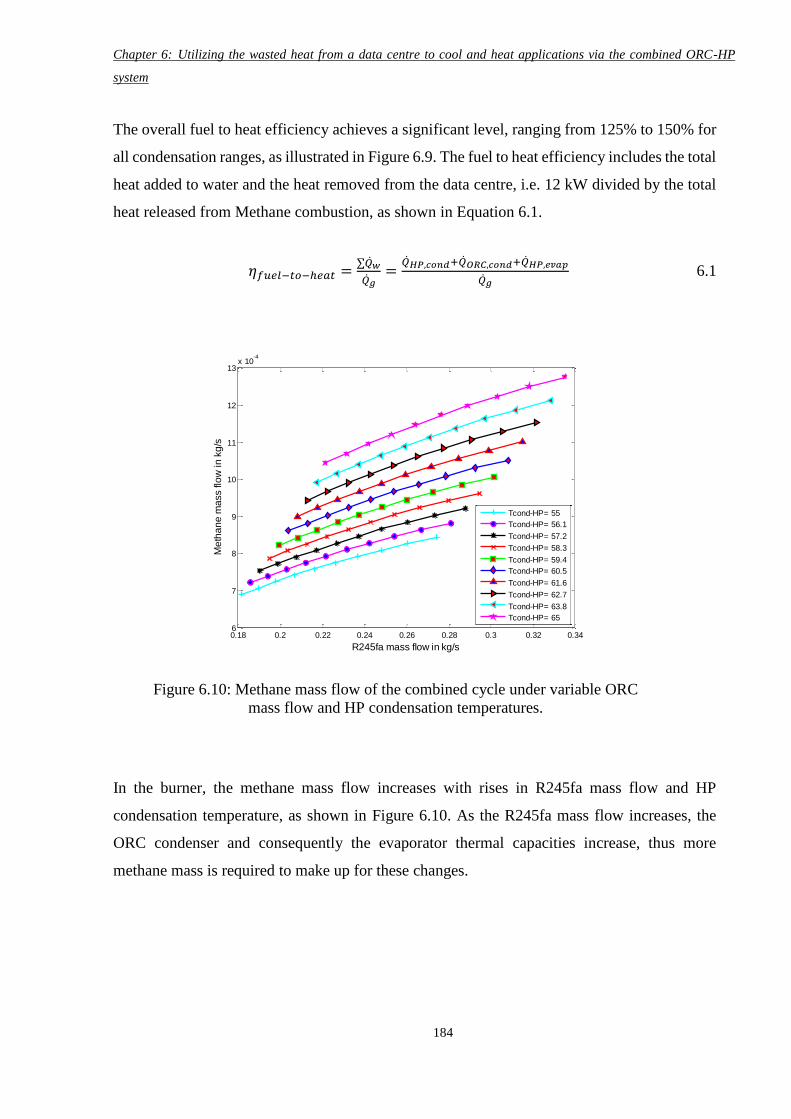
Chapter 6: Utilizing the wasted heat from a data centre to cool and heat applications via the combined ORC-HP
system
184
The overall fuel to heat efficiency achieves a significant level, ranging from 125% to 150% for
all condensation ranges, as illustrated in Figure 6.9. The fuel to heat efficiency includes the total
heat added to water and the heat removed from the data centre, i.e. 12 kW divided by the total
heat released from Methane combustion, as shown in Equation 6.1.
𝜂𝑓𝑢𝑒𝑙−𝑡𝑜−ℎ𝑒𝑎𝑡 =∑��𝑤
��𝑔=
��𝐻𝑃,𝑐𝑜𝑛𝑑+��𝑂𝑅𝐶,𝑐𝑜𝑛𝑑+��𝐻𝑃,𝑒𝑣𝑎𝑝
��𝑔 6.1
In the burner, the methane mass flow increases with rises in R245fa mass flow and HP
condensation temperature, as shown in Figure 6.10. As the R245fa mass flow increases, the
ORC condenser and consequently the evaporator thermal capacities increase, thus more
methane mass is required to make up for these changes.
Figure 6.10: Methane mass flow of the combined cycle under variable ORC
mass flow and HP condensation temperatures.
0.18 0.2 0.22 0.24 0.26 0.28 0.3 0.32 0.346
7
8
9
10
11
12
13x 10
-4
R245fa mass flow in kg/s
Me
tha
ne
ma
ss flo
w in
kg
/s
Tcond-HP= 55
Tcond-HP= 56.1
Tcond-HP= 57.2
Tcond-HP= 58.3
Tcond-HP= 59.4
Tcond-HP= 60.5
Tcond-HP= 61.6
Tcond-HP= 62.7
Tcond-HP= 63.8
Tcond-HP= 65
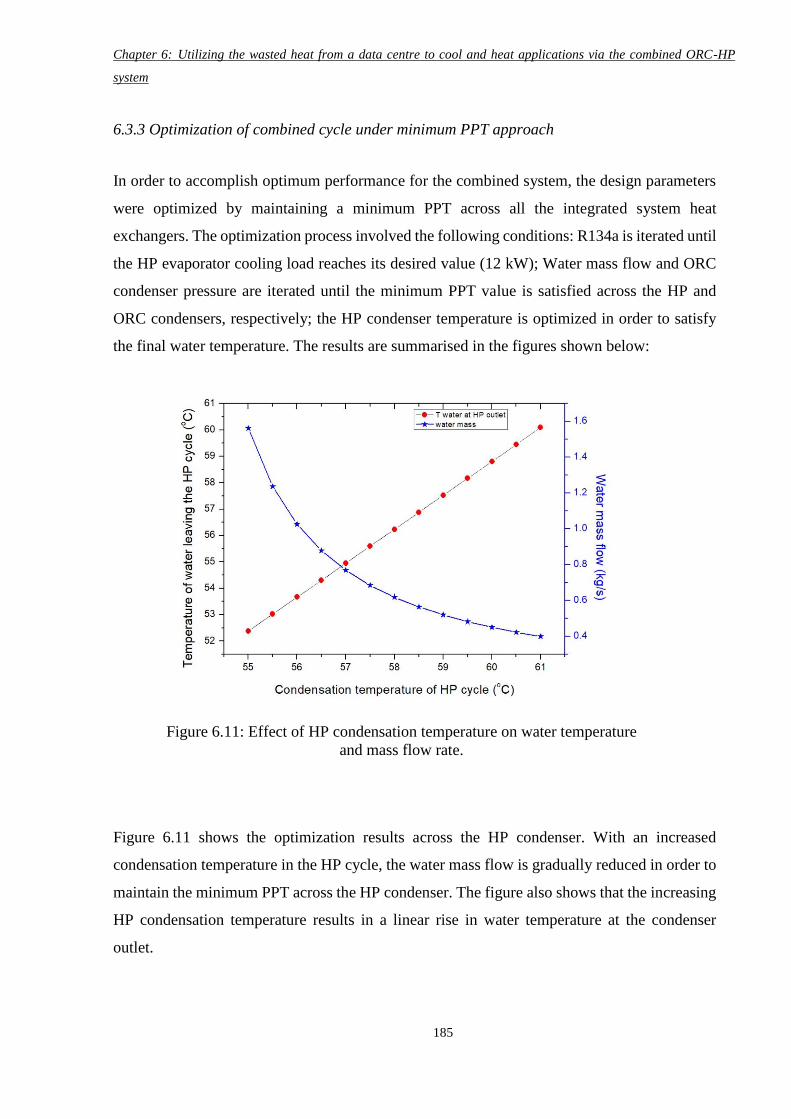
Chapter 6: Utilizing the wasted heat from a data centre to cool and heat applications via the combined ORC-HP
system
185
6.3.3 Optimization of combined cycle under minimum PPT approach
In order to accomplish optimum performance for the combined system, the design parameters
were optimized by maintaining a minimum PPT across all the integrated system heat
exchangers. The optimization process involved the following conditions: R134a is iterated until
the HP evaporator cooling load reaches its desired value (12 kW); Water mass flow and ORC
condenser pressure are iterated until the minimum PPT value is satisfied across the HP and
ORC condensers, respectively; the HP condenser temperature is optimized in order to satisfy
the final water temperature. The results are summarised in the figures shown below:
Figure 6.11 shows the optimization results across the HP condenser. With an increased
condensation temperature in the HP cycle, the water mass flow is gradually reduced in order to
maintain the minimum PPT across the HP condenser. The figure also shows that the increasing
HP condensation temperature results in a linear rise in water temperature at the condenser
outlet.
Figure 6.11: Effect of HP condensation temperature on water temperature
and mass flow rate.
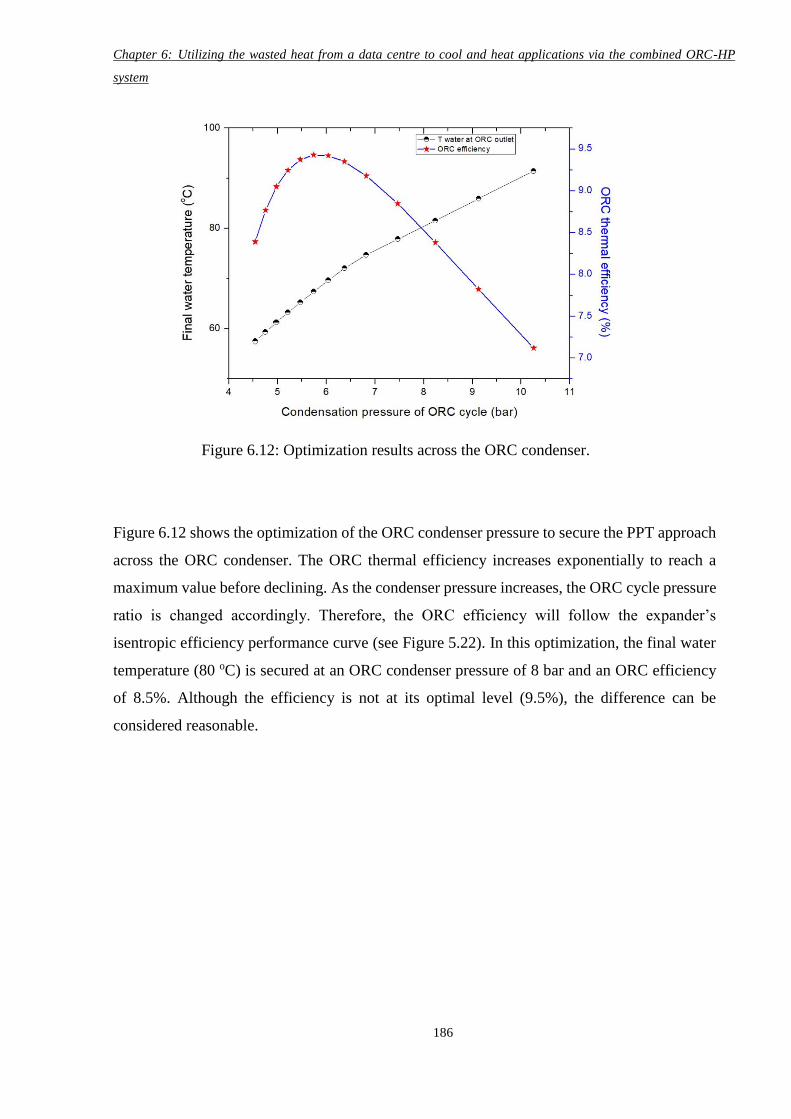
Chapter 6: Utilizing the wasted heat from a data centre to cool and heat applications via the combined ORC-HP
system
186
Figure 6.12 shows the optimization of the ORC condenser pressure to secure the PPT approach
across the ORC condenser. The ORC thermal efficiency increases exponentially to reach a
maximum value before declining. As the condenser pressure increases, the ORC cycle pressure
ratio is changed accordingly. Therefore, the ORC efficiency will follow the expander’s
isentropic efficiency performance curve (see Figure 5.22). In this optimization, the final water
temperature (80 oC) is secured at an ORC condenser pressure of 8 bar and an ORC efficiency
of 8.5%. Although the efficiency is not at its optimal level (9.5%), the difference can be
considered reasonable.
Figure 6.12: Optimization results across the ORC condenser.
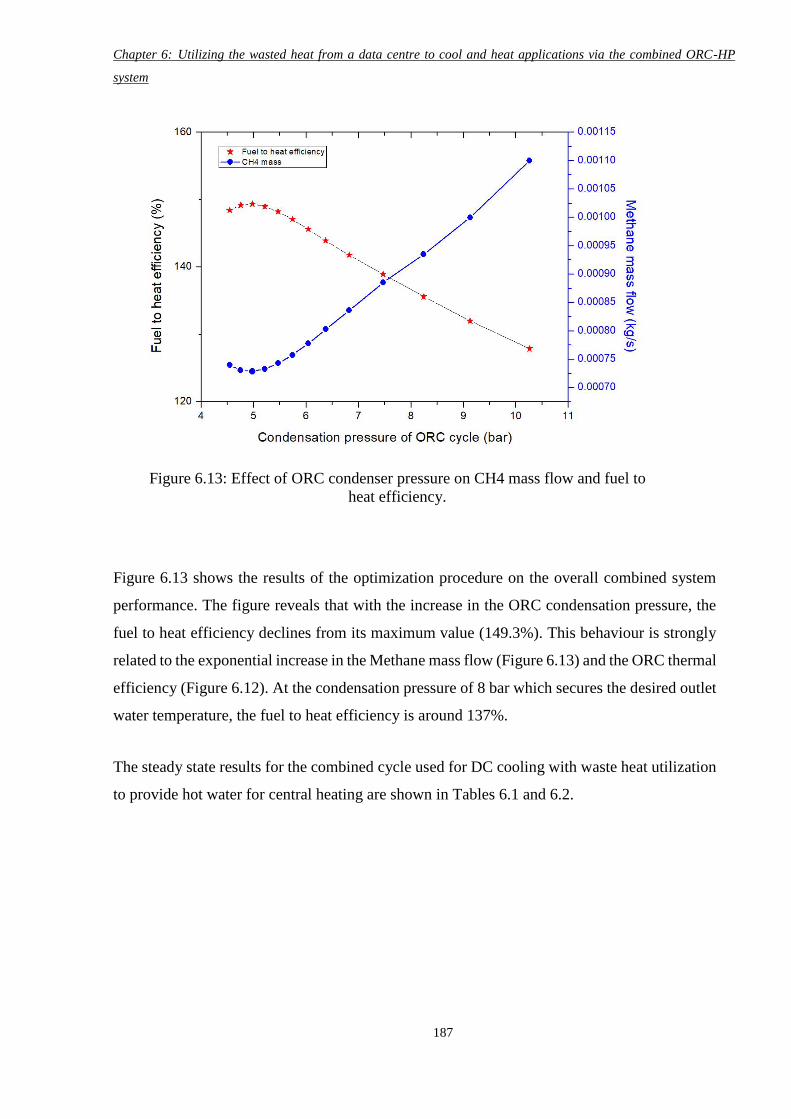
Chapter 6: Utilizing the wasted heat from a data centre to cool and heat applications via the combined ORC-HP
system
187
Figure 6.13 shows the results of the optimization procedure on the overall combined system
performance. The figure reveals that with the increase in the ORC condensation pressure, the
fuel to heat efficiency declines from its maximum value (149.3%). This behaviour is strongly
related to the exponential increase in the Methane mass flow (Figure 6.13) and the ORC thermal
efficiency (Figure 6.12). At the condensation pressure of 8 bar which secures the desired outlet
water temperature, the fuel to heat efficiency is around 137%.
The steady state results for the combined cycle used for DC cooling with waste heat utilization
to provide hot water for central heating are shown in Tables 6.1 and 6.2.
Figure 6.13: Effect of ORC condenser pressure on CH4 mass flow and fuel to
heat efficiency.
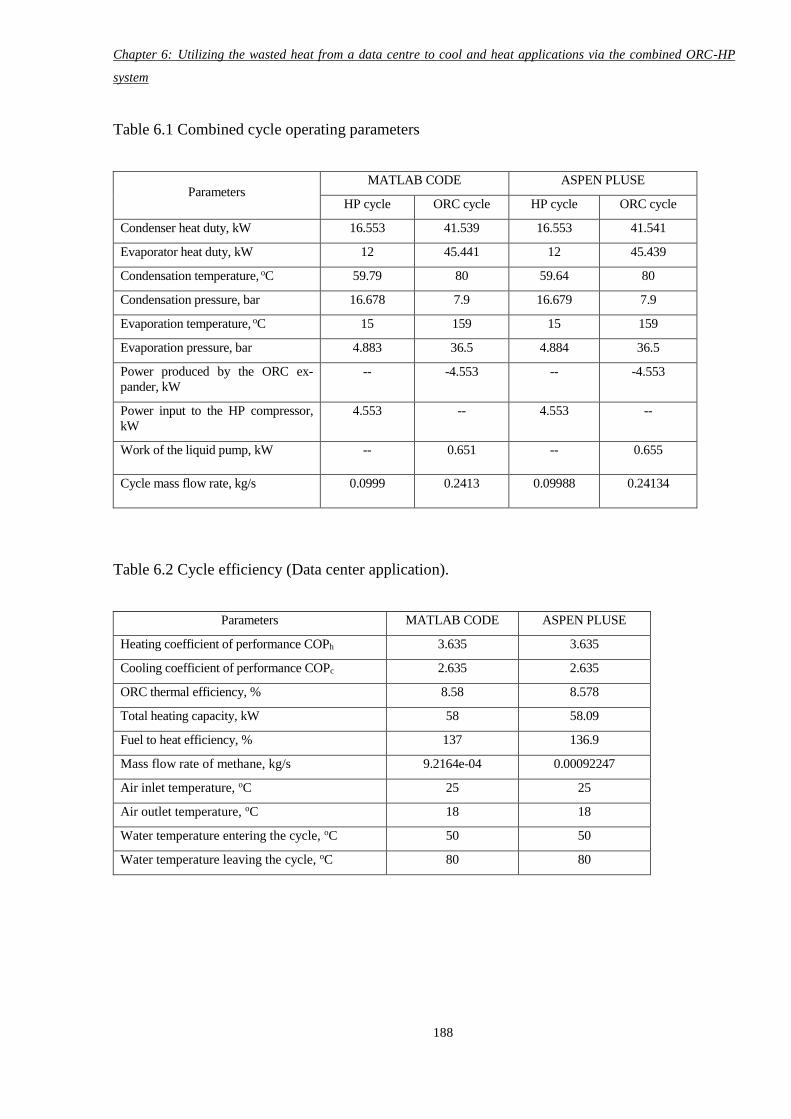
Chapter 6: Utilizing the wasted heat from a data centre to cool and heat applications via the combined ORC-HP
system
188
Table 6.1 Combined cycle operating parameters
Parameters MATLAB CODE ASPEN PLUSE
HP cycle ORC cycle HP cycle ORC cycle
Condenser heat duty, kW 16.553 41.539 16.553 41.541
Evaporator heat duty, kW 12 45.441 12 45.439
Condensation temperature, oC 59.79 80 59.64 80
Condensation pressure, bar 16.678 7.9 16.679 7.9
Evaporation temperature, oC 15 159 15 159
Evaporation pressure, bar 4.883 36.5 4.884 36.5
Power produced by the ORC ex-
pander, kW
-- -4.553 -- -4.553
Power input to the HP compressor,
kW
4.553 -- 4.553 --
Work of the liquid pump, kW -- 0.651 -- 0.655
Cycle mass flow rate, kg/s 0.0999 0.2413 0.09988 0.24134
Table 6.2 Cycle efficiency (Data center application).
Parameters MATLAB CODE ASPEN PLUSE
Heating coefficient of performance COPh 3.635 3.635
Cooling coefficient of performance COPc 2.635 2.635
ORC thermal efficiency, % 8.58 8.578
Total heating capacity, kW 58 58.09
Fuel to heat efficiency, % 137 136.9
Mass flow rate of methane, kg/s 9.2164e-04 0.00092247
Air inlet temperature, oC 25 25
Air outlet temperature, oC 18 18
Water temperature entering the cycle, oC 50 50
Water temperature leaving the cycle, oC 80 80
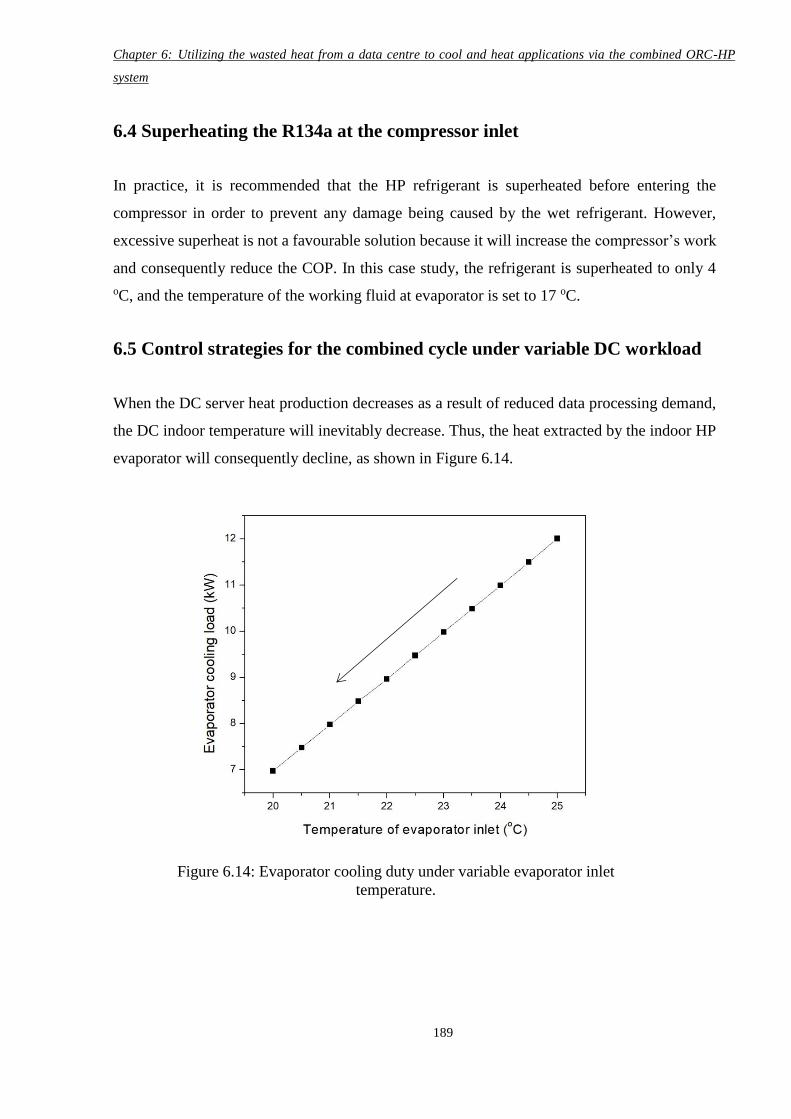
Chapter 6: Utilizing the wasted heat from a data centre to cool and heat applications via the combined ORC-HP
system
189
6.4 Superheating the R134a at the compressor inlet
In practice, it is recommended that the HP refrigerant is superheated before entering the
compressor in order to prevent any damage being caused by the wet refrigerant. However,
excessive superheat is not a favourable solution because it will increase the compressor’s work
and consequently reduce the COP. In this case study, the refrigerant is superheated to only 4
oC, and the temperature of the working fluid at evaporator is set to 17 oC.
6.5 Control strategies for the combined cycle under variable DC workload
When the DC server heat production decreases as a result of reduced data processing demand,
the DC indoor temperature will inevitably decrease. Thus, the heat extracted by the indoor HP
evaporator will consequently decline, as shown in Figure 6.14.
Figure 6.14: Evaporator cooling duty under variable evaporator inlet
temperature.
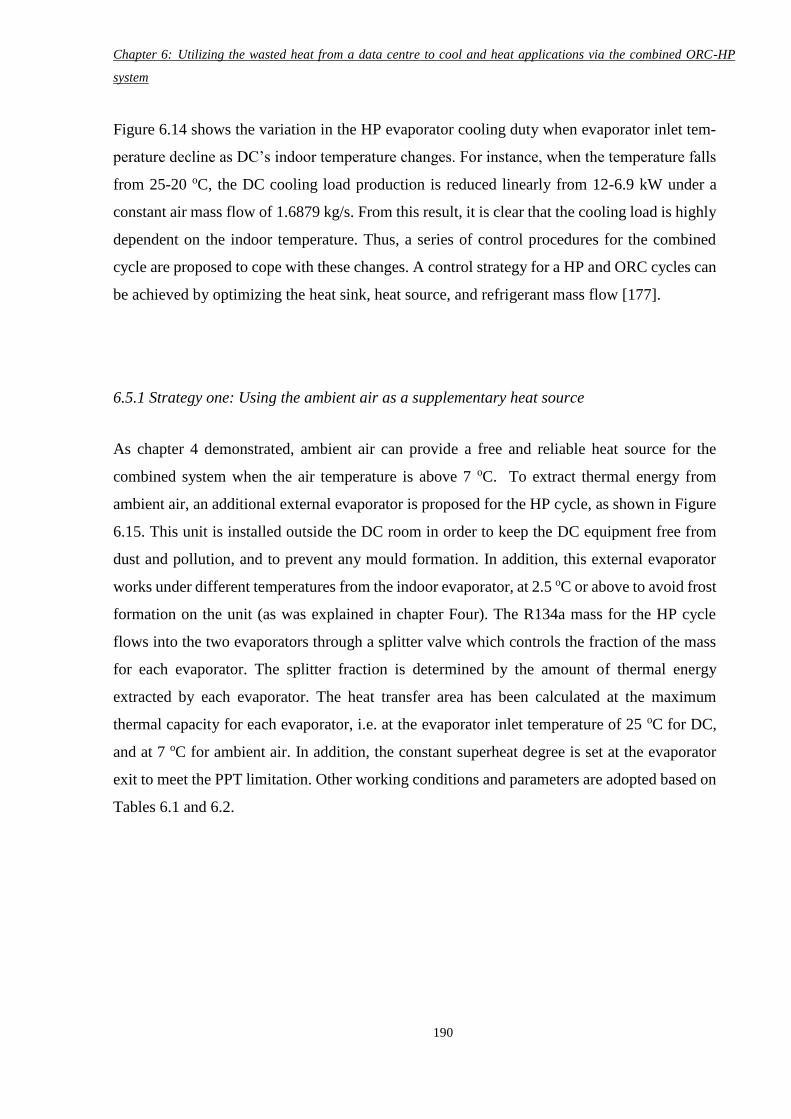
Chapter 6: Utilizing the wasted heat from a data centre to cool and heat applications via the combined ORC-HP
system
190
Figure 6.14 shows the variation in the HP evaporator cooling duty when evaporator inlet tem-
perature decline as DC’s indoor temperature changes. For instance, when the temperature falls
from 25-20 oC, the DC cooling load production is reduced linearly from 12-6.9 kW under a
constant air mass flow of 1.6879 kg/s. From this result, it is clear that the cooling load is highly
dependent on the indoor temperature. Thus, a series of control procedures for the combined
cycle are proposed to cope with these changes. A control strategy for a HP and ORC cycles can
be achieved by optimizing the heat sink, heat source, and refrigerant mass flow [177].
6.5.1 Strategy one: Using the ambient air as a supplementary heat source
As chapter 4 demonstrated, ambient air can provide a free and reliable heat source for the
combined system when the air temperature is above 7 oC. To extract thermal energy from
ambient air, an additional external evaporator is proposed for the HP cycle, as shown in Figure
6.15. This unit is installed outside the DC room in order to keep the DC equipment free from
dust and pollution, and to prevent any mould formation. In addition, this external evaporator
works under different temperatures from the indoor evaporator, at 2.5 oC or above to avoid frost
formation on the unit (as was explained in chapter Four). The R134a mass for the HP cycle
flows into the two evaporators through a splitter valve which controls the fraction of the mass
for each evaporator. The splitter fraction is determined by the amount of thermal energy
extracted by each evaporator. The heat transfer area has been calculated at the maximum
thermal capacity for each evaporator, i.e. at the evaporator inlet temperature of 25 oC for DC,
and at 7 oC for ambient air. In addition, the constant superheat degree is set at the evaporator
exit to meet the PPT limitation. Other working conditions and parameters are adopted based on
Tables 6.1 and 6.2.
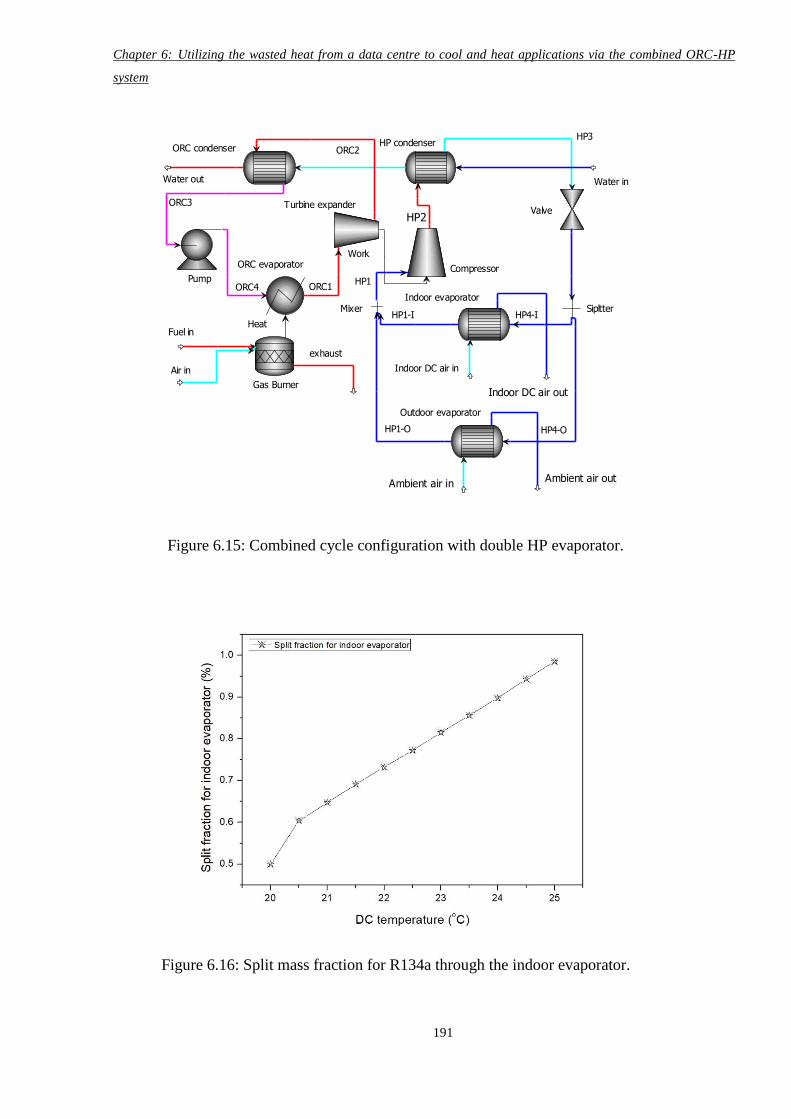
Chapter 6: Utilizing the wasted heat from a data centre to cool and heat applications via the combined ORC-HP
system
191
Indoor evaporator
HP condenser
Gas Burner
ORC evaporator
ORC condenser
Pump
Turbine expander
Compressor
Valve
Water inWater out
HP1
HP2
HP3
Indoor DC air in
ORC1
ORC2
ORC3
ORC4
Indoor DC air out
Fuel in
exhaust
Heat
Work
Air in
Ambient air inAmbient air out
Outdoor evaporator
Mixer Sipltter
HP4-O
HP4-IHP1-I
HP1-O
Figure 6.15: Combined cycle configuration with double HP evaporator.
Figure 6.16: Split mass fraction for R134a through the indoor evaporator.
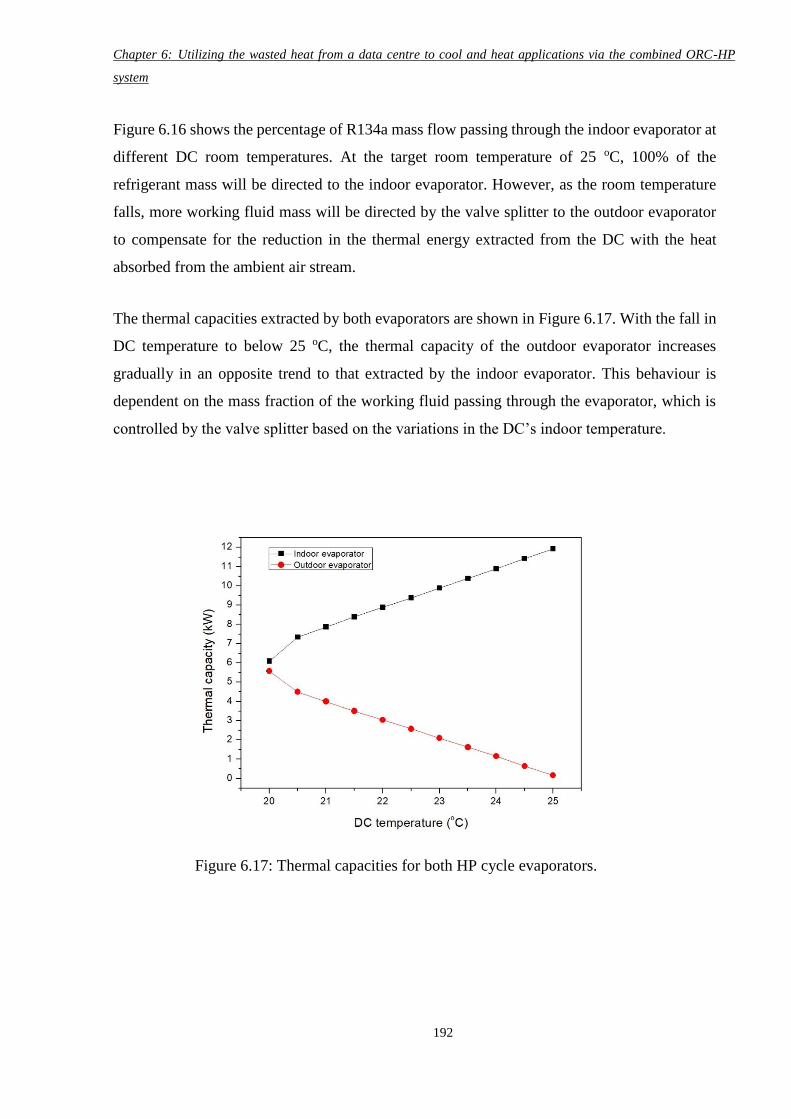
Chapter 6: Utilizing the wasted heat from a data centre to cool and heat applications via the combined ORC-HP
system
192
Figure 6.16 shows the percentage of R134a mass flow passing through the indoor evaporator at
different DC room temperatures. At the target room temperature of 25 oC, 100% of the
refrigerant mass will be directed to the indoor evaporator. However, as the room temperature
falls, more working fluid mass will be directed by the valve splitter to the outdoor evaporator
to compensate for the reduction in the thermal energy extracted from the DC with the heat
absorbed from the ambient air stream.
The thermal capacities extracted by both evaporators are shown in Figure 6.17. With the fall in
DC temperature to below 25 oC, the thermal capacity of the outdoor evaporator increases
gradually in an opposite trend to that extracted by the indoor evaporator. This behaviour is
dependent on the mass fraction of the working fluid passing through the evaporator, which is
controlled by the valve splitter based on the variations in the DC’s indoor temperature.
Figure 6.17: Thermal capacities for both HP cycle evaporators.
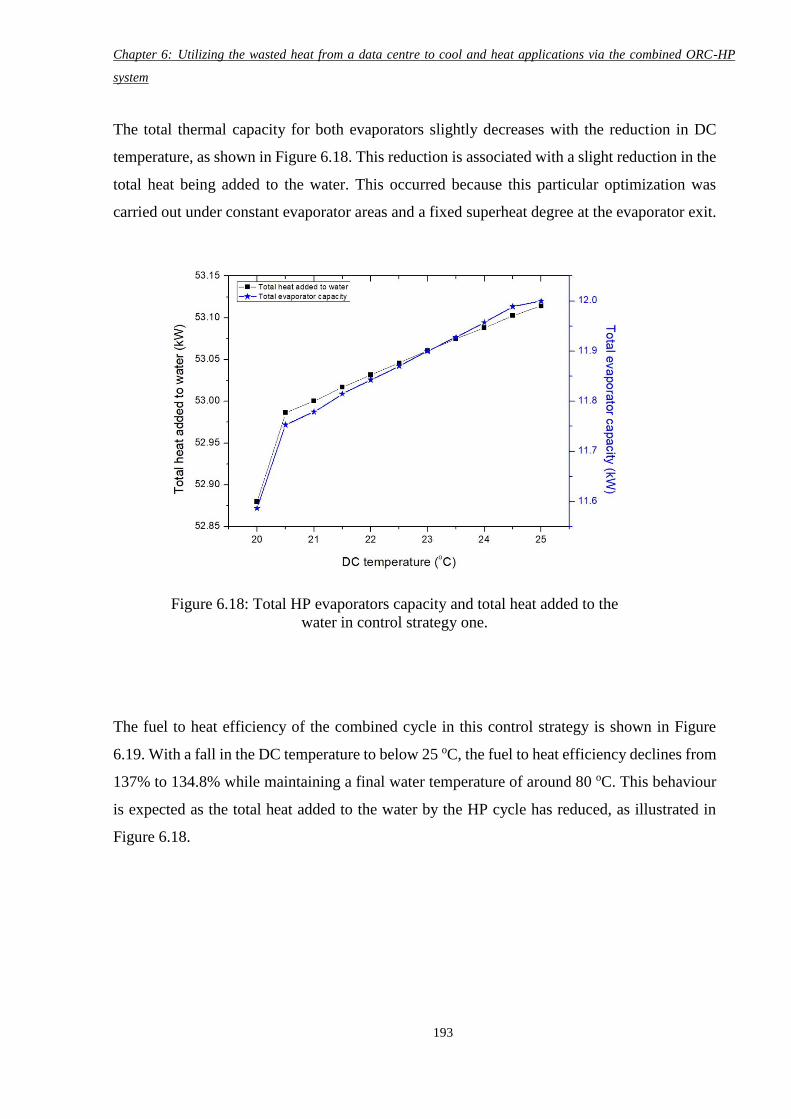
Chapter 6: Utilizing the wasted heat from a data centre to cool and heat applications via the combined ORC-HP
system
193
The total thermal capacity for both evaporators slightly decreases with the reduction in DC
temperature, as shown in Figure 6.18. This reduction is associated with a slight reduction in the
total heat being added to the water. This occurred because this particular optimization was
carried out under constant evaporator areas and a fixed superheat degree at the evaporator exit.
The fuel to heat efficiency of the combined cycle in this control strategy is shown in Figure
6.19. With a fall in the DC temperature to below 25 oC, the fuel to heat efficiency declines from
137% to 134.8% while maintaining a final water temperature of around 80 oC. This behaviour
is expected as the total heat added to the water by the HP cycle has reduced, as illustrated in
Figure 6.18.
Figure 6.18: Total HP evaporators capacity and total heat added to the
water in control strategy one.
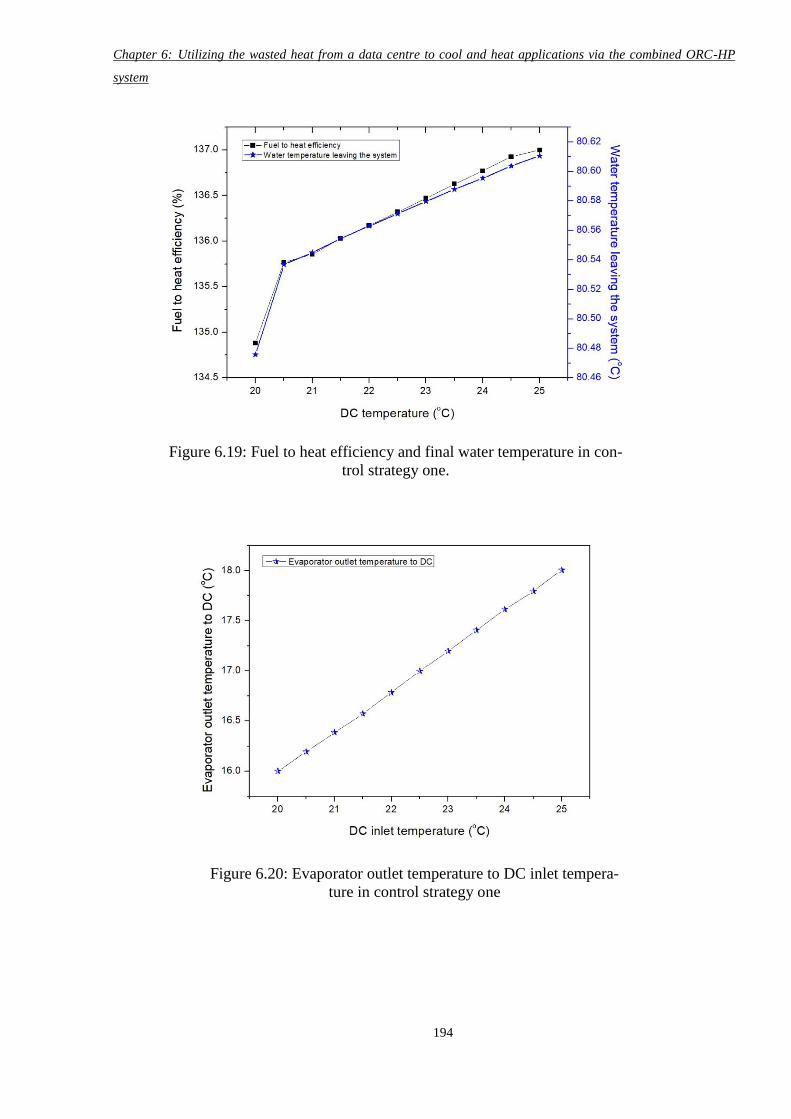
Chapter 6: Utilizing the wasted heat from a data centre to cool and heat applications via the combined ORC-HP
system
194
Figure 6.19: Fuel to heat efficiency and final water temperature in con-
trol strategy one.
Figure 6.20: Evaporator outlet temperature to DC inlet tempera-
ture in control strategy one
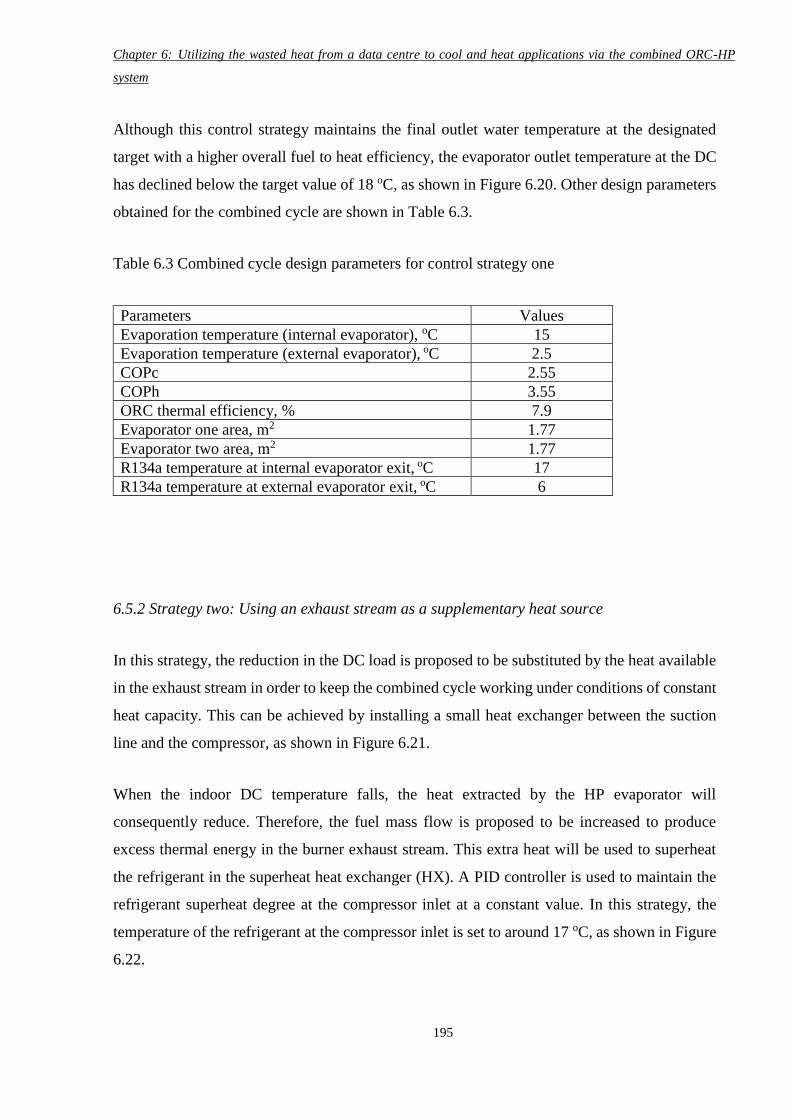
Chapter 6: Utilizing the wasted heat from a data centre to cool and heat applications via the combined ORC-HP
system
195
Although this control strategy maintains the final outlet water temperature at the designated
target with a higher overall fuel to heat efficiency, the evaporator outlet temperature at the DC
has declined below the target value of 18 oC, as shown in Figure 6.20. Other design parameters
obtained for the combined cycle are shown in Table 6.3.
Table 6.3 Combined cycle design parameters for control strategy one
Parameters Values
Evaporation temperature (internal evaporator), oC 15
Evaporation temperature (external evaporator), oC 2.5
COPc 2.55
COPh 3.55
ORC thermal efficiency, % 7.9
Evaporator one area, m2 1.77
Evaporator two area, m2 1.77
R134a temperature at internal evaporator exit, oC 17
R134a temperature at external evaporator exit, oC 6
6.5.2 Strategy two: Using an exhaust stream as a supplementary heat source
In this strategy, the reduction in the DC load is proposed to be substituted by the heat available
in the exhaust stream in order to keep the combined cycle working under conditions of constant
heat capacity. This can be achieved by installing a small heat exchanger between the suction
line and the compressor, as shown in Figure 6.21.
When the indoor DC temperature falls, the heat extracted by the HP evaporator will
consequently reduce. Therefore, the fuel mass flow is proposed to be increased to produce
excess thermal energy in the burner exhaust stream. This extra heat will be used to superheat
the refrigerant in the superheat heat exchanger (HX). A PID controller is used to maintain the
refrigerant superheat degree at the compressor inlet at a constant value. In this strategy, the
temperature of the refrigerant at the compressor inlet is set to around 17 oC, as shown in Figure
6.22.
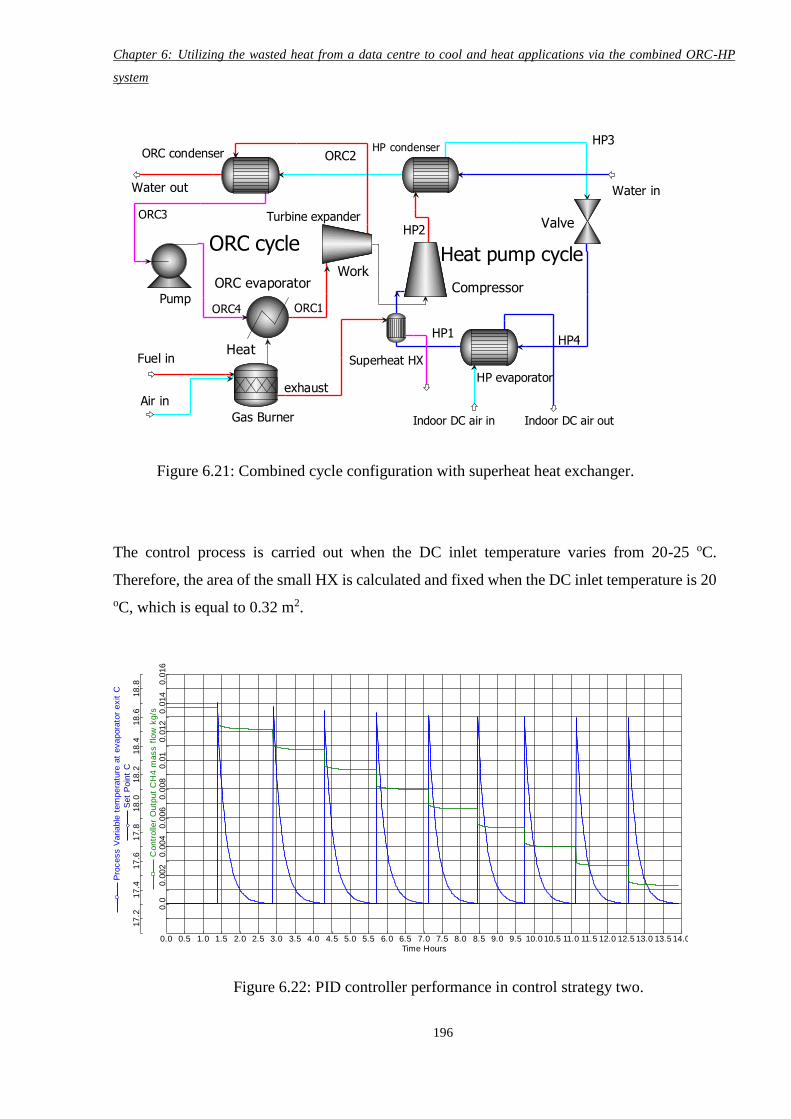
Chapter 6: Utilizing the wasted heat from a data centre to cool and heat applications via the combined ORC-HP
system
196
The control process is carried out when the DC inlet temperature varies from 20-25 oC.
Therefore, the area of the small HX is calculated and fixed when the DC inlet temperature is 20
oC, which is equal to 0.32 m2.
Heat pump cycleORC cycle
HP evaporator
HP condenser
Gas Burner
ORC evaporator
ORC condenser
Pump
Turbine expander
Compressor
Valve
Water inWater out
HP1
HP2
HP3
HP4
Indoor DC air in
ORC1
ORC2
ORC3
ORC4
Indoor DC air out
Fuel in
exhaust
Heat
Work
Air in
Superheat HX
Figure 6.21: Combined cycle configuration with superheat heat exchanger.
Time Hours
Set
Poin
t C
Contr
olle
r O
utp
ut
CH
4 m
ass f
low
kg/s
Pro
cess V
ariable
tem
pera
ture
at
evapora
tor
exit C
0.0 0.5 1.0 1.5 2.0 2.5 3.0 3.5 4.0 4.5 5.0 5.5 6.0 6.5 7.0 7.5 8.0 8.5 9.0 9.5 10.0 10.5 11.0 11.5 12.0 12.5 13.0 13.5 14.0
0.0
0.0
02
0.0
04
0.0
06
0.0
08
0.0
10.0
12
0.0
14
0.0
16
17.2
17.4
17.6
17.8
18.0
18.2
18.4
18.6
18.8
Figure 6.22: PID controller performance in control strategy two.
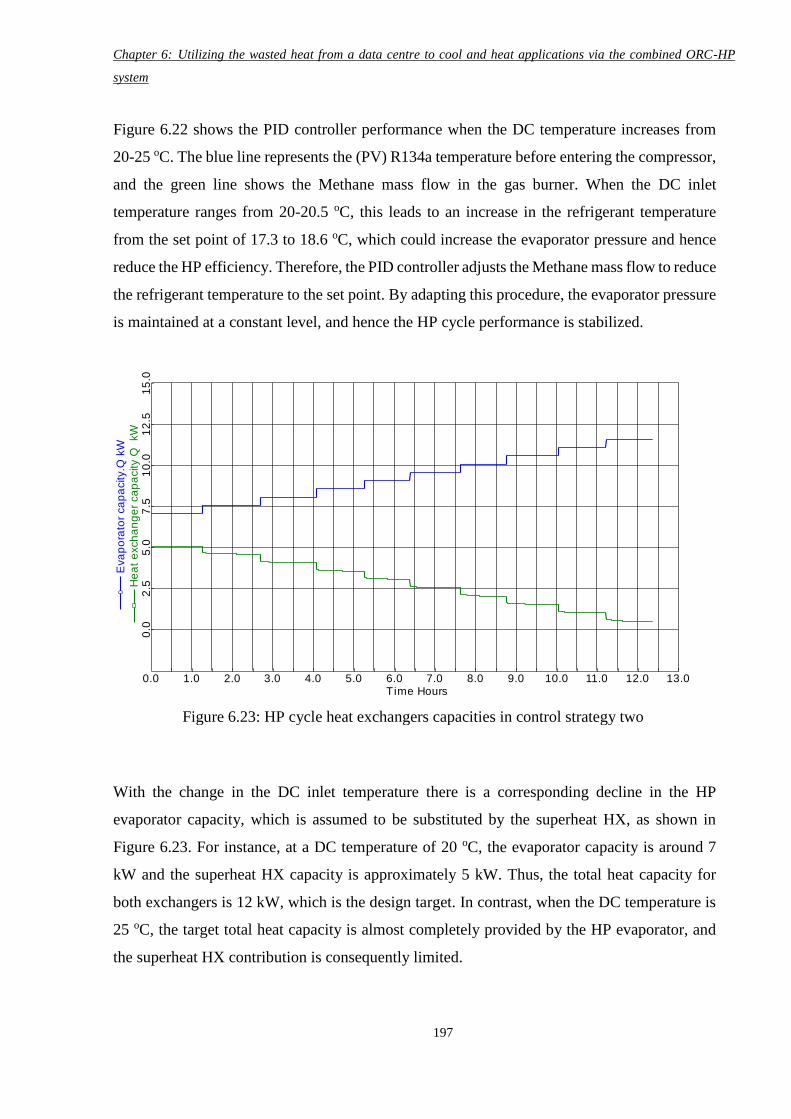
Chapter 6: Utilizing the wasted heat from a data centre to cool and heat applications via the combined ORC-HP
system
197
Figure 6.22 shows the PID controller performance when the DC temperature increases from
20-25 oC. The blue line represents the (PV) R134a temperature before entering the compressor,
and the green line shows the Methane mass flow in the gas burner. When the DC inlet
temperature ranges from 20-20.5 oC, this leads to an increase in the refrigerant temperature
from the set point of 17.3 to 18.6 oC, which could increase the evaporator pressure and hence
reduce the HP efficiency. Therefore, the PID controller adjusts the Methane mass flow to reduce
the refrigerant temperature to the set point. By adapting this procedure, the evaporator pressure
is maintained at a constant level, and hence the HP cycle performance is stabilized.
With the change in the DC inlet temperature there is a corresponding decline in the HP
evaporator capacity, which is assumed to be substituted by the superheat HX, as shown in
Figure 6.23. For instance, at a DC temperature of 20 oC, the evaporator capacity is around 7
kW and the superheat HX capacity is approximately 5 kW. Thus, the total heat capacity for
both exchangers is 12 kW, which is the design target. In contrast, when the DC temperature is
25 oC, the target total heat capacity is almost completely provided by the HP evaporator, and
the superheat HX contribution is consequently limited.
Time Hours
He
at
exch
an
ge
r ca
pa
city Q
kW
Eva
po
rato
r ca
pa
city.Q
kW
0.0 1.0 2.0 3.0 4.0 5.0 6.0 7.0 8.0 9.0 10.0 11.0 12.0 13.0
0.0
2.5
5.0
7.5
10
.01
2.5
15
.0
Figure 6.23: HP cycle heat exchangers capacities in control strategy two
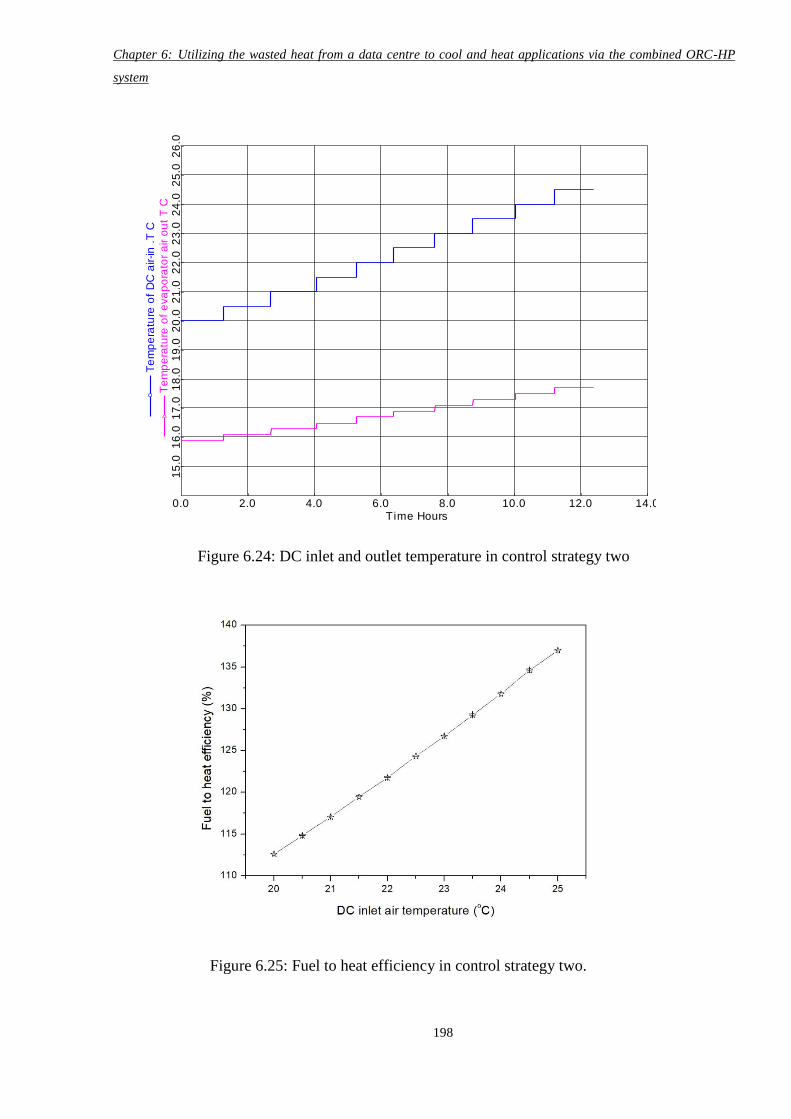
Chapter 6: Utilizing the wasted heat from a data centre to cool and heat applications via the combined ORC-HP
system
198
Time Hours
Te
mp
era
ture
of
eva
po
rato
r a
ir o
ut
T C
Te
mp
era
ture
of
DC
air-in
.T
C
0.0 2.0 4.0 6.0 8.0 10.0 12.0 14.0
15
.01
6.0
17
.01
8.0
19
.02
0.0
21
.02
2.0
23
.02
4.0
25
.02
6.0
Figure 6.24: DC inlet and outlet temperature in control strategy two
Figure 6.25: Fuel to heat efficiency in control strategy two.
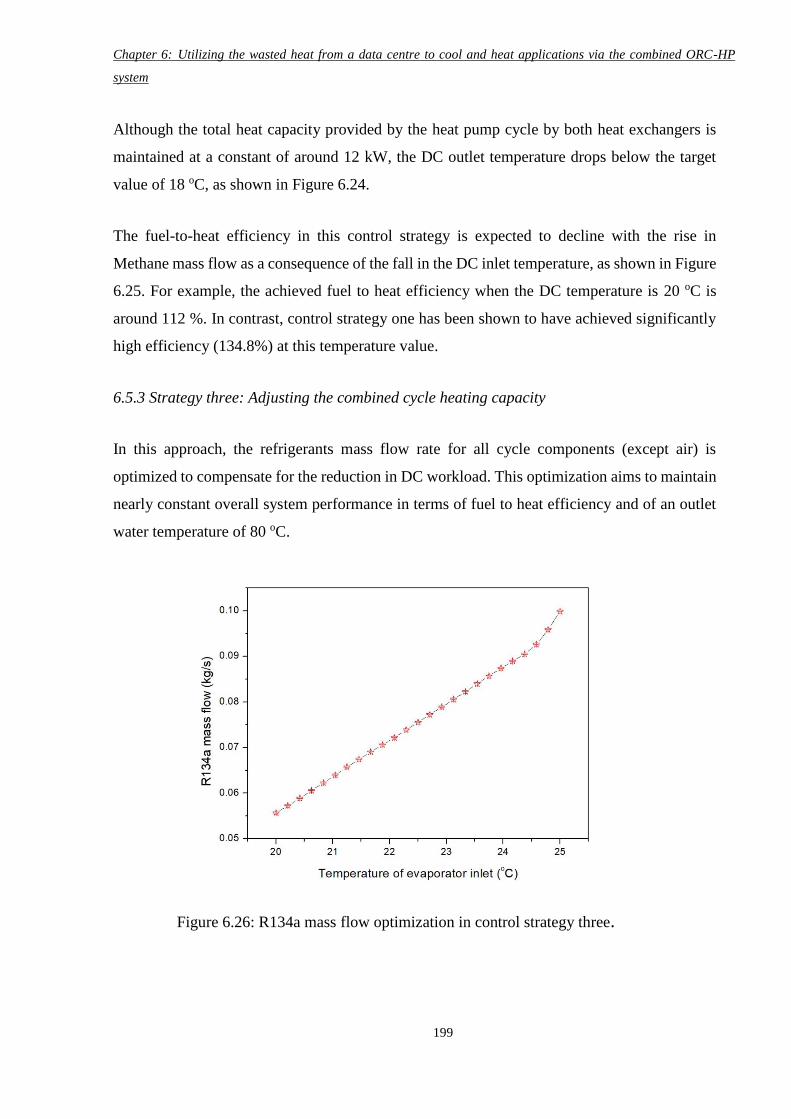
Chapter 6: Utilizing the wasted heat from a data centre to cool and heat applications via the combined ORC-HP
system
199
Although the total heat capacity provided by the heat pump cycle by both heat exchangers is
maintained at a constant of around 12 kW, the DC outlet temperature drops below the target
value of 18 oC, as shown in Figure 6.24.
The fuel-to-heat efficiency in this control strategy is expected to decline with the rise in
Methane mass flow as a consequence of the fall in the DC inlet temperature, as shown in Figure
6.25. For example, the achieved fuel to heat efficiency when the DC temperature is 20 oC is
around 112 %. In contrast, control strategy one has been shown to have achieved significantly
high efficiency (134.8%) at this temperature value.
6.5.3 Strategy three: Adjusting the combined cycle heating capacity
In this approach, the refrigerants mass flow rate for all cycle components (except air) is
optimized to compensate for the reduction in DC workload. This optimization aims to maintain
nearly constant overall system performance in terms of fuel to heat efficiency and of an outlet
water temperature of 80 oC.
Figure 6.26: R134a mass flow optimization in control strategy three.
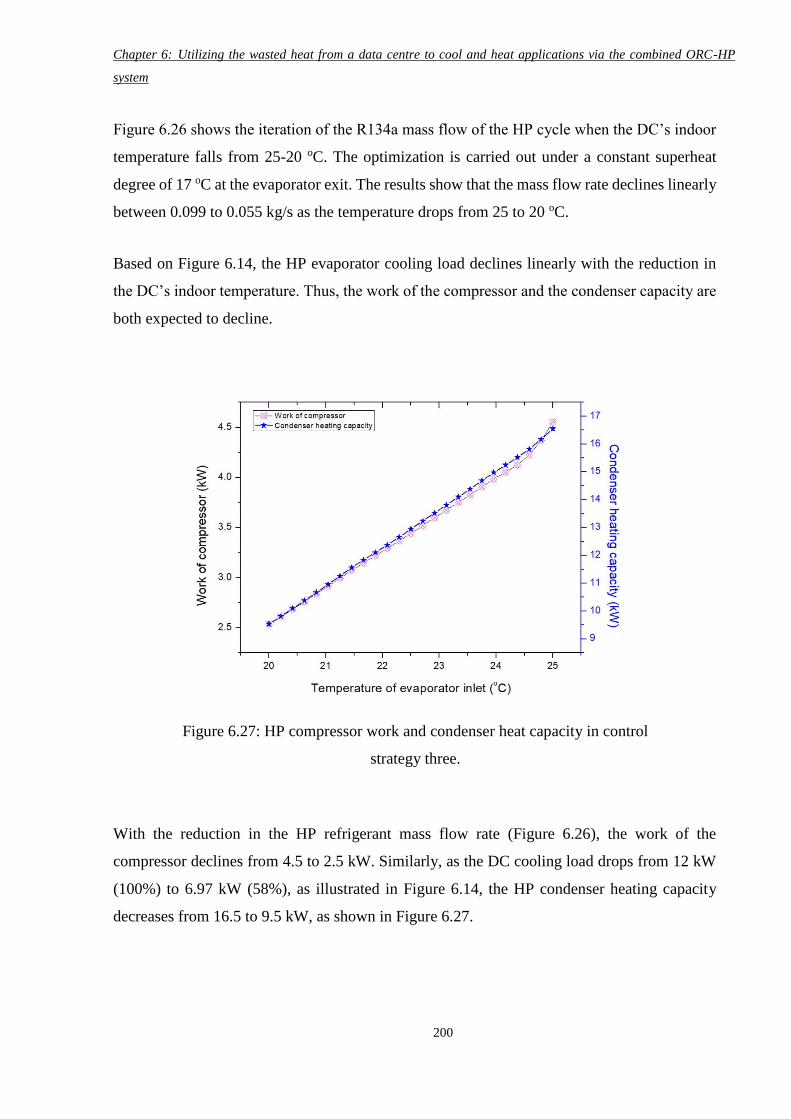
Chapter 6: Utilizing the wasted heat from a data centre to cool and heat applications via the combined ORC-HP
system
200
Figure 6.26 shows the iteration of the R134a mass flow of the HP cycle when the DC’s indoor
temperature falls from 25-20 oC. The optimization is carried out under a constant superheat
degree of 17 oC at the evaporator exit. The results show that the mass flow rate declines linearly
between 0.099 to 0.055 kg/s as the temperature drops from 25 to 20 oC.
Based on Figure 6.14, the HP evaporator cooling load declines linearly with the reduction in
the DC’s indoor temperature. Thus, the work of the compressor and the condenser capacity are
both expected to decline.
With the reduction in the HP refrigerant mass flow rate (Figure 6.26), the work of the
compressor declines from 4.5 to 2.5 kW. Similarly, as the DC cooling load drops from 12 kW
(100%) to 6.97 kW (58%), as illustrated in Figure 6.14, the HP condenser heating capacity
decreases from 16.5 to 9.5 kW, as shown in Figure 6.27.
Figure 6.27: HP compressor work and condenser heat capacity in control
strategy three.
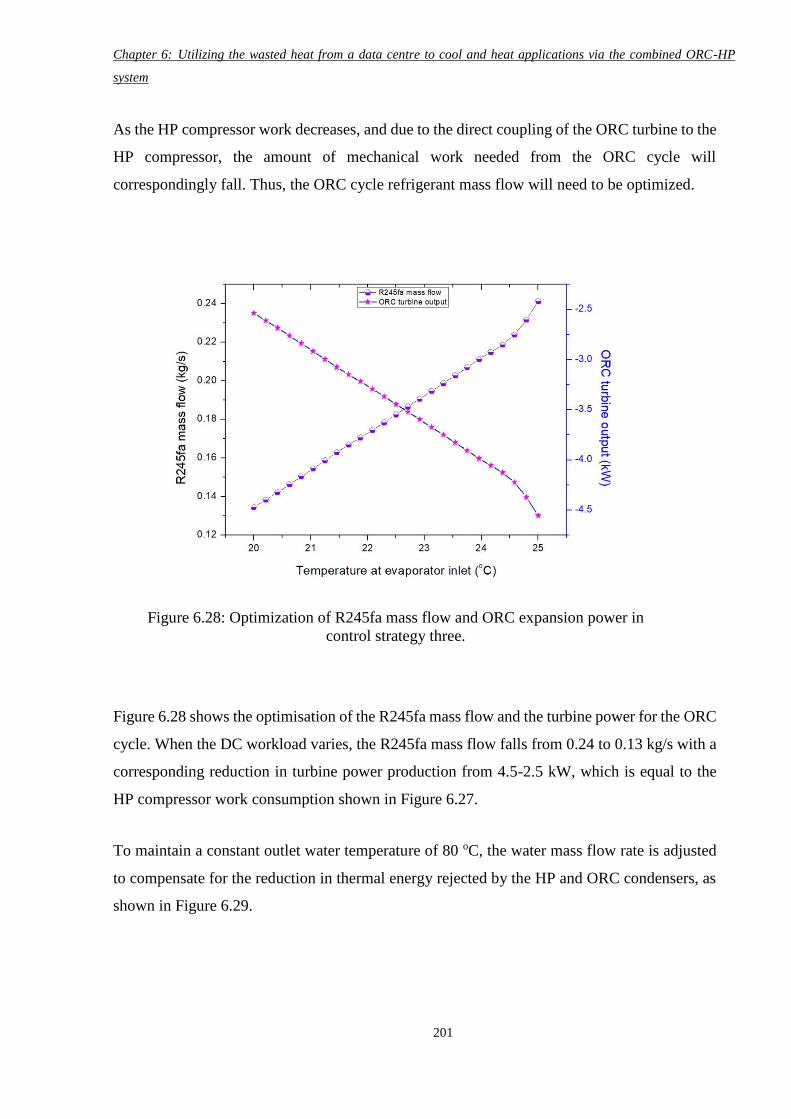
Chapter 6: Utilizing the wasted heat from a data centre to cool and heat applications via the combined ORC-HP
system
201
As the HP compressor work decreases, and due to the direct coupling of the ORC turbine to the
HP compressor, the amount of mechanical work needed from the ORC cycle will
correspondingly fall. Thus, the ORC cycle refrigerant mass flow will need to be optimized.
Figure 6.28 shows the optimisation of the R245fa mass flow and the turbine power for the ORC
cycle. When the DC workload varies, the R245fa mass flow falls from 0.24 to 0.13 kg/s with a
corresponding reduction in turbine power production from 4.5-2.5 kW, which is equal to the
HP compressor work consumption shown in Figure 6.27.
To maintain a constant outlet water temperature of 80 oC, the water mass flow rate is adjusted
to compensate for the reduction in thermal energy rejected by the HP and ORC condensers, as
shown in Figure 6.29.
Figure 6.28: Optimization of R245fa mass flow and ORC expansion power in
control strategy three.
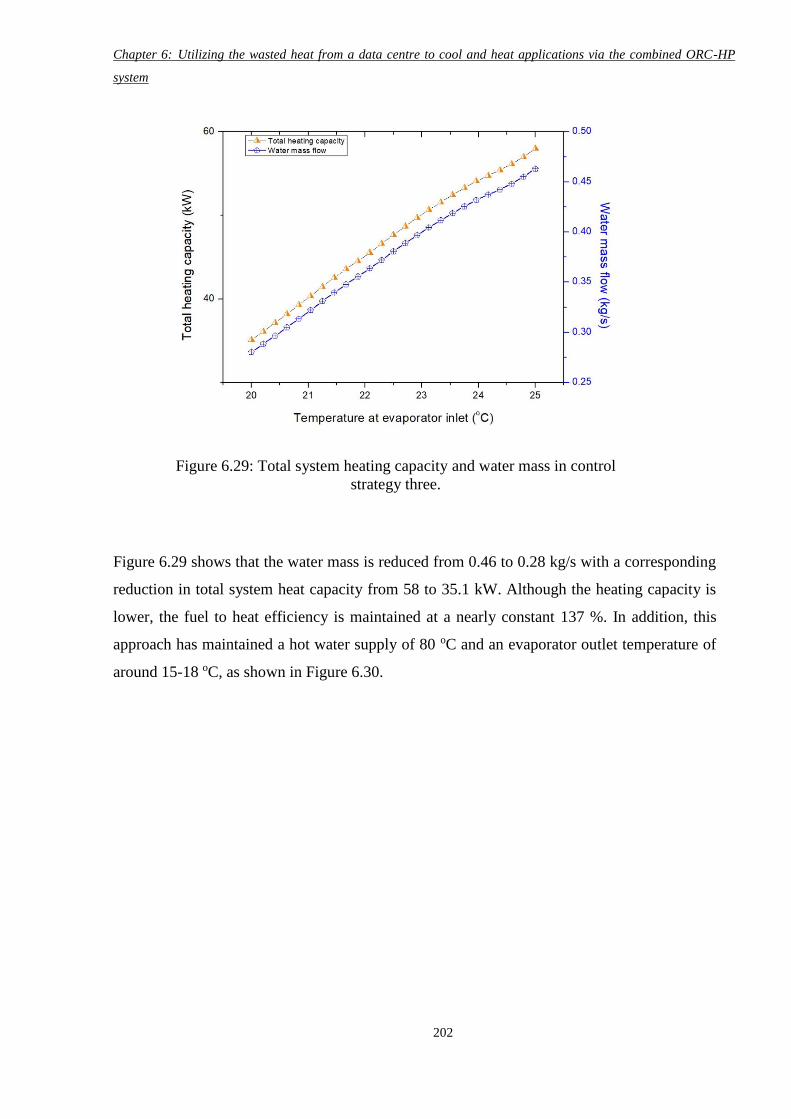
Chapter 6: Utilizing the wasted heat from a data centre to cool and heat applications via the combined ORC-HP
system
202
Figure 6.29 shows that the water mass is reduced from 0.46 to 0.28 kg/s with a corresponding
reduction in total system heat capacity from 58 to 35.1 kW. Although the heating capacity is
lower, the fuel to heat efficiency is maintained at a nearly constant 137 %. In addition, this
approach has maintained a hot water supply of 80 oC and an evaporator outlet temperature of
around 15-18 oC, as shown in Figure 6.30.
Figure 6.29: Total system heating capacity and water mass in control
strategy three.
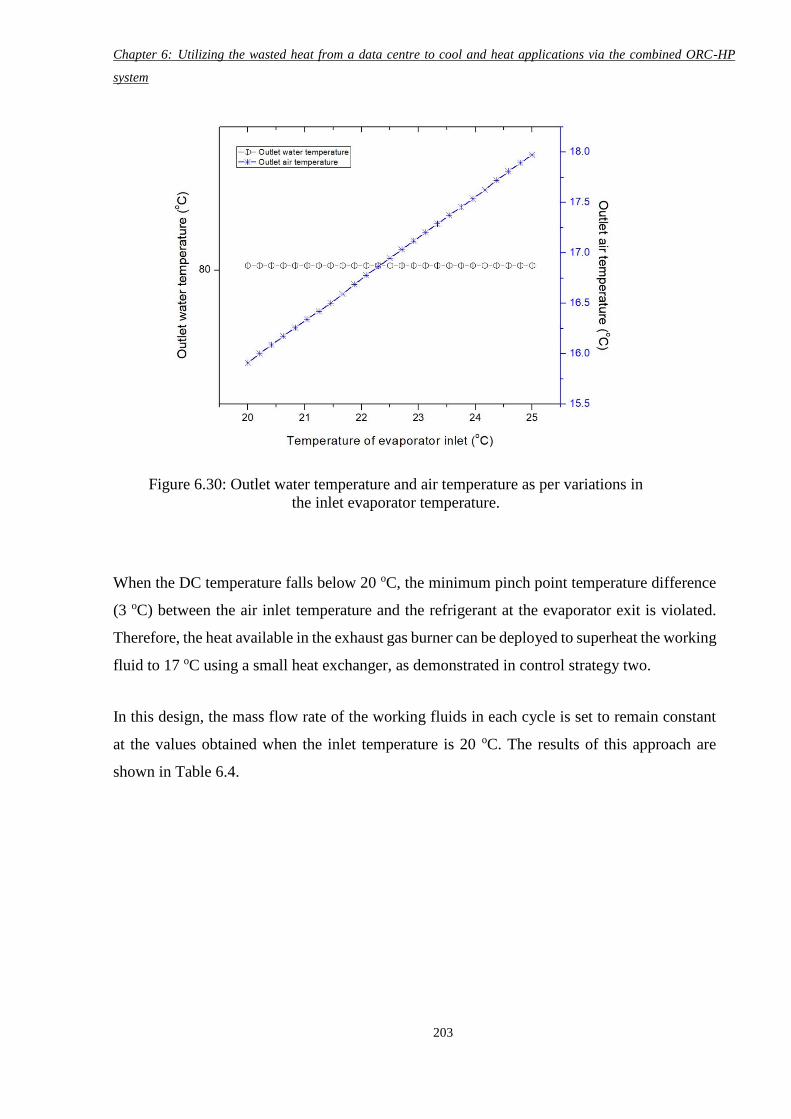
Chapter 6: Utilizing the wasted heat from a data centre to cool and heat applications via the combined ORC-HP
system
203
When the DC temperature falls below 20 oC, the minimum pinch point temperature difference
(3 oC) between the air inlet temperature and the refrigerant at the evaporator exit is violated.
Therefore, the heat available in the exhaust gas burner can be deployed to superheat the working
fluid to 17 oC using a small heat exchanger, as demonstrated in control strategy two.
In this design, the mass flow rate of the working fluids in each cycle is set to remain constant
at the values obtained when the inlet temperature is 20 oC. The results of this approach are
shown in Table 6.4.
Figure 6.30: Outlet water temperature and air temperature as per variations in
the inlet evaporator temperature.
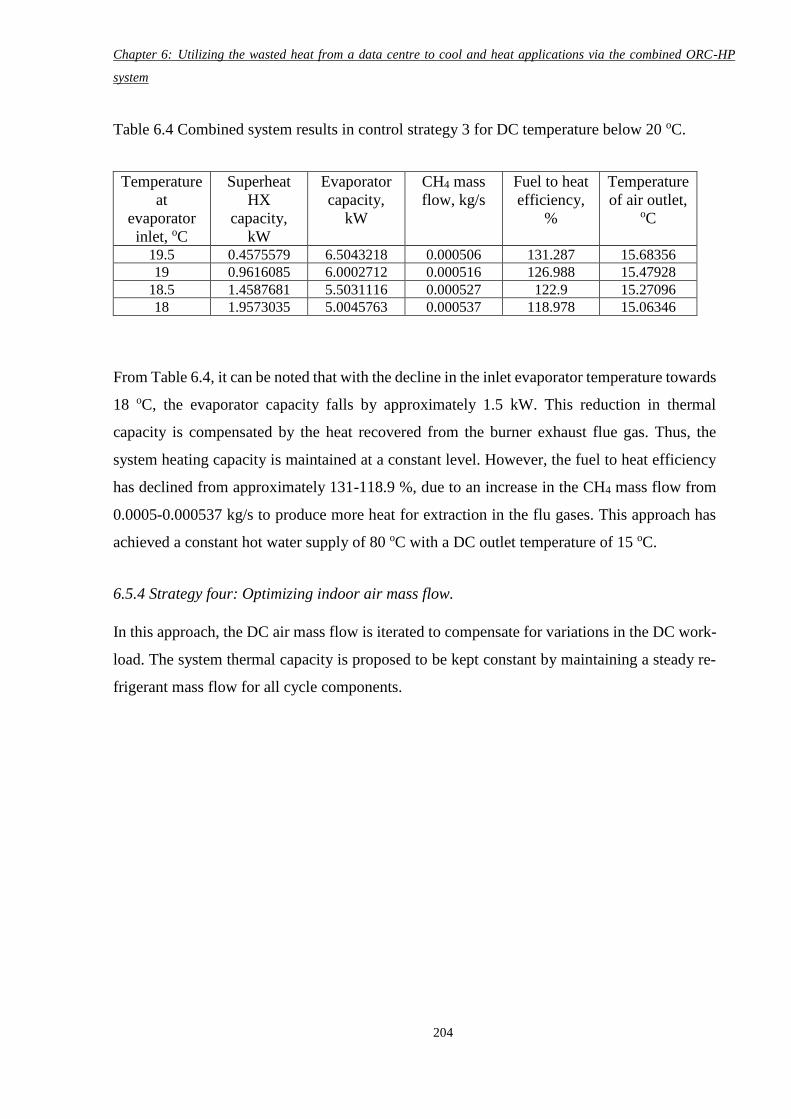
Chapter 6: Utilizing the wasted heat from a data centre to cool and heat applications via the combined ORC-HP
system
204
Table 6.4 Combined system results in control strategy 3 for DC temperature below 20 oC.
Temperature
at
evaporator
inlet, oC
Superheat
HX
capacity,
kW
Evaporator
capacity,
kW
CH4 mass
flow, kg/s
Fuel to heat
efficiency,
%
Temperature
of air outlet, oC
19.5 0.4575579 6.5043218 0.000506 131.287 15.68356
19 0.9616085 6.0002712 0.000516 126.988 15.47928
18.5 1.4587681 5.5031116 0.000527 122.9 15.27096
18 1.9573035 5.0045763 0.000537 118.978 15.06346
From Table 6.4, it can be noted that with the decline in the inlet evaporator temperature towards
18 oC, the evaporator capacity falls by approximately 1.5 kW. This reduction in thermal
capacity is compensated by the heat recovered from the burner exhaust flue gas. Thus, the
system heating capacity is maintained at a constant level. However, the fuel to heat efficiency
has declined from approximately 131-118.9 %, due to an increase in the CH4 mass flow from
0.0005-0.000537 kg/s to produce more heat for extraction in the flu gases. This approach has
achieved a constant hot water supply of 80 oC with a DC outlet temperature of 15 oC.
6.5.4 Strategy four: Optimizing indoor air mass flow.
In this approach, the DC air mass flow is iterated to compensate for variations in the DC work-
load. The system thermal capacity is proposed to be kept constant by maintaining a steady re-
frigerant mass flow for all cycle components.
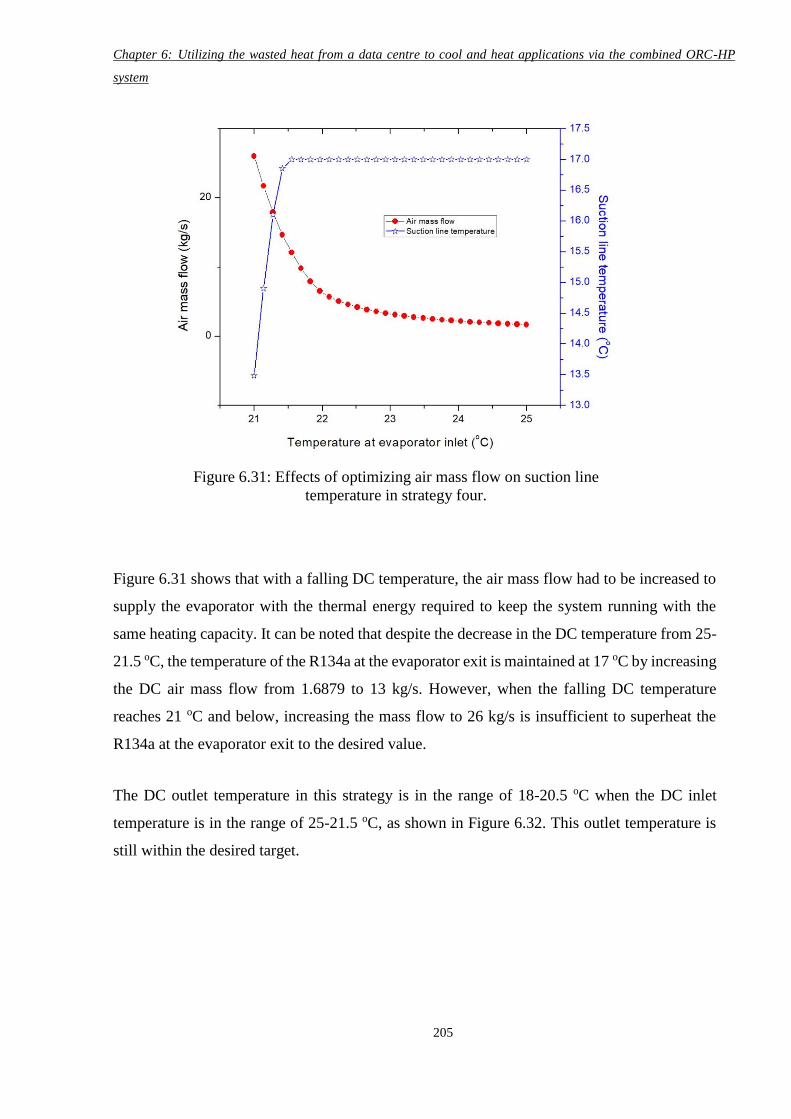
Chapter 6: Utilizing the wasted heat from a data centre to cool and heat applications via the combined ORC-HP
system
205
Figure 6.31 shows that with a falling DC temperature, the air mass flow had to be increased to
supply the evaporator with the thermal energy required to keep the system running with the
same heating capacity. It can be noted that despite the decrease in the DC temperature from 25-
21.5 oC, the temperature of the R134a at the evaporator exit is maintained at 17 oC by increasing
the DC air mass flow from 1.6879 to 13 kg/s. However, when the falling DC temperature
reaches 21 oC and below, increasing the mass flow to 26 kg/s is insufficient to superheat the
R134a at the evaporator exit to the desired value.
The DC outlet temperature in this strategy is in the range of 18-20.5 oC when the DC inlet
temperature is in the range of 25-21.5 oC, as shown in Figure 6.32. This outlet temperature is
still within the desired target.
Figure 6.31: Effects of optimizing air mass flow on suction line
temperature in strategy four.
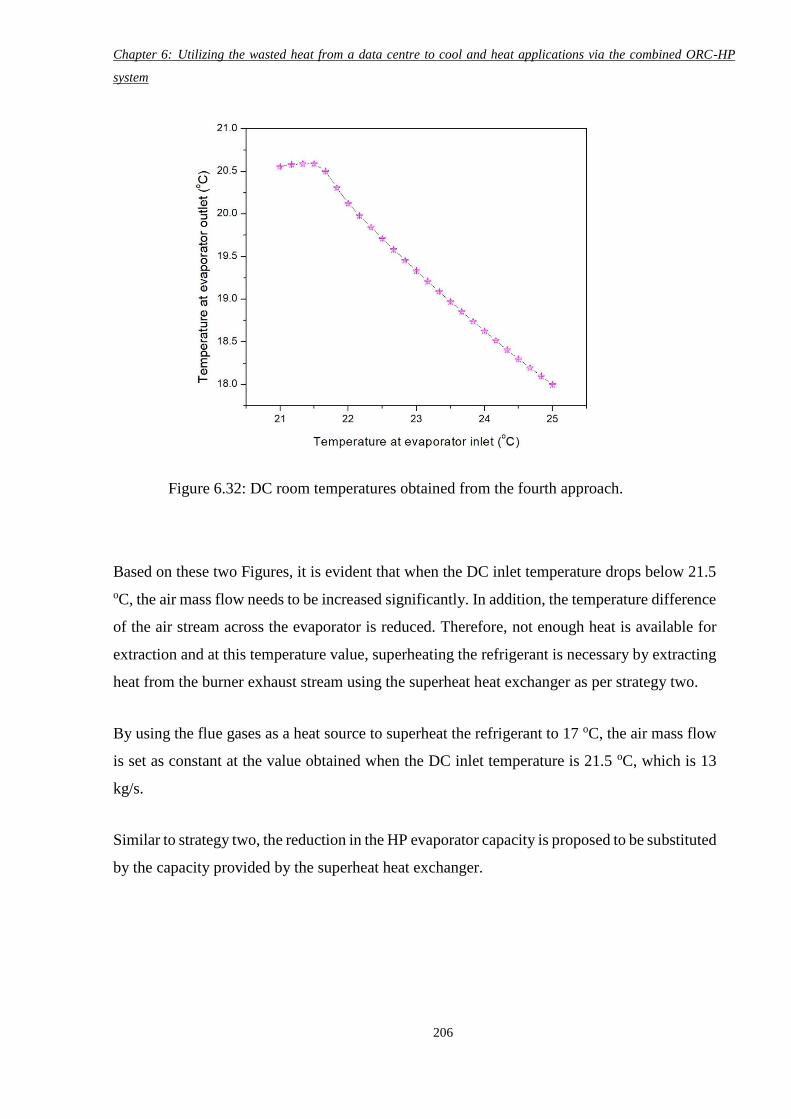
Chapter 6: Utilizing the wasted heat from a data centre to cool and heat applications via the combined ORC-HP
system
206
Based on these two Figures, it is evident that when the DC inlet temperature drops below 21.5
oC, the air mass flow needs to be increased significantly. In addition, the temperature difference
of the air stream across the evaporator is reduced. Therefore, not enough heat is available for
extraction and at this temperature value, superheating the refrigerant is necessary by extracting
heat from the burner exhaust stream using the superheat heat exchanger as per strategy two.
By using the flue gases as a heat source to superheat the refrigerant to 17 oC, the air mass flow
is set as constant at the value obtained when the DC inlet temperature is 21.5 oC, which is 13
kg/s.
Similar to strategy two, the reduction in the HP evaporator capacity is proposed to be substituted
by the capacity provided by the superheat heat exchanger.
Figure 6.32: DC room temperatures obtained from the fourth approach.
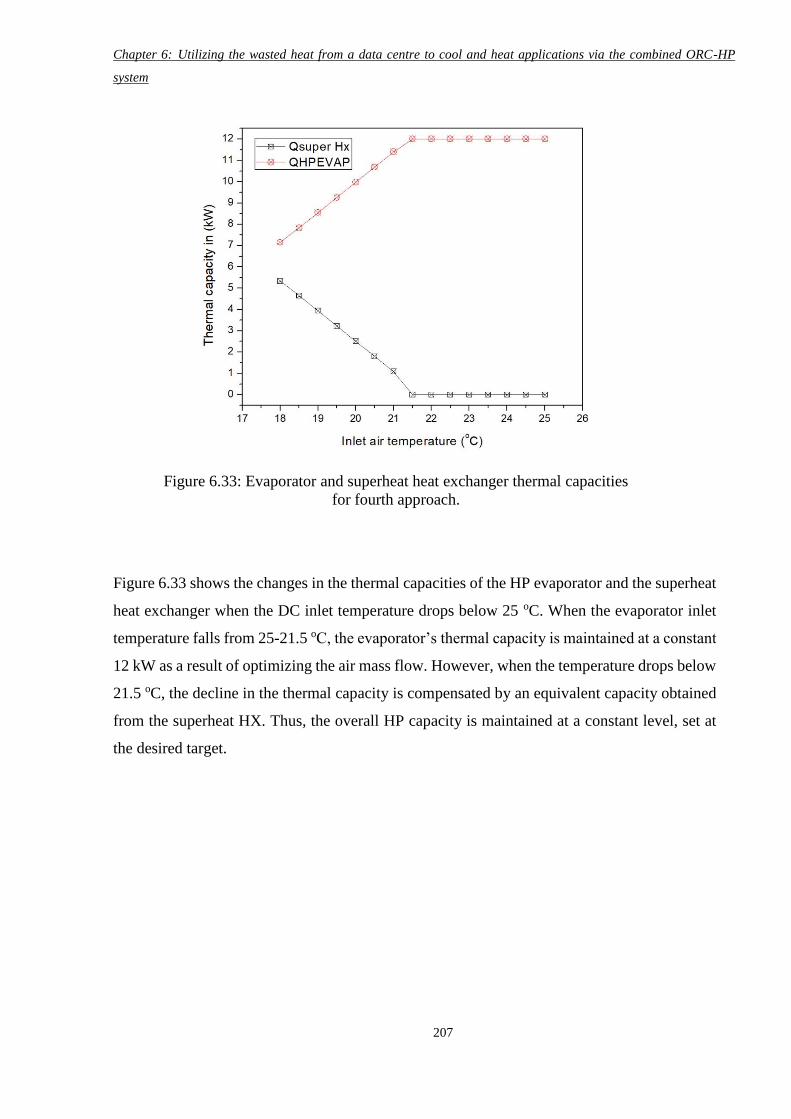
Chapter 6: Utilizing the wasted heat from a data centre to cool and heat applications via the combined ORC-HP
system
207
Figure 6.33 shows the changes in the thermal capacities of the HP evaporator and the superheat
heat exchanger when the DC inlet temperature drops below 25 oC. When the evaporator inlet
temperature falls from 25-21.5 oC, the evaporator’s thermal capacity is maintained at a constant
12 kW as a result of optimizing the air mass flow. However, when the temperature drops below
21.5 oC, the decline in the thermal capacity is compensated by an equivalent capacity obtained
from the superheat HX. Thus, the overall HP capacity is maintained at a constant level, set at
the desired target.
Figure 6.33: Evaporator and superheat heat exchanger thermal capacities
for fourth approach.

Chapter 6: Utilizing the wasted heat from a data centre to cool and heat applications via the combined ORC-HP
system
208
Figure 6.34 shows that with the fall in DC temperature, the fuel mass flow increases from the
steady state value to 0.000975401 kg/s to produce the required thermal energy to feed the ORC
evaporator and superheat exchanger. As a result, the overall fuel to heat efficiency falls from
137 to 111.8%.
In this design, the total heating capacity of the system is maintained at a constant level, and the
final water temperature is kept at 80 oC.
Figure 6.34: Methane mass flow and fuel to heat efficiency for the fourth
approach.
Chapter 6: Utilizing the wasted heat from a data centre to cool and heat applications via the combined ORC-HP
system
209
6.6 Conclusion
In this chapter, a gas driven combined HP-ORC cycle was numerically investigated for the
purpose of data centre (DC) cooling, with waste heat utilized to provide a central heating
supply. A comprehensive assessment was conducted in terms of design configuration, best
theoretical performance, and the control strategies needed to maintain optimal system
performance despite fluctuations in DC workload.
When the DC operates at its maximum thermal workload (12 kW), the combined system has
provided a cooling effect by pumping wasted heat from the DC and maintaining the indoor
temperature at between 18-25 oC. This extracted heat has been recovered to provide central
heating by lifting returnee water from 50-80 oC. The overall fuel to heat efficiency achieved is
137%. When the DC workload varies, four control strategies are proposed to maintain the DC
indoor temperature within the target range. Additional heat extracted from ambient air was
proposed as a substitute for the reduction in thermal capacity of the DC while maintaining
steady fuel to heat efficiency. However, the potential of this strategy is limited by the
temperature of the outdoor environment. Alternatively, the thermal energy contained in the flue
gases can be used to compensate for the decline in HP evaporator duty. In this proposed
strategy, Methane mass flow consequently increases, resulting in lower fuel to heat efficiency
(112 %). In both these strategies, the total heating capacity of the combined system is
maintained at a constant level (58 kW). However, in the third control strategy, the total capacity
was reduced by adjusting working fluids (water, R134a and R245fa) mass flow to maintain an
optimum level of fuel to heat efficiency. The DC indoor air mass flow can be adjusted to
increase heat extraction when the DC indoor temperature drops below 25 oC. This mechanism
is valid in a limited DC indoor temperature range (25- 21.5 oC). In both strategies three and
four, when the proposed mechanism is limited, heat from flue gases can be used to overcome
the reduction in thermal energy at the expense of the fuel to heat efficiency.
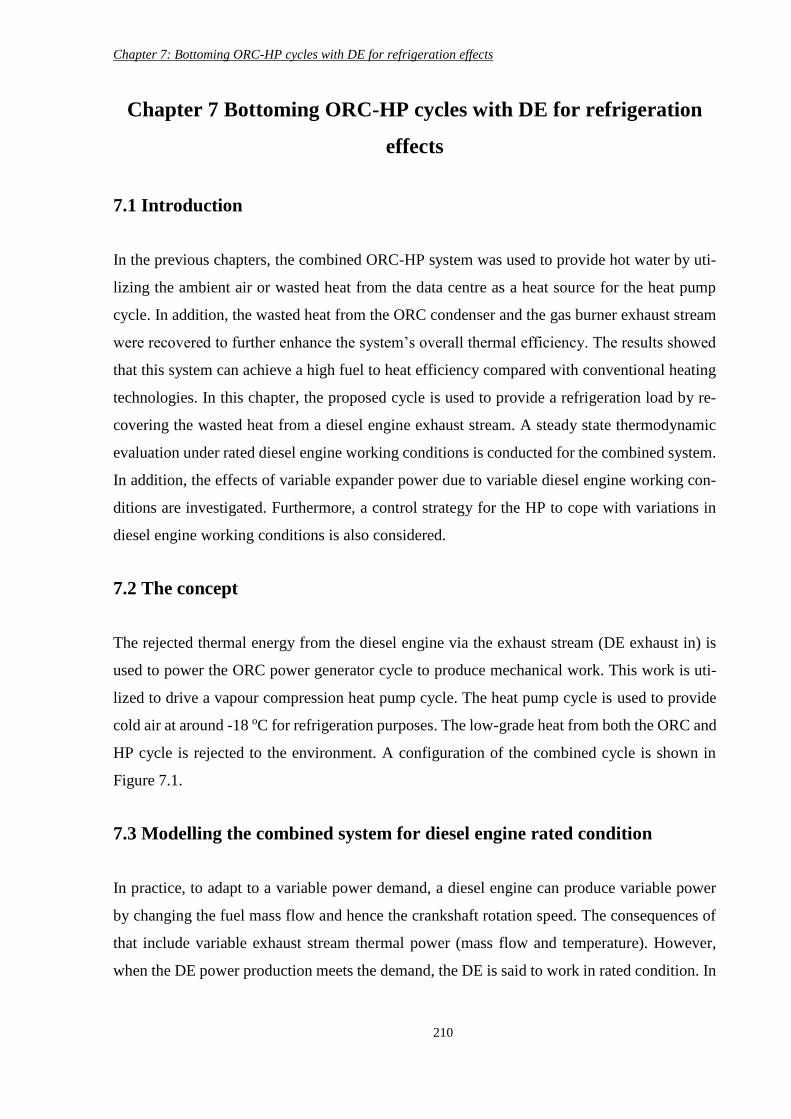
Chapter 7: Bottoming ORC-HP cycles with DE for refrigeration effects
210
Chapter 7 Bottoming ORC-HP cycles with DE for refrigeration
effects
7.1 Introduction
In the previous chapters, the combined ORC-HP system was used to provide hot water by uti-
lizing the ambient air or wasted heat from the data centre as a heat source for the heat pump
cycle. In addition, the wasted heat from the ORC condenser and the gas burner exhaust stream
were recovered to further enhance the system’s overall thermal efficiency. The results showed
that this system can achieve a high fuel to heat efficiency compared with conventional heating
technologies. In this chapter, the proposed cycle is used to provide a refrigeration load by re-
covering the wasted heat from a diesel engine exhaust stream. A steady state thermodynamic
evaluation under rated diesel engine working conditions is conducted for the combined system.
In addition, the effects of variable expander power due to variable diesel engine working con-
ditions are investigated. Furthermore, a control strategy for the HP to cope with variations in
diesel engine working conditions is also considered.
7.2 The concept
The rejected thermal energy from the diesel engine via the exhaust stream (DE exhaust in) is
used to power the ORC power generator cycle to produce mechanical work. This work is uti-
lized to drive a vapour compression heat pump cycle. The heat pump cycle is used to provide
cold air at around -18 oC for refrigeration purposes. The low-grade heat from both the ORC and
HP cycle is rejected to the environment. A configuration of the combined cycle is shown in
Figure 7.1.
7.3 Modelling the combined system for diesel engine rated condition
In practice, to adapt to a variable power demand, a diesel engine can produce variable power
by changing the fuel mass flow and hence the crankshaft rotation speed. The consequences of
that include variable exhaust stream thermal power (mass flow and temperature). However,
when the DE power production meets the demand, the DE is said to work in rated condition. In
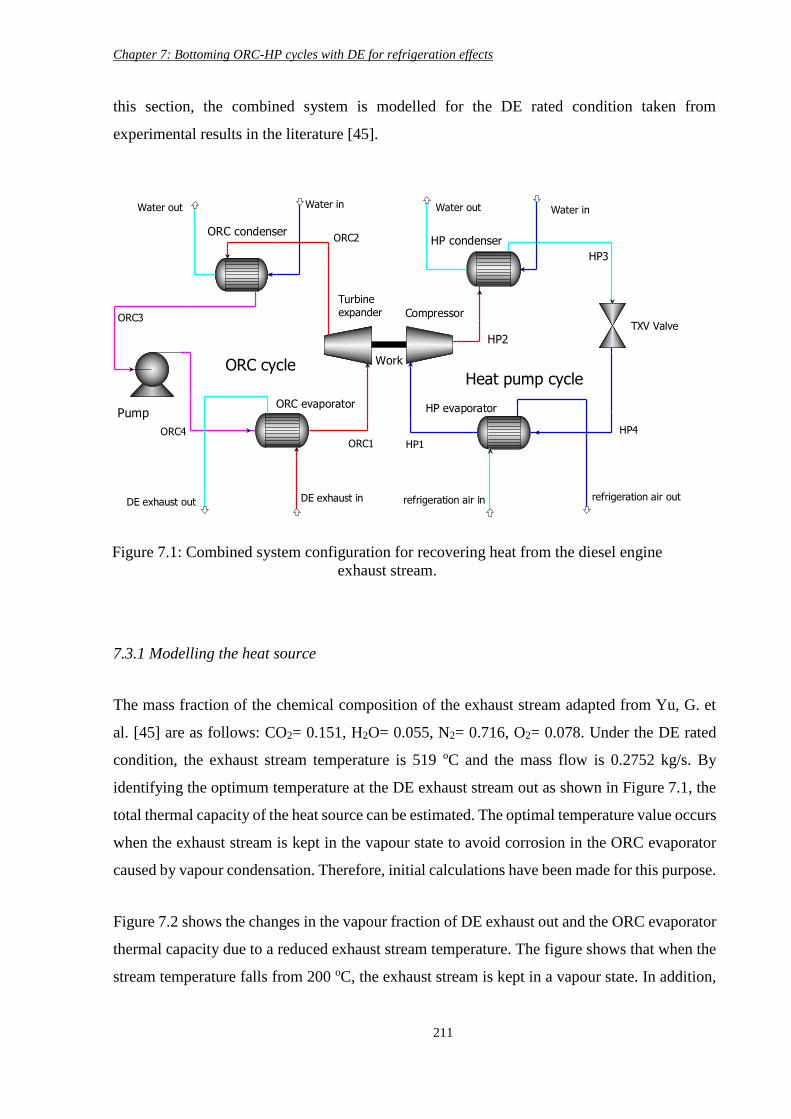
Chapter 7: Bottoming ORC-HP cycles with DE for refrigeration effects
211
this section, the combined system is modelled for the DE rated condition taken from
experimental results in the literature [45].
7.3.1 Modelling the heat source
The mass fraction of the chemical composition of the exhaust stream adapted from Yu, G. et
al. [45] are as follows: CO2= 0.151, H2O= 0.055, N2= 0.716, O2= 0.078. Under the DE rated
condition, the exhaust stream temperature is 519 oC and the mass flow is 0.2752 kg/s. By
identifying the optimum temperature at the DE exhaust stream out as shown in Figure 7.1, the
total thermal capacity of the heat source can be estimated. The optimal temperature value occurs
when the exhaust stream is kept in the vapour state to avoid corrosion in the ORC evaporator
caused by vapour condensation. Therefore, initial calculations have been made for this purpose.
Figure 7.2 shows the changes in the vapour fraction of DE exhaust out and the ORC evaporator
thermal capacity due to a reduced exhaust stream temperature. The figure shows that when the
stream temperature falls from 200 oC, the exhaust stream is kept in a vapour state. In addition,
Figure 7.1: Combined system configuration for recovering heat from the diesel engine
exhaust stream.
Heat pump cycleORC cycle
HP evaporator
HP condenser
ORC evaporator
ORC condenser
Pump
Turbine
expander CompressorTXV Valve
Water in
HP1
HP2
HP3
HP4
refrigeration air in
ORC1
ORC2
ORC3
ORC4
refrigeration air outDE exhaust in
Work
DE exhaust out
Water outWater inWater out
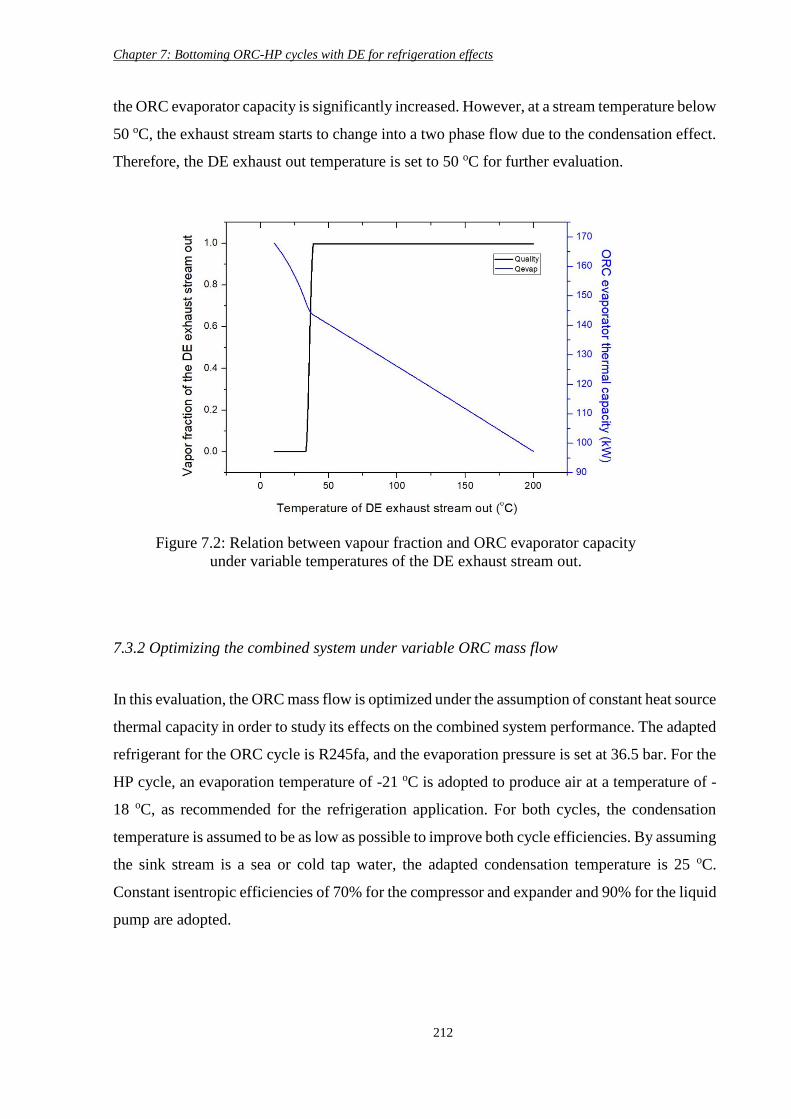
Chapter 7: Bottoming ORC-HP cycles with DE for refrigeration effects
212
the ORC evaporator capacity is significantly increased. However, at a stream temperature below
50 oC, the exhaust stream starts to change into a two phase flow due to the condensation effect.
Therefore, the DE exhaust out temperature is set to 50 oC for further evaluation.
7.3.2 Optimizing the combined system under variable ORC mass flow
In this evaluation, the ORC mass flow is optimized under the assumption of constant heat source
thermal capacity in order to study its effects on the combined system performance. The adapted
refrigerant for the ORC cycle is R245fa, and the evaporation pressure is set at 36.5 bar. For the
HP cycle, an evaporation temperature of -21 oC is adopted to produce air at a temperature of -
18 oC, as recommended for the refrigeration application. For both cycles, the condensation
temperature is assumed to be as low as possible to improve both cycle efficiencies. By assuming
the sink stream is a sea or cold tap water, the adapted condensation temperature is 25 oC.
Constant isentropic efficiencies of 70% for the compressor and expander and 90% for the liquid
pump are adopted.
Figure 7.2: Relation between vapour fraction and ORC evaporator capacity
under variable temperatures of the DE exhaust stream out.
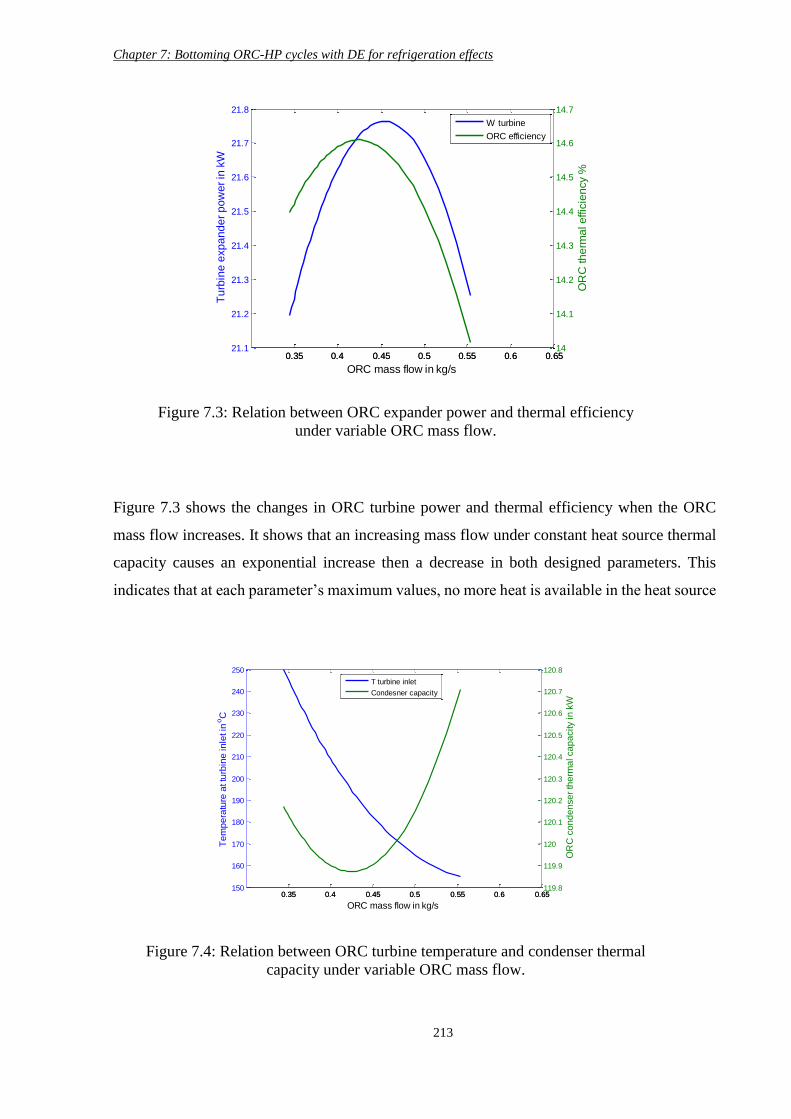
Chapter 7: Bottoming ORC-HP cycles with DE for refrigeration effects
213
Figure 7.3 shows the changes in ORC turbine power and thermal efficiency when the ORC
mass flow increases. It shows that an increasing mass flow under constant heat source thermal
capacity causes an exponential increase then a decrease in both designed parameters. This
indicates that at each parameter’s maximum values, no more heat is available in the heat source
0.35 0.4 0.45 0.5 0.55 0.6 0.6521.1
21.2
21.3
21.4
21.5
21.6
21.7
21.8
Tu
rbin
e e
xp
an
de
r p
ow
er
in k
W
ORC mass flow in kg/s
0.35 0.4 0.45 0.5 0.55 0.6 0.6514
14.1
14.2
14.3
14.4
14.5
14.6
14.7
OR
C th
erm
al e
ffic
ien
cy %
W turbine
ORC efficiency
Figure 7.3: Relation between ORC expander power and thermal efficiency
under variable ORC mass flow.
Figure 7.4: Relation between ORC turbine temperature and condenser thermal
capacity under variable ORC mass flow.
0.35 0.4 0.45 0.5 0.55 0.6 0.65150
160
170
180
190
200
210
220
230
240
250
Te
mp
era
ture
at tu
rbin
e in
let in
oC
ORC mass flow in kg/s
0.35 0.4 0.45 0.5 0.55 0.6 0.65119.8
119.9
120
120.1
120.2
120.3
120.4
120.5
120.6
120.7
120.8
OR
C c
on
de
nse
r th
erm
al ca
pa
city in
kW
T turbine inlet
Condesner capacity
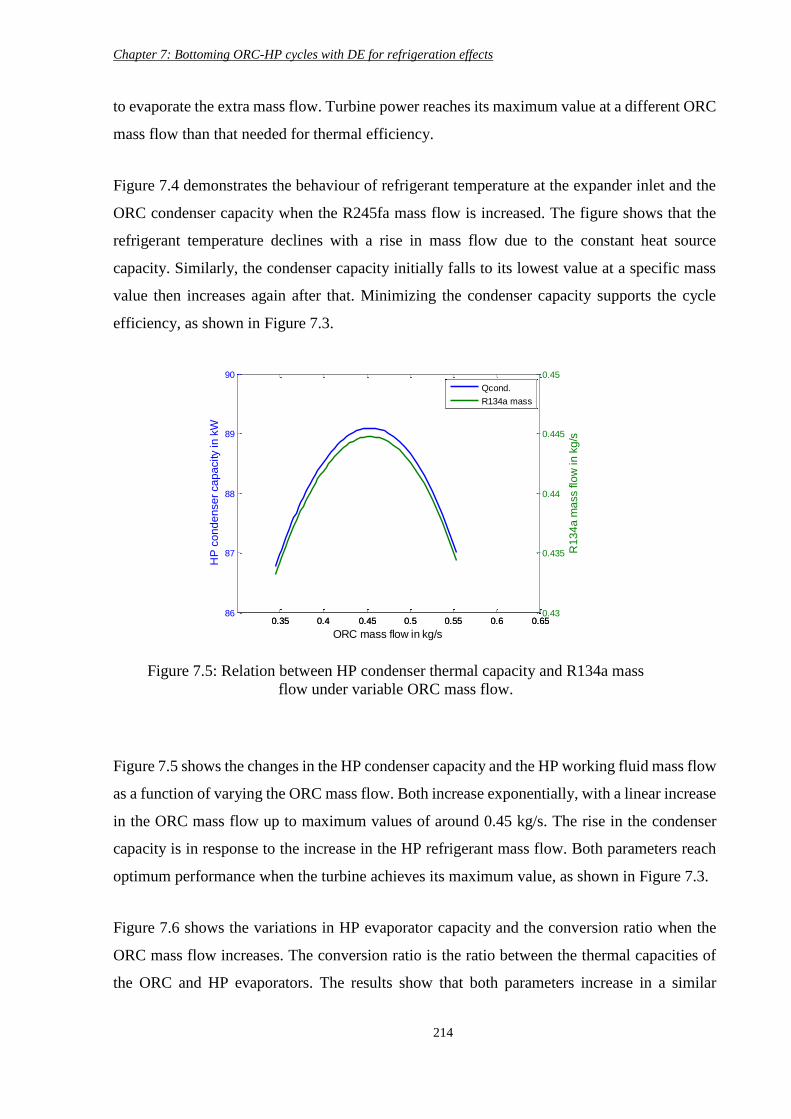
Chapter 7: Bottoming ORC-HP cycles with DE for refrigeration effects
214
to evaporate the extra mass flow. Turbine power reaches its maximum value at a different ORC
mass flow than that needed for thermal efficiency.
Figure 7.4 demonstrates the behaviour of refrigerant temperature at the expander inlet and the
ORC condenser capacity when the R245fa mass flow is increased. The figure shows that the
refrigerant temperature declines with a rise in mass flow due to the constant heat source
capacity. Similarly, the condenser capacity initially falls to its lowest value at a specific mass
value then increases again after that. Minimizing the condenser capacity supports the cycle
efficiency, as shown in Figure 7.3.
Figure 7.5 shows the changes in the HP condenser capacity and the HP working fluid mass flow
as a function of varying the ORC mass flow. Both increase exponentially, with a linear increase
in the ORC mass flow up to maximum values of around 0.45 kg/s. The rise in the condenser
capacity is in response to the increase in the HP refrigerant mass flow. Both parameters reach
optimum performance when the turbine achieves its maximum value, as shown in Figure 7.3.
Figure 7.6 shows the variations in HP evaporator capacity and the conversion ratio when the
ORC mass flow increases. The conversion ratio is the ratio between the thermal capacities of
the ORC and HP evaporators. The results show that both parameters increase in a similar
Figure 7.5: Relation between HP condenser thermal capacity and R134a mass
flow under variable ORC mass flow.
0.35 0.4 0.45 0.5 0.55 0.6 0.6586
87
88
89
90
HP
co
nd
en
se
r ca
pa
city in
kW
ORC mass flow in kg/s
0.35 0.4 0.45 0.5 0.55 0.6 0.650.43
0.435
0.44
0.445
0.45
R1
34
a m
ass flo
w in
kg
/s
Qcond.
R134a mass
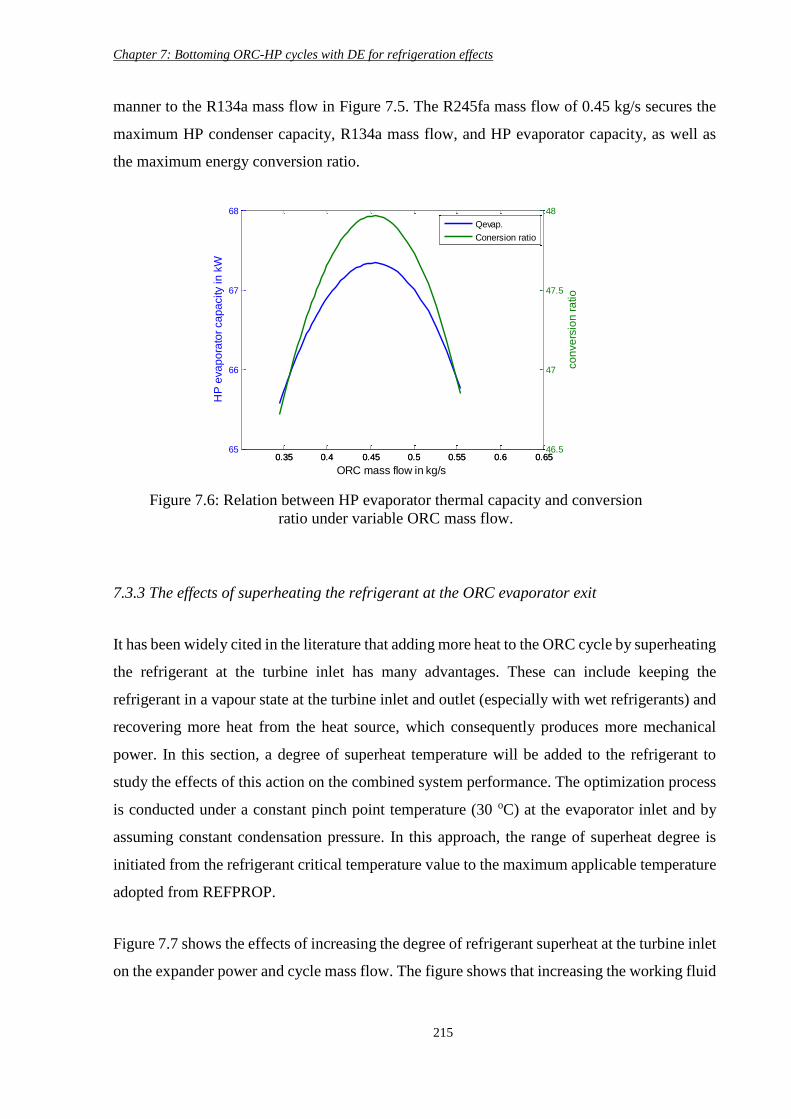
Chapter 7: Bottoming ORC-HP cycles with DE for refrigeration effects
215
manner to the R134a mass flow in Figure 7.5. The R245fa mass flow of 0.45 kg/s secures the
maximum HP condenser capacity, R134a mass flow, and HP evaporator capacity, as well as
the maximum energy conversion ratio.
7.3.3 The effects of superheating the refrigerant at the ORC evaporator exit
It has been widely cited in the literature that adding more heat to the ORC cycle by superheating
the refrigerant at the turbine inlet has many advantages. These can include keeping the
refrigerant in a vapour state at the turbine inlet and outlet (especially with wet refrigerants) and
recovering more heat from the heat source, which consequently produces more mechanical
power. In this section, a degree of superheat temperature will be added to the refrigerant to
study the effects of this action on the combined system performance. The optimization process
is conducted under a constant pinch point temperature (30 oC) at the evaporator inlet and by
assuming constant condensation pressure. In this approach, the range of superheat degree is
initiated from the refrigerant critical temperature value to the maximum applicable temperature
adopted from REFPROP.
Figure 7.7 shows the effects of increasing the degree of refrigerant superheat at the turbine inlet
on the expander power and cycle mass flow. The figure shows that increasing the working fluid
0.35 0.4 0.45 0.5 0.55 0.6 0.6565
66
67
68H
P e
va
po
rato
r ca
pa
city in
kW
ORC mass flow in kg/s
0.35 0.4 0.45 0.5 0.55 0.6 0.6546.5
47
47.5
48
co
nve
rsio
n r
atio
Qevap.
Conersion ratio
Figure 7.6: Relation between HP evaporator thermal capacity and conversion
ratio under variable ORC mass flow.
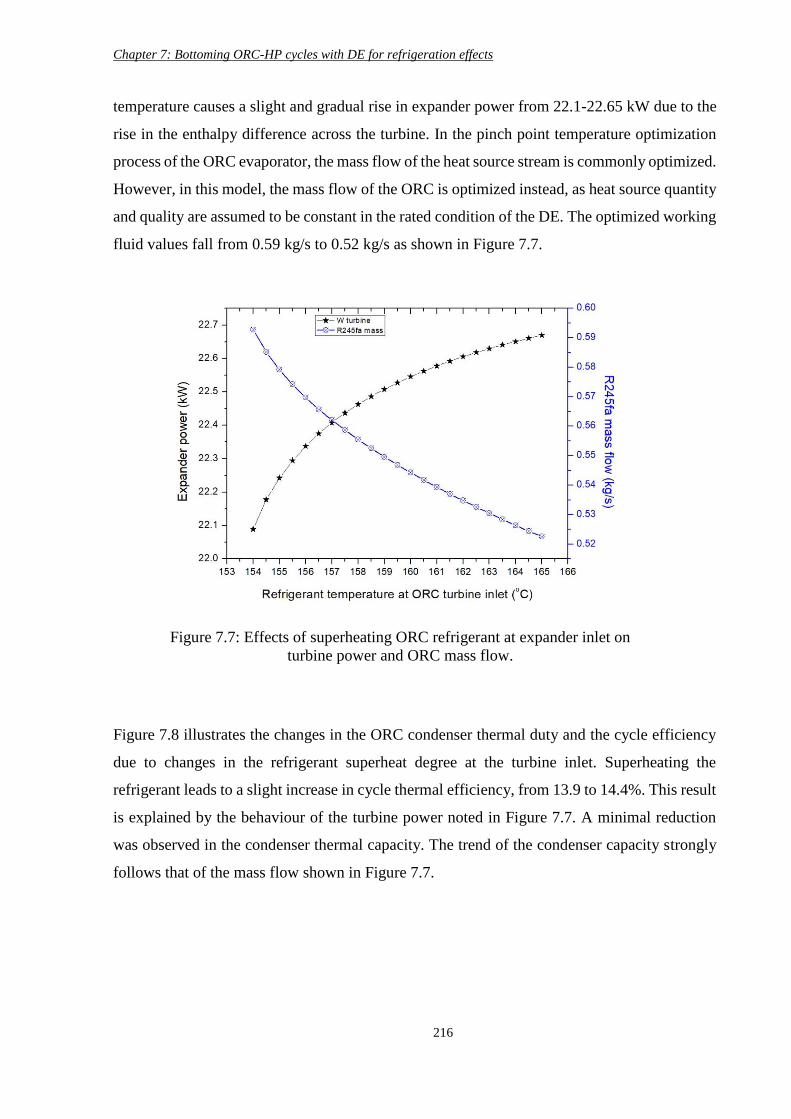
Chapter 7: Bottoming ORC-HP cycles with DE for refrigeration effects
216
temperature causes a slight and gradual rise in expander power from 22.1-22.65 kW due to the
rise in the enthalpy difference across the turbine. In the pinch point temperature optimization
process of the ORC evaporator, the mass flow of the heat source stream is commonly optimized.
However, in this model, the mass flow of the ORC is optimized instead, as heat source quantity
and quality are assumed to be constant in the rated condition of the DE. The optimized working
fluid values fall from 0.59 kg/s to 0.52 kg/s as shown in Figure 7.7.
Figure 7.8 illustrates the changes in the ORC condenser thermal duty and the cycle efficiency
due to changes in the refrigerant superheat degree at the turbine inlet. Superheating the
refrigerant leads to a slight increase in cycle thermal efficiency, from 13.9 to 14.4%. This result
is explained by the behaviour of the turbine power noted in Figure 7.7. A minimal reduction
was observed in the condenser thermal capacity. The trend of the condenser capacity strongly
follows that of the mass flow shown in Figure 7.7.
Figure 7.7: Effects of superheating ORC refrigerant at expander inlet on
turbine power and ORC mass flow.
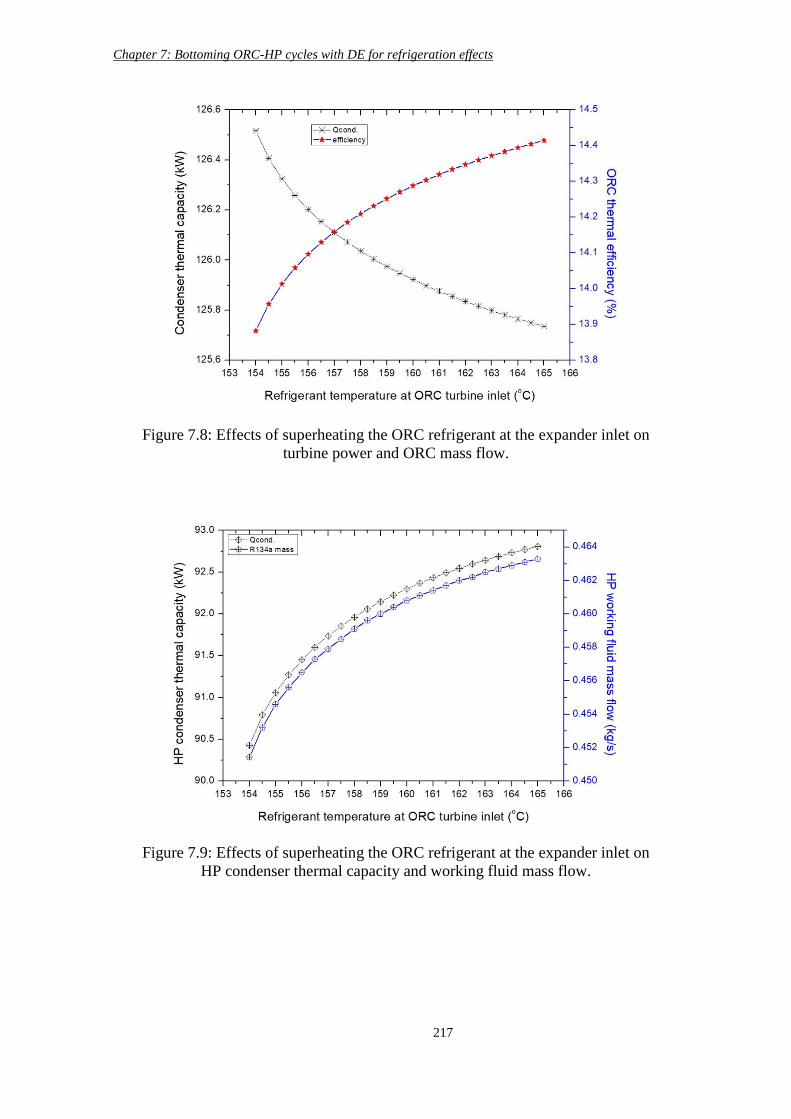
Chapter 7: Bottoming ORC-HP cycles with DE for refrigeration effects
217
Figure 7.8: Effects of superheating the ORC refrigerant at the expander inlet on
turbine power and ORC mass flow.
Figure 7.9: Effects of superheating the ORC refrigerant at the expander inlet on
HP condenser thermal capacity and working fluid mass flow.
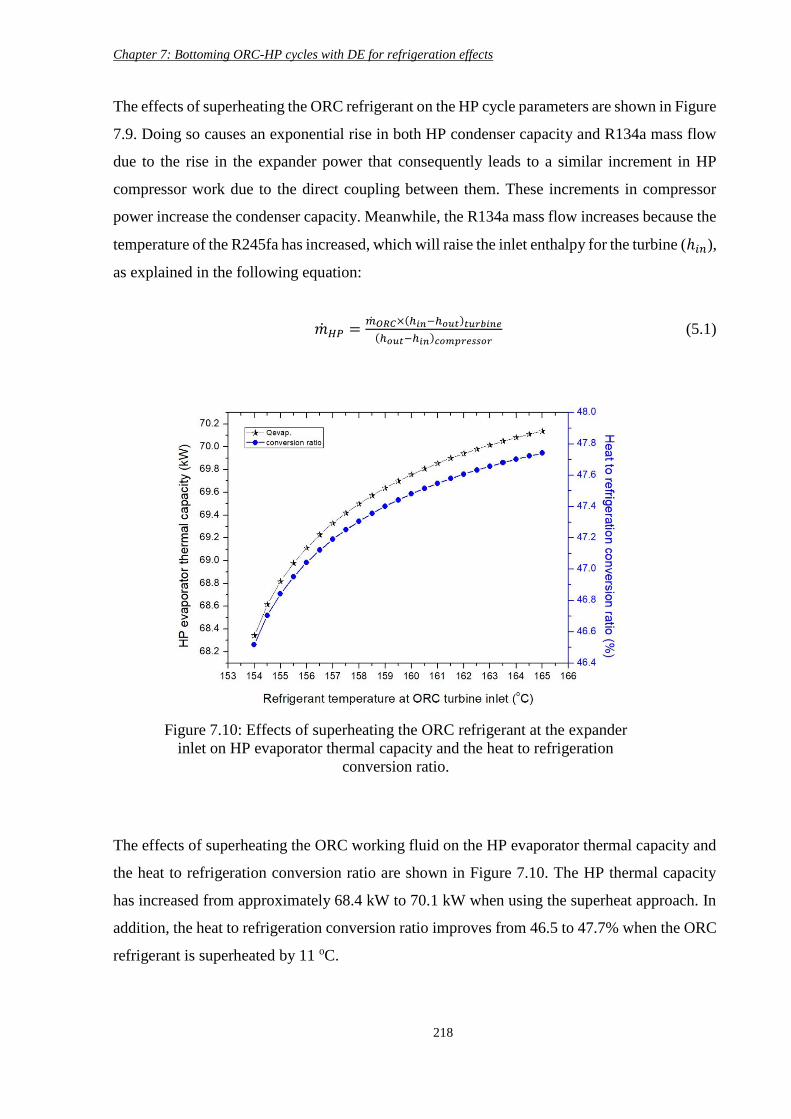
Chapter 7: Bottoming ORC-HP cycles with DE for refrigeration effects
218
The effects of superheating the ORC refrigerant on the HP cycle parameters are shown in Figure
7.9. Doing so causes an exponential rise in both HP condenser capacity and R134a mass flow
due to the rise in the expander power that consequently leads to a similar increment in HP
compressor work due to the direct coupling between them. These increments in compressor
power increase the condenser capacity. Meanwhile, the R134a mass flow increases because the
temperature of the R245fa has increased, which will raise the inlet enthalpy for the turbine (ℎ𝑖𝑛),
as explained in the following equation:
��𝐻𝑃 =��𝑂𝑅𝐶×(ℎ𝑖𝑛−ℎ𝑜𝑢𝑡)𝑡𝑢𝑟𝑏𝑖𝑛𝑒
(ℎ𝑜𝑢𝑡−ℎ𝑖𝑛)𝑐𝑜𝑚𝑝𝑟𝑒𝑠𝑠𝑜𝑟 (5.1)
The effects of superheating the ORC working fluid on the HP evaporator thermal capacity and
the heat to refrigeration conversion ratio are shown in Figure 7.10. The HP thermal capacity
has increased from approximately 68.4 kW to 70.1 kW when using the superheat approach. In
addition, the heat to refrigeration conversion ratio improves from 46.5 to 47.7% when the ORC
refrigerant is superheated by 11 oC.
Figure 7.10: Effects of superheating the ORC refrigerant at the expander
inlet on HP evaporator thermal capacity and the heat to refrigeration
conversion ratio.
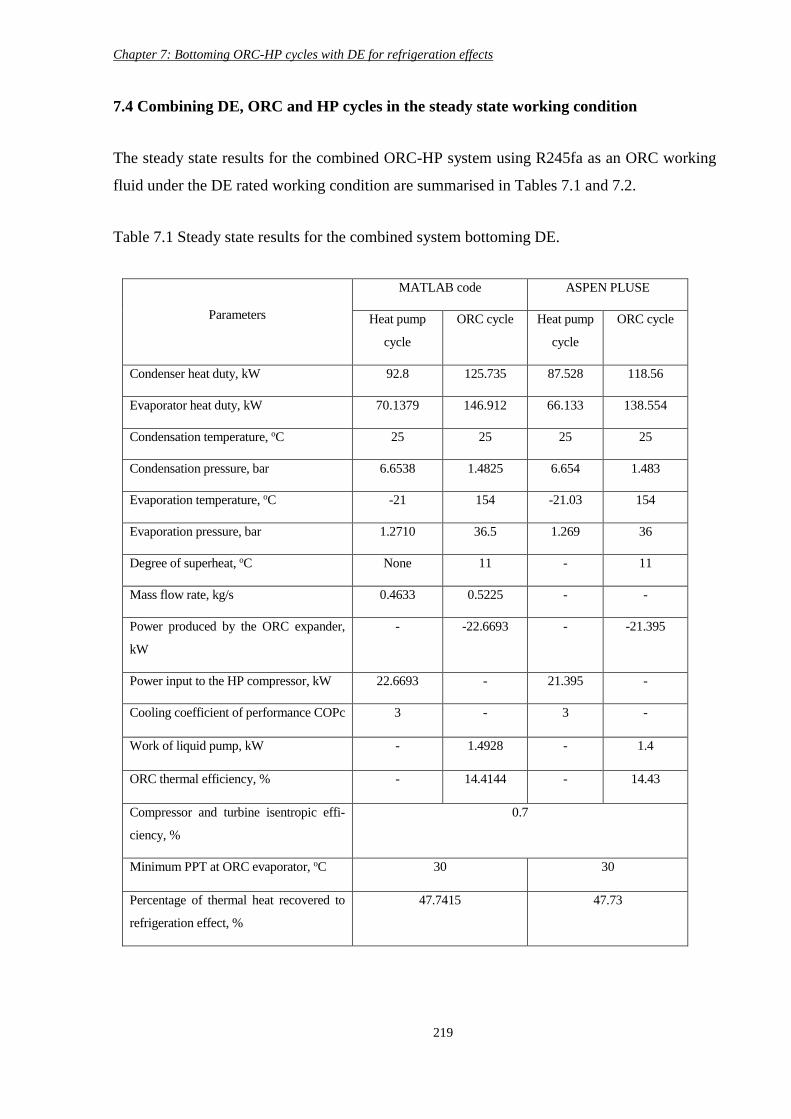
Chapter 7: Bottoming ORC-HP cycles with DE for refrigeration effects
219
7.4 Combining DE, ORC and HP cycles in the steady state working condition
The steady state results for the combined ORC-HP system using R245fa as an ORC working
fluid under the DE rated working condition are summarised in Tables 7.1 and 7.2.
Table 7.1 Steady state results for the combined system bottoming DE.
Parameters
MATLAB code ASPEN PLUSE
Heat pump
cycle
ORC cycle Heat pump
cycle
ORC cycle
Condenser heat duty, kW 92.8 125.735 87.528 118.56
Evaporator heat duty, kW 70.1379 146.912 66.133 138.554
Condensation temperature, oC 25 25 25 25
Condensation pressure, bar 6.6538 1.4825 6.654 1.483
Evaporation temperature, oC -21 154 -21.03 154
Evaporation pressure, bar 1.2710 36.5 1.269 36
Degree of superheat, oC None 11 - 11
Mass flow rate, kg/s 0.4633 0.5225 - -
Power produced by the ORC expander,
kW
- -22.6693 - -21.395
Power input to the HP compressor, kW 22.6693 - 21.395 -
Cooling coefficient of performance COPc 3 - 3 -
Work of liquid pump, kW - 1.4928 - 1.4
ORC thermal efficiency, % - 14.4144 - 14.43
Compressor and turbine isentropic effi-
ciency, %
0.7
Minimum PPT at ORC evaporator, oC 30 30
Percentage of thermal heat recovered to
refrigeration effect, %
47.7415 47.73
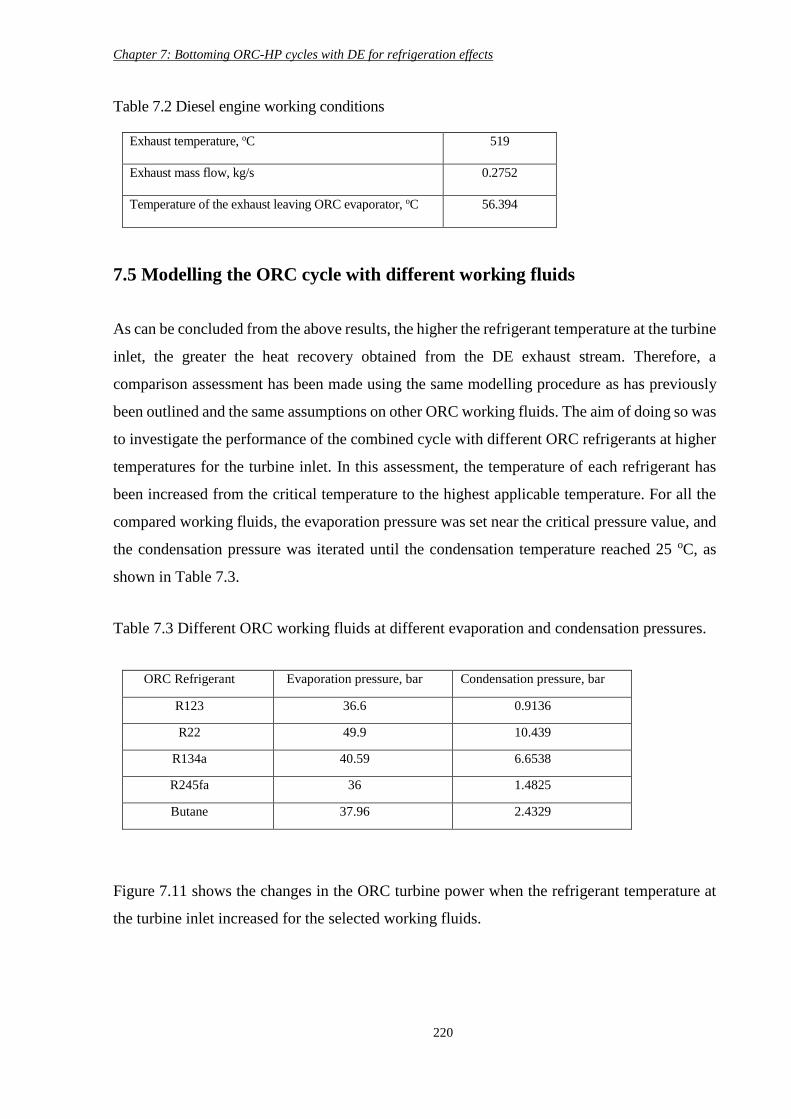
Chapter 7: Bottoming ORC-HP cycles with DE for refrigeration effects
220
Table 7.2 Diesel engine working conditions
Exhaust temperature, oC 519
Exhaust mass flow, kg/s 0.2752
Temperature of the exhaust leaving ORC evaporator, oC 56.394
7.5 Modelling the ORC cycle with different working fluids
As can be concluded from the above results, the higher the refrigerant temperature at the turbine
inlet, the greater the heat recovery obtained from the DE exhaust stream. Therefore, a
comparison assessment has been made using the same modelling procedure as has previously
been outlined and the same assumptions on other ORC working fluids. The aim of doing so was
to investigate the performance of the combined cycle with different ORC refrigerants at higher
temperatures for the turbine inlet. In this assessment, the temperature of each refrigerant has
been increased from the critical temperature to the highest applicable temperature. For all the
compared working fluids, the evaporation pressure was set near the critical pressure value, and
the condensation pressure was iterated until the condensation temperature reached 25 oC, as
shown in Table 7.3.
Table 7.3 Different ORC working fluids at different evaporation and condensation pressures.
ORC Refrigerant Evaporation pressure, bar Condensation pressure, bar
R123 36.6 0.9136
R22 49.9 10.439
R134a 40.59 6.6538
R245fa 36 1.4825
Butane 37.96 2.4329
Figure 7.11 shows the changes in the ORC turbine power when the refrigerant temperature at
the turbine inlet increased for the selected working fluids.
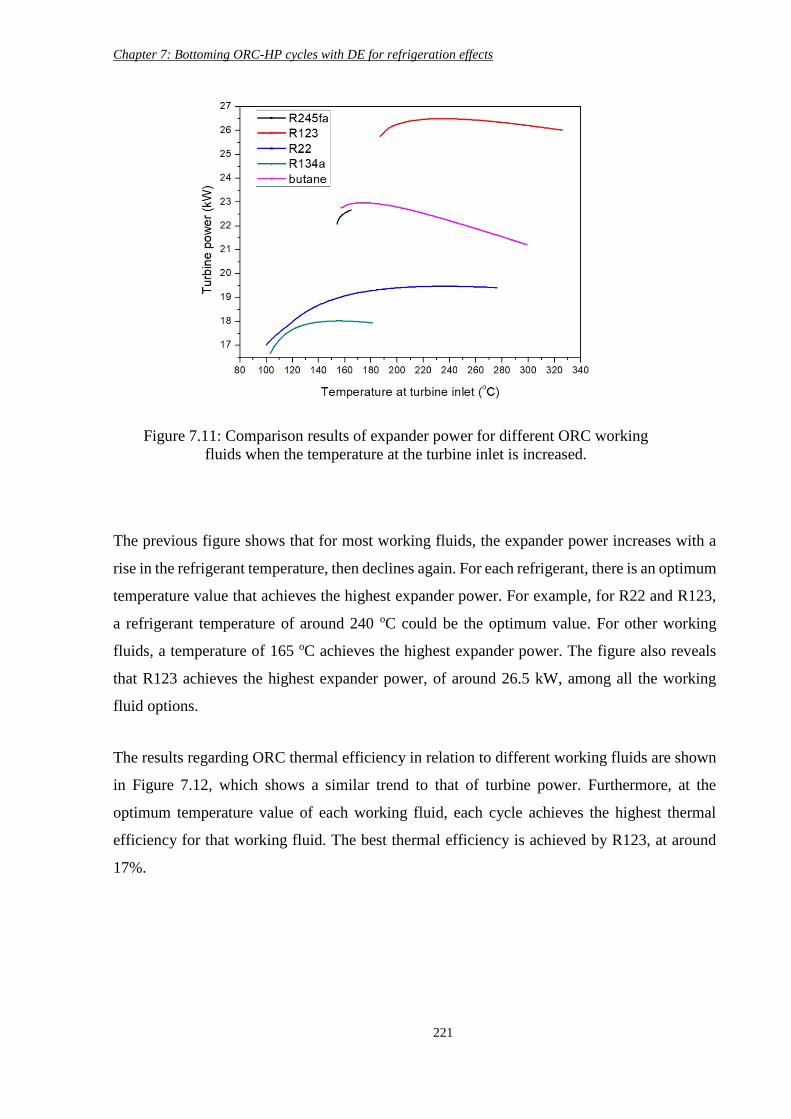
Chapter 7: Bottoming ORC-HP cycles with DE for refrigeration effects
221
The previous figure shows that for most working fluids, the expander power increases with a
rise in the refrigerant temperature, then declines again. For each refrigerant, there is an optimum
temperature value that achieves the highest expander power. For example, for R22 and R123,
a refrigerant temperature of around 240 oC could be the optimum value. For other working
fluids, a temperature of 165 oC achieves the highest expander power. The figure also reveals
that R123 achieves the highest expander power, of around 26.5 kW, among all the working
fluid options.
The results regarding ORC thermal efficiency in relation to different working fluids are shown
in Figure 7.12, which shows a similar trend to that of turbine power. Furthermore, at the
optimum temperature value of each working fluid, each cycle achieves the highest thermal
efficiency for that working fluid. The best thermal efficiency is achieved by R123, at around
17%.
Figure 7.11: Comparison results of expander power for different ORC working
fluids when the temperature at the turbine inlet is increased.
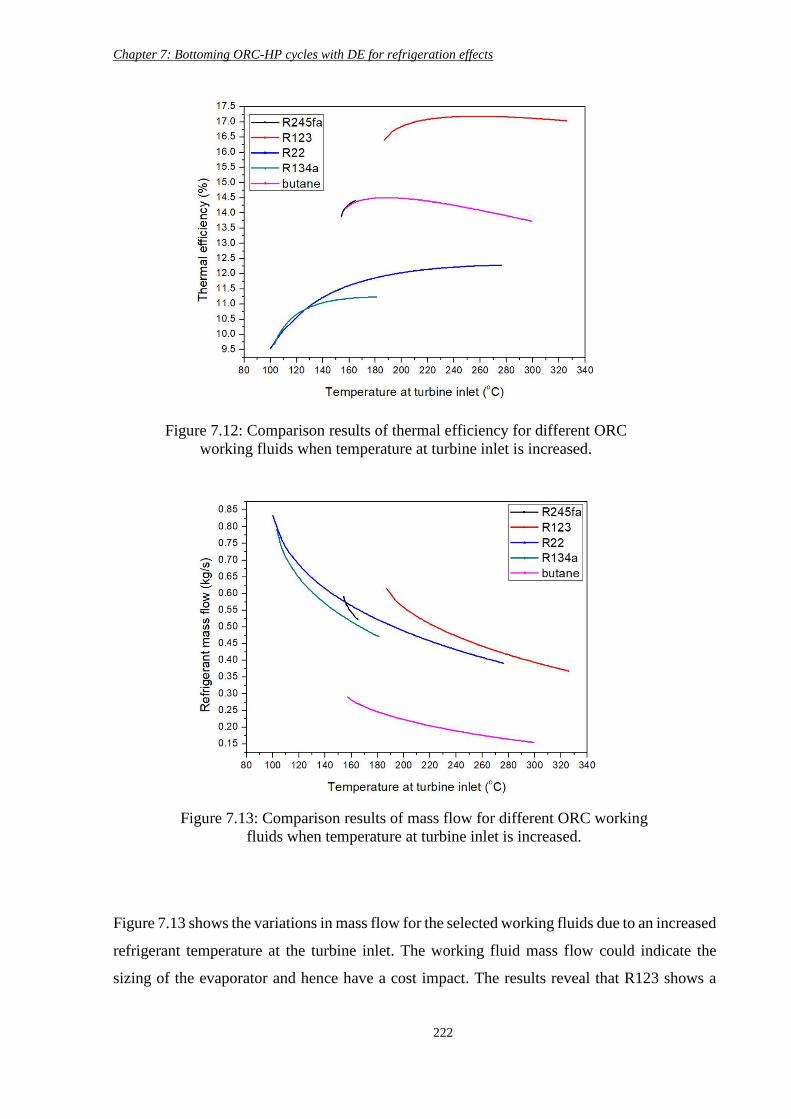
Chapter 7: Bottoming ORC-HP cycles with DE for refrigeration effects
222
Figure 7.13 shows the variations in mass flow for the selected working fluids due to an increased
refrigerant temperature at the turbine inlet. The working fluid mass flow could indicate the
sizing of the evaporator and hence have a cost impact. The results reveal that R123 shows a
Figure 7.12: Comparison results of thermal efficiency for different ORC
working fluids when temperature at turbine inlet is increased.
Figure 7.13: Comparison results of mass flow for different ORC working
fluids when temperature at turbine inlet is increased.
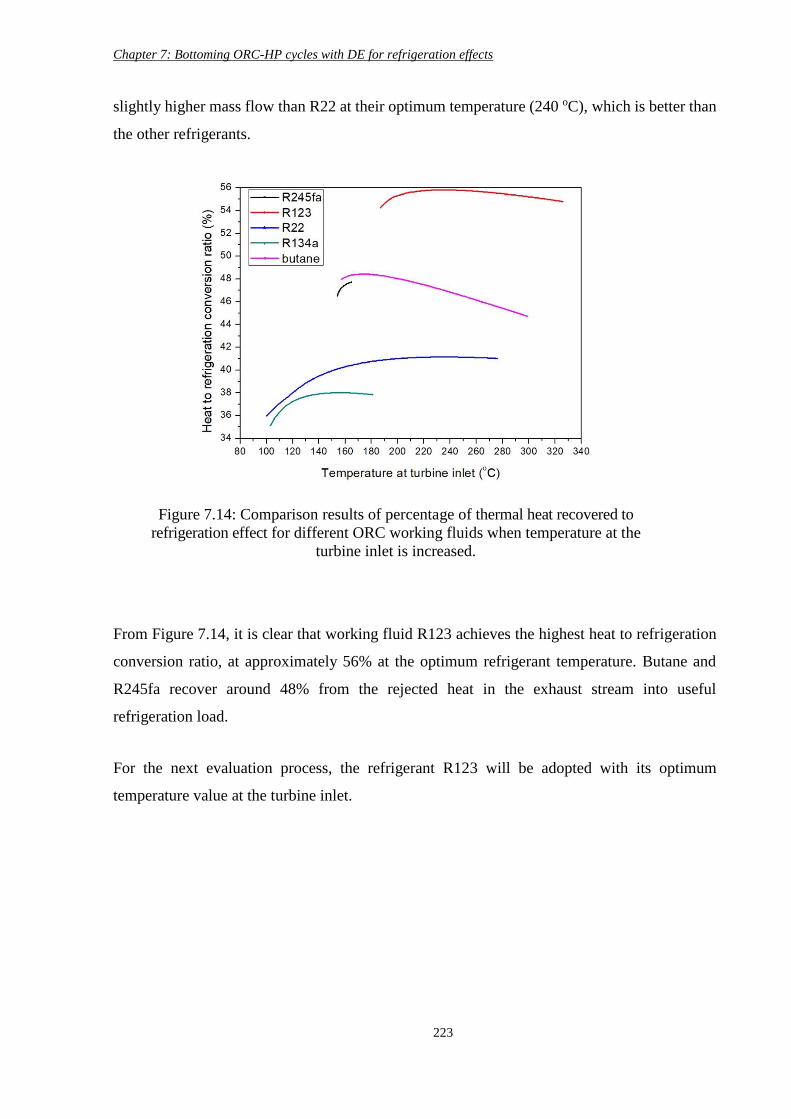
Chapter 7: Bottoming ORC-HP cycles with DE for refrigeration effects
223
slightly higher mass flow than R22 at their optimum temperature (240 oC), which is better than
the other refrigerants.
From Figure 7.14, it is clear that working fluid R123 achieves the highest heat to refrigeration
conversion ratio, at approximately 56% at the optimum refrigerant temperature. Butane and
R245fa recover around 48% from the rejected heat in the exhaust stream into useful
refrigeration load.
For the next evaluation process, the refrigerant R123 will be adopted with its optimum
temperature value at the turbine inlet.
Figure 7.14: Comparison results of percentage of thermal heat recovered to
refrigeration effect for different ORC working fluids when temperature at the
turbine inlet is increased.
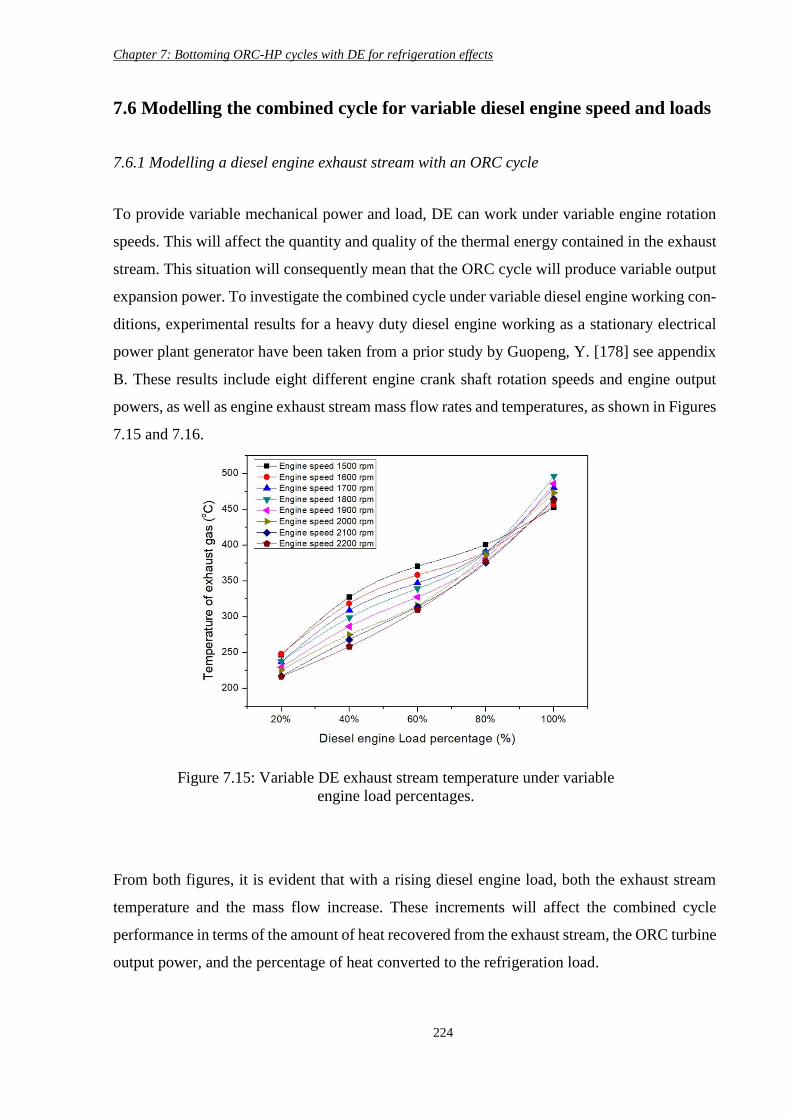
Chapter 7: Bottoming ORC-HP cycles with DE for refrigeration effects
224
7.6 Modelling the combined cycle for variable diesel engine speed and loads
7.6.1 Modelling a diesel engine exhaust stream with an ORC cycle
To provide variable mechanical power and load, DE can work under variable engine rotation
speeds. This will affect the quantity and quality of the thermal energy contained in the exhaust
stream. This situation will consequently mean that the ORC cycle will produce variable output
expansion power. To investigate the combined cycle under variable diesel engine working con-
ditions, experimental results for a heavy duty diesel engine working as a stationary electrical
power plant generator have been taken from a prior study by Guopeng, Y. [178] see appendix
B. These results include eight different engine crank shaft rotation speeds and engine output
powers, as well as engine exhaust stream mass flow rates and temperatures, as shown in Figures
7.15 and 7.16.
From both figures, it is evident that with a rising diesel engine load, both the exhaust stream
temperature and the mass flow increase. These increments will affect the combined cycle
performance in terms of the amount of heat recovered from the exhaust stream, the ORC turbine
output power, and the percentage of heat converted to the refrigeration load.
Figure 7.15: Variable DE exhaust stream temperature under variable
engine load percentages.
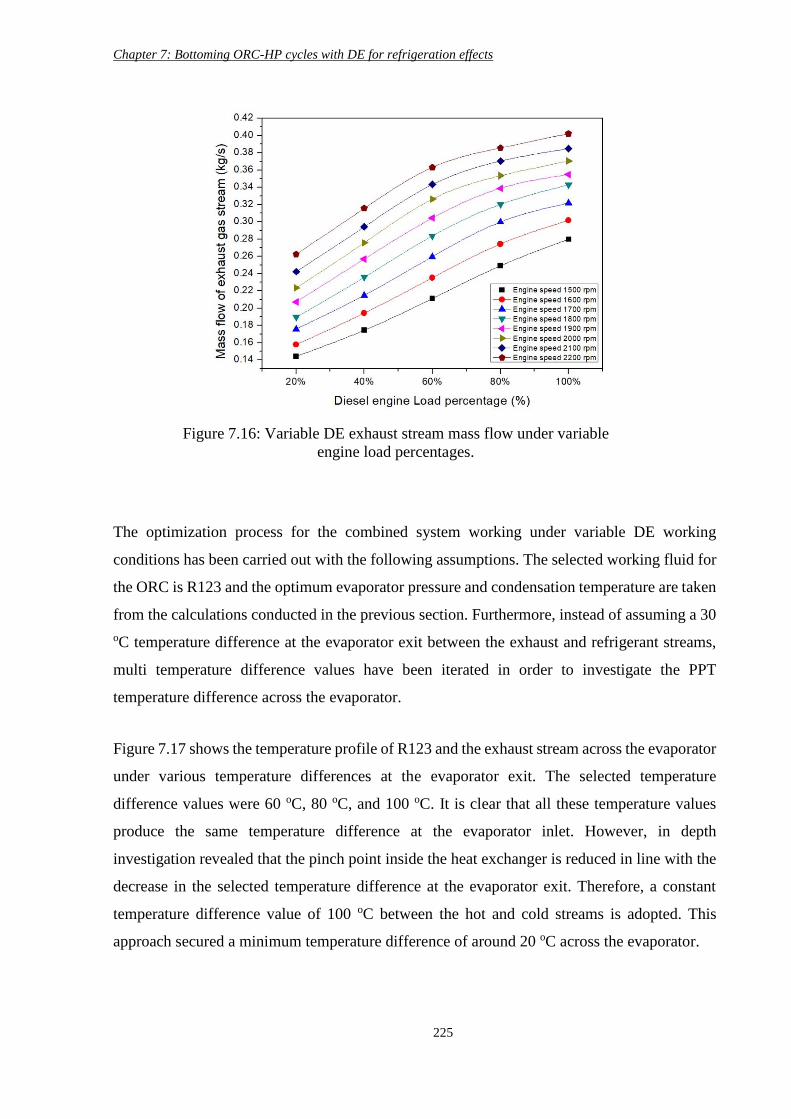
Chapter 7: Bottoming ORC-HP cycles with DE for refrigeration effects
225
The optimization process for the combined system working under variable DE working
conditions has been carried out with the following assumptions. The selected working fluid for
the ORC is R123 and the optimum evaporator pressure and condensation temperature are taken
from the calculations conducted in the previous section. Furthermore, instead of assuming a 30
oC temperature difference at the evaporator exit between the exhaust and refrigerant streams,
multi temperature difference values have been iterated in order to investigate the PPT
temperature difference across the evaporator.
Figure 7.17 shows the temperature profile of R123 and the exhaust stream across the evaporator
under various temperature differences at the evaporator exit. The selected temperature
difference values were 60 oC, 80 oC, and 100 oC. It is clear that all these temperature values
produce the same temperature difference at the evaporator inlet. However, in depth
investigation revealed that the pinch point inside the heat exchanger is reduced in line with the
decrease in the selected temperature difference at the evaporator exit. Therefore, a constant
temperature difference value of 100 oC between the hot and cold streams is adopted. This
approach secured a minimum temperature difference of around 20 oC across the evaporator.
Figure 7.16: Variable DE exhaust stream mass flow under variable
engine load percentages.
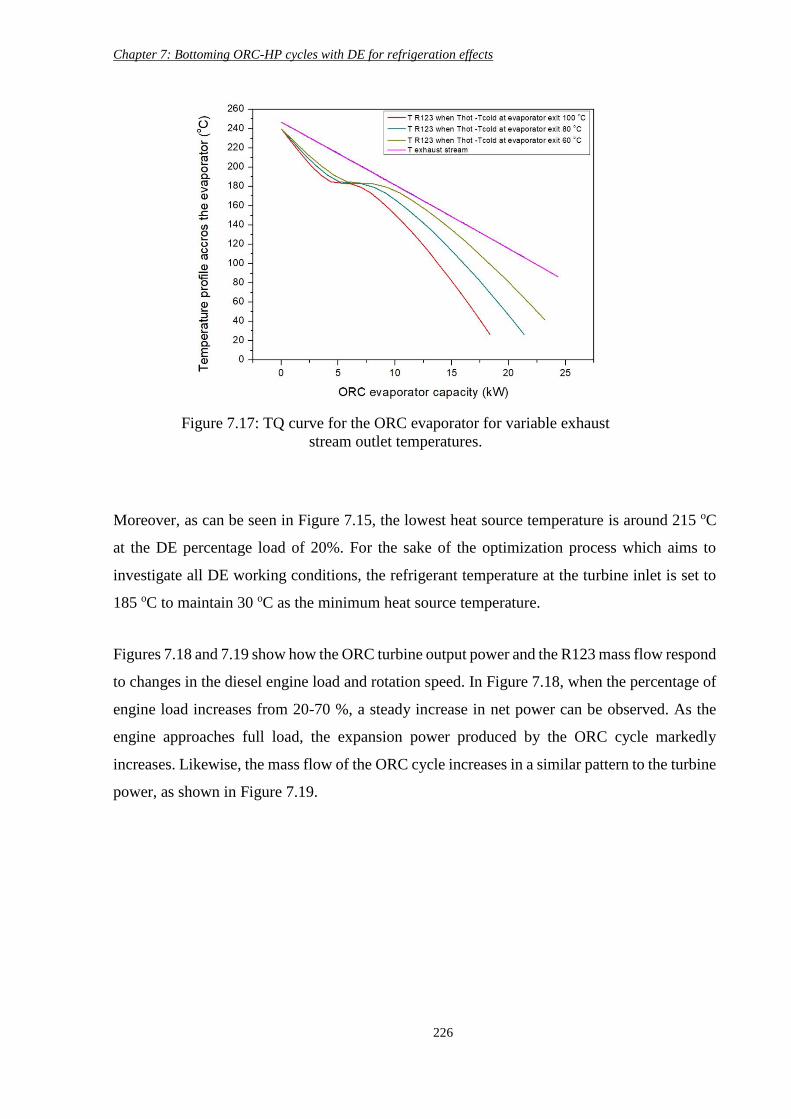
Chapter 7: Bottoming ORC-HP cycles with DE for refrigeration effects
226
Moreover, as can be seen in Figure 7.15, the lowest heat source temperature is around 215 oC
at the DE percentage load of 20%. For the sake of the optimization process which aims to
investigate all DE working conditions, the refrigerant temperature at the turbine inlet is set to
185 oC to maintain 30 oC as the minimum heat source temperature.
Figures 7.18 and 7.19 show how the ORC turbine output power and the R123 mass flow respond
to changes in the diesel engine load and rotation speed. In Figure 7.18, when the percentage of
engine load increases from 20-70 %, a steady increase in net power can be observed. As the
engine approaches full load, the expansion power produced by the ORC cycle markedly
increases. Likewise, the mass flow of the ORC cycle increases in a similar pattern to the turbine
power, as shown in Figure 7.19.
Figure 7.17: TQ curve for the ORC evaporator for variable exhaust
stream outlet temperatures.
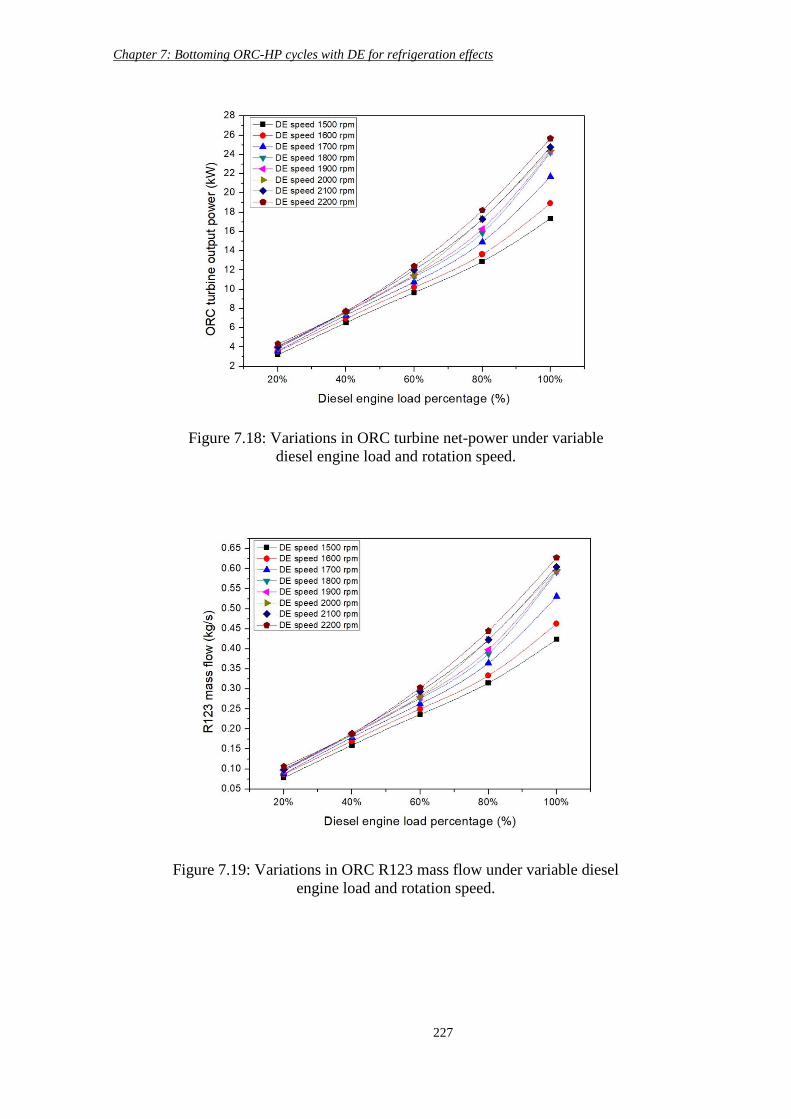
Chapter 7: Bottoming ORC-HP cycles with DE for refrigeration effects
227
Figure 7.18: Variations in ORC turbine net-power under variable
diesel engine load and rotation speed.
Figure 7.19: Variations in ORC R123 mass flow under variable diesel
engine load and rotation speed.
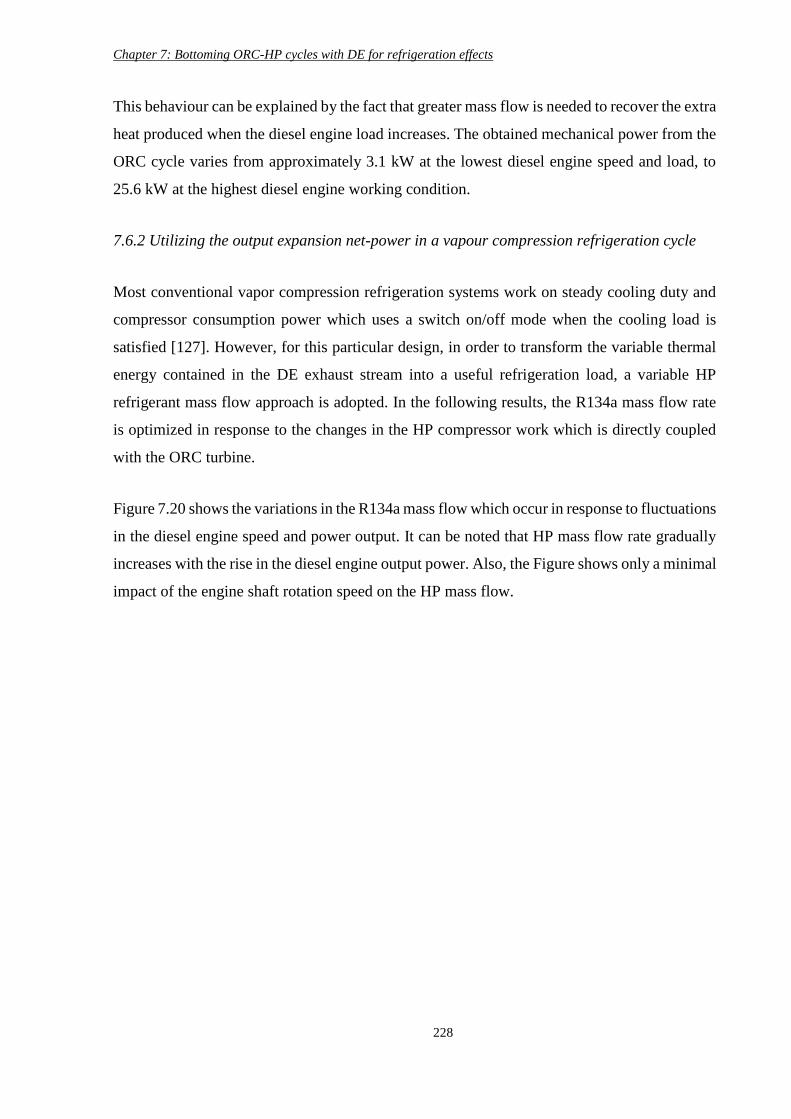
Chapter 7: Bottoming ORC-HP cycles with DE for refrigeration effects
228
This behaviour can be explained by the fact that greater mass flow is needed to recover the extra
heat produced when the diesel engine load increases. The obtained mechanical power from the
ORC cycle varies from approximately 3.1 kW at the lowest diesel engine speed and load, to
25.6 kW at the highest diesel engine working condition.
7.6.2 Utilizing the output expansion net-power in a vapour compression refrigeration cycle
Most conventional vapor compression refrigeration systems work on steady cooling duty and
compressor consumption power which uses a switch on/off mode when the cooling load is
satisfied [127]. However, for this particular design, in order to transform the variable thermal
energy contained in the DE exhaust stream into a useful refrigeration load, a variable HP
refrigerant mass flow approach is adopted. In the following results, the R134a mass flow rate
is optimized in response to the changes in the HP compressor work which is directly coupled
with the ORC turbine.
Figure 7.20 shows the variations in the R134a mass flow which occur in response to fluctuations
in the diesel engine speed and power output. It can be noted that HP mass flow rate gradually
increases with the rise in the diesel engine output power. Also, the Figure shows only a minimal
impact of the engine shaft rotation speed on the HP mass flow.
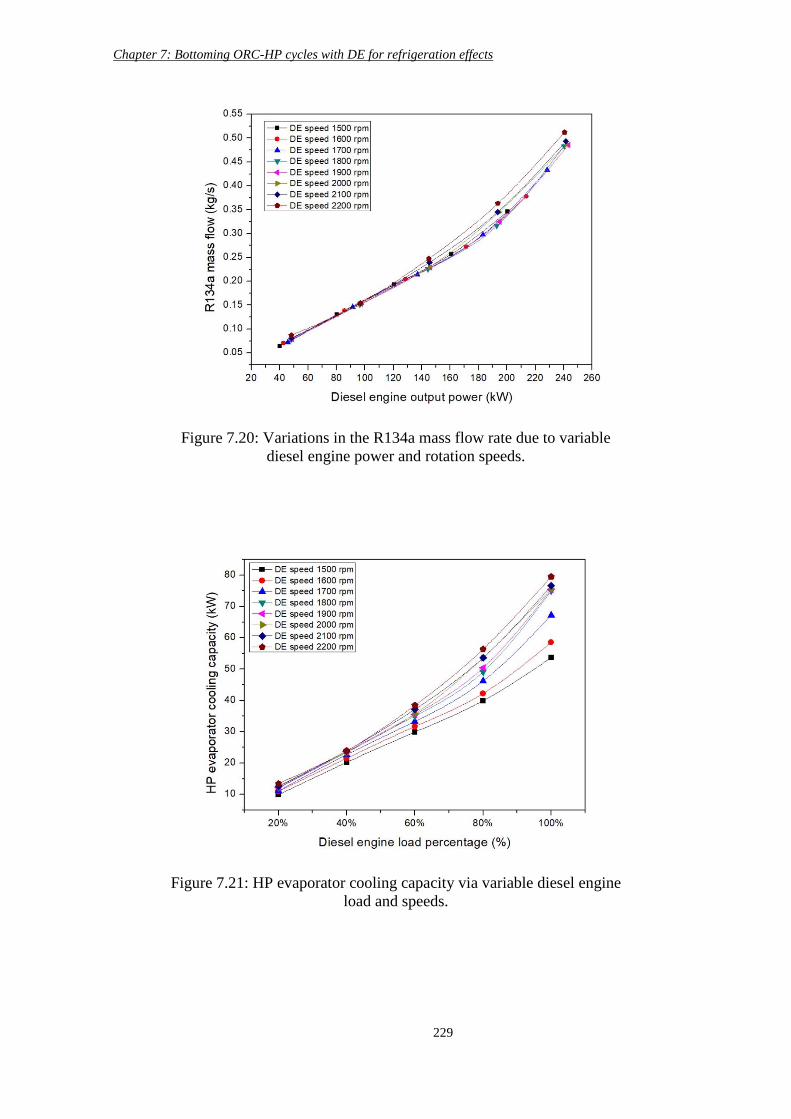
Chapter 7: Bottoming ORC-HP cycles with DE for refrigeration effects
229
Figure 7.20: Variations in the R134a mass flow rate due to variable
diesel engine power and rotation speeds.
Figure 7.21: HP evaporator cooling capacity via variable diesel engine
load and speeds.
Chapter 7: Bottoming ORC-HP cycles with DE for refrigeration effects
230
Figure 7.21 shows the variations in the HP evaporator cooling duty due to variable diesel engine
performance. Increasing the DE load from 20-100% causes a rise in the evaporator cooling duty
of between approximately 9.9 – 79.4 kW, while increasing the engine speed from 1800- 2200
rpm results in a further increase in evaporator capacity when approaching the full engine load.
This happens because a higher evaporator cooling load occurs as a response to the increase in
the refrigerant mass flow, as demonstrated in figure 7.20.
7.6.3 Varying the mass flow rate in the heat pump system
The mechanism of changing the refrigerant mass flow in the heat pump cycle can be practically
achieved by varying the compressor frequency (rotation speed), or by using an expansion valve
that can optimize the required mass for a certain cooling load [127].
An expansion valve such as thermostatic expansion valve (TXV) can optimize the refrigerant
mass flow passing through the evaporator by maintaining a constant degree of superheat at the
evaporator exit. The sensor bulb of the TXV valve is charged and sealed with the same HP
working fluid in a vapour state at a set temperature and pressure. This sensor is set up on the
evaporator exit pipe to measure the temperature of the passing vapour refrigerant. When the
cooling load increases (i.e. the temperature in the cooling chamber increases), the temperature
of the refrigerant leaving the evaporator also increases, leading to a rise in the temperature and
pressure of the refrigerant inside the TXV sensor bubble. Then, the pressure of the working
fluid in the connecting pipe of the TXV valve increases, leading to an adjustment in the valve
gate to allow more refrigerant to enter the evaporator in order to absorb the extra heat load.
7.6.4 Superheating the refrigerant at the evaporator exit
Superheating the working fluid at the evaporator exit ensures that no wet refrigerant enters the
compressor, and secures constant evaporation pressure and temperatures, which can contribute
to maintaining constant cycle performance. Usually, a constant superheat degree of 10 oC is
recommended at the evaporator exit. However, for this case study, a constant superheat degree
of 5 oC of R134a is assumed to allow a higher temperature and cooling load to be involved in
the evaporation process.
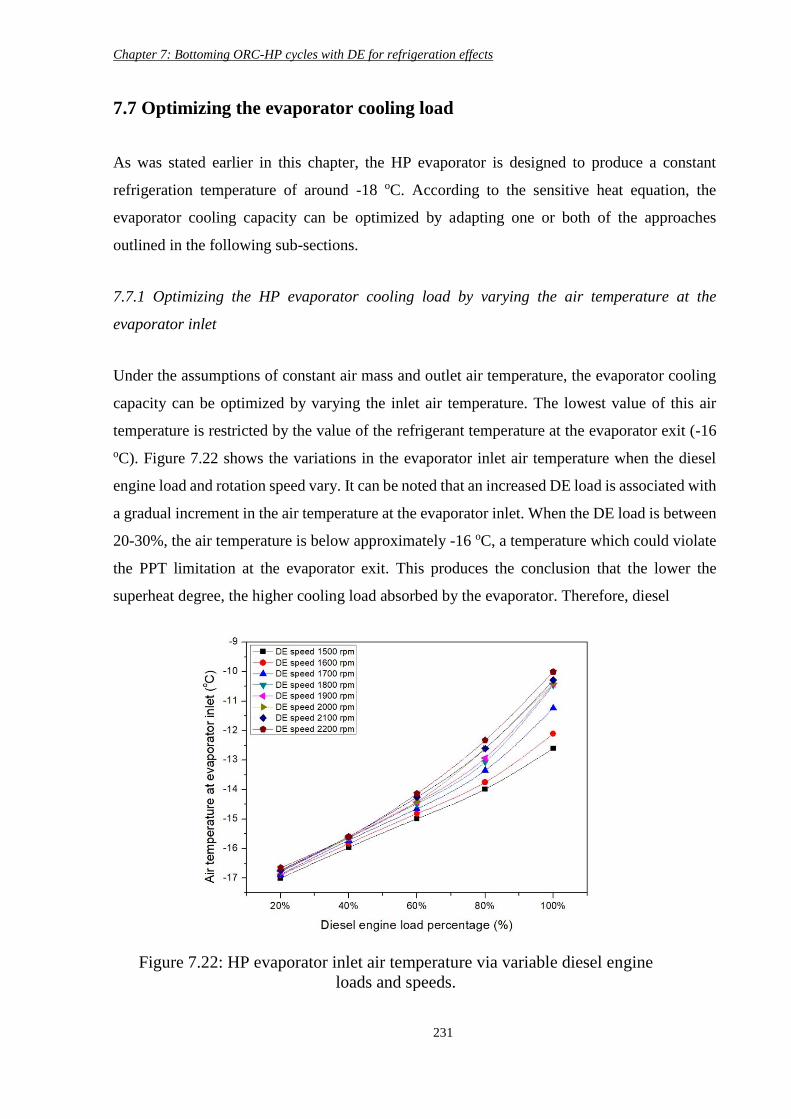
Chapter 7: Bottoming ORC-HP cycles with DE for refrigeration effects
231
7.7 Optimizing the evaporator cooling load
As was stated earlier in this chapter, the HP evaporator is designed to produce a constant
refrigeration temperature of around -18 oC. According to the sensitive heat equation, the
evaporator cooling capacity can be optimized by adapting one or both of the approaches
outlined in the following sub-sections.
7.7.1 Optimizing the HP evaporator cooling load by varying the air temperature at the
evaporator inlet
Under the assumptions of constant air mass and outlet air temperature, the evaporator cooling
capacity can be optimized by varying the inlet air temperature. The lowest value of this air
temperature is restricted by the value of the refrigerant temperature at the evaporator exit (-16
oC). Figure 7.22 shows the variations in the evaporator inlet air temperature when the diesel
engine load and rotation speed vary. It can be noted that an increased DE load is associated with
a gradual increment in the air temperature at the evaporator inlet. When the DE load is between
20-30%, the air temperature is below approximately -16 oC, a temperature which could violate
the PPT limitation at the evaporator exit. This produces the conclusion that the lower the
superheat degree, the higher cooling load absorbed by the evaporator. Therefore, diesel
Figure 7.22: HP evaporator inlet air temperature via variable diesel engine
loads and speeds.
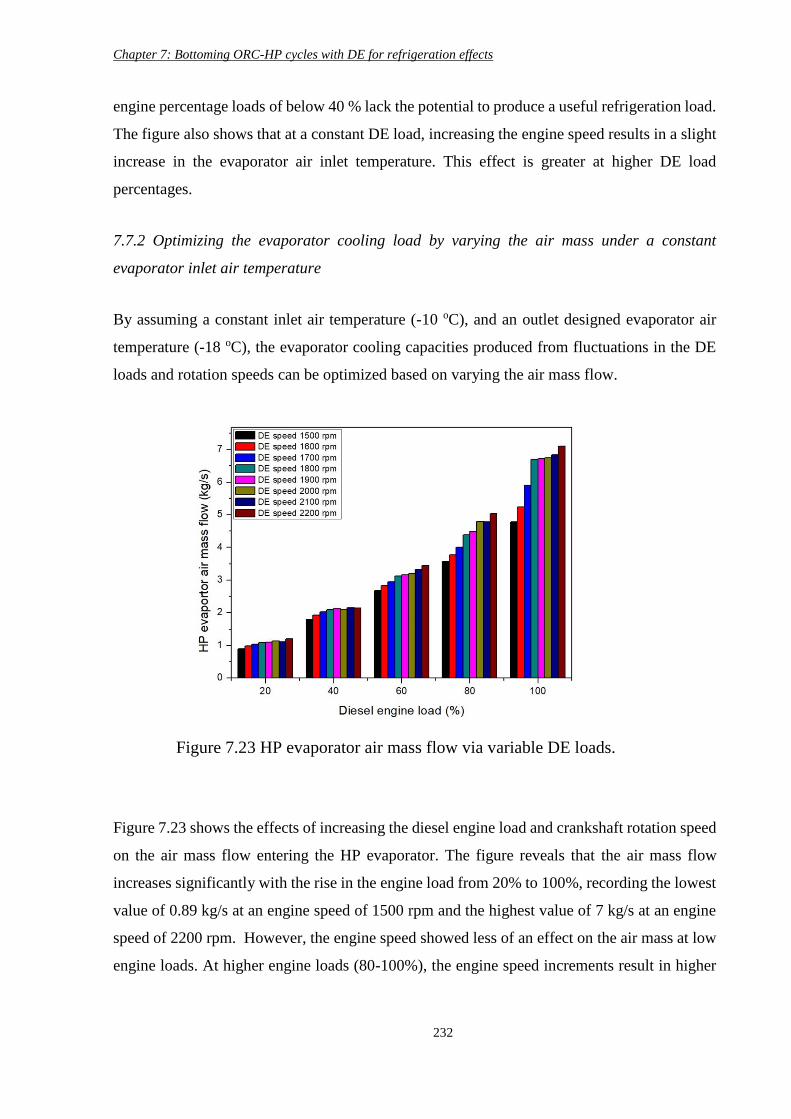
Chapter 7: Bottoming ORC-HP cycles with DE for refrigeration effects
232
engine percentage loads of below 40 % lack the potential to produce a useful refrigeration load.
The figure also shows that at a constant DE load, increasing the engine speed results in a slight
increase in the evaporator air inlet temperature. This effect is greater at higher DE load
percentages.
7.7.2 Optimizing the evaporator cooling load by varying the air mass under a constant
evaporator inlet air temperature
By assuming a constant inlet air temperature (-10 oC), and an outlet designed evaporator air
temperature (-18 oC), the evaporator cooling capacities produced from fluctuations in the DE
loads and rotation speeds can be optimized based on varying the air mass flow.
Figure 7.23 shows the effects of increasing the diesel engine load and crankshaft rotation speed
on the air mass flow entering the HP evaporator. The figure reveals that the air mass flow
increases significantly with the rise in the engine load from 20% to 100%, recording the lowest
value of 0.89 kg/s at an engine speed of 1500 rpm and the highest value of 7 kg/s at an engine
speed of 2200 rpm. However, the engine speed showed less of an effect on the air mass at low
engine loads. At higher engine loads (80-100%), the engine speed increments result in higher
Figure 7.23 HP evaporator air mass flow via variable DE loads.
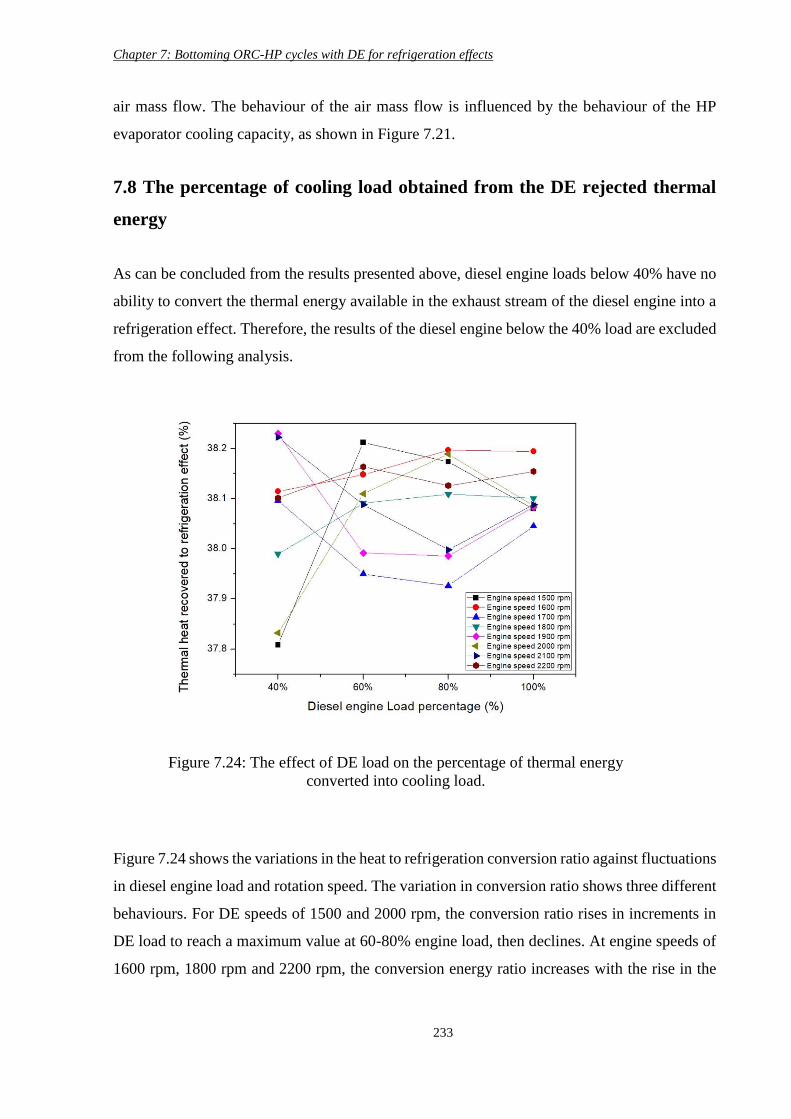
Chapter 7: Bottoming ORC-HP cycles with DE for refrigeration effects
233
air mass flow. The behaviour of the air mass flow is influenced by the behaviour of the HP
evaporator cooling capacity, as shown in Figure 7.21.
7.8 The percentage of cooling load obtained from the DE rejected thermal
energy
As can be concluded from the results presented above, diesel engine loads below 40% have no
ability to convert the thermal energy available in the exhaust stream of the diesel engine into a
refrigeration effect. Therefore, the results of the diesel engine below the 40% load are excluded
from the following analysis.
Figure 7.24 shows the variations in the heat to refrigeration conversion ratio against fluctuations
in diesel engine load and rotation speed. The variation in conversion ratio shows three different
behaviours. For DE speeds of 1500 and 2000 rpm, the conversion ratio rises in increments in
DE load to reach a maximum value at 60-80% engine load, then declines. At engine speeds of
1600 rpm, 1800 rpm and 2200 rpm, the conversion energy ratio increases with the rise in the
Figure 7.24: The effect of DE load on the percentage of thermal energy
converted into cooling load.
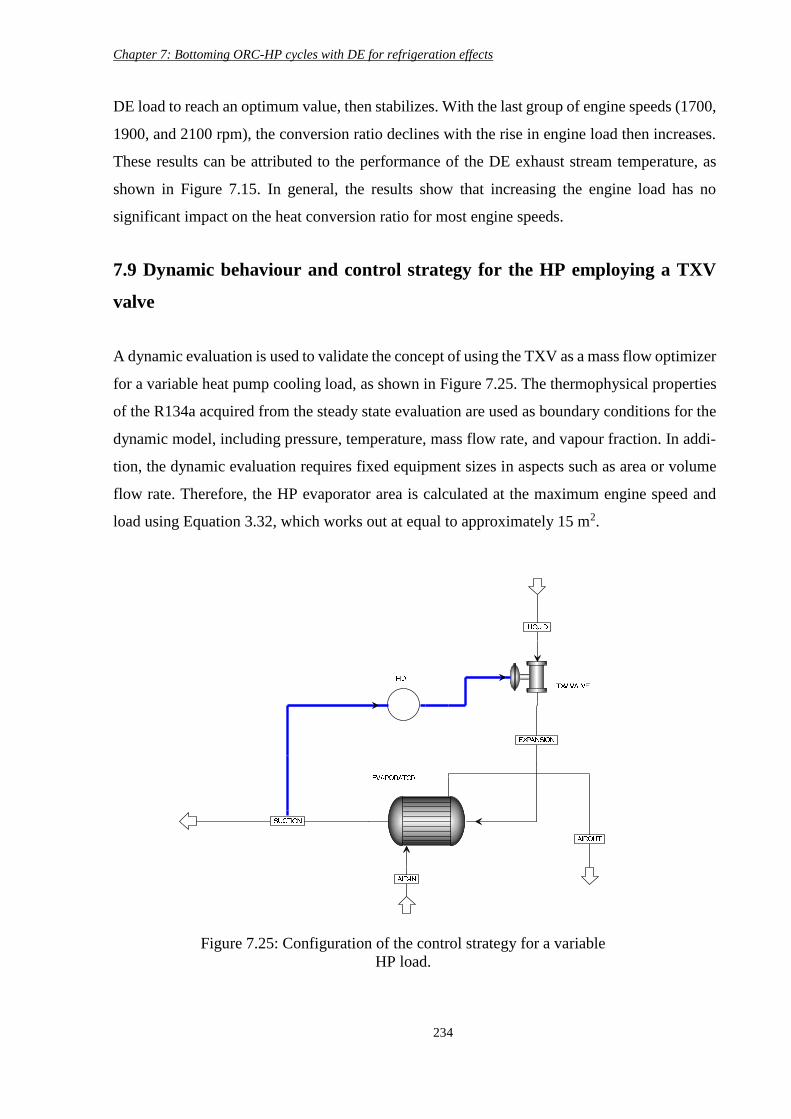
Chapter 7: Bottoming ORC-HP cycles with DE for refrigeration effects
234
DE load to reach an optimum value, then stabilizes. With the last group of engine speeds (1700,
1900, and 2100 rpm), the conversion ratio declines with the rise in engine load then increases.
These results can be attributed to the performance of the DE exhaust stream temperature, as
shown in Figure 7.15. In general, the results show that increasing the engine load has no
significant impact on the heat conversion ratio for most engine speeds.
7.9 Dynamic behaviour and control strategy for the HP employing a TXV
valve
A dynamic evaluation is used to validate the concept of using the TXV as a mass flow optimizer
for a variable heat pump cooling load, as shown in Figure 7.25. The thermophysical properties
of the R134a acquired from the steady state evaluation are used as boundary conditions for the
dynamic model, including pressure, temperature, mass flow rate, and vapour fraction. In addi-
tion, the dynamic evaluation requires fixed equipment sizes in aspects such as area or volume
flow rate. Therefore, the HP evaporator area is calculated at the maximum engine speed and
load using Equation 3.32, which works out at equal to approximately 15 m2.
Figure 7.25: Configuration of the control strategy for a variable
HP load.
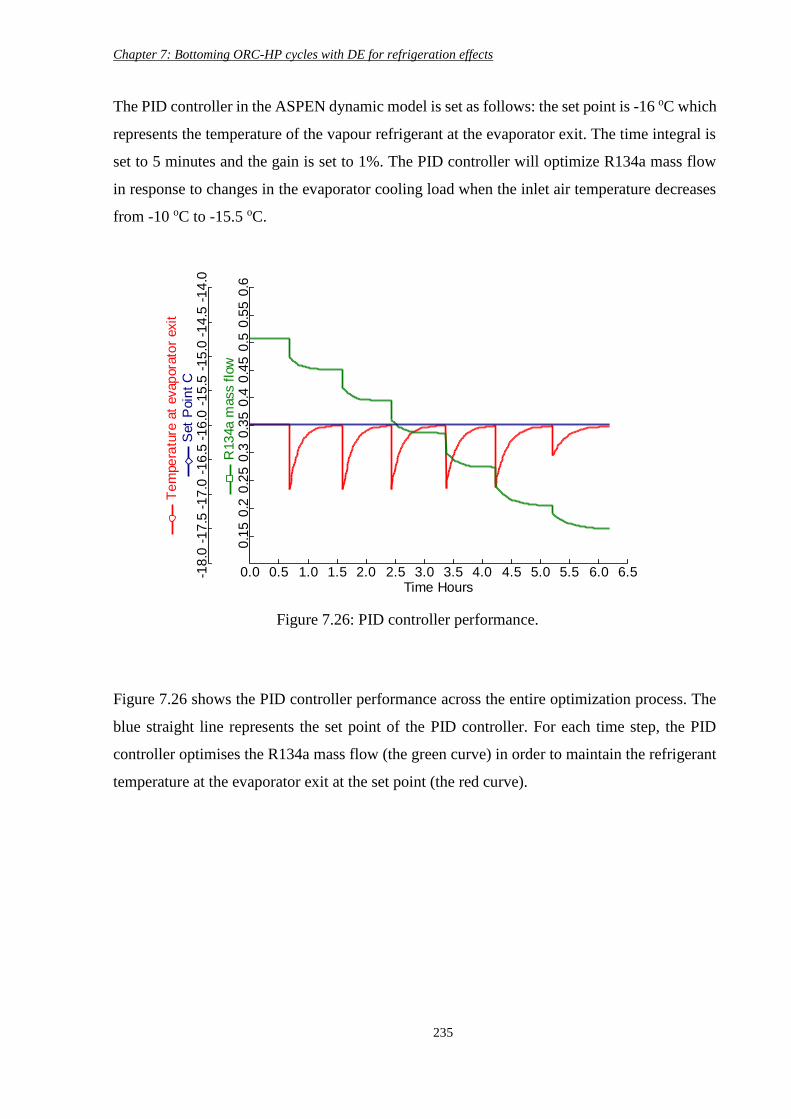
Chapter 7: Bottoming ORC-HP cycles with DE for refrigeration effects
235
The PID controller in the ASPEN dynamic model is set as follows: the set point is -16 oC which
represents the temperature of the vapour refrigerant at the evaporator exit. The time integral is
set to 5 minutes and the gain is set to 1%. The PID controller will optimize R134a mass flow
in response to changes in the evaporator cooling load when the inlet air temperature decreases
from -10 oC to -15.5 oC.
Figure 7.26 shows the PID controller performance across the entire optimization process. The
blue straight line represents the set point of the PID controller. For each time step, the PID
controller optimises the R134a mass flow (the green curve) in order to maintain the refrigerant
temperature at the evaporator exit at the set point (the red curve).
Figure 7.26: PID controller performance.
Time Hours
Set
Poin
t C
R13
4a
mass f
low
Te
mpe
ratu
re a
t evap
ora
tor
exit
0.0 0.5 1.0 1.5 2.0 2.5 3.0 3.5 4.0 4.5 5.0 5.5 6.0 6.5
0.1
50
.20
.25
0.3
0.3
50
.40
.45
0.5
0.5
50
.6
-18
.0-1
7.5
-17
.0-1
6.5
-16
.0-1
5.5
-15
.0-1
4.5
-14
.0
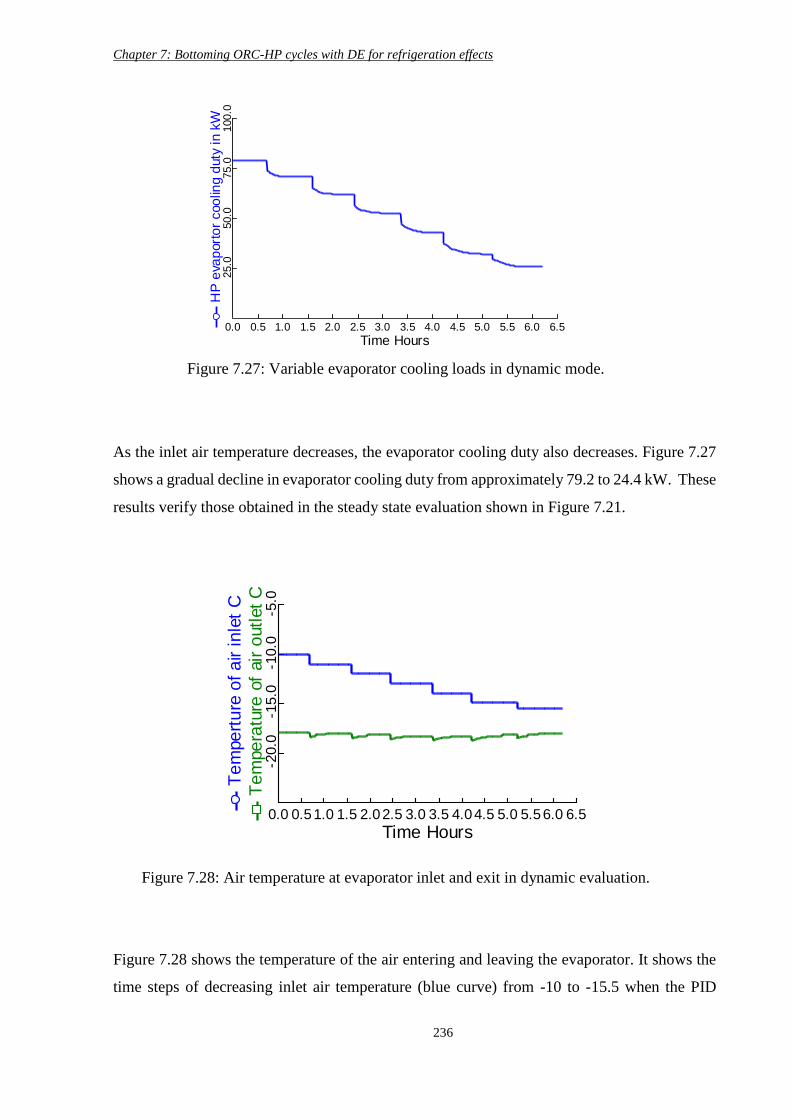
Chapter 7: Bottoming ORC-HP cycles with DE for refrigeration effects
236
As the inlet air temperature decreases, the evaporator cooling duty also decreases. Figure 7.27
shows a gradual decline in evaporator cooling duty from approximately 79.2 to 24.4 kW. These
results verify those obtained in the steady state evaluation shown in Figure 7.21.
Figure 7.28 shows the temperature of the air entering and leaving the evaporator. It shows the
time steps of decreasing inlet air temperature (blue curve) from -10 to -15.5 when the PID
Figure 7.27: Variable evaporator cooling loads in dynamic mode.
Time Hours
HP
eva
port
or
coo
ling
duty
in
kW
0.0 0.5 1.0 1.5 2.0 2.5 3.0 3.5 4.0 4.5 5.0 5.5 6.0 6.5
25.0
50.0
75.0
100.0
Figure 7.28: Air temperature at evaporator inlet and exit in dynamic evaluation.
Time Hours
Te
mpe
ratu
re o
f air
outl
et
C
Te
mpe
rtu
re o
f a
ir in
let
C
0.0 0.51.0 1.5 2.02.5 3.0 3.5 4.04.5 5.0 5.56.0 6.5
-20.0
-15.0
-10.0
-5.0
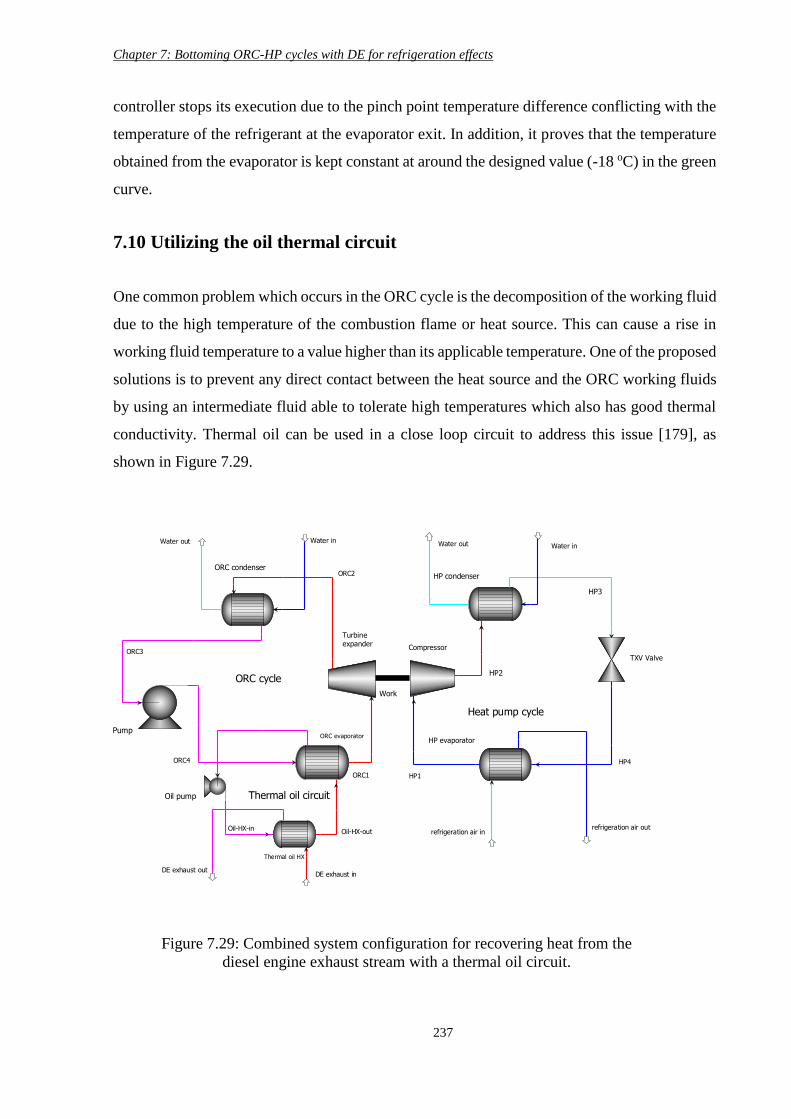
Chapter 7: Bottoming ORC-HP cycles with DE for refrigeration effects
237
controller stops its execution due to the pinch point temperature difference conflicting with the
temperature of the refrigerant at the evaporator exit. In addition, it proves that the temperature
obtained from the evaporator is kept constant at around the designed value (-18 oC) in the green
curve.
7.10 Utilizing the oil thermal circuit
One common problem which occurs in the ORC cycle is the decomposition of the working fluid
due to the high temperature of the combustion flame or heat source. This can cause a rise in
working fluid temperature to a value higher than its applicable temperature. One of the proposed
solutions is to prevent any direct contact between the heat source and the ORC working fluids
by using an intermediate fluid able to tolerate high temperatures which also has good thermal
conductivity. Thermal oil can be used in a close loop circuit to address this issue [179], as
shown in Figure 7.29.
Figure 7.29: Combined system configuration for recovering heat from the
diesel engine exhaust stream with a thermal oil circuit.
Heat pump cycle
ORC cycle
HP evaporator
HP condenser
ORC evaporator
ORC condenser
Pump
Turbine expander
Compressor
TXV Valve
Water in
HP1
HP2
HP3
HP4
refrigeration air in
ORC1
ORC2
ORC3
ORC4
refrigeration air out
DE exhaust in
Work
DE exhaust out
Water outWater inWater out
Thermal oil HX
Thermal oil circuitOil pump
Oil-HX-outOil-HX-in
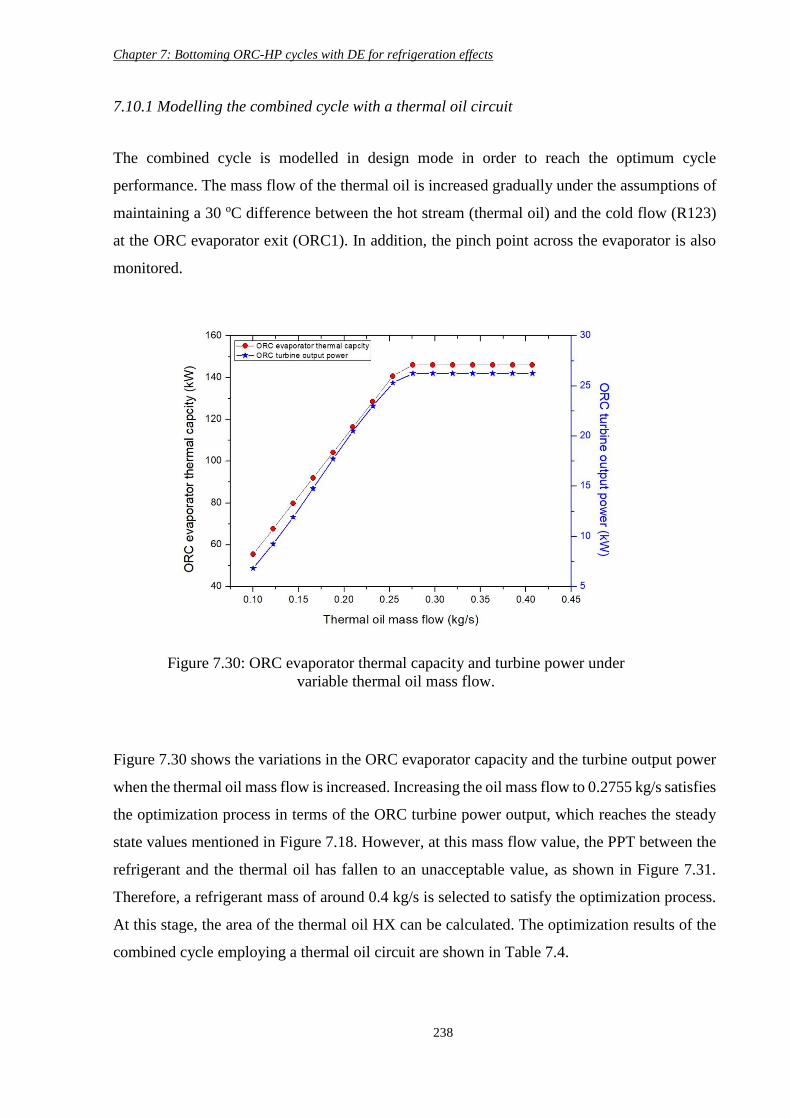
Chapter 7: Bottoming ORC-HP cycles with DE for refrigeration effects
238
7.10.1 Modelling the combined cycle with a thermal oil circuit
The combined cycle is modelled in design mode in order to reach the optimum cycle
performance. The mass flow of the thermal oil is increased gradually under the assumptions of
maintaining a 30 oC difference between the hot stream (thermal oil) and the cold flow (R123)
at the ORC evaporator exit (ORC1). In addition, the pinch point across the evaporator is also
monitored.
Figure 7.30 shows the variations in the ORC evaporator capacity and the turbine output power
when the thermal oil mass flow is increased. Increasing the oil mass flow to 0.2755 kg/s satisfies
the optimization process in terms of the ORC turbine power output, which reaches the steady
state values mentioned in Figure 7.18. However, at this mass flow value, the PPT between the
refrigerant and the thermal oil has fallen to an unacceptable value, as shown in Figure 7.31.
Therefore, a refrigerant mass of around 0.4 kg/s is selected to satisfy the optimization process.
At this stage, the area of the thermal oil HX can be calculated. The optimization results of the
combined cycle employing a thermal oil circuit are shown in Table 7.4.
Figure 7.30: ORC evaporator thermal capacity and turbine power under
variable thermal oil mass flow.
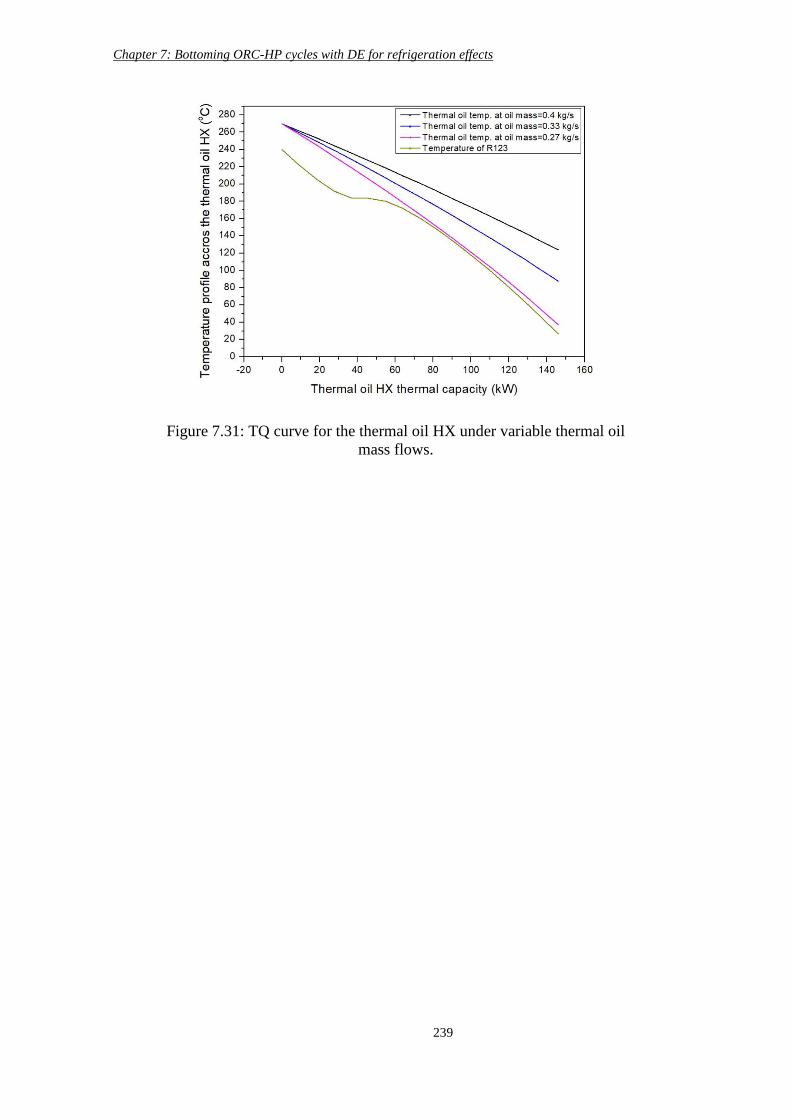
Chapter 7: Bottoming ORC-HP cycles with DE for refrigeration effects
239
Figure 7.31: TQ curve for the thermal oil HX under variable thermal oil
mass flows.
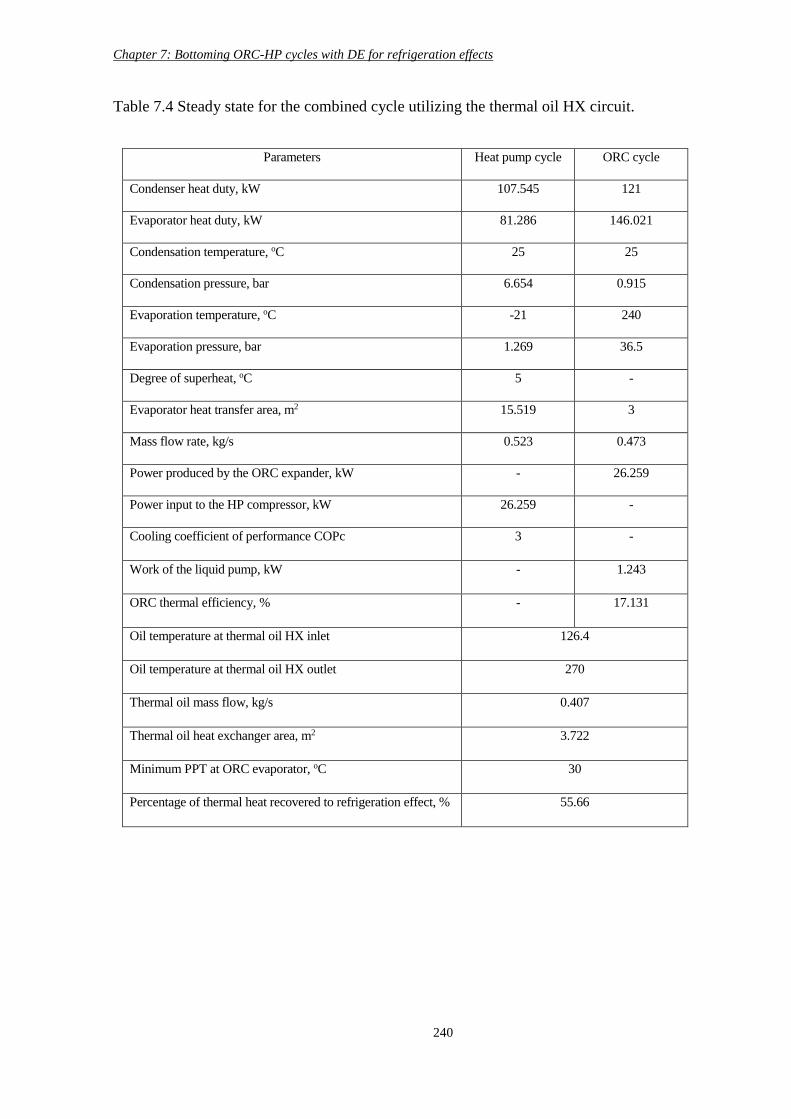
Chapter 7: Bottoming ORC-HP cycles with DE for refrigeration effects
240
Table 7.4 Steady state for the combined cycle utilizing the thermal oil HX circuit.
Parameters Heat pump cycle ORC cycle
Condenser heat duty, kW 107.545 121
Evaporator heat duty, kW 81.286 146.021
Condensation temperature, oC 25 25
Condensation pressure, bar 6.654 0.915
Evaporation temperature, oC -21 240
Evaporation pressure, bar 1.269 36.5
Degree of superheat, oC 5 -
Evaporator heat transfer area, m2 15.519 3
Mass flow rate, kg/s 0.523 0.473
Power produced by the ORC expander, kW - 26.259
Power input to the HP compressor, kW 26.259 -
Cooling coefficient of performance COPc 3 -
Work of the liquid pump, kW - 1.243
ORC thermal efficiency, % - 17.131
Oil temperature at thermal oil HX inlet 126.4
Oil temperature at thermal oil HX outlet 270
Thermal oil mass flow, kg/s 0.407
Thermal oil heat exchanger area, m2 3.722
Minimum PPT at ORC evaporator, oC 30
Percentage of thermal heat recovered to refrigeration effect, % 55.66
Chapter 7: Bottoming ORC-HP cycles with DE for refrigeration effects
241
7.11 Conclusion
The potential offered through using a combined ORC-HP system as a heat recovery machine
has been investigated in this chapter. The heat source for the ORC cycle is the rejected thermal
energy contained in the diesel engine’s exhaust stream. An integrated system has been proposed
here to convert this wasted heat into a useful refrigeration load with cold air of around -18 oC.
A steady state evaluation of the combined cycle powered by a constant DE working condition
was performed. The results showed that for the combined system using R245fa and R134a as
working fluids for ORC and HP respectively, about 47% of the wasted heat can be converted
into a useful refrigeration load. Furthermore, a comparison evaluation of ORC cycle working
fluids was carried out and the R123 refrigerant showed the greatest potential in terms of higher
ORC turbine power and cycle thermal efficiency.
Further, a control strategy for the combined system working with variable DE loads and speeds
has been proposed. This strategy is based on varying the ORC and HP working fluids mass flow
to cope with the variations in the quantity and quality of the heat source. The results show that
not all the power recovered from the ORC cycle can be converted into a useful refrigeration
effect. More specifically, the thermal energy contained in the exhaust stream when the DE load
is below 40% might not have the potential to be transferred into a refrigeration load due to the
decline in temperature difference (pinch point) between the inlet evaporator air temperatures
and the superheated vapour refrigerant at the HP evaporator exit. However, when the DE works
at over the 40% percentage load, around 55% of the wasted heat available in the exhaust stream
is recovered by the ORC and transformed into useful refrigeration effects by the HP cycle.
Moreover, the mechanism of optimizing the refrigerant mass flow in the HP cycle was
investigated by adopting the TVX valve concept. In addition, a dynamic model using ASPEN
PLUS was employed to validate the concept of the TXV, and to verify the results obtained from
the steady state simulation.
Chapter 8: Conclusion and future work
242
Chapter 8 Conclusion and future work
In this chapter, the findings presented in the thesis are summarised, and a plan for future work
is presented.
8.1 Summary
This thesis has theoretically examined a new integrated heating and cooling system consisting
of an Organic Rankine cycle directly driving a vapour compression heat pump cycle. The pri-
mary heat sources are burning fossil fuel via a gas burner or using diesel engine exhaust gas.
Supplemental heat sources have also been utilised, including ambient air, waste heat from gas
burner flue gases, and wasted heat from data centre IT equipment.
In chapter four, a comparative study of the performance of various working fluids for HP and
ORC cycles was presented. The selected refrigerants for the HP cycle were: Ammonia, R600a,
R22, R134a, R1234yf, R410a and CO2. The ORC cycle working fluids were: R123, Heptane,
Hexane, Pentane, and R245fa as pure refrigerants, R245fa+R134a, and Hexane+R141b as ze-
otropic mixtures. The analysis was based on the performance of these working fluids in terms
of cycle efficiency, heating and cooling capacities, as well as environmental and safety con-
cerns.
For the HP cycle in heating mode, at low condensation temperature (30 oC), all refrigerants
apart from CO2 showed comparable heating COP. In contrast, at a high condensation tempera-
ture, ammonia, R600a, R22 and R134a achieved higher COPh. For the HP cycle in cooling
mode, all the refrigerants showed similar COPc behaviour as evaporation temperature increased
at constant condensation pressure.
In the ORC cycle, all the selected refrigerants showed reductions in thermal efficiency with a
rising condensation temperature. Also, pure refrigerants showed better thermal efficiency than
zeotropic mixtures.
Natural refrigerants such as ammonia and CO2 have minimal environmental impacts, with no
global warming potential or risk of damage to the ozone layer. Similarly, Pentane, Hexane,
Heptane, and Isobutane (R600a) have low GWP and ODP profiles. However, from a safety
point of view, these refrigerants as well as ammonia, might be not suitable for domestic appli-
cation due to their flammability or toxicity. R134a as a HP cycle working fluid has shown good
thermal performance and is widely used with a good safety profile and environmentally friendly
Chapter 8: Conclusion and future work
243
behaviours. Similarly, R123 and R245fa as ORC working fluids have achieved comparable
thermal efficiency with good safety and environmental profiles. These working fluids were
therefore selected for the combined cycle studied in this thesis.
Chapter five investigated the use of the combined cycle powered by a gas burner for domestic
hot water application. A preliminary design was proposed and analysed in order to explore the
highest achievable cycle performance. The results suggested that the system can achieve an
overall fuel to heat efficiency of around 136%. In addition, the contribution of the post heater
to water heating is minimal.
Based on these results, a combined system without a post heater was proposed and investigated
further in terms of the sequence of water heating in the HP and ORC condensers. In the first
approach, the fuel to heat efficiency decreases with the rise in both condensers’ pressure. The
second approach examined a system with a reversed water heating process in which the ORC
condenser is the first heating stage. The overall results showed that the first approach achieved
higher system efficiency than the reverse design.
To tackle the effects of ambient temperature variation on the HP cycle while maintaining the
HP evaporator in a frost free state, various control strategies were proposed and investigated.
The results were verified and validated via a dynamic model, which showed good agreement
with the steady state results.
Chapter six examined the potential use of the combined system for data centre cooling, with
the wasted heat recovered from the DC room used to heat returnee water for central heating
application. The HP cycle achieves heating and cooling COP of around 3.6 and 2.6, respec-
tively. The ORC thermal efficiency is approximately 8.5% and the overall system fuel to heat
efficiency is 137%.
To tackle the effects of various DC workloads on the system performance, four control strate-
gies were proposed and analysed with the aim of maintain the DC room temperature within the
target range. In the first strategy, DC room temperature is maintained below 25 oC, with returnee
water of 80 oC and a fuel to heat efficiency of over 134%.
In the second strategy the resulting fuel to heat efficiency is around 112%, which is lower than
for strategy one. In both these strategies, the total heating capacity of the combined system is
maintained at a constant 58 kW.
Chapter 8: Conclusion and future work
244
In the third strategy, the total heating capacity of the system is reduced while maintaining con-
stant fuel to heat efficiency (137%). The final water temperature is maintained at 80 oC, but the
mass flow of water is reduced from 0.46 to 0.28 kg/s with a corresponding reduction in total
system heat capacity from 58 to 35.1 kW.
Strategy four is only valid for a limited range of indoor temperatures (25- 21.5 oC), after which
the increasing indoor air mass flow to 26 kg/s becomes insufficient to superheat the refrigerant
at the evaporator exit to the desired value. In both strategies three and four, the fuel to heat
efficiency declines to around 111%.
In chapter seven, a combined ORC-HP system was used to produce a refrigeration load by
utilising diesel engine exhaust wasted heat as a primary energy source. The target cold air tem-
perature was -18 oC and R245fa and R134a were the initial selected working fluids for ORC
and HP respectively. The achieved HP cooling COP is 3, the ORC thermal efficiency is 14.4%,
and the heat to refrigeration conversion ratio is 47.7%.
Modelling of the combined system under various diesel engine loads and speeds was also con-
ducted. In addition, a control strategy was proposed to adapt to these variations. A reduction in
diesel engine load from 100% to 20% causes a decline in the HP evaporator cooling capacity
from 79.4 to 9.9 kW. In addition, the air temperature at the evaporator inlet falls to -16 oC at
diesel engine loads below 40%.
8.2 Suggested future work
Overall, the work conducted in this thesis supports the proposed system as an efficient heating
and cooling technology. Some other potentially beneficial areas of research that could be car-
ried out in the future on this system can be summarised as follows:
8.2.1 Theoretical work
• It is well documented in the literature that an air source HP cycle performance varies with
fluctuations in ambient temperature. In this thesis, ambient air has been used as the heat
source for the HP evaporator, and the system performance was shown to be significantly
affected by falling ambient temperatures. The potential of using more steady heat sources
Chapter 8: Conclusion and future work
245
such as geothermal, solar, surface water, or other waste heat sources instead of air could
therefore be theoretically explored.
• Various experimental and theoretical researches have examined the potential of enhancing
the performance of the standalone ORC and HP cycles using various methods including the
use of cascade configuration, an ejector as an expansion device instead of an expansion
valve, and others. The potential of employing these technologies in the combined system
proposed in this thesis could be explored and compared to the performance results reported
in the present work.
• A wider range of working fluids for the combined system could be selected and compared.
• The definition of fuel to heat efficiency conducted in this research can be used as a
comparison tool by applying it to other combined ORC-VCC cycles published in the
literature.
• The potential for using the combined system for large scale industrial heating and cooling
application purposes could be investigated. In addition, other sources of waste heat, such as
sewage water and industrial waste heat, could be used to further investigate the potential of
the combined system as a waste heat recovery technology.
• Investigating other power and heat recovery systems used for similar applications and
comparing the results with the combined system studied in this thesis.
8.2.2 Experimental work
• Building a lab rig of the combined system with the intended application of domestic hot
water supply would provide new insights. The results obtained in this thesis can be used as
a guide in selecting the thermodynamic specifications of each of the cycle components. The
design parameters could include the refrigerant type, evaporation and condensation pressure,
and compressor and turbine power capacity. Ambient air source could initially be used as a
heat source for the HP evaporator, either on its own or mixed with the gas burner flue gases.

Chapter 8: Conclusion and future work
246
• Alternative heat sources could be used to simulate the waste heat from a data centre or a
diesel engine exhaust. For instance, a hot air blower with variable mass flow and temperature
could be used for this purpose. The rig could be modified to simulate the combined cycle
proposed in chapters six and seven.
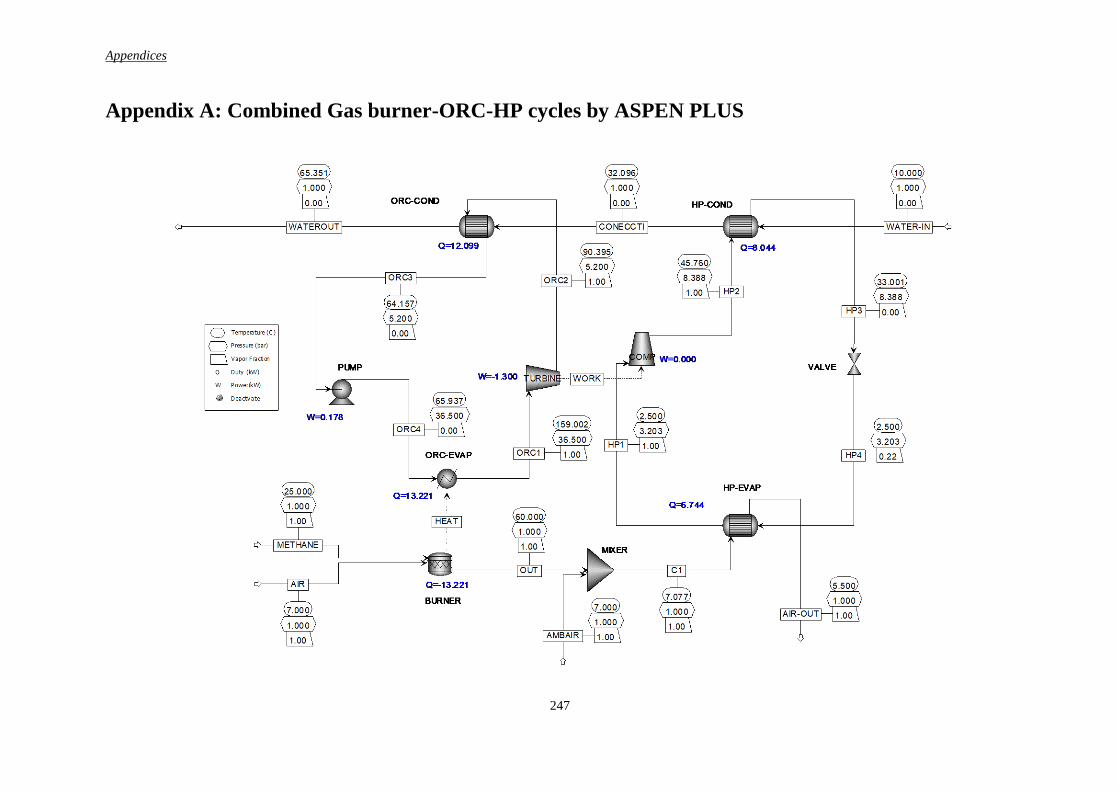
Appendices
247
Appendix A: Combined Gas burner-ORC-HP cycles by ASPEN PLUS
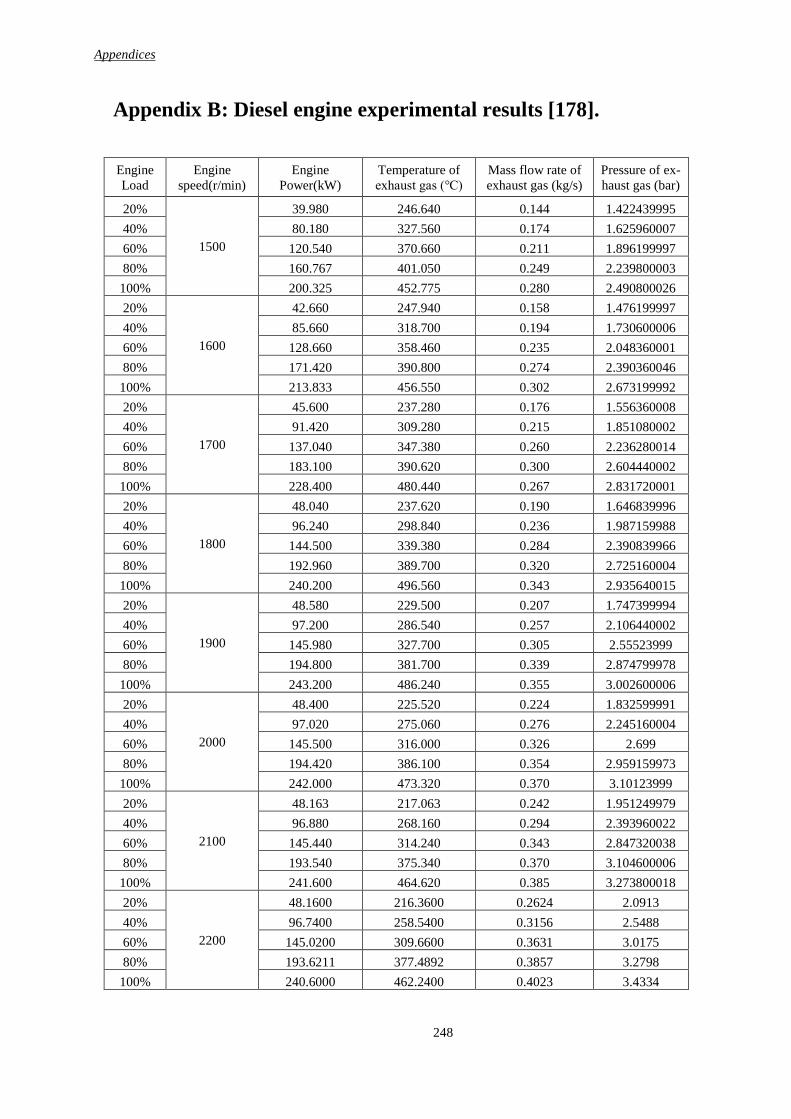
Appendices
248
Appendix B: Diesel engine experimental results [178].
Engine
Load
Engine
speed(r/min)
Engine
Power(kW)
Temperature of
exhaust gas (℃)
Mass flow rate of
exhaust gas (kg/s)
Pressure of ex-
haust gas (bar)
20%
1500
39.980 246.640 0.144 1.422439995
40% 80.180 327.560 0.174 1.625960007
60% 120.540 370.660 0.211 1.896199997
80% 160.767 401.050 0.249 2.239800003
100% 200.325 452.775 0.280 2.490800026
20%
1600
42.660 247.940 0.158 1.476199997
40% 85.660 318.700 0.194 1.730600006
60% 128.660 358.460 0.235 2.048360001
80% 171.420 390.800 0.274 2.390360046
100% 213.833 456.550 0.302 2.673199992
20%
1700
45.600 237.280 0.176 1.556360008
40% 91.420 309.280 0.215 1.851080002
60% 137.040 347.380 0.260 2.236280014
80% 183.100 390.620 0.300 2.604440002
100% 228.400 480.440 0.267 2.831720001
20%
1800
48.040 237.620 0.190 1.646839996
40% 96.240 298.840 0.236 1.987159988
60% 144.500 339.380 0.284 2.390839966
80% 192.960 389.700 0.320 2.725160004
100% 240.200 496.560 0.343 2.935640015
20%
1900
48.580 229.500 0.207 1.747399994
40% 97.200 286.540 0.257 2.106440002
60% 145.980 327.700 0.305 2.55523999
80% 194.800 381.700 0.339 2.874799978
100% 243.200 486.240 0.355 3.002600006
20%
2000
48.400 225.520 0.224 1.832599991
40% 97.020 275.060 0.276 2.245160004
60% 145.500 316.000 0.326 2.699
80% 194.420 386.100 0.354 2.959159973
100% 242.000 473.320 0.370 3.10123999
20%
2100
48.163 217.063 0.242 1.951249979
40% 96.880 268.160 0.294 2.393960022
60% 145.440 314.240 0.343 2.847320038
80% 193.540 375.340 0.370 3.104600006
100% 241.600 464.620 0.385 3.273800018
20%
2200
48.1600 216.3600 0.2624 2.0913
40% 96.7400 258.5400 0.3156 2.5488
60% 145.0200 309.6600 0.3631 3.0175
80% 193.6211 377.4892 0.3857 3.2798
100% 240.6000 462.2400 0.4023 3.4334
List of References
249
List of References
1. Statista. Daily demand for crude oil worldwide from 2006 to 2019. 2019; Available from:
https://www.statista.com/statistics/271823/daily-global-crude-oil-demand-since-2006/.
2. Huijbregts, M.A.J., et al., Is Cumulative Fossil Energy Demand a Useful Indicator for the
Environmental Performance of Products? Environmental Science and Technology, 2006.
40(3): p. 641-648.
3. Covert, T., M. Greenstone, and C.R. Knittel, Will We Ever Stop Using Fossil Fuels? The
Journal of Economic Perspectives, 2016. 30(1): p. 117-137.
4. Mahmoudi, A., M. Fazli, and M.R. Morad, A recent review of waste heat recovery by Or-
ganic Rankine Cycle. applied thermal engineering, 2018. 143: p. 660-675.
5. Léger, J., et al., Comparing electric heating systems at equal thermal comfort: An experi-
mental investigation. Building and Environment, 2018. 128: p. 161-169.
6. Balke, E.C., W.M. Healy, and T. Ullah, An assessment of efficient water heating options
for an all-electric single family residence in a mixed-humid climate. Energy & Buildings,
2016. 133: p. 371-380.
7. Hinrichs, J., et al., Numerical and experimental investigation of pollutant formation and
emissions in a full-scale cylindrical heating unit of a condensing gas boiler. Applied En-
ergy, 2018. 229: p. 977-989.
8. Wang, Z., et al., A theoretical fundamental investigation on boilers equipped with vapor-
pump system for Flue-Gas Heat and Moisture Recovery. Energy, 2019. 171: p. 956-970.
9. Shang, S., et al., A total heat recovery system between the flue gas and oxidizing air of a
gas-fired boiler using a non-contact total heat exchanger. Applied Energy, 2017. 207: p.
613-623.
10. Wei, M., et al., Experimental investigation on vapor-pump equipped gas boiler for flue gas
heat recovery. Applied Thermal Engineering, 2019. 147: p. 371-379.
11. Qu, M., O. Abdelaziz, and H. Yin, New configurations of a heat recovery absorption heat
pump integrated with a natural gas boiler for boiler efficiency improvement. Energy Con-
version and Management, 2014. 87: p. 175-184.
12. Hebenstreit, B., et al., Techno-economic study of a heat pump enhanced flue gas heat re-
covery for biomass boilers. Biomass and Bioenergy, 2014. 71: p. 12-22.
13. Rees, S.J., Advances in ground-source heat pump systems. Vol. no.100.;number 100;.
2016, Duxford, UK: Woodhead Publishing is an imprint of Elsevier.
14. Dincer, I.b. and M. Rosen, Exergy analysis of heating, refrigerating and air conditioning:
methods and applications. 2015, Amsterdam: Elsevier.
15. Latorre-Biel, J.-I., et al., Replacement of electric resistive space heating by an air-source
heat pump in a residential application. Environmental amortization. Building and Envi-
ronment, 2018. 141: p. 193-205.
16. european council for an energy efficient economy. Getting warmer: a field trial of heat
pumps. 2011, June 9; Available from: https://www.eceee.org/library/conference_proceed-
ings/eceee_Summer_Studies/2011/7-monitoring-and-evaluation160/getting-warmer-a-
field-trial-of-heat-pumps/.
17. Wu, D.W. and R.Z. Wang, Combined cooling, heating and power: A review. Progress in
Energy and Combustion Science, 2006. 32(5): p. 459-495.
18. Cho, H., A.D. Smith, and P. Mago, Combined cooling, heating and power: A review of
performance improvement and optimization. Applied Energy, 2014. 136: p. 168-185.
List of References
250
19. Breeze, P., Chapter 3 - Combined Heat and Power Principles and Technologies, in Com-
bined Heat and Power, P. Breeze, Editor. 2018, Academic Press. p. 21-32.
20. Macháčková, A., et al., Numerical and experimental investigation of flue gases heat recov-
ery via condensing heat exchanger. International Journal of Heat and Mass Transfer, 2018.
124: p. 1321-1333.
21. Oró, E., et al., Design and economic analysis of liquid cooled data centres for waste heat
recovery: A case study for an indoor swimming pool. Sustainable Cities and Society, 2018.
36: p. 185-203.
22. Davies, G.F., G.G. Maidment, and R.M. Tozer, Using data centres for combined heating
and cooling: An investigation for London. Applied Thermal Engineering, 2016. 94: p. 296-
304.
23. Ebrahimi, K., G.F. Jones, and A.S. Fleischer, The viability of ultra low temperature waste
heat recovery using organic Rankine cycle in dual loop data center applications. Applied
Thermal Engineering, 2017. 126: p. 393-406.
24. Snijders, A.L. and B.C. Drijver, 9 - Open-loop heat pump and thermal energy storage sys-
tems, in Advances in Ground-Source Heat Pump Systems, S.J. Rees, Editor. 2016, Wood-
head Publishing. p. 247-268.
25. Jensen, J.K., et al., Design of serially connected district heating heat pumps utilising a
geothermal heat source. Energy, 2017. 137: p. 865-877.
26. Singh, R.M., A.K. Sani, and T. Amis, 15 - An overview of ground-source heat pump tech-
nology, in Managing Global Warming, T.M. Letcher, Editor. 2019, Academic Press. p.
455-485.
27. Zhen, J., et al., Groundwater source heat pump application in the heating system of Tibet
Plateau airport. Energy & Buildings, 2017. 136: p. 33-42.
28. Naicker, S.S. and S.J. Rees, Performance analysis of a large geothermal heating and cool-
ing system. Renewable Energy, 2018. 122: p. 429-442.
29. Liu, X.H., Y.F. Zhang, and J. Shen, System performance optimization of ORC-based geo-
plant with R245fa under different geothermal water inlet temperatures. Geothermics, 2017.
66: p. 134-142.
30. Li, T.L., et al., Entransy dissipation/loss-based optimization of two-stage organic Rankine
cycle (TSORC) with R245fa for geothermal power generation. Science China-Technolog-
ical Sciences, 2016. 59(10): p. 1524-1536.
31. Gaudard, A., A. Wüest, and M. Schmid, Using lakes and rivers for extraction and disposal
of heat: Estimate of regional potentials. Renewable Energy, 2019. 134: p. 330-342.
32. Shen, C., et al., Experimental performance evaluation of a novel anti-fouling wastewater
source heat pump system with a wastewater tower. Applied Energy, 2019. 236: p. 690-699.
33. Guo, X., et al., Experimental study on the performance of a novel in–house heat pump
water heater with freezing latent heat evaporator and assisted by domestic drain water.
Applied Energy, 2019. 235: p. 442-450.
34. Liu, Z., H. Tan, and Z. Li, Heating and Cooling Performances of River-Water Source Heat
Pump System for Energy Station in Shanghai. Procedia Engineering, 2017. 205: p. 4074-
4081.
35. Zou, S. and X. Xie, Simplified model for coefficient of performance calculation of surface
water source heat pump. Applied Thermal Engineering, 2017. 112: p. 201-207.
36. Zhang, H., H. Zhao, and Z. Li, Thermodynamic performance study on solar-assisted ab-
sorption heat pump cogeneration system in the coal-fired power plant. Energy, 2016. 116:
p. 942-955.
List of References
251
37. Zhao, M., et al., Experimental investigation and feasibility analysis on a capillary radiant
heating system based on solar and air source heat pump dual heat source. Applied Energy,
2017. 185: p. 2094-2105.
38. Eisavi, B., et al., Thermodynamic analysis of a novel combined cooling, heating and power
system driven by solar energy. Applied Thermal Engineering, 2018. 129: p. 1219-1229.
39. Freeman, J., et al., A small-scale solar organic Rankine cycle combined heat and power
system with integrated thermal energy storage. Applied Thermal Engineering, 2017. 127:
p. 1543-1554.
40. Wang, J. and Y. Yang, Energy, exergy and environmental analysis of a hybrid combined
cooling heating and power system utilizing biomass and solar energy. Energy Conversion
and Management, 2016. 124: p. 566-577.
41. Aspen plus v8.8 , Aspen Technology Inc.:USA. 2014.
42. Lemmon, E.W., Huber, M. L., McLinden, M. O., NIST Standard Reference Database 23:
Reference Fluid Thermodynamic and Transport Properties-REFPROP, Version 9.1., Na-
tional Institute of Standards and Technology, Standard Reference Data Program,
Gaithersburg. 2013.
43. Breeze, P., Chapter 6 - Gas Turbine Combined Heat and Power Systems, in Combined
Heat and Power, P. Breeze, Editor. 2018, Academic Press. p. 51-59.
44. Al Moussawi, H., F. Fardoun, and H. Louahlia, Selection based on differences between
cogeneration and trigeneration in various prime mover technologies. Renewable and Sus-
tainable Energy Reviews, 2017. 74: p. 491-511.
45. Yu, G., et al., Simulation and thermodynamic analysis of a bottoming Organic Rankine
Cycle (ORC) of diesel engine (DE). Energy, 2013. 51: p. 281-290.
46. Qiu, S., et al., Development of an advanced free-piston Stirling engine for micro combined
heating and power application. Applied Energy, 2019. 235: p. 987-1000.
47. Zhou, N., et al., Experimental study on Organic Rankine Cycle for waste heat recovery
from low-temperature flue gas. Energy, 2013. 55: p. 216-225.
48. Collings, P., Theoretical and experimental analysis of an organic Rankine Cycle. 2018,
University of Glasgow: University of Glasgow PhD Thesis.
49. Zhao, X., et al., Flue gas recovery system for natural gas combined heat and power plant
with distributed peak-shaving heat pumps. Applied Thermal Engineering, 2017. 111: p.
599-607.
50. Kang, S., et al., A new utilization approach of the waste heat with mid-low temperature in
the combined heating and power system integrating heat pump. Applied Energy, 2015.
160: p. 185-193.
51. Cai, B., et al., Theoretical and experimental study of combined heat and power (CHP)
system integrated with ground source heat pump (GSHP). Applied Thermal Engineering,
2017. 127: p. 16-27.
52. Lei, H., et al., Study on different heat supplementation strategies for a combined cooling,
heating and power system. Applied Thermal Engineering, 2018. 144: p. 558-570.
53. Yang, Z., W.-B. Wang, and X. Wu, Thermal modeling and operating tests for a gas-engine
driven heat pump working as a water heater in winter. Energy & Buildings, 2013. 58: p.
219-226.
54. Hu, B., et al., Thermal modeling and experimental research of a gas engine-driven heat
pump in variable condition. Applied Thermal Engineering, 2017. 123: p. 1504-1513.
55. Liu, F.-G., et al., Experimental study on the performance of a gas engine heat pump for
heating and domestic hot water. Energy & Buildings, 2017. 152: p. 273-278.
List of References
252
56. Liu, F.-G., et al., Experimental investigation of a gas engine-driven heat pump system for
cooling and heating operation. International Journal of Refrigeration, 2018. 86: p. 196-
202.
57. Wan, X., et al., Power management strategy for a parallel hybrid-power gas engine heat
pump system. Applied Thermal Engineering, 2017. 110: p. 234-243.
58. Jiang, W., et al., Simulation and validation of a hybrid-power gas engine heat pump. Inter-
national Journal of Refrigeration, 2015. 50: p. 114-126.
59. Farrokhi, M., S.H. Noie, and A.A. Akbarzadeh, Preliminary experimental investigation of
a natural gas-fired ORC-based micro-CHP system for residential buildings. Applied Ther-
mal Engineering, 2014. 69(1-2): p. 221-229.
60. Peris, B., et al., Experimental characterization of an ORC (organic Rankine cycle) for
power and CHP (combined heat and power) applications from low grade heat sources.
Energy, 2015. 82: p. 269-276.
61. Zhao, M., et al., Performance evaluation of a diesel engine integrated with ORC system.
Applied Thermal Engineering, 2017. 115: p. 221-228.
62. Bombarda, P., C.M. Invernizzi, and C. Pietra, Heat recovery from Diesel engines: A ther-
modynamic comparison between Kalina and ORC cycles. Applied Thermal Engineering,
2010. 30(2): p. 212-219.
63. Koppauer, H., W. Kemmetmüller, and A. Kugi, Modeling and optimal steady-state oper-
ating points of an ORC waste heat recovery system for diesel engines. Applied Energy,
2017. 206: p. 329-345.
64. Feru, E., et al., Two-phase plate-fin heat exchanger modeling for waste heat recovery sys-
tems in diesel engines. Applied Energy, 2014. 133: p. 183-196.
65. Yang, F., et al., Thermoeconomic multi-objective optimization of a dual loop organic Ran-
kine cycle (ORC) for CNG engine waste heat recovery. Applied Energy, 2017. 205: p.
1100-1118.
66. Lu, Y., et al., Parametric study for small scale engine coolant and exhaust heat recovery
system using different Organic Rankine cycle layouts. Applied Thermal Engineering, 2017.
127: p. 1252-1266.
67. Liu, P., et al., Alkanes based two-stage expansion with interheating Organic Rankine cycle
for multi-waste heat recovery of truck diesel engine. Energy, 2018. 147: p. 337-350.
68. Song, J. and C.-w. Gu, Analysis of ORC (Organic Rankine Cycle) systems with pure hy-
drocarbons and mixtures of hydrocarbon and retardant for engine waste heat recovery.
Applied Thermal Engineering, 2015. 89: p. 693-702.
69. Salek, F., A.N. Moghaddam, and M.M. Naserian, Thermodynamic analysis of diesel engine
coupled with ORC and absorption refrigeration cycle. Energy Conversion and Manage-
ment, 2017. 140: p. 240-246.
70. Di Battista, D., M. Mauriello, and R. Cipollone, Waste heat recovery of an ORC-based
power unit in a turbocharged diesel engine propelling a light duty vehicle. Applied Energy,
2015. 152: p. 109-120.
71. Shu, G., et al., Experimental investigation on thermal OS/ORC (Oil Storage/Organic Ran-
kine Cycle) system for waste heat recovery from diesel engine. Energy, 2016. 107: p. 693-
706.
72. Xu, B., et al., Transient dynamic modeling and validation of an organic Rankine cycle
waste heat recovery system for heavy duty diesel engine applications. Applied Energy,
2017. 205: p. 260-279.
73. Huster, W.R., et al., Validated dynamic model of an organic Rankine cycle (ORC) for waste
heat recovery in a diesel truck. Energy, 2018. 151: p. 647-661.
List of References
253
74. Aphornratana, S. and T. Sriveerakul, Analysis of a combined Rankine–vapour–compres-
sion refrigeration cycle. Energy Conversion and Management, 2010. 51(12): p. 2557-2564.
75. Wang, H., R. Peterson, and T. Herron, Design study of configurations on system COP for
a combined ORC (organic Rankine cycle) and VCC (vapor compression cycle). Energy,
2011. 36(8): p. 4809-4820.
76. Kim, K.H. and H. Perez-Blanco, Performance analysis of a combined organic Rankine
cycle and vapor compression cycle for power and refrigeration cogeneration. Applied
Thermal Engineering, 2015. 91: p. 964-974.
77. Molés, F., et al., Thermodynamic analysis of a combined organic Rankine cycle and vapor
compression cycle system activated with low temperature heat sources using low GWP
fluids. Applied Thermal Engineering, 2015. 87: p. 444-453.
78. Asim, M., et al., Thermodynamic and Thermo-economic Analysis of Integrated Organic
Rankine Cycle for Waste Heat Recovery from Vapor Compression Refrigeration Cycle.
Energy Procedia, 2017. 143: p. 192-198.
79. Saleh, B., Energy and exergy analysis of an integrated organic Rankine cycle-vapor com-
pression refrigeration system. Applied Thermal Engineering, 2018. 141: p. 697-710.
80. Yu, H., T. Gundersen, and X. Feng, Process integration of organic Rankine cycle (ORC)
and heat pump for low temperature waste heat recovery. Energy, 2018. 160: p. 330-340.
81. Patel, B., N.B. Desai, and S.S. Kachhwaha, Optimization of waste heat based organic Ran-
kine cycle powered cascaded vapor compression-absorption refrigeration system. Energy
Conversion and Management, 2017. 154: p. 576-590.
82. Patel, B., et al., Thermo-economic analysis of a novel organic Rankine cycle integrated
cascaded vapor compression–absorption system. Journal of Cleaner Production, 2017.
154: p. 26-40.
83. Patel, B., N.B. Desai, and S.S. Kachhwaha, Thermo-economic analysis of solar-biomass
organic Rankine cycle powered cascaded vapor compression-absorption system. Solar En-
ergy, 2017. 157: p. 920-933.
84. Lizarte, R., M.E. Palacios-Lorenzo, and J.D. Marcos, Parametric study of a novel organic
Rankine cycle combined with a cascade refrigeration cycle (ORC-CRS) using natural re-
frigerants. Applied Thermal Engineering, 2017. 127: p. 378-389.
85. Bounefour, O. and A. Ouadha, Performance improvement of combined organic Rankine-
vapor compression cycle using serial cascade evaporation in the organic cycle. Energy
Procedia, 2017. 139: p. 248-253.
86. Kaşka, Ö., et al., The performance assessment of a combined organic Rankine-vapor com-
pression refrigeration cycle aided hydrogen liquefaction. International Journal of Hydro-
gen Energy, 2018. 43(44): p. 20192-20202.
87. Chang, H., et al., Energy analysis of a hybrid PEMFC–solar energy residential micro-
CCHP system combined with an organic Rankine cycle and vapor compression cycle. En-
ergy Conversion and Management, 2017. 142: p. 374-384.
88. Collings, M.P.a.A.-T., Mr Mohammed and Yu, Dr Zhibin. A Combined Organic Rankine
Cycle-Heat Pump System for Domestic Hot Water Application. in 12th International Con-
ference on Heat Transfer, Fluid Mechanics and Thermodynamics 2016. Malaga, Spain.
89. Liang, Y., M. Al-Tameemi, and Z. Yu, Investigation of a gas-fuelled water heater based
on combined power and heat pump cycles. Applied Energy, 2018. 212: p. 1476-1488.
90. Underwood, C.P., 14 - Heat pump modelling, in Advances in Ground-Source Heat Pump
Systems, S.J. Rees, Editor. 2016, Woodhead Publishing. p. 387-421.
91. Dincer, I. and M.A. Rosen, Chapter 4 - Heat Pump Systems, in Exergy Analysis of Heating,
Refrigerating and Air Conditioning, I. Dincer and M.A. Rosen, Editors. 2015, Elsevier:
Boston. p. 131-168.
List of References
254
92. Mikielewicz, D. and J. Wajs, Performance of the very high-temperature heat pump with
low GWP working fluids. Energy, 2019. 182: p. 460-470.
93. Wang, G.B. and X.R. Zhang, Thermoeconomic optimization and comparison of the simple
single-stage transcritical carbon dioxide vapor compression cycle with different subcool-
ing methods for district heating and cooling. Energy Conversion and Management, 2019.
185: p. 740-757.
94. He, W.F., et al., Thermodynamic, economic analysis and optimization of a heat pump
driven desalination system with open-air humidification dehumidification configurations.
Energy, 2019. 174: p. 768-778.
95. Rad, E.A. and S. Maddah, Entropic optimization of the economizer's pressure in a heat
pump cycle integrated with a flash-tank and vapor-injection system. International Journal
of Refrigeration-Revue Internationale Du Froid, 2019. 97: p. 56-66.
96. Yang, F.B., et al., Parametric optimization and performance analysis of ORC (organic
Rankine cycle) for diesel engine waste heat recovery with a fin-and- tube evaporator. En-
ergy, 2015. 91: p. 128-141.
97. Underwood, C.P., M. Royapoor, and B. Sturm, Parametric modelling of domestic air-
source heat pumps. Energy & Buildings, 2017. 139: p. 578-589.
98. Woodland, B.J., et al. Experimental Testing of an Organic Rankine Cycle with Scroll-type
Expander. Publications of the Ray W. Herrick Laboratories. 2012. Paper 52.
99. Declaye, S., et al., Experimental study on an open-drive scroll expander integrated into an
ORC (Organic Rankine Cycle) system with R245fa as working fluid. Energy, 2013. 55: p.
173-183.
100. Cuevas, C., N. Fonseca, and V. Lemort, Automotive electric scroll compressor: Testing
and modeling. International Journal of Refrigeration, 2012. 35(4): p. 841-849.
101. Wang, Z.H., et al., Dynamic character investigation and optimization of a novel air-source
heat pump system. Applied Thermal Engineering, 2017. 111: p. 122-133.
102. Nenkaew, P. and C. Tangthien, A study of Transient Performance of A Cascade Heat Pump
System. 2015 International Conference on Alternative Energy in Developing Countries and
Emerging Economies, 2015. 79: p. 131-136.
103. He, Z.L., et al., Experimental study on a bifunctional heat utilization system of heat pump
and power generation using low-grade heat source. Applied Thermal Engineering, 2017.
124: p. 71-82.
104. Kong, X.Q., et al., Control strategy and experimental analysis of a direct-expansion solar-
assisted heat pump water heater with R134a. Energy, 2018. 145: p. 17-24.
105. Shen, J.B., et al., Design and experimental study of an air source heat pump for drying
with dual modes of single stage and cascade cycle. Applied Thermal Engineering, 2018.
129: p. 280-289.
106. Kong, X.Q., et al., Experimental performance analysis of a direct-expansion solar-assisted
heat pump water heater with R134a in summer. International Journal of Refrigeration-Re-
vue Internationale Du Froid, 2018. 91: p. 12-19.
107. Xu, Y.J., et al., Experimental and theoretical study on an air-source heat pump water
heater for northern China in cold winter: Effects of environment temperature and switch
of operating modes. Energy and Buildings, 2019. 191: p. 164-173.
108. Liu, T.Q., S.F. Wang, and Y.S. Xu, Experimental investigation of stepped short tube orifice
as expansion device in domestic air conditioning/heat pump system. Energy and Buildings,
2019. 193: p. 240-249.
109. Fannou, J.-L.C., et al., Cooling mode experimental analysis of a direct expansion geother-
mal heat pump with a control depending on the discharge pressure. Applied Thermal En-
gineering, 2019. 160: p. 113955.
List of References
255
110. Yang, L.-X., et al., Experimental study on the effect of compressor frequency on the per-
formance of transcritical CO2 heat pump system with regenerator. Applied Thermal En-
gineering, 2019. 150: p. 1216-1223.
111. Guo, X., et al., Experimental study on the performance of a novel in–house heat pump
water heater with freezing latent heat evaporator and assisted by domestic drain water.
Applied Energy, 2019. 235: p. 442-450.
112. Mota-Babiloni, A., et al., Experimental influence of an internal heat exchanger (IHX) using
R513A and R134a in a vapor compression system. Applied Thermal Engineering, 2019.
147: p. 482-491.
113. Li, Z., K. Liang, and H. Jiang, Experimental study of R1234yf as a drop-in replacement for
R134a in an oil-free refrigeration system. Applied Thermal Engineering, 2019. 153: p.
646-654.
114. Youcai Liang, A.M., Guopeng Yu, Zhibin Yu. Experimental research on a small air-
source heat pump with an oil-free scroll compressor. in The 5th Sustainable Thermal En-
ergy Management International Conference 2019. Hangzhou(China).
115. Yun, E., et al., Experimental investigation of an organic Rankine cycle with multiple ex-
panders used in parallel. Applied Energy, 2015. 145: p. 246-254.
116. Lei, B., et al., Development and experimental study on a single screw expander integrated
into an Organic Rankine Cycle. Energy, 2016. 116: p. 43-52.
117. Pu, W., et al., Experimental study on Organic Rankine cycle for low grade thermal energy
recovery. Applied Thermal Engineering, 2016. 94: p. 221-227.
118. Pang, K.-C., et al., Experimental study on organic Rankine cycle utilizing R245fa, R123
and their mixtures to investigate the maximum power generation from low-grade heat. En-
ergy, 2017. 133: p. 636-651.
119. Li, L., Y.T. Ge, and S.A. Tassou, Experimental Study on a Small-scale R245fa Organic
Rankine Cycle System for Low-grade Thermal Energy Recovery. Energy Procedia, 2017.
105: p. 1827-1832.
120. Yang, S.-C., et al., Experimental investigation on a 3kW organic Rankine cycle for low-
grade waste heat under different operation parameters. Applied Thermal Engineering,
2017. 113: p. 756-764.
121. Nematollahi, O., et al., Experimental study of the effect of brazed compact metal-foam
evaporator in an organic Rankine cycle performance: Toward a compact ORC. Energy
Conversion and Management, 2018. 173: p. 37-45.
122. Kim, J.-S., D.-Y. Kim, and Y.-T. Kim, Experiment on radial inflow turbines and perfor-
mance prediction using deep neural network for the organic Rankine cycle. Applied Ther-
mal Engineering, 2019. 149: p. 633-643.
123. Chen, J., et al., A flexible and multi-functional organic Rankine cycle system: Preliminary
experimental study and advanced exergy analysis. Energy Conversion and Management,
2019. 187: p. 339-355.
124. Zhang, H.-H., et al., Experimental study of the organic rankine cycle under different heat
and cooling conditions. Energy, 2019. 180: p. 678-688.
125. Yamaguchi, T., S. Sasaki, and S. Momoki, Experimental study for the small capacity or-
ganic Rankine cycle to recover the geothermal energy in Obama hot spring resort area.
Energy Procedia, 2019. 160: p. 389-395.
126. Collings, et al., Experimental Investigation of a Small-Scale ORC Power Plant Using a
Positive Displacement Expander with and without a Regenerator. Energies, 2019. 12(8):
p. 1452.
127. Eastop, T.D. and A. McConkey, Applied thermodynamics for engineering technologists.
5th ed. 1993, Harlow: Addison Wesley Longman Limited.
List of References
256
128. Correa, F. and C. Cuevas, Air-water heat pump modelling for residential heating and do-
mestic hot water in Chile. Applied Thermal Engineering, 2018. 143: p. 594-606.
129. Ju, F., et al., Experimental investigation on a heat pump water heater using R744/R290
mixture for domestic hot water. International Journal of Thermal Sciences, 2018. 132: p.
1-13.
130. Willem, H., Y. Lin, and A. Lekov, Review of energy efficiency and system performance of
residential heat pump water heaters. Energy & Buildings, 2017. 143: p. 191-201.
131. Li, J., et al., Energetic and exergetic investigation of an organic Rankine cycle at different
heat source temperatures. Energy, 2012. 38(1): p. 85-95.
132. Saleh, B., et al., Working fluids for low-temperature organic Rankine cycles. Energy, 2007.
32(7): p. 1210-1221.
133. Cao, Y., et al., Optimum design and thermodynamic analysis of a gas turbine and ORC
combined cycle with recuperators. Energy Conversion and Management, 2016. 116: p. 32-
41.
134. Andreasen, J.G., et al., Design and optimization of a novel organic Rankine cycle with
improved boiling process. Energy, 2015. 91: p. 48-59.
135. Dong, B., et al., Parametric analysis of organic Rankine cycle based on a radial turbine
for low-grade waste heat recovery. Applied Thermal Engineering, 2017. 126: p. 470-479.
136. Ju, F., et al., Experiment and simulation study on performances of heat pump water heater
using blend of R744/R290. Energy & Buildings, 2018. 169: p. 148-156.
137. Högberg, M., L. Vamling, and T. Berntsson, Calculation methods for comparing the per-
formance of pure and mixed working fluids in heat pump applications. International Journal
of Refrigeration, 1993. 16(6): p. 403-413.
138. Kim, M.S. and S.G. Kim, Experiment and simulation on the performance of an autocas-
cade refrigeration system using carbon dioxide as a refrigerant. International Journal of
Refrigeration, 2002. 25(8): p. 1093-1101.
139. Gu, Z., et al., A solution to the cooling and preheating of hydraulic system by organic
Rankine cycle with heat pump. Energy Conversion and Management, 2019. 180: p. 94-105.
140. Schimpf, S. and R. Span, Simulation of a solar assisted combined heat pump – Organic
rankine cycle system. Energy Conversion and Management, 2015. 102: p. 151-160.
141. Deutz, K.R., et al., Detailed and dynamic variable speed air source heat pump water heater
model: Combining a zonal tank model approach with a grey box heat pump model. Inter-
national Journal of Refrigeration, 2018. 92: p. 55-69.
142. Potter, M.C., Somerton, Craig W. , Thermodynamics for Engineers Third Edition ed, ed.
S.s.O. Series. 2014, Untied States of America: McGraw-Hill Education.
143. Quoilin, S., V. Lemort, and J. Lebrun, Experimental study and modeling of an Organic
Rankine Cycle using scroll expander. Applied Energy, 2010. 87(4): p. 1260-1268.
144. Hsieh, Y.Y. and T.F. Lin, Saturated flow boiling heat transfer and pressure drop of refrig-
erant R-410A in a vertical plate heat exchanger. International Journal of Heat and Mass
Transfer, 2002. 45(5): p. 1033-1044.
145. Kuo, W.S., et al., Condensation heat transfer and pressure drop of refrigerant R-410A flow
in a vertical plate heat exchanger. International Journal of Heat and Mass Transfer, 2005.
48(25): p. 5205-5220.
146. Mitrovic, J., Wärme- und Stoffübertragung: Von Prof. Dr.H. D. Baehr und Prof. Dr.K.
Stephan. 2. Aufl. Berlin: Springer-Verlag 1996. 697 S., geb., Preis: 98.-DM. Forschung im
Ingenieurwesen, 1996. 62(6): p. 167-167.
147. Gnielinski, V., On heat transfer in tubes. International Journal of Heat and Mass Transfer,
2013. 63: p. 134-140.
List of References
257
148. Dittus, F.W. and L.M.K. Boelter, Heat transfer in automobile radiators of the tubular type.
International Communications in Heat and Mass Transfer, 1985. 12(1): p. 3-22.
149. Shah, M.M., A general correlation for heat transfer during film condensation inside pipes.
International Journal of Heat and Mass Transfer, 1979. 22(4): p. 547-556.
150. Asadi, M. and R.H. Khoshkhoo, Effects of Chevron Angle on Thermal Performance of
Corrugated Plate Heat Exchanger. International Journal of Engineering Practical Research
(IJEPR), 2014. 3(1).
151. Shu, G., et al., A Multi-Approach Evaluation System (MA-ES) of Organic Rankine Cycles
(ORC) used in waste heat utilization. Applied Energy, 2014. 132: p. 325-338.
152. Keinath, C.M. and S. Garimella, Development and demonstration of a microscale absorp-
tion heat pump water heater. International Journal of Refrigeration, 2018. 88: p. 151-171.
153. Guo, J.J., et al., Experimental research and operation optimization of an air-source heat
pump water heater. Applied Energy, 2011. 88(11): p. 4128-4138.
154. Liu, S., et al., Energetic, economic and environmental analysis of air source transcritical
CO2 heat pump system for residential heating in China. Applied Thermal Engineering,
2019. 148: p. 1425-1439.
155. Wang, D., Y. Lu, and L. Tao, Optimal combination of capillary tube geometry and refrig-
erant charge on a small CO2 water-source heat pump water heater. International Journal
of Refrigeration, 2018. 88: p. 626-636.
156. Lai, N.A., M. Wendland, and J. Fischer, Working fluids for high-temperature organic Ran-
kine cycles. Energy, 2011. 36(1): p. 199-211.
157. Zhang, S., H. Wang, and T. Guo, Experimental investigation of moderately high tempera-
ture water source heat pump with non-azeotropic refrigerant mixtures. Applied Energy,
2010. 87(5): p. 1554-1561.
158. Yaqub, M. and S.M. Zubair, Capacity Control for Refrigeration and Air-Conditioning Sys-
tems: A Comparative Study. Journal of Energy Resources Technology, 2001. 123(1): p. 92.
159. Finn, D.P. and C.J. Doyle, Control and optimization issues associated with algorithm-con-
trolled refrigerant throttling devices. 2000, Univ. Coll. of Dublin (IE).
160. Marcinichen, J.B., T.N.d. Holanda, and C. Melo, A dual SISO controller for a vapor com-
pression refrigeration system. 2008.
161. Goyal, A., M.A. Staedter, and S. Garimella, A review of control methodologies for vapor
compression and absorption heat pumps. International Journal of Refrigeration, 2019. 97:
p. 1-20.
162. Sung, S.W., J. Lee, and I.-B. Lee, Process identification and PID control. 2009, Singa-
pore;Hoboken, N.J;: John Wiley.
163. Saloux, E., et al., Reconstruction procedure of the thermodynamic cycle of organic Rankine
cycles (ORC) and selection of the most appropriate working fluid. Applied Thermal Engi-
neering, 2018. 129: p. 628-635.
164. Qiu, G., Selection of working fluids for micro-CHP systems with ORC. Renewable Energy,
2012. 48: p. 565-570.
165. Chen, G., et al., Performance prediction and working fluids selection for organic Rankine
cycle under reduced temperature. Applied Thermal Engineering, 2019. 153: p. 95-103.
166. Wang, X., et al., Working fluid selection for organic Rankine cycle power generation using
hot produced supercritical CO2 from a geothermal reservoir. Applied Thermal Engineer-
ing, 2019. 149: p. 1287-1304.
167. Wallerand, A.S., et al., Optimal heat pump integration in industrial processes. Applied
Energy, 2018. 219: p. 68-92.
168. Frate, G.F., L. Ferrari, and U. Desideri, Analysis of suitability ranges of high temperature
heat pump working fluids. Applied Thermal Engineering, 2019. 150: p. 628-640.
List of References
258
169. Nasir, M.T. and K.C. Kim, Working fluids selection and parametric optimization of an
Organic Rankine Cycle coupled Vapor Compression Cycle (ORC-VCC) for air condition-
ing using low grade heat. Energy & Buildings, 2016. 129: p. 378-395.
170. Yu, H., D. Kim, and T. Gundersen, A study of working fluids for Organic Rankine Cycles
(ORCs) operating across and below ambient temperature to utilize Liquefied Natural Gas
(LNG) cold energy. Energy, 2019. 167: p. 730-739.
171. Scaccabarozzi, R., et al., Comparison of working fluids and cycle optimization for heat
recovery ORCs from large internal combustion engines. Energy, 2018. 158: p. 396-416.
172. Restrepo, G., et al., Ranking of refrigerants. Environmental Science & Technology, 2008.
42(8): p. 2925-2930.
173. Vocale, P., G.L. Morini, and M. Spiga, Influence of Outdoor Air Conditions on the Air
Source Heat Pumps Performance. Energy Procedia, 2014. 45: p. 653-662.
174. Chen, J.H. and J.L. Yu, Dynamic simulation of an air-source heat pump water heater using
novel modified evaporator model. Applied Thermal Engineering, 2018. 144: p. 469-478.
175. Zhou, F., C.C. Wei, and G.Y. Ma, Development and analysis of a pump-driven loop heat
pipe unit for cooling a small data center. Applied Thermal Engineering, 2017. 124: p.
1169-1175.
176. McConkey, A., A. Poon-King, and Z. Yu, Heating Glasgow University with River Sourced
Heat Pumps. 3rd Iir International Conference on Sustainability and the Cold Chain, 2014.
2014(1): p. 631-638.
177. Badescu, V., et al., Avoiding malfunction of ORC-based systems for heat recovery from
internal combustion engines under multiple operation conditions. Applied Thermal Engi-
neering, 2019. 150: p. 977-986.
178. Guopeng, Y., Research on Highly Efficient Bottoming Cascaded Thermal Systems Used
for Large-Temperature-Difference Waste-Heat-Recovery of Heavy-Duty Diesel Engine.
2017, Tianjin University. p. p:11-40.
179. Li, J., et al., Energetic and exergetic investigation of an organic Rankine cycle at different
heat source temperatures. Energy, 2012. 38(1): p. 85-95.


![Chap1- Time Value of Money (Ridha)[1]](https://img.pdfslide.us/doc/110x75/577cd0d91a28ab9e7893320e/chap1-time-value-of-money-ridha1.jpg)