Embed Size (px)
Citation preview

Ajera and PORTFOLIO
Quick Tour of the Financial Statement Designer
9750 SW Nimbus Avenue • Beaverton, Oregon • 97008 • 800.872.1540 • www.axiumae.com
2
NOTICE
This documentation and the Axium software programs may only be used in accordance with the accompanying Ajera License Agreement. You may not use, copy, modify or transfer the Axium programs or this documentation except as expressly provided in the Ajera License Agreement. AXIUM™ and the Axium software logo as it appears in this manual are registered Marks of XTS Software Corporation dba Axium. Microsoft and Windows are registered trademarks of Microsoft Corporation in the United States and/or other countries. All other company, product, or brand names mentioned herein, may be the trademarks of their respective owners. © 2010 XTS Software Corporation dba Axium. All rights reserved. Copyright includes accompanying software and windows generated by the software.
3
Goals of this quick tour
In this quick tour, you will receive an overview of the Financial Statement Designer. The designer contains a simple spreadsheet format that you can use to add cells, rows, and columns of information to a statement design.
You will also learn about reporting entities, which are groups of departments that you create to represent the various divisions in your firm for which you want financial information. You can use reporting entities to create comparative or multi-level financial statements.
This quick tour assumes that you have experience with common spreadsheet programs.

4
Using the Financial Statement Designer (7 steps) Goal: To design a financial statement in the Financial Statement Designer.
Work plan: Set up a design in the Financial Statement Designer with the desired columns and rows. Do this by selecting columns and rows in the designer’s worksheet and defining the contents and appearance of these selections.
Step 1: Set security
1. From the Company menu, click Security.
2. Select an employee type, and click Edit.
3. Select the Financial Statement Designer check box on the General tab.

5
Step 2: Open the Financial Statement Designer
1. From the Reports menu, click Financial Statement Designer.
2. On the Design tab is a worksheet with a properties area below it:
• The worksheet is where you create or change a design. You begin by selecting cells in the worksheet.
• The properties area is where you select options that define the contents of the selected cells in the worksheet.
3. Select a cell, row, or column and notice how the options in the properties area depend on what is selected in the worksheet.
b. The options that appear in the properties area depend on what you select in the worksheet (see examples below ).
a. Start by making a selection in the worksheet: a cell, row, or column.
When you select an empty column, the Column Filter fields appear.
Worksheet
Properties area
When you select an empty row, the Row Type buttons appear.
When you select an empty cell, the Company contents options appear.

6
Step 3: Provide a title for the statement 1. In the worksheet, click a cell and define the contents of the cell. You can double-click a contents option, such as Company Name, in the properties
area, or enter the text directly into the cell.
2. Use the toolbar to merge cells and to format and align the title.
Use the toolbar to format your title.
7
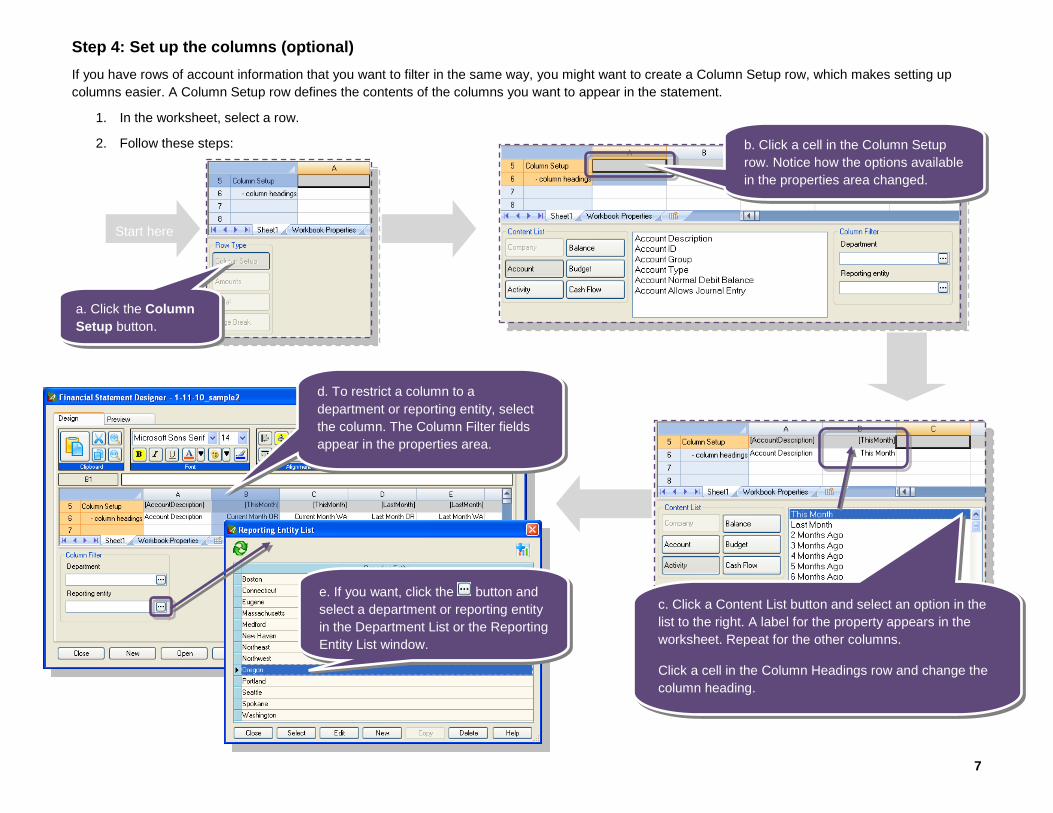
Step 4: Set up the columns (optional) If you have rows of account information that you want to filter in the same way, you might want to create a Column Setup row, which makes setting up columns easier. A Column Setup row defines the contents of the columns you want to appear in the statement.
1. In the worksheet, select a row.
2. Follow these steps:
a. Click the Column Setup button.
b. Click a cell in the Column Setup row. Notice how the options available in the properties area changed.
c. Click a Content List button and select an option in the list to the right. A label for the property appears in the worksheet. Repeat for the other columns.
Click a cell in the Column Headings row and change the column heading.
d. To restrict a column to a department or reporting entity, select the column. The Column Filter fields appear in the properties area.
e. If you want, click the button and select a department or reporting entity in the Department List or the Reporting Entity List window.
Start here
8
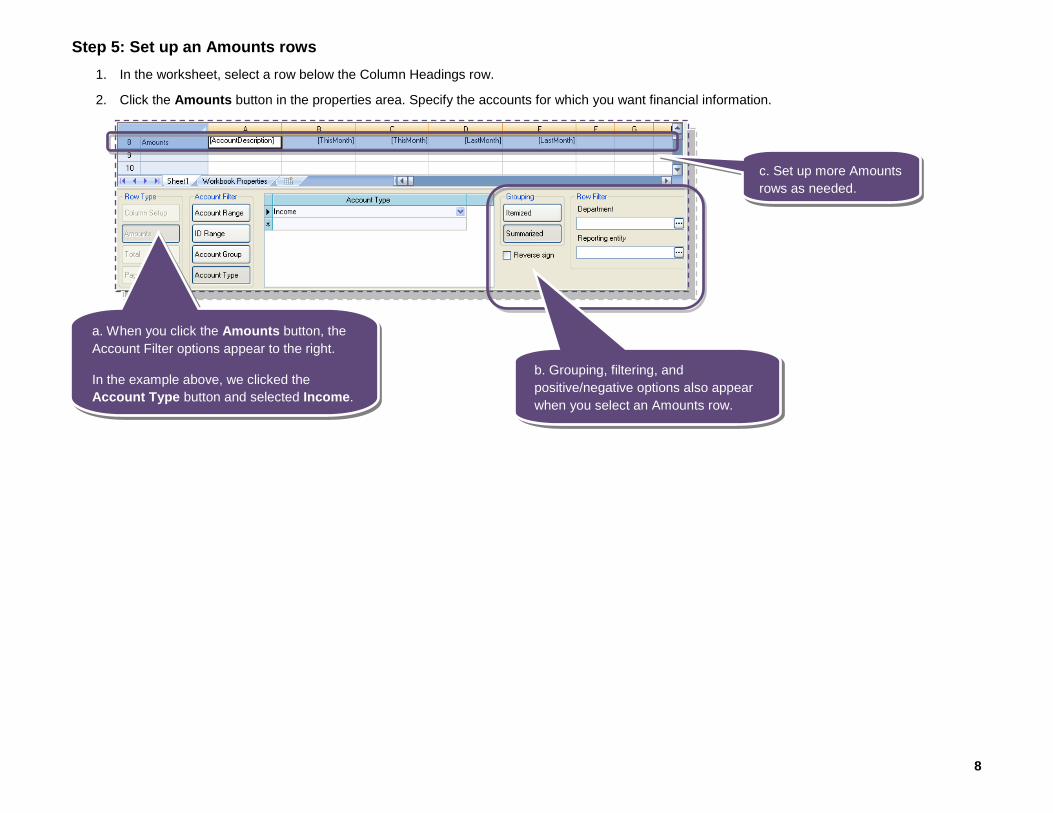
Step 5: Set up an Amounts rows 1. In the worksheet, select a row below the Column Headings row.
2. Click the Amounts button in the properties area. Specify the accounts for which you want financial information.
a. When you click the Amounts button, the Account Filter options appear to the right.
In the example above, we clicked the Account Type button and selected Income.
c. Set up more Amounts rows as needed.
b. Grouping, filtering, and positive/negative options also appear when you select an Amounts row.

9
Step 6: Set up a Total row 1. In the worksheet, select a row below the Amounts row.
2. Click the Total button in the properties area to apply a formula to the row that sums the values of all amount cells between the current row and the preceding Total or Column Setup row for each defined column.
Notice how the Design tab displays labels of the contents properties, not the actual values from your database.
Also, if you select an Amounts row or a column in the worksheet, the properties area displays the options you selected for that row or column.
All of this allows you to easily analyze your statement design and change it, if needed.
To view your statement with the actual values from your database, use the Preview tab.
If you want, you can click a cell and change the formula or property.

10
Step 7: Select global properties on the Workbook Properties sheet 1. On the Design tab, click the Workbook Properties subtab.
2. Select properties that define the following:
• Appearance of certain information in individual statements • Print settings for individual statements • General contents of individual statements • Accounting basis and date reported of all statements in the workbook
Worksheet display properties: determine how certain information, such as commas or zeros in currency values, display in a statement.
Worksheet print properties: determine print settings, such as margins and orientation, for a statement.
Worksheet contents properties: determine whether the information in a statement represents the entire company or just a department or reporting entity.
Workbook contents properties: determine the accounting basis and the month-end date for all the statements in the workbook.
The month-end date is particularly significant because options in the properties area that define a time period reference this date.
11
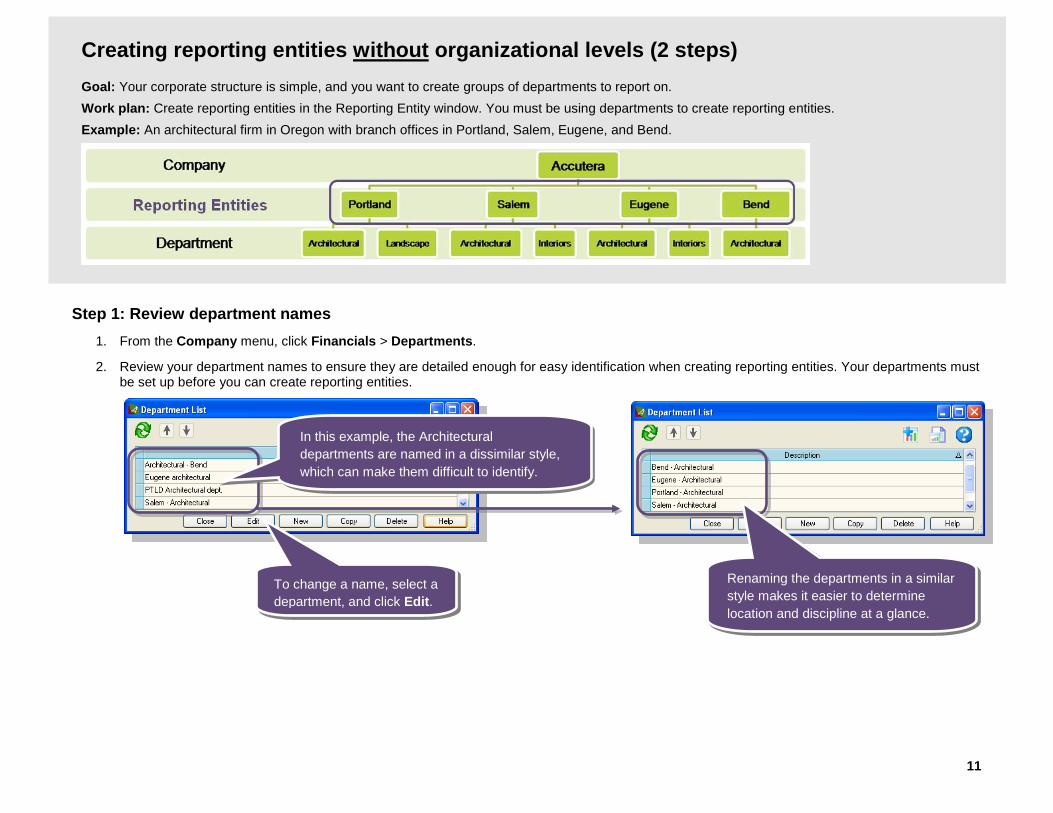
Creating reporting entities without organizational levels (2 steps) Goal: Your corporate structure is simple, and you want to create groups of departments to report on. Work plan: Create reporting entities in the Reporting Entity window. You must be using departments to create reporting entities. Example: An architectural firm in Oregon with branch offices in Portland, Salem, Eugene, and Bend.
Step 1: Review department names 1. From the Company menu, click Financials > Departments.
2. Review your department names to ensure they are detailed enough for easy identification when creating reporting entities. Your departments must be set up before you can create reporting entities.
To change a name, select a department, and click Edit.
Renaming the departments in a similar style makes it easier to determine location and discipline at a glance.
In this example, the Architectural departments are named in a dissimilar style, which can make them difficult to identify.
12
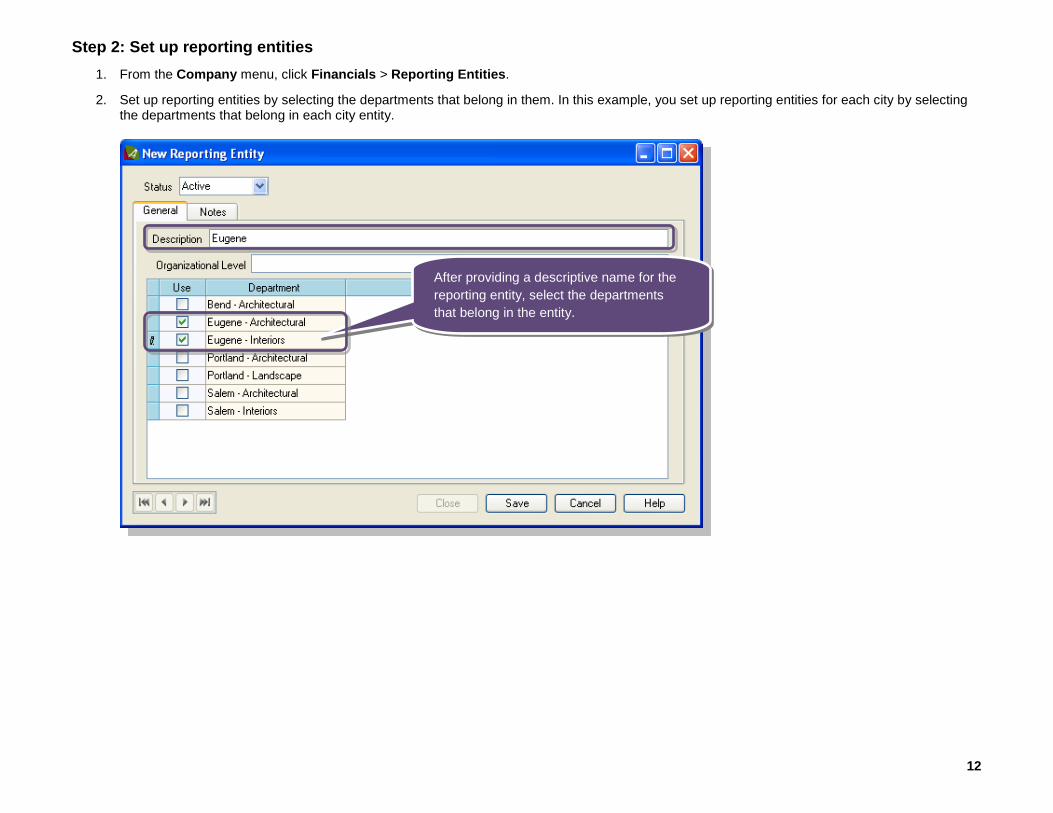
Step 2: Set up reporting entities 1. From the Company menu, click Financials > Reporting Entities.
2. Set up reporting entities by selecting the departments that belong in them. In this example, you set up reporting entities for each city by selecting the departments that belong in each city entity.
After providing a descriptive name for the reporting entity, select the departments that belong in the entity.
13
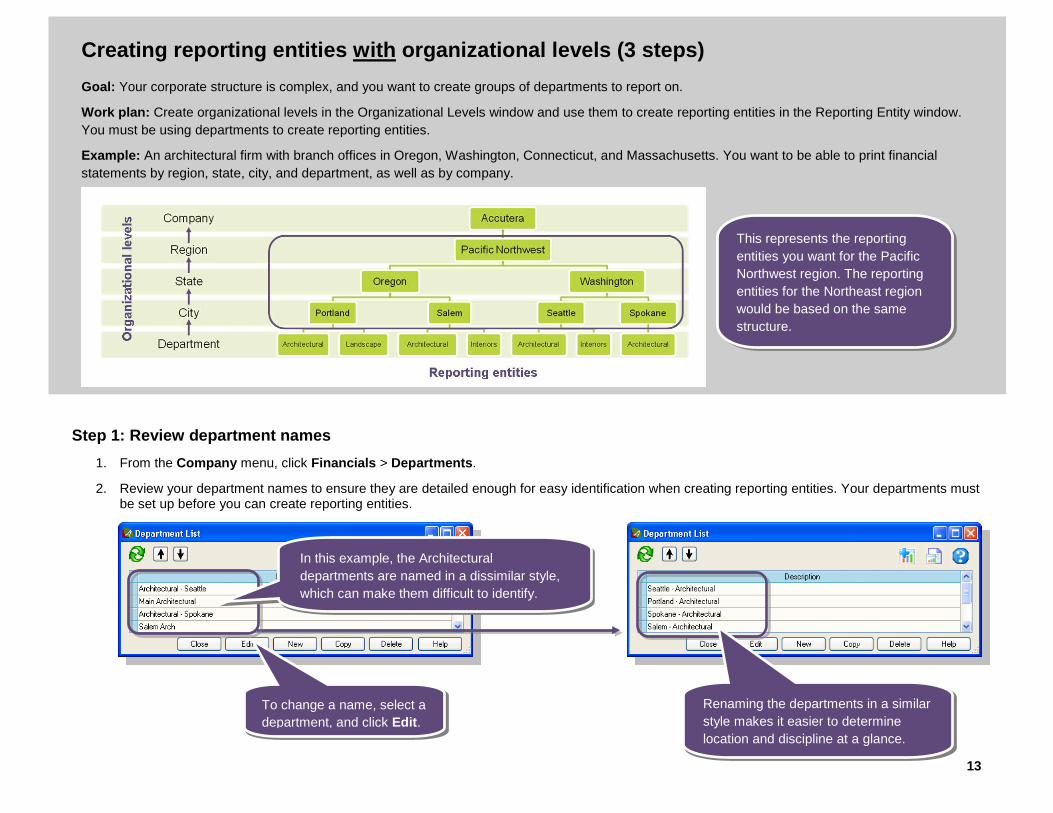
Creating reporting entities with organizational levels (3 steps) Goal: Your corporate structure is complex, and you want to create groups of departments to report on.
Work plan: Create organizational levels in the Organizational Levels window and use them to create reporting entities in the Reporting Entity window. You must be using departments to create reporting entities.
Example: An architectural firm with branch offices in Oregon, Washington, Connecticut, and Massachusetts. You want to be able to print financial statements by region, state, city, and department, as well as by company.
Step 1: Review department names 1. From the Company menu, click Financials > Departments.
2. Review your department names to ensure they are detailed enough for easy identification when creating reporting entities. Your departments must be set up before you can create reporting entities.
To change a name, select a department, and click Edit.
This represents the reporting entities you want for the Pacific Northwest region. The reporting entities for the Northeast region would be based on the same structure.
Renaming the departments in a similar style makes it easier to determine location and discipline at a glance.
In this example, the Architectural departments are named in a dissimilar style, which can make them difficult to identify.

14
Step 2: Create organizational levels 1. From the Company menu, click Financials > Organizational Levels.
2. Enter the organizational levels between Company and Department. Organizational levels mirror your corporate structure.
Company and Department are automatically the highest and lowest levels.
To provide Ajera with labels that reflect the structure of your firm, simply enter them at the appropriate levels.
15
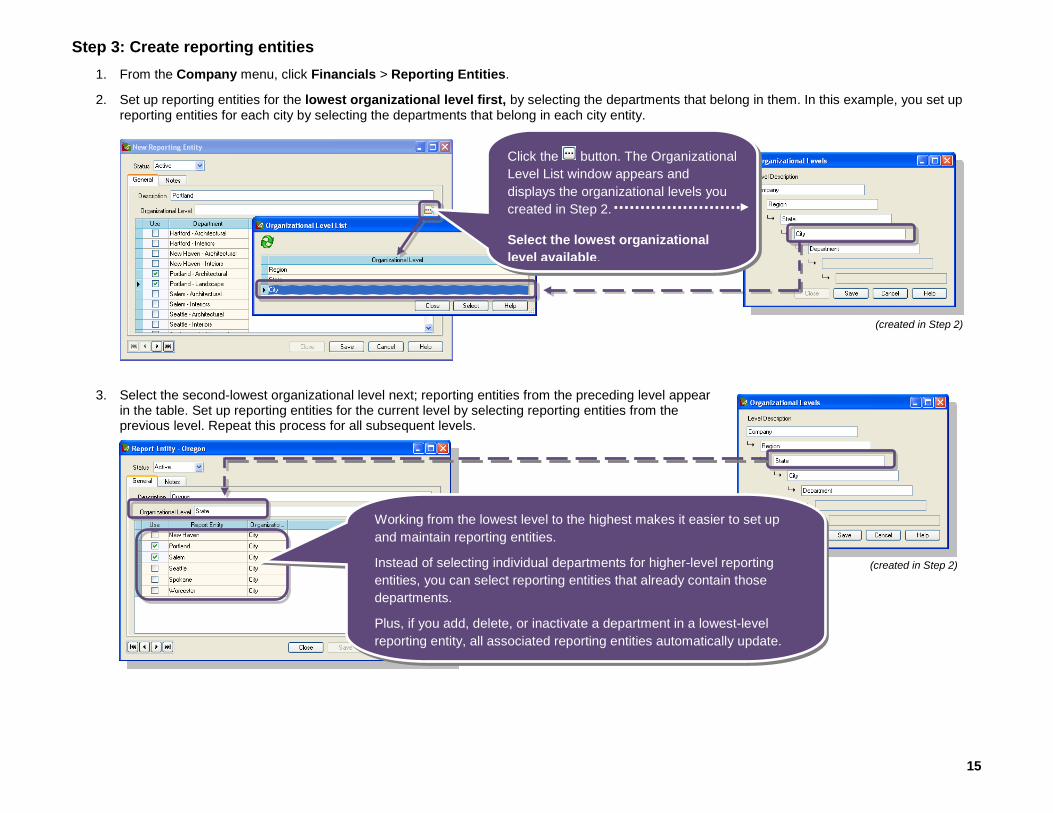
Step 3: Create reporting entities 1. From the Company menu, click Financials > Reporting Entities.
2. Set up reporting entities for the lowest organizational level first, by selecting the departments that belong in them. In this example, you set up reporting entities for each city by selecting the departments that belong in each city entity.
3. Select the second-lowest organizational level next; reporting entities from the preceding level appear in the table. Set up reporting entities for the current level by selecting reporting entities from the previous level. Repeat this process for all subsequent levels.
Working from the lowest level to the highest makes it easier to set up and maintain reporting entities.
Instead of selecting individual departments for higher-level reporting entities, you can select reporting entities that already contain those departments.
Plus, if you add, delete, or inactivate a department in a lowest-level reporting entity, all associated reporting entities automatically update.
Click the button. The Organizational Level List window appears and displays the organizational levels you created in Step 2.
Select the lowest organizational level available.
(created in Step 2)
(created in Step 2)
16
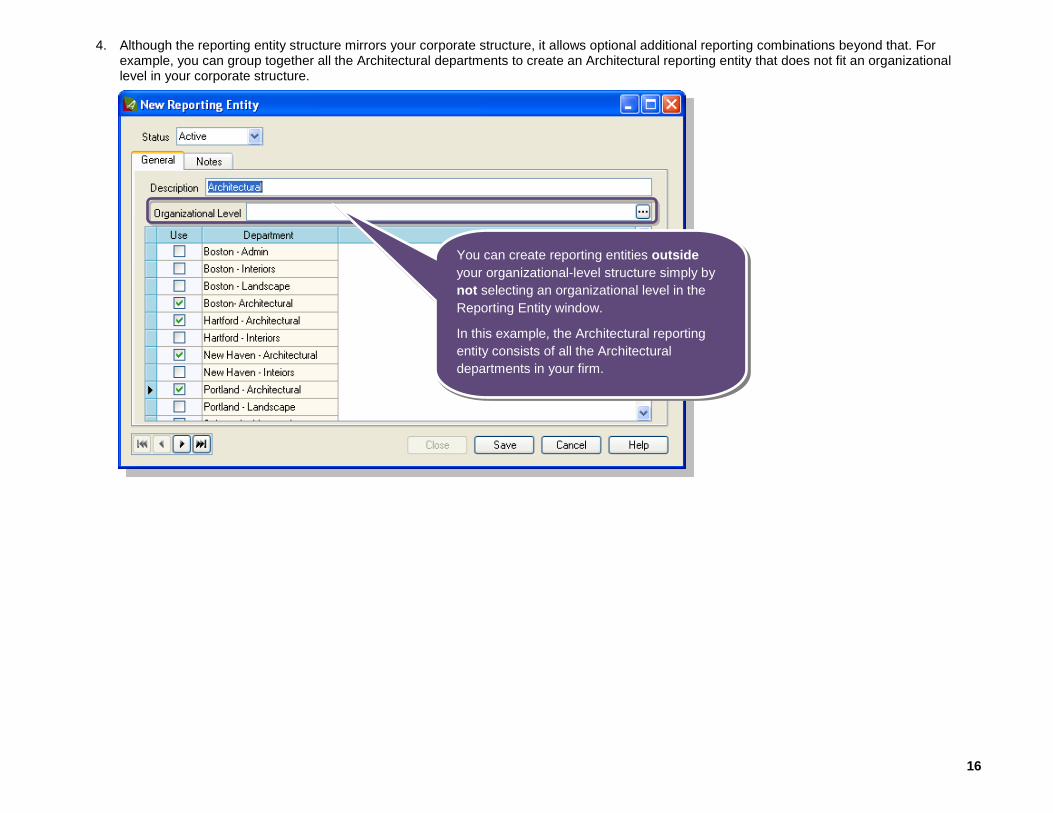
4. Although the reporting entity structure mirrors your corporate structure, it allows optional additional reporting combinations beyond that. For example, you can group together all the Architectural departments to create an Architectural reporting entity that does not fit an organizational level in your corporate structure.
You can create reporting entities outside your organizational-level structure simply by not selecting an organizational level in the Reporting Entity window.
In this example, the Architectural reporting entity consists of all the Architectural departments in your firm.

17
Learn more For more details about reporting entities, see Help > Contents > Reporting entities.
For more details about the Financial Statement Designer, see Help > Contents > Reports > Financial Statement Designer.
To register for our other training sessions, please visit axiumae.com/trainingsessions
Coming soon Financial Statement Designer
June 22, 2010 10:00 am PT
Duration: 2 hours Registration Fee: $400
This two-hour training session builds on what you learned in the quick tour of the Financial Statement Designer.
In this session, you will learn how easy it is to use the new Financial Statement Designer to create financial statements tailored to your firm’s needs. You’ll see first-hand how to build a financial statement. Soon, you’ll be modifying or creating financial statements
such as balance sheets, profit and loss statements, and statements of cash flow.
* Please note that if there is a high demand for this class, we will open up another class on June 24, 2010, at 10:00 am PT.
* * *
Thank you for your continued business with Axium.