Embed Size (px)
Citation preview
ARTICLE IN PRESS
0098-3004/$ - se
doi:10.1016/j.ca
$Paper prese
University of S$$Editorial�CorrespondE-mail addr
Computers & Geosciences 30 (2004) 1003–1018
www.elsevier.com/locate/cageo
A Java-based intelligent advisor for selecting a context-appropriate spatial interpolation algorithm$,$$
William Coopera,�, Claire Jarvisb
aSAIC Ltd, Campus 1, Aberdeen Science and Technology Park, Bridge of Don, Aberdeen, UKbDepartment of Geography, University of Leicester, University Road, Leicester, UK
Accepted 18 July 2004
Abstract
The choice of an appropriate interpolation technique is an imposing task. There are many techniques to choose from
depending on the characteristics of the phenomenon, the purpose of the study and also the expertise of the user. This
paper describes the implementation and architecture of a Java-based intelligent advisor to assist a generic user, ranging
from the casual to the specialist, in selecting the interpolator most appropriate for a given task and data set. The
software integrates procedural knowledge from disparate sources through an expert system shell, and uses multiple
sensory channels to present and abstract contextual knowledge from the user regarding both the data and the task at
hand. The system has been tested for use in a meteorological domain in the first instance. The interpolation methods
currently assessed by the system are multiple forms of kriging, thin plate smoothing splines, inverse-distance weighting
and trend surface/polynomial analysis.
r 2004 Elsevier Ltd. All rights reserved.
Keywords: Interpolation selection; Expert systems; Java and Jess; AI; Meteorology
1. Introduction
Spatial interpolation methods are widely used in
creating continuous environmental data sets from a
network of sparsely sampled points. In particular, they
have been employed to build continuous representations
of terrain, soil composition, terrestrial and atmospheric
pollution and climate variables (Heuvelink and Webster,
2001; Hutchinson and Gallant, 1999; Jarvis and Stuart,
2001a; Oliver and Khayrat, 2000). The task of inter-
polator selection, of choosing a credible spatial model to
e front matter r 2004 Elsevier Ltd. All rights reserve
geo.2004.07.007
nted at the GIS Research UK conference,
heffield, April 2002.
handling by S.M.Wise.
ing author. Tel.: +441224 333 600.
ess: [email protected] (W. Cooper).
suit the data, is however non-trivial. The appropriate-
ness of a particular method from the wide range
available is dependent on a number of factors, such as
the characteristics of the phenomenon and the purpose
of the study. Judgement is required of the user that
requires familiarity both with the spatial associations in
the domain data and the functions and assumptions
behind the methods of interpolation. Thus the casual
user who has received no formal instruction in
GIScience or spatial statistics may find it difficult to
judge the applicability of a method, whilst the data
analyst who casually dismisses the assumptions in
interpolation methods is the one most likely to ‘‘misuse
them or to be misled by them’’ (Kitanidis, 1999, p. 7–8).
The challenge in the selection of an interpolator is to
identify an adequate method with appropriate para-
meters that best suits the user’s expertise, data and task
d.

ARTICLE IN PRESS
SpatialAnalysis
ExpertKnowledge
Rules
W. Cooper, C. Jarvis / Computers & Geosciences 30 (2004) 1003–10181004
(Mitas and Mitasova, 1999). This paper addresses the
implementation of an ‘intelligent’ advisor to assist users
of GIS with the problem of selecting the most
‘appropriate’ interpolation method on a task and data-
dependent basis.
InformationVisualization
Knowingyour data
Cognition
"Intelligent"ExpertSystem
Fig. 1. Filling gap: major methodological elements of software
required to provide user with ‘intelligent’ support.
2. Background
Considerable polarization exists within the current
literature for selecting an appropriate interpolation
method, between extended exploratory data analysis
(EEDA) on one side (Bucher, 1998) and simple knowl-
edge-based methods on the other (Dimitrakopoulos,
1993; Maslyn, 1987). Both of these approaches indivi-
dually address only a limited, if valuable, part of the
overall problem and so limit the practical support they
can provide for the user. A gap exists in supporting the
selection of an interpolation method when evaluating
the area of model selection and procedures as a whole. In
other words, within GIScience to date there is no one
tool that encapsulates the experience of an expert tutor
and supports decisions throughout all key tasks when
selecting which interpolation method to use under a
certain set of circumstances.
In attempting to fill this gap, we firstly consider the
potential synergy among various automated and visual
statistical modules that might be required. Just as the
use of linked windows has assisted the discerning of
relationships between GI data using visual expression
(Bastin et al., 2002; Dykes, 1997), we argue that similar
links are required to bring together the distinct statistical
analyses needed within the interpolation selection
process on an automated basis. Furthermore, to support
the user in selecting an interpolator, and following Mitas
and Mitasova (1999), we argue that intelligence should
be incorporated into the selection procedure. In other
words, we consider the software for the task of selecting
an interpolation technique discussed in this paper to be a
symbiotic construction of spatial analysis (exploratory
data analysis/statistics), exploratory information visua-
lization techniques and expert knowledge (Fig. 1).
As we shall demonstrate, the software seeks to
balance deductive and inductive methods, in this case
using Expert System (ES) technology in addition to
assisted data analysis, to represent a large body of expert
knowledge regarding the functions and assumptions of
interpolation methods. The flexibility to use both
qualitative symbolic and quantitative numerical meth-
ods as required in one application provides great
potential to deliver an understanding of the initial
assumptions and methods used in the spatial interpola-
tion process. It further permits the system to be
responsive to the information, task and context at hand.
Recent developments in intelligent systems emphasise
the importance of context when developing flexible ES
in order to define when knowledge should be considered
for practical decision support (Brezillon, 1999). We
advocate that such context might be achieved here
through an approach that accompanies knowledge of
the GIScience procedures themselves with both the
users’ knowledge of their domain and a visual and
numerical analysis of the data. In a previous paper, we
outlined the theoretical constructs of artificially intelli-
gent support and how knowledge from interpolation
experts could be conceptually structured (Jarvis et al.,
2003). This paper serves to discuss the implementation
of these concepts into a software system and to provide
a walkthrough of the system in operation. Here we also
discuss the verification and validation of our strategy for
assisting the users of GIS in their selection of interpola-
tion methods that are appropriate to the task and data.
3. Scope of the software
GIS and statistical software contain diverse options
for spatial analysis, but a user of one system in
particular is unlikely to have a complete range of
possible tools at hand. Thus, for the broadest adoption
of first initial generation intelligent GI support modules,
we advocate a loosely coupled approach (Fig. 2) that is
able to serve the many GIS and statistical packages
currently commercially available, each with their differ-
ent scripting and interfacing capabilities. That is, input
point sample data may be imported to the advisor
software via simple ASCII files and simple parameter
files may be exported.
We also designed the intelligent interpolation advisor
to choose between interpolation methods that are

ARTICLE IN PRESS
Informatics ModuleDecision SupportModule
InformationVisualization
ExploratoryStatistics
InferenceEngine
UserCognition
Spatial AnalysisModule
Knowledge &Parameter support
Expert SystemModule
InformationEnrichment
User Interface
ExternalInterpolation
ProgramData Set
1.6 32.6 0.6 0.14.1 44.5 0.4 -990.6 64 0.5 0.12.4 71.8 0.3 0.37.8 3.5 0.4 0.1
ExpertRules
Expert System Interpolant Selector
Facts
Fig. 2. Interpolation, spatial data and an ‘‘intelligent’’ expert system: their integration.
3.4 STEP-WISECONSTRUCTION
3.1 NEEDS ASSESSMENT
Software Support
Implement
Extend
Verification
Yes
No
The acquisition processPhase
Teaching
Design Scenario
Encapsulating ModalityJava Classes and
Programming
3.5 VALIDATION
3.2 INTEGRATING THEEXPERT SYSTEM
3.3 KNOWLEDGEACQUISITION
W. Cooper, C. Jarvis / Computers & Geosciences 30 (2004) 1003–1018 1005
commonly available in many packages and that are
widely used in many domains. These include, in the first
instance, trend surface analysis, inverse distance weight-
ing (IDW), thin plate splines and the kriging family. The
system is designed to suggest a primary and secondary
interpolation method suitable for the task at hand.
Where a method is suggested to which a user has no
access, the intention is that firstly the suggested
alternative method might be used and secondly, where
this performs poorly, the user might be prompted to
access additional interpolation software. The software
itself does not provide interpolation functions, nor
pander to the functionality of one proprietary GIS or
one theoretical camp. Its rationale is rather to advise on
which methods a user might best consider based on the
collected evidence, expecting that a user will have
expertise in their particular domain to judge the realism
of the surface(s) suggested by the selection software but
constructed within a proprietary GIS and also the ability
to carry out independent sampling of the surface(s) for
accuracy.
3.6 EVALUATIONSTRATEGY
ValidationDomainSphere
Fig. 3. Main phases in software development.
4. Implementation: software design and system
architecture
For reference, Fig. 3 outlines the main phases in the
development of the system as a whole. The software
design scenario process established that the performance
and functionality needs of a modular system would best
be managed using Javar. Java from SunTM (Shannon
et al., 2000) is a platform independent object orientated
language which is suitable for calling external programs
(interpolation algorithms) for providing openess as a
portal for future implementation of the module over the

ARTICLE IN PRESSW. Cooper, C. Jarvis / Computers & Geosciences 30 (2004) 1003–10181006
World Wide Web and for its interconnectivity with ES
shells. In addition, the growing availability of modular,
re-useable classes for both spatial analysis tasks
(Faulkner, 2002) and interface development more
generally made Java an attractive choice.
System architecture was conceived with three main
underlying components, brought together within a
multi-modal (Egenhofer, 1996) user interface (Section
4.1). These include an expert systems module (Section
4.2) an informatics module (Section 4.3) and a decision
support module (Section 4.4).
4.1. User interface
The main challenge in designing an interface is to
‘‘assist in the visualization and manipulation of complex
domains’’ (Lypher and Stelzner, 1991, p. 404), in this
case the theoretical world of interpolation as expressed
within an expert system. In drawing together the textual,
visual and graphical channels that are required for the
desired partnership between spatial analysis (explora-
tory data analysis/statistics), expert knowledge and
exploratory information visualization, we implicitly
adopt the advantages of multi-modal channels (Egen-
hofer, 1996) to support the user in making decisions
based on various criteria. That is, an interface that
appeals to multiple elements of their perception in order
to explain a topic, for example by providing written text
in the form of a question and an accompanying picture
explaining the concept in an alternative fashion.
Combining these complementary channels should ex-
pose to the user various aspects of the data and
interpolation procedures.
In the field of human computer interfaces, it has been
suggested that users are the most variable component
(Shneiderman, 1998). This arises from the variety of user
preferences, varying familiarity with a system or concept
(e.g. interpolation), previous experience and expecta-
tions, and an understanding and knowledge of terms
used. In order to minimize these variables, we therefore
created a ‘‘look’’ for the interpolation selection assistant
based upon the familiar ‘‘Desktop’’ metaphor.
The main work area of the prototype interface is
therefore analogous to the ‘‘Desktop’’ (Fig. 4). This
Desktop allows for informatics, statistics, X–Y plot,
variogram, histogram (not shown) and distribution
curve internal frames to be generated. The Informatics
frame is automatically made once the program is run. It
is subdivided into a left- and right-hand side, with two
buttons on the bottom. The left-hand side presents to
the user questions, which are answered by pressing either
the yes or no buttons provided. On the right-hand side of
the frame, information visualization is presented, to aid
the user in understanding questions, which may be
highly contextual. The parameter module is found in the
‘‘Menubar’’ at the top of the desktop. The Menubar
provides further assistance, allowing other frames to be
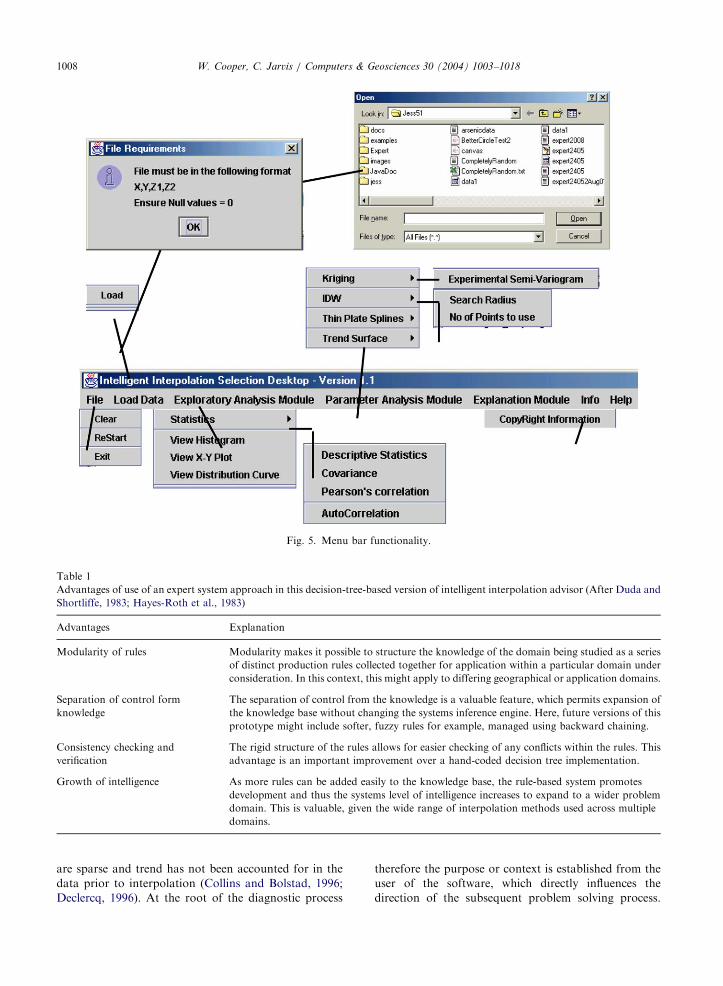
generated when required, as shown in Fig. 5.
The Menubar consists of seven main items: Load, File,
Exploratory Analysis Module, Parameter Analysis Mod-
ule and the Info drop down box. Working through these
in order, Load allows a variety of data input file formats
to be loaded, so long as they are comma delimited and in
an X, Y, dependent variable, covariate format where the
covariates are optional. The standard loading facilities
of the operating platform are adopted by Java. In the
above example, Java is being run on the Windowss 95
platform and the associated load box is presented. File
controls the Informatics frame. It provides a drop down
menu that can clear out the frame contents, and allows
the user to exit the inference process. A restart button
will allow the inference process to be repeated if the user
wishes.
The task of interpolation selection requires the user to
use judgement and make decisions, for which additional
familiarity with the data and interpolation methods over
and above that provided automatically by the software
is helpful. Thus, the Exploratory Analysis Module drop
down box handles various descriptive statistics and
correlation calculations, which are presented to the user
in the Statistics Frame. Histograms, X–Y plots and
distribution curves are calculated in their associated
frames. Finally, the Parameter Analysis Module is used
after the Informatics frame gives a recommendation.
This allows the user to determine the parameters
required to carry out an interpolation method, for
example the most appropriate model with which to fit a
variogram.
4.2. Expert systems module
Generalizations in regard to expert systems as a whole
have been discussed at length by Duda and Shortliffe
(1983) and Hayes-Roth et al. (1983) among others, and
are summarized in relation to this software in Table 1.
These include for example the modularity of rules, useful
for different geographical or application domains, and
the separation of control from knowledge such that
alternative and more flexible, softer forms of control can
be explored in future with relative ease. Thus, the
decision to implement this prototype software around
expert system architecture has many advantages in
regard to the future stability and expansion of the
system. This is regardless of the simplicity of the control
strategy by which we structure knowledge in this
software prototype.
4.2.1. Control strategy
A control strategy is vital to pull together all the
components of the ES. There are many types of control
strategies, including frame based, induction, goal agenda
and hybrid approaches. It is, however known that where

ARTICLE IN PRESS
Informatics Frame Menubar X-Y Plot Frame
Statistics Frame Variogram Frame Distibution Curve Frame
Fig. 4. System interface ‘‘desktop’’.
W. Cooper, C. Jarvis / Computers & Geosciences 30 (2004) 1003–1018 1007
a global problem solving approach is used by the expert,
a strategy using rules best matches the problem (Durkin,
1994). Following this advice, we concluded that in the
case of interpolation a rule-based control strategy would
offer a good means of structuring the knowledge of
experts. In this case, expert knowledge for interpolation
is held as ‘rules of thumb’ which specify a set of actions
to be performed for a given situation in the form ‘if
/conditionS then /conclusionS’. A rule-based ap-
proach allows the acquired knowledge to be external to
the program, in this system held in a text file, so the
expert knowledge can be easily expanded, archived or
viewed.
4.2.2. Organizing the rules: conceptual and formal
structuring of knowledge
Much of the work in developing the rule-based
approach is focused on accumulating all of the knowl-
edge necessary to resolve a problem. The method used to
elicit and acquire knowledge of the interpolation
selection process involved close collaboration with the
domain experts and extensive research of the literature
as discussed more extensively elsewhere (Jarvis et al.,
2003). Out of this previous work came a common
sequence in the way in which an expert often asks
questions or employs knowledge at each stage of the
decision making process in selecting an interpolation
method. This provides an important context for the
process of implementation and so is expanded upon
here.
In the first instance, the interpolation selection process
needs to review a study’s objectives and the user’s
accuracy requirements. We note for example the
important divide within project objectives between
whether a data surface is used for analysis or is required
for aesthetic purposes. As Declercq (1996, p. 128) notes,
‘‘highly accurate interpolations do not always produce
realistic spatial patterns’’. Moreover, notable problems
in the representation of visual pattern have been noted
with particular interpolators such as IDW where data
ARTICLE IN PRESS
Fig. 5. Menu bar functionality.
Table 1
Advantages of use of an expert system approach in this decision-tree-based version of intelligent interpolation advisor (After Duda and
Shortliffe, 1983; Hayes-Roth et al., 1983)
Advantages Explanation
Modularity of rules Modularity makes it possible to structure the knowledge of the domain being studied as a series
of distinct production rules collected together for application within a particular domain under
consideration. In this context, this might apply to differing geographical or application domains.
Separation of control form
knowledge
The separation of control from the knowledge is a valuable feature, which permits expansion of
the knowledge base without changing the systems inference engine. Here, future versions of this
prototype might include softer, fuzzy rules for example, managed using backward chaining.
Consistency checking and
verification
The rigid structure of the rules allows for easier checking of any conflicts within the rules. This
advantage is an important improvement over a hand-coded decision tree implementation.
Growth of intelligence As more rules can be added easily to the knowledge base, the rule-based system promotes
development and thus the systems level of intelligence increases to expand to a wider problem
domain. This is valuable, given the wide range of interpolation methods used across multiple
domains.
W. Cooper, C. Jarvis / Computers & Geosciences 30 (2004) 1003–10181008
are sparse and trend has not been accounted for in the
data prior to interpolation (Collins and Bolstad, 1996;
Declercq, 1996). At the root of the diagnostic process
therefore the purpose or context is established from the
user of the software, which directly influences the
direction of the subsequent problem solving process.

ARTICLE IN PRESSW. Cooper, C. Jarvis / Computers & Geosciences 30 (2004) 1003–1018 1009
This division, and others similar further down the chain
of reasoning, led us to formalize expert knowledge
contained within the software as a binary decision tree
(Fig. 6). All nodes within the tree contain a question to
which the user is asked for a [yes] or [no] outcome.
Further down the knowledge structure, we identify
questions that draw on the domain expert’s under-
standing of the phenomenon being interpolated and the
existence and nature of any digital data that they might
have to hand. Would a ‘smooth’ or ‘bumpy’ outcome
more suit their expectations, for example? The meteor-
ological user would know that monthly average or
climate normal surfaces will be smoother than surfaces
of daily meteorological variables, and that a precipita-
tion surface for Britain is likely to be more spatially
fragmented than a corresponding temperature surface.
Further questions in this vein assess whether associated
data are available at co-located points to the dependent
variable or as continuous a surface such as elevation, if
indeed at all. These ‘top down’ concepts commonly form
the earliest questions that an expert might ask in
diagnosing which interpolator to use, and form part of
a previously implicit knowledge structure.
From this point in the decision tree structure, more
technical questions need to be raised and addressed. For
example, how large is the sample?, are the data normal?,
if anisotropy is expected, what is the ratio and direction
of greatest variation indicated by the data?. Moving
through this range of considerations relies on expert
knowledge of the procedures involved in selecting an
interpolation method, and invoking this procedural
knowledge is reliant on local context. An important
function of the intelligent software is to ask questions
and provoke user interaction to answer as many of these
technical questions as possible ‘behind the scenes’.
Classifying an appropriate interpolation method using
the decision tree might thus occur as follows for the
example outline in Fig. 6. Firstly, beginning with the
root node (1), we determine if the new task is either a
visualization [yes] or analytical problem [no]. In our
1
2
45 6
3
7
8 9 10 11 2 13
ROOT NODE
BRANCH
NODE
LEAF
Traverse Direction
Example
14 15
16 17 18 19
Fig. 6. Binary decision tree.
study case the outcome is [yes] so the left branch is
traversed. The next node (2) is a non-leaf node, so a new
question is tested, i.e. ‘‘is the data strongly related to
another variable?’’ The answer to this is [yes] and the
corresponding branch is traversed. The next node (4) is
also a non-leaf node so a further question is asked, ‘‘Do
you have digital data for this variable?’’. The answer to
this is [no] which leads to node (9) where the question
‘‘are you expecting a smooth [yes] or bumpy surface
[no]’’. The answer to this is [yes] and the corresponding
branch is traversed to a leaf where a classification of
Regularized Spline Tension or Smoothing Splines is
given. A decision tree traverse such as above might
provide the impression that only a handful of rules have
been encoded within the expert system. It is important to
note that, while a handful of rules are directed at the
user at any one time the overall number of questions
that could be asked according to the problem at hand is
considerably higher; the system encapsulates almost 50
rules at the present time with scope for further
expansion. It is also worth reiterating at this juncture
that the user can employ statistical and visual tools from
the overall system toolbox to support the reasoning
process.
4.2.3. Encoding: physical structuring of knowledge
We engaged Jessr as a means to encode the
requirements of the control strategy and procedural
knowledge. Jess from Friedman-Hill (1997) is a rule-
based expert system shell and scripting language written
entirely with the Java language. It is based on the kernel
of the CLIPS-ES (Giarratano and Riley, 1989), which
has broad acceptance both in the AI literature and more
specifically within GIScience. It utilizes the Rete
algorithm (Forgy, 1982) inference engine.
The expert knowledge conceptually formulated in the
binary decision tree and in part described in Table 2 was
physically implemented into a tree-structured node
network of Jess IF–THEN statements called production
rules, illustrated within Table 3. While these structures
combined could have been implemented in a procedural
language, we used the Jess formalization methodology
for its ability to separate knowledge from rules to aid
extensibility, useful for scaling the prototype to addi-
tional domains and methods in the future. The produc-
tion rules have a left-hand side (LHS) and a right-hand
side separated by the ‘‘) ’’ symbol, which can be read
as THEN. During the system operation an initial root
question is asked and stored in the LHS of the
production rule. In answering by console interaction,
the user declares knowledge and these ‘new facts’ are
placed in working memory. Rete processes the LHS
knowledge and the RHS action for conditions that can
be satisfied by working memory. When a rule’s LHS
matches a fact, the RHS is then activated, the current
node is retracted and Rete fires to the next node in the

ARTICLE IN PRESS
Table 2
Network of nodes: decision tree encoding
(node (name root) (type decision) (question ‘‘Do you wish to generate a surface for
Visualization (i.e. just a quick aesthetic surface) [PRESS YES] or a method
that produces values for the purpose of analysis [PRESS NO] ? 1’’) (yes-node
node2) (no-node node3) (answer nil))
(node (name node2) (type decision) (question ‘‘Is the surface to be generated
strongly related to another variable? 2’’) (yes-node node4) (no-node node5)
(answer nil))
(node (name node4) (type decision) (question ‘‘Do you have digital data for this
variable? 3’’) (yes-node node8) (no-node node9) (answer nil))
(node (name node9) (type decision) (question ‘‘Are you expecting the generated
surface to be Smooth [PRESS YES] or Bumpy [PRESS NO]? 7’’) (yes-node node
18) (no-node node 19) (answer nil))
(node (name node 18) (type answer) (question nil) (yes-node nil) (no-node nil)
(answer
BEST_METHOD_#1=reguralised_spline_tension_OR_#2=smoothing_splines_0))
W. Cooper, C. Jarvis / Computers & Geosciences 30 (2004) 1003–10181010
network. This determines which questions are asked and
in what order, and eventually leads to a recommenda-
tion. For example, within the node network and starting
with the root node, the system asks a decision node a
question and reads the answer (only ‘‘yes’’ or ‘‘no’’). The
current node is then retracted, and the reasoning
proceeds downwards to the next node using either the
yes or no branch, as relevant, and onwards through the
decision tree structure. Fig. 7 provides examples of node
activation in the interpolation context at the upper levels
of the node network tree involved with the user’s
knowledge of the task and supporting data.
4.3. Informatics module
The informatics module promotes semantic under-
standing, contextual recognition and statistical feature
abstraction, with the aim of helping users to understand
the potentially complex questions asked of them during
the course of a ‘conversation’ with the software. These
questions prompt the user to carry out the inference
process and procedure used by an expert. However,
since a domain expert retains a large number of image
symbolic abstractions relating to their expert knowledge,
graphical representations are presented which relate to
individual questions. The objective of this is to inspire
and connect with the thought processes of the user more
efficiently than using communication by text alone. For
example, the question ‘do you expect the surface variable
to be smooth or bumpy?’ is accompanied by pictures of
two surfaces exhibiting very different levels of auto-
correlation. The effect of answering a question relating
to the desirability or otherwise, from a sample accuracy
perspective, of retaining exact data measurements within
the surface is illustrating by a curve showing a smooth
surface but with overshooting or undershooting sample
points. The expectation of anisotropy within the data is
similarly best explained to the geostatistical layperson in
diagrammatic terms or the danger is that the user of the
software is simply over-awed by the questions asked,
rather than supported as is the intention.
To further present contextual clues we encourage the
user to explore their data using preliminary spatial and
statistical investigations. Exploring data visually by
using scattergrams and distribution graphs such as
histograms and variograms is acknowledged to be
beneficial to cognition, and allows the user to be
informed of their data more effectively (Fotheringham
et al., 2000; Kitanidis, 1999). An example of this facility
in action would be the ability to check for the
significance of a linear regression between dependent
and independent variables if the domain user was not
certain of this a priori.
4.4. Decision support module
Having been supported in the selection of a range of
potentially satisfactory interpolation methods, the user
still requires assistance with the setting of parameters to
control the generation of surfaces. The majority of GIS
systems leave the selection of parameters entirely in the
hands of the user, and an ill-judged choice may give rise
to a surface that is not intended (Bonham-Carter, 1994).
The rationale behind a parameter module is to aid the
user by suggesting such parameters as the variogram
model, range and sill in the case of ordinary kriging or
an appropriate distance decay rate for IDW (Table 4).
Inferred solutions will not necessarily be unique
within the context of interpolation. Bounding an ill-
defined problem such as selecting an interpolation
method is an approach that we adopt from spatial
decision support systems (Cameron and Abel, 1996).

ARTICLE IN PRESS
Table 3
Production system rules
(deftemplate node (slot name) (slot type) (slot question) (slot yes-node) (slot no-node) (slot
answer))
(defrule initialize-1 (not (node (name root)))
=4(load-facts ‘‘knowledge.dat’’) (assert (current-node root)))
(defrule initialize-2
(declare (salience 100))? fact o- (next-gensym-idx ?idx)
=4(retract ?fact)(setgen ?idx))
(defrule ask-decision-node-question
?node o- (current-node ?name) (node (name ?name) (type decision) (question?question)) (not (answer
?))
=4(printout t ?question crlf) (assert (answer (read))))
(defrule bad-answer?answer o- (answer~yes&~no)
=4(retract ?answer))
(defrule proceed-to-yes-branch
?node o- (current-node ?name) (node (name ?name) (type decision)
(yes-node ?yes-branch)) ?answer o- (answer yes)
=4(retract ?node ?answer) (assert (current-node ?yes-branch)))
(defrule proceed-to-no-branch
?node o- (current-node ?name) (node (name ?name) (type decision)
(no-node ?no-branch)) ?answer o- (answer no)
=4(retract ?node ?answer) (assert (current-node ?no-branch)))
(defrule print answer
?node o- (current-node ?name) (node (name ?name) (type answer) (answer ?value)) (not (answer ?))
=4(printout t‘‘- - - - - - - - - - - - - - - - - - -end of inference- - - - - - - - - - -
(reset)
(run)
Task isvisualisation
18
2Data strongly
related to anothervariable
4Dont have datafor variable
Expecting asmooth surface
9
Classified asRegularised
SplineTension
Fired on NODE 2
Fired on NODE 4
Fired on NODE 9
Activated
Fig. 7. Sample rule activation.
W. Cooper, C. Jarvis / Computers & Geosciences 30 (2004) 1003–1018 1011
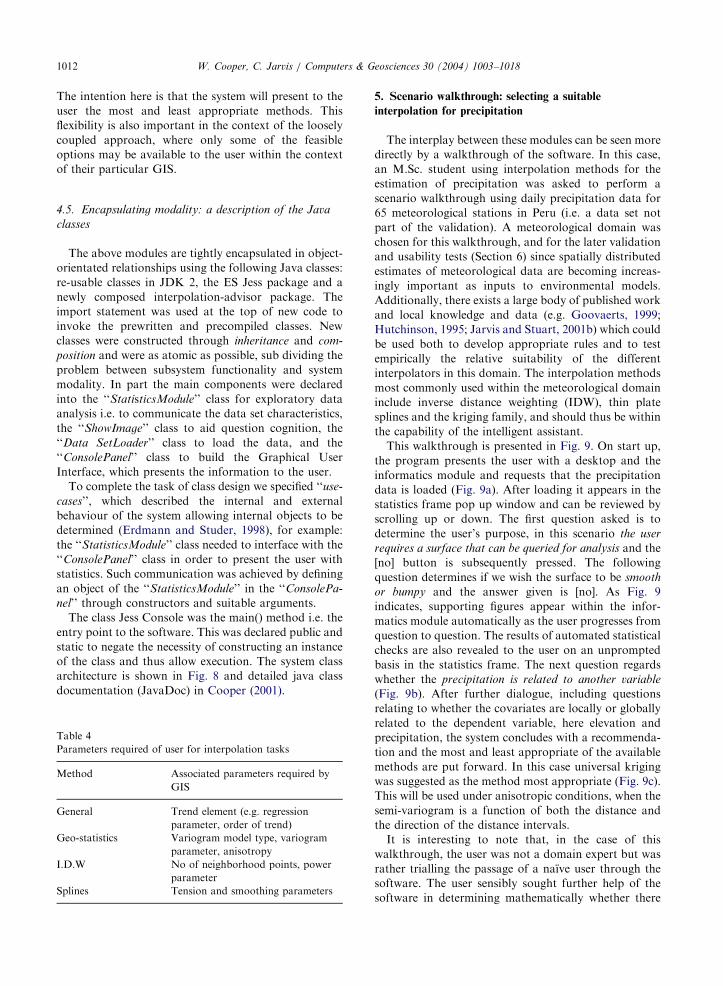
ARTICLE IN PRESSW. Cooper, C. Jarvis / Computers & Geosciences 30 (2004) 1003–10181012
The intention here is that the system will present to the
user the most and least appropriate methods. This
flexibility is also important in the context of the loosely
coupled approach, where only some of the feasible
options may be available to the user within the context
of their particular GIS.
4.5. Encapsulating modality: a description of the Java
classes
The above modules are tightly encapsulated in object-
orientated relationships using the following Java classes:
re-usable classes in JDK 2, the ES Jess package and a
newly composed interpolation-advisor package. The
import statement was used at the top of new code to
invoke the prewritten and precompiled classes. New
classes were constructed through inheritance and com-
position and were as atomic as possible, sub dividing the
problem between subsystem functionality and system
modality. In part the main components were declared
into the ‘‘StatisticsModule’’ class for exploratory data
analysis i.e. to communicate the data set characteristics,
the ‘‘ShowImage’’ class to aid question cognition, the
‘‘Data SetLoader’’ class to load the data, and the
‘‘ConsolePanel’’ class to build the Graphical User
Interface, which presents the information to the user.
To complete the task of class design we specified ‘‘use-
cases’’, which described the internal and external
behaviour of the system allowing internal objects to be
determined (Erdmann and Studer, 1998), for example:
the ‘‘StatisticsModule’’ class needed to interface with the
‘‘ConsolePanel’’ class in order to present the user with
statistics. Such communication was achieved by defining
an object of the ‘‘StatisticsModule’’ in the ‘‘ConsolePa-
nel’’ through constructors and suitable arguments.
The class Jess Console was the main() method i.e. the
entry point to the software. This was declared public and
static to negate the necessity of constructing an instance
of the class and thus allow execution. The system class
architecture is shown in Fig. 8 and detailed java class
documentation (JavaDoc) in Cooper (2001).
Table 4
Parameters required of user for interpolation tasks
Method Associated parameters required by
GIS
General Trend element (e.g. regression
parameter, order of trend)
Geo-statistics Variogram model type, variogram
parameter, anisotropy
I.D.W No of neighborhood points, power
parameter
Splines Tension and smoothing parameters
5. Scenario walkthrough: selecting a suitable
interpolation for precipitation
The interplay between these modules can be seen more
directly by a walkthrough of the software. In this case,
an M.Sc. student using interpolation methods for the
estimation of precipitation was asked to perform a
scenario walkthrough using daily precipitation data for
65 meteorological stations in Peru (i.e. a data set not
part of the validation). A meteorological domain was
chosen for this walkthrough, and for the later validation
and usability tests (Section 6) since spatially distributed
estimates of meteorological data are becoming increas-
ingly important as inputs to environmental models.
Additionally, there exists a large body of published work
and local knowledge and data (e.g. Goovaerts, 1999;
Hutchinson, 1995; Jarvis and Stuart, 2001b) which could
be used both to develop appropriate rules and to test
empirically the relative suitability of the different
interpolators in this domain. The interpolation methods
most commonly used within the meteorological domain
include inverse distance weighting (IDW), thin plate
splines and the kriging family, and should thus be within
the capability of the intelligent assistant.
This walkthrough is presented in Fig. 9. On start up,
the program presents the user with a desktop and the
informatics module and requests that the precipitation
data is loaded (Fig. 9a). After loading it appears in the
statistics frame pop up window and can be reviewed by
scrolling up or down. The first question asked is to
determine the user’s purpose, in this scenario the user
requires a surface that can be queried for analysis and the
[no] button is subsequently pressed. The following
question determines if we wish the surface to be smooth
or bumpy and the answer given is [no]. As Fig. 9
indicates, supporting figures appear within the infor-
matics module automatically as the user progresses from
question to question. The results of automated statistical
checks are also revealed to the user on an unprompted
basis in the statistics frame. The next question regards
whether the precipitation is related to another variable
(Fig. 9b). After further dialogue, including questions
relating to whether the covariates are locally or globally
related to the dependent variable, here elevation and
precipitation, the system concludes with a recommenda-
tion and the most and least appropriate of the available
methods are put forward. In this case universal kriging
was suggested as the method most appropriate (Fig. 9c).
This will be used under anisotropic conditions, when the
semi-variogram is a function of both the distance and
the direction of the distance intervals.
It is interesting to note that, in the case of this
walkthrough, the user was not a domain expert but was
rather trialling the passage of a naıve user through the
software. The user sensibly sought further help of the
software in determining mathematically whether there

ARTICLE IN PRESS
Class Javaawt.Window
ClassMyLine
ClassTestExpert
Class javax swingJComponent
Class Java lang.Object
ClassDataSetLoader
ClassSimpleIOClass Jess
Rete
ClassGeostatPanel
ClassNormalCurve
Class JessMain
ClassScattergramPanel
Class JessConsole
Class Javaawt.Frame
Class javaxswing.JPanel
Class Javaawt.Component
Class Javaawt.Container
ClassStatisticsModule
ClassConsolePanel
Java+Jess Package Class Hierarchy
Jess Class
Java Class
Key
ProjectClass
Class
Fig. 8. Java classes.
W. Cooper, C. Jarvis / Computers & Geosciences 30 (2004) 1003–1018 1013
was an association between precipitation and elevation.
Investigation of the data was performed in the
exploratory analysis pull down menu. Pressing the
Pearson’s correlation button in the exploratory analysis
menu indicated that these variables were correlated and
thus the [yes] button was pressed by the user. The choice
or local or global association was however a relatively
arbitary one. By pressing [yes] to local variation, the user
ended with the suggestion to use universal kriging, a
good choice in relation to the existing literature, but
could equally have selected the potentially less desirable
recommendation to use residual ordinary kriging.
To assist the user in determining a theoretical semi-
variogram, i.e. to ascertain which function is necessary
to fit the data, the parameter analysis module is used,
which calculates the experimental (empirical) semi-
variogram. The start of this process is shown in Fig. 9d.
6. Verification, validation and evaluation
Significant numbers of articles on verification and
validation of knowledge-based systems first appeared in
the AI literature in the early 1980s. The methods used
are usually a reflection of that particular domain. The
approach for this research was to adopt the definitions
used by Gonzalez and Barr (2000, p. 412–413), where
‘‘verification is the process of ensuring that the intelligent
system conforms to specifications, and that its knowledge
base is consistent and complete within itself. Validation is
the process of ensuring that the output of the intelligent
system is equivalent to those of human experts when given
the same inputs’’. To suit our research needs in full, we
also advocated a sub-division of the verification process
into what we term logical and semantic verification.
Logical verification was used to ensure that the system
had no defects in the code. Thus, in order to determine
whether or not the statistical analysis methods, normal
curve, experimental variogram and descriptive statistics
were valid, the output was logically validated against
known samples worked from current systems such as
GS+TM from Gamma Design Software (2002). Where
time allowed the testing strategy in general attempted to
test the functionality and correctness of the programmed
code by running it to test for: (1) defect detection, and
(2) reliability estimation. In general, we populated a test
data file using randomly generated data so that the test
environment could be run automatically.
Semantic verification was used to determine if the
system had in fact incorporated consistent and complete
expert domain knowledge. This was implemented
though a review of the decision tree structures. In
particular, we checked the rule base for consistency,
correctness and redundancy, against the knowledge

ARTICLE IN PRESS
Fig. 9. Walk through of interpolation advisor in action for a precipitation data set from Peru. A Precipitation data set is loaded and
first question is asked of user, B Question is asked that user is uncertain about so exploratory analysis tool is envoked, C System gives a
recommendation and D Advisor assists with selection of variogram model through illustration of experimental semi-variogram.
W. Cooper, C. Jarvis / Computers & Geosciences 30 (2004) 1003–10181014
acquired from the expert. In this case, this consisted of
viewing the decision tree for rules that have the same
premises but differing conclusions, which would suggest
inconsistency. For instance, kriging would normally be a
prime possibility for interpolations used for numerical
analysis. If it did not exist at a ‘classification leaf’ within
the expected side of the decision tree, then a review of
the process was instigated. Additionally, a graph of the
decision tree was presented to additional experts for
review. An independent expert verified the correctness of
the decision tree so that, for each possible case, the
likelihood would be that the right action(s) would be
executed by the system and the most probable inter-
polation method inferred. Furthermore, redundancy
checks were carried out in order to ensure that the
decision tree was not capable of repeating rules. By
definition, a binary tree eliminates redundant rules and
premises. Nonetheless, in some instances the same
question/rule needs to be applied to different nodes,
with potentially different outcomes. For example, on
nodes 6 and 7, the question is asked ‘‘do you have a
guiding variable’’; if the answer to this is [no] for node 6,
then the decision tree classifies a recommendation of 2d
splines. If on the other hand the answer was [no] for
node 7, another question is asked ‘‘do you know of any
significant trend in the data?’’ for which if the answer was
[no] and the data were of sufficient density a recom-
mendation of IDW would be presented. The decision
tree format easily allowed this kind of verification.
Running a series of validation scenarios on the system
and checking the output was an effective means of
proving that the interpolation method reasoned to be
appropriate by the system for a particular data set was
equivalent to that decided by a human expert. Previous
exhaustive empirical testing of methods for interpolating
daily temperature across Britain (Jarvis and Stuart,
2001a) provided a good base for comparisons bet-
ween the recommendations made by the system and
ARTICLE IN PRESSW. Cooper, C. Jarvis / Computers & Geosciences 30 (2004) 1003–1018 1015
techniques actually known to be the most accurate for a
particular data set. In this case the system advised either
partial thin plate splines or de-trended (i.e. residual)
ordinary kriging on the basis of several days’ data
presented to it, which were indeed the two methods
performing best under comprehensive testing.
As Worboys (1995, p. 289) notes however, ‘‘Ulti-
mately, the success of any computer system rests on
whether it can be effectively used by people’’. No matter
how much thought has been given to the design of a
program to select an interpolation method and methods
of eliminating theoretical problems, it is only when
it is tested by the user that ‘‘real’’ problems appear.
For this reason, heuristic evaluation (Nielsen, 1994)
was adopted and used with extensive scenario walk-
throughs as a combined method for structuring a further
critique of the system as a whole. As part of this process,
the software was presented to six evaluators who
independently reviewed it for functionality or usability
problems. The evaluators ranged across a broad
spectrum, from the casual analyst to the expert in
interpolation selection to the interface designer. These
users employed the system, without help, to determine
the most appropriate interpolation method for a daily
rainfall data set from Peru. At the end of the
walkthrough, users were asked to complete a question-
naire formalized on relatively simple and general
heuristics. More specifically, it was composed of opinion
and attitude type questions divided into categories
examining content and cognition (5 questions), ease of
use (5 questions) and suitability for purpose (7
questions). A brief summary of the outcomes of the
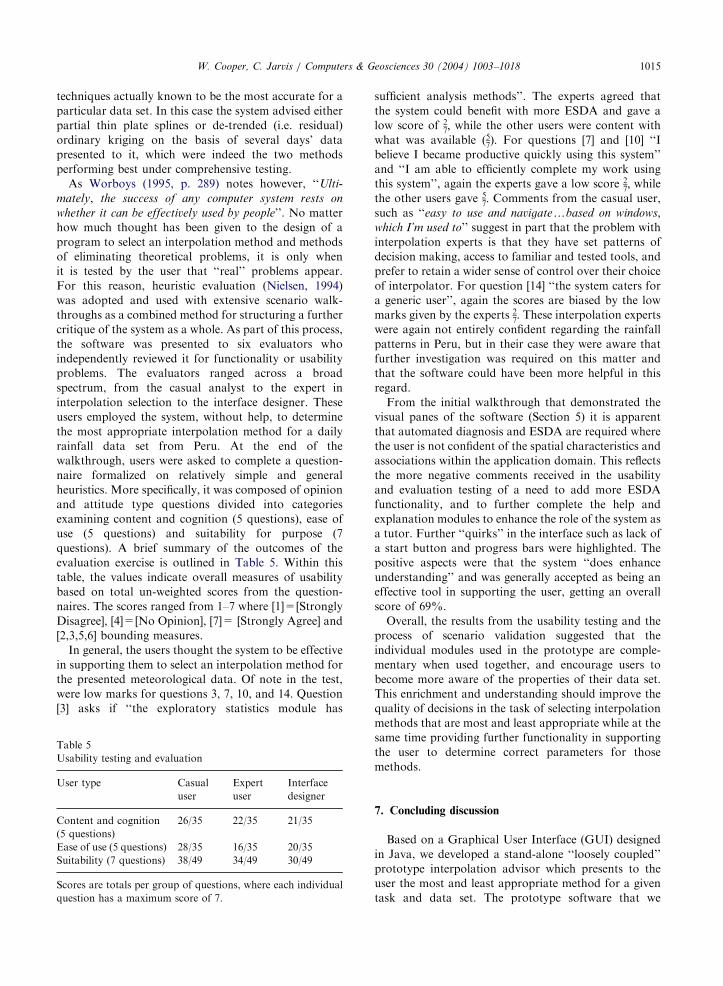
evaluation exercise is outlined in Table 5. Within this
table, the values indicate overall measures of usability
based on total un-weighted scores from the question-
naires. The scores ranged from 1–7 where [1]=[Strongly
Disagree], [4]=[No Opinion], [7]= [Strongly Agree] and
[2,3,5,6] bounding measures.
In general, the users thought the system to be effective
in supporting them to select an interpolation method for
the presented meteorological data. Of note in the test,
were low marks for questions 3, 7, 10, and 14. Question
[3] asks if ‘‘the exploratory statistics module has
Table 5
Usability testing and evaluation
User type Casual
user
Expert
user
Interface
designer
Content and cognition
(5 questions)
26/35 22/35 21/35
Ease of use (5 questions) 28/35 16/35 20/35
Suitability (7 questions) 38/49 34/49 30/49
Scores are totals per group of questions, where each individual
question has a maximum score of 7.
sufficient analysis methods’’. The experts agreed that
the system could benefit with more ESDA and gave a
low score of 27; while the other users were content with
what was available ð57Þ: For questions [7] and [10] ‘‘I
believe I became productive quickly using this system’’
and ‘‘I am able to efficiently complete my work using
this system’’, again the experts gave a low score 27; while
the other users gave 57: Comments from the casual user,
such as ‘‘easy to use and navigateybased on windows,
which I’m used to’’ suggest in part that the problem with
interpolation experts is that they have set patterns of
decision making, access to familiar and tested tools, and
prefer to retain a wider sense of control over their choice
of interpolator. For question [14] ‘‘the system caters for
a generic user’’, again the scores are biased by the low
marks given by the experts 27: These interpolation experts
were again not entirely confident regarding the rainfall
patterns in Peru, but in their case they were aware that
further investigation was required on this matter and
that the software could have been more helpful in this
regard.
From the initial walkthrough that demonstrated the
visual panes of the software (Section 5) it is apparent
that automated diagnosis and ESDA are required where
the user is not confident of the spatial characteristics and
associations within the application domain. This reflects
the more negative comments received in the usability
and evaluation testing of a need to add more ESDA
functionality, and to further complete the help and
explanation modules to enhance the role of the system as
a tutor. Further ‘‘quirks’’ in the interface such as lack of
a start button and progress bars were highlighted. The
positive aspects were that the system ‘‘does enhance
understanding’’ and was generally accepted as being an
effective tool in supporting the user, getting an overall
score of 69%.
Overall, the results from the usability testing and the
process of scenario validation suggested that the
individual modules used in the prototype are comple-
mentary when used together, and encourage users to
become more aware of the properties of their data set.
This enrichment and understanding should improve the
quality of decisions in the task of selecting interpolation
methods that are most and least appropriate while at the
same time providing further functionality in supporting
the user to determine correct parameters for those
methods.
7. Concluding discussion
Based on a Graphical User Interface (GUI) designed
in Java, we developed a stand-alone ‘‘loosely coupled’’
prototype interpolation advisor which presents to the
user the most and least appropriate method for a given
task and data set. The prototype software that we
ARTICLE IN PRESSW. Cooper, C. Jarvis / Computers & Geosciences 30 (2004) 1003–10181016
demonstrate is able to assist a variety of users in their
need to select an appropriate interpolation method,
without the comprehensive numerical testing of multiple
and perhaps inappropriate options. It also provides
further functionality in supporting the user to determine
correct parameters for those methods.
Having no dependency on other GIS program code to
run routines or statistical functions for the interpolation
selection process, the software is flexible in offering
assistance to a broader audience using a wide variety of
GIS packages for the subsequent interpolation itself.
The use of Java also allows for the ease of further
development of the system, owing to the rapidly
increasing number of publicly available classes for
geographical functions (e.g. Bastin et al., 2002; Faul-
kner, 2002). A process of logical and semantic verifica-
tion ensured the consistency of the knowledge encoding
within the prototype software. Logical verification is a
crucial part of the software cycle and is often overlooked
because of time and effort constraints (Arnow and
Weiss, 2000). Semantic validation was also achieved, by
comparing the methods suggested by the system with
methods actually chosen by the experts working with a
temperature data set.
A broader user evaluation process suggested that the
functionality implemented within the software was of
value to the general GIS user. Moreover, the users
appreciated the complementary nature of the individual
modules as implemented in combination. The system
clearly benefited from using multi modal channels to ‘re-
contextualize’ the knowledge held by the system. In
doing so it appeared to provide a richer structure of
references between logically related information, which
encouraged users to become more aware of the proper-
ties of their data set. This enrichment and understanding
should improve the quality of decisions in the task of
selecting interpolation methods that are most and least
appropriate. The functions implemented were also felt to
be useful to the general GIS user. Still, it is noted that
the specialist requested more techniques for ESDA such
as the enhancement of the parameter module and
graphical data summaries. Walkthroughs also high-
lighted the dangers of the software where the user was
not only new to interpolation, but was also not confident
regarding the application domain within which they
were working. Again, further ESDA or automated
analyses are suggested by this finding. Many of these
ESDA facilities are probably still best provided in
specialist software and linking the system to such
packages could be easily implemented, providing a
useful addition to the system functionality for the
specialist. In consideration, for the system to operate
across all platforms, the development of the prototype
as a stand-alone package is perhaps more worthwhile.
Further validation and evaluation exercises in different
user domains will be needed to test the system more
comprehensively once the recommended ESDA exten-
sions to the software are developed.
Outstanding research questions relate particularly
how to best employ the user and their understanding
within the decision making process, which reflect both
the context within which the software is being used and
the expertise of the users themselves. Use of the system
as an intelligent tutor, initially over the WWW but
perhaps better embedded within GIS such that the
difference between expected and learner pathways
through the decision making process can be highlighted
(e.g. Cheikes et al., 1998), suggests one profitable role
for multi-modal information and user driven explora-
tory analyses. Those who find the nature of interpola-
tion bewildering and the selection process problematic,
could be taught using the system. This develops the idea
of ‘‘rethinking’’ new ways to teach GIS (Fotheringham,
et al., 2000, p. 246). However, to comprehend confusing
context by visual experiences could be ‘‘influenced
(biased) by what we expect to see’’ (Mark, 1989, p.
551), thus, such visualizations must firstly be relevant to
the task, and secondly, for the user who is unaware of
interpolation terminology, must be of a type they expect
to see. This sounds contradictory, and suggests that
selecting such images in support of the interpolation
selection process is a difficult practice and an area
requiring further investigation. In contrast, the increas-
ing use of modular GIS components arranged for user-
specific tasks suggests the use of stronger and potentially
hidden structures to assist with the design of appropriate
workflows for particular tasks (Mineter et al., 2003). In
some contexts the software may need to fulfil completely
a function that normally requires human expertise, or it
may play the role of an assistant to a human decision
maker. The design of adaptable software (Grundy and
Hosking, 2002), with support that reduces as the user
gains familiarity with the system, is also an intriguing
prospect for the future.
Finally, a number of internal, expert systems and
knowledge structuring issues remain to be tackled.
Among these is to address the benefit of being able to
supply the user with a value that enumerates how
confident the system is of the appropriateness of the
method selected. This could be achieved in a future
system by summing the salience factors implied when a
rule fires (Giarratano and Riley, 1989), in a combination
with a move away from the strict decision tree structures
for knowledge used in this prototype. For the current
system, given the expert system implementation via Jess,
it would be a relatively straightforward enhancement;
however, this method only implies the importance of a
rule. Similarly, in its present prototype form the advisor
does not allow for stepping back and forth between
questions, nor does it allow for fuzzy answers. It asks of
the user to make a judgement that is either [yes] or [no],
and the introduction of fuzzy evidence is a further

ARTICLE IN PRESSW. Cooper, C. Jarvis / Computers & Geosciences 30 (2004) 1003–1018 1017
direction for future work. In taking a broader view,
future work should focus on adding more meaning-
ful forms of quality assurance. Other future directions
should consider learning from experiences rather
than solely from theoretical knowledge. Case-
based reasoning matches new problems to ‘‘cases’’
adapting solutions from the past to current situations
(Giarratano and Riley, 1989). Further, cases are useful
for interpreting open-ended or ill-defined concepts and
thus fit well to task of selecting an interpolator.
Furthermore, it is possible to use a case-based system
as a way for a community of experts to pool their
knowledge.
Defining and encoding the process of how an expert
chooses an interpolation method is a complicated
undertaking. While there is a broad range of expert
knowledge on the subject of interpolation, there is a lack
of software to support the user in selecting an
appropriate method that balances expert knowledge on
context and procedures with data analyses. The proto-
type tool demonstrated here goes some way towards the
goal of developing a robust and comprehensive ‘in-
telligent’ advisor for selecting an interpolator, but its
development also raises many further research questions
for the future in the process.
References
Arnow, D., Weiss, G., 2000. Introduction to Programming
Using Java, An Object Oriented Approach. Addison-
Wesley, Longman, New York, NY 805pp.
Bastin, L., Fisher, P.F., Wood, J., 2002. Visualizing uncertainty
in multi-spectral remotely sensed imagery. Computers &
Geosciences 28 (3), 337–350.
Bonham-Carter, G.F., 1994. Geographic Information Systems
for Geoscientists: Modelling with GIS. Pergamon, Oxford
398pp.
Brezillon, P., 1999. Context in problem solving: a survey. The
Knowledge Engineering Review 14 (1), 1–34.
Bucher, F., 1998. Using extended exploratory data analysis for
the selection of an appropriate interpolation model. In:
Onsrud, H. (Ed.)., Geographic Information Research:
Trans-Atlantic Perspectives. Taylor and Francis, London,
pp. 391–403.
Cameron, M.A., Abel, D.J., 1996. A problem model for spatial
decision support systems, advances in GIS research II:
Proceedings of the Seventh International Symposium on
Spatial Data Handling, London, pp. 89–99.
Cheikes, B.A., et al., 1998. Embedded training for complex
information systems. Lecture Notes in Computer Science,
vol. 1452, pp. 36–45.
Collins, F., Bolstad, P., 1996. A comparison of spatial
interpolation techniques in temperature estimation. In:
NCGIA Third International Conference/Workshop on
Integrating GIS and Environmental Modeling, Santa Fe,
NM, USA.
Cooper W., 2001. Interpolation selection: supporting the user
with an intelligent system. M.Sc. Thesis, The University of
Edinburgh, Edinburgh, UK, 160pp.
Declercq, F.A., 1996. Interpolation methods for scaterred
sample data: accuracy, spatial patterns, processing time.
Cartography and Geographical Information Systems 23 (3),
128–144.
Dimitrakopoulos, R., 1993. Artificially intelligent geostatistics:
a framework accommodating qualitative knowledge-infor-
mation. Mathematical Geology 25, 261–279.
Duda, R.O., Shortliffe, E.H., 1983. Expert system research.
Science 220, 261–268.
Durkin, J., 1994. Expert Systems: Design and Development.
Prentice-Hall Inc, Englewood Cliffs, NJ 800pp.
Dykes, J.A., 1997. Exploring spatial data representation with
dynamic graphics. Computers & Geosciences 23 (4),
345–370.
Egenhofer, M.J., 1996. MultiModal spatial querying, advances
in GIS research II. Proceedings of the Seventh International
Symposium on Spatial Data Handling, London, pp.
785–799.
Erdmann, M., Studer, R., 1998. Use-cases and scenarios for
developing knowledge based systems. Proceedings of the
15th IFIP World Computer Congress, WCC’98, Conference
on Information Technologies and Knowledge Systems, pp.
259–272.
Faulkner, B.R., 2002. Java classes for nonprocedural variogram
modeling. Computers & Geosciences 28 (3), 387–397.
Forgy, C.L., 1982. Rete: a fast algorithm for the many pattern/
many object pattern match problem. Artificial Intelligence
19, 17–37.
Fotheringham, A.S., Brunsdon, C., Charlton, M., 2000.
Quantitative Geography: Perspectives on Spatial Data
Analysis. Sage Publications, London 270pp.
Friedman-Hill, E.J., 1997. Jess, The expert system shell for the
Java platform. Online Report SAND98-8206, Sandia
National Laboratories, Livermore, CA.
Gamma Design Software, 2002. GS+TM Version 5, Geostatis-
tics for the Environmental Sciences.
Giarratano, J., Riley, G., 1989. Expert Systems—Principles and
Programming. PWS-Kent Publishing Company, Boston,
MA 624pp.
Gonzalez, A., Barr, V., 2000. Validation and verification of
intelligent systems—What are they and how are they
different. Journal of Experimental and Theoretical Artificial
Intelligence 407–420.
Goovaerts, P., 1999. Performance comparison of geostatistical
algorithms for incorporating elevation into the mapping of
precipitation. Proceedings of the Fourth International
Conference on GeoComputation, Mary Washington Col-
lege Fredericksburg, Virginia, USA.
Grundy, J., Hosking, J., 2002. Developing adaptable user
interfaces for component-based systems. Interacting with
Computers 14, 175–194.
Hayes-Roth, F., Waterman, D.A., Lenat, D.B., 1983. Building
Expert Systems. Addison-Wesley, Reading, MA 444pp.
Heuvelink, G., Webster, R., 2001. Modelling soil variation:
past, present, and future. Geoderma 100 (3–4), 269–301.
Hutchinson, M.F., Gallant, G.C., 1999. Representation of
terrain. In: Longley, P.A., Goodchild, M.F., Maguire, D.,
Rhind, D.W. (Eds.)., Geographical Information Systems:

ARTICLE IN PRESSW. Cooper, C. Jarvis / Computers & Geosciences 30 (2004) 1003–10181018
Principles and Technical Issues. Wiley, New York, NY, pp.
105–113.
Hutchinson, M.F., 1995. Interpolating mean rainfall using thin
plate splines. International Journal of Geographical In-
formation Systems 9, 385–404.
Jarvis, C.H., Stuart, N., 2001a. A comparison among strategies
for interpolating maximum and minimum daily air tem-
peratures Part I: the selection of ‘‘guiding’’ topographic and
land cover variables. Journal of Applied Meteorology 40
(6), 1060–1074.
Jarvis, C.H., Stuart, N., 2001b. A comparison among stra-
tegies for interpolating maximum and minimum daily
air temperatures. Part II: the interaction between number
of guiding variables and the type of interpolation
method. Journal of Applied Meteorology 40 (6),
1075–1084.
Jarvis, C.H., Stuart, N., Cooper, W., 2003. Infometric and
statistical diagnostics to provide artificially-intelligent sup-
port for spatial analysis: the example of interpolation.
International Journal of Geographical Information Science
17, 495–516.
Kitanidis, P.K., 1999. Introduction to Geostatistics: Applica-
tions in Hydrogeology. Cambridge University Press, Cam-
bridge, UK 271pp.
Lypher, S., Stelzner, M., 1991. Graphical knowledge-based
model editors. In: Tyler, S.W. (Ed.)., Intelligent User
Interfaces. ACM Press, New York, NY, pp. 403–420.
Mark, D.M., 1989. Cognitive image-schemata for geographic
information: relations to user views and GIS interfaces.
Proceedings, GIS/LIS, Orlando, FL, pp. 551–560.
Maslyn, R.M., 1987. Gridding advisor: an expert system for
gridding algorithms. Geobyte 2, 42–43.
Mineter, M.J., Jarvis, C.H., Dowers, S., 2003. From stand-
alone programs towards GRID-aware services and compo-
nents: a case study in agricultural modelling with inter-
polated climate data. Environmental Modelling and
Software 18, 379–391.
Mitas, L., Mitasova, H., 1999. Spatial interpolation. In:
Longley, P.A., Goodchild, M.F., Maguire, D., Rhind,
D.W. (Eds.)., Geographical Information Systems—Princi-
ples and Technical Issues. Wiley, Chichester, pp. 481–492.
Nielsen, J., 1994. Usability Engineering. Morgan Kaufmann
Publishers, CA, USA, 362pp.
Oliver, M.A., Khayrat, A.L., 2000. A geostatistical investiga-
tion of the spatial variation of radon in soil. Computers &
Geosciences 27 (8), 939–957.
Shannon, B., et al., 2000. JavaTM 2 Platform, Enterprise
Edition: Platform and Component Specifications. Addison-
Wesley Professional, Reading, MA 800pp.
Shneiderman, B., 1998. Designing the User Interface: Strategies
for Effective Human Computer Interaction. Addison-
Wesley, Reading, MA 640 pp.
Worboys, M.F., 1995. GIS: A Computing Perspective. Taylor
& Francis, London 392pp.