Embed Size (px)
Citation preview
Investor Presentation
Bharti Airtel LimitedMarch 2009
DisclaimerThe information contained in this presentation is only current as of its date. All actions and statements made herein or otherwise shall be subject to the applicable laws and regulations as amended from time to time. There is no representation that all information relating to the context has been taken care off in the presentation and neither we undertake any obligation as to the regular updating of the information as a result of new information, future events or otherwise. We will accept no liability whatsoever for any loss arising directly or indirectly from the use of, reliance of any information contained in this presentation or for any omission of the information. The information shall not be distributed or used by any person or entity in any jurisdiction or countries were such distribution or use would be contrary to the applicable laws or Regulations. It is advised that prior to acting upon this presentation independent consultation / advise may be obtained and necessary due diligence, investigation etc may be done at your end. You may also contact us directly for any questions or clarifications at our end.
This presentation contain certain statements of future expectations and other forward-looking statements, including those relating to our general business plans and strategy, our future financial condition and growth prospects, and future developments in our industry and our competitive and regulatory environment. In addition to statements which are forward looking by reason of context, the words ‘may, will, should, expects, plans, intends, anticipates, believes, estimates, predicts, potential or continue’ and similar expressions identify forward looking statements.
Actual results, performances or events may differ materially from these forward-looking statements including the plans, objectives, expectations, estimates and intentions expressed in forward looking statements due to a number of factors, including without limitation future changes or developments in our business, our competitive environment, telecommunications technology and application, and political, economic, legal and social conditions in India. It is cautioned that the foregoing list is not exhaustive
This presentation is not being used in connection with any invitation of an offer or an offer of securities and should not be used as a basis for any investment decision.
Investor Relations :- http://www.bhartiairtel.inFor any queries, write to: [email protected]
“The information contained herein does not constitute an offer of securities for sale in the United States. Securities may not be sold in the United States absent registration or an exemption from registration under the U.S. Securities Act of 1933, as amended. Any public offering of securities to be made in the United States will be made by means of a prospectus and will contain detailed information about the Company and its management, as well as financial statements. No money, securities or other consideration is being solicited, and, if sent in response to the information contained herein, will not be accepted.”
3
Mobile Services Telemedia Services Enterprise Services
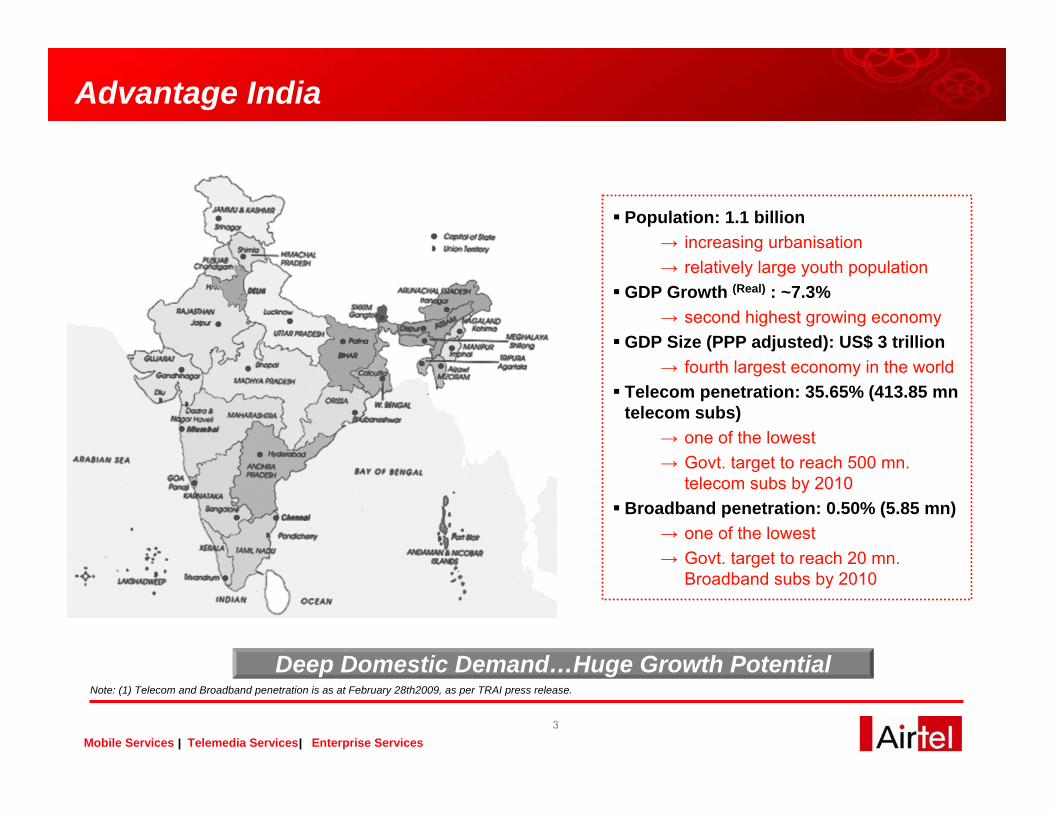
Advantage India
Deep Domestic Demand…Huge Growth Potential
Population: 1.1 billion→ increasing urbanisation→ relatively large youth population
GDP Growth (Real) : ~7.3%→ second highest growing economy
GDP Size (PPP adjusted): US$ 3 trillion→ fourth largest economy in the world
Telecom penetration: 35.65% (413.85 mntelecom subs)
→ one of the lowest→ Govt. target to reach 500 mn.
telecom subs by 2010Broadband penetration: 0.50% (5.85 mn)
→ one of the lowest→ Govt. target to reach 20 mn.
Broadband subs by 2010
Note: (1) Telecom and Broadband penetration is as at February 28th2009, as per TRAI press release.
4
Mobile Services Telemedia Services Enterprise Services
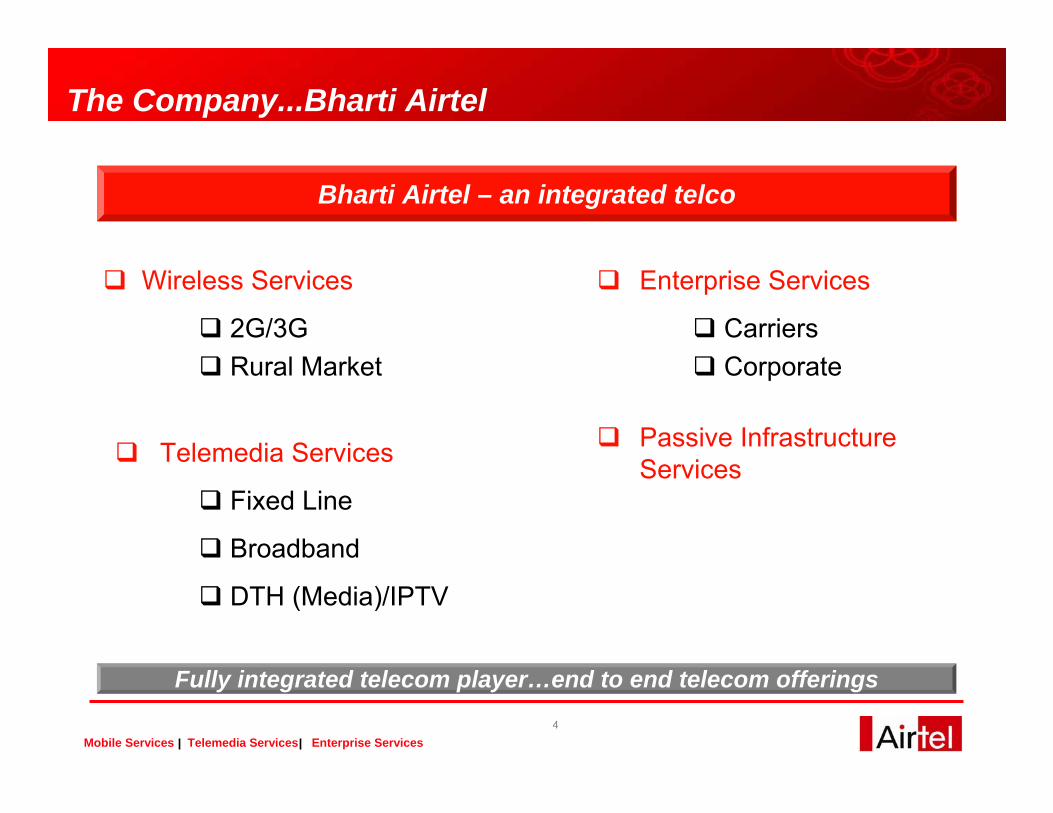
The Company...Bharti Airtel
Bharti Airtel – an integrated telco
Wireless Services
2G/3GRural Market
Telemedia Services
Fixed Line
Broadband
DTH (Media)/IPTV
Enterprise Services
CarriersCorporate
Passive Infrastructure Services
Fully integrated telecom player…end to end telecom offerings
5
Mobile Services Telemedia Services Enterprise Services
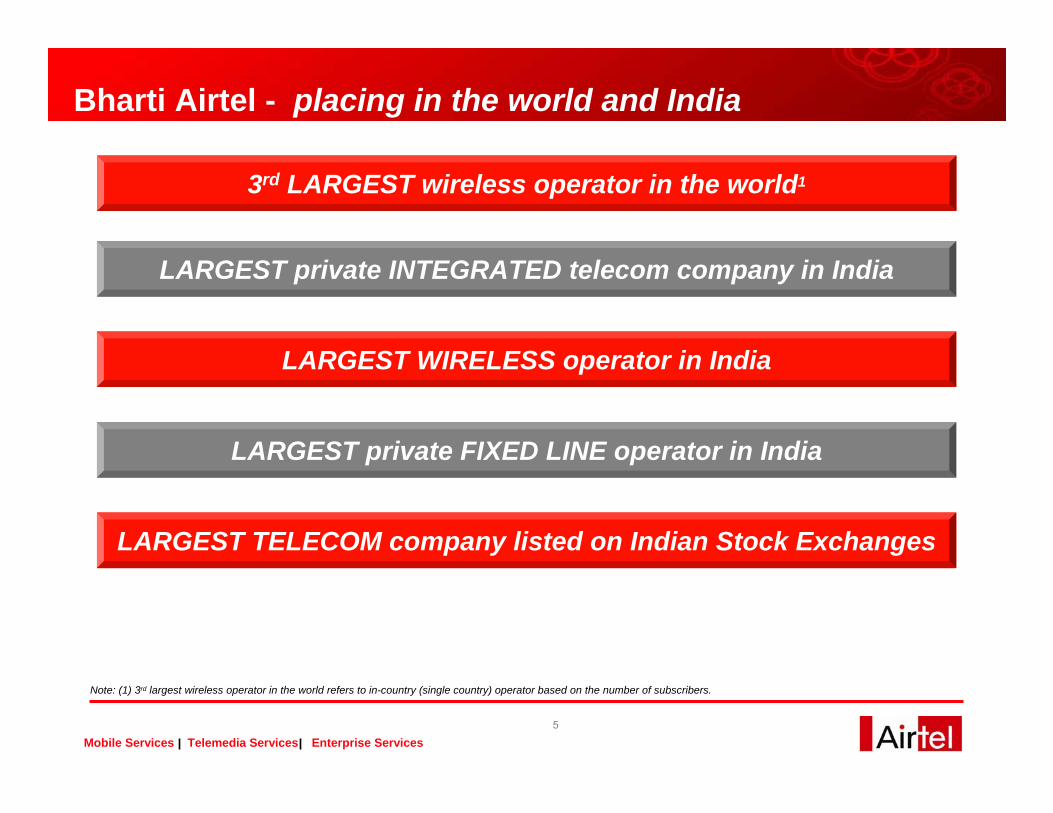
3rd LARGEST wireless operator in the world1
LARGEST TELECOM company listed on Indian Stock Exchanges
Bharti Airtel - placing in the world and India
LARGEST private INTEGRATED telecom company in India
LARGEST WIRELESS operator in India
LARGEST private FIXED LINE operator in India
Note: (1) 3rd largest wireless operator in the world refers to in-country (single country) operator based on the number of subscribers.
6
Mobile Services Telemedia Services Enterprise Services
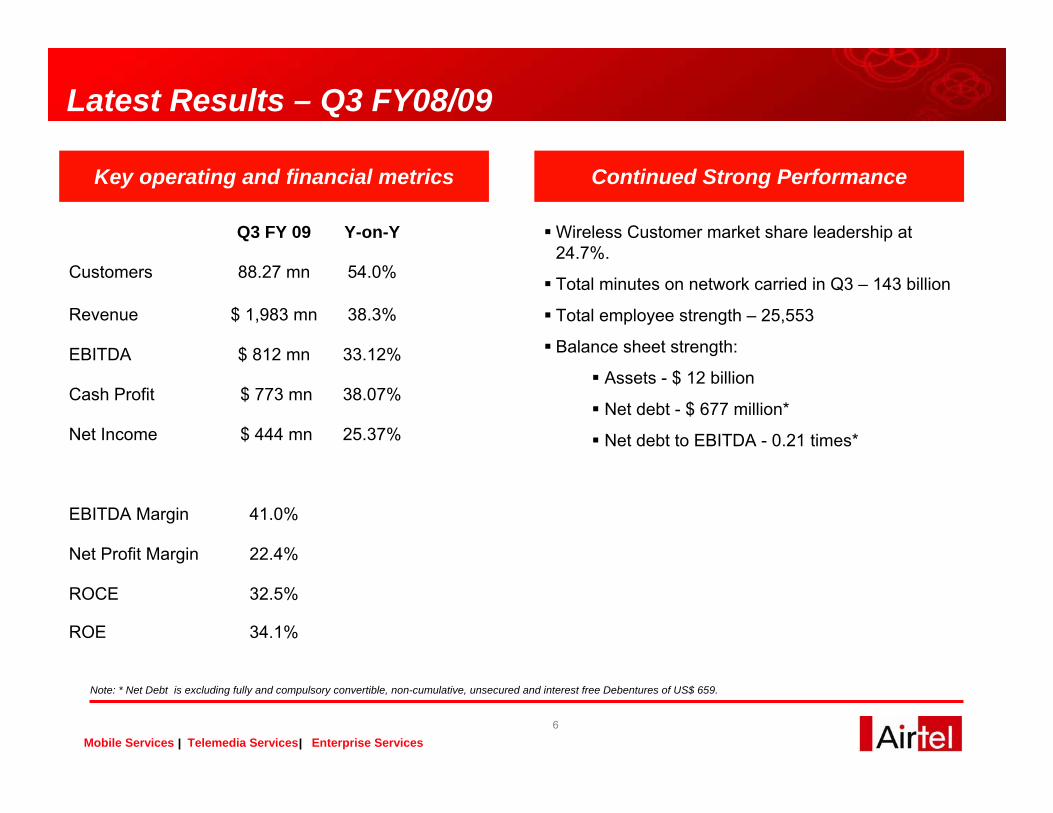
Latest Results – Q3 FY08/09
Key operating and financial metrics
34.1%ROE
32.5%ROCE
22.4%Net Profit Margin
41.0%EBITDA Margin
25.37%$ 444 mnNet Income
38.07%$ 773 mnCash Profit
33.12%$ 812 mnEBITDA
38.3%$ 1,983 mnRevenue
54.0%88.27 mnCustomers
Y-on-YQ3 FY 09
Continued Strong Performance
Wireless Customer market share leadership at 24.7%.
Total minutes on network carried in Q3 – 143 billion
Total employee strength – 25,553
Balance sheet strength:
Assets - $ 12 billion
Net debt - $ 677 million*
Net debt to EBITDA - 0.21 times*
Note: * Net Debt is excluding fully and compulsory convertible, non-cumulative, unsecured and interest free Debentures of US$ 659.
7
Mobile Services Telemedia Services Enterprise Services
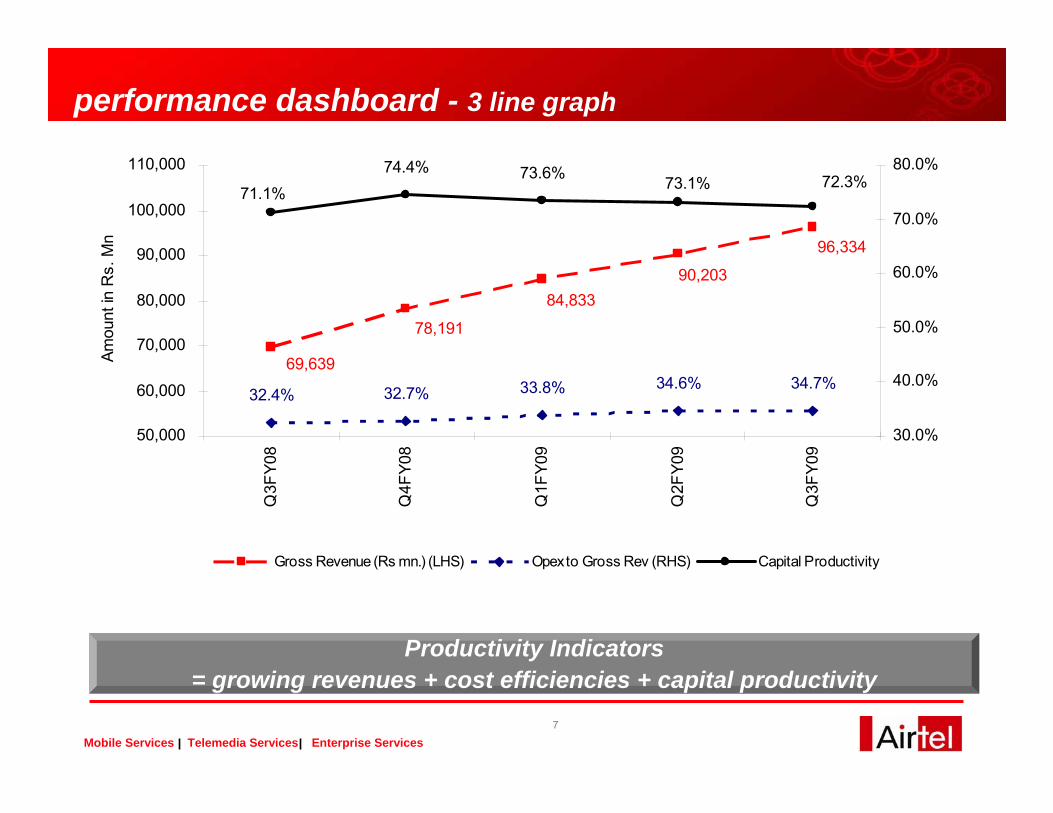
performance dashboard - 3 line graph
Productivity Indicators = growing revenues + cost efficiencies + capital productivity
96,334
90,20384,833
78,191
69,639
32.4% 32.7% 33.8% 34.6% 34.7%
71.1%74.4% 73.6% 73.1% 72.3%
50,000
60,000
70,000
80,000
90,000
100,000
110,000
Q3F
Y08
Q4F
Y08
Q1F
Y09
Q2F
Y09
Q3F
Y09
Amou
nt in
Rs.
Mn
30.0%
40.0%
50.0%
60.0%
70.0%
80.0%
Gross Revenue (Rs mn.) (LHS) Opex to Gross Rev (RHS) Capital Productivity
8
Mobile Services Telemedia Services Enterprise Services
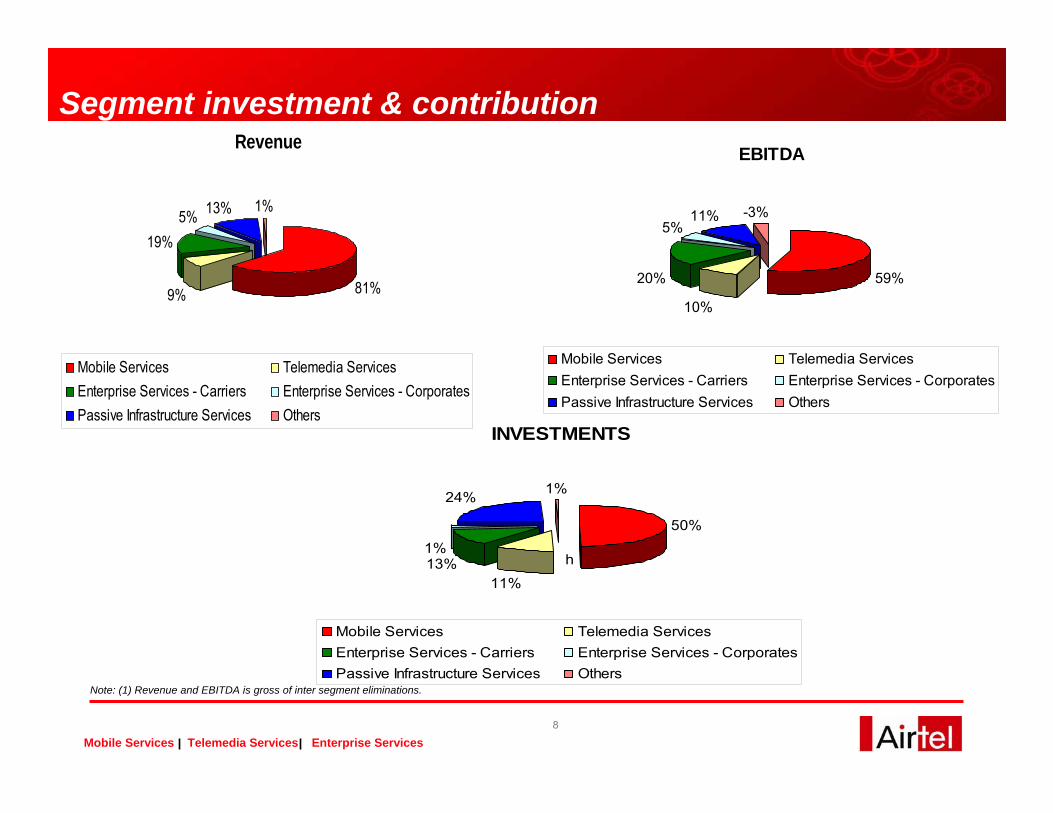
Segment investment & contribution
Note: (1) Revenue and EBITDA is gross of inter segment eliminations.
Revenue
81%9%
19%5% 13% 1%
Mobile Services Telemedia ServicesEnterprise Services - Carriers Enterprise Services - CorporatesPassive Infrastructure Services Others
EBITDA
59%
10%
20%
5%11% -3%
Mobile Services Telemedia ServicesEnterprise Services - Carriers Enterprise Services - CorporatesPassive Infrastructure Services Others
INVESTMENTS
50%
11%13%1%
24% 1%
Mobile Services Telemedia ServicesEnterprise Services - Carriers Enterprise Services - CorporatesPassive Infrastructure Services Others
h
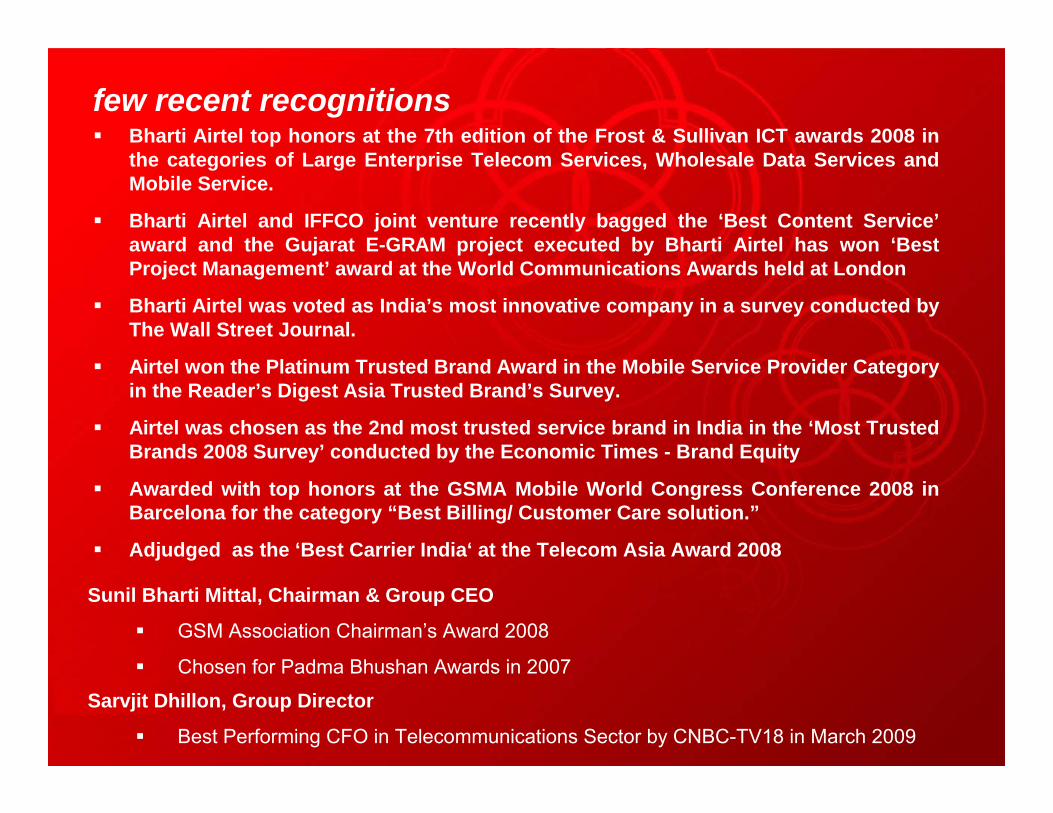
few recent recognitionsBharti Airtel top honors at the 7th edition of the Frost & Sullivan ICT awards 2008 in the categories of Large Enterprise Telecom Services, Wholesale Data Services and Mobile Service.
Bharti Airtel and IFFCO joint venture recently bagged the ‘Best Content Service’award and the Gujarat E-GRAM project executed by Bharti Airtel has won ‘Best Project Management’ award at the World Communications Awards held at London
Bharti Airtel was voted as India’s most innovative company in a survey conducted by The Wall Street Journal.
Airtel won the Platinum Trusted Brand Award in the Mobile Service Provider Category in the Reader’s Digest Asia Trusted Brand’s Survey.
Airtel was chosen as the 2nd most trusted service brand in India in the ‘Most Trusted Brands 2008 Survey’ conducted by the Economic Times - Brand Equity
Awarded with top honors at the GSMA Mobile World Congress Conference 2008 in Barcelona for the category “Best Billing/ Customer Care solution.”
Adjudged as the ‘Best Carrier India‘ at the Telecom Asia Award 2008
Sunil Bharti Mittal, Chairman & Group CEO
GSM Association Chairman’s Award 2008
Chosen for Padma Bhushan Awards in 2007
Sarvjit Dhillon, Group Director
Best Performing CFO in Telecommunications Sector by CNBC-TV18 in March 2009
10
Mobile Services Telemedia Services Enterprise Services
Wireless Services
11
Mobile Services Telemedia Services Enterprise Services
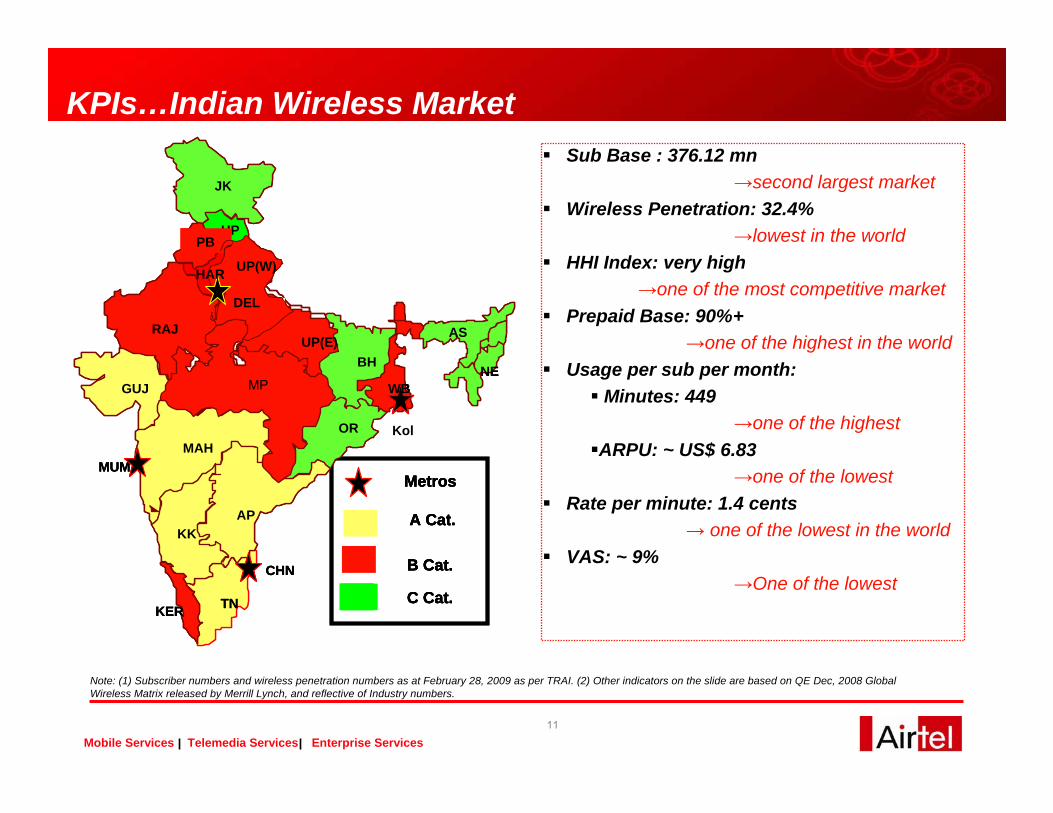
Sub Base : 376.12 mn→second largest market
Wireless Penetration: 32.4%→lowest in the world
HHI Index: very high→one of the most competitive market
Prepaid Base: 90%+→one of the highest in the world
Usage per sub per month:Minutes: 449
→one of the highestARPU: ~ US$ 6.83
→one of the lowestRate per minute: 1.4 cents
→ one of the lowest in the worldVAS: ~ 9%
→One of the lowest
KPIs…Indian Wireless Market
MUM
HP
DELHI
AP
CHN
MADHYA PRADESH`
TNKER
PB
DEL
UP(W)
MP
RAJUP(E)
KK
OR
HAR
JK
BH
WBGUJ
MAH
AS
NE
Metros
A Cat.
B Cat.
C Cat.
MUM
HP
DELHI
AP
CHN
MADHYA PRADESH`
TNKER
PB
DEL
UP(W)
MP
RAJUP(E)
KK
OR
HAR
JK
BH
WBGUJ
MAH
AS
NE
Metros
A Cat.
B Cat.
C Cat.
MUM
HP
DELHI
AP
CHN
MADHYA PRADESH`
TNKER
PB
DEL
UP(W)
MP
RAJUP(E)
KK
OR
HAR
JK
BH
WBGUJ
MAH
AS
NE
Metros
A Cat.
B Cat.
C Cat.
Metros
A Cat.
B Cat.
C Cat.
Kol
Note: (1) Subscriber numbers and wireless penetration numbers as at February 28, 2009 as per TRAI. (2) Other indicators on the slide are based on QE Dec, 2008 Global Wireless Matrix released by Merrill Lynch, and reflective of Industry numbers.
12
Mobile Services Telemedia Services Enterprise Services
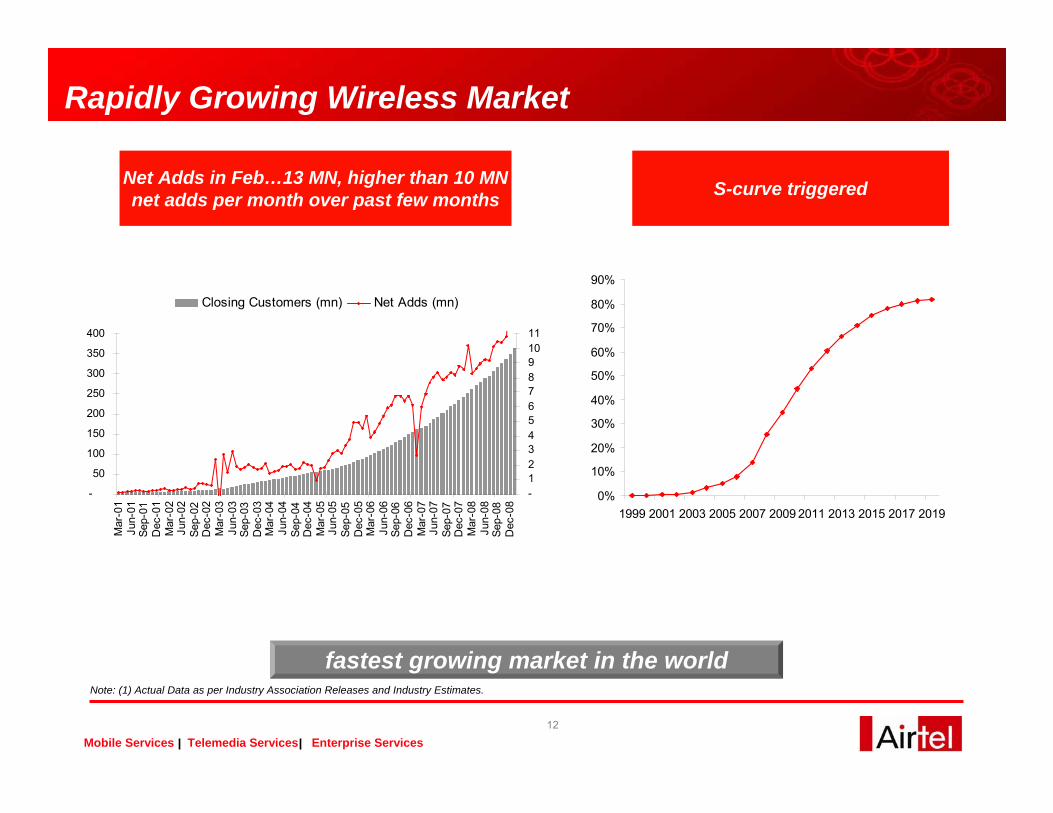
Net Adds in Feb…13 MN, higher than 10 MN net adds per month over past few months S-curve triggered
Rapidly Growing Wireless Market
Note: (1) Actual Data as per Industry Association Releases and Industry Estimates.
fastest growing market in the world
0%
10%
20%
30%
40%
50%
60%
70%
80%
90%
1999 2001 2003 2005 2007 2009 2011 2013 2015 2017 2019
-
50
100
150
200
250
300
350
400
Mar
-01
Jun-
01Se
p-01
Dec
-01
Mar
-02
Jun-
02Se
p-02
Dec
-02
Mar
-03
Jun-
03Se
p-03
Dec
-03
Mar
-04
Jun-
04Se
p-04
Dec
-04
Mar
-05
Jun-
05Se
p-05
Dec
-05
Mar
-06
Jun-
06Se
p-06
Dec
-06
Mar
-07
Jun-
07Se
p-07
Dec
-07
Mar
-08
Jun-
08Se
p-08
Dec
-08
-1234567891011
Closing Customers (mn) Net Adds (mn)
13
Mobile Services Telemedia Services Enterprise Services
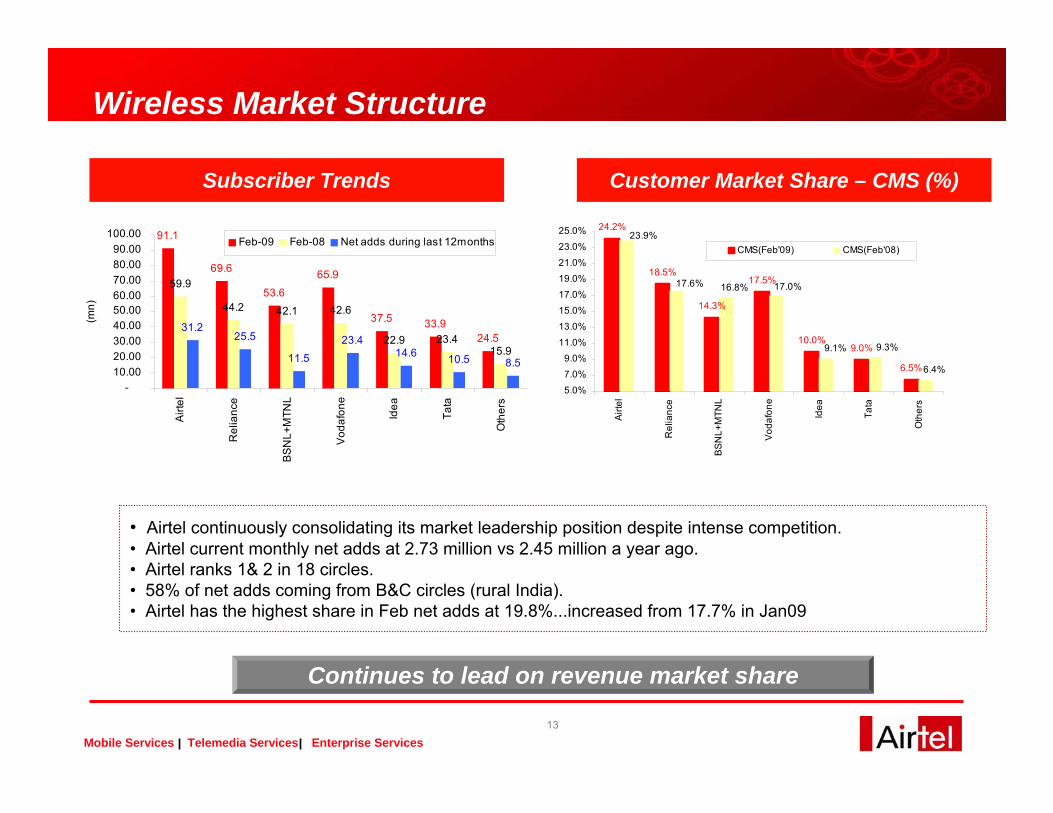
Wireless Market Structure
• Airtel continuously consolidating its market leadership position despite intense competition.• Airtel current monthly net adds at 2.73 million vs 2.45 million a year ago.• Airtel ranks 1& 2 in 18 circles.• 58% of net adds coming from B&C circles (rural India).• Airtel has the highest share in Feb net adds at 19.8%...increased from 17.7% in Jan09
Continues to lead on revenue market share
Subscriber Trends Customer Market Share – CMS (%)
91.1
69.6
53.6
65.9
37.5 33.924.5
59.9
44.2 42.1 42.6
22.9 23.415.9
31.225.5
11.5
23.414.6 10.5 8.5
-10.0020.0030.0040.0050.0060.0070.0080.0090.00
100.00
Airt
el
Rel
ianc
e
BSN
L+M
TNL
Vod
afon
e
Idea
Tata
Oth
ers
(mn)
Feb-09 Feb-08 Net adds during last 12months24.2%
18.5%
14.3%
17.5%
10.0%9.0%
6.5%6.4%
9.3%9.1%
17.0%16.8%17.6%
23.9%
5.0%
7.0%
9.0%11.0%
13.0%
15.0%
17.0%
19.0%
21.0%
23.0%
25.0%
Airt
el
Rel
ianc
e
BS
NL+
MTN
L
Vod
afon
e
Idea
Tata
Oth
ers
CMS(Feb'09) CMS(Feb'08)
14
Mobile Services Telemedia Services Enterprise Services
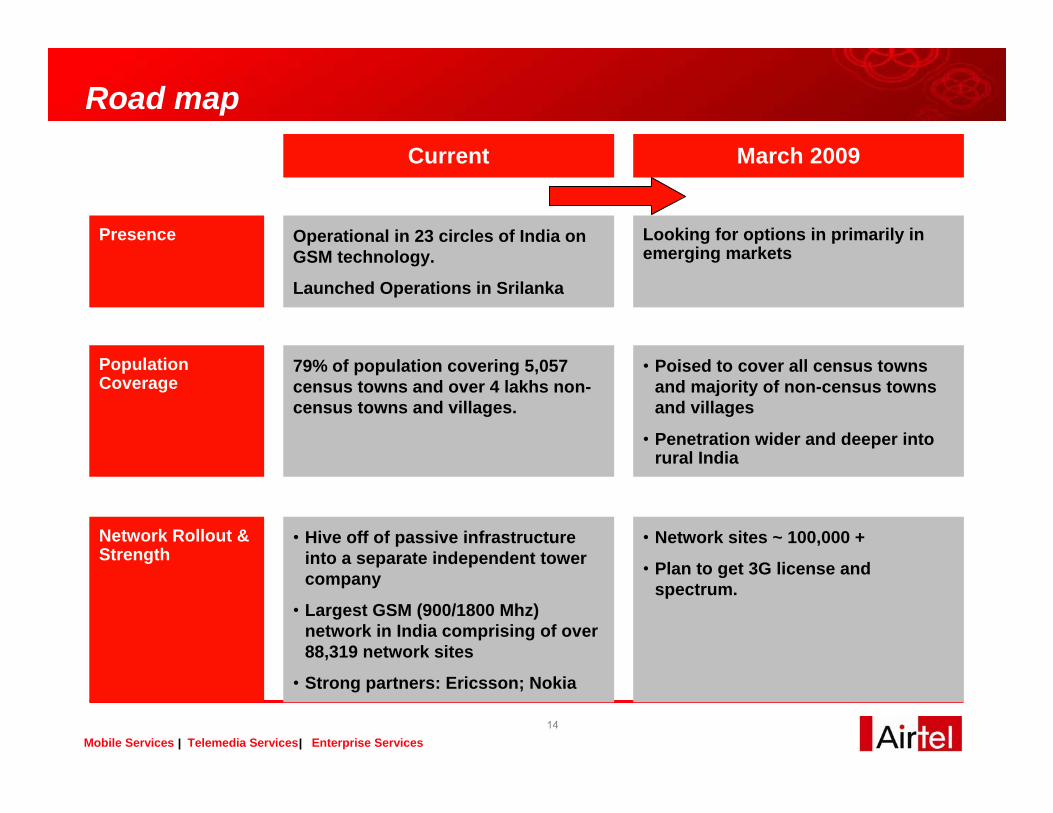
Looking for options in primarily in emerging markets
Operational in 23 circles of India on GSM technology.
Launched Operations in Srilanka
Presence
• Network sites ~ 100,000 +
• Plan to get 3G license and spectrum.
• Hive off of passive infrastructure into a separate independent tower company
• Largest GSM (900/1800 Mhz) network in India comprising of over 88,319 network sites
• Strong partners: Ericsson; Nokia
Network Rollout & Strength
• Poised to cover all census towns and majority of non-census towns and villages
• Penetration wider and deeper into rural India
79% of population covering 5,057 census towns and over 4 lakhs non-census towns and villages.
Population Coverage
March 2009Current
Road map
15
Mobile Services Telemedia Services Enterprise Services
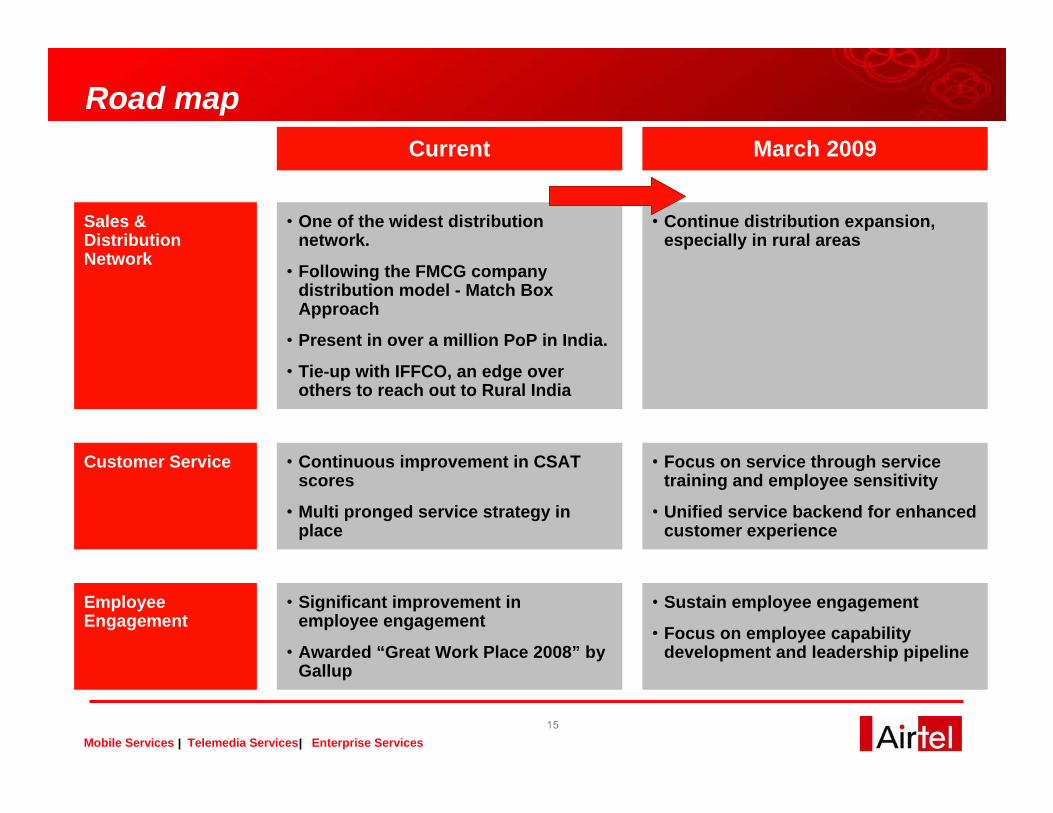
• Focus on service through service training and employee sensitivity
• Unified service backend for enhanced customer experience
• Continuous improvement in CSAT scores
• Multi pronged service strategy in place
Customer Service
• Sustain employee engagement
• Focus on employee capability development and leadership pipeline
• Significant improvement in employee engagement
• Awarded “Great Work Place 2008” by Gallup
Employee Engagement
• Continue distribution expansion, especially in rural areas
• One of the widest distribution network.
• Following the FMCG company distribution model - Match Box Approach
• Present in over a million PoP in India.
• Tie-up with IFFCO, an edge over others to reach out to Rural India
Sales & Distribution Network
March 2009Current
Road map
16
Mobile Services Telemedia Services Enterprise Services16
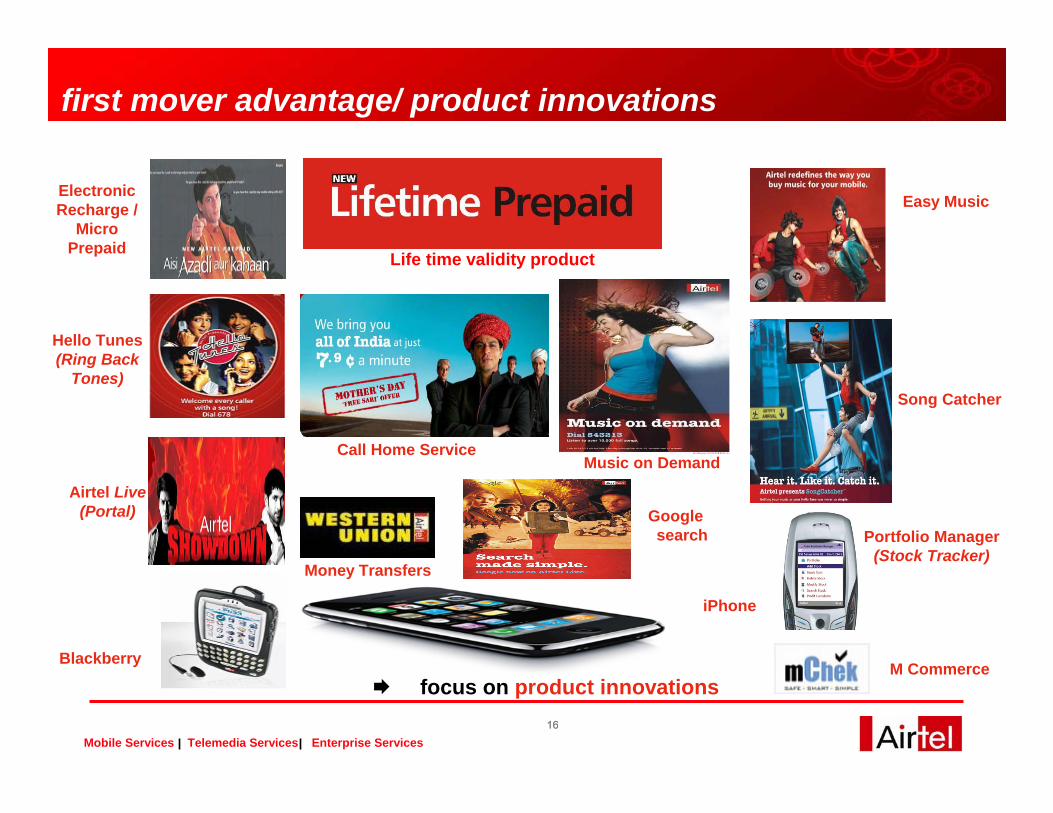
Hello Tunes(Ring Back
Tones)
Portfolio Manager(Stock Tracker)
Blackberry
Airtel Live(Portal)
first mover advantage/ product innovations
Life time validity product
Electronic Recharge /
Micro Prepaid
focus on product innovations
Easy Music
Song Catcher
Call Home Service
Money Transfers
Music on Demand
Google search
M Commerce
iPhone
17
Mobile Services Telemedia Services Enterprise Services
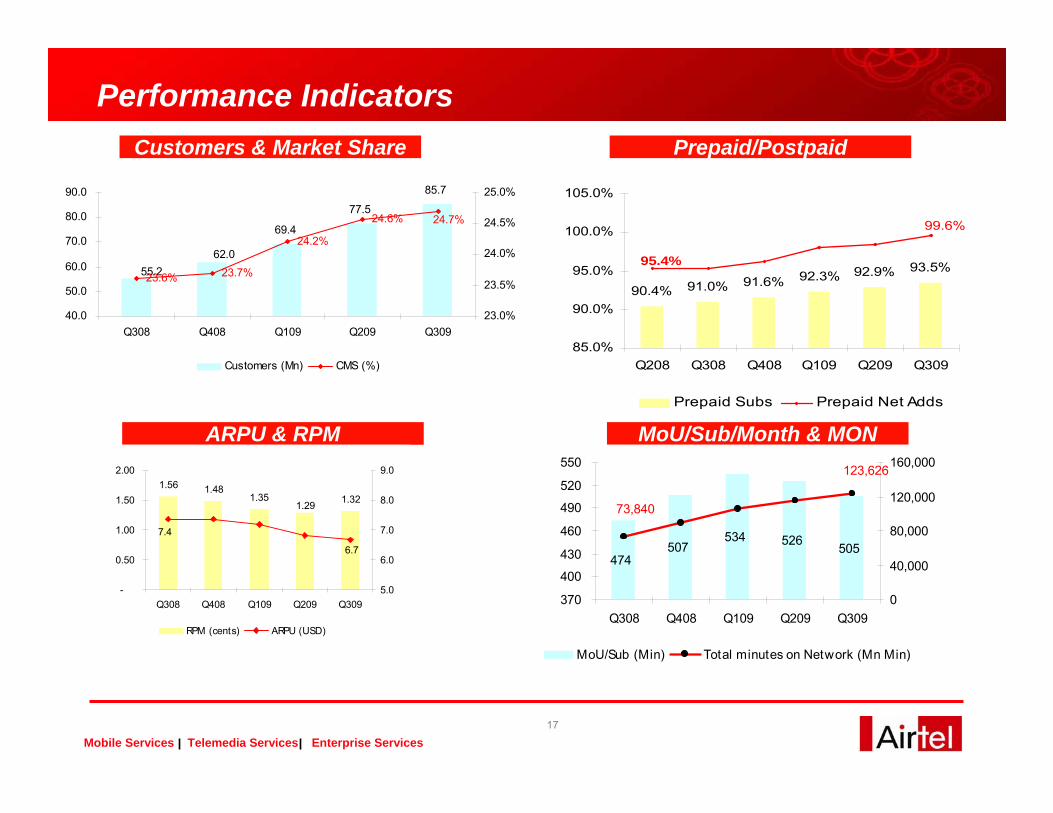
Performance IndicatorsCustomers & Market Share Prepaid/Postpaid
MoU/Sub/Month & MONARPU & RPM
90.4% 91.0% 91.6% 92.3% 92.9% 93.5%
99.6%
95.4%
85.0%
90.0%
95.0%
100.0%
105.0%
Q208 Q308 Q408 Q109 Q209 Q309
Prepaid Subs Prepaid Net Adds
69.4
77.5
85.7
55.262.0
23.6% 23.7%
24.2%
24.6% 24.7%
40.0
50.0
60.0
70.0
80.0
90.0
Q308 Q408 Q109 Q209 Q30923.0%
23.5%
24.0%
24.5%
25.0%
Customers (Mn) CMS (%)
1.56 1.481.35 1.321.29
7.4
6.7
-
0.50
1.00
1.50
2.00
Q308 Q408 Q109 Q209 Q3095.0
6.0
7.0
8.0
9.0
RPM (cents) ARPU (USD)
474505507
534 526
123,626
73,840
370
400
430
460
490
520
550
Q308 Q408 Q109 Q209 Q3090
40,000
80,000
120,000
160,000
MoU/Sub (Min) Total minutes on Network (Mn Min)
18
Mobile Services Telemedia Services Enterprise Services
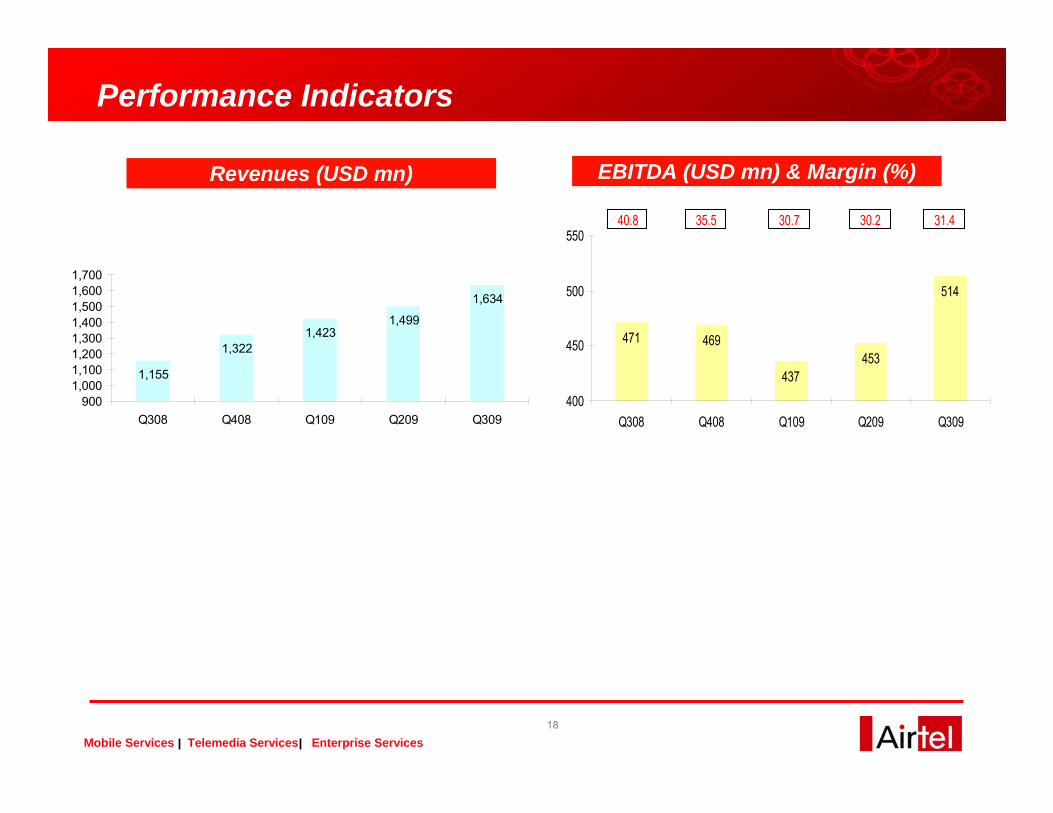
Performance Indicators
EBITDA (USD mn) & Margin (%)Revenues (USD mn)
1,155
1,3221,423
1,499
1,634
9001,0001,1001,2001,3001,4001,5001,6001,700
Q308 Q408 Q109 Q209 Q309
471 469
437453
514
400
450
500
550
Q308 Q408 Q109 Q209 Q309
40.8 35.5 30.7 30.2 31.4

19
Mobile Services Telemedia Services Enterprise Services
Telemedia Services
20
Mobile Services Telemedia Services Enterprise Services
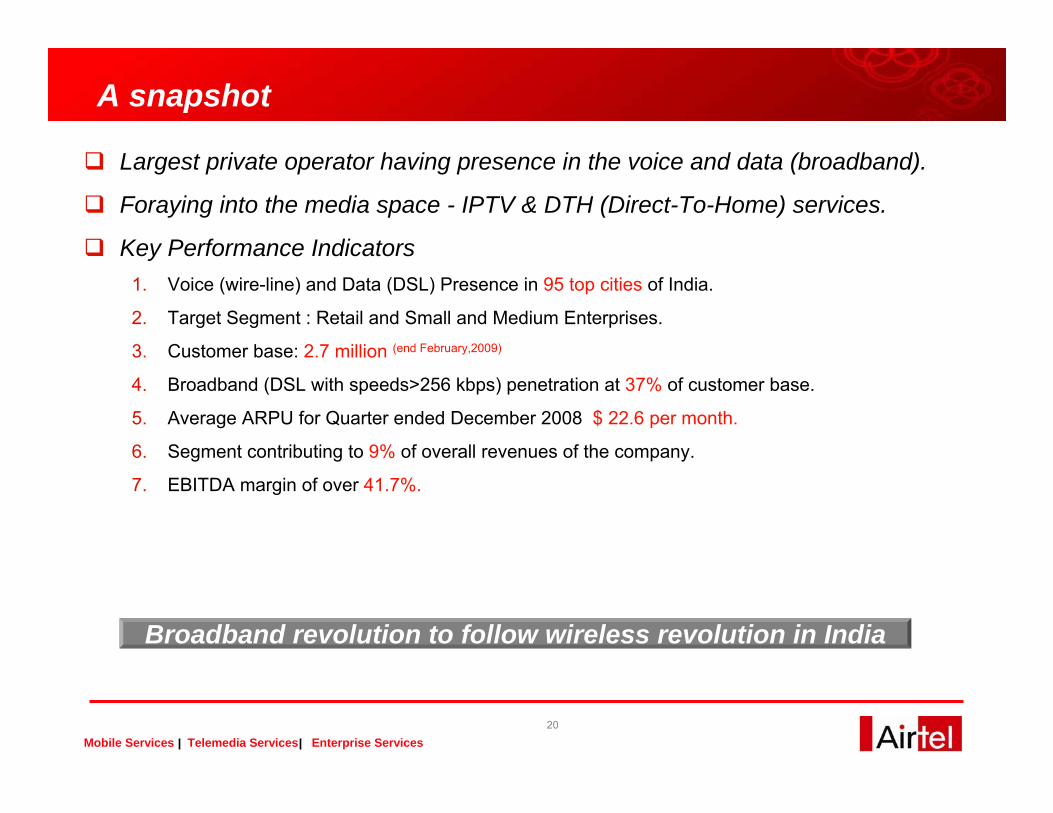
A snapshot
Largest private operator having presence in the voice and data (broadband).
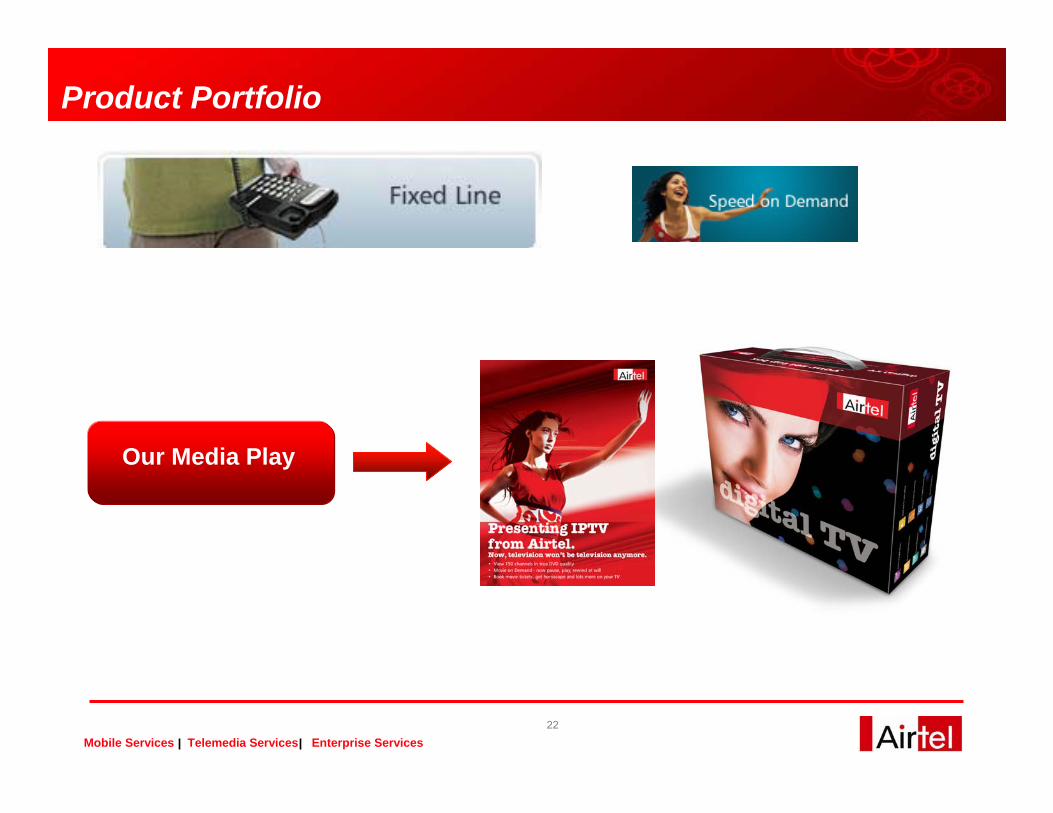
Foraying into the media space - IPTV & DTH (Direct-To-Home) services.
Key Performance Indicators 1. Voice (wire-line) and Data (DSL) Presence in 95 top cities of India.
2. Target Segment : Retail and Small and Medium Enterprises.
3. Customer base: 2.7 million (end February,2009)
4. Broadband (DSL with speeds>256 kbps) penetration at 37% of customer base.
5. Average ARPU for Quarter ended December 2008 $ 22.6 per month.
6. Segment contributing to 9% of overall revenues of the company.
7. EBITDA margin of over 41.7%.
Broadband revolution to follow wireless revolution in India
21
Mobile Services Telemedia Services Enterprise Services
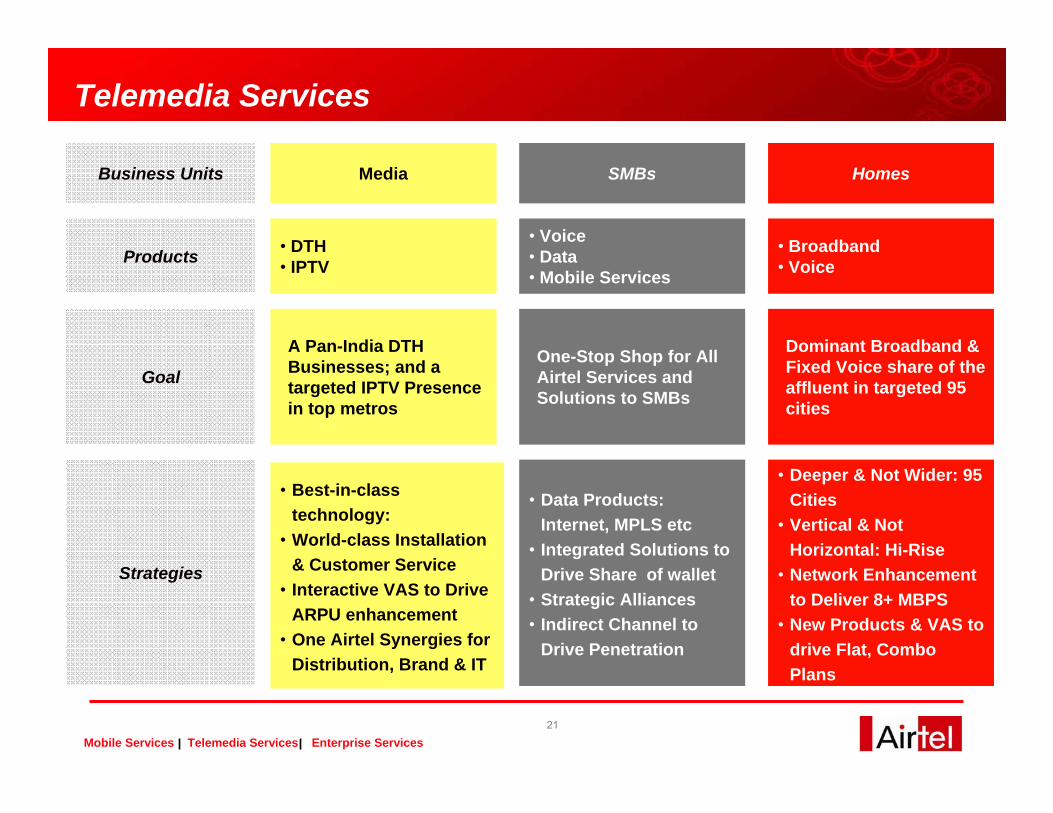
Telemedia Services
Business Units Media SMBs Homes
Products • DTH• IPTV
• Voice• Data• Mobile Services
• Broadband• Voice
Goal
A Pan-India DTH Businesses; and a targeted IPTV Presence in top metros
One-Stop Shop for All Airtel Services and Solutions to SMBs
Dominant Broadband & Fixed Voice share of the affluent in targeted 95 cities
Strategies
• Best-in-class technology:
• World-class Installation & Customer Service
• Interactive VAS to Drive ARPU enhancement
• One Airtel Synergies for Distribution, Brand & IT
• Data Products: Internet, MPLS etc
• Integrated Solutions to Drive Share of wallet
• Strategic Alliances• Indirect Channel to
Drive Penetration
• Deeper & Not Wider: 95 Cities
• Vertical & Not Horizontal: Hi-Rise
• Network Enhancement to Deliver 8+ MBPS
• New Products & VAS to drive Flat, Combo Plans
22
Mobile Services Telemedia Services Enterprise Services
Product Portfolio
Our Media Play
23
Mobile Services Telemedia Services Enterprise Services
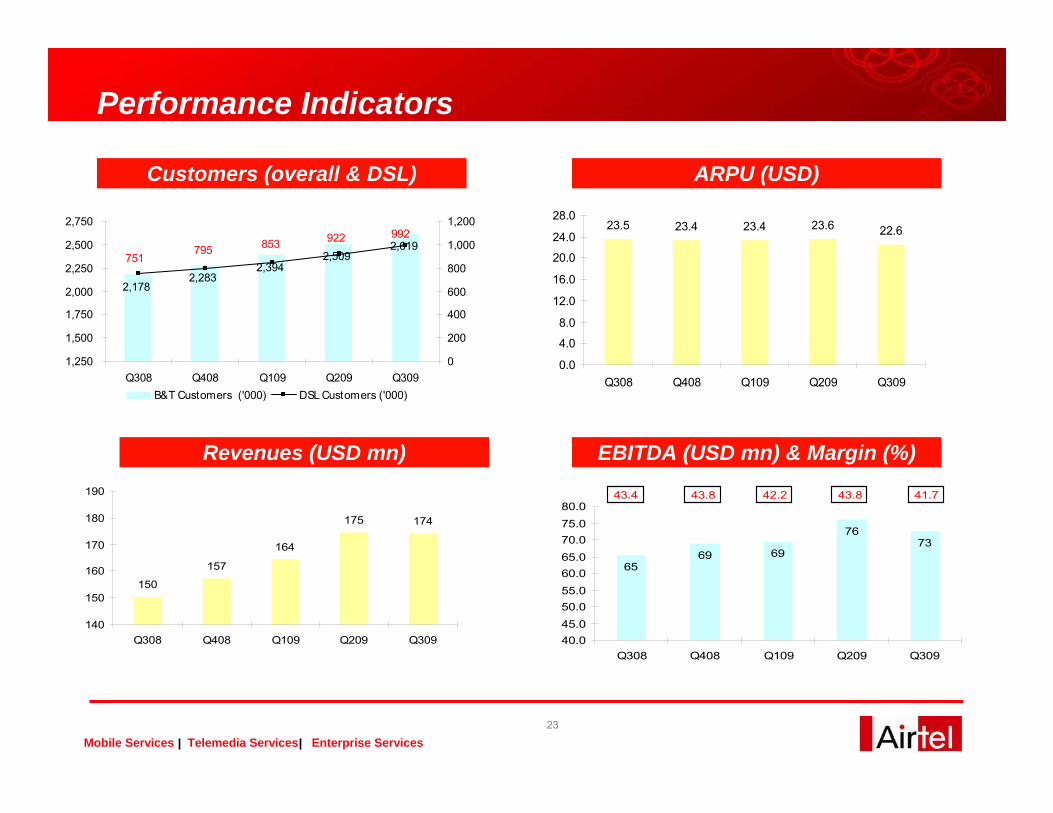
Performance Indicators
Customers (overall & DSL) ARPU (USD)
Revenues (USD mn) EBITDA (USD mn) & Margin (%)
2,2832,394
2,5092,619
2,178
992922853795751
1,250
1,500
1,750
2,000
2,250
2,500
2,750
Q308 Q408 Q109 Q209 Q3090
200
400
600
800
1,000
1,200
B&T Customers ('000) DSL Customers ('000)
23.5 23.4 23.4 23.6 22.6
0.0
4.0
8.0
12.0
16.0
20.0
24.0
28.0
Q308 Q408 Q109 Q209 Q309
150
157
164
175 174
140
150
160
170
180
190
Q308 Q408 Q109 Q209 Q309
6569 69
7673
40.045.050.055.060.065.070.075.080.0
Q308 Q408 Q109 Q209 Q309
43.4 43.8 42.2 43.8 41.7

24
Mobile Services Telemedia Services Enterprise Services
Enterprise Services
25
Mobile Services Telemedia Services Enterprise Services
A snapshotCarrier: - one of the largest carriers of voice and data, both domestic and international.
Corporate: - providing end to end telecom solutions to large corporate and Small & Medium Businesses.
Present Competition: National Long Distance: BSNL; Reliance; VSNL; Vodafone; Tata
International Long Distance: VSNL, Bharti, Reliance, BSNL
26
Mobile Services Telemedia Services Enterprise Services
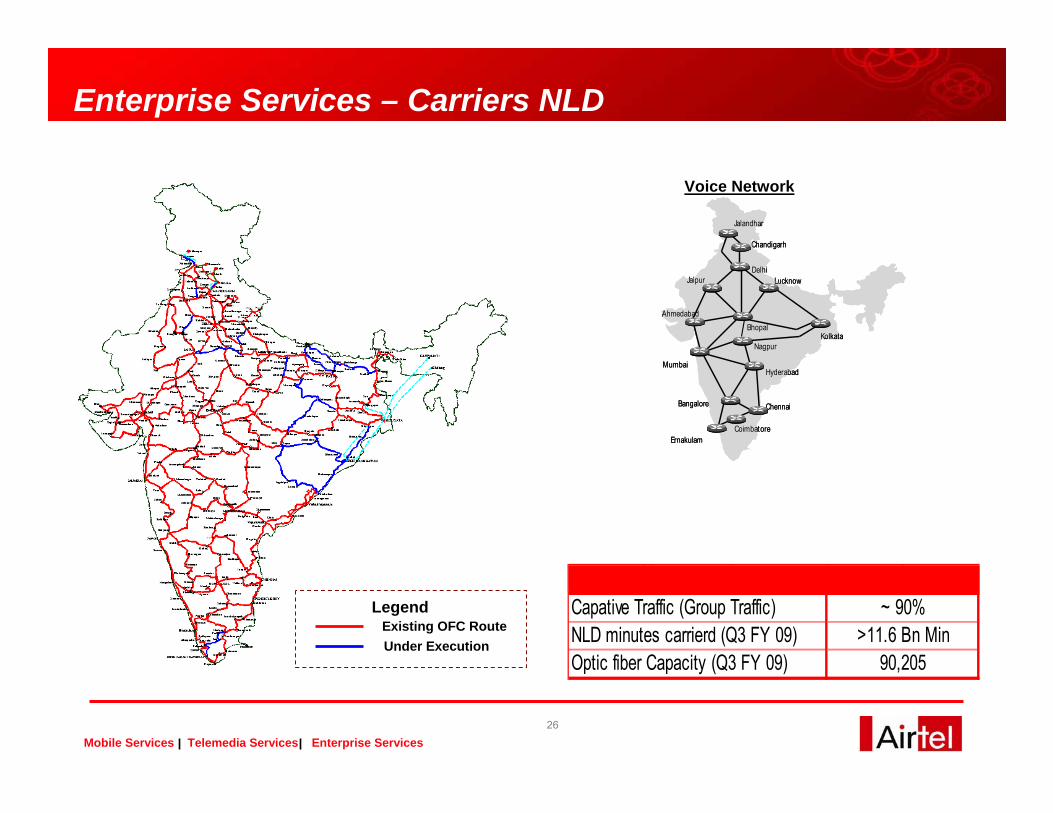
Enterprise Services – Carriers NLD
LegendExisting OFC RouteUnder Execution
Kolkata
Mumbai
Chennai
Hyderabad
Bangalore
Jaipur
Ahmedabad Bhopal
Chandigarh
Delhi
Nagpur
Lucknow
Jalandhar
ErnakulamCoimbatore
Kolkata
Mumbai
Chennai
Hyderabad
Bangalore
Jaipur
Ahmedabad Bhopal
Chandigarh
Delhi
Nagpur
Lucknow
Jalandhar
ErnakulamCoimbatore
Voice Network
Capative Traffic (Group Traffic)NLD minutes carrierd (Q3 FY 09)Optic fiber Capacity (Q3 FY 09)
~ 90%>11.6 Bn Min
90,205
27
Mobile Services Telemedia Services Enterprise Services
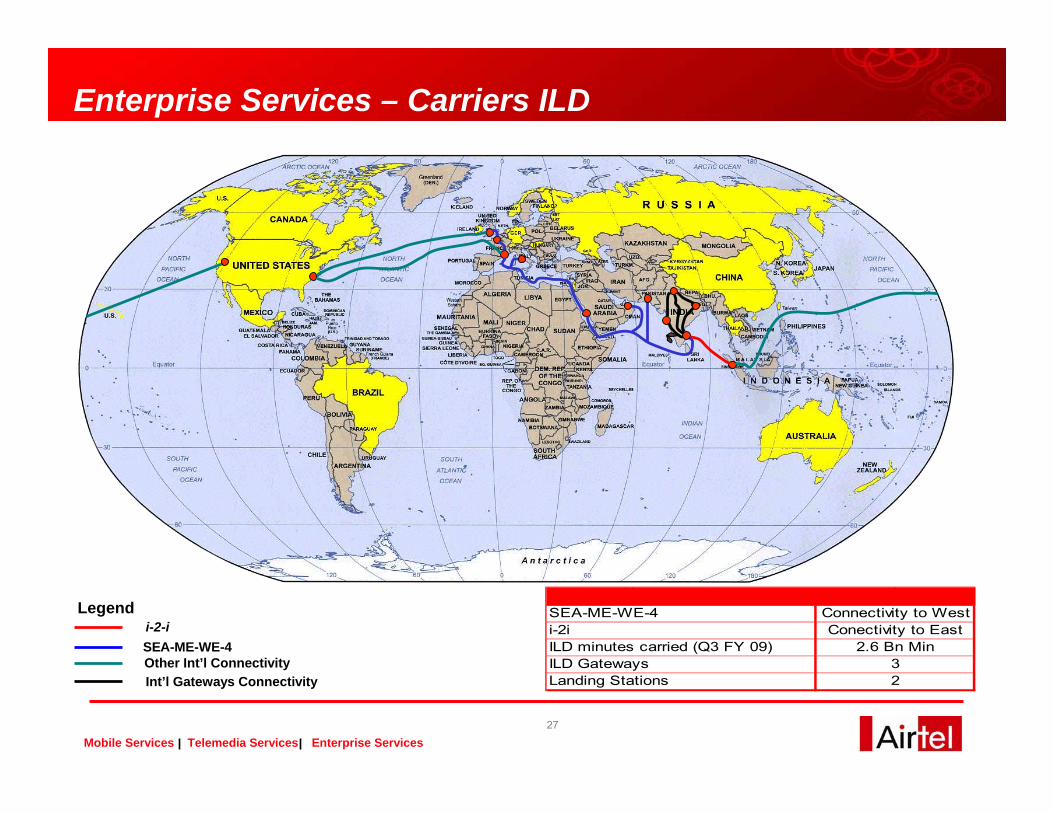
Enterprise Services – Carriers ILD
Legendi-2-iSEA-ME-WE-4Other Int’l ConnectivityInt’l Gateways Connectivity
SEA-ME-WE-4i-2i ILD minutes carried (Q3 FY 09)ILD GatewaysLanding Stations
Connectivity to West
32
Conectivity to East2.6 Bn Min
28
Mobile Services Telemedia Services Enterprise Services
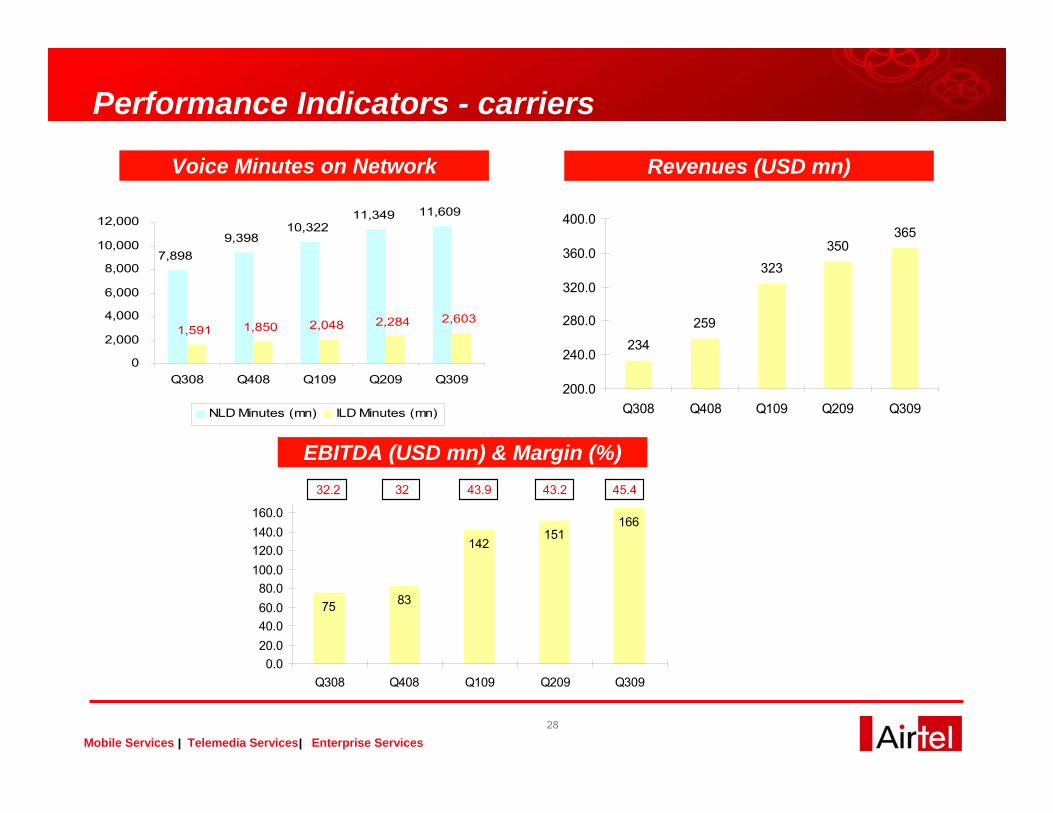
Performance Indicators - carriers
Voice Minutes on Network Revenues (USD mn)
EBITDA (USD mn) & Margin (%)
7,8989,398
10,32211,349 11,609
1,591 1,850 2,048 2,284 2,603
0
2,000
4,000
6,000
8,000
10,000
12,000
Q308 Q408 Q109 Q209 Q309
NLD Minutes (mn) ILD Minutes (mn)
234259
323350
365
200.0
240.0
280.0
320.0
360.0
400.0
Q308 Q408 Q109 Q209 Q309
75 83
142151
166
0.020.040.060.080.0
100.0120.0140.0160.0
Q308 Q408 Q109 Q209 Q309
32.2 32 43.9 43.2 45.4
29
Mobile Services Telemedia Services Enterprise Services
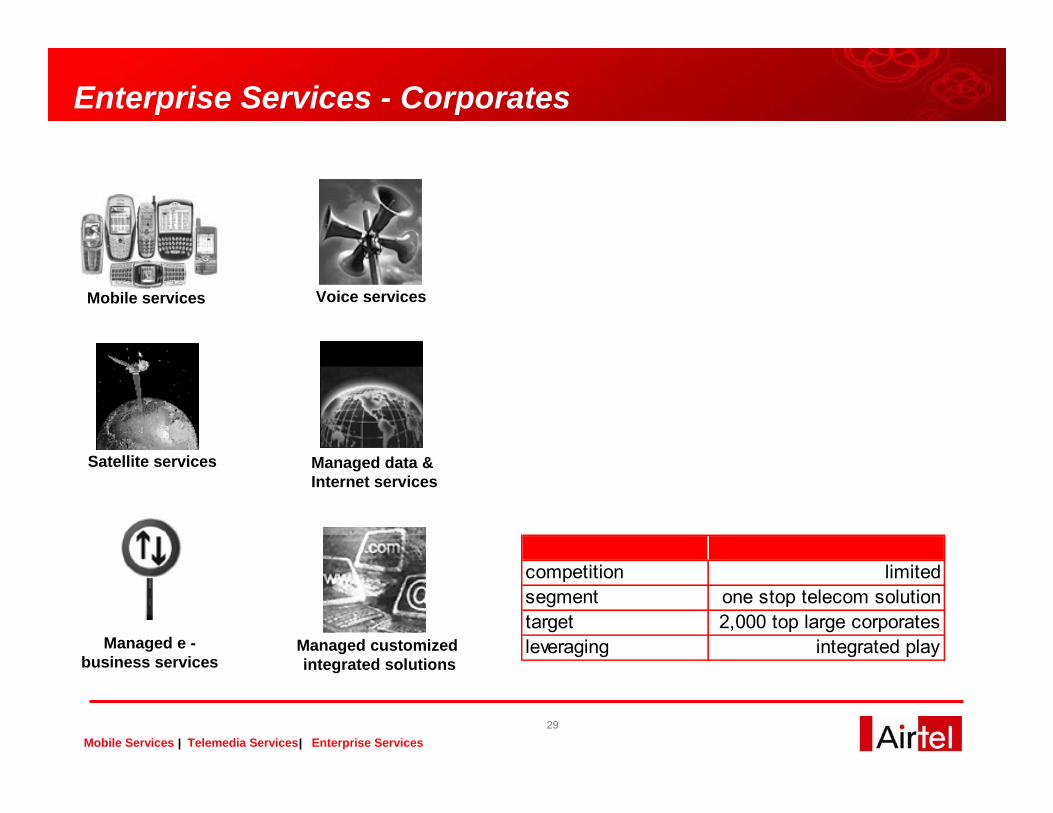
Enterprise Services - Corporates
Voice services
Satellite services Managed data & Internet services
Managed e -business services
Managed customized integrated solutions
Mobile services
competition limitedsegment one stop telecom solutiontarget 2,000 top large corporatesleveraging integrated play
30
Mobile Services Telemedia Services Enterprise Services
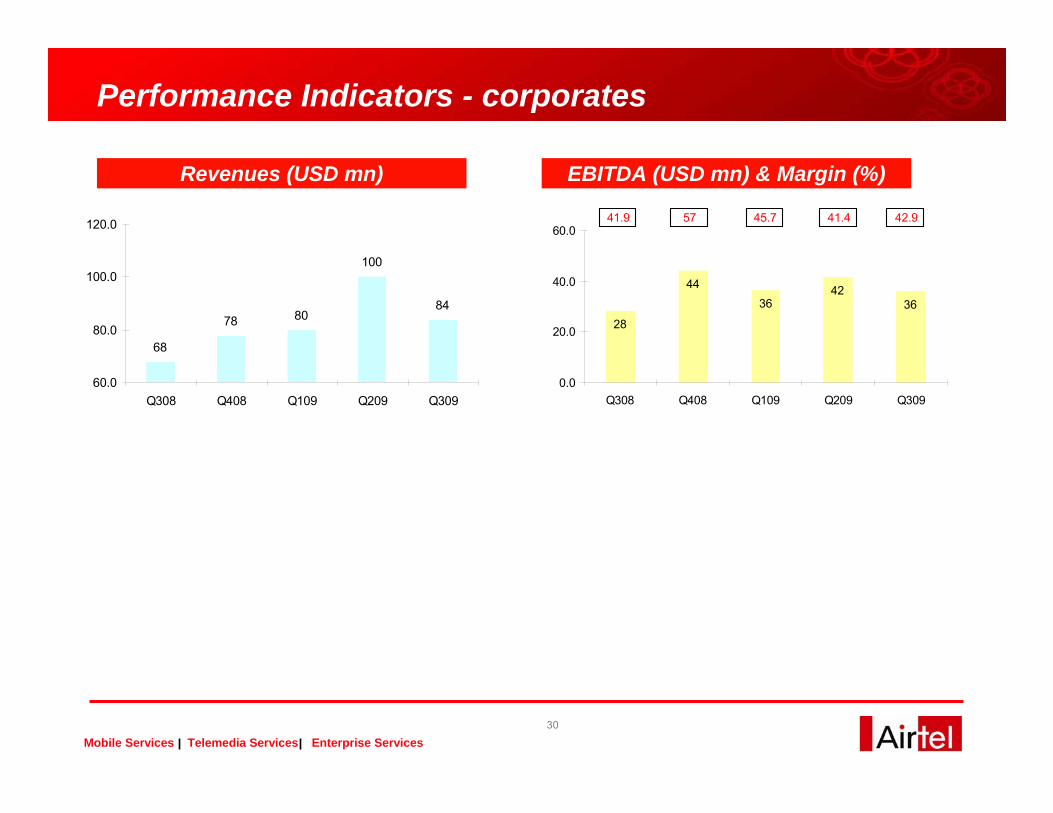
Performance Indicators - corporates
Revenues (USD mn) EBITDA (USD mn) & Margin (%)
68
78 80
100
84
60.0
80.0
100.0
120.0
Q308 Q408 Q109 Q209 Q309
28
4436
4236
0.0
20.0
40.0
60.0
Q308 Q408 Q109 Q209 Q309
41.9 57 45.7 41.4 42.9
31
Mobile Services Telemedia Services Enterprise Services
Passive Infrastructure Services
32
Mobile Services Telemedia Services Enterprise Services
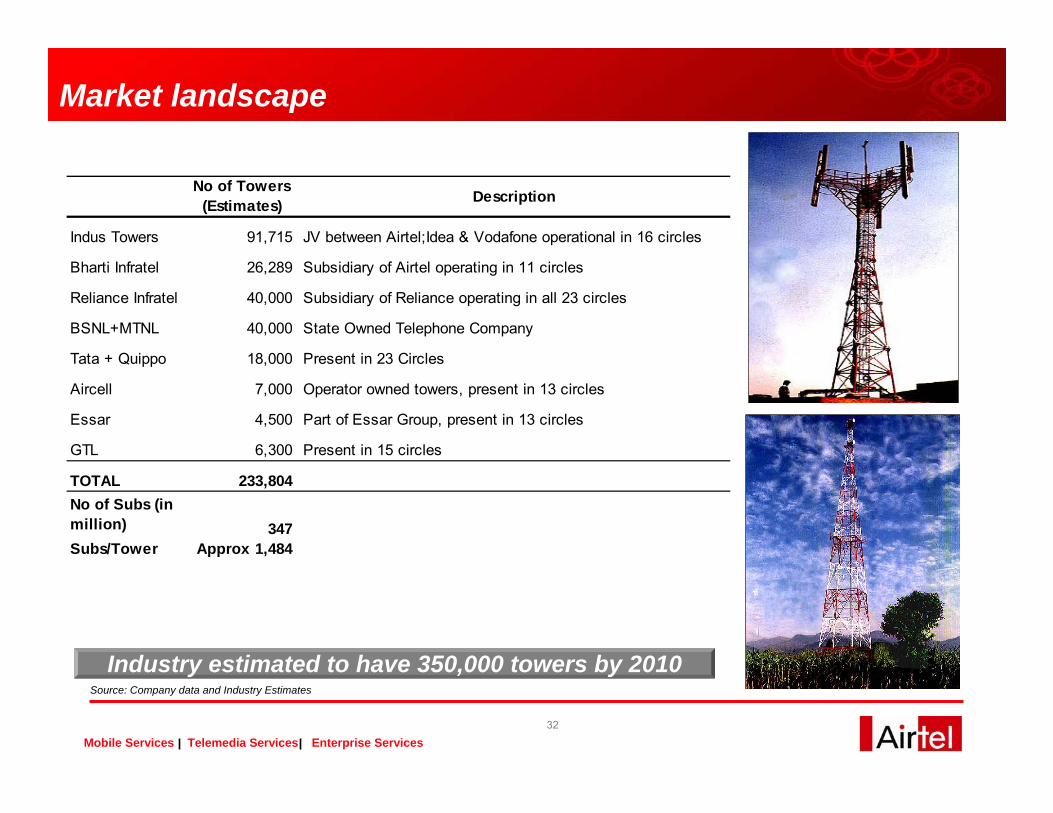
Market landscape
Industry estimated to have 350,000 towers by 2010Source: Company data and Industry Estimates
No of Towers (Estimates) Description
Indus Towers 91,715 JV between Airtel;Idea & Vodafone operational in 16 circles
Bharti Infratel 26,289 Subsidiary of Airtel operating in 11 circles
Reliance Infratel 40,000 Subsidiary of Reliance operating in all 23 circles
BSNL+MTNL 40,000 State Owned Telephone Company
Tata + Quippo 18,000 Present in 23 Circles
Aircell 7,000 Operator owned towers, present in 13 circles
Essar 4,500 Part of Essar Group, present in 13 circles
GTL 6,300 Present in 15 circles
TOTAL 233,804 No of Subs (in million) 347 Subs/Tower Approx 1,484
33
Mobile Services Telemedia Services Enterprise Services
A snapshotBharti Infratel operates in 11 circles.
Indus Tower operates in 16 circles.
Standard Master Services Agreement with competitive rates already in place.
Key focus areas:
To increase sharing factor (tenancy) from current levels of 1.34.
Provide energy optimization solutions and other network management services.
Evaluate other revenue streams.
Key performance Indicators:Sharing Factor: 1.34
Sharing Revenue per sharing operator per month at Rs. 31,488.
EBITDA margin: 33.5%
Aim to be the preferred choice of vendor for all existing and new operators
34
Mobile Services Telemedia Services Enterprise Services
To conclude
35
Mobile Services Telemedia Services Enterprise Services
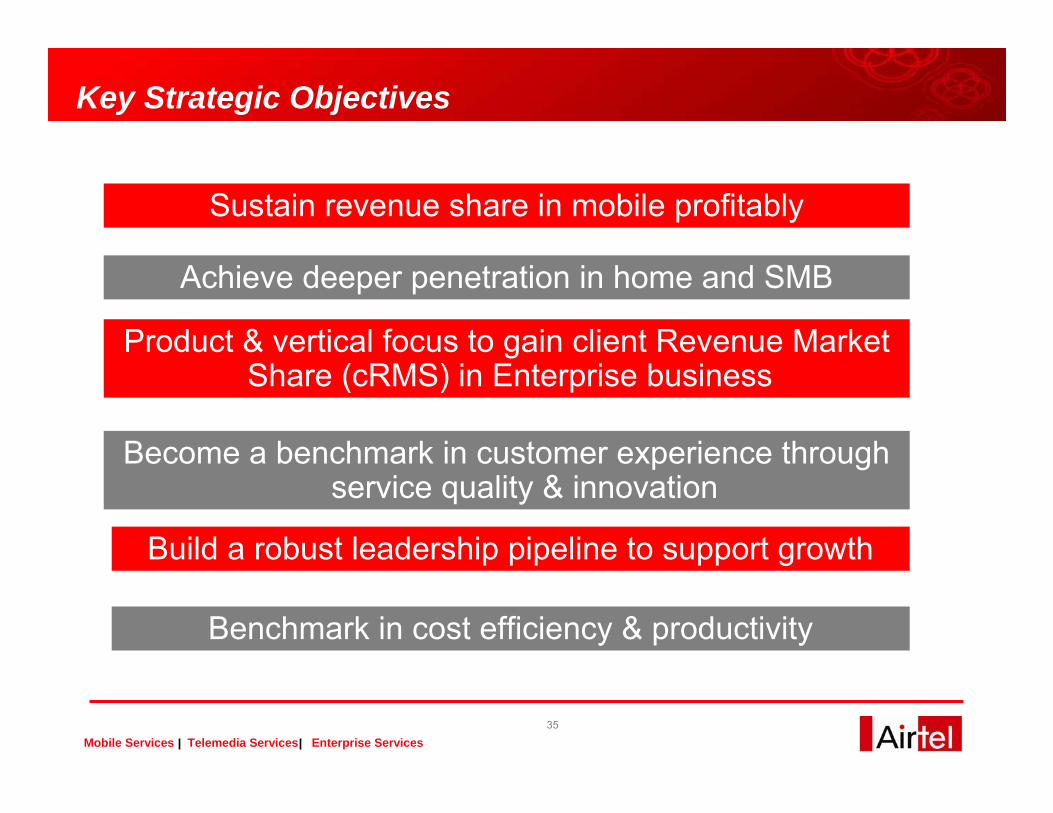
Key Strategic Objectives
Sustain revenue share in mobile profitably
Achieve deeper penetration in home and SMB
Product & vertical focus to gain client Revenue Market Share (cRMS) in Enterprise business
Become a benchmark in customer experience through service quality & innovation
Build a robust leadership pipeline to support growth
Benchmark in cost efficiency & productivity

DisclaimerThe information contained in this presentation is only current as of its date. All actions and statements made herein or otherwise shall be subject to the applicable laws and regulations as amended from time to time. There is no representation that all information relating to the context has been taken care off in the presentation and neither we undertake any obligation as to the regular updating of the information as a result of new information, future events or otherwise. We will accept no liability whatsoever for any loss arising directly or indirectly from the use of, reliance of any information contained in this presentation or for any omission of the information. The information shall not be distributed or used by any person or entity in any jurisdiction or countries were such distribution or use would be contrary to the applicable laws or Regulations. It is advised that prior to acting upon this presentation independent consultation / advise may be obtained and necessary due diligence, investigation etc may be done at your end. You may also contact us directly for any questions or clarifications at our end.
This presentation contain certain statements of future expectations and other forward-looking statements, including those relating to our general business plans and strategy, our future financial condition and growth prospects, and future developments in our industry and our competitive and regulatory environment. In addition to statements which are forward looking by reason of context, the words ‘may, will, should, expects, plans, intends, anticipates, believes, estimates, predicts, potential or continue’ and similar expressions identify forward looking statements.
Actual results, performances or events may differ materially from these forward-looking statements including the plans, objectives, expectations, estimates and intentions expressed in forward looking statements due to a number of factors, including without limitation future changes or developments in our business, our competitive environment, telecommunications technology and application, and political, economic, legal and social conditions in India. It is cautioned that the foregoing list is not exhaustive
This presentation is not being used in connection with any invitation of an offer or an offer of securities and should not be used as a basis for any investment decision.
Investor Relations :- http://www.bhartiairtel.inFor any queries, write to: [email protected]
“The information contained herein does not constitute an offer of securities for sale in the United States. Securities may not be sold in the United States absent registration or an exemption from registration under the U.S. Securities Act of 1933, as amended. Any public offering of securities to be made in the United States will be made by means of a prospectus and will contain detailed information about the Company and its management, as well as financial statements. No money, securities or other consideration is being solicited, and, if sent in response to the information contained herein, will not be accepted.”