Embed Size (px)
Citation preview

PRESENTED TO: PRESENTED BY: PRESENTED ON:
Airport Ground Transportation and Landside SimulationChallenges and Opportunities
Virginia and Washington DC Joint SimCapMeeting
Gustavo Ceballos - Ricondo January 15, 2018
Agenda
Virginia and Washington DC Joint SimCap Meeting - TRB 2019
▪ Simulation as integral part of airport planning process
▪ Typical airport landside components, demand, and simulation tools
▪ Airport landside special simulation cases – Curbside roadways
▪ Airport landside trends and new technologies
– Impacts of TNCs and AV/CV
2

Elements of the Airport System
▪ Airfield
▪ Terminal
▪ Landside
Virginia and Washington DC Joint SimCap Meeting - TRB 2019 3

Simulation Tools Typically Used in Airport Planning
Runway Delay Simulation Model
(RDSIM)
Airport Delay Simulation Model (ADSIM)
Airport and Airspace Simulation Model
(SIMMOD)
ATAC’s Simmod PLUS! and PRO!
AirportTools’ Visual SIMMOD
Jeppesen’s Total Airspace and Airport
Modeler (TAAM)
AirTOpsoft’s Air Traffic Optimization
(AirTOp)
Comprehensive Airport Simulation
Technology (CAST)
Fast-time airport terminal, airside and
landside simulation (ARCport)
Comprehensive Airport Simulation
Technology (CAST)
Fast-time airport terminal, airside and
landside simulation (ARCport)
Airport Passenger Flows (INCONTROL)
Terminal Simulation Software
(ServiceModel)
Simulation Software (ARENA )
Simulation and Modeling Software
(LEGION)
PTV Group Pedestrian Simulation
(VisWalk)
Event Discrete Model
Comprehensive Airport Simulation
Technology (CAST)
Fast-time airport terminal, airside and
landside simulation (ARCport)
Stochastic Microsimulation Models
PTV VISSIM
AIMSUN
Others…
Virginia and Washington DC Joint SimCap Meeting - TRB 2019 4

The Landside Component of the Airport System
Virginia and Washington DC Joint SimCap Meeting - TRB 2019
▪ Airport = Intermodal Facility
– “inter” fr. L. = between
– “modal” fr. L. = manner
– “intermodal facility” = one between two
manners of transportation
– Without the landside, there is no other mode
▪ Integration
– Basic competition for scarce physical space
– Interconnected parts of same system
– People and vehicles
SOURCE: Los Angeles World Airports – Official website. Future pedestrian plaza with the People Mover train above. Pedestrian plaza with an
LED curtain wall. Entrance to the Intermodal Transportation Facility
5

The Landside System
Virginia and Washington DC Joint SimCap Meeting - TRB 2019
Access and
Circulation
Roadways
Curbside
Roadways
Parking
garages and
lots (employee,
public)
Rental car
facilities
CV facilities
(curbs, roads,
staging areas,
passenger
waiting areas)
Rail transit
facilities
Ground
transportation
centers
Cargo areas
and other
airport ancillary
facilities
SOURCE: Imaginary © 2018 Google. Landsat / Copernicus. Dana SIO. NOAA. U.S. Navi. NGA. GEBCO. Map data 2018 Google © - Hartsfield-
Jackson Atlanta International Airport – CONRAC Facility and Automated People Mover
6

Landside Simulation – Demand Estimates
Virginia and Washington DC Joint SimCap Meeting - TRB 2019
▪ Driven mostly by passenger activity
▪ Different peaking patterns with off-airport
roadways
▪ Different peaking patterns for different landside
facilities
– Access and circulation
– Parking
– Curbside
– Rental Car
– Employee facilities
– Cargo Facilities
▪ Sub-modal behaviors
7

Landside Simulation – Demand Estimates
Virginia and Washington DC Joint SimCap Meeting - TRB 2019
Demand Levels
▪ Peak of the peak (e.g., Thanksgiving week)?
▪ Average day of the average month?
▪ Average day of the peak month?
▪ Busy day of the peak month?
▪ Facility peak? (e.g., curbside vs. parking)
▪ Off-airport roadway peak?
Design Hour
▪ Number of enplaned and deplaned passengers departing
or arriving on aircraft in an elapsed hour of a typically
busy (design) day.
▪ Typically does not correspond exactly to a clock hour
such as 7:00–7:59 but usually overlaps two clock hours
(e.g., 7:20–8:19), reflecting airline scheduling patterns.
Typical Approach for Roadway Planning
▪ 90th or 95th percentile busiest hour of the year
▪ The peak hour of the average day of the peak month
(PHADPM)
▪ Peak hour of the busiest day in a week of the peak
month
▪ Specific peak hour by facility (for facility planning)0
200
400
600
800
1,000
1,200
1,400
1,600
1,800
12:0
0 A
M
12:3
0 A
M
1:0
0 A
M
1:3
0 A
M
2:0
0 A
M
2:3
0 A
M
3:0
0 A
M
3:3
0 A
M
4:0
0 A
M
4:3
0 A
M
5:0
0 A
M
5:3
0 A
M
6:0
0 A
M
6:3
0 A
M
7:0
0 A
M
7:3
0 A
M
8:0
0 A
M
8:3
0 A
M
9:0
0 A
M
9:3
0 A
M
10:0
0 A
M
10:3
0 A
M
11:0
0 A
M
11:3
0 A
M
12:0
0 P
M
12:3
0 P
M
1:0
0 P
M
1:3
0 P
M
2:0
0 P
M
2:3
0 P
M
3:0
0 P
M
3:3
0 P
M
4:0
0 P
M
4:3
0 P
M
5:0
0 P
M
5:3
0 P
M
6:0
0 P
M
6:3
0 P
M
7:0
0 P
M
7:3
0 P
M
8:0
0 P
M
8:3
0 P
M
9:0
0 P
M
9:3
0 P
M
10:0
0 P
M
10:3
0 P
M
11:0
0 P
M
11:3
0 P
M
Veh
icle
s
Inbound Outbound Terminal A Terminal B
11:15 AM-12:15 PM
Overall Airport Peak
4:45 AM-5:45 AM
Terminal B
Departures Peak
12:15 PM-1:1 5PM
Overall Terminal A Peak
9:00 PM – 10:00 PM
Terminal B
Arrivals Peak
8
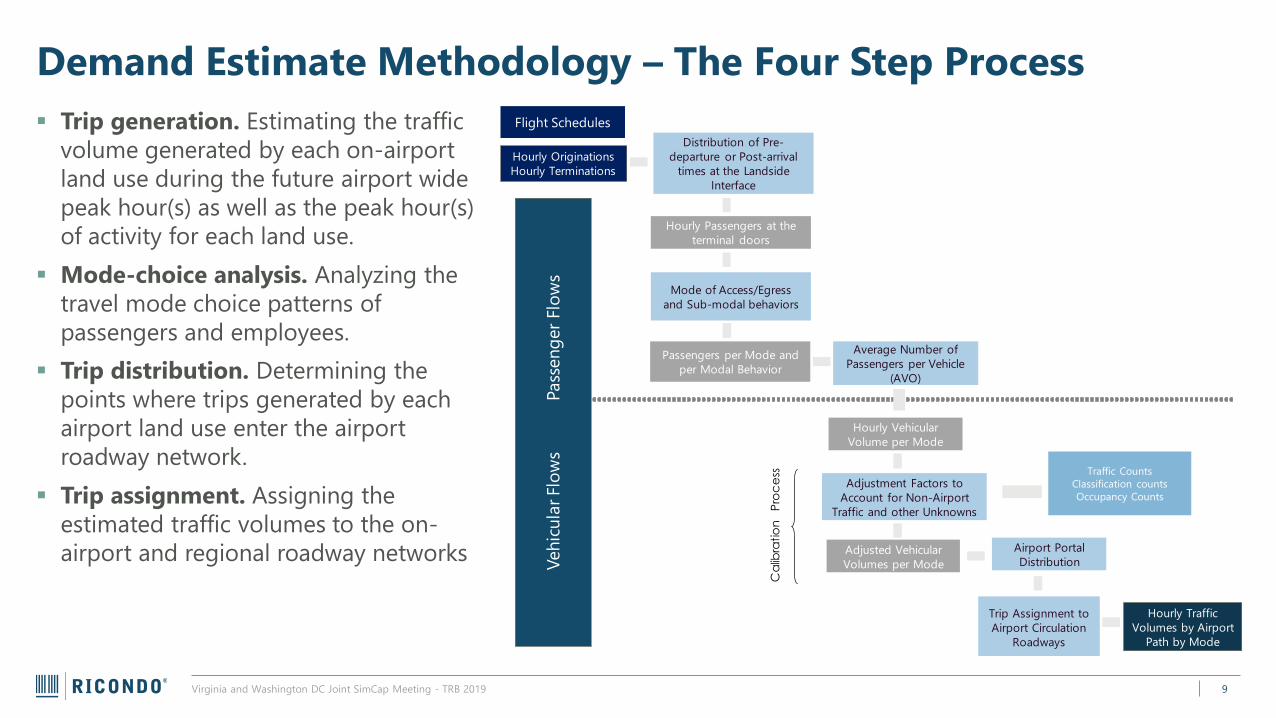
Demand Estimate Methodology – The Four Step Process
Virginia and Washington DC Joint SimCap Meeting - TRB 2019
▪ Trip generation. Estimating the traffic
volume generated by each on-airport
land use during the future airport wide
peak hour(s) as well as the peak hour(s)
of activity for each land use.
▪ Mode-choice analysis. Analyzing the
travel mode choice patterns of
passengers and employees.
▪ Trip distribution. Determining the
points where trips generated by each
airport land use enter the airport
roadway network.
▪ Trip assignment. Assigning the
estimated traffic volumes to the on-
airport and regional roadway networks
Hourly Originations
Hourly Terminations
Distribution of Pre-
departure or Post-arrival
times at the Landside
Interface
Hourly Passengers at the
terminal doors
Mode of Access/Egress
and Sub-modal behaviors
Passengers per Mode and
per Modal Behavior
Veh
icu
lar
Flo
ws
Pass
en
ger
Flo
ws
Average Number of
Passengers per Vehicle
(AVO)
Hourly Vehicular
Volume per Mode
Adjustment Factors to
Account for Non-Airport
Traffic and other Unknowns
Adjusted Vehicular
Volumes per Mode
Airport Portal
Distribution
Trip Assignment to
Airport Circulation
Roadways
Hourly Traffic
Volumes by Airport
Path by Mode
Ca
libra
tio
n P
roc
ess
9
Traffic Counts
Classification counts
Occupancy Counts
Flight Schedules

Users of the Airport Roadways
Virginia and Washington DC Joint SimCap Meeting - TRB 2019
AUTOS
▪ Private Vehicles (POV)
▪ Rental Car Vehicles
(RAC)
▪ App –based Shared
Rides (TNC)
COMMERCIAL VEHICLES
SERVICE VEHICLES
OTHER
▪ Taxis/limos (On
demand, reserved)
▪ Courtesy bus (hotel,
rental car, etc.)
▪ Door-to-door vans
▪ Airport parking
shuttles
▪ Employee parking
shuttles
▪ Off-airport parking
▪ Charter buses
▪ Employee buses ▪ Delivery vehicles
▪ Rail
▪ Public transit
▪ APM
10

Commercial Vehicles – Types of Operation
Virginia and Washington DC Joint SimCap Meeting - TRB 2019
ON-DEMAND
▪ Taxis
▪ Limousines
▪ Door-to-door vans
▪ Charter buses
▪ Misc. service vehicles
FIXED OR POLICY HEADWAYS
▪ RAC shuttles
▪ Parking shuttles
▪ Hotel shuttles
▪ Transit buses
▪ Intercity buses
11

Airport Roadways
Virginia and Washington DC Joint SimCap Meeting - TRB 2019
HIERARCHY OF AIRPORT
ROADWAY CLASSIFICATIONS
▪ Terminal Area Roadways
– Terminal approach roadways
– Curbside roadways
– Private vehicle roads
– Commercial vehicle roads
▪ Driveways and facility internal circulation
▪ Special roadways (e.g. parking entry and
exit plazas,
▪ Recirculation roadway
▪ Service roadways
▪ Access roads
▪ Regional roadway network (off airport)
12

What Makes Airport Roadway Operations Unique?
Virginia and Washington DC Joint SimCap Meeting - TRB 2019
▪ Low speed uninterrupted flow
▪ A high proportion of unfamiliar
motorists
▪ Large number of complex
directional signs
▪ Stressful conditions
▪ High proportion of large
vehicles
▪ Mix of experienced and
inexperienced drivers
13
SOURCE: VISSIM Animation for Existing Conditions, AM Peak Hour Operation at Doha International Airport – DRAFT – For illustration purposes only. Ricondo, 2018

What Makes Airport Roadway Operations Unique?
Virginia and Washington DC Joint SimCap Meeting - TRB 2019
▪ Recirculating traffic
▪ Inconsistent driver behavior,
large speed differentials
▪ Different peaking patterns
compared to commuter off-
airport roads patterns
▪ Greater amount of weaving
and merging
▪ Most Federal/State design
standards are not applicable
14
SOURCE: Miami International Airport – Taxi and TNC Relocation Options – PM Peak Hour Operation – DRAFT VISSIM Animation – For illustration purposes only. Ricondo, 2018

Airport Landside – Simulation Special Cases
▪ Curbside Roadways
– Driver behavior
– Curbside attractiveness, signage
– Dwell time distributions
– Pedestrian interaction
– MOEs
▪ Commercial Vehicle Facilities
– Staging areas, dispatching mechanisms
– Waiting areas, Ground Transportation Center (GTC)
– Curb allocation and operational protocols
▪ Parking Facilities
– Public vs. Employee
– Entry and Exist Plazas, internal circulation, parking capacity, searching
algorithms
▪ Rental Car Facilities
– Ready and return areas, QTA, circulation, car shuttlers, pedestrian
interaction
Virginia and Washington DC Joint SimCap Meeting - TRB 2019

Curbside Roadways – A Special Case for Simulation
Virginia and Washington DC Joint SimCap Meeting - TRB 2019
▪ Terminal approach and curbside
roadways
▪ Terminal frontage sidewalk
▪ Curbside check-in
▪ Levels, segregation of traffic
▪ Inner and Outer, Islands
▪ Curb allocation
▪ Pedestrian crossings
▪ Curb management, enforcement
▪ Security
16

Graphical Depiction of Curbside Congestion
Virginia and Washington DC Joint SimCap Meeting - TRB 2019
SOURCES: Ricondo & Associates, Inc., based on information published by the Transportation Research Board (TRB), ACRP Report 40,
Airport Curbside and Terminal Area Roadway Operations, Washington DC, 2010, and Federal Aviation Administration (FAA) Advisory
Circular 150/5360-13, Planning and Design Guidelines, January 19, 1994.
CURBSIDE UTILIZATION LOS RANGES
LOSSINGLE LANE LOADING DOUBLE LANE LOADING DESCRIPTION
A 0% - 70% 0% - 90% EXCELLENT: Drivers experience no interference from pedestrians or other motorist
B 71% - 85% 91% - 110% VERY GOOD: Relatively free flow conditions with limited double parking
C 86% - 100% 111% - 130% GOOD: Double parking near doors is common with some intermittent triple parking
D 101% - 115% 131% - 170% FAIR: Vehicle maneuverability restricted due to frequent double/triple parking
E 116% - 130% 171% - 200% POOR: Significant delays and queues; double/triple parking throughout curbside
F >131% >201% FAILURE: Motorists unable to access/depart curbside; significant queuing along entry road
Curbside LOS – Dual Lane Loading
Curbside Utilization = Required Curb Length
Available Curb LengthX 100
17

Curbside Simulation Analysis – Case Study – SMF Terminal A
Virginia and Washington DC Joint SimCap Meeting - TRB 2019
Terminal A Peak: 12:15 PM – 1:15 PM
Average Speed (mph)
Speed (mph)
SOURCE: Prepared by Ricondo & Associates, Inc., VISSIM 9
0%
6%
1%
1%
5%
1%
1%
5%
1%
10%
5%
1%
24%
5%
1%
2%
5%
1%
15%
5%
1%
1%
5%
1%
6%
5%
1%
2%
6%
1%
2%
4%
1%
16%
5%
1%
1%
5%
1%
5%
5%
1%
1%
5%
1%
1%
5%
1%
1%
5%
1%
1%
5%
1%
1%
5%
0%
1%
6%
1%
1%
5%
1%
1%
5%
1%
1%
5%
1%
1%
5%
1%
0%
5%
0%
0%
6%
0%
Departures ArrivalsDepartures Arrivals
Terminal A
NOT TO SCALE
NORTH
Inner
Roadway
Outer Roadway
0%
0%
0%
2%
18%
0%
0%
1%
11%
9%
23%
1%
7%
9%
7%
76%
13%
11%
3%
6%
66%
22%
7%
3%
6%
47%
12%
4%
2%
4%
33%
13%
4%
2%
4%
80%
19%
4%
1%
4%
99%
32%
7%
2%
5%
38%
36%
15%
14%
7%
2%
8%
3%
7%
2%
18%
8%
2%
7%
2%
54%
9%
1%
7%
2%
40%
10%
1%
8%
3%
91%
12%
2%
11%
5%
85%
7%
1%
8%
4%
63%
6%
1%
9%
4%
18%
3%
2%
9%
5%
16%
1%
1%
10%
5%
5%
0%
1%
13%
6%
4%
0%
0%
11%
5%
4%
0%
0%
11%
5%
4%
0%
0%
11%
5%
5%
0%
0%
11%
5%
6%
0%
0%
12%
5%
5%
0%
0%
8%
4%
Parking Garage
DIRECTION OF TRAVEL
Curbside Parking Spot Occupancy
18

Curbside Reporting – Case Study – ATL TNC Reallocation
Virginia and Washington DC Joint SimCap Meeting - TRB 2019
0%
20%
40%
60%
80%
100%
120%
140%
21:4
5
21:4
8
21:5
1
21:5
4
21:5
7
22:0
0
22:0
3
22:0
6
22:0
9
22:1
2
22:1
5
22:1
8
22:2
1
22:2
4
22:2
7
22:3
0
22:3
3
22:3
6
22:3
9
22:4
2
22:4
5
22:4
8
22:5
1
22:5
4
22:5
7
Uti
lizati
on
Rate
Simulation Time (Hour:Minutes)
TNC North Lower Curb Zone
LOS F LOS E LOS D LOS C LOS B LOS A
0
20
40
60
Tim
e (
Min
ute
s)
TNC North Curb Zone - Peak Hour
LOS Distribution
LOS A
LOS B
LOS C
LOS D
LOS E
LOS F
Statistics LOS
Average Utilization 85% B
85th % Utilization 107% D
LOS Distribution Time (min)
LOS A 16
LOS B 22
LOS C 13
LOS D 7
LOS E 2
LOS F 0
ATL Domestic Terminal - North Curb – Lower Level
19

VISSIM Curb Output Tool – COT – Beta version
Virginia and Washington DC Joint SimCap Meeting - TRB 2019 20
▪ Tool computes parking occupancy
(number of vehicles parked) by parking
zone
▪ Allows user to determine data collection
period and aggregation period
▪ Export results to a spreadsheet for quickly
post-processing of results

Airport Curbside Simulation – Opportunities for Improvements
▪ Coordination and cooperation with PTV for VisAir
Landside Demand Generator
▪ Development of new COM tools for enhancing:
– VISSIM Curb operation behaviors
– Parking and maneuvering
– Dwelling strategies
– Operation at saturation conditions
– Dynamic signing
– CV/AV
– MOE outputs
▪ Need for specific curbside behaviors based on observed
curbside vehicle trajectories
Virginia and Washington DC Joint SimCap Meeting - TRB 2019 21

Airport Landside Simulation Special Cases – Rental Car Facilities
Virginia and Washington DC Joint SimCap Meeting - TRB 2019 22
▪ RAC Model needs to:
– Calculate operating capacity of RAC components
– Measure impacts on customer service levels as operating conditions change

The transportation
revolution
Virginia and Washington DC Joint SimCap Meeting - TRB 2019
Mobility as a
Service
Electric
Vehicles
Autonomous
Vehicles
Self-driving drone
taxis
Maglev trains
Hyperloop
transportation
systems
Satellite-based air
traffic control
systems
Self-driving electric
buses
Elevated buses
Flying hotel pods
Smart roads
Ground level
pedestrian lights SOURCE: :
23

Challenges and opportunities facing airport operators?
Virginia and Washington DC Joint SimCap Meeting - TRB 2019
Storage,
staging
sites?
Operating
Rules, regs,
and
restrictions?
Ownership?
Impacts on
airport and
landside
activity ?
AV and non-
AV mixed
operations?
Maintenance
responsibilities
Curbside
operations?
What will be the Impacts of AV on
Airport Facilities and Operations?What do we do with TNCs?
Storage,
staging
sites?
Operating
Rules, regs,
and
restrictions?
Use of
geofences?
Impacts on
airport and
landside
activity ?
Enforcement
/tracking
methods?
Changes in the
use of other
modes?
Drop-
off/pick-up
curbside
operations?
24

PRESENTED TO: PRESENTED BY: PRESENTED ON:
Questions?
Virginia and Washington DC Joint SimCapMeeting
Gustavo Ceballos - Ricondo January 15, 2018