Embed Size (px)
Citation preview
Virginia Tech 1 of 51
Airport and Airspace Operations in theUS (Air Traffic Control)
Dr. Antonio A. TraniAssociate Professor
Department of Civil Engineering
Virginia Tech
Virginia Tech 2 of 51
Discussion fo Flight Rules
Flight Rules
• IFR - instrument flight rules (ATC controlled flights)
• VFR - visual flight rules (> 3 nm visibility and 1000 ft from clouds)
Weather conditions
• VMC - visual meteorological conditions
• IMC - instrument meteorological conditions
An airliner could fly in VMC conditions but always under IFR flight plan rules
Virginia Tech 3 of 51
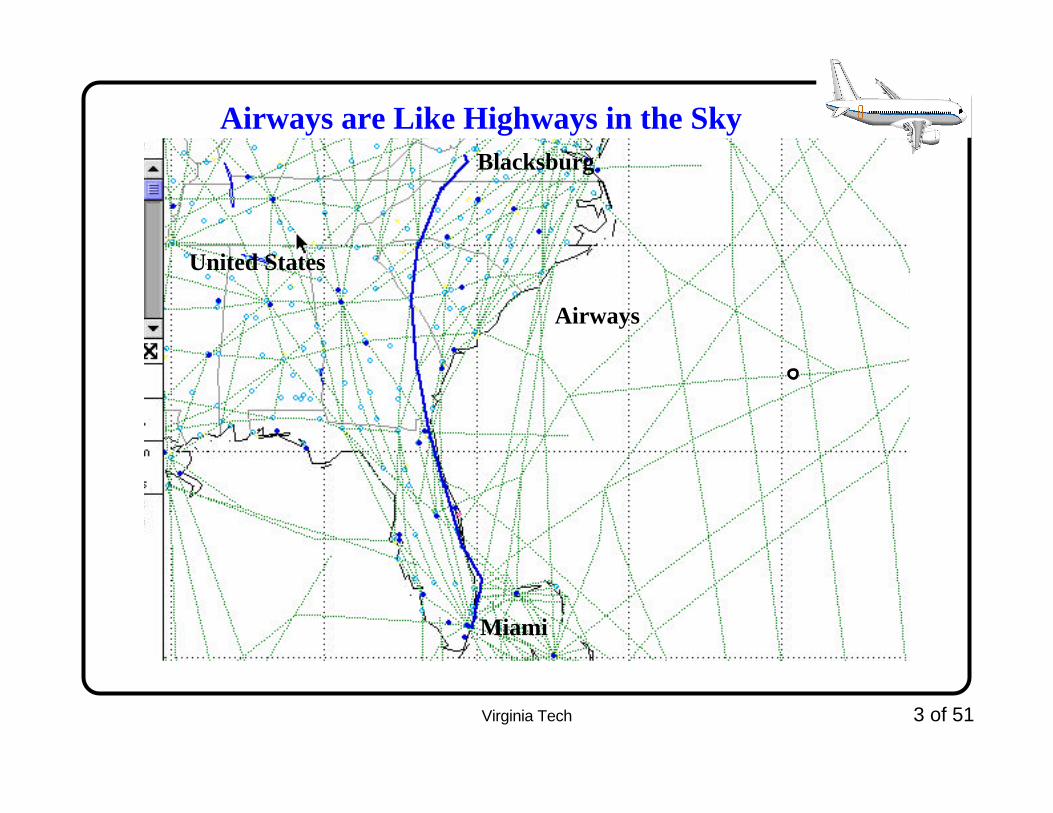
Airways are Like Highways in the Sky
United States
Blacksburg
Miami
Airways
Virginia Tech 4 of 51
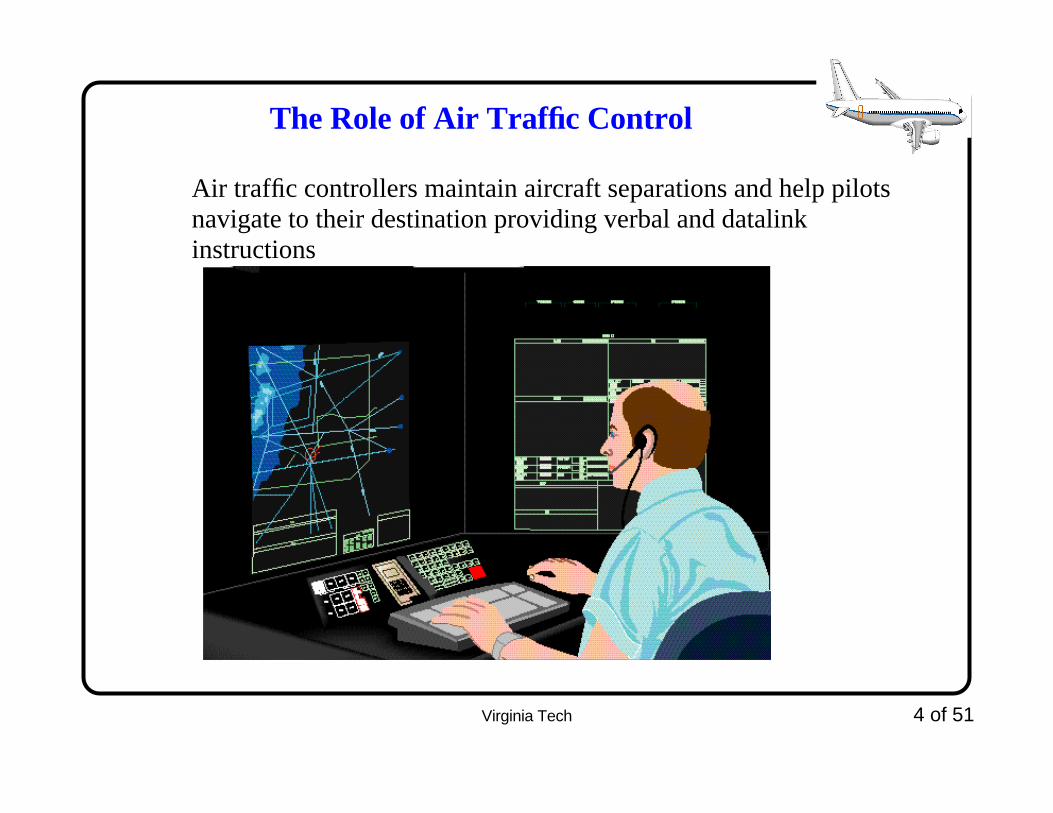
The Role of Air Traffic Control
Air traffic controllers maintain aircraft separations and help pilots navigate to their destination providing verbal and datalink instructions
Virginia Tech 5 of 51
Classification of ATC Services
There are 3 control components of ATC and one support component. These components interact all time among themselves via telephone or microwave data links.
Control Components:
• Air Route Traffic Control Centers (ARTCC)
• Terminal Approach Control Facility (TCA - TRACON)
• Airport Traffic Control Tower (ATCT)
Support Component (Information)
• Flight Service Stations (FSS)

Virginia Tech 6 of 51
Air Traffic Control Tower
• Control aircraftl traffic (both arrivals and departures) at the airport (includes ramps near gates, taxiways, runways, and airspace up to 5 nm from airport)
• Three controller posts
- Local controller (runways and landing areas)
- Ground control (taxiways and aprons)
- Clearance delivery (provides information on flight plans)
• Some ATCT divide workload into East-West operations
• Use of short and precise language
- AA52 taxi to RWY 36 via alpha-3
- UA53 clear for takeoff, wind 040 at 12
- Aeromexico clear to land RWY 36

Virginia Tech 7 of 51
ATC Wake Vortex Separations
IFR In-trail Separations Near Runways in nautical miles for Medium and Small Size Hub Airports
IFR In-trail Separations Near Runways in nautical miles for Large Size Hub Airports
LEAD
ACFT.
Trailing Aircraft
HEAVY LIGHT SMALL
HeavyLightSmall
4.003.003.00
5.003.003.00
6.004.003.00
LEAD
ACFT.
Trailing Aircraft
HEAVY LIGHT SMALL
HeavyLightSmall
4.002.502.50
5.002.502.50
6.004.002.50

Virginia Tech 8 of 51
TRACON Facilities
• Control terminal traffic (both arrivals and departures)
• Typically 50-80 nm from the aircraft
• Some TRACONS control more than one airport (SW California)
• TRACONs are divided into sectors to ease workload for controllers
• TRACONs “meter” traffic approaching an airport facility
• Heavy use of verbal advisories (“vectors”)
- AA52 turn right heading 120
- UA53 descent and maintain 170 (17,000 ft)
- Aeromexico reduce to 230 (IAS airspeed)
• Minimum separation inside TRACON is either 5 nm (>40 nm from radar antenna) or 3 nm (if < 40 nm from radar antenna)
Virginia Tech 9 of 51
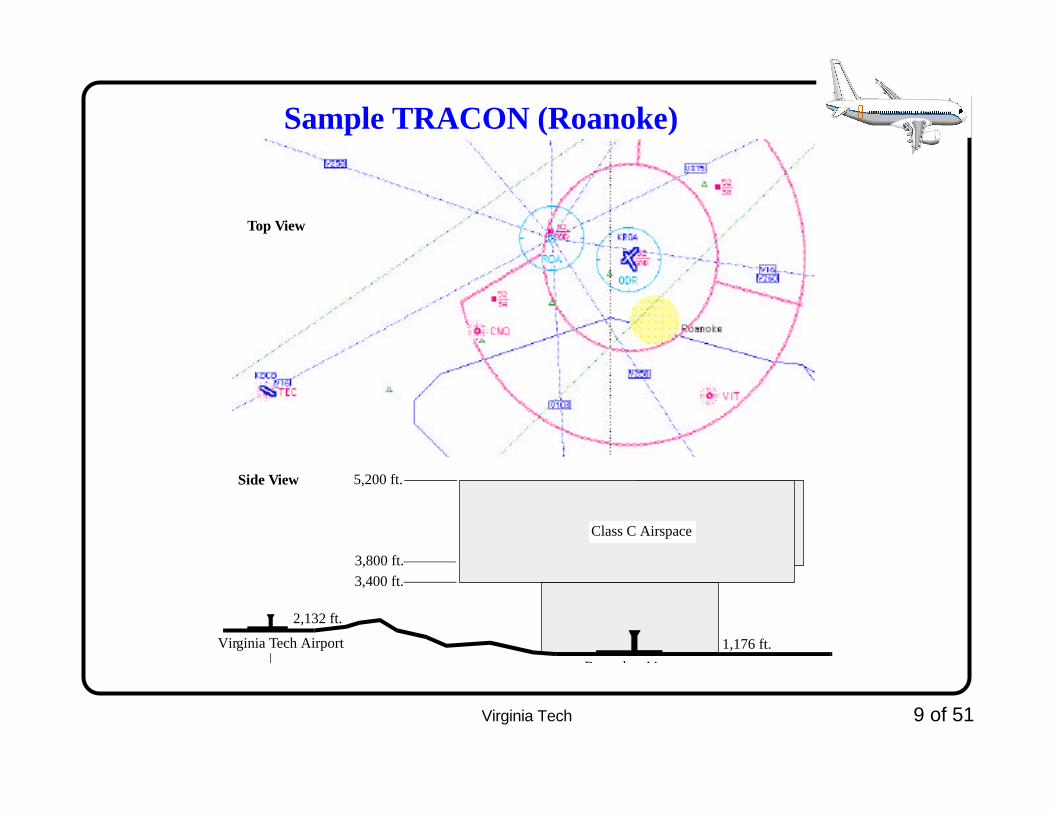
Sample TRACON (Roanoke)
Top View
Class C Airspace
Roanoke Aiport
Virginia Tech Airport
5,200 ft.
3,400 ft.
3,800 ft.
1,176 ft.
2,132 ft.
Side View
Virginia Tech 10 of 51
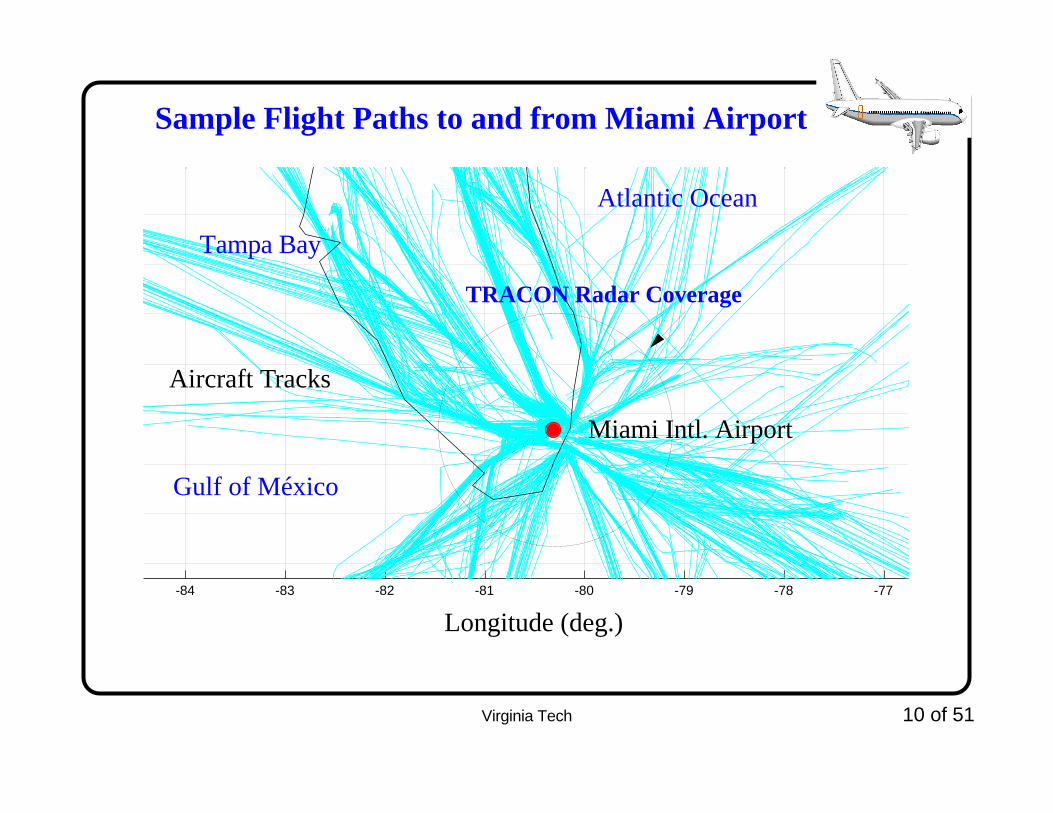
Sample Flight Paths to and from Miami Airport
-84 -83 -82 -81 -80 -79 -78 -77
Longitude (deg.)
Miami Intl. Airport
Aircraft Tracks
Tampa Bay
Gulf of México
Atlantic Ocean
TRACON Radar Coverage
Virginia Tech 11 of 51
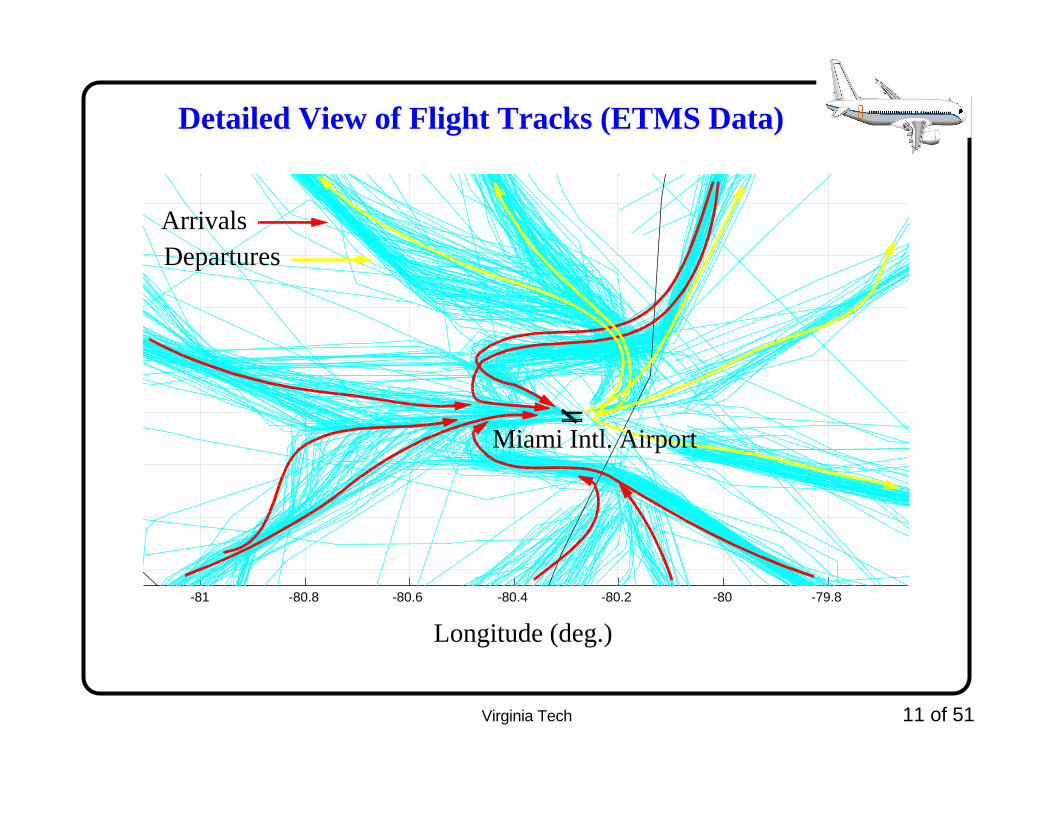
Detailed View of Flight Tracks (ETMS Data)
-81 -80.8 -80.6 -80.4 -80.2 -80 -79.8
Longitude (deg.)
Miami Intl. Airport
ArrivalsDepartures
Virginia Tech 12 of 51
US Air Route Traffic Control Centers (ARTCC
• Twenty continental ARTCC facilities
• 30-50 sectors (horizontal and vertical) in each ARTCC
• Control over 250-300 nm from radar sites (use of multiple radars to track targests at long distances)
• Longitudinal separation is typically enforced as in-trail

Virginia Tech 13 of 51
Enroute Control Sectors in the US
• A well organized and hiererchical system
• Communications are via Voice channels
Virginia Tech 14 of 51
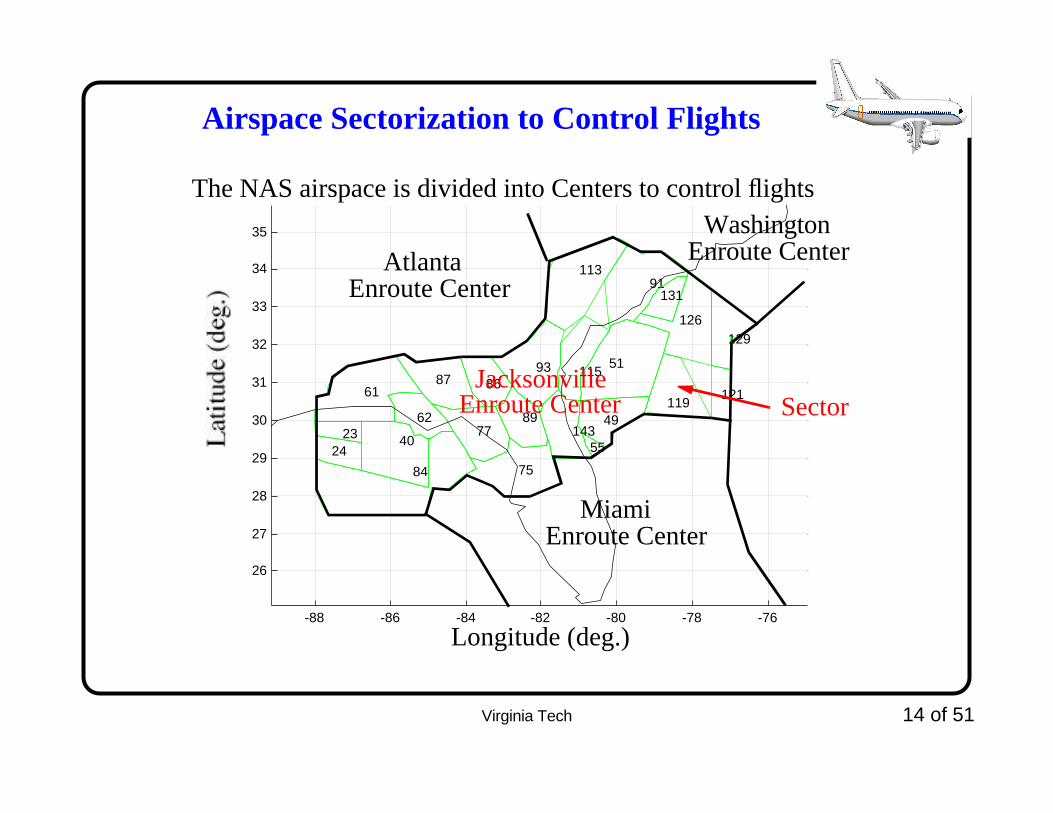
Airspace Sectorization to Control Flights
The NAS airspace is divided into Centers to control flights
-88 -86 -84 -82 -80 -78 -76
26
27
28
29
30
31
32
33
34
35
2324
40
49
51
55
61
62
75
77
84
8687
89
91
93
113
115
119121
126129
131
143
Longitude (deg.)
JacksonvilleEnroute Center
AtlantaEnroute Center
MiamiEnroute Center
Sector
WashingtonEnroute Center
Virginia Tech 15 of 51
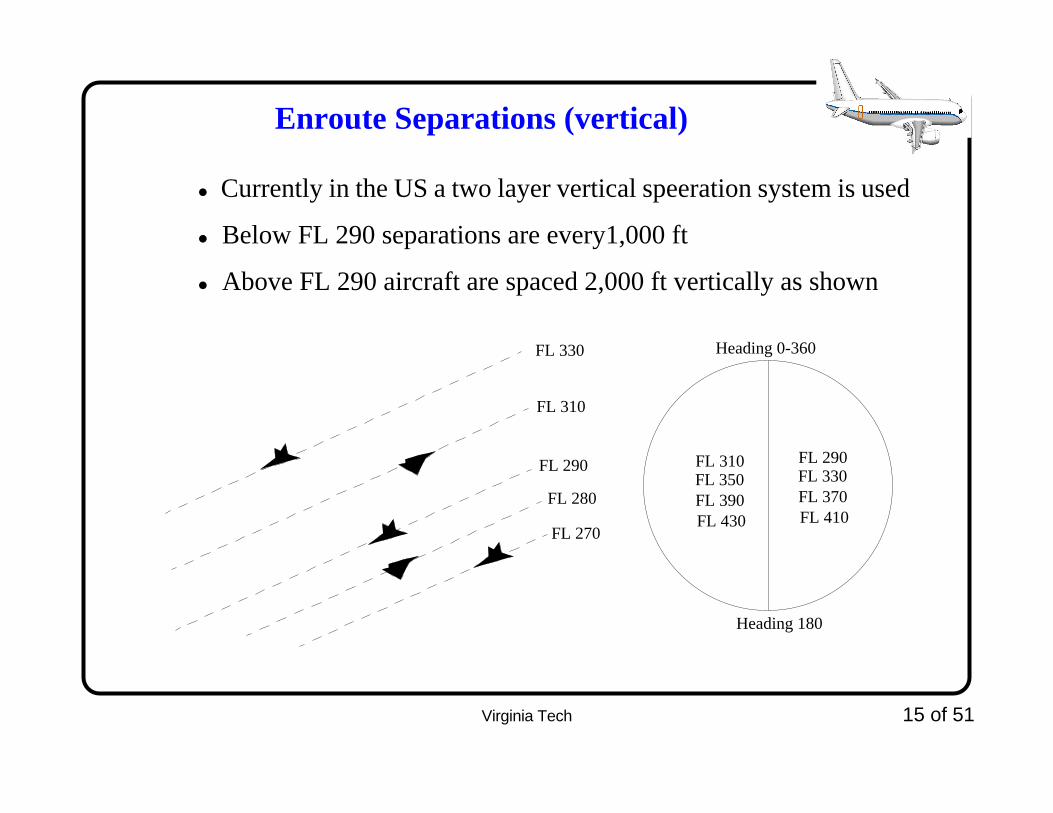
Enroute Separations (vertical)
• Currently in the US a two layer vertical speeration system is used
• Below FL 290 separations are every1,000 ft
• Above FL 290 aircraft are spaced 2,000 ft vertically as shown
FL 290
FL 310
FL 330
FL 280
FL 270
Heading 0-360
Heading 180
FL 290FL 330FL 370FL 410
FL 310FL 350FL 390FL 430
Virginia Tech 16 of 51
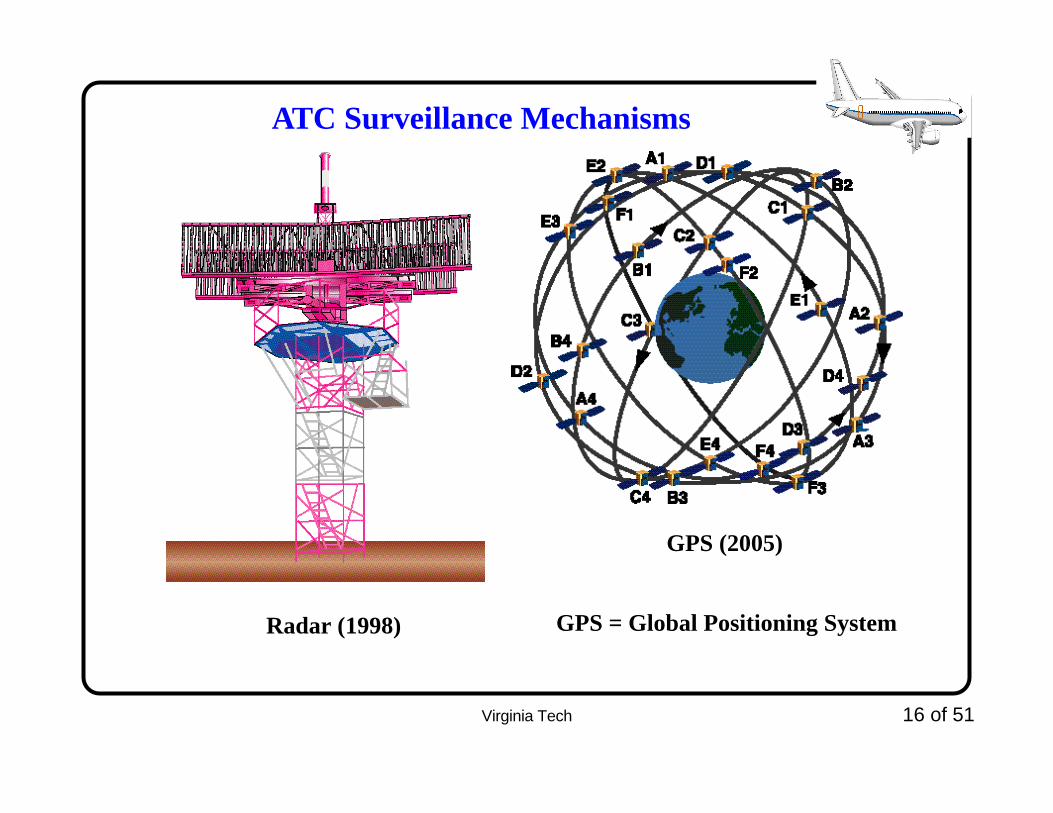
ATC Surveillance Mechanisms
Radar (1998)
GPS (2005)
GPS = Global Positioning System
Virginia Tech 17 of 51
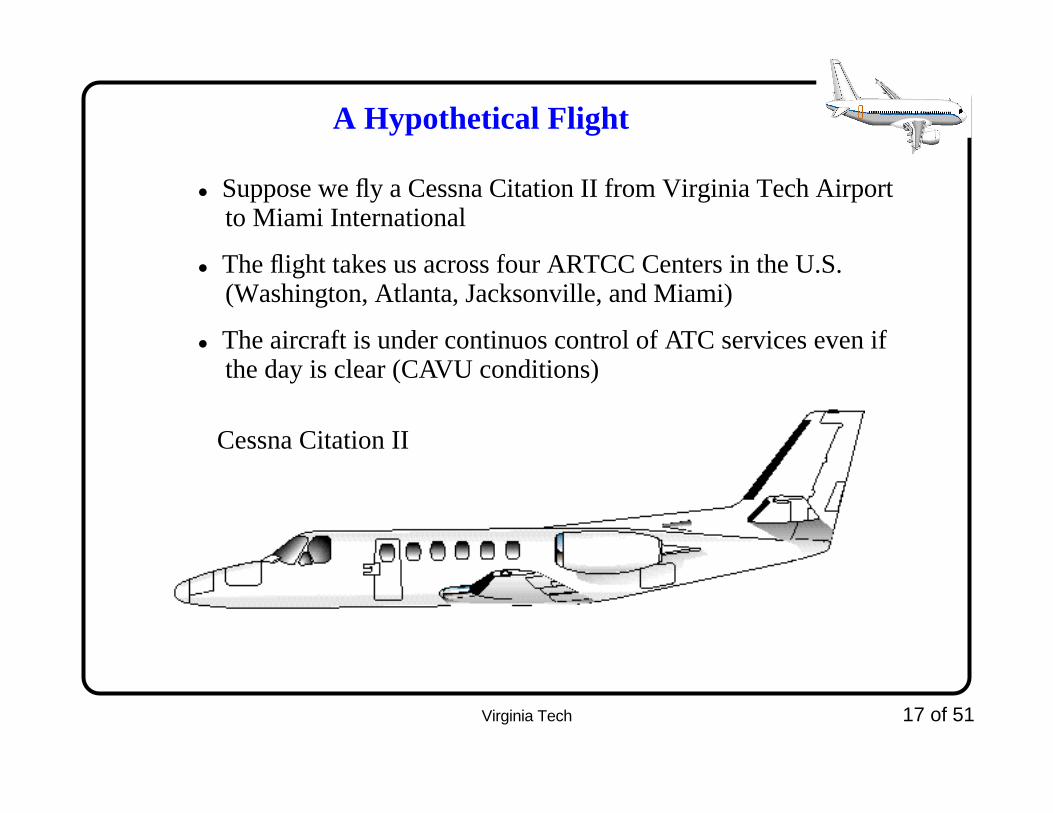
A Hypothetical Flight
• Suppose we fly a Cessna Citation II from Virginia Tech Airport to Miami International
• The flight takes us across four ARTCC Centers in the U.S. (Washington, Atlanta, Jacksonville, and Miami)
• The aircraft is under continuos control of ATC services even if the day is clear (CAVU conditions)
Cessna Citation II
Virginia Tech 18 of 51
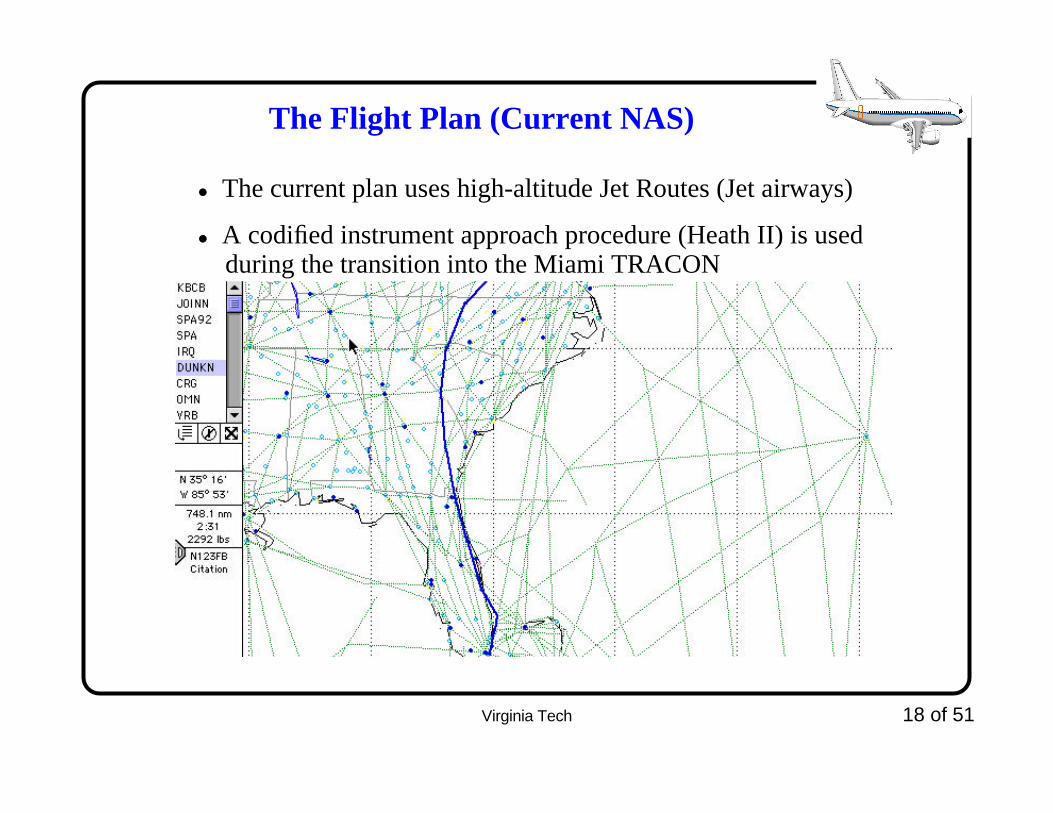
The Flight Plan (Current NAS)
• The current plan uses high-altitude Jet Routes (Jet airways)
• A codified instrument approach procedure (Heath II) is used during the transition into the Miami TRACON
Virginia Tech 19 of 51
Activities of the Flight
• Pilots arrive to VPI Airport (BCB) an hour before the flight (to review weather and submit a flight plan)
• Few minutes before departure they contact Roanoke ATC for flight plan approval
• BCB has no control tower (but a UNICOM frequency is used to establish intent - blind verbal statements)
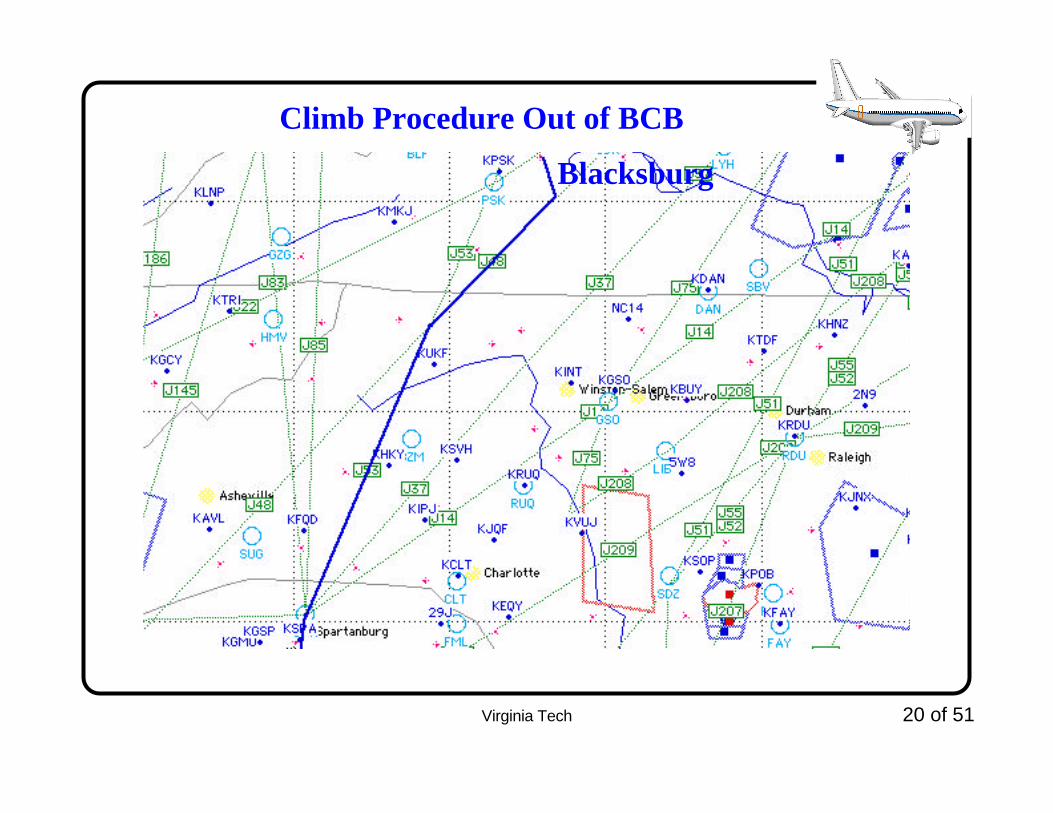
• Out of BCB pilots contact Roanoke TRACON for climb instructions (to intercept J-48 a Jet Route)
• At FL 100 (10,000 ft) the pilots contact Washington Center - ZDC (briefly)
• A few minutes later ZDC hands-off the flight to ZTL (Atlanta ARTCC)
Virginia Tech 20 of 51
Climb Procedure Out of BCB
Blacksburg
Virginia Tech 21 of 51
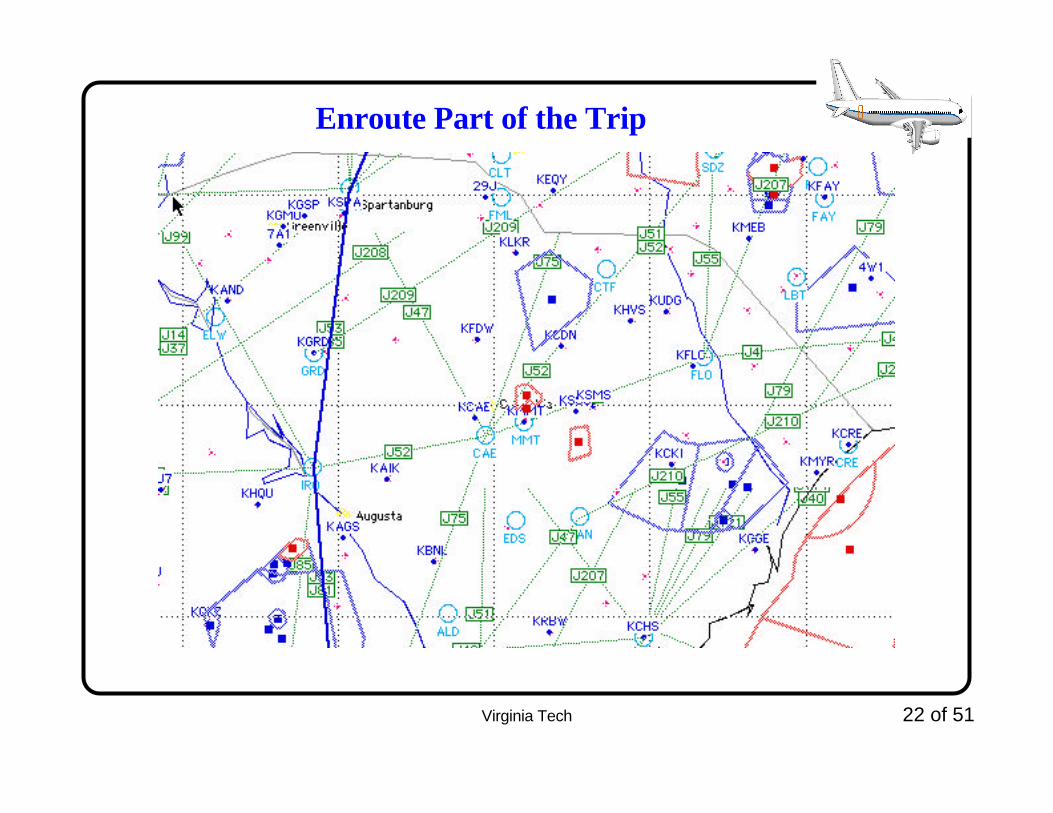
Flight Activities
• ZTL controllers (4 sectors total for this trip) direct this flight to switch to J-53 to Spartanburg VOR (a NAVAID facility)
• The aircraft reaches its enroute cruising altitude of FL 350 (heading is around 187 degrees - South)
• The flight then moves over to J-81 West of Augusta, GA
• 100 nm North of Jacksonville ZTL controllers hand-off the flight to ZJX controllers (Jacksonville Center)
• The flight takes J-45 and passes a few miles West of Daytona Beach (flies over Daytona Beach VOR called DAB)
• The flight is handed-off to ZMA (Miami ARTCC Center)
• ZMA controllers start descending the flight 100 nm from MIA VOR near Vero Beach VOR
Virginia Tech 22 of 51
Enroute Part of the Trip

Virginia Tech 23 of 51
Final Part of the Trip (Activities)
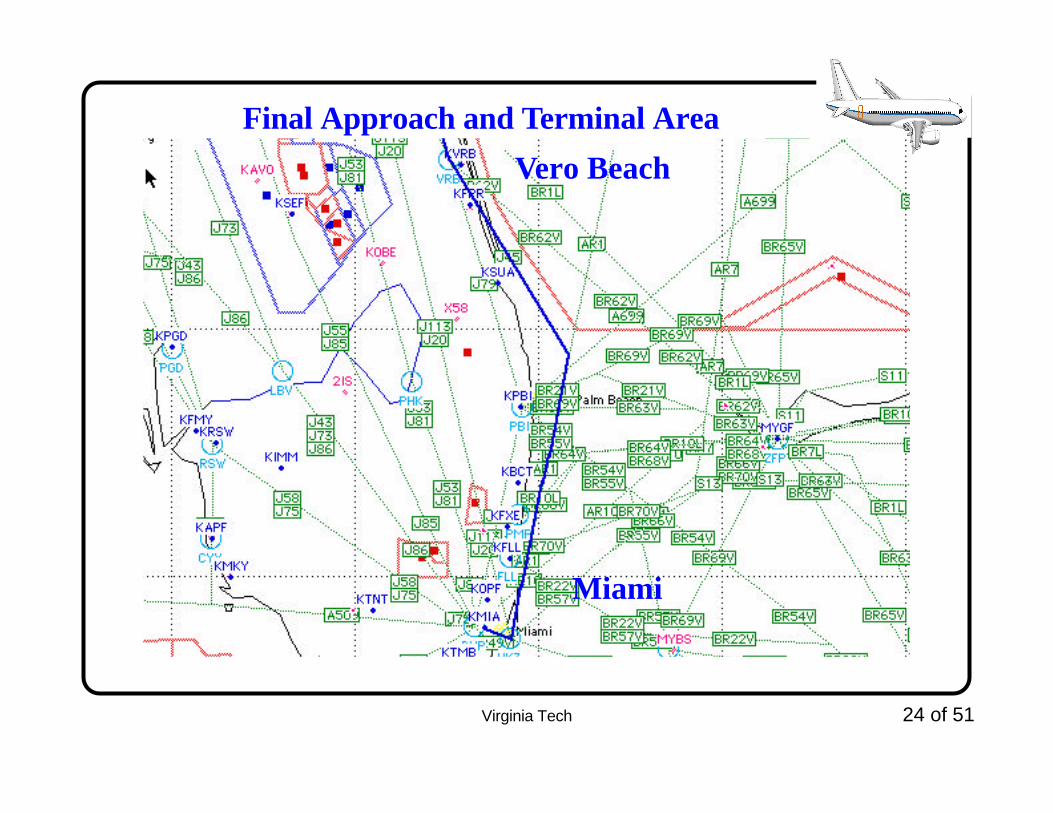
• The flight is handed over to MIA TRACON 60 nm from the airport East of the West Palm Beach VOR
• The flight progresses inside the MIa terminal area flying a codified Standard Terminal Arrival Route (STAR)
• The flight is continuously given vectors inside the 50 nm radius from MIA
• The TRACON controller sequences our flight behind a “heavy” (Boeing 757 of American Airlines) and establishes 6 nm of separation
• 5 nm from MIA airport the flight is haned-off to MIA tower
• The flight lands on RWY 27 R per local controller instructions
• The flight taxis to the ramp following instructions of a ground controller
Virginia Tech 24 of 51
Final Approach and Terminal Area
Vero Beach
Miami

Virginia Tech 25 of 51
Aircraft Instrumentation and Navigation
Modern transport aircraft have plenty of instrumentation to navigate across the U.S. and over the oceans

Virginia Tech 26 of 51
Future Navigation (Free Flight)
In Free Flight a pilot navigates directly from an origin to a destination using Satellite Navigation (SATNAV) systems
GPS Networkof Satellites

Virginia Tech 27 of 51
Sample Individual Free Flight Track
Flight plans will be more flexible and allow pilots to save time and fuel
80
85
90
95
100 2626.5
2727.5
2828.5
2929.5
0
10
20
30
Longitude (deg) Latitude (deg)
Flight plan way-points
DFW
MIA
Pseudo-globe circle route
Constant headingsegments
ClimbDescent
Virginia Tech 28 of 51
North Atlantic and Pacific Operations
Virginia Tech 29 of 51
Why Collision Risk Analysis?
• There are about 15-30 aircraft collisions in the U.S. every year
• Most of these occur on the ground and involve General Aviation (GA) type aircraft
• According to the Office of Technology Asseessment statistics the number of collisions has increased quadratically with flight operations
• Collisions are rare events but “near misses” incidents are more numerous
• Enroute collisions do not happen very often (once every10- 20 years)
• Modeling rare events is challenging
Virginia Tech 30 of 51
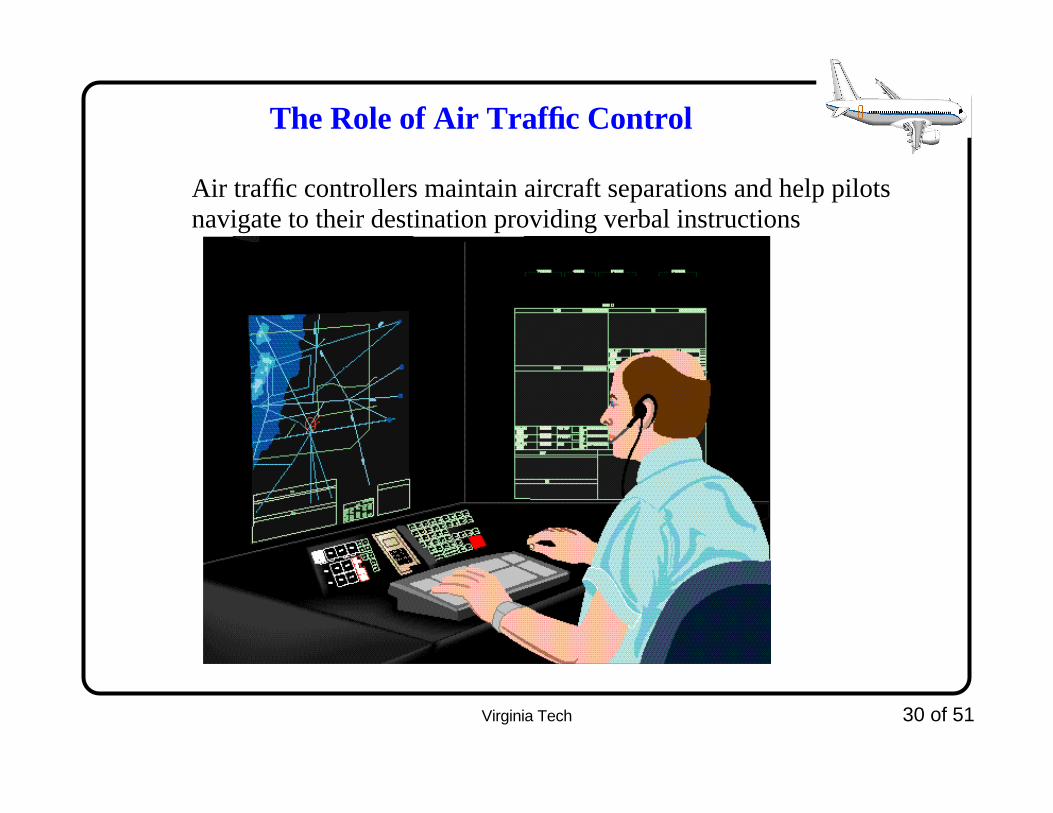
The Role of Air Traffic Control
Air traffic controllers maintain aircraft separations and help pilots navigate to their destination providing verbal instructions
Virginia Tech 31 of 51
Modeling Collision Risk in NAS Operations
• We use computer simulation models to replicate the real system (i.e., airports, aircraft, airways, sectors, etc.)
- Simulation models are mathematical abstractions on how the system works
- Simulation models have a lot of logic and math behind them
• Computer simulations integrate mathematics and computer science expertise
• Collisions are rare so we need to create models to predict their predecessors (incidents)
• Collisions could be a detrimental to the growth of air transportation
Virginia Tech 32 of 51
First Application of CRM Models
• 1963 - Reich and Marks start development of the first Collision Risk Assessment model
• 1968 - Reich-Marks model accepted for oceanic operations
- Established longitudinal, lateral and vertical separation minimums to fly over the North Atlantic
- 120 nautical mile lateral separation (90 nm separation considered unsafe using the model)
- The longitudinal seperation was 20 minutes initially
- 15 minutes in-trail adopted in 1978
Virginia Tech 33 of 51
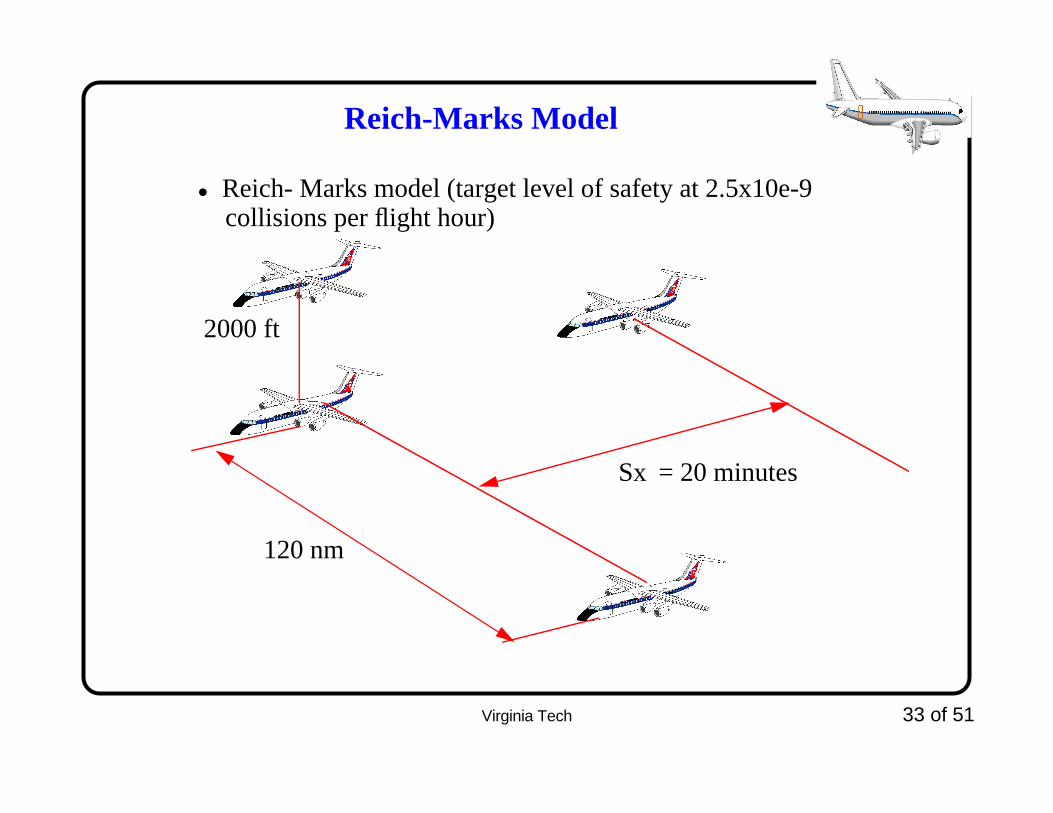
Reich-Marks Model
• Reich- Marks model (target level of safety at 2.5x10e-9 collisions per flight hour)
2000 ft
120 nm
Sx = 20 minutes
Virginia Tech 34 of 51
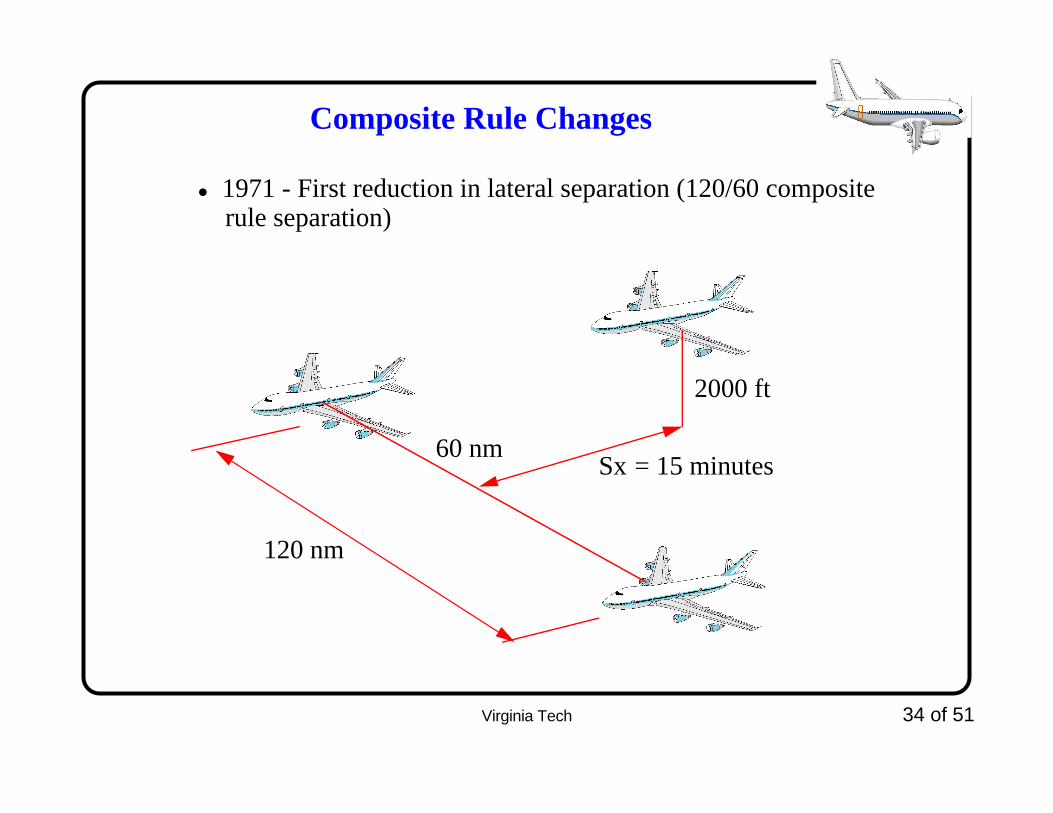
Composite Rule Changes
• 1971 - First reduction in lateral separation (120/60 composite rule separation)
2000 ft
120 nm
60 nmSx = 15 minutes
Virginia Tech 35 of 51
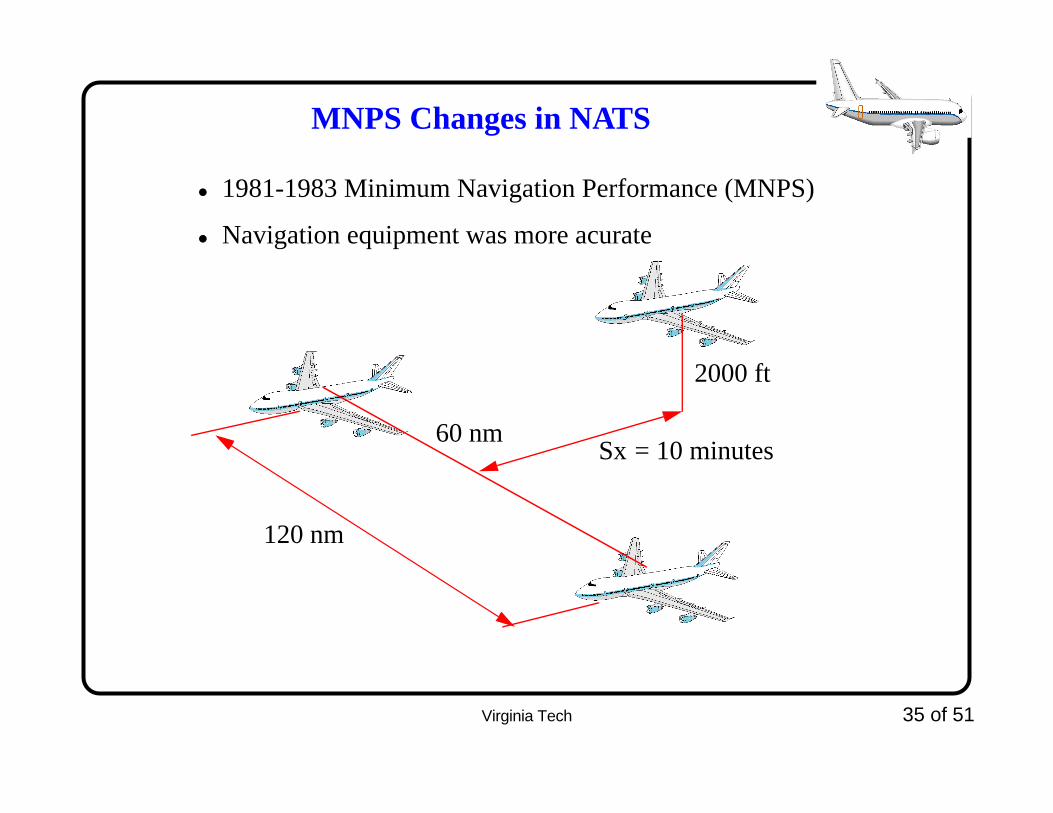
MNPS Changes in NATS
• 1981-1983 Minimum Navigation Performance (MNPS)
• Navigation equipment was more acurate
2000 ft
120 nm
60 nmSx = 10 minutes
Virginia Tech 36 of 51
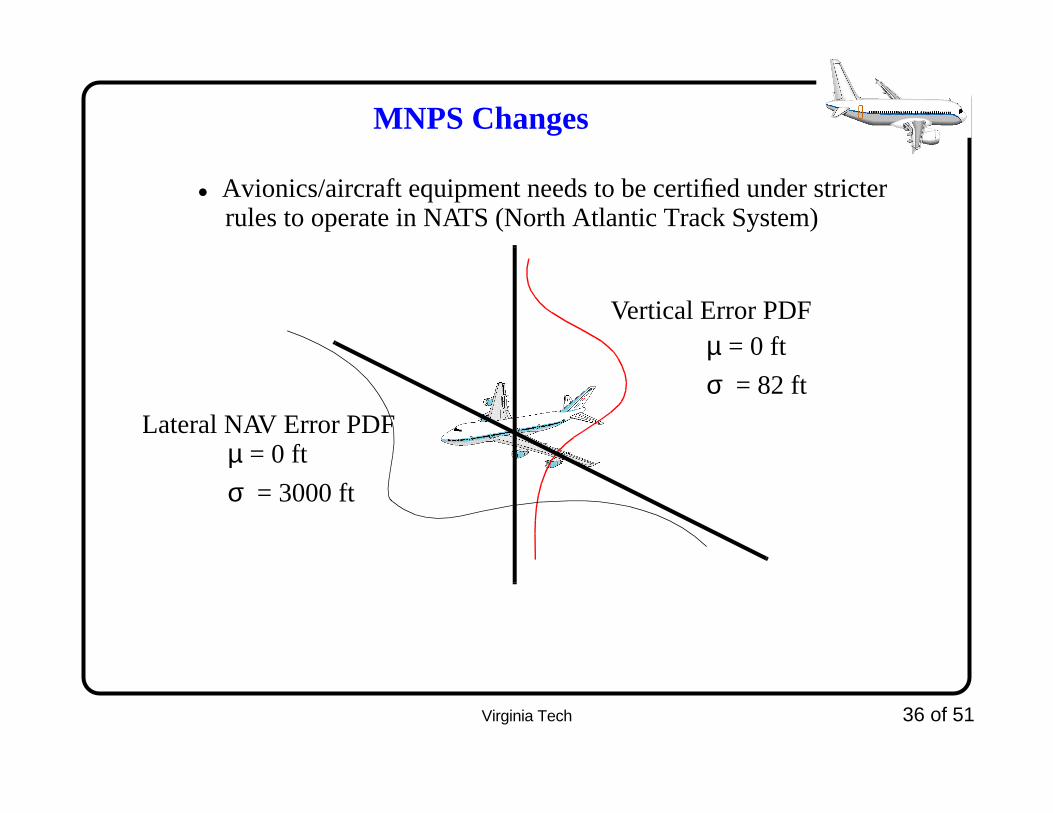
MNPS Changes
• Avionics/aircraft equipment needs to be certified under stricter rules to operate in NATS (North Atlantic Track System)
Vertical Error PDF
Lateral NAV Error PDF
µ = 0 ft
σ = 82 ft
µ = 0 ft
σ = 3000 ft

Virginia Tech 37 of 51
RVSM Rule Changes
In 1990 a new study concluded that 1000 ft vertical separation was acceptable over the North Atlantic
1000 ft
60 nm
Sx = 10 minutes
Virginia Tech 38 of 51
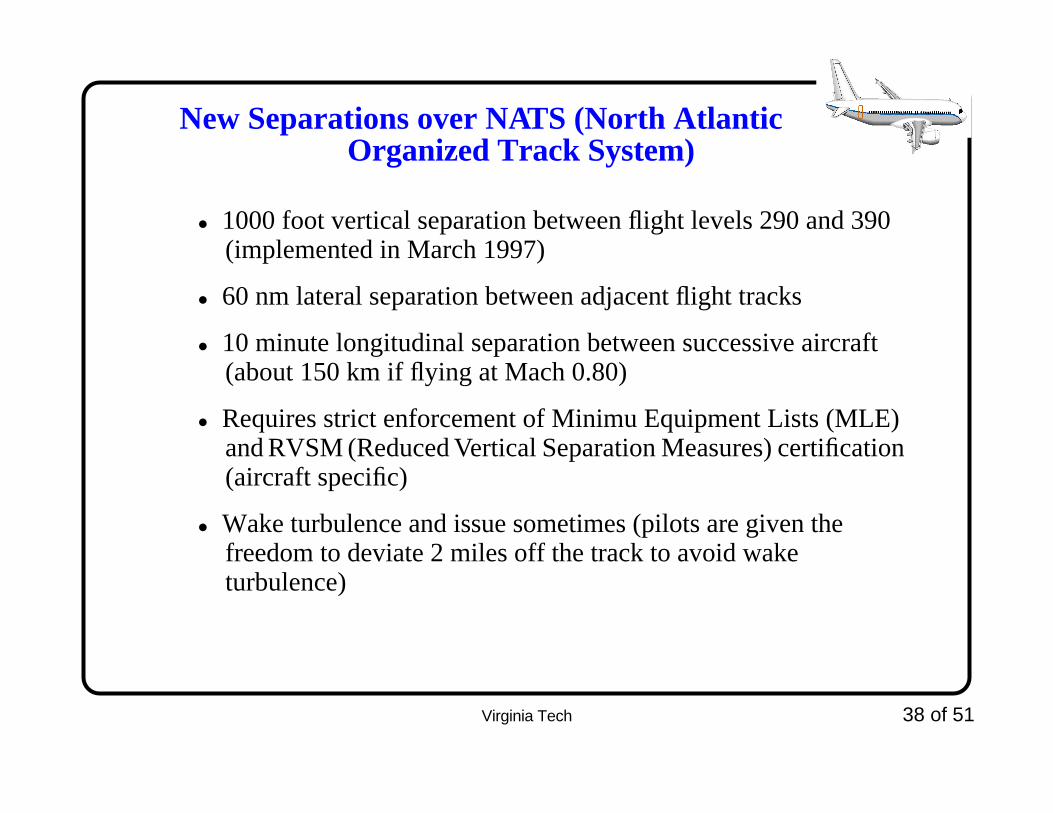
New Separations over NATS (North Atlantic Organized Track System)
• 1000 foot vertical separation between flight levels 290 and 390 (implemented in March 1997)
• 60 nm lateral separation between adjacent flight tracks
• 10 minute longitudinal separation between successive aircraft (about 150 km if flying at Mach 0.80)
• Requires strict enforcement of Minimu Equipment Lists (MLE) and RVSM (Reduced Vertical Separation Measures) certification (aircraft specific)
• Wake turbulence and issue sometimes (pilots are given the freedom to deviate 2 miles off the track to avoid wake turbulence)
Virginia Tech 39 of 51
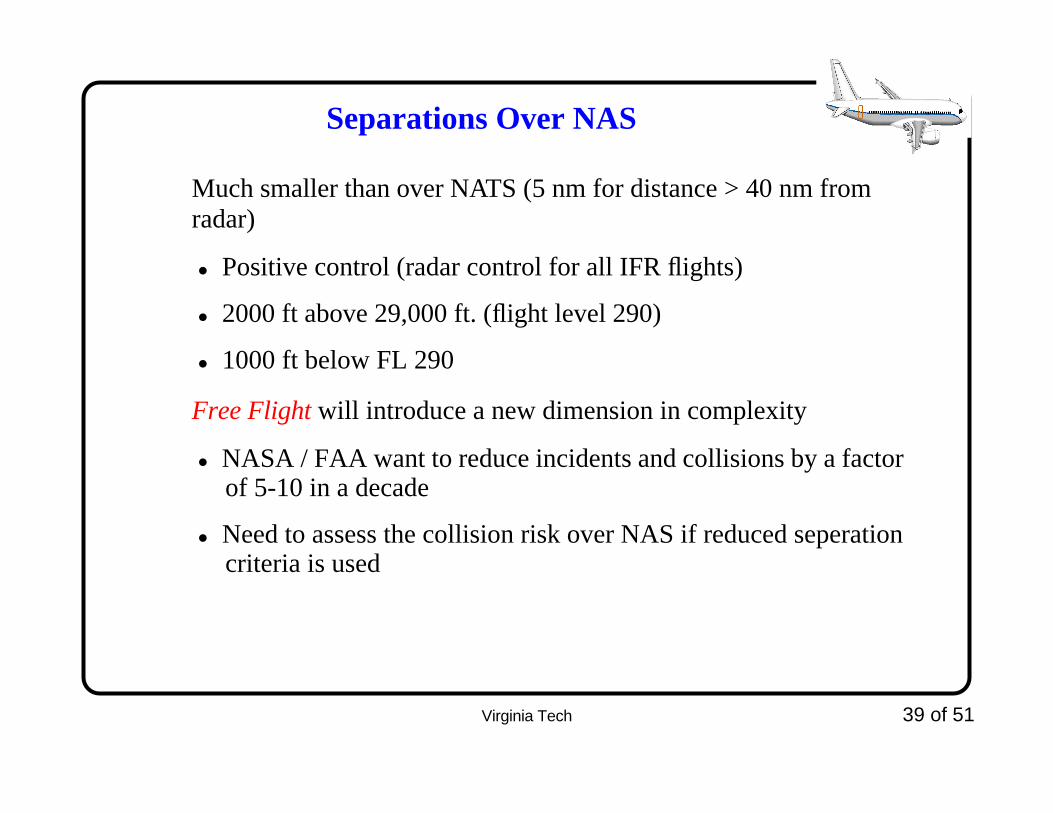
Separations Over NAS
Much smaller than over NATS (5 nm for distance > 40 nm from radar)
• Positive control (radar control for all IFR flights)
• 2000 ft above 29,000 ft. (flight level 290)
• 1000 ft below FL 290
Free Flight will introduce a new dimension in complexity
• NASA / FAA want to reduce incidents and collisions by a factor of 5-10 in a decade
• Need to assess the collision risk over NAS if reduced seperation criteria is used
Virginia Tech 40 of 51
VPI Involvement
• We are developing a model to assess the risk of collision under Free Flight NAS operational concepts
• Joint FAA/Eurocontrol effort
• Approach
- Develop scenarios
- Develop a blind conflict model
- Work out the end-game dynamics (ATC/Pilot)
- Introduce reliability factors to the model
Virginia Tech 41 of 51
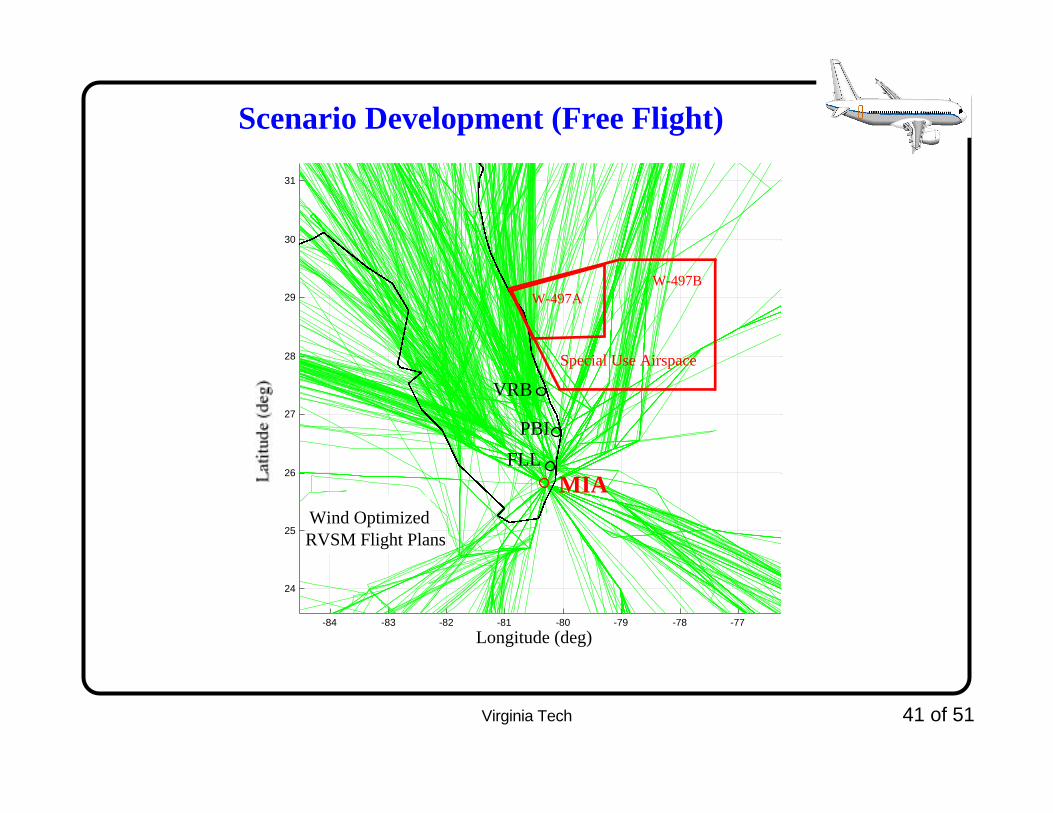
Scenario Development (Free Flight)
-84 -83 -82 -81 -80 -79 -78 -77
24
25
26
27
28
29
30
31
Longitude (deg)
MIA
W-497BW-497A
PBI
FLL
VRB
Wind OptimizedRVSM Flight Plans
Special Use Airspace
Virginia Tech 42 of 51
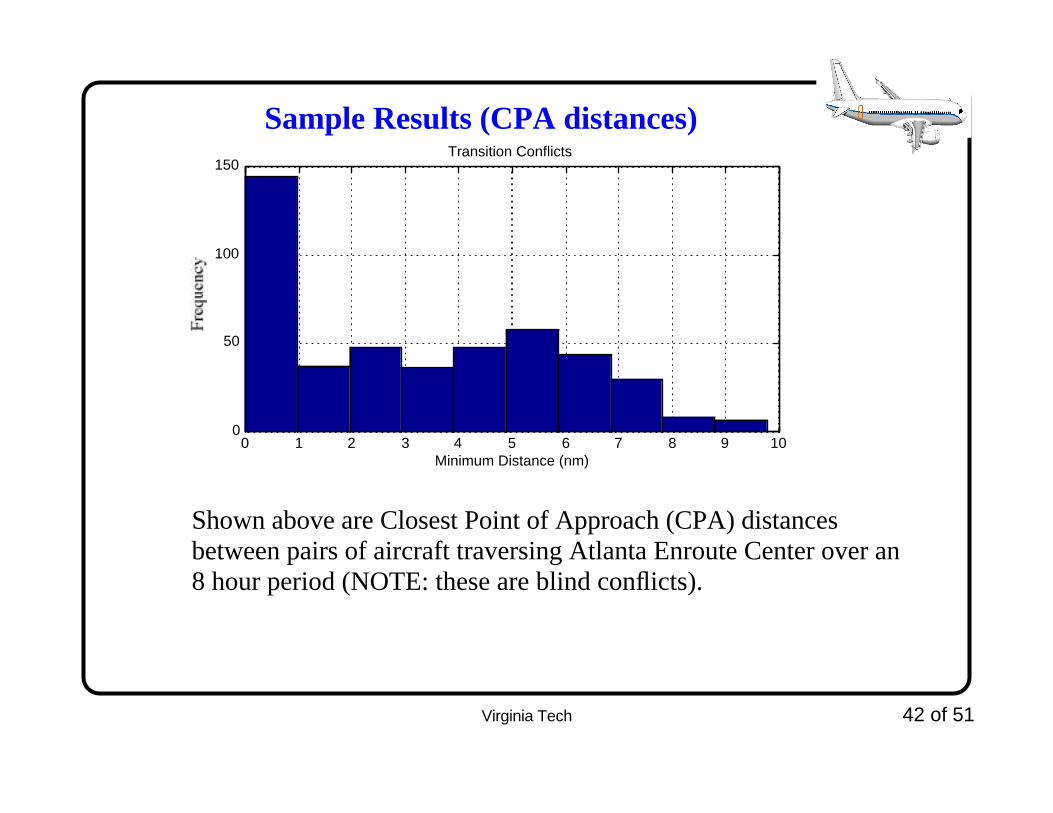
Sample Results (CPA distances)
Shown above are Closest Point of Approach (CPA) distances between pairs of aircraft traversing Atlanta Enroute Center over an 8 hour period (NOTE: these are blind conflicts).
0 1 2 3 4 5 6 7 8 9 100
50
100
150
Minimum Distance (nm)
Fre
que
ncy
Transition Conflicts

Virginia Tech 43 of 51
Sample Results (Conflict Times)
Conflict times contribute to workload and serve as precursors to establish ATC controller resolution advisories.
0 5 10 15 20 25 300
10
20
30
40
50
60
70
Time in Conflict (min)
Fre
quen
cy
Enroute Conflicts
Virginia Tech 44 of 51
The conclict geometry is another important factor to determine workload and possible ATC/Aircraft end-game interactions
Virginia Tech 45 of 51
Future Steps
• We are developing a plan for the end-game model to be associated with ASOM and CAM models developed at VPI
• Reliability modeling of ATC controllers, pilots and aircraft is not an easy task. Several options are possible:
- Dynamic fault tree analysis
- Event tree analysis
- Petri nets
- Neural nets
- Artificial intelligence models
• Regardless the technique employed all these models require significant human-in-the-loop simulation studies to assess ATC and Pilot reactions to airspace conflict scenarios
Virginia Tech 46 of 51
Implications for Air Transport Systems Analysts
• ATC services housed at the airport
- Airport surveillance radars
- VOR - very high frequency omnidirectional range and TACAN systems
- ILS - instrument landing systems
• ATC aircraft seperations dictate capacity of the airport and in the airspace
• Runway separation criteria are dictated by ATC technology

Virginia Tech 47 of 51
Runway Separations at Airports Depend on Technology
The same technology used to establish the position of aircraft in the airspace is used to perform surveillance activities near airports
• Radar technology has inherent weaknesses for surveillance
• The farthest from the antenna, the larger the uncertainty to determine accurate positions
• Primary radar (skin paint)
• Secondary radar (transponder inside aircraft - Modes C and S)
Virginia Tech 48 of 51
Independent ILS or Precision Approaches
• IFR operational conditions
• 4,300 ft between runway centerlines
• Standard radar systems (scan rate of 4.8 seconds or more)
Virginia Tech 49 of 51
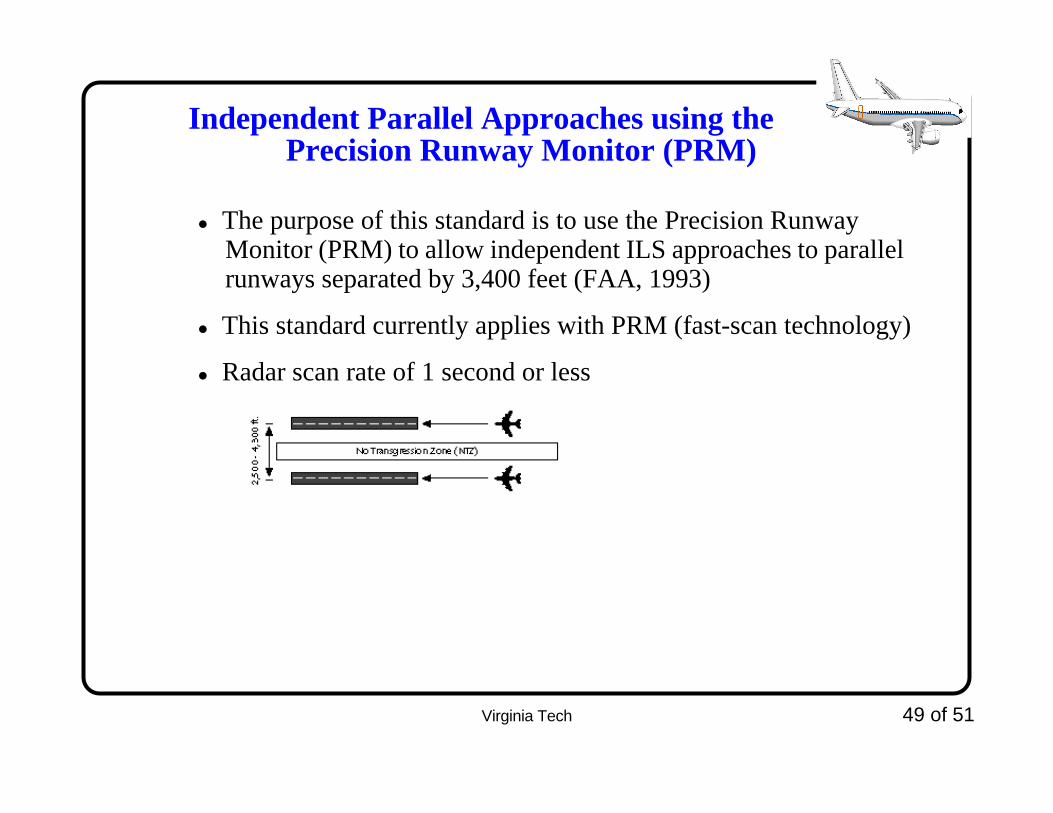
Independent Parallel Approaches using the Precision Runway Monitor (PRM)
• The purpose of this standard is to use the Precision Runway Monitor (PRM) to allow independent ILS approaches to parallel runways separated by 3,400 feet (FAA, 1993)
• This standard currently applies with PRM (fast-scan technology)
• Radar scan rate of 1 second or less

Virginia Tech 50 of 51
Independent Triple and Quadruple Approaches To Parallel Runways
• The idea behind this concept is to allow triple and quadruple parallel approaches to runways separated by 5,000 feet using current radar systems (scan update rate of 4.8 seconds) at airports having field elevations of less than 1,000 feet
• Increase to 5,300 ft spacing between runways for elevations above 5,000 ft

Virginia Tech 51 of 51
Independent Simultaneous Approaches to Converging Runways
Procedures governing independent converging approaches require that the distance between the missed approach points be 3 n.m. apart and that the Terminal Instrument Procedures (TERPS) surfaces not overlap. Because of these restrictions, minimums are high, thereby limiting the number of airports
NTZ - No Transgression Zone
Assumes the Missed ApproachEnvelopes are Non-overlapping


![Airspace Volumes & Sectorisation · aimed at including TMA, CTA, CTR, ATZ airspace classification or any other nomenclature used to describe the airspace around an airport]. [The](https://img.pdfslide.us/doc/110x75/5e6c872238dc2c12146ebb3e/airspace-volumes-sectorisation-aimed-at-including-tma-cta-ctr-atz-airspace.jpg)