Embed Size (px)
Citation preview
Ground School 2011 Created by Steve Reisser
AIRPLANE PERFORMANCE / WEIGHT AND BALANCE
Airspeed Calibration for Normal and Alternate Static Sources)
Stall Speeds (Fore-Aft CG)
Take Off Distances
Rate of Climb
Time, Fuel, and Distance to Climb
Cruise Performance
Range Profile
Endurance Profile
Landing Distance
and much, much more…
Pilot’s Operating Handbook (POH) specific to THAT airplane contains:
YOU must be able to predict the performance of your aircraft to operate safelyin and out of airports, and understand its climb and cruise performance. You must also
be able to safely load your aircraft, know when you are overloaded and weather the
center of gravity is too far forward or aft.
Ground School 2011 Created by Steve Reisser
AIRPLANE PERFORMANCE / WEIGHT AND BALANCE
FACTORS INFLUENCING PERFORMANCE
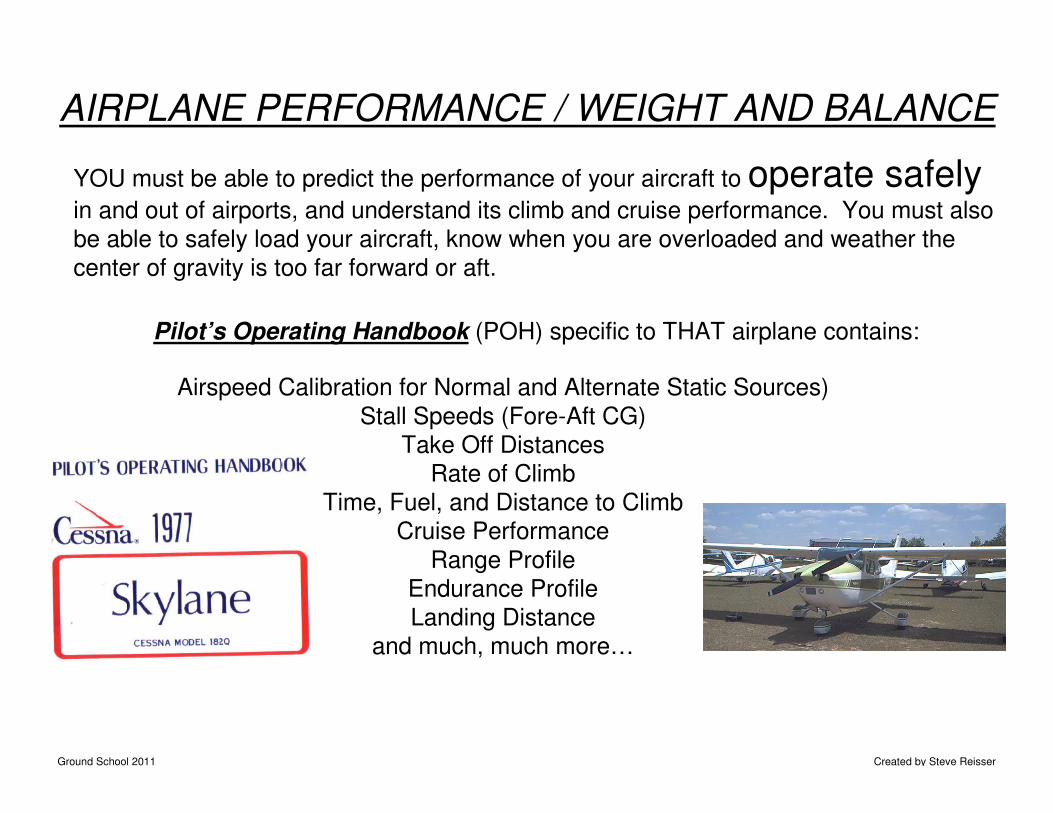
Pressure Altitude. Understand that engineer’s create performance charts and tables based on a
sea level pressure and altitude. Pressure altitude is that altitude which is indicated on your
altimeter when you select 29.92 in the Kollsman window.
Difference in PA
changes takeoff
Roll.
Ground School 2011 Created by Steve Reisser
AIRPLANE PERFORMANCE / WEIGHT AND BALANCE
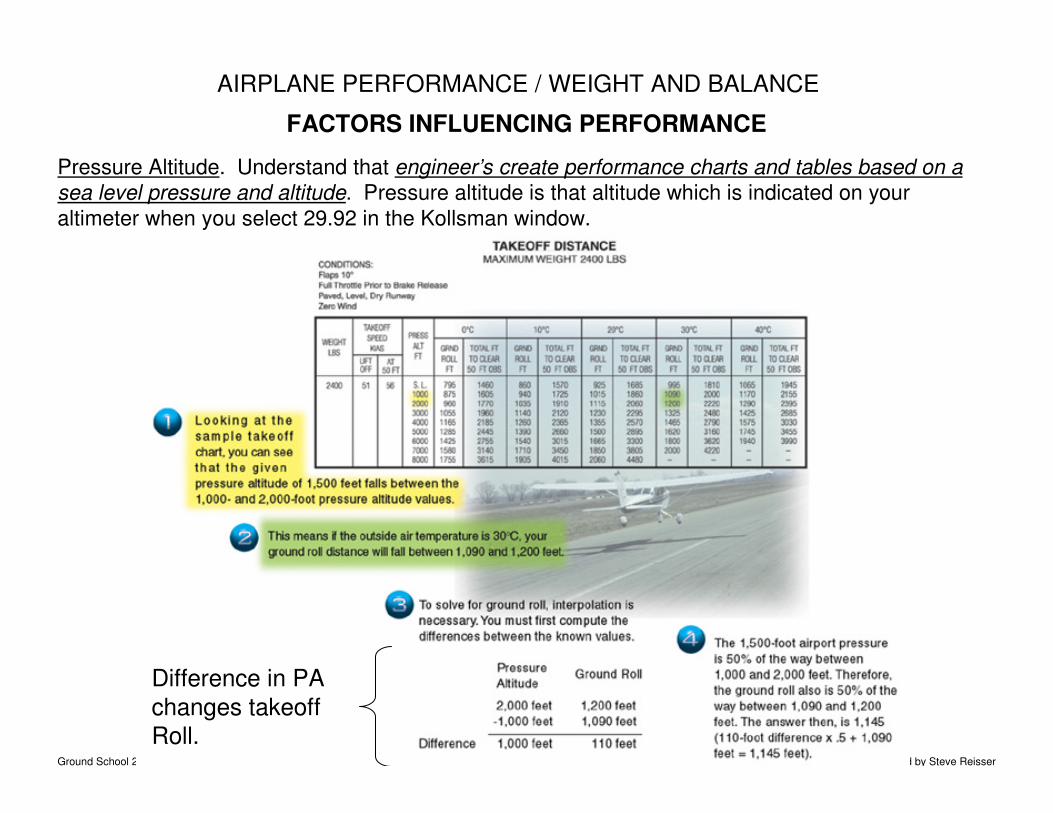
How do you determine Pressure Altitude from Indicated Altitude?
1. Note Kollsman Window, write pressure, set to 29.92. Altimeter now
indicates Pressure Altitude. REMEMBER TO RESET .
2. Head work, determine difference of pressure set in Kollsman
window and 29.92. If greater than 29.92, you multiply by 1000 and
REDUCE from Indicated altitude. If less than 29.92, you multiply by
1000 and ADD to the Indicated altitude.
30.42
29.9229.92
29.12
Kollman
Difference = -00.50 x1000 = -500 ft
Difference = -00.80 x1000 = -+800 ft
INDICATED ALT =2500
PRESSURE ALTITUDE = 2000 FT PRESSURE ALTITUDE = 3300 FT
Ground School 2011 Created by Steve Reisser
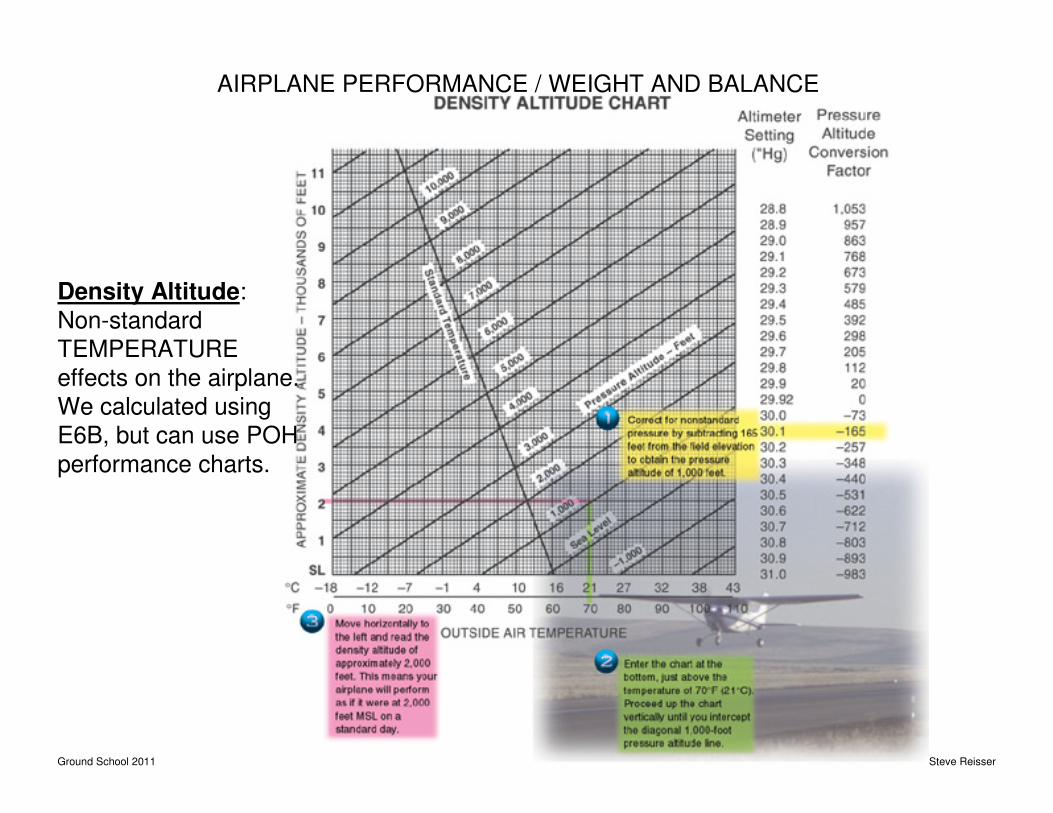
Density Altitude:
Non-standard
TEMPERATURE
effects on the airplane.
We calculated using
E6B, but can use POH
performance charts.
AIRPLANE PERFORMANCE / WEIGHT AND BALANCE
Ground School 2011 Created by Steve Reisser
AIRPLANE PERFORMANCE / WEIGHT AND BALANCE
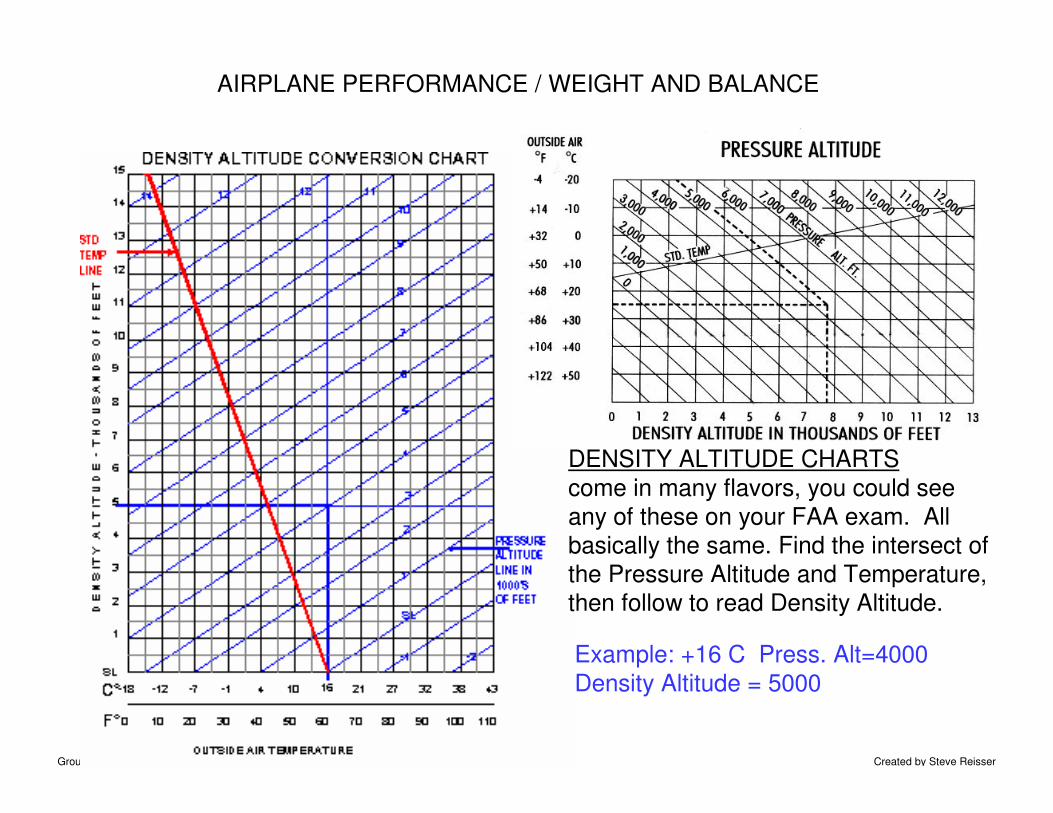
DENSITY ALTITUDE CHARTS
come in many flavors, you could see
any of these on your FAA exam. All
basically the same. Find the intersect of
the Pressure Altitude and Temperature,
then follow to read Density Altitude.
Example: +16 C Press. Alt=4000
Density Altitude = 5000
Ground School 2011 Created by Steve Reisser
AIRPLANE PERFORMANCE / WEIGHT AND BALANCE
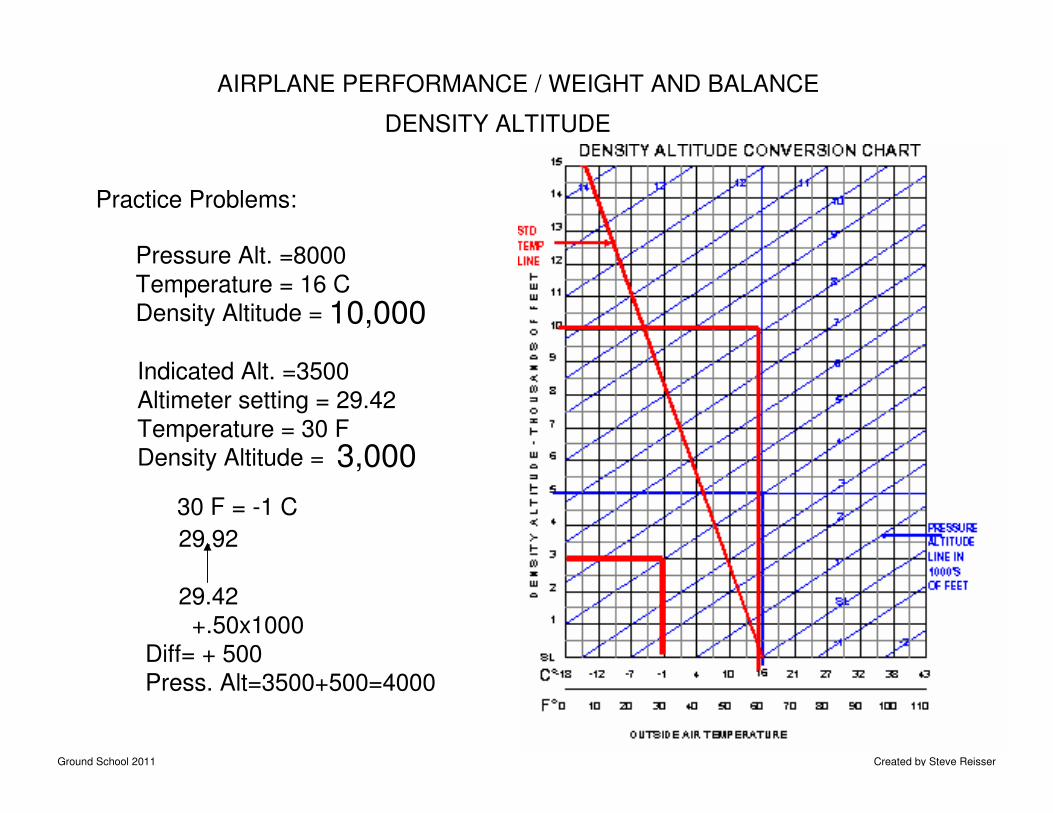
DENSITY ALTITUDE
Practice Problems:
Pressure Alt. =8000
Temperature = 16 C
Density Altitude = 10,000
Indicated Alt. =3500
Altimeter setting = 29.42
Temperature = 30 F
Density Altitude =
30 F = -1 C
29.92
29.42
+.50x1000
Diff= + 500
Press. Alt=3500+500=4000
3,000
Ground School 2011 Created by Steve Reisser
AIRPLANE PERFORMANCE / WEIGHT AND BALANCE
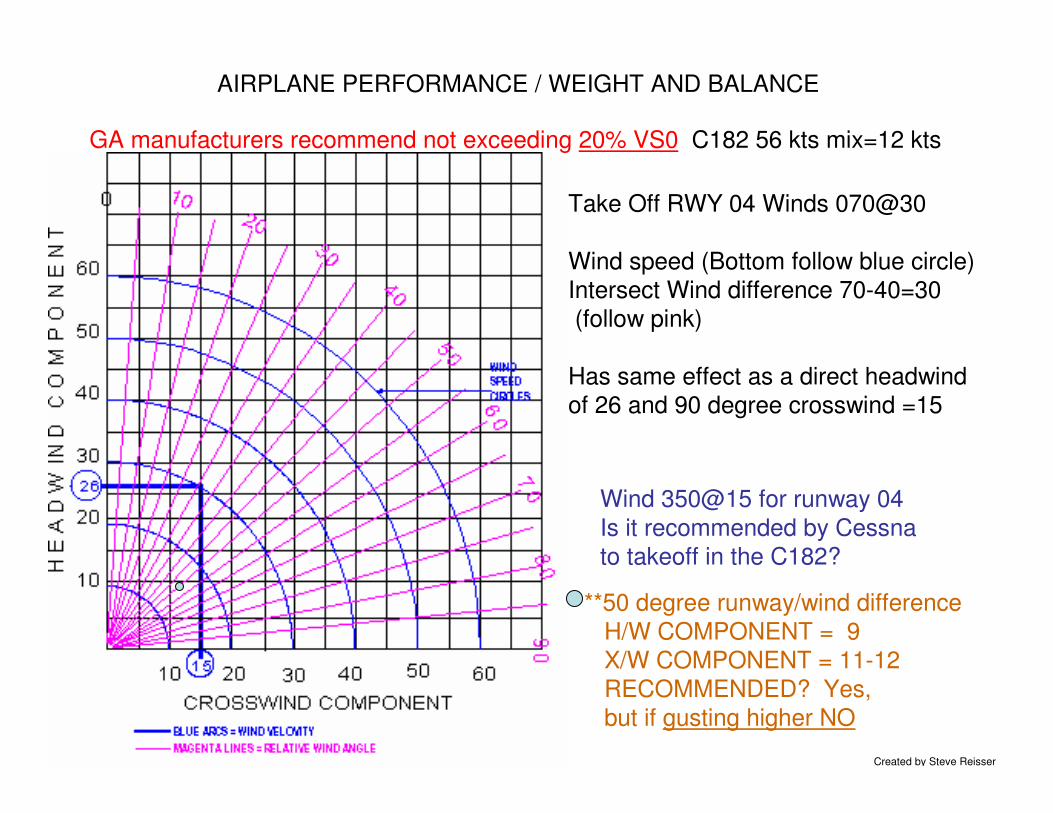
GA manufacturers recommend not exceeding 20% VS0 C182 56 kts mix=12 kts
Take Off RWY 04 Winds 070@30
Wind speed (Bottom follow blue circle)
Intersect Wind difference 70-40=30
(follow pink)
Has same effect as a direct headwind
of 26 and 90 degree crosswind =15
Wind 350@15 for runway 04
Is it recommended by Cessna
to takeoff in the C182?
**50 degree runway/wind difference
H/W COMPONENT = 9
X/W COMPONENT = 11-12
RECOMMENDED? Yes,
but if gusting higher NO
Ground School 2011 Created by Steve Reisser
X-Wind Component - MENTALLY
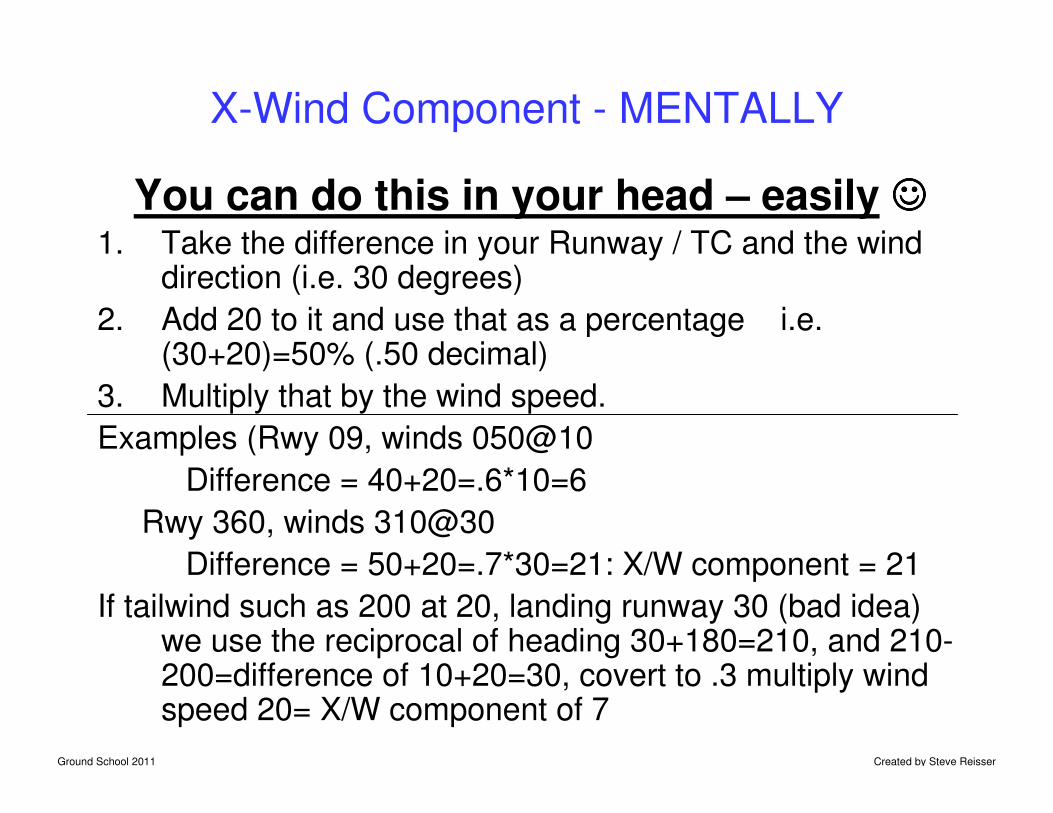
You can do this in your head – easily ☺☺☺☺
1. Take the difference in your Runway / TC and the wind direction (i.e. 30 degrees)
2. Add 20 to it and use that as a percentage i.e. (30+20)=50% (.50 decimal)
3. Multiply that by the wind speed.
Examples (Rwy 09, winds 050@10
Difference = 40+20=.6*10=6
Rwy 360, winds 310@30
Difference = 50+20=.7*30=21: X/W component = 21
If tailwind such as 200 at 20, landing runway 30 (bad idea) we use the reciprocal of heading 30+180=210, and 210-200=difference of 10+20=30, covert to .3 multiply wind speed 20= X/W component of 7
Ground School 2011 Created by Steve Reisser
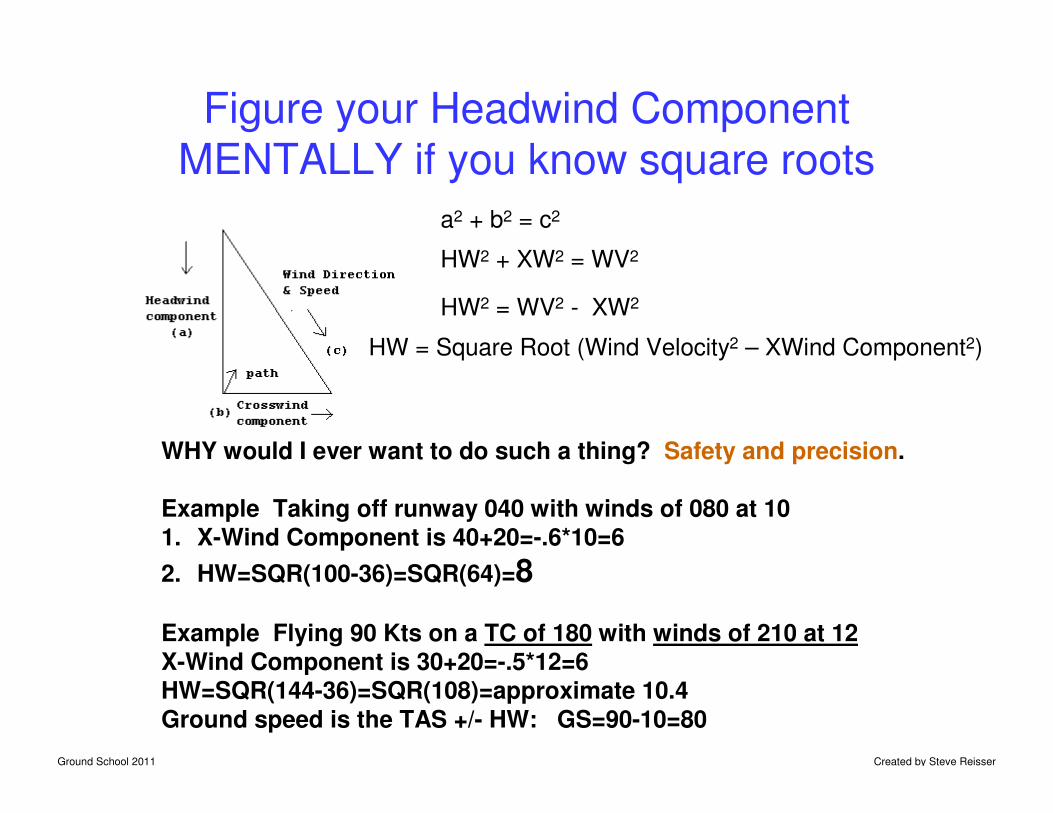
Figure your Headwind ComponentMENTALLY if you know square roots
a2 + b2 = c2
HW2 + XW2 = WV2
HW2 = WV2 - XW2
HW = Square Root (Wind Velocity2 – XWind Component2)
WHY would I ever want to do such a thing? Safety and precision.
Example Taking off runway 040 with winds of 080 at 101. X-Wind Component is 40+20=-.6*10=6
2. HW=SQR(100-36)=SQR(64)=8
Example Flying 90 Kts on a TC of 180 with winds of 210 at 12X-Wind Component is 30+20=-.5*12=6HW=SQR(144-36)=SQR(108)=approximate 10.4
Ground speed is the TAS +/- HW: GS=90-10=80
Ground School 2011 Created by Steve Reisser
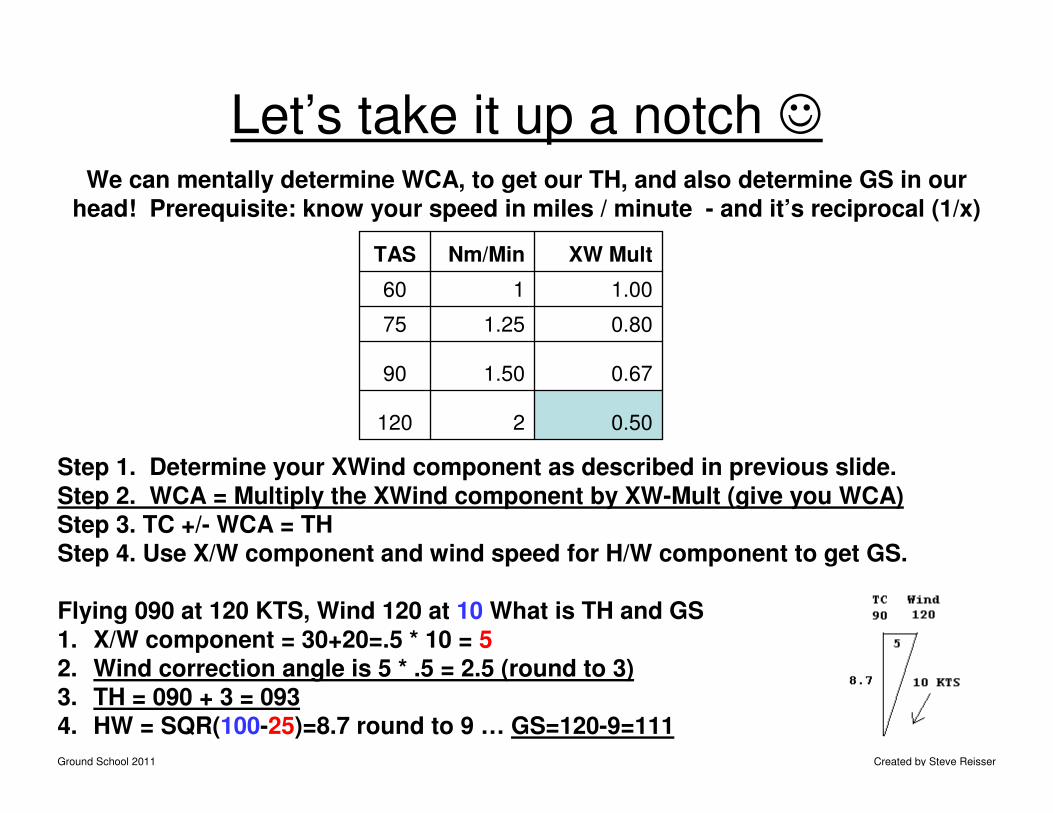
Let’s take it up a notch ☺We can mentally determine WCA, to get our TH, and also determine GS in our
head! Prerequisite: know your speed in miles / minute - and it’s reciprocal (1/x)
1.00160
0.671.5090
0.502120
0.801.2575
XW MultNm/MinTAS
Step 1. Determine your XWind component as described in previous slide.
Step 2. WCA = Multiply the XWind component by XW-Mult (give you WCA)Step 3. TC +/- WCA = THStep 4. Use X/W component and wind speed for H/W component to get GS.
Flying 090 at 120 KTS, Wind 120 at 10 What is TH and GS
1. X/W component = 30+20=.5 * 10 = 52. Wind correction angle is 5 * .5 = 2.5 (round to 3)3. TH = 090 + 3 = 0934. HW = SQR(100-25)=8.7 round to 9 … GS=120-9=111
Ground School 2011 Created by Steve Reisser
AIRPLANE PERFORMANCE / WEIGHT AND BALANCE
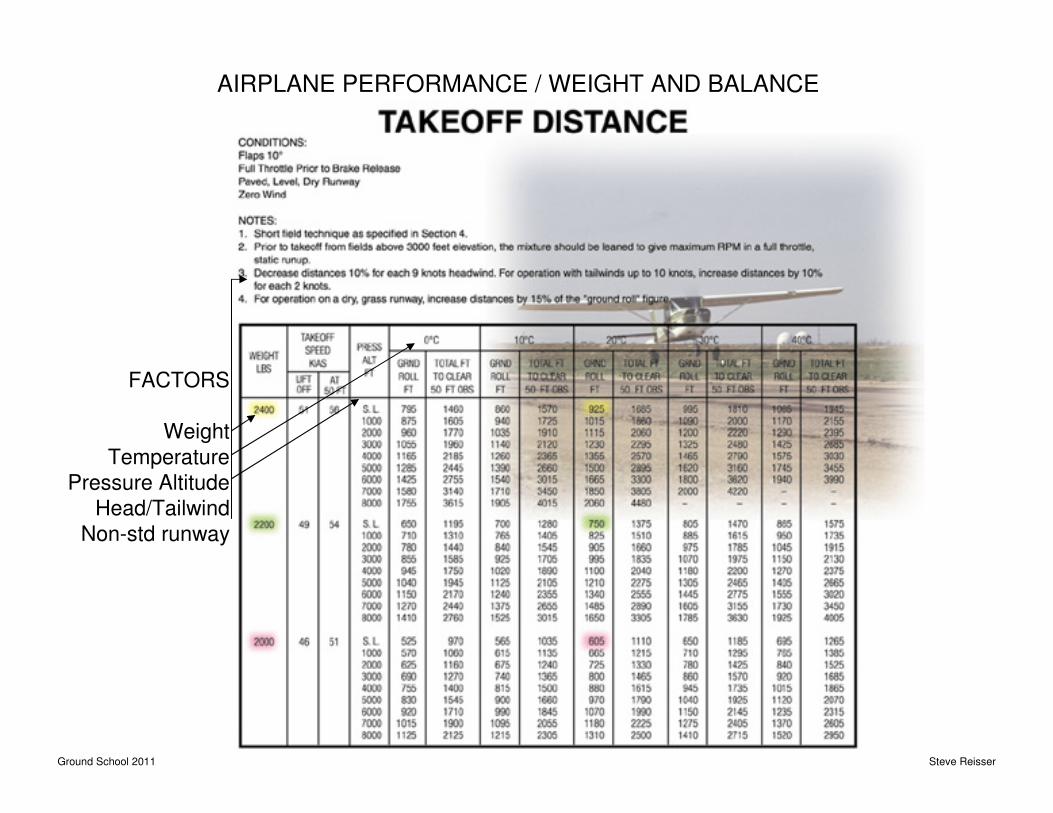
FACTORS
Weight
Temperature
Pressure Altitude
Head/Tailwind
Non-std runway
Ground School 2011 Created by Steve Reisser
AIRPLANE PERFORMANCE / WEIGHT AND BALANCE
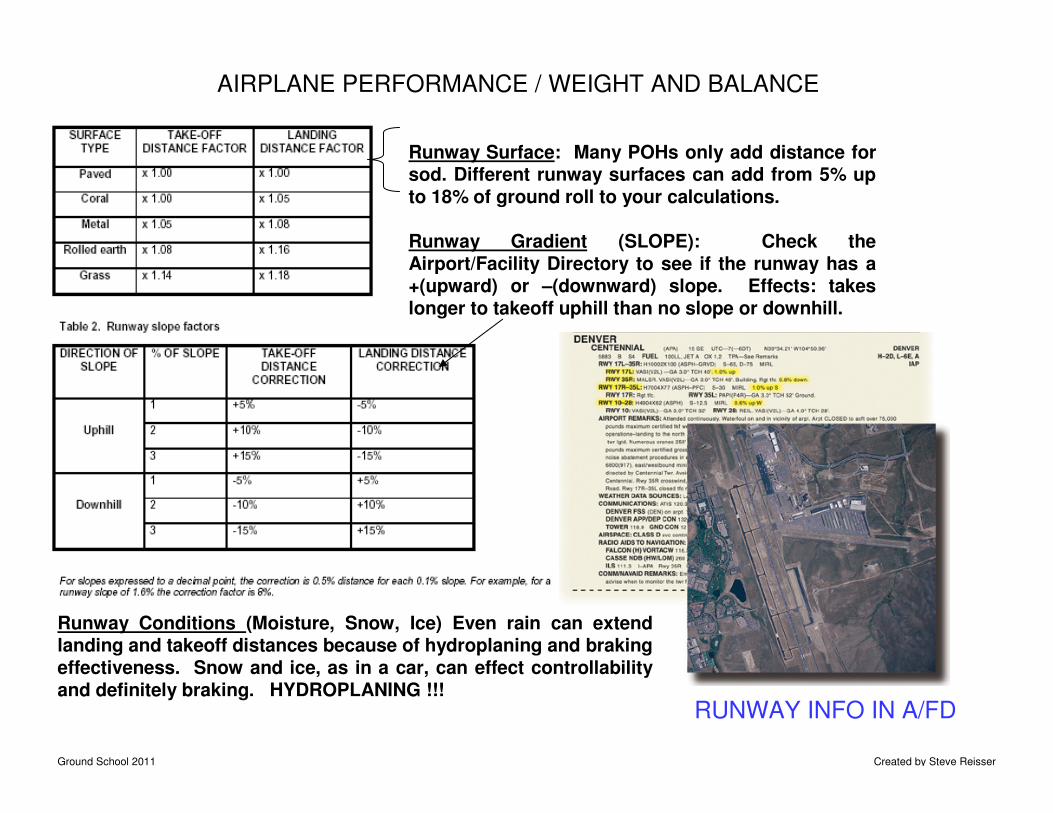
Runway Surface: Many POHs only add distance for sod. Different runway surfaces can add from 5% up to 18% of ground roll to your calculations.
Runway Gradient (SLOPE): Check the Airport/Facility Directory to see if the runway has a +(upward) or –(downward) slope. Effects: takes longer to takeoff uphill than no slope or downhill.
Runway Conditions (Moisture, Snow, Ice) Even rain can extend landing and takeoff distances because of hydroplaning and braking effectiveness. Snow and ice, as in a car, can effect controllability and definitely braking. HYDROPLANING !!!
RUNWAY INFO IN A/FD
Ground School 2011 Created by Steve Reisser
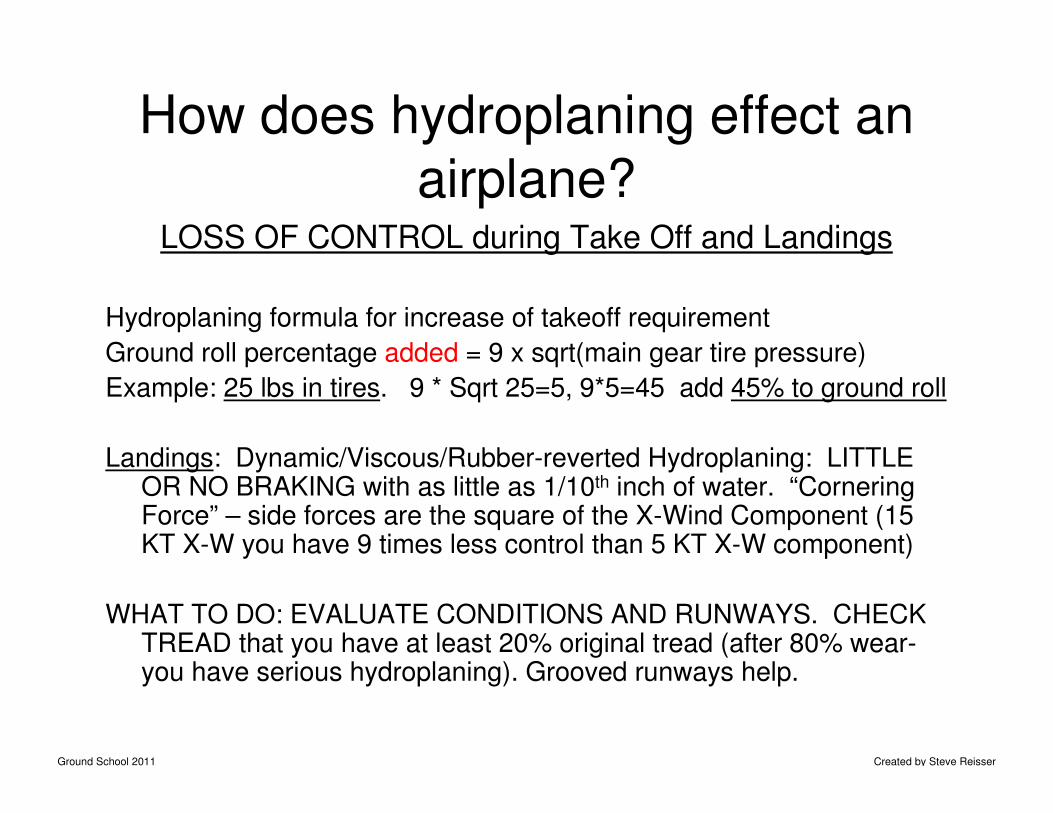
How does hydroplaning effect an
airplane?LOSS OF CONTROL during Take Off and Landings
Hydroplaning formula for increase of takeoff requirement
Ground roll percentage added = 9 x sqrt(main gear tire pressure)
Example: 25 lbs in tires. 9 * Sqrt 25=5, 9*5=45 add 45% to ground roll
Landings: Dynamic/Viscous/Rubber-reverted Hydroplaning: LITTLE OR NO BRAKING with as little as 1/10th inch of water. “Cornering Force” – side forces are the square of the X-Wind Component (15 KT X-W you have 9 times less control than 5 KT X-W component)
WHAT TO DO: EVALUATE CONDITIONS AND RUNWAYS. CHECK TREAD that you have at least 20% original tread (after 80% wear-you have serious hydroplaning). Grooved runways help.
Ground School 2011 Created by Steve Reisser
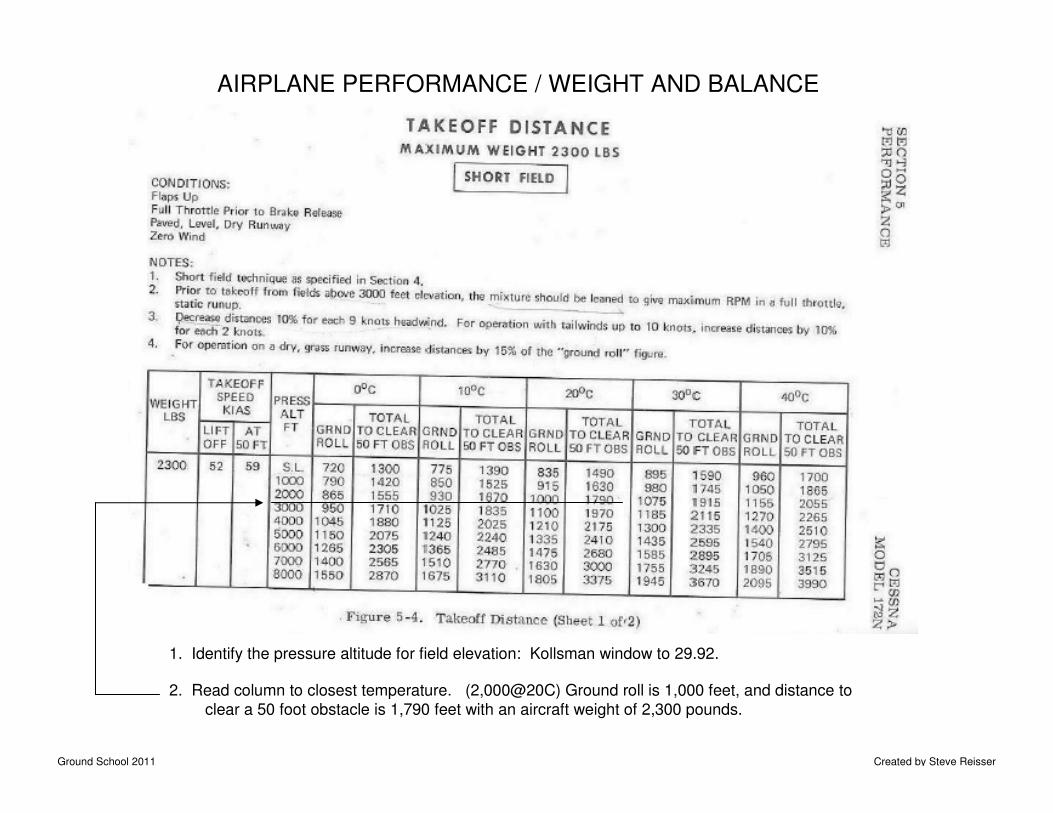
1. Identify the pressure altitude for field elevation: Kollsman window to 29.92.
2. Read column to closest temperature. (2,000@20C) Ground roll is 1,000 feet, and distance to
clear a 50 foot obstacle is 1,790 feet with an aircraft weight of 2,300 pounds.
AIRPLANE PERFORMANCE / WEIGHT AND BALANCE
Ground School 2011 Created by Steve Reisser
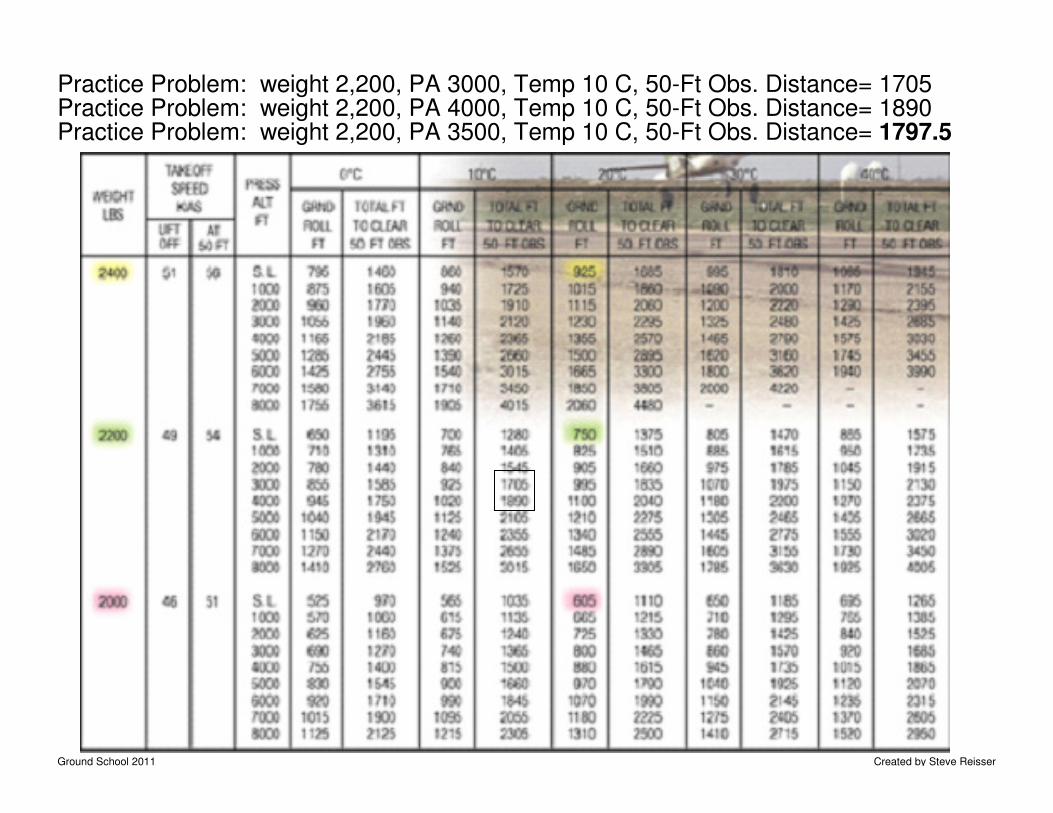
Practice Problem: weight 2,200, PA 3000, Temp 10 C, 50-Ft Obs. Distance= 1705Practice Problem: weight 2,200, PA 4000, Temp 10 C, 50-Ft Obs. Distance= 1890Practice Problem: weight 2,200, PA 3500, Temp 10 C, 50-Ft Obs. Distance= 1797.5
Ground School 2011 Created by Steve Reisser
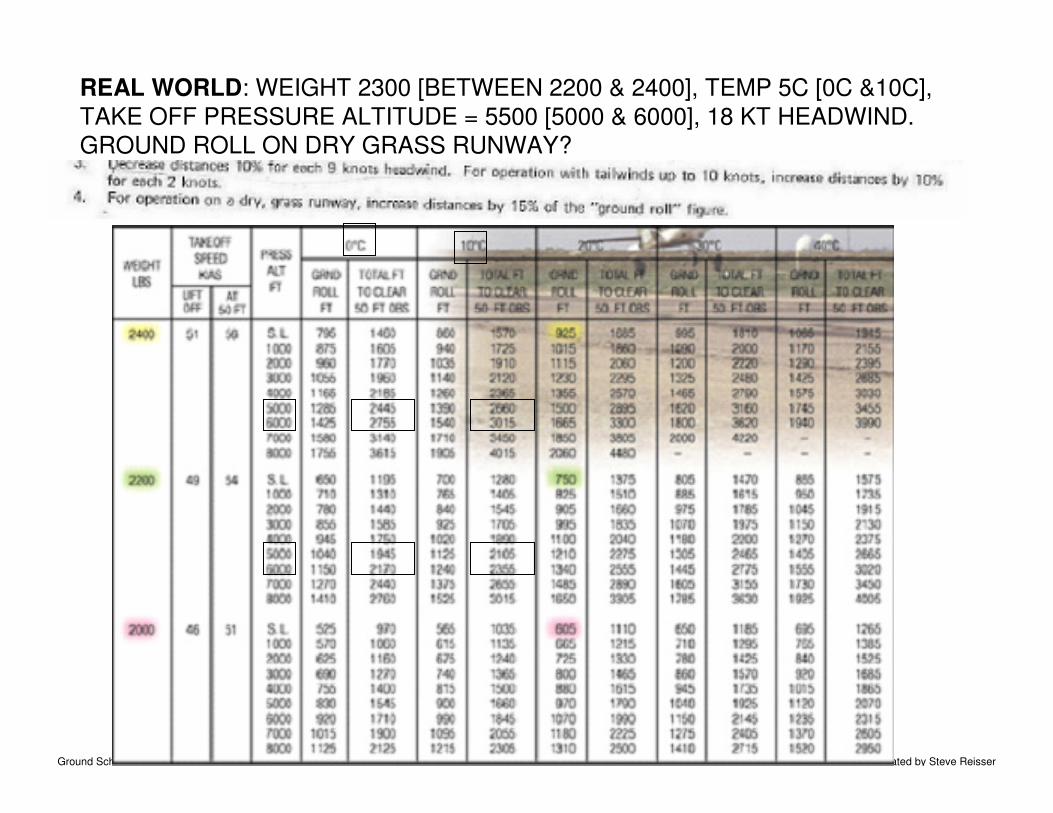
REAL WORLD: WEIGHT 2300 [BETWEEN 2200 & 2400], TEMP 5C [0C &10C],
TAKE OFF PRESSURE ALTITUDE = 5500 [5000 & 6000], 18 KT HEADWIND.
GROUND ROLL ON DRY GRASS RUNWAY?
Ground School 2011 Created by Steve Reisser
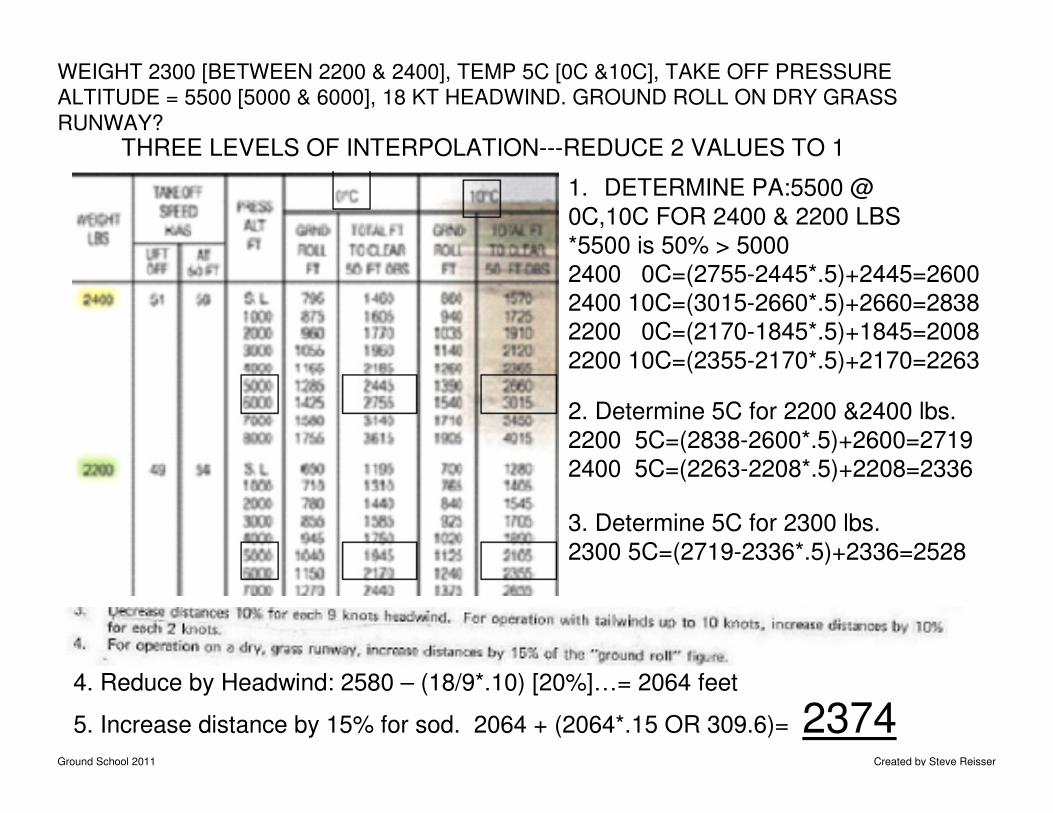
WEIGHT 2300 [BETWEEN 2200 & 2400], TEMP 5C [0C &10C], TAKE OFF PRESSURE
ALTITUDE = 5500 [5000 & 6000], 18 KT HEADWIND. GROUND ROLL ON DRY GRASS
RUNWAY?
THREE LEVELS OF INTERPOLATION---REDUCE 2 VALUES TO 1
1. DETERMINE PA:5500 @
0C,10C FOR 2400 & 2200 LBS
*5500 is 50% > 5000
2400 0C=(2755-2445*.5)+2445=2600
2400 10C=(3015-2660*.5)+2660=2838
2200 0C=(2170-1845*.5)+1845=2008
2200 10C=(2355-2170*.5)+2170=2263
2. Determine 5C for 2200 &2400 lbs.
2200 5C=(2838-2600*.5)+2600=2719
2400 5C=(2263-2208*.5)+2208=2336
3. Determine 5C for 2300 lbs.
2300 5C=(2719-2336*.5)+2336=2528
4. Reduce by Headwind: 2580 – (18/9*.10) [20%]…= 2064 feet
5. Increase distance by 15% for sod. 2064 + (2064*.15 OR 309.6)= 2374
Ground School 2011 Created by Steve Reisser
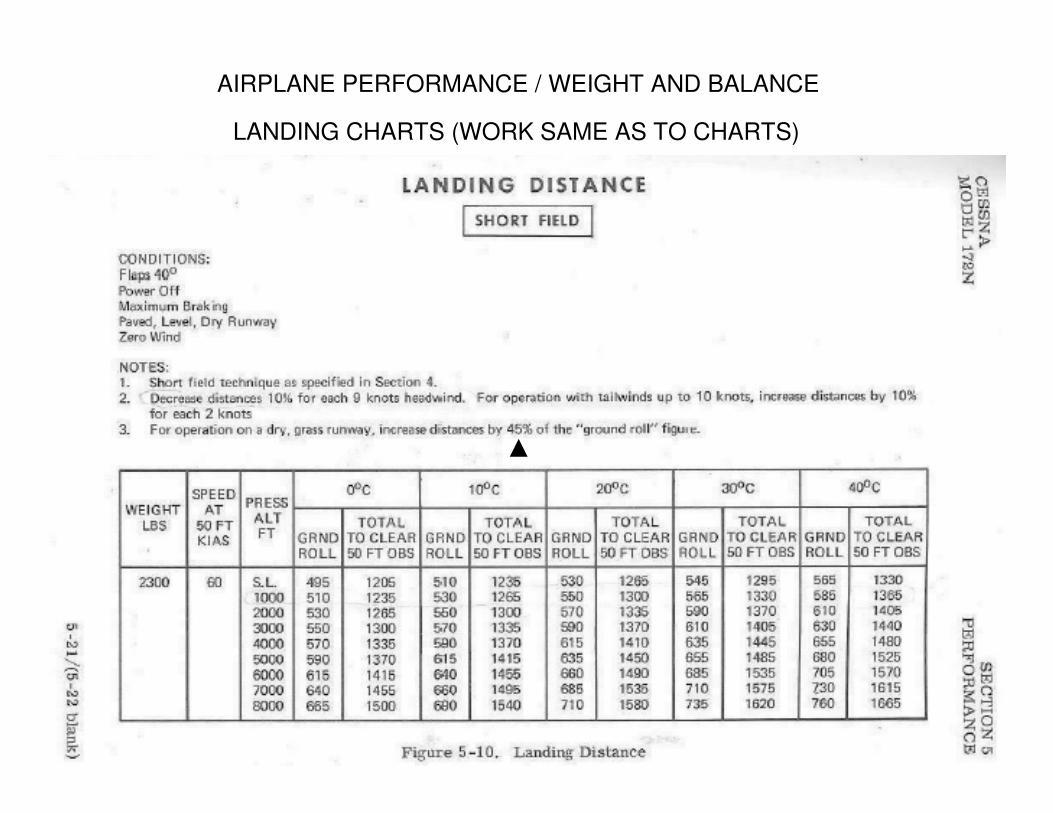
AIRPLANE PERFORMANCE / WEIGHT AND BALANCE
LANDING CHARTS (WORK SAME AS TO CHARTS)
Ground School 2011 Created by Steve Reisser
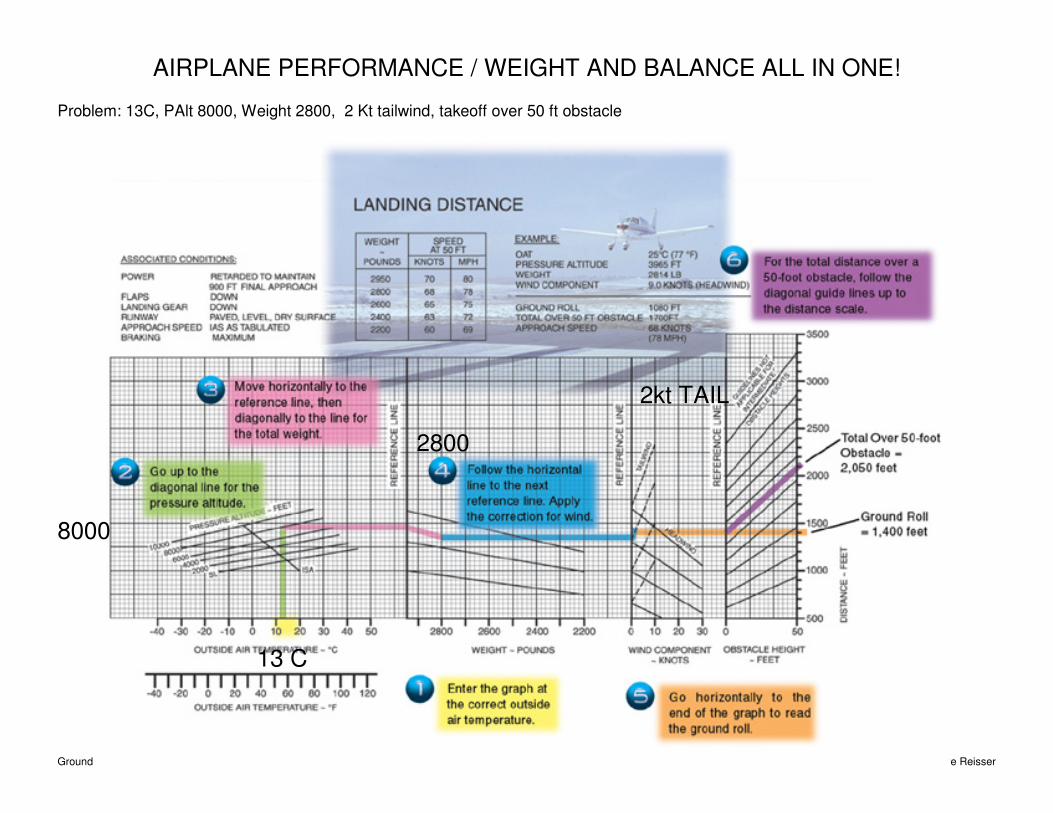
AIRPLANE PERFORMANCE / WEIGHT AND BALANCE ALL IN ONE!
Problem: 13C, PAlt 8000, Weight 2800, 2 Kt tailwind, takeoff over 50 ft obstacle
13 C
8000
2800
2kt TAIL
Ground School 2011 Created by Steve Reisser
AIRPLANE PERFORMANCE / WEIGHT AND BALANCE
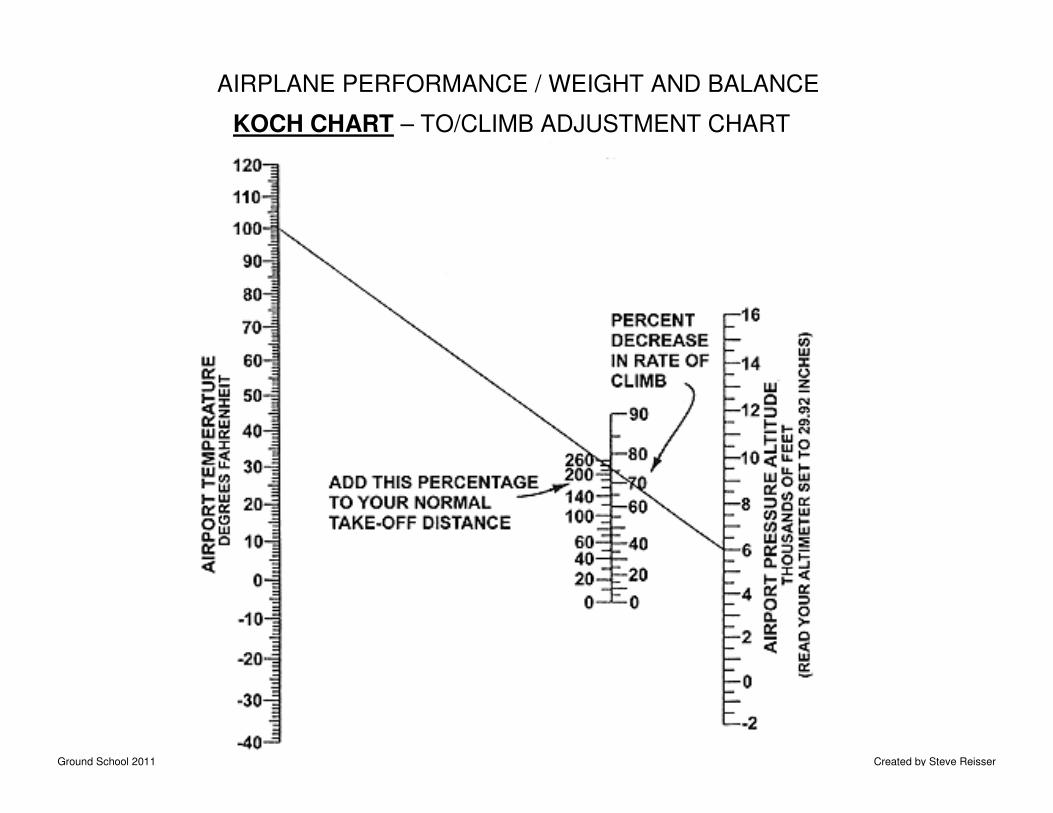
KOCH CHART – TO/CLIMB ADJUSTMENT CHART
Ground School 2011 Created by Steve Reisser
AIRPLANE PERFORMANCE / WEIGHT AND BALANCE
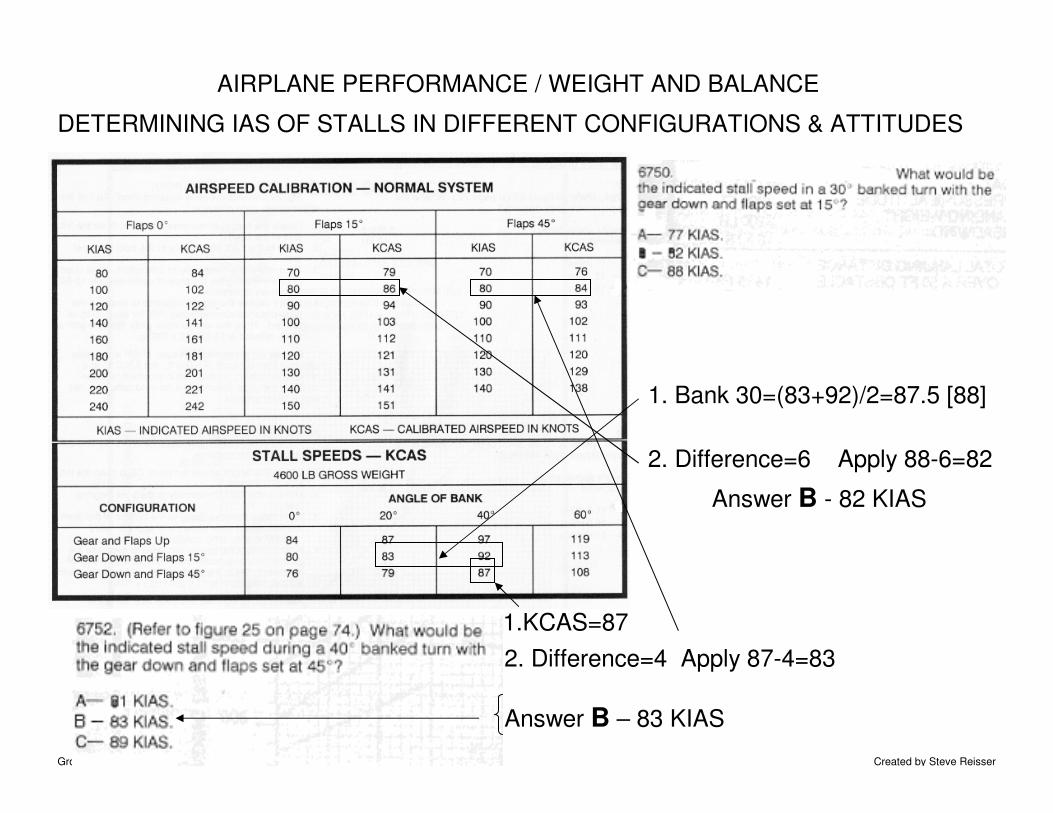
DETERMINING IAS OF STALLS IN DIFFERENT CONFIGURATIONS & ATTITUDES
1. Bank 30=(83+92)/2=87.5 [88]
2. Difference=6 Apply 88-6=82
Answer B - 82 KIAS
1.KCAS=87
2. Difference=4 Apply 87-4=83
Answer B – 83 KIAS
Ground School 2011 Created by Steve Reisser
AIRPLANE PERFORMANCE / WEIGHT AND BALANCE
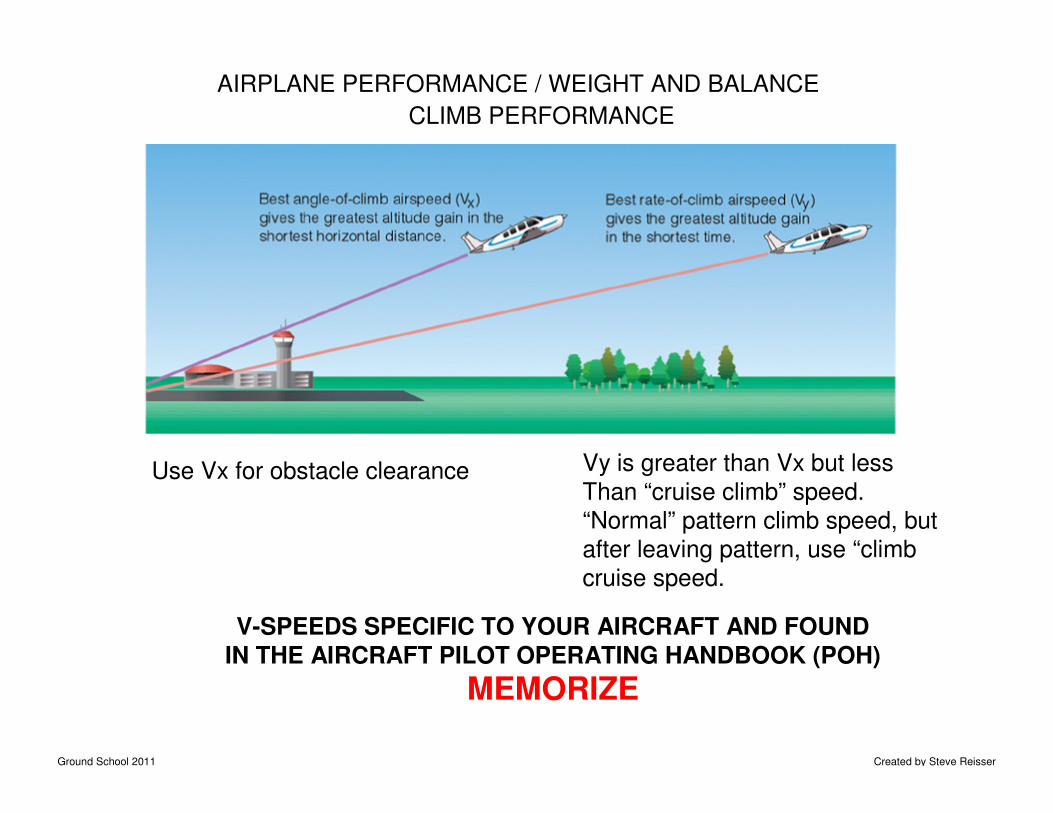
CLIMB PERFORMANCE
Use Vx for obstacle clearance Vy is greater than Vx but less
Than “cruise climb” speed.
“Normal” pattern climb speed, but
after leaving pattern, use “climb
cruise speed.
V-SPEEDS SPECIFIC TO YOUR AIRCRAFT AND FOUND
IN THE AIRCRAFT PILOT OPERATING HANDBOOK (POH)
MEMORIZE
Ground School 2011 Created by Steve Reisser
AIRPLANE PERFORMANCE / WEIGHT AND BALANCE
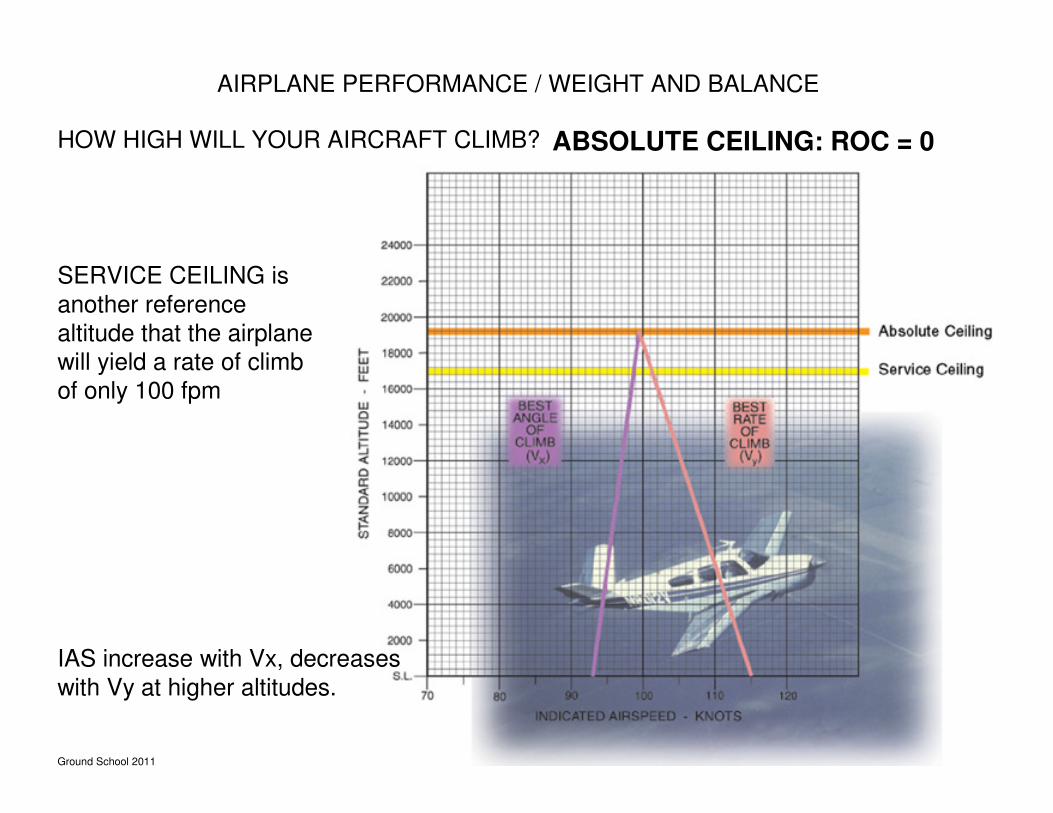
HOW HIGH WILL YOUR AIRCRAFT CLIMB? ABSOLUTE CEILING: ROC = 0
SERVICE CEILING is
another reference
altitude that the airplane
will yield a rate of climb
of only 100 fpm
IAS increase with Vx, decreases
with Vy at higher altitudes.

Ground School 2011 Created by Steve Reisser
AIRPLANE PERFORMANCE / WEIGHT AND BALANCE
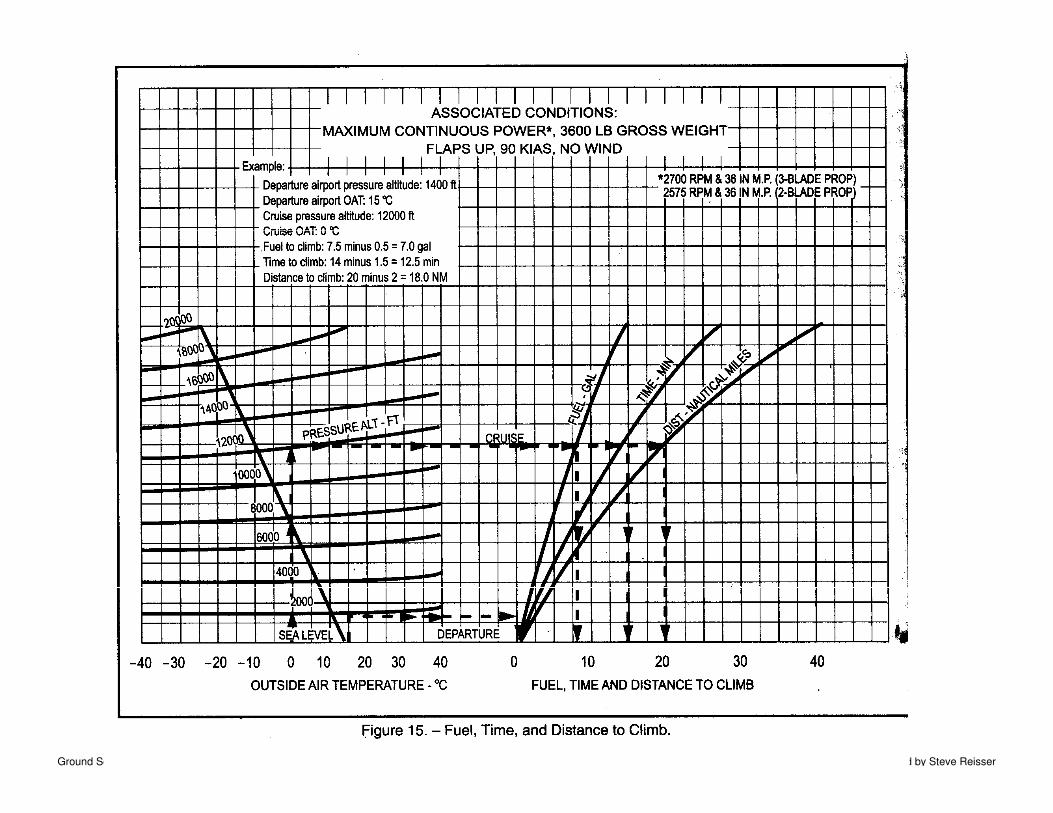
POH Data saves time
In determining Time, Fuel,
Distance.
What if you don’t TO at SL?
Climbing 2000-8000?
(Subtract base values)
8000=17 Min, 3.1 Gals., 22 Miles.
Subtract 2000 values (3, .6, 4) Yields 14 Min., 2.5 Gals., 18 Miles
Ground School 2011 Created by Steve Reisser
Fuel Efficiency: SPECIFIC RANGE
Most cars are compared on fuel efficiency by using miles per gallon. Airplane fuel
efficiency is often given as “Specific Range.” It is a value derived by dividing the range
in nautical miles by the pounds of fuel burned. Instead of miles per gallon, it represents
miles per pound of fuel. It is a good method for comparing performance between
different aircraft.
As an example, a piston airplane with a true airspeed of 150 knots while burning 12
gallons per hour (72 pounds) would have a very good specific range of 2.08. A business
jet cruising at 440 knots true burning 1,200 pounds per hour (pph) has a specific range
of 0.37, good for a jet.
In general, LSA’s are more efficient than other general aviation aircraft except for motor-
gliders. LSA’s have specific ranges in the 4-5 as compared to 1-2’s for many
single engine general aviation aircraft. General aviation aircraft can get much better
specific ranges by reducing power to 55-65% and only sacrificing a small airspeedloss but getting much higher specific range and also total available range. For example
a twin-engine Baron flying 170Kts burns 30 GPH, but reducing power to maintain 120Kts
only burns 16 GPH. The specific range increases from .94 to 1.2 which is a 26%
increase in range with only a 30% decrease in airspeed. The same holds true for all
classes of aircraft.
Another thing to remember that airlines practice to the extreme is that a lighter aircraft
has to use less power and therefore is more fuel efficient.
Ground School 2011 Created by Steve Reisser
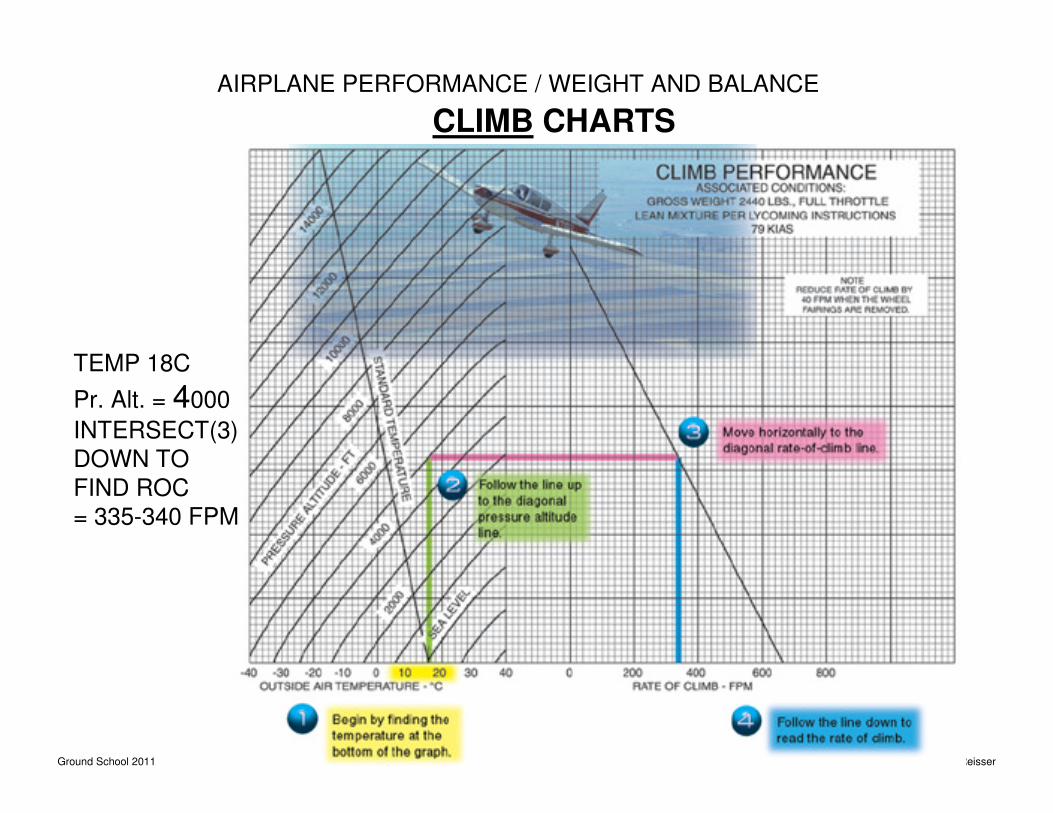
AIRPLANE PERFORMANCE / WEIGHT AND BALANCE
CLIMB CHARTS
TEMP 18C
Pr. Alt. = 4000
INTERSECT(3)
DOWN TO
FIND ROC
= 335-340 FPM
Ground School 2011 Created by Steve Reisser
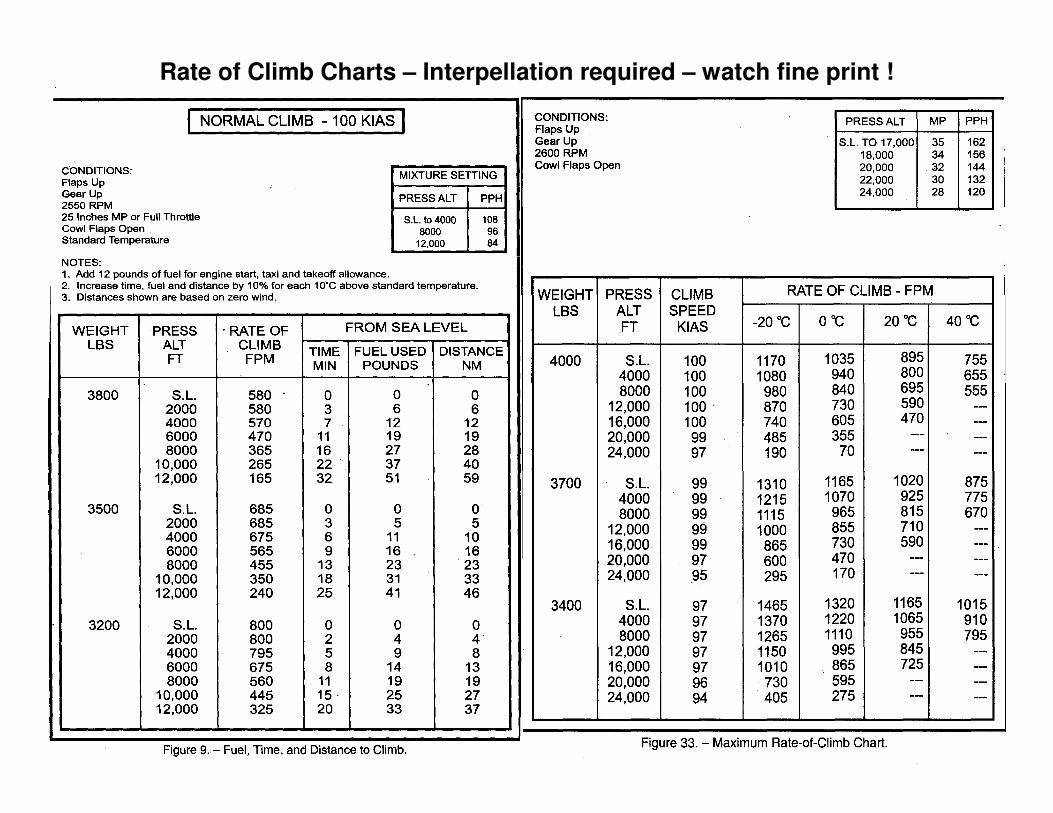
Rate of Climb Charts – Interpellation required – watch fine print !
Ground School 2011 Created by Steve Reisser
Ground School 2011 Created by Steve Reisser
AIRPLANE PERFORMANCE / WEIGHT AND BALANCE
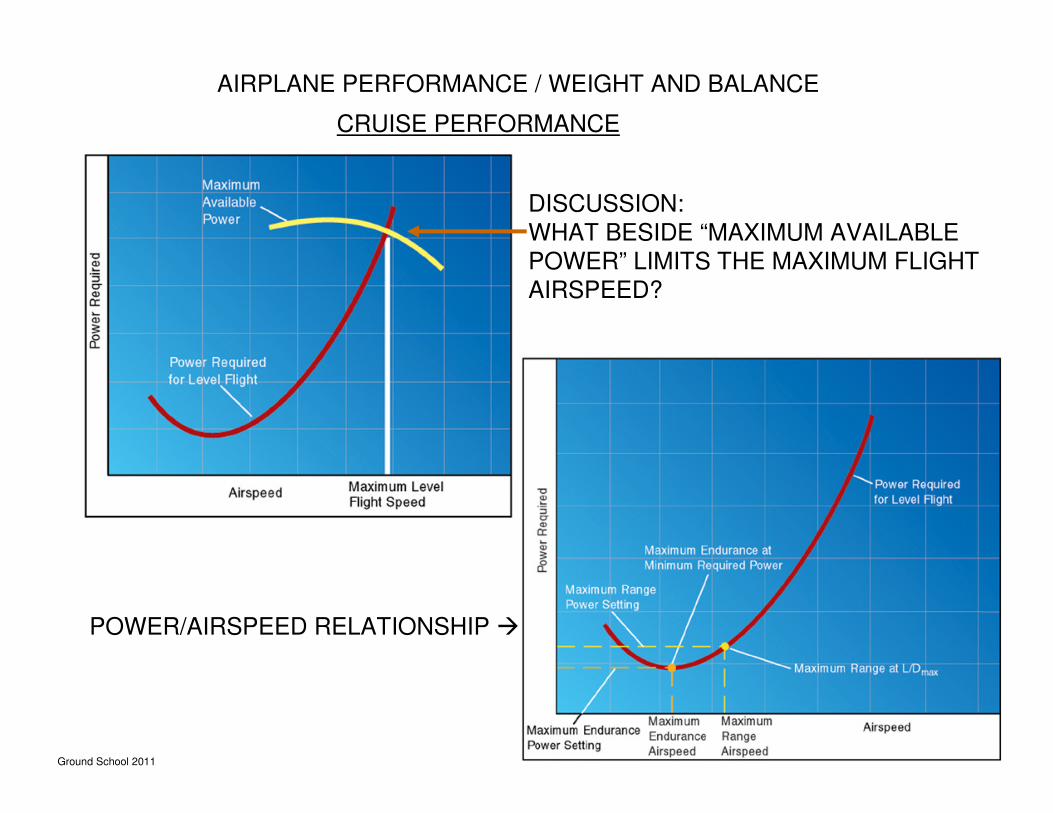
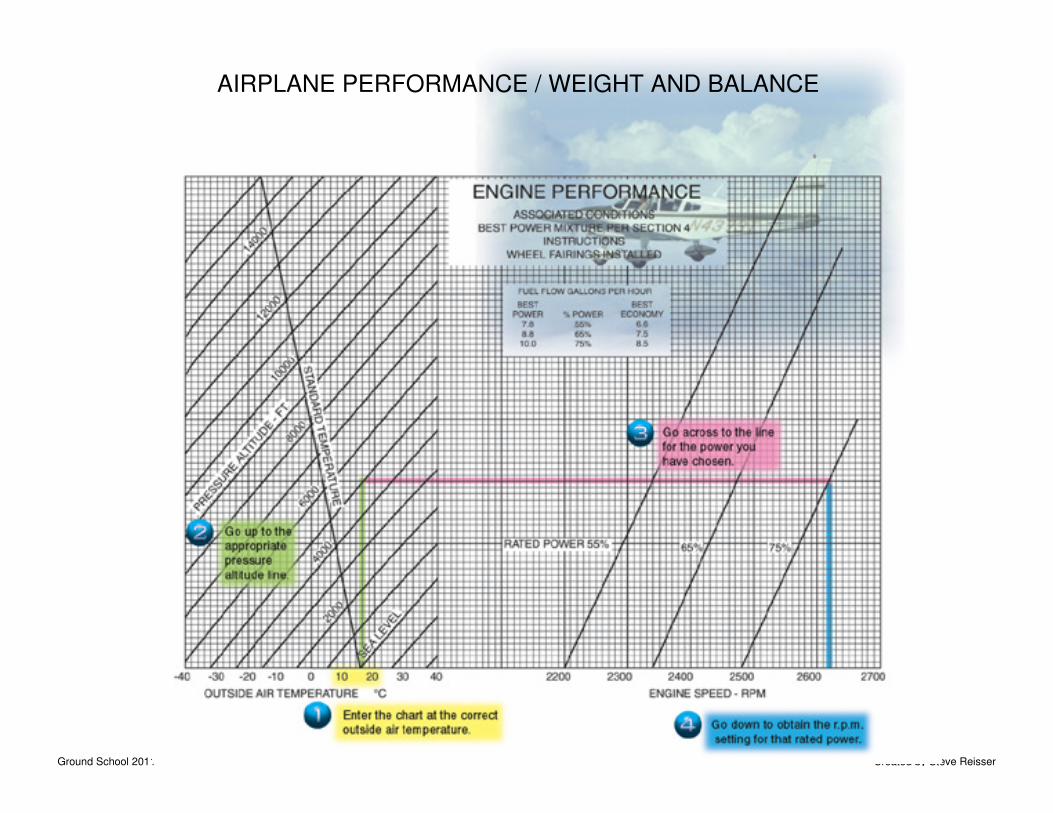
CRUISE PERFORMANCE
DISCUSSION:
WHAT BESIDE “MAXIMUM AVAILABLE
POWER” LIMITS THE MAXIMUM FLIGHT
AIRSPEED?
POWER/AIRSPEED RELATIONSHIP �
Ground School 2011 Created by Steve Reisser
AIRPLANE PERFORMANCE / WEIGHT AND BALANCE
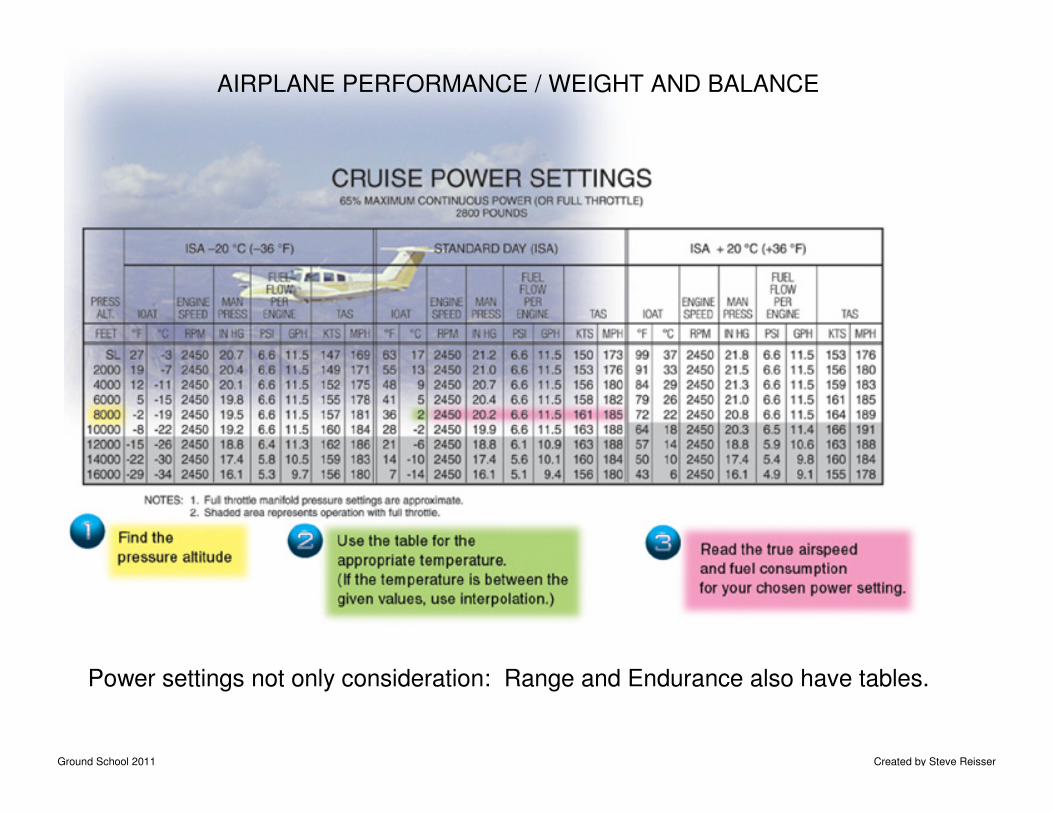
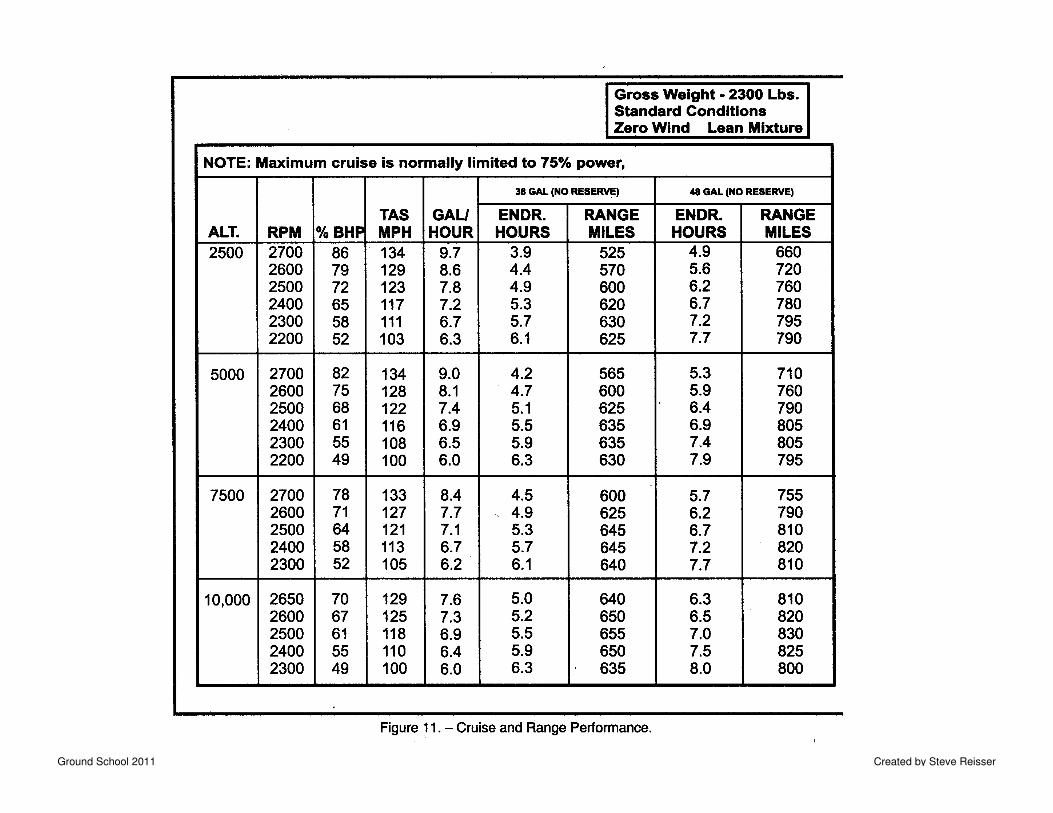
Power settings not only consideration: Range and Endurance also have tables.
Ground School 2011 Created by Steve Reisser
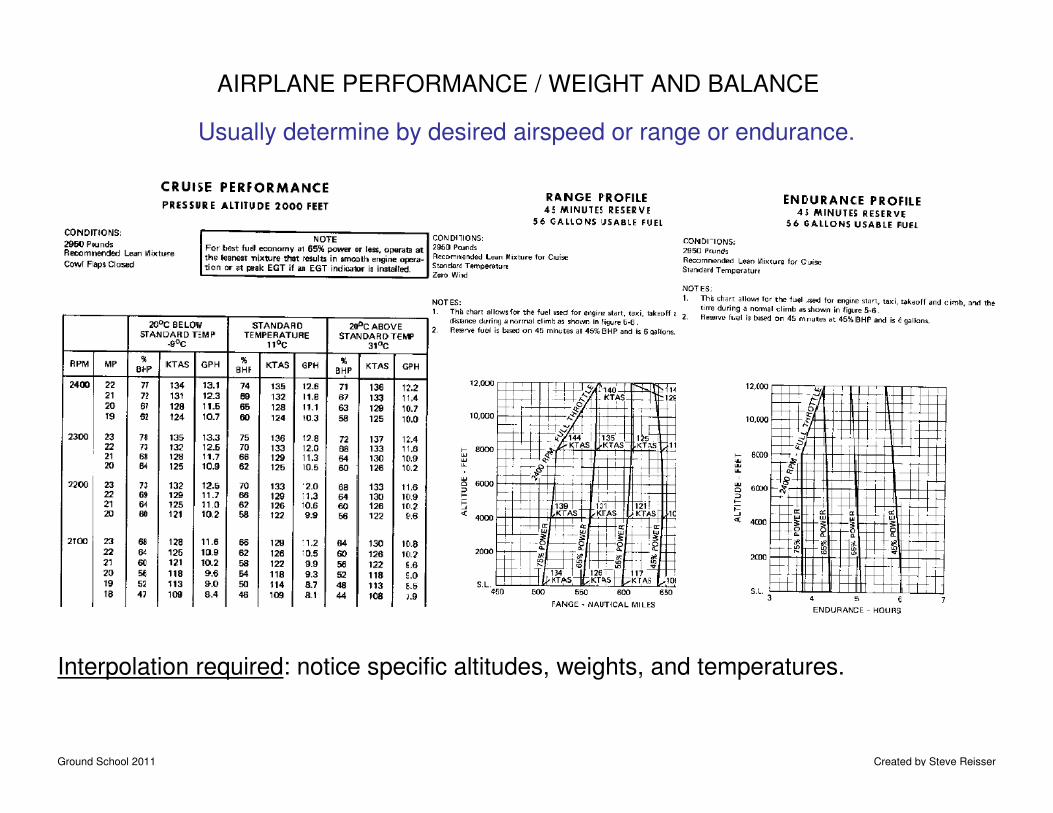
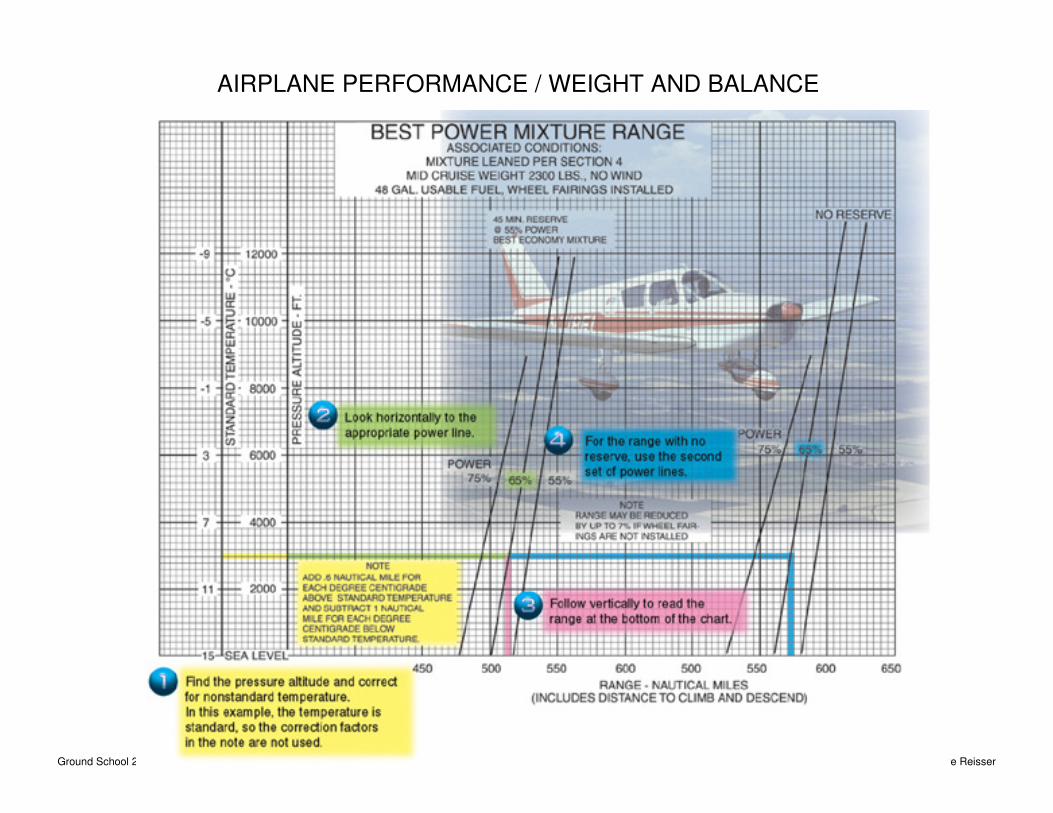
Usually determine by desired airspeed or range or endurance.
AIRPLANE PERFORMANCE / WEIGHT AND BALANCE
Interpolation required: notice specific altitudes, weights, and temperatures.
Ground School 2011 Created by Steve Reisser
AIRPLANE PERFORMANCE / WEIGHT AND BALANCE
Ground School 2011 Created by Steve Reisser
AIRPLANE PERFORMANCE / WEIGHT AND BALANCE
Ground School 2011 Created by Steve Reisser


![Mrunal » [Answerkey] CSAT 2013 GS_ Geography_ Physical, Indian, World Geography Questions solved with explanation, reference, all four sets (A,B,C,D) » Print](https://img.pdfslide.us/doc/110x75/55cf9a76550346d033a1d7c6/mrunal-answerkey-csat-2013-gs-geography-physical-indian-world-geography.jpg)