Embed Size (px)
Citation preview
FAA CENTER OF EXCELLENCE FOR ALTERNATIVE JET FUELS & ENVIRONMENT
Project manager: László Windhoffer, FAAGeorgia Tech (Lead University): Dimitri Mavris (PI), Jimmy Tai (Co-PI)
Purdue: Daniel DeLaurentis, William Crossley (PIs)Stanford: Juan J. Alonso (PI)
Aircraft Technology Modeling and AssessmentProject 10
Opinions, findings, conclusions and recommendations expressed in this material are those of the author(s)and do not necessarily reflect the views of ASCENT sponsor organizations.
2
Overview
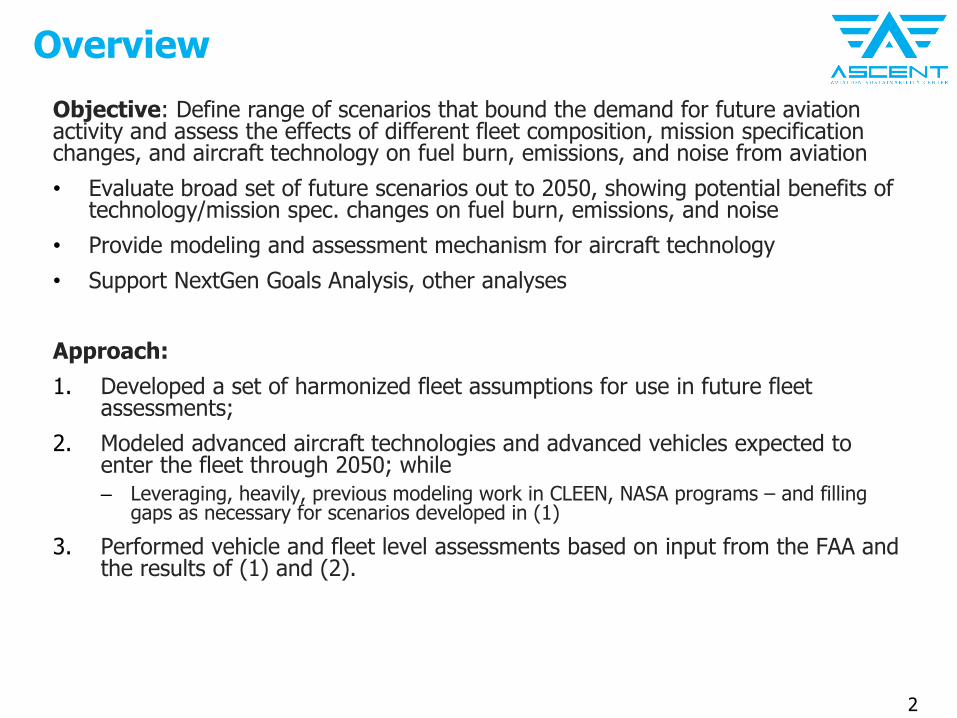
Objective: Define range of scenarios that bound the demand for future aviation activity and assess the effects of different fleet composition, mission specification changes, and aircraft technology on fuel burn, emissions, and noise from aviation
• Evaluate broad set of future scenarios out to 2050, showing potential benefits of technology/mission spec. changes on fuel burn, emissions, and noise
• Provide modeling and assessment mechanism for aircraft technology
• Support NextGen Goals Analysis, other analyses
Approach:
1. Developed a set of harmonized fleet assumptions for use in future fleet assessments;
2. Modeled advanced aircraft technologies and advanced vehicles expected to enter the fleet through 2050; while
– Leveraging, heavily, previous modeling work in CLEEN, NASA programs – and filling gaps as necessary for scenarios developed in (1)
3. Performed vehicle and fleet level assessments based on input from the FAA and the results of (1) and (2).
3
Team Approach to Tasks
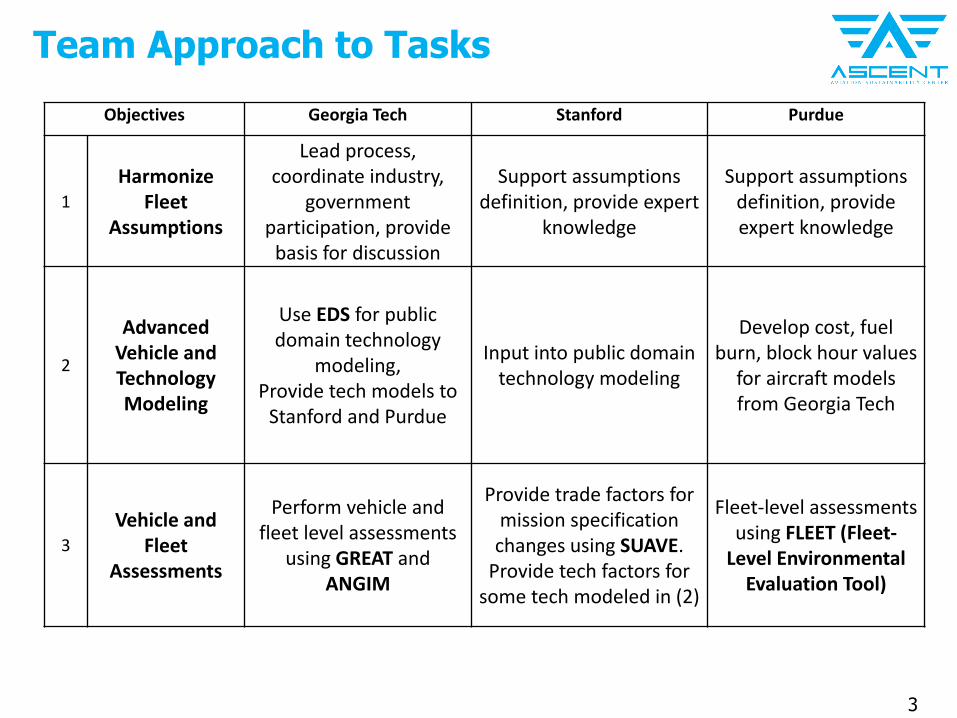
Objectives Georgia Tech Stanford Purdue
1
Harmonize Fleet
Assumptions
Lead process, coordinate industry,
government participation, provide
basis for discussion
Support assumptions definition, provide expert
knowledge
Support assumptions definition, provide expert knowledge
2
Advanced Vehicle and Technology Modeling
Use EDS for public domain technology
modeling,Provide tech models to
Stanford and Purdue
Input into public domain technology modeling
Develop cost, fuelburn, block hour values
for aircraft models from Georgia Tech
3
Vehicle and Fleet
Assessments
Perform vehicle and fleet level assessments
using GREAT and ANGIM
Provide trade factors for mission specification
changes using SUAVE. Provide tech factors for
some tech modeled in (2)
Fleet-level assessments using FLEET (Fleet-
Level Environmental Evaluation Tool)
4
Airline Fleet
AllocationEnvironmental
Impact Metrics
Environmental
PolicyEnvironmental
Constraints
Fuel Tax
Projected
Demand
Total OC
Aircraft
Performance
MetricsAvailable Aircraft
Fleet
Biofuels Price
Fuel DOC
Non-fuel
DOC + IOC
Fare
Fare Yield
Price-Demand
Elasticity
Inherent
Demand
GDP Growth
Initial
Fleet
Improved
Operational
Concepts and
Technologies
FLOPS Models
Aircraft Technology
PortfolioOperating
Aircraft Fleet
Aircraft
Retirement
Aircraft
Delivery
EIS
Dates
Aircraft
Production
Airport Capacity
Constraints
Economic Factors
Market Factors
Aircraft Factors
Environmental Factors
Airline
Profit
EIA Fuel
Price
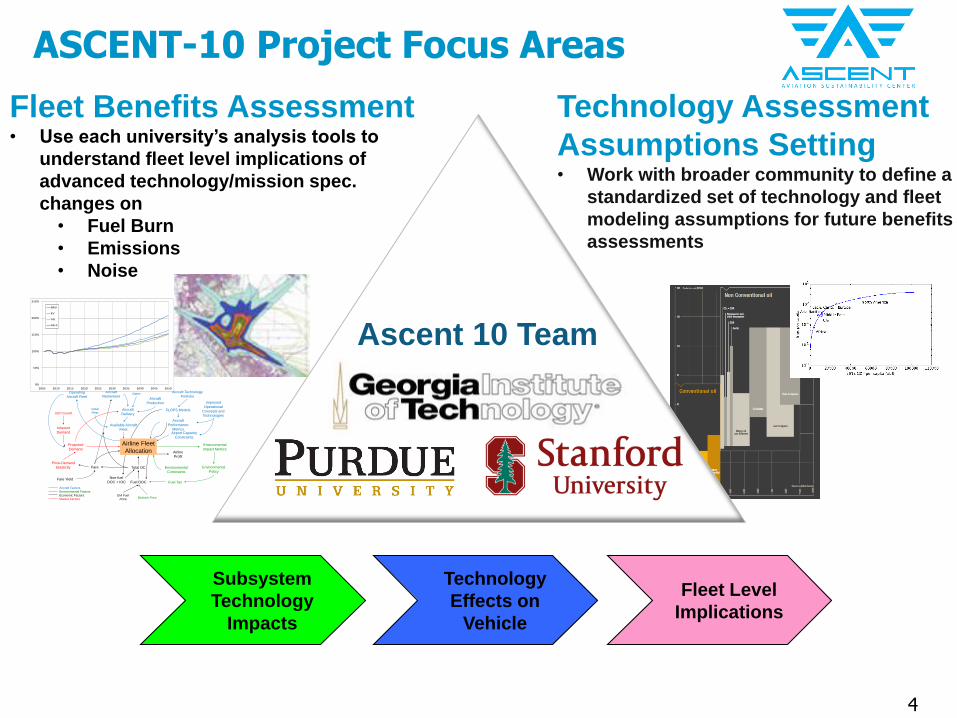
ASCENT-10 Project Focus Areas
Ascent 10 Team
Fleet Benefits Assessment• Use each university’s analysis tools to
understand fleet level implications of
advanced technology/mission spec.
changes on
• Fuel Burn
• Emissions
• Noise
Technology Assessment
Assumptions Setting• Work with broader community to define a
standardized set of technology and fleet
modeling assumptions for future benefits
assessments
0%
50%
100%
150%
200%
250%
2005 2010 2015 2020 2025 2030 2035 2040 2045 2050
BAU
EV
AG
AG-C
Subsystem
Technology
Impacts
Technology
Effects on
Vehicle
Fleet Level
Implications
5
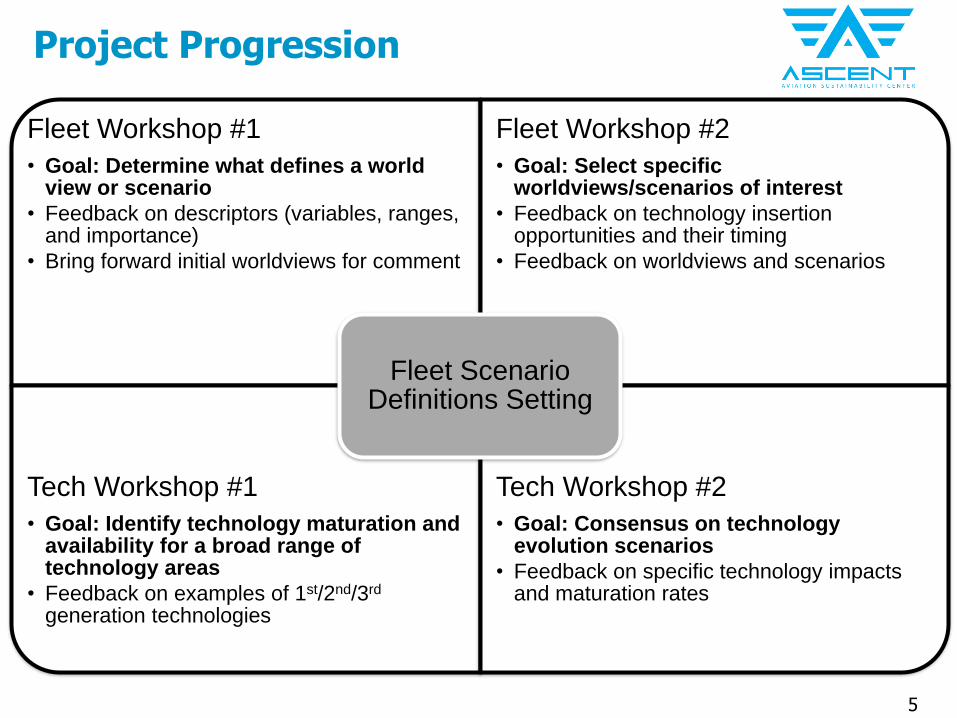
Project Progression
Fleet Workshop #1
• Goal: Determine what defines a world view or scenario
• Feedback on descriptors (variables, ranges, and importance)
• Bring forward initial worldviews for comment
Fleet Workshop #2
• Goal: Select specific worldviews/scenarios of interest
• Feedback on technology insertion opportunities and their timing
• Feedback on worldviews and scenarios
Tech Workshop #1
• Goal: Identify technology maturation and availability for a broad range of technology areas
• Feedback on examples of 1st/2nd/3rd
generation technologies
Tech Workshop #2
• Goal: Consensus on technology evolution scenarios
• Feedback on specific technology impacts and maturation rates
Fleet Scenario Definitions Setting
6
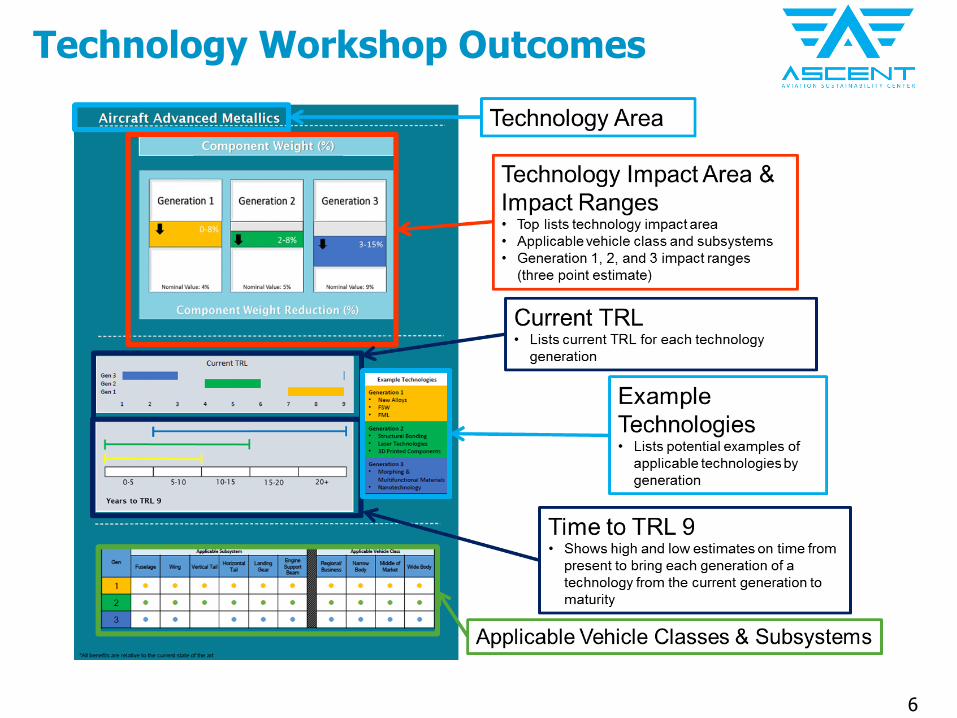
Technology Workshop Outcomes
7
Aircraft Technology Energy PriceEconomic Growth
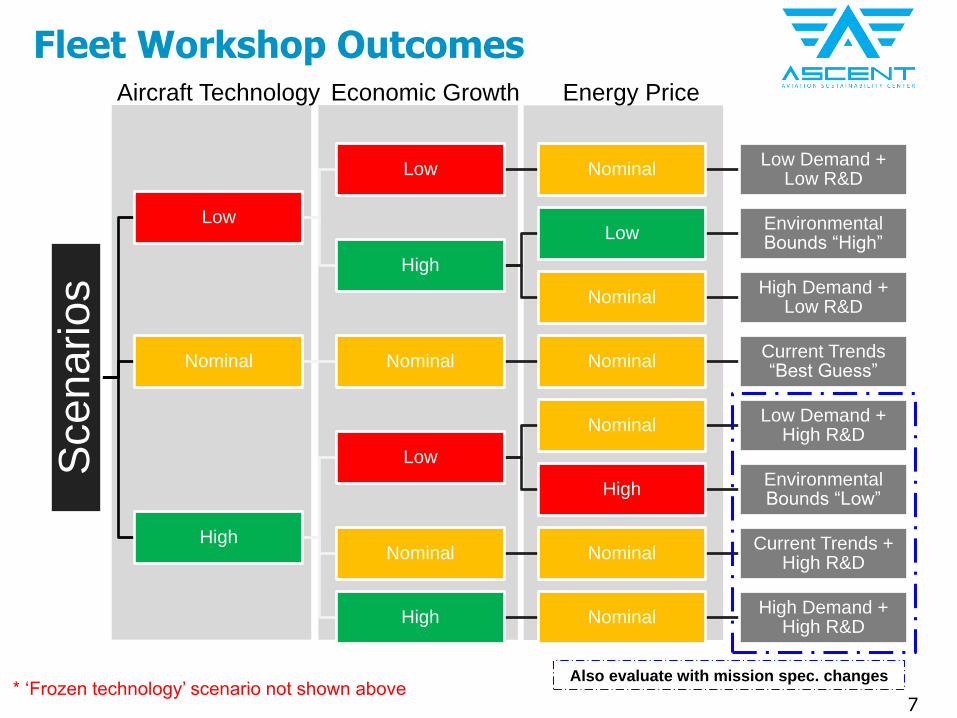
Fleet Workshop OutcomesS
ce
narios
Low
Low NominalLow Demand +
Low R&D
High
LowEnvironmental Bounds “High”
NominalHigh Demand +
Low R&D
Nominal Nominal NominalCurrent Trends “Best Guess”
High
Low
NominalLow Demand +
High R&D
HighEnvironmental Bounds “Low”
Nominal NominalCurrent Trends +
High R&D
High NominalHigh Demand +
High R&D
* ‘Frozen technology’ scenario not shown aboveAlso evaluate with mission spec. changes
8
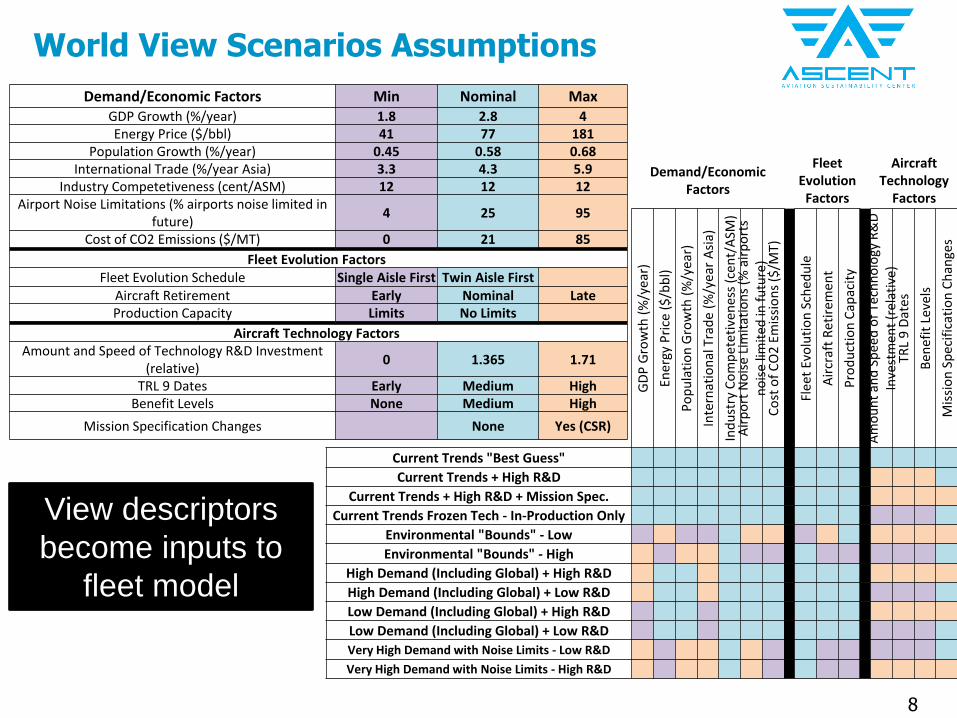
World View Scenarios Assumptions
Demand/Economic Factors
Fleet Evolution
Factors
Aircraft Technology
Factors
GD
P G
row
th (
%/y
ear)
Ener
gy P
rice
($
/bb
l)
Po
pu
lati
on
Gro
wth
(%
/yea
r)
Inte
rnat
ion
al T
rad
e (%
/yea
r A
sia)
Ind
ust
ry C
om
pet
etiv
enes
s (c
ent/
ASM
)A
irp
ort
No
ise
Lim
itat
ion
s (%
air
po
rts
no
ise
limit
ed in
fu
ture
)C
ost
of
CO
2 E
mis
sio
ns
($/M
T)
Flee
t Ev
olu
tio
n S
ched
ule
Air
craf
t R
etir
emen
t
Pro
du
ctio
n C
apac
ity
Am
ou
nt
and
Sp
eed
of
Tech
no
logy
R&
D
Inve
stm
ent
(rel
ativ
e)TR
L 9
Dat
es
Ben
efit
Lev
els
Mis
sio
n S
pec
ific
atio
n C
han
ges
Current Trends "Best Guess"
Current Trends + High R&D
Current Trends + High R&D + Mission Spec.
Current Trends Frozen Tech - In-Production Only
Environmental "Bounds" - Low
Environmental "Bounds" - High
High Demand (Including Global) + High R&D
High Demand (Including Global) + Low R&D
Low Demand (Including Global) + High R&D
Low Demand (Including Global) + Low R&D
Very High Demand with Noise Limits - Low R&D
Very High Demand with Noise Limits - High R&D
Demand/Economic Factors Min Nominal MaxGDP Growth (%/year) 1.8 2.8 4Energy Price ($/bbl) 41 77 181
Population Growth (%/year) 0.45 0.58 0.68International Trade (%/year Asia) 3.3 4.3 5.9
Industry Competetiveness (cent/ASM) 12 12 12Airport Noise Limitations (% airports noise limited in
future)4 25 95
Cost of CO2 Emissions ($/MT) 0 21 85
Fleet Evolution FactorsFleet Evolution Schedule Single Aisle First Twin Aisle First
Aircraft Retirement Early Nominal LateProduction Capacity Limits No Limits
Aircraft Technology FactorsAmount and Speed of Technology R&D Investment
(relative)0 1.365 1.71
TRL 9 Dates Early Medium HighBenefit Levels None Medium High
Mission Specification Changes None Yes (CSR)
View descriptors
become inputs to
fleet model
9
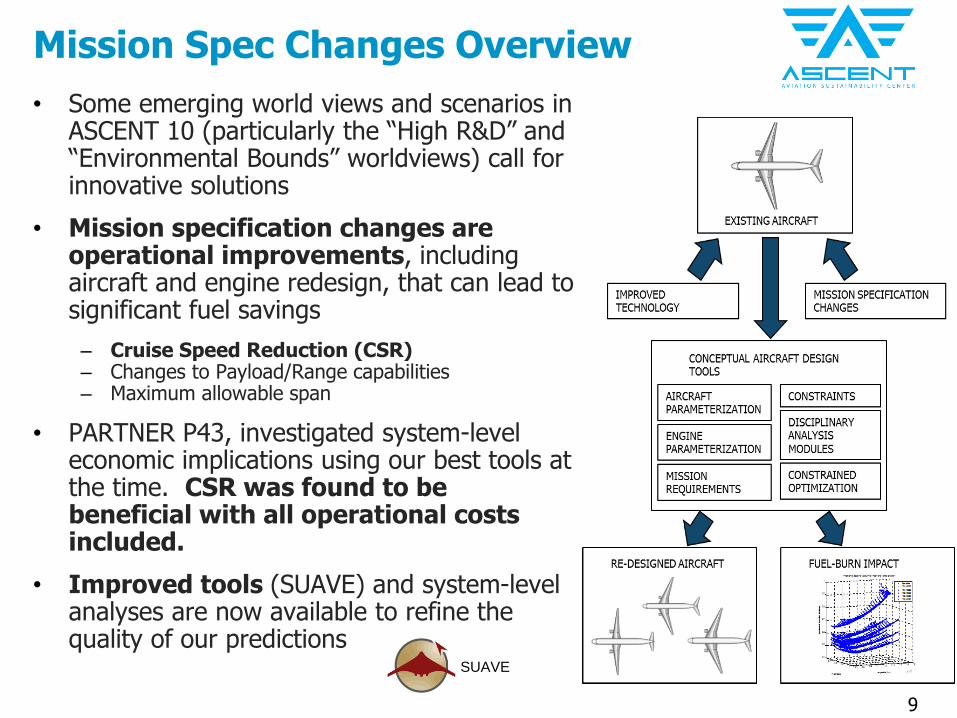
Mission Spec Changes Overview
• Some emerging world views and scenarios in ASCENT 10 (particularly the “High R&D” and “Environmental Bounds” worldviews) call for innovative solutions
• Mission specification changes are operational improvements, including aircraft and engine redesign, that can lead to significant fuel savings
– Cruise Speed Reduction (CSR)– Changes to Payload/Range capabilities– Maximum allowable span
• PARTNER P43, investigated system-level economic implications using our best tools at the time. CSR was found to be beneficial with all operational costs included.
• Improved tools (SUAVE) and system-level analyses are now available to refine the quality of our predictions
SUAVE
10
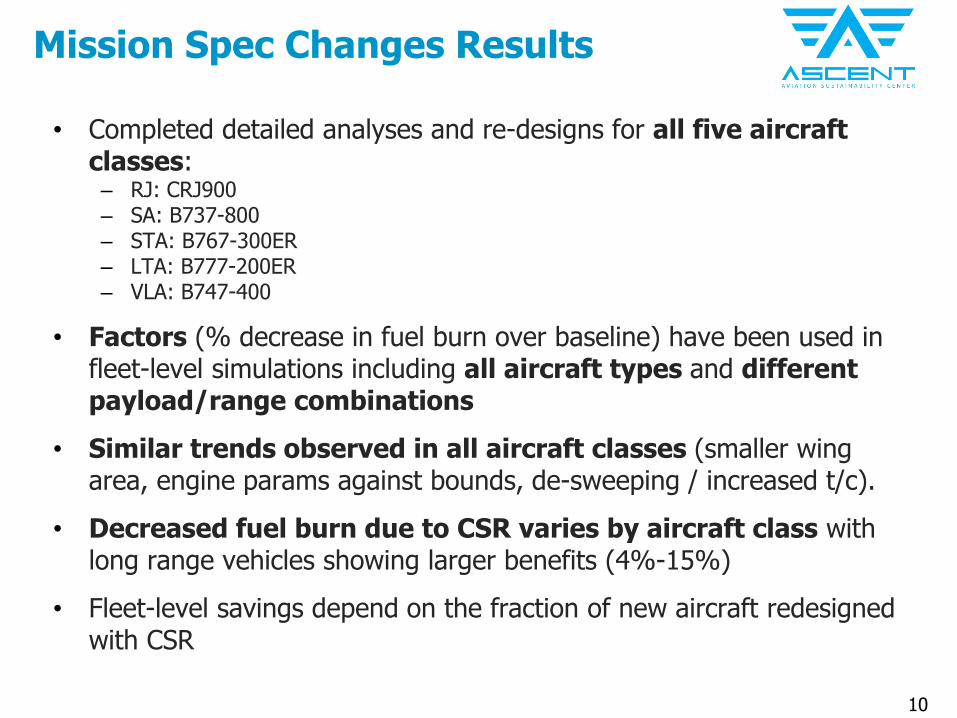
Mission Spec Changes Results
• Completed detailed analyses and re-designs for all five aircraft classes:– RJ: CRJ900– SA: B737-800– STA: B767-300ER– LTA: B777-200ER– VLA: B747-400
• Factors (% decrease in fuel burn over baseline) have been used in fleet-level simulations including all aircraft types and different payload/range combinations
• Similar trends observed in all aircraft classes (smaller wing area, engine params against bounds, de-sweeping / increased t/c).
• Decreased fuel burn due to CSR varies by aircraft class with long range vehicles showing larger benefits (4%-15%)
• Fleet-level savings depend on the fraction of new aircraft redesigned with CSR
11
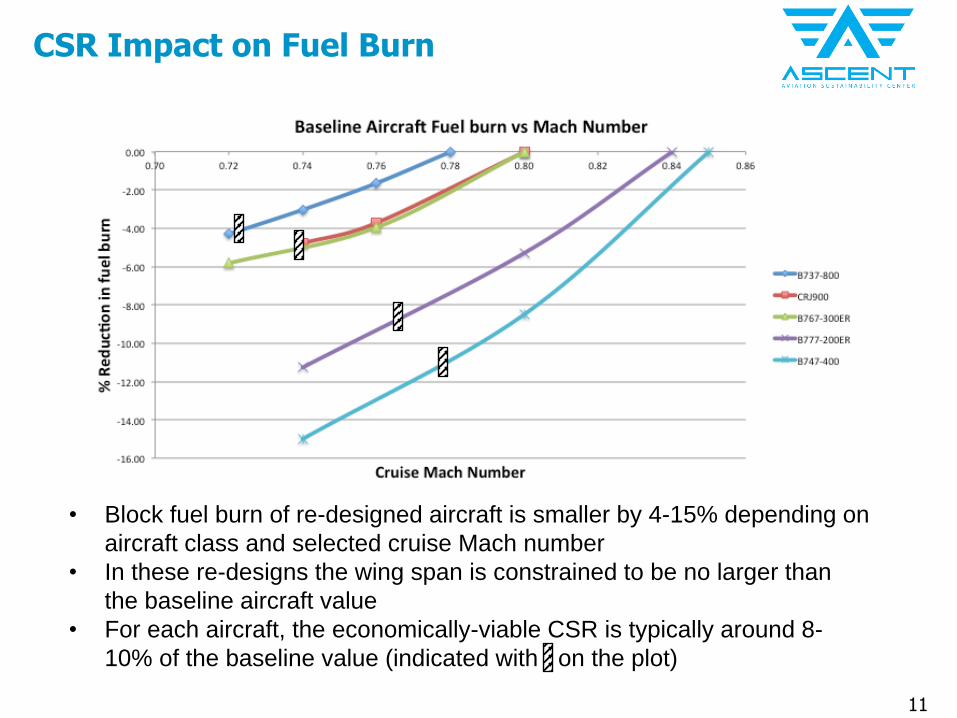
CSR Impact on Fuel Burn
• Block fuel burn of re-designed aircraft is smaller by 4-15% depending on
aircraft class and selected cruise Mach number
• In these re-designs the wing span is constrained to be no larger than
the baseline aircraft value
• For each aircraft, the economically-viable CSR is typically around 8-
10% of the baseline value (indicated with on the plot)
12
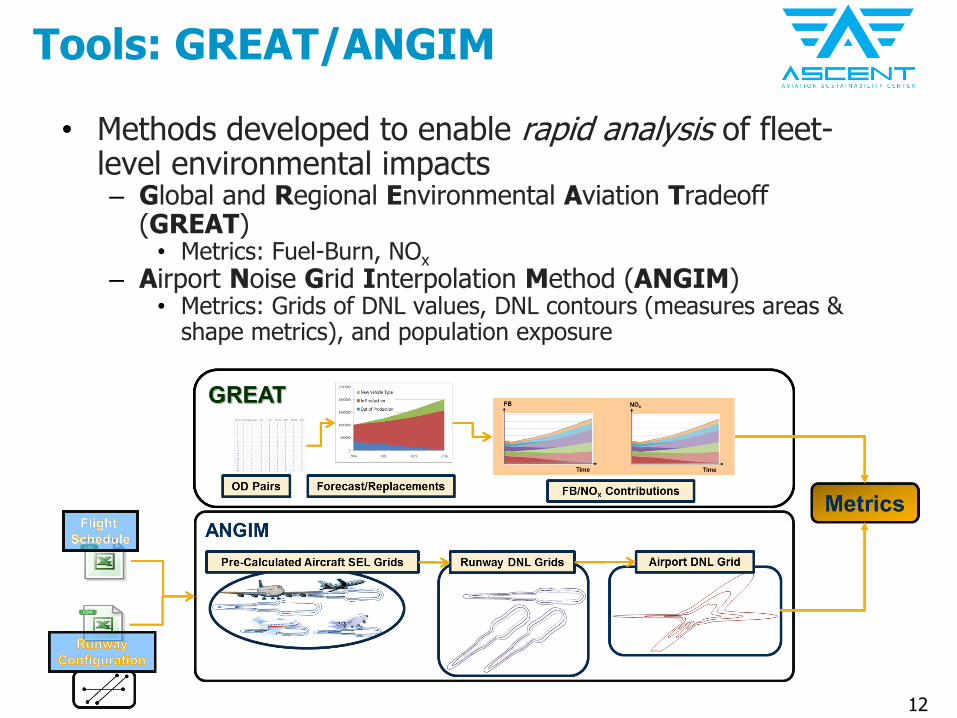
Tools: GREAT/ANGIM
• Methods developed to enable rapid analysis of fleet-level environmental impacts– Global and Regional Environmental Aviation Tradeoff
(GREAT)• Metrics: Fuel-Burn, NOx
– Airport Noise Grid Interpolation Method (ANGIM)• Metrics: Grids of DNL values, DNL contours (measures areas &
shape metrics), and population exposure

13
Tools: Fleet Level Environmental Evaluation Tool (FLEET)
14
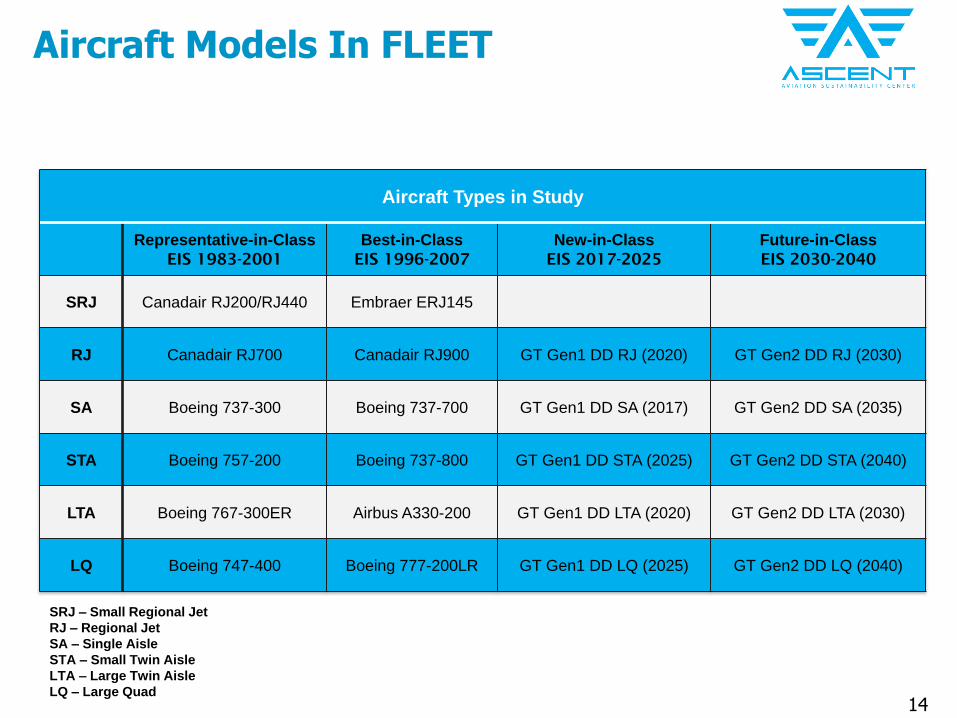
Aircraft Models In FLEET
Aircraft Types in Study
Representative-in-Class
EIS 1983-2001
Best-in-Class
EIS 1996-2007
New-in-Class
EIS 2017-2025
Future-in-Class
EIS 2030-2040
SRJ Canadair RJ200/RJ440 Embraer ERJ145
RJ Canadair RJ700 Canadair RJ900 GT Gen1 DD RJ (2020) GT Gen2 DD RJ (2030)
SA Boeing 737-300 Boeing 737-700 GT Gen1 DD SA (2017) GT Gen2 DD SA (2035)
STA Boeing 757-200 Boeing 737-800 GT Gen1 DD STA (2025) GT Gen2 DD STA (2040)
LTA Boeing 767-300ER Airbus A330-200 GT Gen1 DD LTA (2020) GT Gen2 DD LTA (2030)
LQ Boeing 747-400 Boeing 777-200LR GT Gen1 DD LQ (2025) GT Gen2 DD LQ (2040)
SRJ – Small Regional Jet
RJ – Regional Jet
SA – Single Aisle
STA – Small Twin Aisle
LTA – Large Twin Aisle
LQ – Large Quad
15
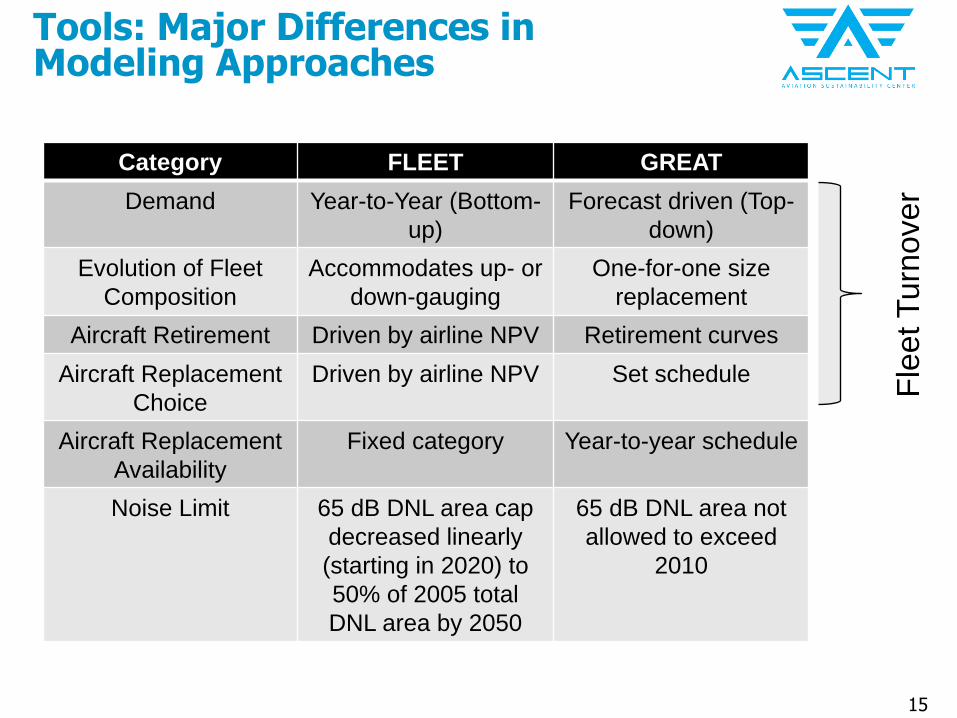
Tools: Major Differences in Modeling Approaches
Category FLEET GREAT
Demand Year-to-Year (Bottom-
up)
Forecast driven (Top-
down)
Evolution of Fleet
Composition
Accommodates up- or
down-gauging
One-for-one size
replacement
Aircraft Retirement Driven by airline NPV Retirement curves
Aircraft Replacement
Choice
Driven by airline NPV Set schedule
Aircraft Replacement
Availability
Fixed category Year-to-year schedule
Noise Limit 65 dB DNL area cap
decreased linearly
(starting in 2020) to
50% of 2005 total
DNL area by 2050
65 dB DNL area not
allowed to exceed
2010
Fle
et T
urn
over
16
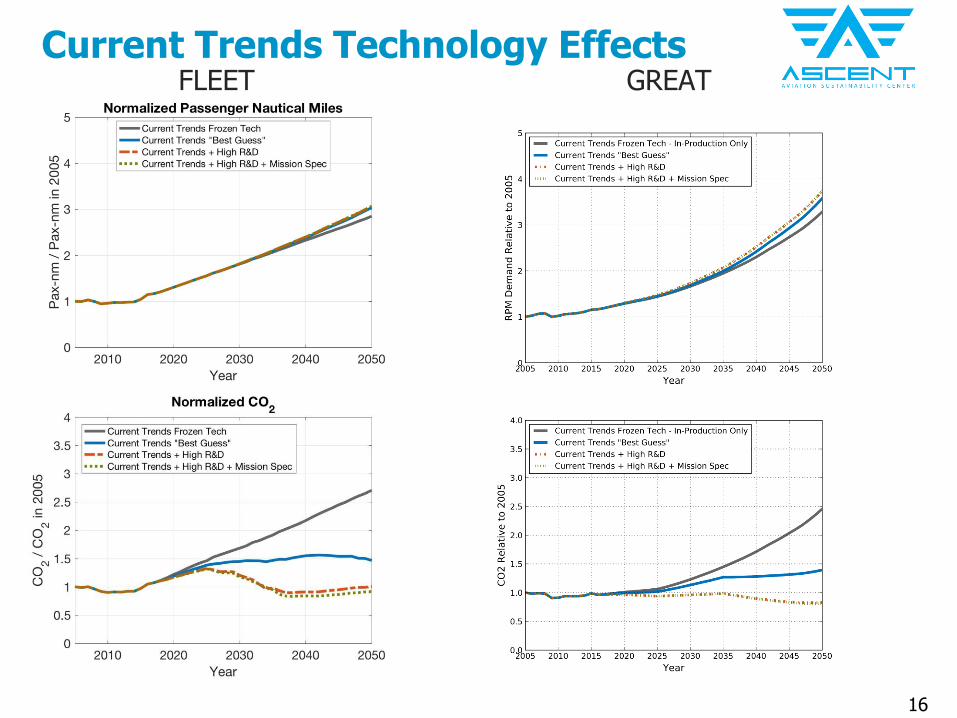
Current Trends Technology EffectsFLEET GREAT

17
Current Trends Technology EffectsFLEET GREAT
Models show different pax-nm and CO2
evolution, but similar CO2 outcomes in 2050
18
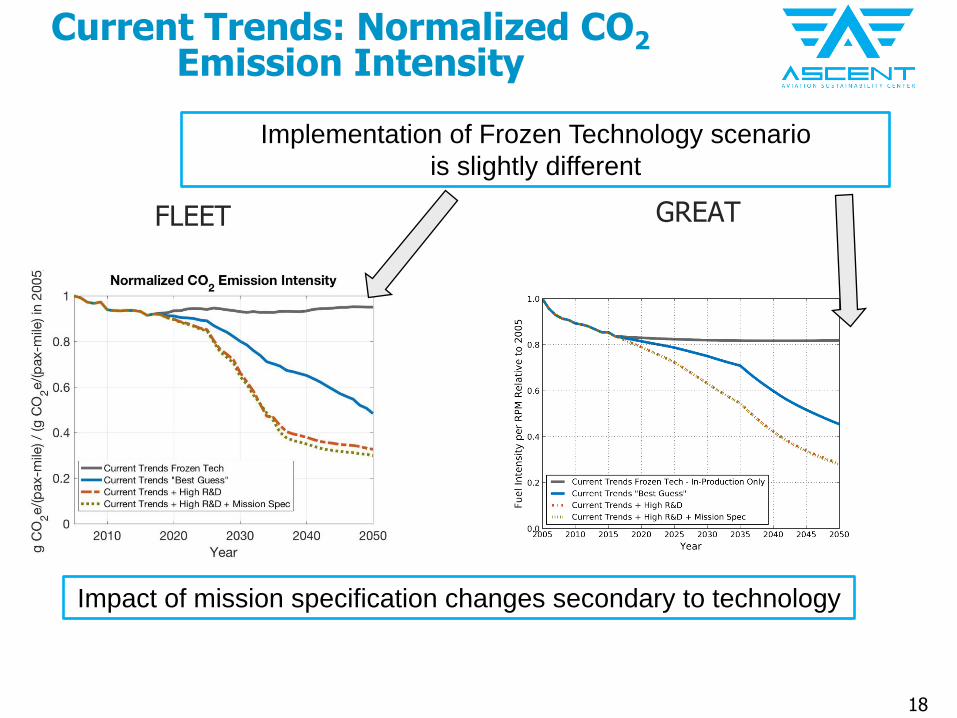
Current Trends: Normalized CO2Emission Intensity
FLEET GREAT
Impact of mission specification changes secondary to technology
Implementation of Frozen Technology scenario
is slightly different
19
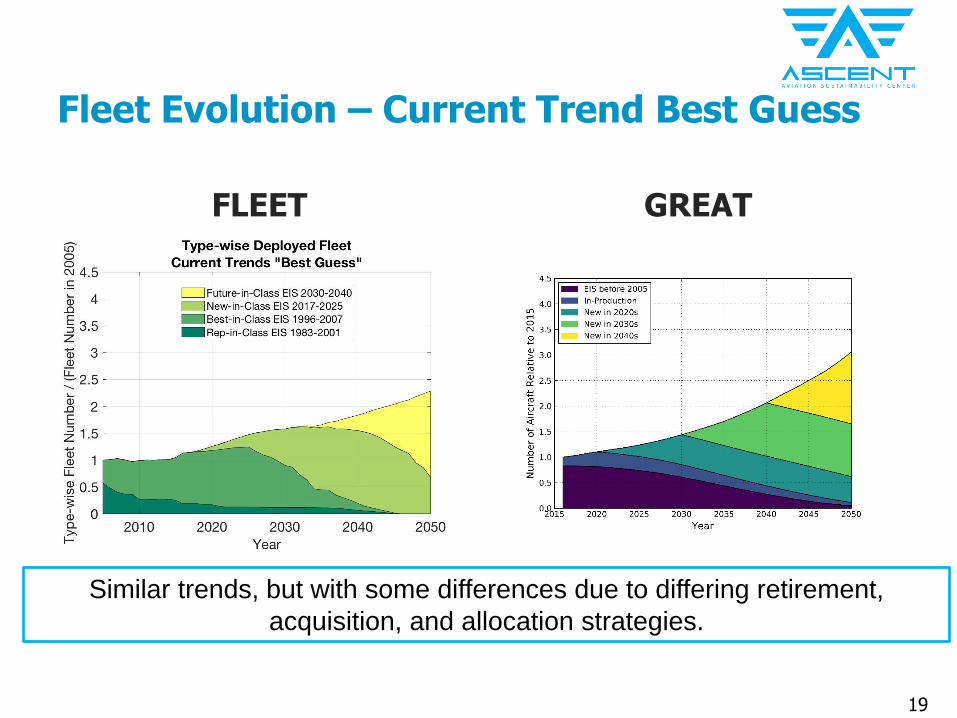
Fleet Evolution – Current Trend Best Guess
FLEET GREAT
Similar trends, but with some differences due to differing retirement,
acquisition, and allocation strategies.
20
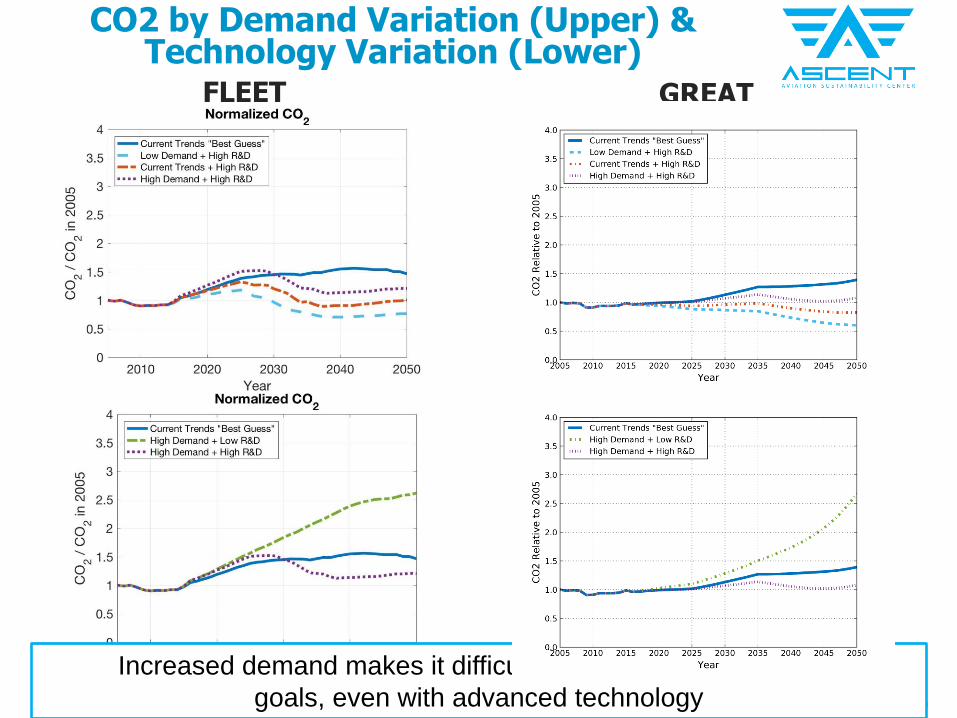
CO2 by Demand Variation (Upper) & Technology Variation (Lower)
FLEET GREAT
Increased demand makes it difficult to achieve carbon neutral
goals, even with advanced technology
21
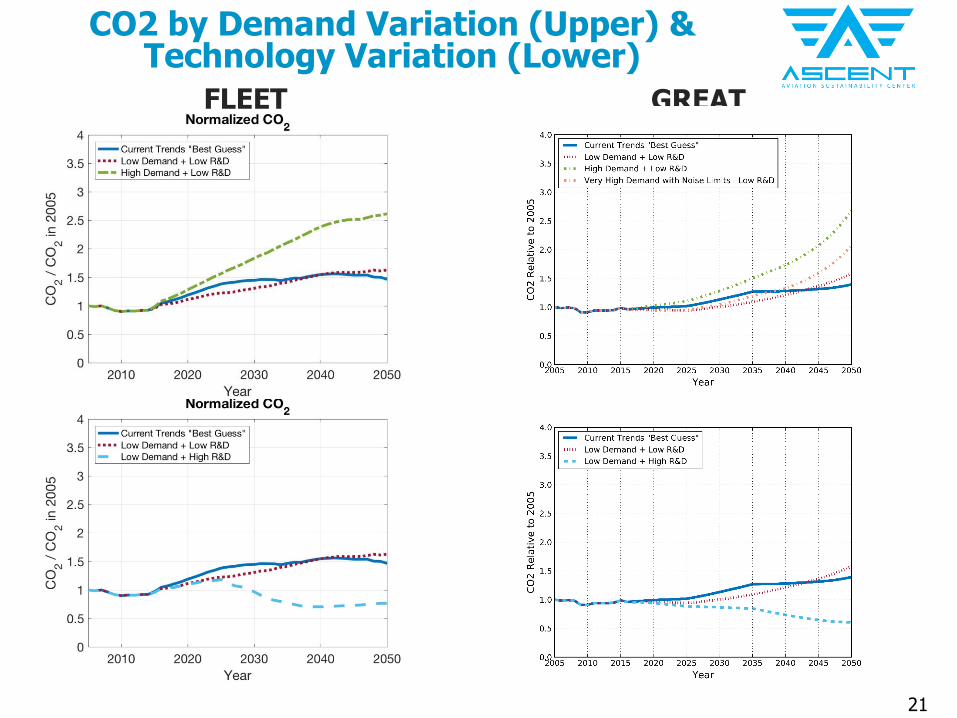
CO2 by Demand Variation (Upper) & Technology Variation (Lower)
FLEET GREAT

22
Environmental Bounds and Noise Limits
FLEET GREAT
Scenarios bound environmental outcomes
23
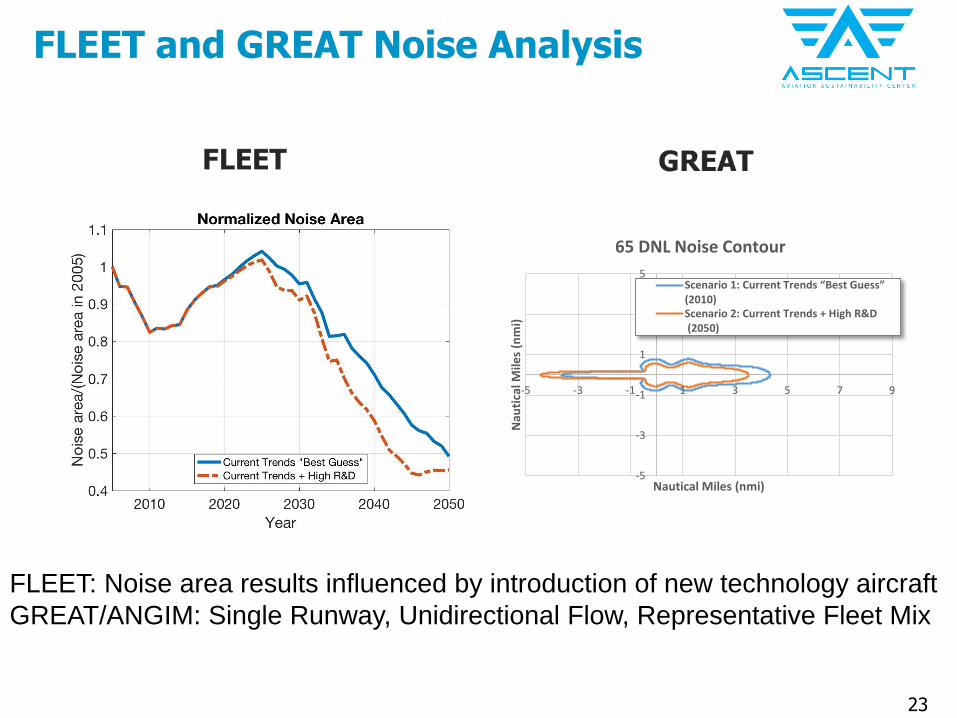
FLEET and GREAT Noise Analysis
FLEET: Noise area results influenced by introduction of new technology aircraft
GREAT/ANGIM: Single Runway, Unidirectional Flow, Representative Fleet Mix
-5
-3
-1
1
3
5
-5 -3 -1 1 3 5 7 9
Nau
tica
l Mile
s (n
mi)
Nautical Miles (nmi)
65 DNL Noise Contour
Scenario 1: Current Trends “Best Guess” (2010)Scenario 2: Current Trends + High R&D (2050)

24
Technology Impact On 2050 CO2
• Examined variability introduced by fleet demand and technology at the macro level– Grouped as ‘high’ (greater impact, more rapid introduction) or ‘low’ (less impact, delayed
introduction) technology relative to baseline
• Variation in 2050 CO2 caused by demand assumptions for given technology level
Rapid technology
introduction required to
reduce CO2 in 2050
25
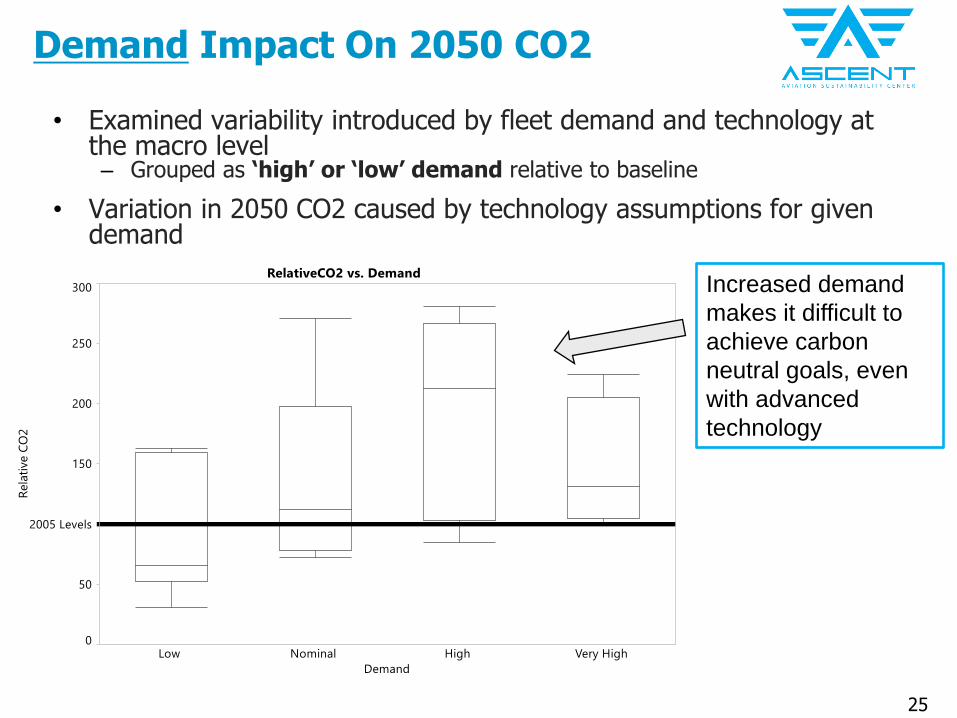
Demand Impact On 2050 CO2
• Examined variability introduced by fleet demand and technology at the macro level– Grouped as ‘high’ or ‘low’ demand relative to baseline
• Variation in 2050 CO2 caused by technology assumptions for given demand
Increased demand
makes it difficult to
achieve carbon
neutral goals, even
with advanced
technology
26
Summary
• Successfully completed project 10 initial intent
• Project outcomes– Suggested Fleet Scenario inputs for future assessment activities– Technology evolution scenarios for future assessment activities– Conducted long term technology assessment for defined fleet and
technology scenarios– Understand bounding of technology and demand on future fleet-
wide environmental impacts– Comparison of similarities and differences using multiple fleet
evaluation tools (FLEET and GREAT)
• Provided framework for deeper investigation of sensitivities to demand and technology drivers
• Wrapping up final ASCENT report