Embed Size (px)
Citation preview
Global Commercial Aerospace Industry Aircraft order backlog analysisJuly 2016
02
Background 3
Executive summary 4
Global commercial aircraft backlog – a deep dive 6Airline profitability Growth in travel demand matches net additions in capacity Change in backlog nature since 2004 Backlog size and by region Backlog by airline type Backlog by original equipment manufacturer (OEM) Emergence of low-cost carriers Airlines/leasing companies with credit ratings
Aircraft backlog – a detailed analysis of creditworthiness 22
Sensitivity analysis 30
Methodology 32
Caveats 34
Sources 35
Contact 36
Contents
Global Commercial Aerospace Industry | Aircraft order backlog analysis
3
Recent industry dialogue regarding the robustness of the commercial aerospace sector has in part focused on the risk of an economic downturn and the potential impact it might have on the historically high levels of aircraft backlog.
One perspective is that some of the backlog is at risk because the industry has experienced boom and bust cycles on average about every eight years, and that the current cycle has run its course. Also, some believe that the production cycle and output is unsustainable at current levels because global airlines cannot absorb the output, which may lead to potential airline price wars. An alternative perspective is that the commercial aerospace sector has largely outgrown past boom/bust cycles due to sustained growth in travel demand, airline capacity discipline, industry consolidation, backlog concentration in fast growing economies, improved airline financial performance and aircraft affordability.
This analysis of the global commercial aircraft backlog is to assess what part of the backlog, if any, is potentially at risk of cancellation or deferral based on an analysis of air carrier credit risk and other factors, and to help inform industry dialogue on this matter.
Background
Global Commercial Aerospace Industry | Aircraft order backlog analysis
4
The global commercial aerospace industry’s operating profits and margins have increased in 2014 and 2015 and are expected to improve further in 2016. This provides for higher affordability by airline customers to purchase new aircraft, due to:
• Increased revenue passenger kilometers (RPKs) and capacity utilization
• Improved airline operating cost structure, including significantly lower fuel prices
The recent up-cycle of aircraft orders and production has resulted in a backlog increase from 6,913 units in 2009 to 13,467 units in 2015, or 9.6 years of aircraft production backlog at current production rates. The commercial aircraft backlog is at an all-time high, driven by:
• 6.6 percent and 6.7 percent year-on-year (YoY) growth in passenger traffic in 2014 and 2015 respectively
• Replacement of obsolete equipment
233 airlines or leasing companies are customers in the order backlog for the 5 largest commercial aircraft OEMs, of which information for 215* of them was available and included in this study. Viewed historically, the aircraft order backlog appears to have stabilized at a “new norm” of 6 to 10 years, compared to average backlogs of 3 to 5 years in the last cycle.
Aircraft additions to the global fleet, net of retirements, generally match the growth in air transportation travel demand, as measured by RPK growth.
*Represents more than 85 percent of total commercial aircraft backlog; excludes airline customers undisclosed by OEMs and airline customers for which information was not available
Source: Deloitte analysis, IATA, UBS, Airbus, Boeing, Bombardier, Flightglobal
Executive summary
Global Commercial Aerospace Industry | Aircraft order backlog analysis
5
What we included
Of the unit backlog, 36 percent were from airlines and leasing companies rated by credit agencies. The remaining backlog for airlines/leasing companies not possessing a credit rating total 8,614 units, representing 64 percent of total unit backlog, as follows:
• 11.5 percent of unit backlog were for government-owned airlines or state-owned enterprises
• 52.5 percent of unit backlog were for private airlines, smaller leasing companies and unidentified customers, all with no credit ratings
In summary, 13.0 percent of total aircraft unit backlog and 11.6 percent of total backlog dollar value is potentially vulnerable to deferral or cancellation in the event of a sustained economic recession.
• The definition of vulnerable is an airline/leasing company with a credit rating BB or lower; or where there is no credit rating, an airline/leasing company that has been in business for 10 or less years, and has an order backlog equivalent or more than its current fleet capacity
• To put this in perspective, in a highly unlikely event of an immediate full 13.0 percent reduction in backlog, years of backlog would only be reduced from 9.6 to 8.4 years, equating to 11,716 units of backlog, about a level achieved for the first time in 2013
• A benchmark: the 2008/2009 recession saw global unit backlog decrease 5.4 percent (or 395 units) and backlog value decline 6.9 percent

6
Global Commercial Aircraft backlog – a deep dive
Global Commercial Aerospace Industry | Aircraft order backlog analysis
7
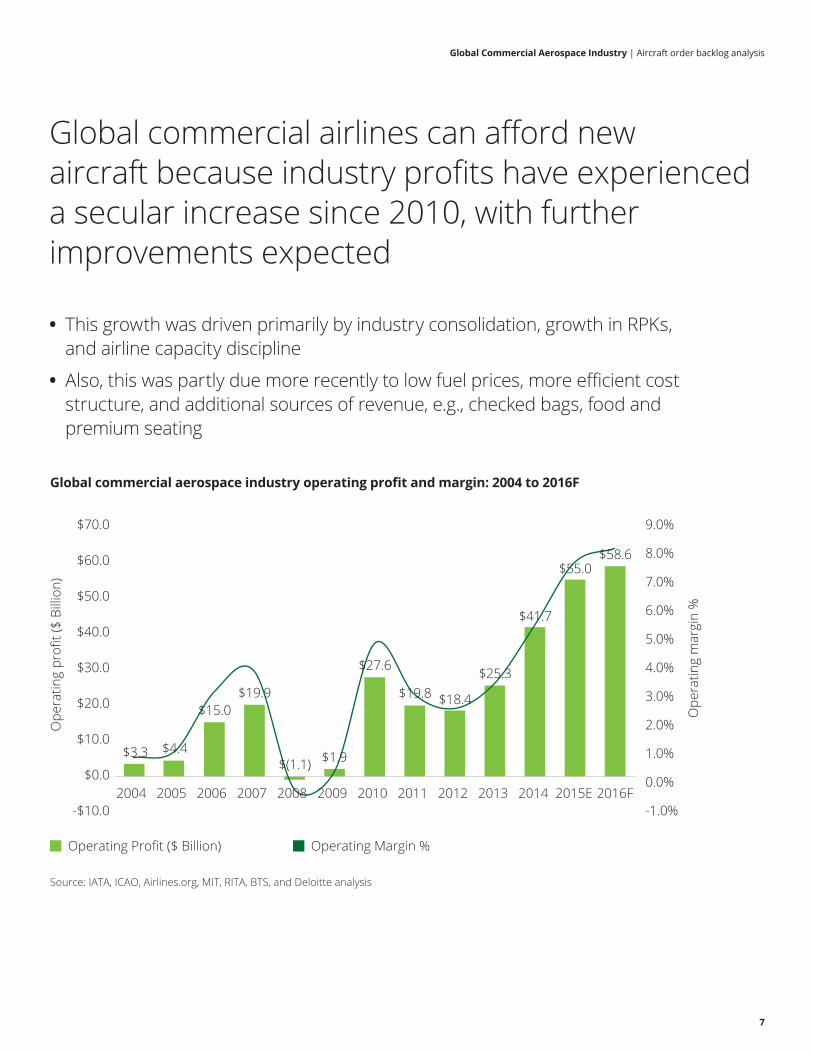
• This growth was driven primarily by industry consolidation, growth in RPKs, and airline capacity discipline
• Also, this was partly due more recently to low fuel prices, more efficient cost structure, and additional sources of revenue, e.g., checked bags, food and premium seating
Global commercial aerospace industry operating profit and margin: 2004 to 2016F
$3.3 $4.4
$15.0$19.9
$(1.1) $1.9
$27.6
$19.8 $18.4
$25.3
$41.7
$55.0$58.6
-1.0%
0.0%
1.0%
2.0%
3.0%
4.0%
5.0%
6.0%
7.0%
8.0%
9.0%
-$10.0
$0.0
$10.0
$20.0
$30.0
$40.0
$50.0
$60.0
$70.0
2004 2005 2006 2007 2008 2009 2010 2011 2012 2013 2014 2015E 2016F
Ope
ratin
g m
argi
n %
Ope
ratin
g pr
ofit (
$ Bi
llion
)
Source: IATA, ICAO, Airlines.org, MIT, RITA, BTS, and Deloitte analysis
Operating Profit ($ Billion) Operating Margin %
Global commercial airlines can afford new aircraft because industry profits have experienced a secular increase since 2010, with further improvements expected
Global Commercial Aerospace Industry | Aircraft order backlog analysis
8
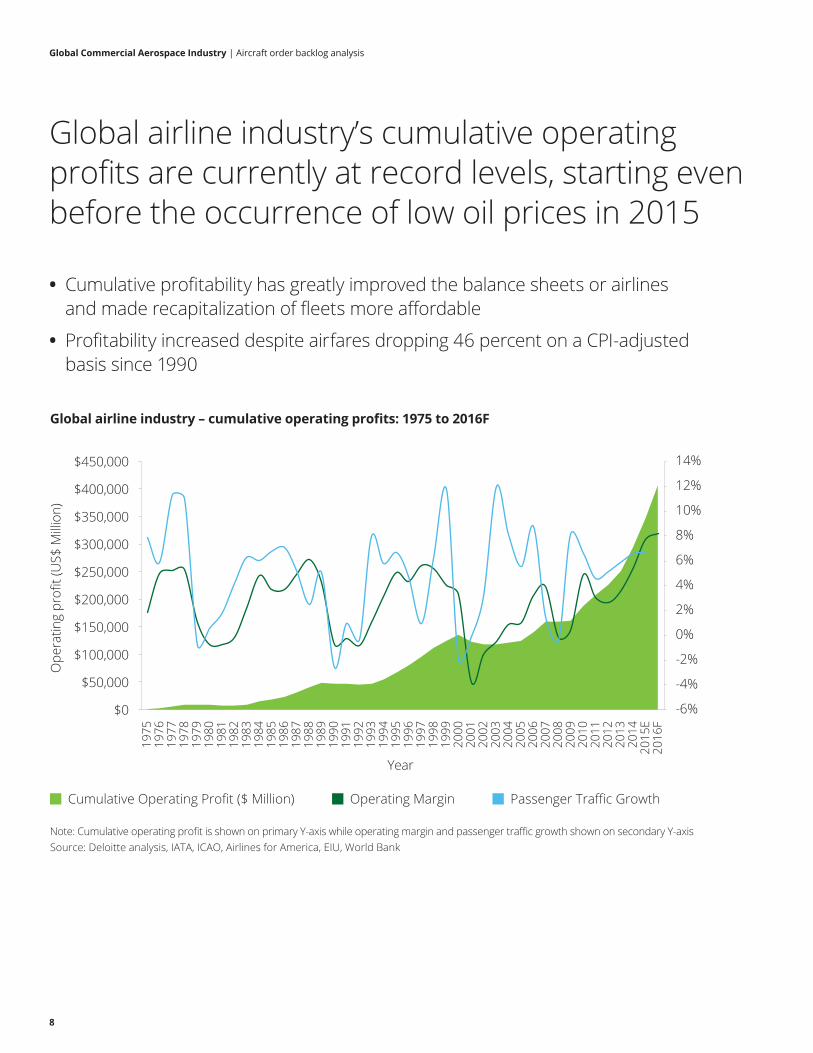
• Cumulative profitability has greatly improved the balance sheets or airlines and made recapitalization of fleets more affordable
• Profitability increased despite airfares dropping 46 percent on a CPI-adjusted basis since 1990
Global airline industry – cumulative operating profits: 1975 to 2016F
Note: Cumulative operating profit is shown on primary Y-axis while operating margin and passenger traffic growth shown on secondary Y-axisSource: Deloitte analysis, IATA, ICAO, Airlines for America, EIU, World Bank
Cumulative Operating Profit ($ Million) Operating Margin Passenger Traffic Growth
-6%
-4%
-2%
0%
2%
4%
6%
8%
10%
12%
14%
1975
19
76
1977
19
78
1979
19
80
1981
19
82
1983
19
84
1985
19
86
1987
19
88
1989
19
90
1991
19
92
1993
19
94
1995
19
96
1997
19
98
1999
20
00
2001
20
02
2003
20
04
2005
20
06
2007
20
08
2009
20
10
2011
20
12
2013
20
14
2015
E20
16F
Year
$0
$50,000
$100,000
$150,000
$200,000
$250,000
$300,000
$350,000
$400,000
$450,000
Ope
ratin
g pr
ofit (
US$
Milli
on)
Global airline industry’s cumulative operating profits are currently at record levels, starting even before the occurrence of low oil prices in 2015
Global Commercial Aerospace Industry | Aircraft order backlog analysis
9
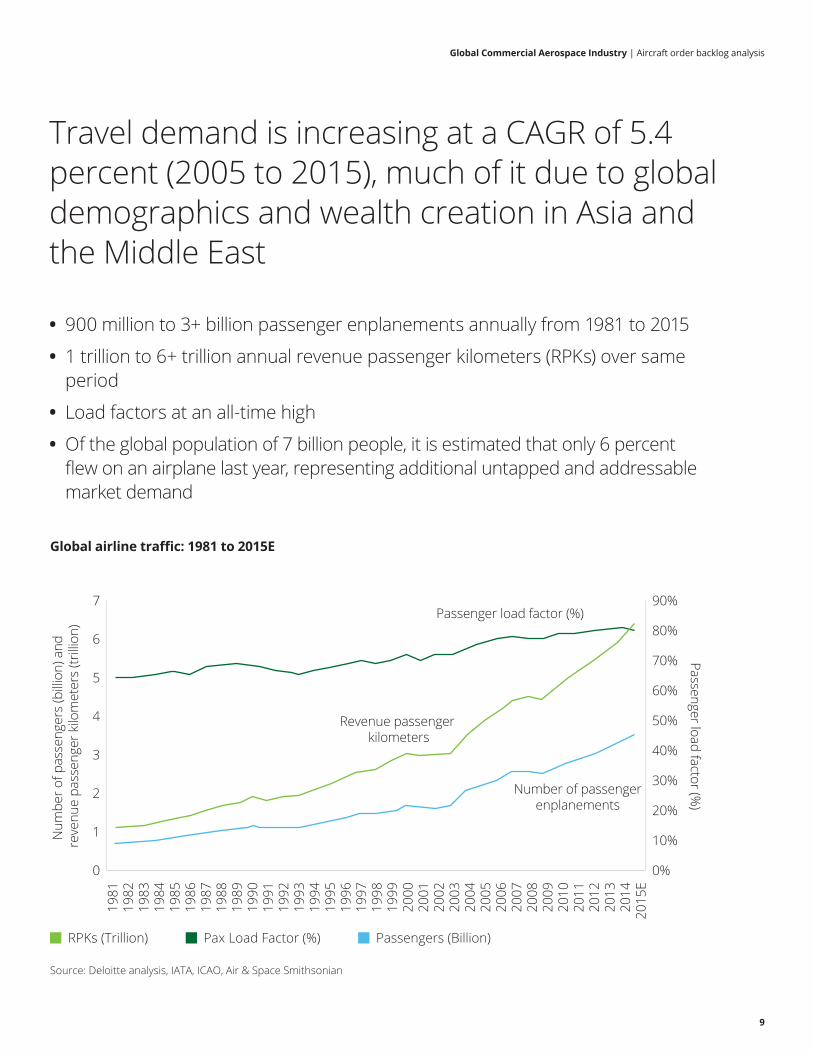
• 900 million to 3+ billion passenger enplanements annually from 1981 to 2015
• 1 trillion to 6+ trillion annual revenue passenger kilometers (RPKs) over same period
• Load factors at an all-time high
• Of the global population of 7 billion people, it is estimated that only 6 percent flew on an airplane last year, representing additional untapped and addressable market demand
Global airline traffic: 1981 to 2015E
Source: Deloitte analysis, IATA, ICAO, Air & Space Smithsonian
RPKs (Trillion) Pax Load Factor (%) Passengers (Billion)
90%
80%
70%
60%
50%
40%
30%
20%
10%
0%
7
1981
1982
1983
1984
1985
1986
1987
1988
1989
1990
1991
1992
1993
1994
1995
1996
1997
1998
1999
2000
2001
2002
2003
2004
2005
2006
2007
2008
2009
2010
2011
2012
2013
2014
2015
E6
5
4
3
2
1
0
Passenger load factor (%)
Revenue passenger kilometers
Number of passengerenplanements
Num
ber o
f pas
seng
ers
(billi
on) a
nd
reve
nue
pass
enge
r kilo
met
ers
(trilli
on)
Passenger load factor (%)
Travel demand is increasing at a CAGR of 5.4 percent (2005 to 2015), much of it due to global demographics and wealth creation in Asia and the Middle East
Global Commercial Aerospace Industry | Aircraft order backlog analysis
10
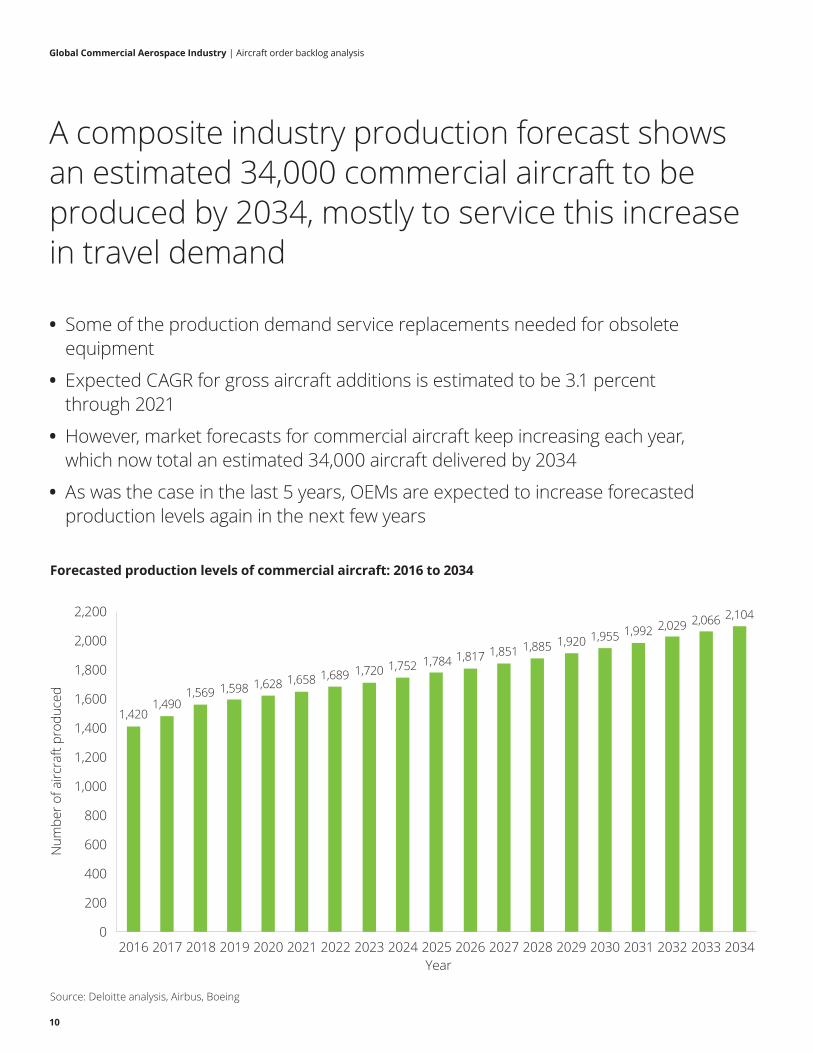
• Some of the production demand service replacements needed for obsolete equipment
• Expected CAGR for gross aircraft additions is estimated to be 3.1 percent through 2021
• However, market forecasts for commercial aircraft keep increasing each year, which now total an estimated 34,000 aircraft delivered by 2034
• As was the case in the last 5 years, OEMs are expected to increase forecasted production levels again in the next few years
Forecasted production levels of commercial aircraft: 2016 to 2034
Source: Deloitte analysis, Airbus, Boeing
1,4201,490
1,569 1,598 1,628 1,658 1,689 1,720 1,752 1,784 1,817 1,851 1,885 1,920 1,955 1,992 2,029 2,066 2,104
0
200
400
600
800
1,000
1,200
1,400
1,600
1,800
2,000
2,200
2016 2017 2018 2019 2020 2021 2022 2023 2024 2025 2026 2027 2028 2029 2030 2031 2032 2033 2034
Num
ber o
f airc
raft
prod
uced
Year
A composite industry production forecast shows an estimated 34,000 commercial aircraft to be produced by 2034, mostly to service this increase in travel demand
Global Commercial Aerospace Industry | Aircraft order backlog analysis
11
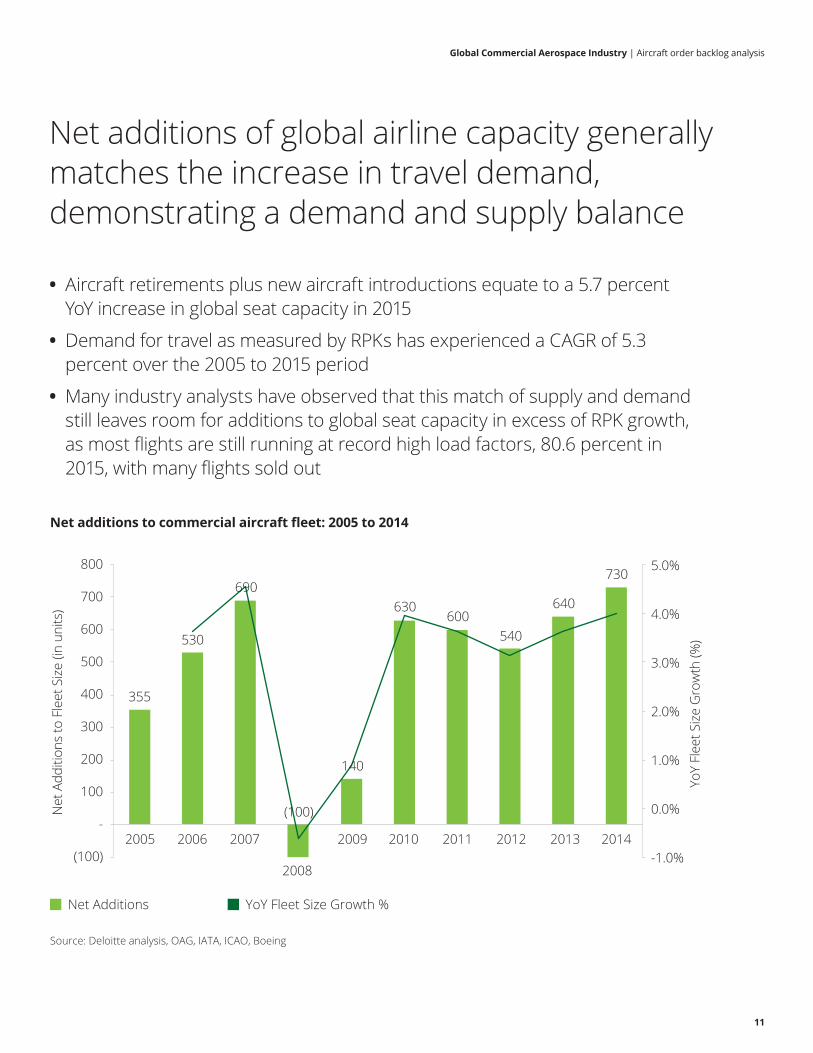
• Aircraft retirements plus new aircraft introductions equate to a 5.7 percent YoY increase in global seat capacity in 2015
• Demand for travel as measured by RPKs has experienced a CAGR of 5.3 percent over the 2005 to 2015 period
• Many industry analysts have observed that this match of supply and demand still leaves room for additions to global seat capacity in excess of RPK growth, as most flights are still running at record high load factors, 80.6 percent in 2015, with many flights sold out
Net additions to commercial aircraft fleet: 2005 to 2014
355
530
690
(100)
140
630 600
540
640
730
2005 2006 2007
2008
2009 2010 2011 2012 2013 2014 -1.0%
0.0%
1.0%
2.0%
3.0%
4.0%
5.0%
YoY
Flee
t Siz
e G
row
th (%
)
(100)
-
100
200
300
400
500
600
700
800
Net
Add
ition
s to
Fle
et S
ize
(in u
nits
)
Source: Deloitte analysis, OAG, IATA, ICAO, Boeing
Net Additions YoY Fleet Size Growth %
Net additions of global airline capacity generally matches the increase in travel demand, demonstrating a demand and supply balance
Global Commercial Aerospace Industry | Aircraft order backlog analysis
12
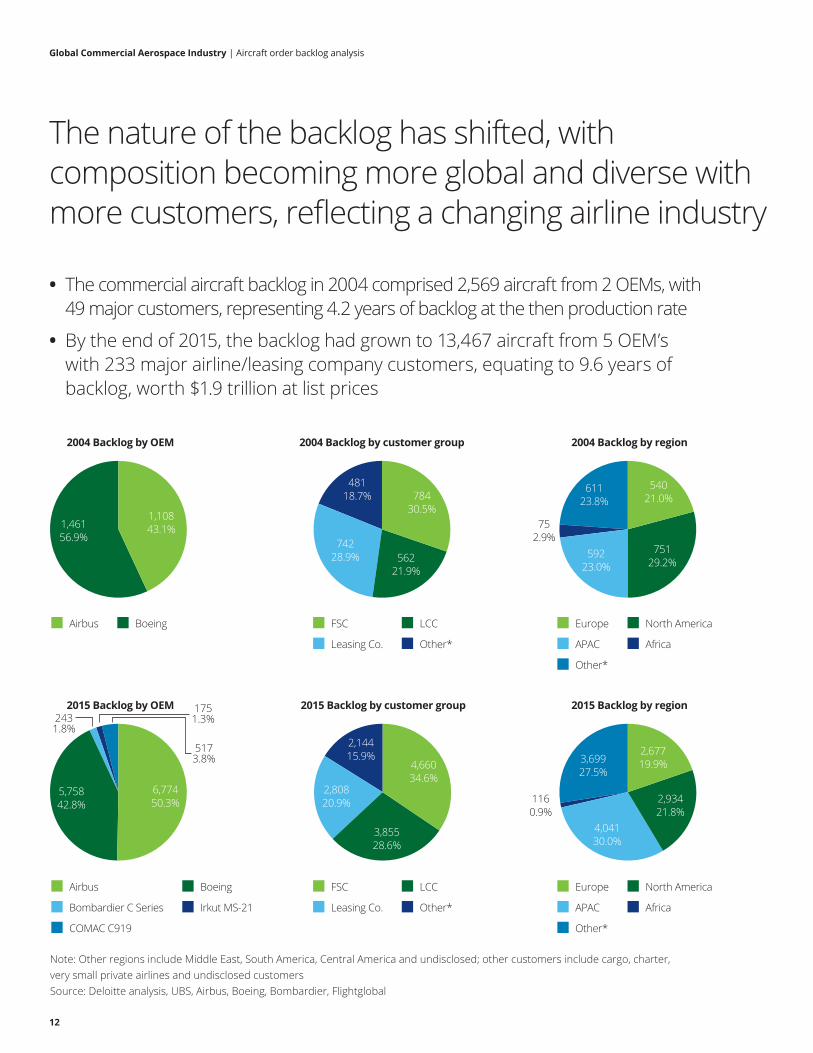
• The commercial aircraft backlog in 2004 comprised 2,569 aircraft from 2 OEMs, with 49 major customers, representing 4.2 years of backlog at the then production rate
• By the end of 2015, the backlog had grown to 13,467 aircraft from 5 OEM’s with 233 major airline/leasing company customers, equating to 9.6 years of backlog, worth $1.9 trillion at list prices
2004 Backlog by OEM
2015 Backlog by OEM 2015 Backlog by customer group 2015 Backlog by region
2004 Backlog by customer group 2004 Backlog by region
Note: Other regions include Middle East, South America, Central America and undisclosed; other customers include cargo, charter, very small private airlines and undisclosed customersSource: Deloitte analysis, UBS, Airbus, Boeing, Bombardier, Flightglobal
1,108 43.1%
481 18.7% 784
30.5%
4,660 34.6%
6,774 50.3%
5173.8%
1751.3%243
1.8%
5,758 42.8%
2,677 19.9% 3,699
27.5%
4,041 30.0%
2,934 21.8%
1160.9%
3,855 28.6%
2,808 20.9%
2,144 15.9%
611 23.8%
540 21.0%
751 29.2%
592 23.0%
752.9%
562 21.9%
742 28.9%
1,461 56.9%
Airbus Boeing FSC
Leasing Co.
LCC
Other*
FSC
Leasing Co.
LCC
Other* APAC
Europe
Africa
North America
Other*
Irkut MS-21
Boeing
Bombardier C Series
Airbus
COMAC C919
APAC
Europe
Africa
North America
Other*
The nature of the backlog has shifted, with composition becoming more global and diverse with more customers, reflecting a changing airline industry
Global Commercial Aerospace Industry | Aircraft order backlog analysis
13
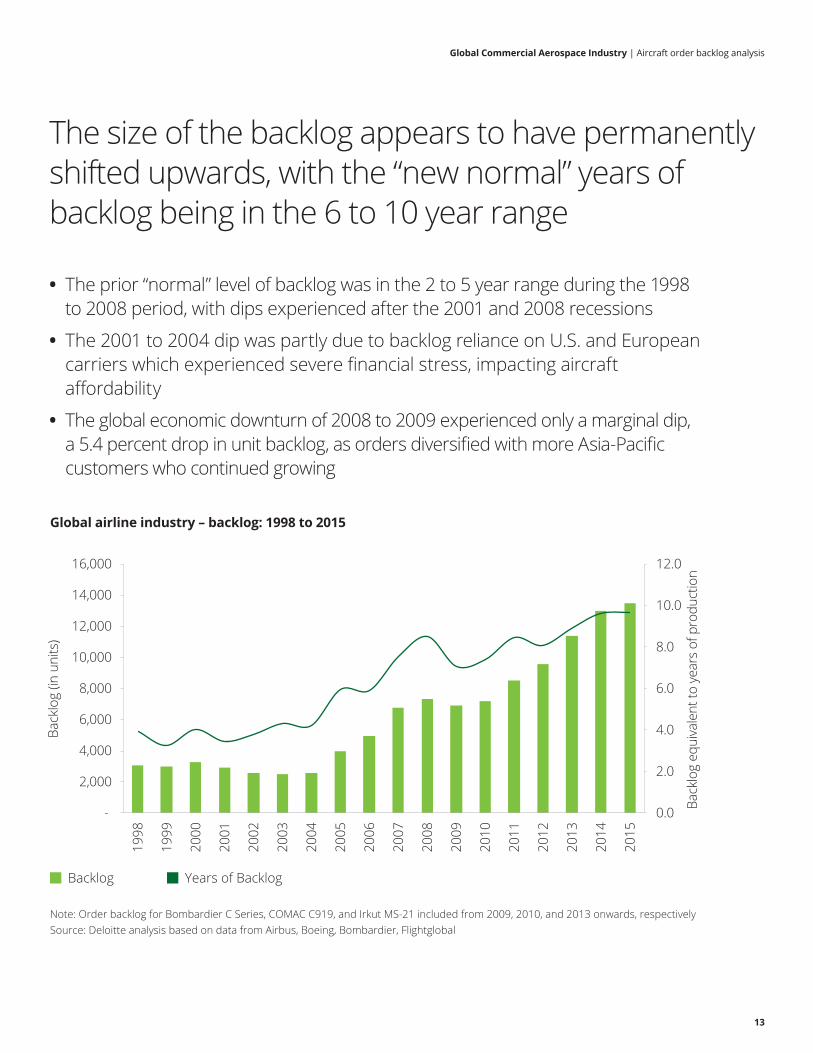
• The prior “normal” level of backlog was in the 2 to 5 year range during the 1998 to 2008 period, with dips experienced after the 2001 and 2008 recessions
• The 2001 to 2004 dip was partly due to backlog reliance on U.S. and European carriers which experienced severe financial stress, impacting aircraft affordability
• The global economic downturn of 2008 to 2009 experienced only a marginal dip, a 5.4 percent drop in unit backlog, as orders diversified with more Asia-Pacific customers who continued growing
Global airline industry – backlog: 1998 to 2015
Note: Order backlog for Bombardier C Series, COMAC C919, and Irkut MS-21 included from 2009, 2010, and 2013 onwards, respectively Source: Deloitte analysis based on data from Airbus, Boeing, Bombardier, Flightglobal
Backlog Years of Backlog
0.0
2.0
4.0
6.0
8.0
10.0
12.0
1998
1999
2000
2001
2002
2003
2004
2005
2006
2007
2008
2009
2010
2011
2012
2013
2014
2015
Back
log
equi
vale
nt to
yea
rs o
f pro
duct
ion
-
2,000
4,000
6,000
8,000
10,000
12,000
14,000
16,000
Back
log
(in u
nits
)
The size of the backlog appears to have permanently shifted upwards, with the “new normal” years of backlog being in the 6 to 10 year range
Global Commercial Aerospace Industry | Aircraft order backlog analysis
14
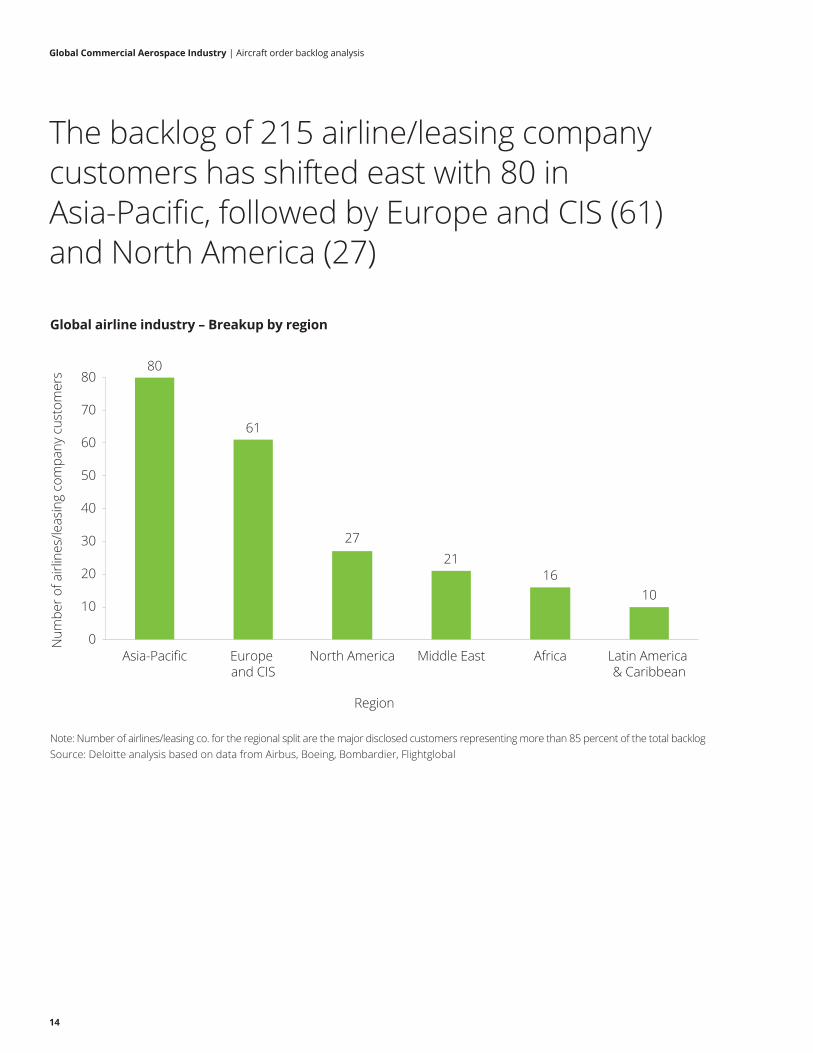
Global airline industry – Breakup by region
Note: Number of airlines/leasing co. for the regional split are the major disclosed customers representing more than 85 percent of the total backlogSource: Deloitte analysis based on data from Airbus, Boeing, Bombardier, Flightglobal
80
61
2721
1610
0
10
20
30
40
50
60
70
80
Asia-Pacific Europe and CIS
North America Middle East Africa Latin America & Caribbean
Num
ber o
f airl
ines
/leas
ing
com
pany
cus
tom
ers
Region
The backlog of 215 airline/leasing company customers has shifted east with 80 in Asia-Pacific, followed by Europe and CIS (61) and North America (27)
Global Commercial Aerospace Industry | Aircraft order backlog analysis
15
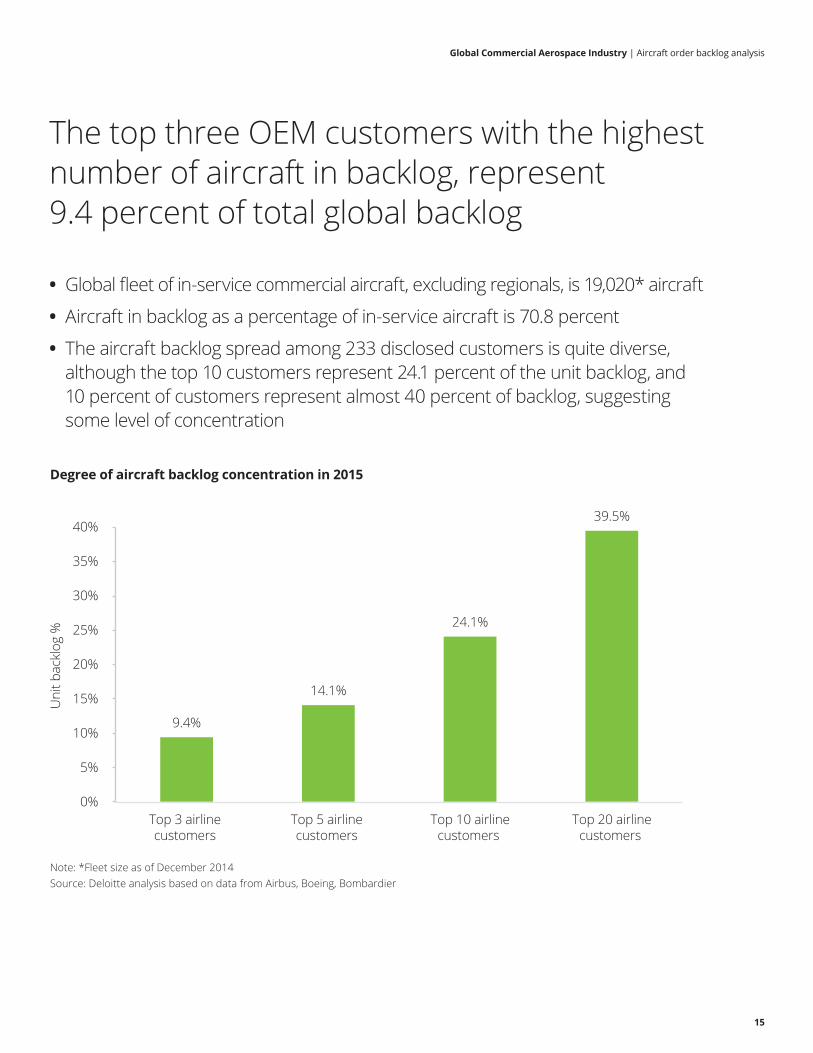
Degree of aircraft backlog concentration in 2015
Note: *Fleet size as of December 2014Source: Deloitte analysis based on data from Airbus, Boeing, Bombardier
9.4%
14.1%
24.1%
39.5%
Top 3 airline customers
Top 5 airline customers
Top 10 airlinecustomers
Top 20 airlinecustomers
0%
5%
10%
15%
20%
25%
30%
35%
40%
Uni
t bac
klog
%
The top three OEM customers with the highest number of aircraft in backlog, represent 9.4 percent of total global backlog
• Global fleet of in-service commercial aircraft, excluding regionals, is 19,020* aircraft
• Aircraft in backlog as a percentage of in-service aircraft is 70.8 percent
• The aircraft backlog spread among 233 disclosed customers is quite diverse, although the top 10 customers represent 24.1 percent of the unit backlog, and 10 percent of customers represent almost 40 percent of backlog, suggesting some level of concentration
Global Commercial Aerospace Industry | Aircraft order backlog analysis
16
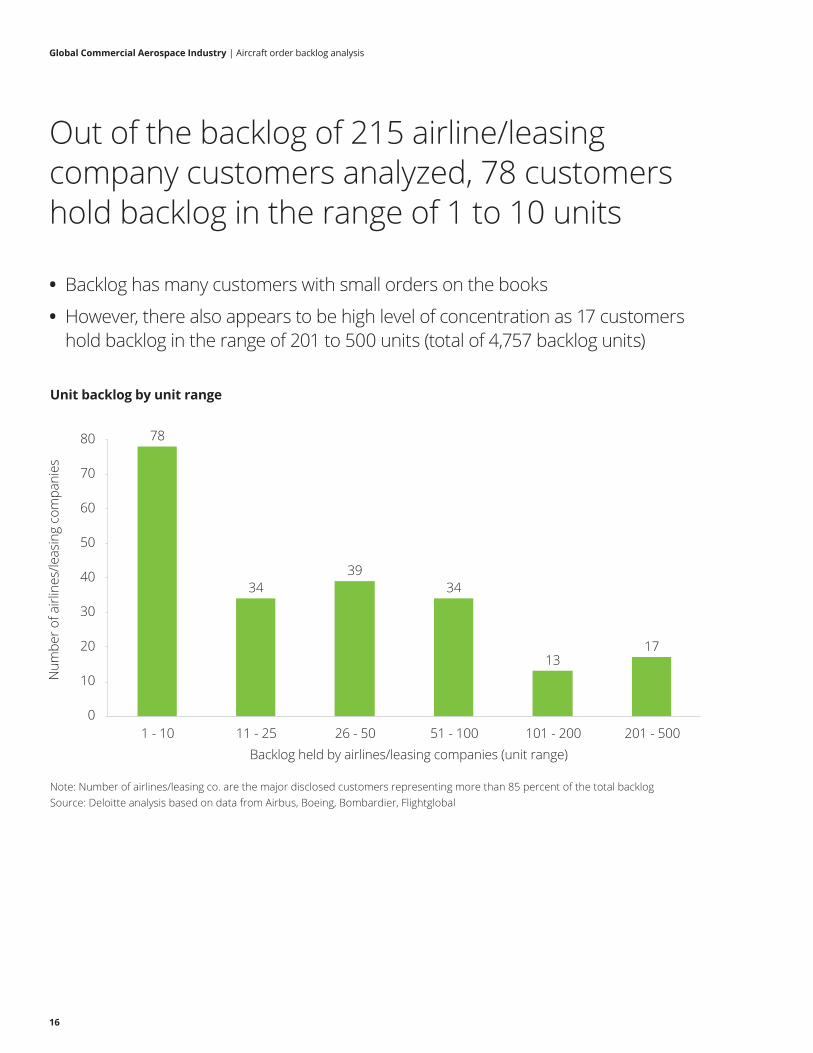
Unit backlog by unit range
Note: Number of airlines/leasing co. are the major disclosed customers representing more than 85 percent of the total backlogSource: Deloitte analysis based on data from Airbus, Boeing, Bombardier, Flightglobal
78
3439
34
1317
0
10
20
30
40
50
60
70
80
1 - 10 11 - 25 26 - 50 51 - 100 101 - 200 201 - 500
Num
ber o
f airl
ines
/leas
ing
com
pani
es
Backlog held by airlines/leasing companies (unit range)
Out of the backlog of 215 airline/leasing company customers analyzed, 78 customers hold backlog in the range of 1 to 10 units
• Backlog has many customers with small orders on the books
• However, there also appears to be high level of concentration as 17 customers hold backlog in the range of 201 to 500 units (total of 4,757 backlog units)
Global Commercial Aerospace Industry | Aircraft order backlog analysis
17
2005 Backlog by type of aircraft (number of units and backlog %)
2015 Backlog by type of aircraft (number of units and backlog %)
Source: Airbus, Boeing, Flightglobal, Deloitte analysis
Single-aisle Widebody Single-aisle Widebody
10,84480.5%
2,79070%
1,19630%
2,62319.5%
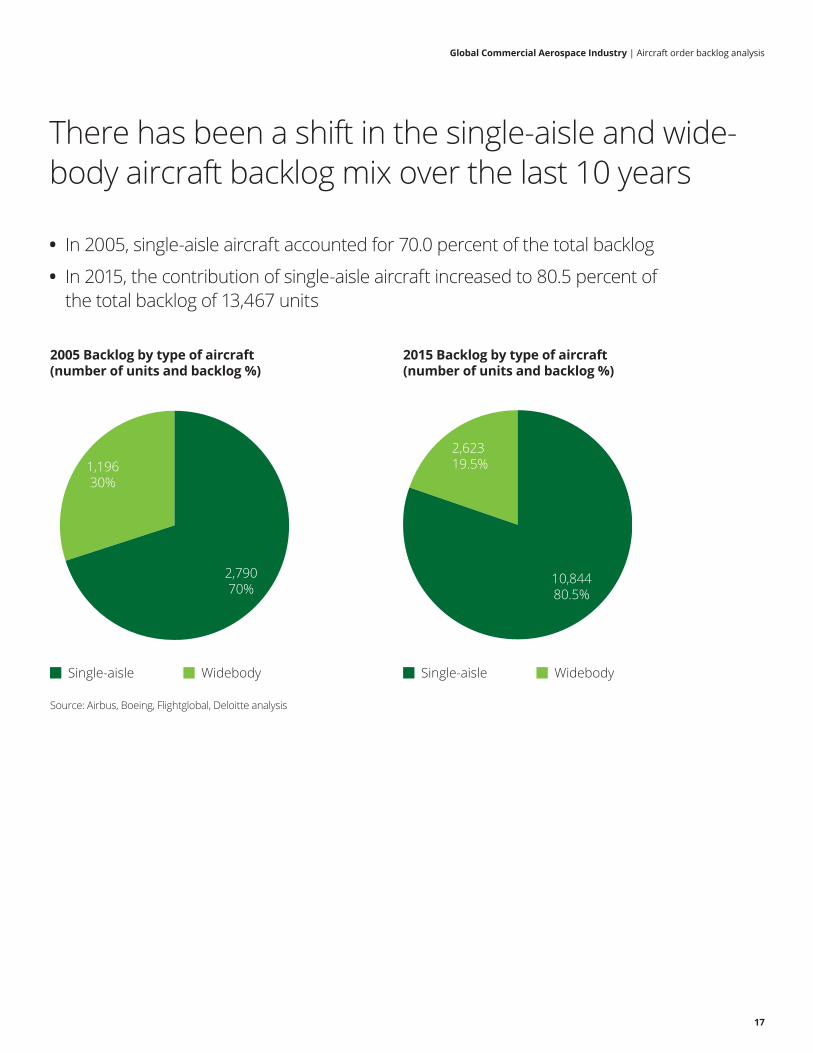
There has been a shift in the single-aisle and wide-body aircraft backlog mix over the last 10 years
• In 2005, single-aisle aircraft accounted for 70.0 percent of the total backlog
• In 2015, the contribution of single-aisle aircraft increased to 80.5 percent of the total backlog of 13,467 units
Global Commercial Aerospace Industry | Aircraft order backlog analysis
18
Backlog dollar value by region (US$ billion)
Unit backlog by region (number of units and backlog %)
Note: *Includes airline customers undisclosed by OEMs and airline customers for which information was not availableSource: Deloitte analysis based on data from Airbus, Boeing, Bombardier, Flightglobal, Capital IQ, and Bloomberg
Europe and CIS North America
Asia-Pacific Latin America & Carribbean
Middle East Africa
Undisclosed
US$ 543.728.1%
US$ 397.320.6%
2,93421.8%
4,04130.0%
2,677 19.9%
1,94814.5%
1,1288.4%
1160.9%
6234.6%
US$ 368.919.1%
US$ 242.312.5%
US$ 24.11.2%
US$ 77.64.0%
US$ 277.914.4%
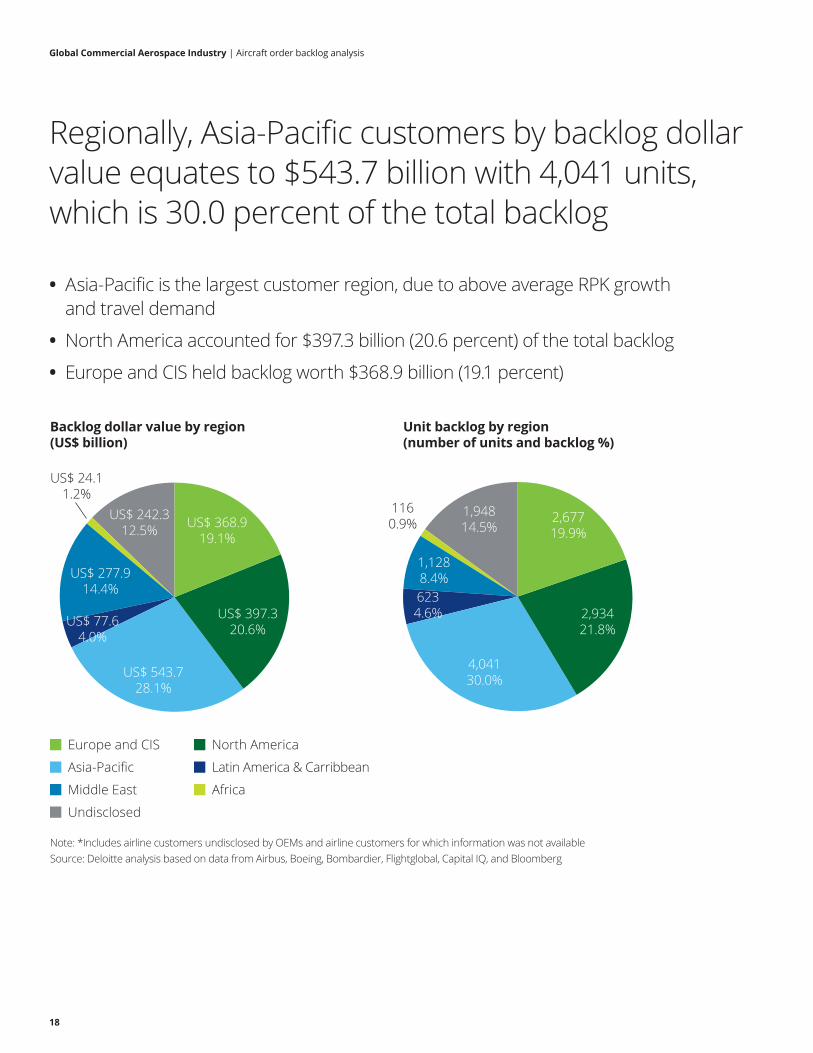
Regionally, Asia-Pacific customers by backlog dollar value equates to $543.7 billion with 4,041 units, which is 30.0 percent of the total backlog
• Asia-Pacific is the largest customer region, due to above average RPK growth and travel demand
• North America accounted for $397.3 billion (20.6 percent) of the total backlog
• Europe and CIS held backlog worth $368.9 billion (19.1 percent)
Global Commercial Aerospace Industry | Aircraft order backlog analysis
19
Overall unit backlog–by airline ownership (number of units and backlog %)
Overall backlog value–by airline ownership(US$ billion)
Note: *Includes airline customers undisclosed by OEMs and airline customers for which information was not availableSource: Deloitte analysis based on data from Airbus, Boeing, Bombardier, Flightglobal
Private Airline/Leasing Co. SOE Public Airline/Leasing Co. Undisclosed*
5,69442.3%
2,30117.1%
3,52426.2%
1,94814.5%
US$ 242.3 12.5%
US$ 772.0 40.0%
US$ 472.7 24.5%
US$ 444.8 23.0%
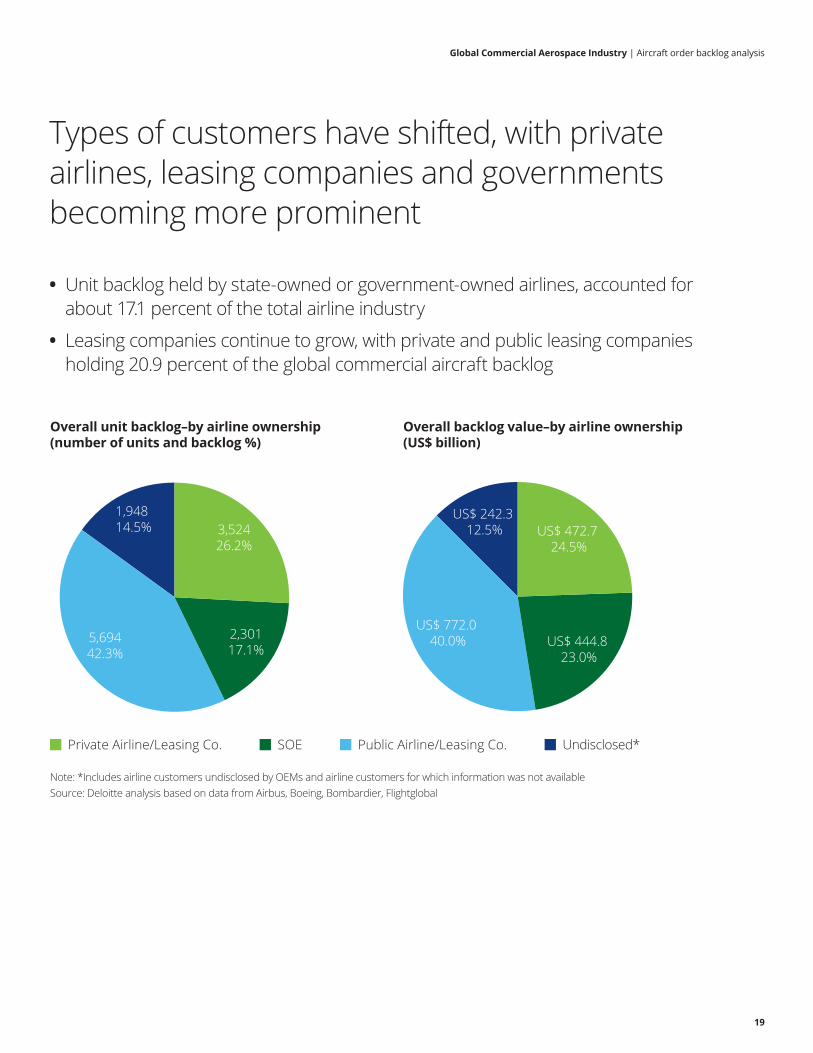
Types of customers have shifted, with private airlines, leasing companies and governments becoming more prominent
• Unit backlog held by state-owned or government-owned airlines, accounted for about 17.1 percent of the total airline industry
• Leasing companies continue to grow, with private and public leasing companies holding 20.9 percent of the global commercial aircraft backlog
Global Commercial Aerospace Industry | Aircraft order backlog analysis
20
Overall backlog value by OEM (US$ billion) Overall unit backlog unit by OEM (number of units and backlog %)
Source: Deloitte analysis based on data from Airbus, Boeing, Bombardier, Flightglobal, Capital IQ, and Bloomberg
Airbus Bombardier C Series COMAC C919Boeing
6,77450.3%
US$ 1,004.9 52.0%
US$ 869.8 45.0%
5,75842.8%
2431.8%
US$ 19.41.0%
US$ 11.80.6% US$ 25.9
1.3%1751.3%
5173.8%
Irkut MS-21
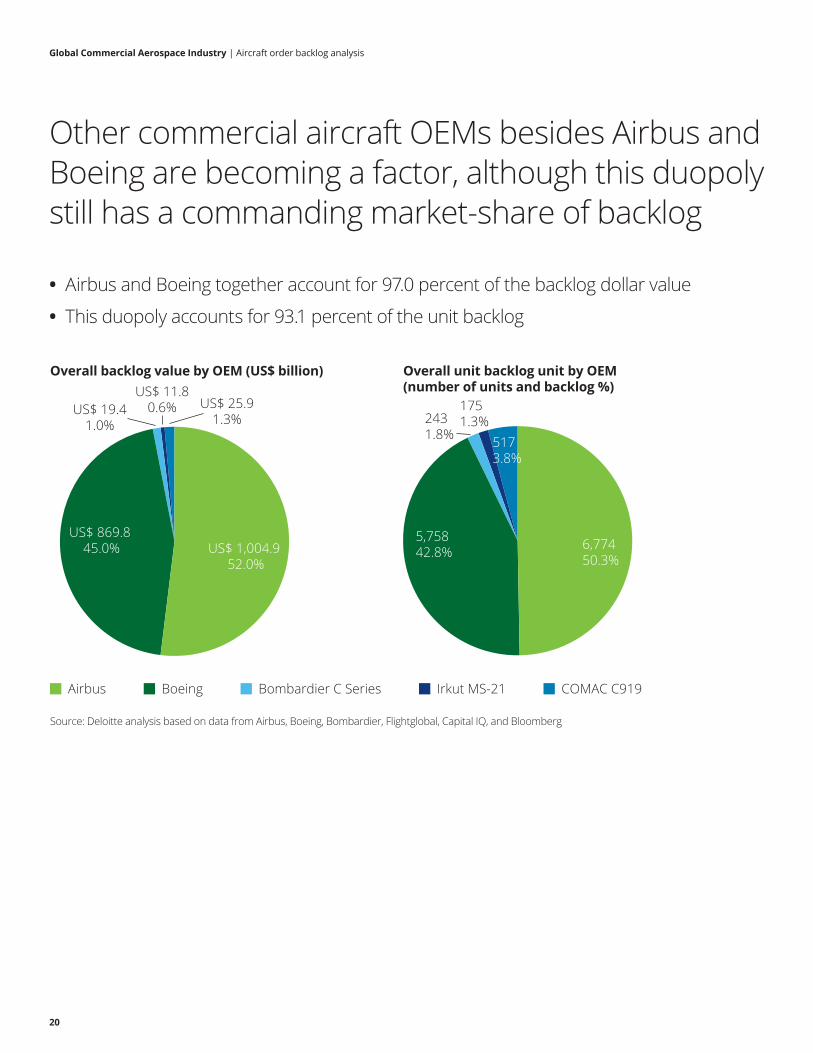
Other commercial aircraft OEMs besides Airbus and Boeing are becoming a factor, although this duopoly still has a commanding market-share of backlog
• Airbus and Boeing together account for 97.0 percent of the backlog dollar value
• This duopoly accounts for 93.1 percent of the unit backlog
Global Commercial Aerospace Industry | Aircraft order backlog analysis
21
Overall backlog dollar value by type of customer (US$ billion)
Overall unit backlog by type of customer (number of units and backlog %)
Note: *Includes airline/leasing co. customers undisclosed by OEMs and customers for which information was not availableSource: Deloitte analysis based on data from Airbus, Boeing, Bombardier, Flightglobal, Capital IQ, and Bloomberg
FSC Leasing Company Undisclosed*LCC
4,66034.6%
3,85528.6%
2,80820.9%
1,94814.5%1,94814.5%
1961.5%
US$ 30.61.6%
Other
US$ 885.445.8%
US$ 242.312.5%
US$ 342.617.7%
US$ 430.922.3%
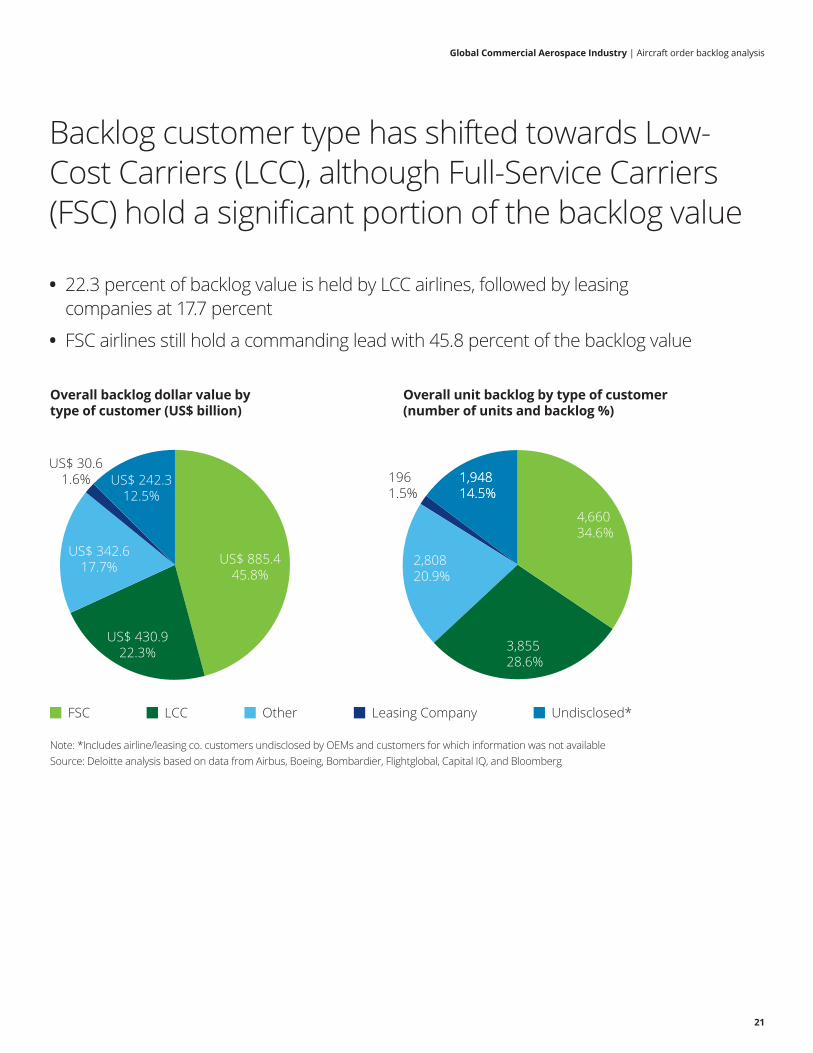
Backlog customer type has shifted towards Low-Cost Carriers (LCC), although Full-Service Carriers (FSC) hold a significant portion of the backlog value
• 22.3 percent of backlog value is held by LCC airlines, followed by leasing companies at 17.7 percent
• FSC airlines still hold a commanding lead with 45.8 percent of the backlog value
22
Aircraft order backlog – a detailed analysis of creditworthiness
Global Commercial Aerospace Industry | Aircraft order backlog analysis
23
Overall backlog dollar value by availability of credit rating (US$ billion)
Overall unit backlog by availability of credit rating (number of units and backlog %)
Note: *Includes airline/leasing co. customers undisclosed by OEMs and customers for which information was not availableSource: Deloitte analysis based on data from Airbus, Boeing, Bombardier, Flightglobal, Capital IQ, and Bloomberg
Airlines/Leasing Co. unrated Airlines/Leasing Co. with credit rating
6,66649.5%
4,85336.0%
1,94814.5%
Customer undisclosed
US$ 936.448.5%
US$ 753.139.0%
US$ 242.312.5%
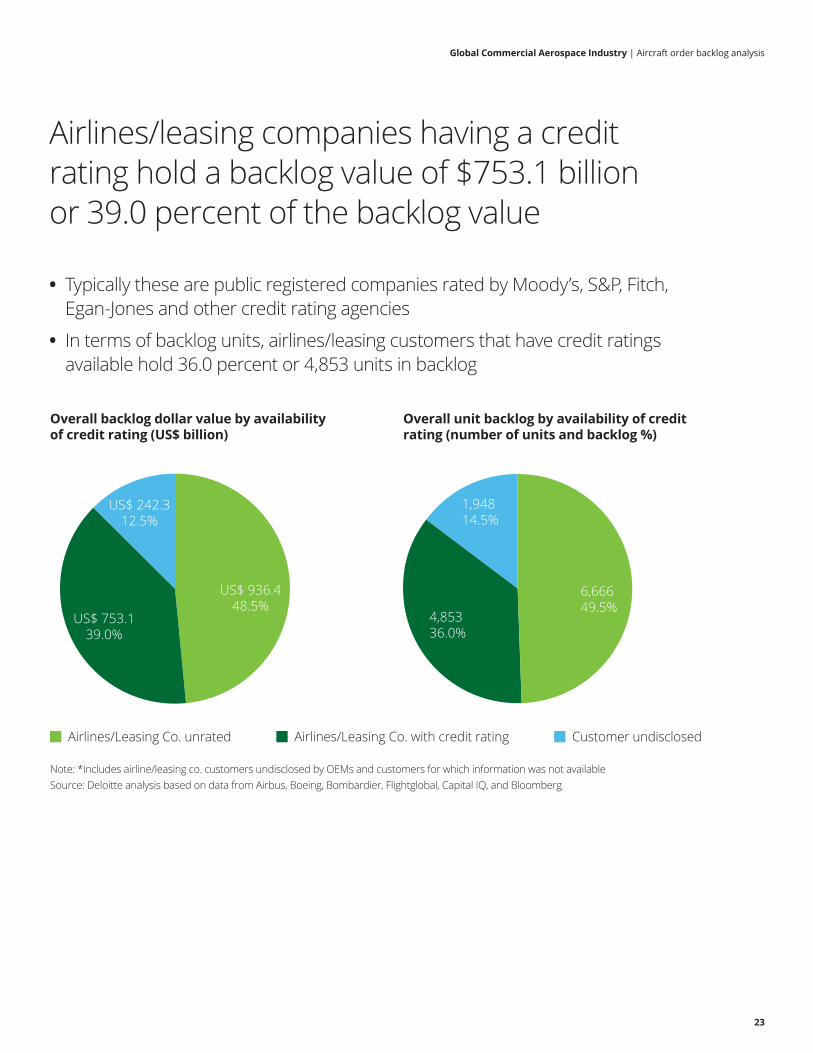
Airlines/leasing companies having a credit rating hold a backlog value of $753.1 billion or 39.0 percent of the backlog value
• Typically these are public registered companies rated by Moody’s, S&P, Fitch, Egan-Jones and other credit rating agencies
• In terms of backlog units, airlines/leasing customers that have credit ratings available hold 36.0 percent or 4,853 units in backlog
Aircraft order backlog – a detailed analysis of creditworthiness
Global Commercial Aerospace Industry | Aircraft order backlog analysis
24
Overall backlog value by stability of customers (US$ billion)
Overall unit backlog by stability of customers (number of units and backlog %)
Note: *Includes airline/leasing co. customers undisclosed by OEMs and customers for which information was not availableSource: Deloitte analysis based on data from Airbus, Boeing, Bombardier, Flightglobal, Capital IQ, and Bloomberg
Stable Vulnerable
1,757 13.0%
US$ 224.6 11.6%
US$ 242.3 12.5%
US$ 1,464.9 75.8%
9,76272.5%
1,94814.5%
Undisclosed*
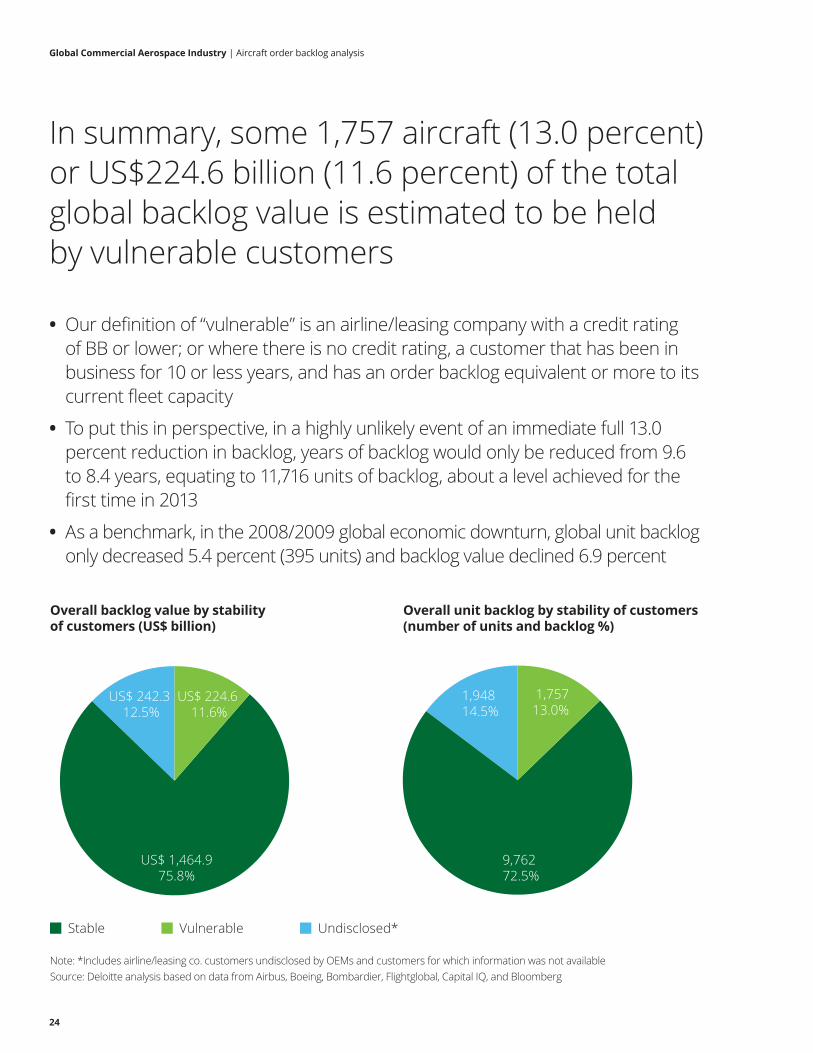
In summary, some 1,757 aircraft (13.0 percent) or US$224.6 billion (11.6 percent) of the total global backlog value is estimated to be held by vulnerable customers
• Our definition of “vulnerable” is an airline/leasing company with a credit rating of BB or lower; or where there is no credit rating, a customer that has been in business for 10 or less years, and has an order backlog equivalent or more to its current fleet capacity
• To put this in perspective, in a highly unlikely event of an immediate full 13.0 percent reduction in backlog, years of backlog would only be reduced from 9.6 to 8.4 years, equating to 11,716 units of backlog, about a level achieved for the first time in 2013
• As a benchmark, in the 2008/2009 global economic downturn, global unit backlog only decreased 5.4 percent (395 units) and backlog value declined 6.9 percent
Global Commercial Aerospace Industry | Aircraft order backlog analysis
25
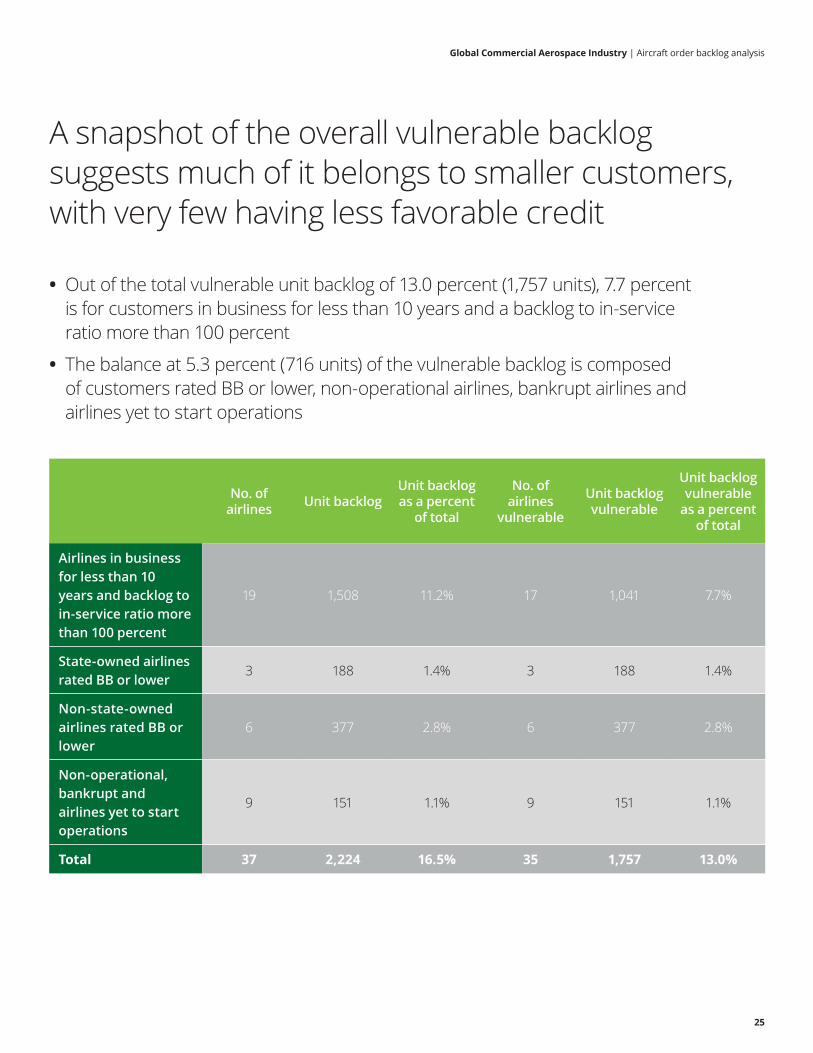
A snapshot of the overall vulnerable backlog suggests much of it belongs to smaller customers, with very few having less favorable credit
• Out of the total vulnerable unit backlog of 13.0 percent (1,757 units), 7.7 percent is for customers in business for less than 10 years and a backlog to in-service ratio more than 100 percent
• The balance at 5.3 percent (716 units) of the vulnerable backlog is composed of customers rated BB or lower, non-operational airlines, bankrupt airlines and airlines yet to start operations
No. of airlines Unit backlog
Unit backlog as a percent
of total
No. of airlines
vulnerable
Unit backlog vulnerable
Unit backlog vulnerable
as a percent of total
Airlines in business for less than 10 years and backlog to in-service ratio more than 100 percent
19 1,508 11.2% 17 1,041 7.7%
State-owned airlines rated BB or lower
3 188 1.4% 3 188 1.4%
Non-state-owned airlines rated BB or lower
6 377 2.8% 6 377 2.8%
Non-operational, bankrupt and airlines yet to start operations
9 151 1.1% 9 151 1.1%
Total 37 2,224 16.5% 35 1,757 13.0%
Global Commercial Aerospace Industry | Aircraft order backlog analysis
26
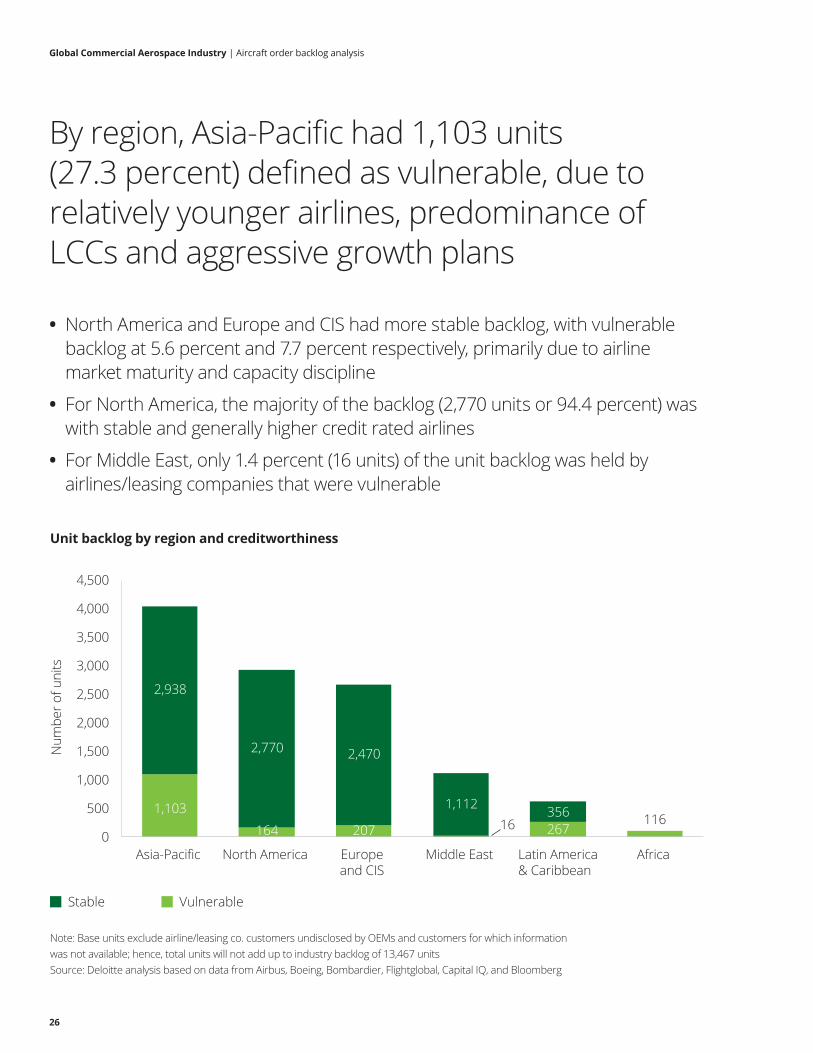
Unit backlog by region and creditworthiness
2,938
1,103
2,770
164 267207
2,470
356 116160
500
1,000
1,500
2,000
2,500
3,000
3,500
4,000
4,500
Asia-Pacific North America Europe and CIS
Middle East Latin America& Caribbean
Africa
Num
ber o
f uni
ts
1,112
Note: Base units exclude airline/leasing co. customers undisclosed by OEMs and customers for which information was not available; hence, total units will not add up to industry backlog of 13,467 unitsSource: Deloitte analysis based on data from Airbus, Boeing, Bombardier, Flightglobal, Capital IQ, and Bloomberg
Stable Vulnerable
By region, Asia-Pacific had 1,103 units (27.3 percent) defined as vulnerable, due to relatively younger airlines, predominance of LCCs and aggressive growth plans
• North America and Europe and CIS had more stable backlog, with vulnerable backlog at 5.6 percent and 7.7 percent respectively, primarily due to airline market maturity and capacity discipline
• For North America, the majority of the backlog (2,770 units or 94.4 percent) was with stable and generally higher credit rated airlines
• For Middle East, only 1.4 percent (16 units) of the unit backlog was held by airlines/leasing companies that were vulnerable
Global Commercial Aerospace Industry | Aircraft order backlog analysis
27
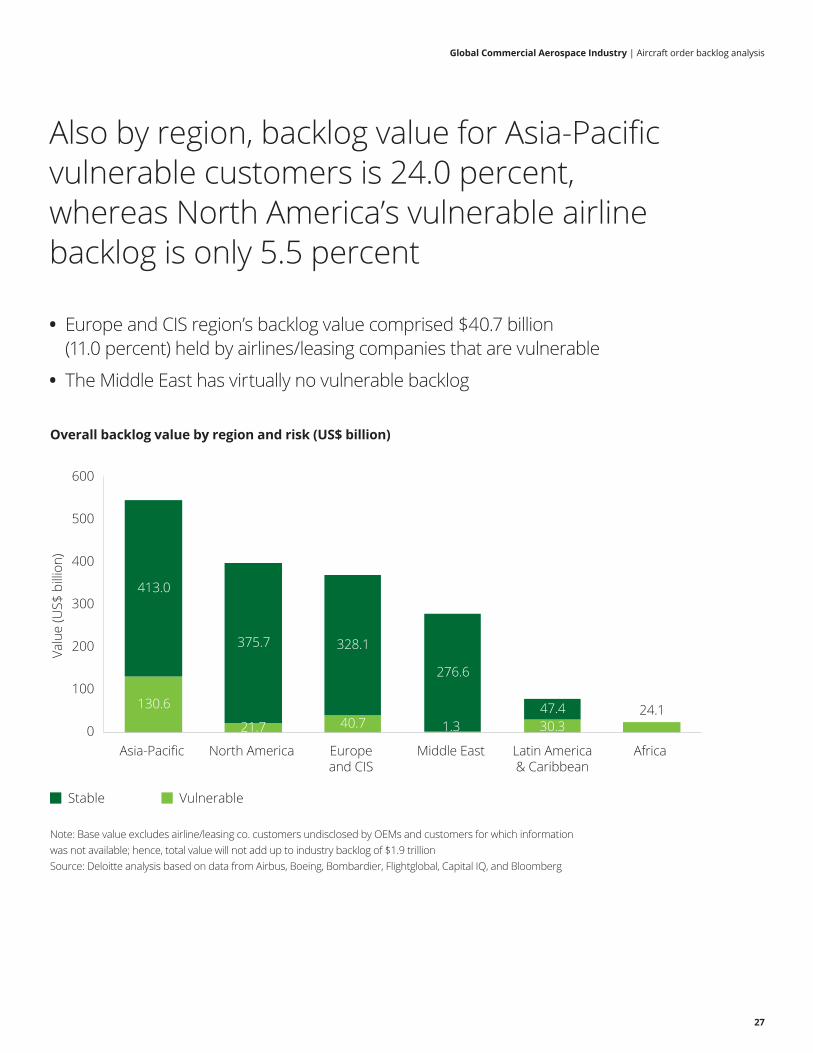
Overall backlog value by region and risk (US$ billion)
Asia-Pacific North America Europe and CIS
Middle East Latin America& Caribbean
Africa
Note: Base value excludes airline/leasing co. customers undisclosed by OEMs and customers for which information was not available; hence, total value will not add up to industry backlog of $1.9 trillionSource: Deloitte analysis based on data from Airbus, Boeing, Bombardier, Flightglobal, Capital IQ, and Bloomberg
Stable Vulnerable
130.640.721.7 1.3
413.0
375.7 328.1
276.6
47.430.3
24.10
100
200
300
400
500
600
Valu
e (U
S$ b
illion
)
Also by region, backlog value for Asia-Pacific vulnerable customers is 24.0 percent, whereas North America’s vulnerable airline backlog is only 5.5 percent
• Europe and CIS region’s backlog value comprised $40.7 billion (11.0 percent) held by airlines/leasing companies that are vulnerable
• The Middle East has virtually no vulnerable backlog
Global Commercial Aerospace Industry | Aircraft order backlog analysis
28
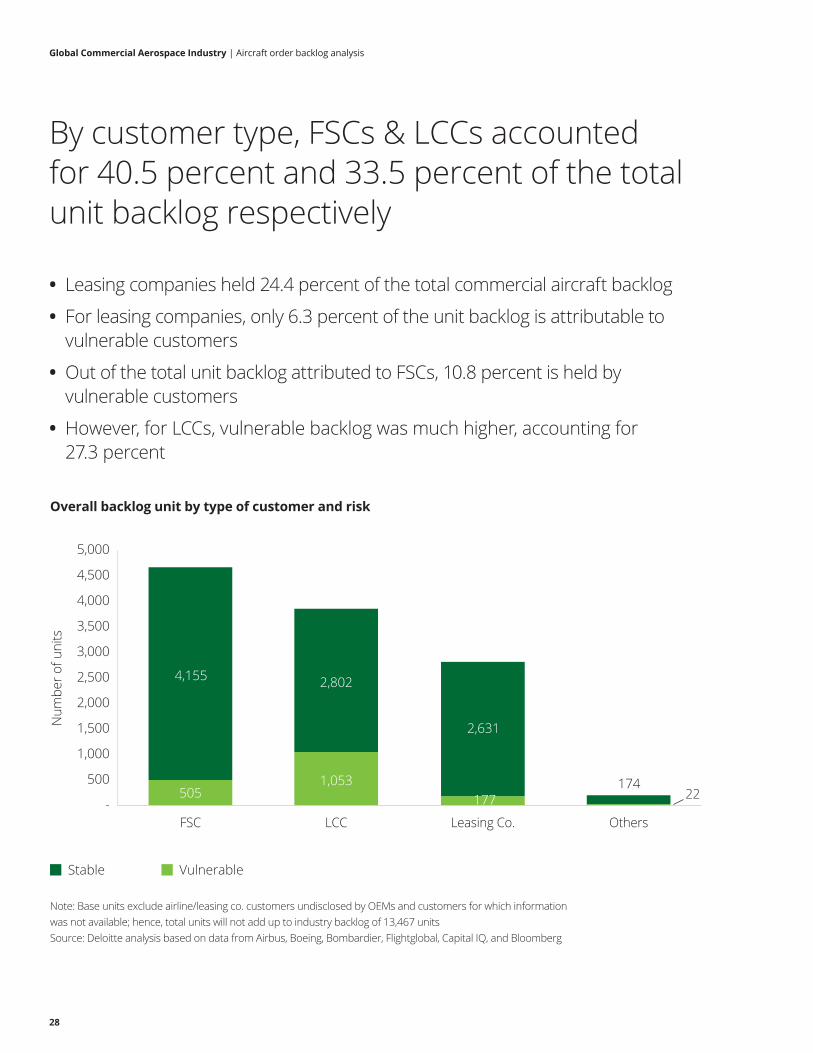
Overall backlog unit by type of customer and risk
FSC LCC Leasing Co. Others
Note: Base units exclude airline/leasing co. customers undisclosed by OEMs and customers for which information was not available; hence, total units will not add up to industry backlog of 13,467 unitsSource: Deloitte analysis based on data from Airbus, Boeing, Bombardier, Flightglobal, Capital IQ, and Bloomberg
Stable Vulnerable
5051,053
177
4,155 2,802
2,631
174 -
500
1,000
1,500
2,000
2,500
3,000
3,500
4,000
4,500
5,000
Num
ber o
f uni
ts
22
By customer type, FSCs & LCCs accounted for 40.5 percent and 33.5 percent of the total unit backlog respectively
• Leasing companies held 24.4 percent of the total commercial aircraft backlog
• For leasing companies, only 6.3 percent of the unit backlog is attributable to vulnerable customers
• Out of the total unit backlog attributed to FSCs, 10.8 percent is held by vulnerable customers
• However, for LCCs, vulnerable backlog was much higher, accounting for 27.3 percent
Global Commercial Aerospace Industry | Aircraft order backlog analysis
29
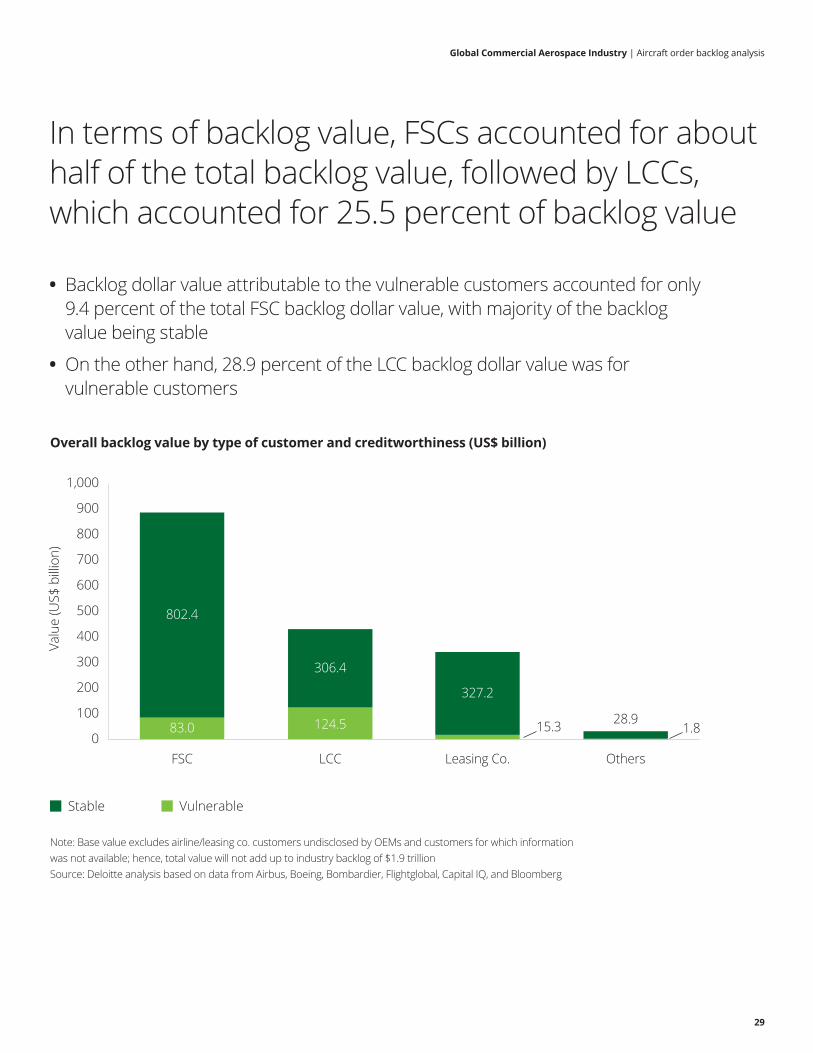
Overall backlog value by type of customer and creditworthiness (US$ billion)
FSC LCC Leasing Co. Others
Note: Base value excludes airline/leasing co. customers undisclosed by OEMs and customers for which informationwas not available; hence, total value will not add up to industry backlog of $1.9 trillionSource: Deloitte analysis based on data from Airbus, Boeing, Bombardier, Flightglobal, Capital IQ, and Bloomberg
Stable Vulnerable
83.0 124.5
802.4
306.4
327.2
15.3 28.90
100
200
300
400
500
600
700
800
900
1,000
Valu
e (U
S$ b
illion
)
1.8
In terms of backlog value, FSCs accounted for about half of the total backlog value, followed by LCCs, which accounted for 25.5 percent of backlog value
• Backlog dollar value attributable to the vulnerable customers accounted for only 9.4 percent of the total FSC backlog dollar value, with majority of the backlog value being stable
• On the other hand, 28.9 percent of the LCC backlog dollar value was for vulnerable customers

Brochure / report title goes here | Section title goes here
30
Sensitivity analysis
Global Commercial Aerospace Industry | Aircraft order backlog analysis
31
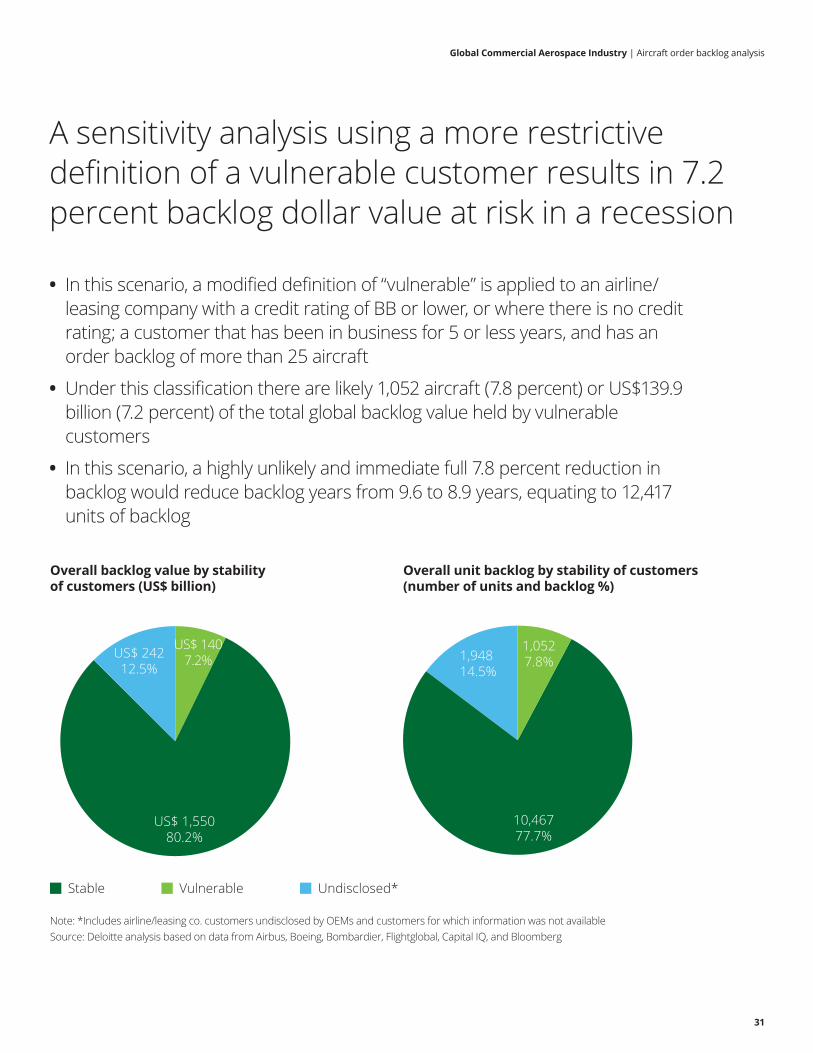
Overall backlog value by stability of customers (US$ billion)
Overall unit backlog by stability of customers (number of units and backlog %)
Note: *Includes airline/leasing co. customers undisclosed by OEMs and customers for which information was not availableSource: Deloitte analysis based on data from Airbus, Boeing, Bombardier, Flightglobal, Capital IQ, and Bloomberg
Stable Vulnerable
1,052 7.8%
10,467 77.7%
1,94814.5%
Undisclosed*
US$ 1,55080.2%
US$ 1407.2%US$ 242
12.5%
A sensitivity analysis using a more restrictive definition of a vulnerable customer results in 7.2 percent backlog dollar value at risk in a recession
• In this scenario, a modified definition of “vulnerable” is applied to an airline/leasing company with a credit rating of BB or lower, or where there is no credit rating; a customer that has been in business for 5 or less years, and has an order backlog of more than 25 aircraft
• Under this classification there are likely 1,052 aircraft (7.8 percent) or US$139.9 billion (7.2 percent) of the total global backlog value held by vulnerable customers
• In this scenario, a highly unlikely and immediate full 7.8 percent reduction in backlog would reduce backlog years from 9.6 to 8.9 years, equating to 12,417 units of backlog

32
Methodology
Global Commercial Aerospace Industry | Aircraft order backlog analysis
33
Customer categorization – Methodology
• For the purpose of the analysis, the listed metrics for 2151 airlines/leasing companies (for which information was available) was analyzed to categorize commercial aircraft backlog as stable or vulnerable: – Type of airline: Public, Private or State-owned enterprise (SOE) – Credit ratings – In-service fleet size – Aircraft backlog units – Backlog to in-service fleet ratio percent2
• Criteria to classify airlines/leasing companies as stable or vulnerable: – For airlines/leasing companies rated by credit agencies (including SOEs), airlines/leasing companies with credit rating BB or lower have been classified as vulnerable; ratings BB and above are categorized as stable – For non-rated airlines/leasing companies, a Public/Private (Non-SOE) airline which is less than 10 years in business and has a backlog to in-service fleet ratio of above 100 percent, has been classified as vulnerable – All other public and private airlines/leasing companies have been classified as stable. State-owned or government-owned airlines that are not credit rated are classified as stable as they are less likely to experience deferrals or cancellations due to financial stress
• Backlog value is calculated at list prices, and backlog units are calculated at the current rate of aircraft production
Source: Deloitte analysis Note: 1) Includes major disclosed airline customers, representing more than 85 percent of the total backlog 2) Backlog to in-service fleet ratio is defined as “Current order backlog / In-service fleet”
Backlog data is sourced from Airbus and Boeing websites, hence, not likely that there is double counting of units between airlines and leasing companies
Global Commercial Aerospace Industry | Aircraft order backlog analysis
34
Caveats
• The analysis has not assessed each individual OEM’s backlog, nor individual airline/leasing company customers, nor have comments on the creditworthiness or vulnerability thereof in backlog.
• Information on 215 of the 233 customers of OEMs was available for analysis, and the analysis offers observations attributable to the entire backlog, including the 18 other customers not assessed. This extrapolation might not be valid.
• The definition of vulnerable is based on criteria which may not be valid or agreed by others that offer financing to purchase aircraft.
• For customers with a credit rating, those with higher than BB may indeed have vulnerability in a severe economic recession to deferrals and cancellations, even though this analysis assumes not. Conversely, customers with BB or lower ratings could indeed have stability in their orders, although for this analysis it is assumed not.
• For non-credit rated customers in business 10 or less years, and have orders in backlog double their current fleet, it is assumed they are a vulnerable customer, absent specific credit ratings indicating otherwise. This definition may not be valid. – Customers that have orders in backlog that are double their current fleet size may indeed be creditworthy, even though they do not have a public credit rating by one of the agencies. – Customers that have been in business 10 years or less may indeed be creditworthy.
• Government and state-owned enterprises may indeed have orders in backlog subject to deferral or cancellation, even though for this analysis it is assumed that they are not vulnerable.
Source: Deloitte analysis
Global Commercial Aerospace Industry | Aircraft order backlog analysis
35
Sources
• Boeing, Orders and Deliveries www.boeing.com/commercial/#/orders-deliveries
• Airbus, Orders and Deliveries www.airbus.com/company/market/orders-deliveries/
• Bombardier, Commercial Aircraft Status Reports www.bombardier.com/en/media/commercial-aircraft-status-reports.html
• Boeing, Current Market Outlook (2015-2034), June 2015, www.boeing.com/resources/boeingdotcom/commercial/about-our-market/assets/downloads/Boeing_Current_Market_Outlook_2015.pdf
• IATA, Fact Sheet, June 2015 https://www.iata.org/pressroom/facts_figures/fact_sheets/Documents/fact-sheet-industry-facts.pdf
• ICAO, Air Transport Yearly Monitor, 2015 www.icao.int/sustainability/Pages/Air-Traffic-Monitor.aspx
• UBS, Aircraft Backlog Analysis, February, 2004
• Flightglobal
• Airlines.org
• Capital IQ
• Bloomberg
• Deloitte analysis

Global Commercial Aerospace Industry | Aircraft order backlog analysis
36
Contact
Tom Captain Vice Chairman Aerospace & Defense Sector Leader Deloitte LLP +1 206 716 6452 [email protected]
Acknowledgements
The leadership thanks Aijaz Hussain, Aerospace & Defense Sector Research Leader from the Deloitte US Center for Industry Insights, for his significant contribution towards the research and analysis of this study. Also, thanks to Siddhant Mehra, Deloitte Support Services India Pvt. Ltd.
About the Deloitte Center for Industry Insights
The Deloitte Center for Industry Insights (the Center) provides premiere insights based on primary research on the most prevalent issues facing the consumer business and manufacturing industries to help companies run effectively and achieve superior business results. The Center is associated with the Deloitte US firm's Consumer & Industrial Products practice, which benefits from the insights of over 12,000 multi-disciplined professionals with a wide array of deep, hands-on industry experience.

About this publicationThis communication contains general information only, and none of Deloitte Touche Tohmatsu Limited, its member firms, or their related entities (collectively, the “Deloitte Network”) is, by means of this communication, rendering professional advice or services. Before making any decision or taking any action that may affect your finances or your business, you should consult a qualified professional adviser. No entity in the Deloitte Network shall be responsible for any loss whatsoever sustained by any person who relies on this communication. Deloitte Global Consumer & Industrial Products Industry groupThe Deloitte Global Consumer & Industrial Products Industry group (Global C&IP) comprises more than 22,000 member firm partners and industry professionals in over 45 countries. Deloitte member firms provide professional services to 84 percent of the C&IP industry companies on the Fortune Global 500®, making an impact that matters in business sectors representing the entire value chain from raw materials to the end consumer. The group brings deep industry knowledge, service line experience, and thought leadership to solving complex business issues in every corner of the globe. Deloitte member firms attract, develop, and retain the very best professionals, and instill a set of shared values centered on integrity, commitment, and serving clients with distinction. Sectors served include aerospace and defense; automotive; chemicals and specialty materials, including metals, forest, paper and packaging; consumer products; industrial products and services; retail, wholesale and distribution; as well as travel, hospitality and business services. For more information about the Global C&IP Industry group, please visit www.deloitte.com/manufacturing and www.deloitte.com/consumerbusiness. About DeloitteDeloitte refers to one or more of Deloitte Touche Tohmatsu Limited, a UK private company limited by guarantee (“DTTL”), its network of member firms, and their related entities. DTTL and each of its member firms are legally separate and independent entities. DTTL (also referred to as “Deloitte Global”) does not provide services to clients. Please see www.deloitte.com/about for a more detailed description of DTTL and its member firms.
Deloitte provides audit, consulting, financial advisory, risk management, tax and related services to public and private clients spanning multiple industries. With a globally connected network of member firms in more than 150 countries, Deloitte brings world-class capabilities and high-quality service to clients, delivering the insights they need to address their most complex business challenges. Deloitte’s more than 225,000 professionals are committed to making an impact that matters. Deloitte serves 4 out of 5 Fortune Global 500® companies. © 2016. For information, contact Deloitte Touche Tohmatsu Limited.