Embed Size (px)
Citation preview

ANALYSIS OF THE EU AIR TRANSPORT INDUSTRY
Final Report 2005
Contract no: TREN/05/MD/S07.52077
by
Cranfield University Department of Air Transport

Analysis of the EU Air Transport Industry, 2005 1

Analysis of the EU Air Transport Industry, 2005 2
CONTENTS 1 AIR TRANSPORT INDUSTRY OVERVIEW......................................................................................11
2 REGULATORY DEVELOPMENTS.....................................................................................................19
3 CAPACITY ............................................................................................................................................25
4. AIR TRAFFIC........................................................................................................................................36
5. AIRLINE FINANCIAL PERFORMANCE............................................................................................54
6. AIRPORTS.............................................................................................................................................85
7 AIR TRAFFIC CONTROL ..................................................................................................................102
8. THE ENVIRONMENT ........................................................................................................................110
9 CONSUMER ISSUES..........................................................................................................................117
10 AIRLINE ALLIANCES .......................................................................................................................124
11 AIRLINE DISTRIBUTION .................................................................................................................131
12 AIRCRAFT AND MANUFACTURERS.............................................................................................137
13 PUBLIC SERVICE OBLIGATION (PSO) ..........................................................................................142

Analysis of the EU Air Transport Industry, 2005 3
Tables Table 1 Financial results: European airlines 2005 vs 2004 ..............................................................................................13 Table 2 Labour costs and productivity: 16 major European network airlines ..................................................................16 Table 3 Changes to domestic networks between June 2004 and June 2005.....................................................................26 Table 4 Losses to the Finnish domestic network..............................................................................................................26 Table 5 Changes to international intra-European networks, 2004-2005...........................................................................27 Table 6 easyJet and Ryanair London airport networks, 2001 - 2005................................................................................31 Table 7 Total passenger traffic of AEA members, 2005 ..................................................................................................40 Table 8 Scheduled passenger services of AEA members, 2005 vs 2004..........................................................................41 Table 9 Europe’s passenger charter airlines in 2005 ........................................................................................................45 Table 10 Europe’s charter airlines’ demand in 2005, and change over 2004 .....................................................................46 Table 11 Air freight traffic carried by AEA carriers, 2005 vs 2004...................................................................................50 Table 12 Growth of world air cargo traffic by regional, 2005 vs 2004 ..............................................................................52 Table 13 Total revenue (US$) per RTK - selected European network airlines ..................................................................55 Table 14 Labour costs and productivity: 16 European airlines, 2004 vs 2005 ...................................................................56 Table 15 Financial results: major European network carriers ............................................................................................58 Table 16 Labour costs and productivity: LCC and charter airlines ....................................................................................62 Table 17 Financial results: European LCC and charter airlines, 2004 and 2005................................................................64 Table 18 Charter airline subsidiaries of Europe’s largest tour operators............................................................................71 Table 19 Financial performance of First Choice ................................................................................................................71 Table 20 Split of First Choice passengers by length of haul ..............................................................................................71 Table 21 Financial performance of MyTravel....................................................................................................................72 Table 22 Financial performance of TUI’s tourism division ...............................................................................................72 Table 23 Financial performance of Thomas Cook Group ..................................................................................................73 Table 24 Financial performance of Kuoni Group...............................................................................................................73 Table 25 Financial results: Air Nostrum and Portugalia ....................................................................................................73 Table 26 Top-twenty European regionals in terms of revenue (USD million) 2005 ..........................................................74 Table 27 Financial results: US airlines (ATA members) ...................................................................................................77 Table 28 Financial results: Asia/Pacific airlines (AAPA members)...................................................................................78 Table 29 Average aviation fuel price trends.......................................................................................................................80 Table 30 FY2005/06 fuel needs hedged at YE2004/05: European airlines .......................................................................81 Table 31 Fuel surcharges announced by major EU airlines in 2005 (€).............................................................................81 Table 32 Cash flow summary for major EU airlines, 2005/06 ...........................................................................................82 Table 33 Top twenty EEA airport operators and top two from accession states, 2005 ......................................................89 Table 34 Share ownership structure for major European airports, 2005 ............................................................................90 Table 35 Interests in other airports by major European airport, 2005 ................................................................................91 Table 36 Departure punctuality: overall performance for ERA regional airlines...............................................................98 Table 37 Departure punctuality for ten largest ERA regional airlines................................................................................99 Table 38 AEA departure delay rates on intra-European services .....................................................................................100 Table 39 Primary cause of departure delays, 2003 - 2005 .......................................................................................108 Table 40 UK air transport CO2 emissions in 2050, as a percentage of 2000 UK total emissions baseline ......................112 Table 41 Global air transport CO2 emissions 2050, as % of 1992 total global emissions baseline..................................112 Table 42 Air transport emissions in a carbon-constrained world, as % of total emissions in 2050 ..................................112 Table 43 Fuel consumption for major EU airlines, 2005 vs 2004 ....................................................................................114 Table 44 Change in pollutants emitted for major EU airlines, 2004 v 2005.....................................................................114 Table 45 Scheduled passengers from major UK airports by purpose of travel and country.............................................117 Table 46 Business traveller behaviour and attitudes ........................................................................................................119 Table 47 Alliance Group Market Shares, 2005 ................................................................................................................124 Table 48 Unaligned carriers market share, 2005 ..............................................................................................................125 Table 49 Weekly global operations..................................................................................................................................126 Table 50 Trend in airline alliance formation ....................................................................................................................126 Table 51 Airline alliances (code shares) commenced by European airlines in 2005........................................................128 Table 52 Proportion of European LCC sales made online ...............................................................................................131 Table 53 Distribution costs for airlines as a percentage of ticket costs ............................................................................132 Table 54 GDS market structure by region........................................................................................................................132 Table 55 Star Alliance’s $11bn distribution costs............................................................................................................133 Table 56 Jet airliner orders and deliveries........................................................................................................................139 Table 57 Regional jet airliner orders and deliveries .........................................................................................................140 Table 58 Turboprop airliner orders and deliveries ...........................................................................................................140 Table 59 PSO lifted and imposed during 2005.................................................................................................................143 Table 60 Norwegian PSO routes 2003-2006....................................................................................................................144

Analysis of the EU Air Transport Industry, 2005 4
Figures Figure 1 Number of city-pair routes between and within states, June 2005 ......................................................................25 Figure 2 Evolution of European routes served by single carriers ......................................................................................28 Figure 3 Seats provided by low-cost carriers, June 2004 and June 2005...........................................................................32 Figure 4 Ryanair Route Structure ex-London, 2005..........................................................................................................33 Figure 5 easyJet Route Structure, ex-London, 2005..........................................................................................................34 Figure 6 Scheduled airline performance, 1995 and 2005 ..................................................................................................36 Figure 7 Average annual growth in RPK by region, 1995-2005 .......................................................................................37 Figure 8 Growth in IATA total international RPK and ASK, 2004-2005..........................................................................37 Figure 9 European air passenger traffic, 2005 and 2004 ...................................................................................................38 Figure 10 Change in air passenger traffic, 2004-2005....................................................................................................39 Figure 11 Extra-EU-25 transport of passengers: % of total in 2005 by region...............................................................39 Figure 12 Scheduled service RPKs of selected AEA members, 2005 and 2004 ............................................................41 Figure 13 Total scheduled passengers by carrier 2005...................................................................................................42 Figure 14 Ryanair load factors on selected London Stansted services 2005 ..................................................................43 Figure 15 Easyjet load factors on selected Dortmund services, 2005.............................................................................44 Figure 16 Top 20 European charter airlines in RPKs in 2005 ........................................................................................47 Figure 17 UK short-haul charter passengers ..................................................................................................................48 Figure 18 European air freight and mail transport by state, 2005...................................................................................49 Figure 19 Annual growth in air freight and mail, 2004-2005.........................................................................................49 Figure 20 Top 12 AEA airline cargo traffic in 2005 and 2004.......................................................................................50 Figure 21 Passenger yields in current and constant USD: AEA member airlines ..........................................................54 Figure 22 Passenger yields in current price € - AEA member airlines...........................................................................55 Figure 23 Premium passengers as a % of total - AEA member airlines .........................................................................56 Figure 24 Labour productivity for selected network carriers, 2004 v 2005...................................................................57 Figure 25 Cost per employee for selected network carriers, 2004 v 2005......................................................................58 Figure 26 Operating margins for major European network airlines, 2005 vs 2004 ........................................................59 Figure 27 AEA airlines: key factors influencing operating results, 2005 vs 2004 .........................................................60 Figure 28 Intra-European RPK as % of total operations (2005).....................................................................................61 Figure 29 ATK per employee, LCC, charter and regional airlines, 2004 v 2005 ...........................................................63 Figure 30 Labour cost per employee, LCC, charter and regional airlines, 2004 v 2005 ................................................63 Figure 31 Operating results, LCC and charter airlines ...................................................................................................65 Figure 32 LCC unit costs, 2004 and 2005......................................................................................................................65 Figure 33 LCC yields, 2004 and 2005............................................................................................................................66 Figure 34 LCC average fares, 2004 and 2005 ...............................................................................................................67 Figure 35 LCC break-even load factors and load factor achieved, 2005.......................................................................67 Figure 36 LCC operating ratios, 2004 and 2005 ............................................................................................................68 Figure 37 LCC aircraft utilisation, 2004 and 2005.........................................................................................................69 Figure 38 LCC capacity (ASK) per employee, 2004 and 2005 .....................................................................................69 Figure 39 LCC operating revenue per employee, 2004 and 2005 ..................................................................................70 Figure 40 LCC passengers per employee, 2004 and 2005..............................................................................................70 Figure 41 Top 10 all-cargo airlines worldwide in 2005 (and % change over 2004) ......................................................75 Figure 42 Index of AEA airline air cargo yields by region ............................................................................................76 Figure 43 Average aviation fuel price and margin over crude oil, 1989-2005 ..............................................................80 Figure 44 Sources of aircraft financing for Boeing deliveries, 2003 and 2005 ..............................................................83 Figure 45 ACI airports by region, 2005 traffic change over 2004..................................................................................85 Figure 46 Eurpopean airports in the world’s top twenty (by passengers), 2005.............................................................86 Figure 47 Passenger traffic at the top 20 ACI Europe airports, 2005 .............................................................................87 Figure 48 Passenger traffic for a selection of smaller European airports, 2005 .............................................................88 Figure 49 Aggregate results for some leading EEA airport operators 2001 -2005 ........................................................93 Figure 50 Change in operating revenues, top ten EEA airport operators, 2005 v 2004..................................................93 Figure 51 Operating margins, EEA operators, 2004 and 2005.......................................................................................94 Figure 52 Net margin by EEA operator 2004 and 2005 .................................................................................................94 Figure 53 Important factors in choosing an airline (2004 – 2005) ...............................................................................118 Figure 54 Changes in intra-European business class (2004 – 2005) ............................................................................120 Figure 55 Changes in North Atlantic business class (2004 – 2005) .............................................................................120 Figure 56 Share of IATA airline traffic by alliance group, 2005 .................................................................................124 Figure 57 E-Ticket penetration by IATA airlines by region.........................................................................................134 Figure 58 First Route Example: Tenders for 2003-2006..............................................................................................145 Figure 59 Second Route Example: Tenders for 2003-2006..........................................................................................145
Analysis of the EU Air Transport Industry, 2005 5
Glossary
Abbreviations, Acronyms and Codes
Aviation Organisations ACI Airports Council International (formerly AACI) AEA Association of European Airlines AFTN Aeronautical Fixed Telecommunications
Network AOA Airports Operators Association ARINC Aeronautical Radio Incorporated BV Bureau Veritas (France) CAA Civil Aviation Authority CCA Conference of City Airports DOT Department of Transportation (US) ECAC European Civil Aviation Conference ERA European Regional Airlines Association FAA Federal Aviation Administration (US) IATA International Air Transport Association ICAO International Civil Aviation Organisation (also
known as OACI in French) INMARSAT International Maritime Satellite Organisation JAA Joint Aviation Authorities LBA Luftfahrt Bundesamt (Germany) NATS National Air Traffic Services (UK) NTSB National Transportation Safety Board OAA Orient Airlines Association OAG Official Airline Guide RAI Registro Aeronautico Italiano RTCA Radio Technical Commission for Aeronautics SITA Société Internationale de Télécommunications
Aéronautique
Units of Measurement ASK Available Seat-Kilometre ATK Available Tonne-Kilometre ATM Air Transport Movement FTK Freight Tonne-Kilometre LF Load Factor MTOW Maximum Take-Off Weight PAX Passengers RPK Revenue Passenger-Kilometre RTK Revenue Tonne-Kilometre
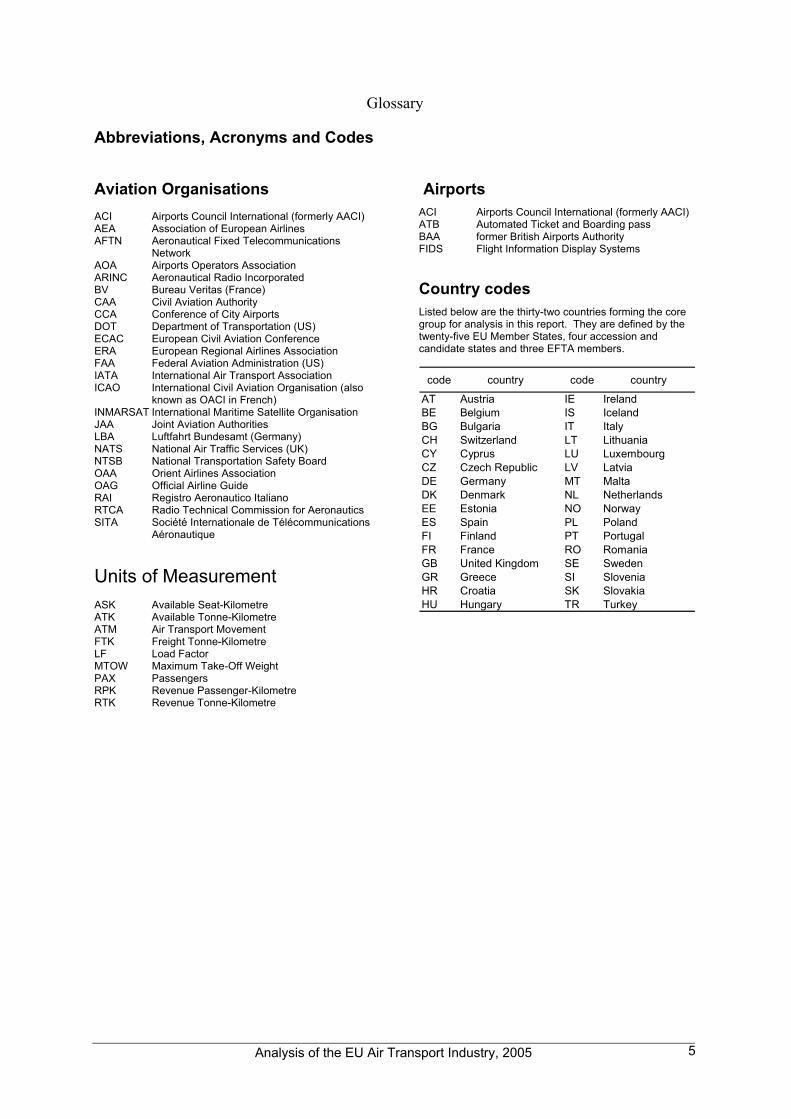
Airports ACI Airports Council International (formerly AACI) ATB Automated Ticket and Boarding pass BAA former British Airports Authority FIDS Flight Information Display Systems Country codes Listed below are the thirty-two countries forming the core group for analysis in this report. They are defined by the twenty-five EU Member States, four accession and candidate states and three EFTA members.
code country code country
AT Austria IE IrelandBE Belgium IS IcelandBG Bulgaria IT ItalyCH Switzerland LT LithuaniaCY Cyprus LU LuxembourgCZ Czech Republic LV LatviaDE Germany MT MaltaDK Denmark NL NetherlandsEE Estonia NO NorwayES Spain PL PolandFI Finland PT PortugalFR France RO RomaniaGB United Kingdom SE SwedenGR Greece SI SloveniaHR Croatia SK SlovakiaHU Hungary TR Turkey

Analysis of the EU Air Transport Industry, 2005 6
Notwithstanding the definition of Europe in the previous paragraph, some sources of data used in this report employ quite different definitions. In the table below, countries represented as members states, contracting states or represented by airline members of international organisations are listed.
EU
Mem
ber
Sta
tes
cand
idat
e st
ates
Albania
Algeria
Andorra
Armenia
Austria
Azerbaijan
Belarus
Belgium
Bosnia & Herzegovina
Bulgaria
Croatia
Cyprus ♦Czech Republic
Denmark
Estonia
Finland
France
FYR Macedonia
Georgia
Germany
Greece
Hungary
Iceland
Ireland
Israel
Italy
Kazakhstan
Kyrgyzstan
Latvia
Liechtenstein
Lithuania
Luxembourg
Malta
Moldova
Monaco
Morocco
Netherlands
Norway
Poland
Portugal
Romania
Russian Federation
San Marino
Serbia & Montenegro
Slovakia
Slovenia
Spain
Sweden
Switzerland
Tajikistan
Tunisia
Turkey
Turkmenistan
Ukraine
United Kingdom
Uzbekistan
IATA
Eur
ope
ICAO
Eur
ope
EEA
EFTA
AC
I Eur
ope
AEA
ECA
C
Eur
o-co
ntro
l
♦ Cyprus is an ICAO contracting state, but represented through the Middle East (Cairo) office of ICAO

Analysis of the EU Air Transport Industry, 2005 7
As the representative of Europe’s major scheduled airlines, the Association on European Airlines (AEA) is used extensively as a data source for this report. The organisation’s airline membership is given below.
Country AEA airline member(s)
Austria Austrian
Belgium SN Brussels
Croatia Croatia Airlines
Cyprus Cyprus Airways
Czech Republic CSA Czech Airlines
Denmark SAS
Finland Finnair
France Air France
Germany Lufthansa
Greece Olympic Airlines
Hungary Malev Hungarian Airlines
Iceland Icelandair
Ireland Aer Lingus
Italy Alitalia
Luxembourg Luxair Cargolux
Malta Air Malta
Netherlands KLM
Norway SAS
Poland LOT
Portugal TAP Portugal
Romania TAROM
Serbia and Montenegro JAT Airways
Slovenia Adria Airways
Spain Iberia
Sweden SAS
Switzerland Swiss International
Turkey Turkish Airlines
United Kingdom Virgin Atlantic Brirish Airways BMI
Analysis of the EU Air Transport Industry, 2005 8
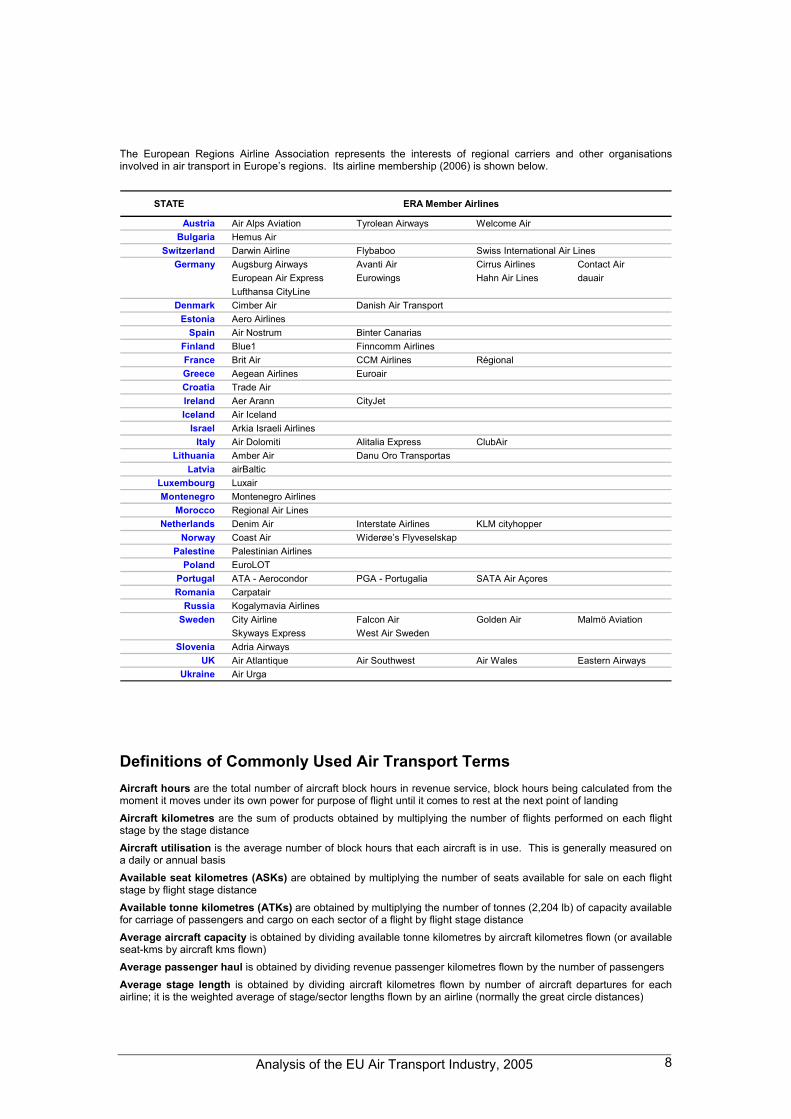
The European Regions Airline Association represents the interests of regional carriers and other organisations involved in air transport in Europe’s regions. Its airline membership (2006) is shown below.
STATE ERA Member Airlines
Austria Air Alps Aviation Tyrolean Airways Welcome AirBulgaria Hemus Air
Switzerland Darwin Airline Flybaboo Swiss International Air LinesGermany Augsburg Airways Avanti Air Cirrus Airlines Contact Air
European Air Express Eurowings Hahn Air Lines dauairLufthansa CityLine
Denmark Cimber Air Danish Air TransportEstonia Aero Airlines
Spain Air Nostrum Binter CanariasFinland Blue1 Finncomm AirlinesFrance Brit Air CCM Airlines RégionalGreece Aegean Airlines EuroairCroatia Trade AirIreland Aer Arann CityJetIceland Air Iceland
Israel Arkia Israeli AirlinesItaly Air Dolomiti Alitalia Express ClubAir
Lithuania Amber Air Danu Oro TransportasLatvia airBaltic
Luxembourg LuxairMontenegro Montenegro Airlines
Morocco Regional Air LinesNetherlands Denim Air Interstate Airlines KLM cityhopper
Norway Coast Air Widerøe’s FlyveselskapPalestine Palestinian Airlines
Poland EuroLOTPortugal ATA - Aerocondor PGA - Portugalia SATA Air AçoresRomania Carpatair
Russia Kogalymavia AirlinesSweden City Airline Falcon Air Golden Air Malmö Aviation
Skyways Express West Air SwedenSlovenia Adria Airways
UK Air Atlantique Air Southwest Air Wales Eastern AirwaysUkraine Air Urga
Definitions of Commonly Used Air Transport Terms Aircraft hours are the total number of aircraft block hours in revenue service, block hours being calculated from the moment it moves under its own power for purpose of flight until it comes to rest at the next point of landing Aircraft kilometres are the sum of products obtained by multiplying the number of flights performed on each flight stage by the stage distance Aircraft utilisation is the average number of block hours that each aircraft is in use. This is generally measured on a daily or annual basis Available seat kilometres (ASKs) are obtained by multiplying the number of seats available for sale on each flight stage by flight stage distance Available tonne kilometres (ATKs) are obtained by multiplying the number of tonnes (2,204 lb) of capacity available for carriage of passengers and cargo on each sector of a flight by flight stage distance Average aircraft capacity is obtained by dividing available tonne kilometres by aircraft kilometres flown (or available seat-kms by aircraft kms flown) Average passenger haul is obtained by dividing revenue passenger kilometres flown by the number of passengers Average stage length is obtained by dividing aircraft kilometres flown by number of aircraft departures for each airline; it is the weighted average of stage/sector lengths flown by an airline (normally the great circle distances)

Analysis of the EU Air Transport Industry, 2005 9
Block time (hours) is the time for each flight stage or sector, measured from when the aircraft leaves the airport gate or stand (chocks off) to when it arrives on the gate or stand at the destination airport (chocks on) Break-even load factor (%) is the load factor required to equate total traffic revenue with operating costs Code sharing is the use of the designation code of one or more airlines on a flight operated by another airline Co-ordinated airport is an airport where an independent co-ordinator has been appointed to facilitate the allocation of take-off and landing slots (times) to airlines at congested airports in Europe Flying time (hours) is the time for each flight stage or sector, measured from when the aircraft leaves the ground or lifts off to when it touches down on the runway on arrival at the destination airport Freight tonne kilometres (FTKs) are obtained by multiplying the number of tonnes of capacity carried (passengers and cargo) on each sector of a flight, by flight stage distance Grandfather rights is the convention by which airlines retain the right to take-off and landing slot times at an airport as long as they are used (also used in conjunction with route rights) Interlining is the acceptance by one airline of travel documents issued by another airline for carriage on the services of the first airline, according to conditions laid down in an interline agreement (which include the allocation of revenues between the two carriers); an interline passenger is one using a through fare for a journey involving two or more separate flights and two or more carriers Operating costs per ATK is a measure obtained by dividing total operating costs by ATKs. It includes flight operating expenses, sales ticketing and promotional costs, ground operations costs and general and administration costs. It usually excludes interest payments, but includes aircraft lease rentals Operating ratio (%) is the operating revenue expressed as a percentage of operating costs Passengers carried are obtained by counting each passenger on a particular flight (with one flight number) once only and not repeatedly on each individual stage of that flight (or one ticket coupon equals one passenger), with a single exception that a passenger flying on both the international and domestic stages of the same flight should be counted as both a domestic and an international passenger Passenger load factor (%) is passenger-kilometres expressed as a percentage of available seat kilometres (on a single sector, this is simplified to the number of passengers carried as a % seats available for sale) Punctuality is measured as the percentage of flights departing within 15 minutes of schedule, according to the most widely used airline industry standard Revenue passenger refers to passengers paying 25% or more of the normal applicable fare (for ICAO statistical purposes) Revenue passenger kilometres (RPKs) are obtained by multiplying the number of fare paying passengers on each flight stage by flight stage distance Revenue tonne kilometres (RTKs) are obtained by multiplying the total number of tonnes of passengers and cargo carried on each flight stage by flight stage distance. Passengers tonne kilometres are normally calculated on a standard basis of 90 kg average weight, including free and excess baggage, although this has been increased recently by some airlines (eg British Airways have recently increased the average passenger weight from 75kg to 80kg, as a result of a CAA directive, to which the 20 kg free baggage allowance should be added) Seat factor or passenger load factor on a single sector is obtained by expressing the passengers carried as a % of the seats available for sale; on a network of routes it is obtained by expressing the total passenger-kms as a % of the total seat-kms available Seat pitch is the standard way of measuring seat density on an aircraft. It is the distance between the back of one seat and the same point on the back of the seat in front Scheduled freight yields are obtained by dividing total revenue from scheduled freight by RTK from freight Scheduled passenger yields are obtained by dividing the total scheduled passenger revenue by RTK from passengers Scheduled services are services provided by flights scheduled and performed for remuneration according to a published timetable, or so regular or frequent as to constitute a recognisably systematic series, which are open to direct booking by members of the public; also extra revenue flights occasioned by overflow traffic from scheduled flights; and preliminary revenue flights on planned new air services Slot at an airport is the right to operate one take-off or landing at that airport within a fixed time period. In practice, the slot timings are only nominal and flights often take-off and land at times outside their specified slot period, although airlines must possess the nominal slots to operate air services. Slots are traded between airlines legally in the US, and unofficially in other parts of the world (where only the exchange of slots is officially permitted) Unduplicated route kilometres are the lengths in kilometres of all the flight stages operated by the airline, each counted only once, and regardless of frequency or direction Unit costs are obtained by dividing total operating costs by ATKs Weight load factor is revenue tonne kilometres performed expressed as percentage of available tonne kilometres (also called overall load factor) Yields are obtained by dividing the total operating revenue by RTKs (or sometimes by ATK); passenger yields are obtained by dividing passenger revenues by RPKs, and cargo yields by dividing cargo revenues by FTKs. Revenues have historically been recorded before the deduction of travel agent commissions, giving gross rather than yields net of commissions

Analysis of the EU Air Transport Industry, 2005 10
SECTION 1
AIR TRANSPORT INDUSTRY OVERVIEW
1.1 REGULATORY/COMPETITION ................................................................11
1.2 AIRLINES..............................................................................................12
1.3 AIRPORTS.............................................................................................13
1.4 AIR TRAFFIC CONTROL .........................................................................14
1.5 THE ENVIRONMENT ..............................................................................15
1.6 CONSUMER ISSUES ...............................................................................15
1.7 AIRLINE ALLIANCES AND MERGERS......................................................15
1.8 AIRLINE DISTRIBUTION ........................................................................16
1.9 AIRCRAFT ............................................................................................16
1.10 LABOUR ...............................................................................................16

Analysis of the EU Air Transport Industry, 2005 11
1 Air transport Industry overview
1.1 Regulatory/competition
There was a significant rise in the number of “Open Skies” deals reached worldwide during 2005, with sixteen such bilateral agreements being concluded, increasing the total number to 118. In all, some 86 bilateral air services agreements were concluded or amended in 2005, with over 70% featuring more liberal arrangements.
In December 2005 a multilateral agreement was reached between the Commission and eight south-east European partners (Albania, Bosnia and Herzegovina, Bulgaria, Croatia, the former Yugoslav Republic of Macedonia, Romania, Serbia, and Montenegro and the United Nations Mission in Kosovo) to establish a European Common Aviation Area. Iceland and Norway were also parties to the agreement (ECAA/1).
During the year the Commission publicised its ambitions in respect of developing aviation agreements with Australia, Chile, China, India, New Zealand, Russia and Ukraine.
Other major developments within the EU during 2005 included Council Regulation 2111/2005 (OJ L 344 of 27.12.2005) that established a list of air carriers subject to an operating ban within the Community. The Regulation requires that passengers be informed of the identity of the operating carrier when they fly.
In February 2005, the Commission put forward its proposal for a Regulation concerning the rights of persons with reduced mobility when travelling by air [COM(2005) 47]. As a result of a consultation process undertaken by the Commission, there is a wide consensus that Community law should protect the rights of persons with reduced mobility. There is also wide agreement that passengers with reduced mobility should not be charged for the assistance needed to use air transport, with the costs being spread across all air travellers.
In September 2005 the Commission adopted new rules covering start up aid granted to airlines operating new routes from regional airports. By increasing transparency and certainty the rules aim to guarantee equal treatment between public and privately owned regional airports. Under the new rules, a regional airport is permitted to give start up aid to an airline for a new, initially, non-commercially viable route, provided the amount is not more than 30%-50% of the additional costs incurred in initiating the service, included marketing and set up costs. The underlying aim is that the new service should ultimately prove profitable and as such the aid must be limited to a maximum of three years, or five years in the case of airports located in disadvantaged or outermost regions of the EU.
Following a preliminary investigation, the Commission began a formal investigation into the public service obligations imposed by Italy on air routes between Sardinia and the Italian mainland (OJ L 75 of 22.3.2005).
In September 2005 the Commission found that the Greece had granted illegal state aid to Olympic Airways and its successor Olympic Airlines1. The declaration represented 1 Olympic Airlines was established in December 2003 to take over the flight operations of Olympic Airways.

Analysis of the EU Air Transport Industry, 2005 12
the culmination of an investigation that had commenced in March 2004 into state aid granted by Greece since 2002.
1.2 Airlines
1.2.1 Connectivity From the OAG, over the 12 months to June 2005, scheduled non-stop services between 355 intra-EU city pairs were abandoned, but a further 711 added contributing to 356 net increase in services.
The proportion of single-carrier routes followed a slow decline between 1994 and 2004 (to just under 69% of all European city-pairs) this was reversed in 2005. By June of that year slightly more than 70% of European schedule air services were operated by only one airline. The reason for this is likely to be found in the new point-to-point routes being opened, often by low-cost carriers. Many of these are still in an initial phase of development, with passenger demand unlikely to attract competition. The highest number of carriers operating on any European route was seven, competing for traffic between Catania and Milan.
1.2.2 Capacity There were no European regional or network airlines start-ups in 2005, but three new charter and three new LCC airlines started operations. There were five LCC failures, five charters and one regional ceased operating.
Passenger capacity of members of the Association of European Airlines (AEA) increased by an average of 4.3% (available seat kilometres), so that the RPK growth of 6.3% resulted in increased passenger load factors (PLF), up from an average 74.6% in 2004 to the 76.0% level reported for 2005. Intra-European PLF increased 1.7% points to 67.2%, with long-haul PLF growing by a more modest 1% point to 81.1%.
1.2.3 Traffic IATA reports intra-European passenger flows as accounting for around 23% of total world passengers in 2004. This places the European market as the second busiest, behind the internal North American market, with 29% of the world’s passengers.
The traffic carried by the 26 reporting AEA airlines mirrored the world picture in 2005: system-wide passenger numbers advanced by 4.5% while passenger-kms rose by 6.1%, indicating an increase in the average passenger trip length. They experienced strongest RPK growth on South Atlantic routes (+13%), followed by Europe to/from Far East and Australasia (12%). Domestic and intra-European traffic rose by 6% and 7% respectively.
Freight traffic carried by AEA carriers increased by only 2% in 2005, although FTKs reported for Europe to/from sub-Saharan Africa increased by 8%, followed by 7% for the South and Mid Atlantic and 6% Europe/Far East and Australasia

Analysis of the EU Air Transport Industry, 2005 13
1.2.4 Financial results Financial results for twenty European airlines show some improvement in 2005, but operating margins were still very low overall. These airlines were the largest AEA members, apart from Olympic and Spanair for which data was not available. The table below shows that the European airlines achieved a small margin of 3% in 2005, up almost 1% point compared to 2004, in a difficult year of large increases in fuel costs. This however disguises a large variation across the sample. Net losses were recorded in 2005 by Alitalia, SAS, Swiss and TAP Air Portugal, while British Airways, Iberia and Lufthansa all made significant improvements.
The improvement in profitability was caused principally by an increase in overall load factor to almost 70%. Yields increased by 5% helped by fuel surcharges, but unit costs advanced faster in spite of the contribution of 4% lower unit labour costs. Labour productivity advanced by 4.7%, with average costs per employee up by less than 1%. The weighted average rate of exchange used to convert local currencies to the US dollar was little changed over the year.
Table 1 Financial results: European airlines 2005 vs 2004
2005* 2004* %(pts) change
Operating margin (%) 2.9 2.1 0.8
Total revenue per RTK (US cents) 97.5 92.8 5.1
Operating cost per ATK (US cents) 66.3 62.7 5.7
Overall load factor (%) 69.8 69.0 0.8
Debt/equity ratio 2.1 2.6 -18.1
Pre-tax profit as % long-term capital 4.8 3.4 1.4
After tax profit as % equity 10.2 9.9 n/a
Operating leases as % long-term capital 32.0 32.4 -0.4
Average sector length (kms)** 1,301 1,326 -1.9
* Aggregate of airlines reporting different financial year ends: largest part of FY falling in 2004 or 2005 ** based on IATA data for calendar year
Returns on both investment and equity were both up in 2005, but still well below industry yardsticks. Given the high reliance on aircraft on operating lease, these were capitalised by multiplying annual operating lease rentals by seven. In the above table balance sheet weaknesses following 9/11 were still much in evidence for some carriers, but the average was significantly improved to just above 2:1.
Total cash and deposits in current assets improved from US$9 billion to $13 billion: this would cover 52 days of cash expenses (versus 44 days at the end of 2003). However, some of the airlines still had very low cash reserves, and some of the airlines in the sample were part of larger tour operators, and their reserves may have been held by the parent company.
1.3 Airports
There was strong growth in passenger traffic recorded at Europe’s airports in 2005. Total passenger volume increased by 5.1% between 2004 and 2005 while total freight

Analysis of the EU Air Transport Industry, 2005 14
traffic rose by 2.7% over the same period 2. London Heathrow remained Europe’s busiest airport in 2005 followed by Paris Charles de Gaulle and Frankfurt. Of the top twenty airports (in terms of traffic volume), the highest growth in 2005 was recorded at Barcelona (10%) and Madrid (8.5%). More significant levels of growth were, however, achieved at smaller accession state airports such as Riga (77%) and Bratislava (48%), fuelled primarily by low cost carrier services.
Rising security-related expenditure and energy prices were key factors contributing to a general increase in airport operating costs across the region, hence the slight reduction in average airport operating margin from 22.0% to 21.6% between 2004 to 2005 3. Strong passenger traffic growth, particularly that fuelled by low cost carriers, appears to have impacted more on revenues generated at secondary airports outside of the sample of airport operators included in the survey.
During 2005, the only significant airport transactions were the German government’s sale of its shares in Fraport and BAA’s purchase of Budapest Airport. The French government continued with its preparations to partially privatise Aéroports de Paris.
There was a decline in overall airport departure punctuality between 2004 and 2005. The number of on-time departures fell by 2%. The least punctual of the major airports was London Heathrow where 28% of fights were delayed by more than fifteen minutes followed by Athens (26.9%) and Rome Fiumicino (26.7%). There were improvements in departure punctuality between 2004 and 2005 recorded at Dusseldorf, Zurich, Vienna and Amsterdam airports.
1.4 Air traffic control
Much of the developments on Galileo during the year revolved around discussions on which of the two rival consortia should be awarded the satellite navigation concession. The decision not to award the concession was attributed to the strength of both bids and by the end of the year the two consortia were working together as a single entity, with the concession contract expected to be signed in 2006. During 2005, including China, Israel, Ukraine, India and Morocco joined the Galileo programme, giving the programme a truly international flavour.
Most of the European Single Sky developments in 2005 were linked to various aspects of planned future co-operation and consolidation of air traffic management activities. The United Kingdom and Ireland commissioned a study to examine the creation of a single block of airspace over both countries and the oceanic areas of the North Atlantic presently under their control. The CEATS saga continued to rumble along with final agreement between the countries still being awaited by the end of the year. Spain and Portugal commenced an examination into the rationalization of their ATC operations and the EC has provided funding to the Skaane project, linked to the coupling of Danish and Swedish air traffic services. Joint ventures were set up for the development of next generation air traffic management systems, one group being NAYS and the other being Slovenia, the Czech Republic and Austria.
Eurocontrol produces delay statistics from the Central Office for Delay Analysis (CODA). Eurocontrol’s 2005 annual report records a total of over nine million flights, an increase of 4% over 2004. Domestic flights, 37% of 2005 traffic, increased
2 ACI Europe airports 3 Sample of top twenty EU airport operators and top two accession state airport operators.

Analysis of the EU Air Transport Industry, 2005 15
by 2% whereas international traffic increased by 5%. The average delay per movement, for all causes of delay, was 11.3 minutes for departure traffic (an increase of 9% on 2004) and 11.0 minutes for arrival traffic (an increase of 3%). Around half of the departure delays in 2005 were attributed to airlines, 195 to airports and 11% to en-route flow control. These figures are identical to those for 2004.
1.5 The environment
There was much discussion in 2005 about air transport being included in the European Emissions Trading Scheme (ETS). Stakeholders presented their views to the European Commission, and the Commission published the draft results of a study that concluded that this was feasible. One environmental group pointed out that there was a need to reduce demand since its growth at around 5% a year was well above the 1-2% efficiency gains that the industry could deliver. There was also discussion about the scope of an aviation ETS, in particular whether it would apply to intra-EU flights only or whether flights to/from EU should be included. By the end of the year the target 2007 introduction of the scheme was no longer possible.
Fuel efficiency in terms of revenue tonne-kms per US gallon was either unchanged or worse for the top five EU network carriers, in spite of a small increase in average sector length. However, a higher average age of aircraft was one factor.
1.6 Consumer issues
Recent evidence suggests that leisure travel within Europe is growing faster than business travel. A very recent UK CAA passenger survey data shows a comparison between international scheduled traffic flows from five major UK airports to various European countries in 2003 and 2005. Overall across these 13 countries traffic grew by just over 5% per annum. However, leisure traffic grew by 6.4% per annum and business traffic by 2.5% per annum. This meant that the share of leisure traffic on these country-pairs increased from 69.4% in 2003 to 70.9% in 2005.
However, the percentage of business class passengers using business class products for intra-European travel declined by 1% for AEA carriers (2005 versus 2004). A study of over 50 aviation executives and analysts conducted in 2005 reached the consensus that the long term prognosis for business class products for short haul travel in Europe was not good with 80% of respondents agreeing with the statement ‘business class products will no longer provided on the short haul market by 2015’.
1.7 Airline alliances and mergers
The three global alliances, Star Alliance, Sky Team, and Oneworld, accounted for over 54% of world RPKs in 2005. Between them they carried over 47% of all passengers, and had a revenue share of over 57%.
The largest second-tier growth came during the summer of 2005 with Sky Team welcoming Air Europa, Copa Airlines, Kenya Airways, Tarom, and Portugalia, to its associate membership programme. It also prepares to have Aeroflot and China Southern Airlines join the scheme. The Air France takeover of KLM is expected to result in changes to Sky Team and the KLM-Northwest Airlines partnership in particular.

Analysis of the EU Air Transport Industry, 2005 16
Malev will join Oneworld as a full member in 2007. While its historic growth has been limited it is hoping to use Cathay Pacific’s stake in Air China to gain a foothold in China. It is also actively trying to persuade Japan Airlines to join the alliance.
Lufthansa and TAP Air Portugal have started an extensive strategic cooperation. As of 1st February 2005, the two airlines offer code-sharing flights. They will also coordinate other areas such as baggage handling, airport services and lounges.
1.8 Airline distribution
Advances in technology coupled with the pressure to reduce costs in the post 9/11 airline industry have forced every player in the distribution chain to re-evaluate its strategy and business processes. Fare transparency provided by airline websites and internet travel agencies has led to a behavioural shift in consumer purchasing, with the internet becoming a major distribution channel. Airlines are using the internet tool to increase direct on-line sales and put pressure on intermediaries to reduce fees. GDS deregulation in the US and the potential revision in Europe have added to the turbulence of the market, affecting the business relationships between the four key stakeholders corporates, airlines, GDSs and travel management companies.
E-ticketing continued to spread in Europe, where over 20% of air tickets were issued in this format. This was slightly above the industry average of 19%. There were wide differences among European countries in the adoption of this technology.
1.9 Aircraft
For the second year running Airbus received more orders than Boeing ending the year with 53% market share of airliners with more than 100 seats. Boeing however was making strides with the B787 and Airbus eventually responded with the A350 "commercial launch". Airbus gained ten new orders for the A380, while Boeing still held off from announcing any development to the B747-400.
In the regional market, Bombardier and Embraer had mixed fortunes, both suffered from the downturn in the 50-seat regional jet market, while orders for their larger offerings, the CRJ700/900 and EJ170/190 families, did well.
ATR saw an increase in turboprop orders on the previous year although these were still well below the level of equivalent sized jets.
1.10 Labour
Table 2 Labour costs and productivity: 16 major European network airlines
2005 2004 %(pts) change
Total employees (year average x 000) 311,431 311,542 0.0
Total labour costs (US$ m) 23,250 23,106 0.6
Average cost per employee ($) 74,654 74,167 0.7
Average ATKs per employee 452,633 432,282 4.7
Unit labour costs (US cents) 16.5 17.2 -3.9
Source: ICAO and airline annual reports

Analysis of the EU Air Transport Industry, 2005 17
Total European airline employment for the sixteen largest European network carriers was around 310,000 in 2005, unchanged from the previous year.
Average costs per employee were also kept in check, and with a 4.7% increase in labour productivity, unit labour costs were down by just under 4%.

Analysis of the EU Air Transport Industry, 2005 18
SECTION 2
REGULATORY DEVELOPMENTS
2.1 GLOBAL DEVELOPMENTS ....................................................................19
2.2 EU DEVELOPMENTS............................................................................20

Analysis of the EU Air Transport Industry, 2005 19
2 Regulatory developments
2.1 Global developments
Of the 86 bilateral air services agreements concluded or amended worldwide in 2005, over 70% comprised more liberal arrangements. There was a further significant rise in the number of “Open Skies” deals, which feature full market access with no limits on route rights, capacity, designation, code-sharing and tariffs. Sixteen such bilateral agreements were concluded during 2005, raising the total number of “Open Skies” deals to 118.
In terms of multi-state agreements, noteworthy developments during the course of 2005 included the following:
EU – the Commission’s negotiations continued on an Open Aviation agreement with the US. A Euro-Mediterranean aviation agreement was reached with Morocco, as was a European Common Aviation Area agreement with countries of the Western Balkans. Negotiations continued in respect of the Commission’s “horizontal” mandate, the aim of which is to replace certain specific provisions in existing agreements with third countries that were declared contrary to Community law by the European Court of Justice in 2002.
ASEAN – the ten Member States of the Association of South East Asian Nations adopted a road map with the aim of liberalising air cargo services in 2008 and passenger services in 2010, as well as establishing a common ASEAN aviation market in 2015.
African ministers responsible for aviation adopted a plan of action to expedite and monitor the implementation of the Yamoussoukro Decision of 1999, which liberalises intra-African air services.
Peru withdrew from the Multilateral Agreement on the Liberalisation of International Air Transportation (MALIAT) generally referred to as the Kona “Open Skies” agreement.
The process of liberalising air transport policies at the national level continued in several states. Four developments of particular note involved firstly, Nigeria where two more airlines were designated to operate intra-regional and intercontinental services; secondly, Venezuela introduced a fare band system allowing airlines the freedom to set certain domestic fares within prescribed zones; thirdly, the UK announced the liberalisation of foreign airlines’ fifth freedom rights involving regional airports; and fourthly, China adopted more flexible regulatory measures in respect of newly established low cost carriers.
In terms of state aid, the government of Jamaica committed itself to a maximum annual subsidy of US$30 m, while the government of Cyprus was authorised by the Commission to provide €100 million of rescue aid to Cyprus Airways.

Analysis of the EU Air Transport Industry, 2005 20
2.2 EU Developments
2.2.1 Community air services agreements with third countries The Commission continued with the process of bringing the existing 2,000 bilateral agreements with third countries into line with European law. By the end of 2005, twenty “horizontal” agreements had been initialled bringing over 300 bilateral agreements into legal conformity.
In March, the Commission outlined its ambition to achieve by 2010 a common aviation area bringing together the Community and all its partners located along its southern and eastern borders, the aim being to achieve a high degree of economic and regulatory integration of aviation markets comprising 35 countries and over 500 million people (IP/05/288). In furtherance of this ambition, a multilateral agreement was reached in December between the Commission and eight south east European partners (Albania, Bosnia and Herzegovina, Bulgaria, Croatia, the former Yugoslav Republic of Macedonia, Romania, Serbia, and Montenegro and the United Nations Mission in Kosovo) to establish a European Common Aviation Area. Iceland and Norway were also parties to the agreement (ECAA/1).
Also in March, the Commission indicated its intention to begin negotiations with key third countries, with a mandate initially being sought from the Council in respect of China. In response to this request, the Council stressed that before granting any further mandates to negotiate comprehensive agreements with third countries, the added value of any Community-level agreement would need to be clearly demonstrated in each case. An aviation summit meeting between the EU and China was held in Beijing in July.
In March, the Commission publicized its ambitions in respect of a proposed framework for developing an aviation agreement with Russia [COM(2005) 77] and in September, the proposed Commission published its proposal to develop a Common Aviation Area with Ukraine [COM(2005) 451]. Also in September, the Commission announced its intentions to develop comprehensive aviation agreements with Australia [COM(2005) 408], Chile [COM(2005) 406], India [COM(2005) 409] and New Zealand [COM(2005) 407]. Australia, Chile and New Zealand are among the countries that have already signed or initialled “horizontal” agreements with the EU. In respect of Russia, the European Parliament are insisting that the issue of Siberian over-flight charging be resolved before any more liberalized agreement is reached. Payments by European carriers for over-flying Siberia amount to around €250m annually.
Negotiations continued during 2005 on an EU-US aviation agreement and whilst significant progress was achieved, the Council of Ministers was of the opinion that improvements in the terms relating to the ownership and control of US airlines would be needed before the first stage of a deal could be concluded. The US Administration has been seeking ways to relax the rules governing control of US airlines by foreign nationals. In November the US Department of Transportation issued a “Notice of Proposed Rulemaking” that would reinterpret the statutory requirement for US airlines to be under the actual control of US citizens in order to expand the opportunities for foreigners to invest in and participate in the management of US carriers. A number of EU airlines however, have expressed doubts as to the feasibility of the proposed change.

Analysis of the EU Air Transport Industry, 2005 21
2.2.2 Consumer protection In February, the Commission put forward its proposal for a Regulation concerning the rights of persons with reduced mobility when travelling by air [COM(2005) 47]. As a result of a consultation process undertaken by the Commission, there is a wide consensus that Community law should protect the rights of persons with reduced mobility. There is also wide agreement that passengers with reduced mobility should not be charged for the assistance needed to use air transport, with the costs being spread between all air travellers. The issue of whether airlines or airports should be responsible for assistance at airports was fiercely contested, however. The Commission’s view is that the managing body of an airport should be responsible for providing assistance to passengers with reduced mobility, but be able to levy a charge to airlines using the airport to cover the costs of such provision.
Aside from the issue of specific measures in favour of persons with reduced mobility, the Commission identified a number of other matters pertaining to the rights of consumers across all modes of public transport that needed strengthening [COM(2005) 46]. These include: automatic and immediate solutions when travel is interrupted, liability in the event of death or injury of passengers, the treatment of complaints and means of redress, and passenger information. In respect of air travel, the issues of carrier identity, the availability of information on relative airline performance, integrated ticketing and passenger rights in the event of the bankruptcy of an air carrier were highlighted.
2.2.3 State aids In September 2005 the Commission found that Greece had granted illegal state aid to Olympic Airways and its successor Olympic Airlines4. The declaration represented the culmination of an investigation begun in March 2004 into state aid granted by Greece since 2002. In December 2002 Olympic Airways had been ordered to repay €160m of illegal aid to the Greek state. Aside from this sum not being repaid, further amounts of illegal aid have been provided by Greece to Olympic Airways and its successor company. These aid payments violate the “one time, last time” principle, under which the carrier had benefited previously from restructuring aid.
2.2.4 Operating ban for safety reasons Regulation (EC) 2111/2005 establishes a list of air carriers subject to an operating ban within the Community (OJ L 344, 27.12.2005, p. 15–22). In considering whether an air carrier should be totally or partially banned, an assessment will be made to determine if the airline is meeting the relevant safety standards taking into account verified evidence of serious safety deficiencies, the lack of ability and/or willingness of an air carrier to address safety deficiencies, and the lack of ability and/or willingness of the authorities responsible for the oversight of an air carrier to address safety deficiencies.
2.2.5 Development aid for regional airports The Commission published detailed Guidelines on development aid for airports and air services in December 2005 (O.J. C 312, 09/12/2005), thereby expanding its 1994 guidelines on the applications of Articles 92 and 93 of the EC Treaty and Article 61 of the EEA Agreement to state aid in respect of air transport (O.J. C 312 of 9.12.05).
4 Olympic Airlines was established in December 2003 to take over the flight operations of Olympic Airways.

Analysis of the EU Air Transport Industry, 2005 22
Four categories of airport are defined: A being large Community airports with more than ten million passengers annually, B comprising national airports with a passenger throughput of between five and ten million, C consisting of large regional airports handling between one and five million passengers, and D being small regional airports with annual passenger traffic of less than one million. Public funding to categories A and B will normally be considered to distort, or threaten to distort, competition and to affect trade between the Member States, while state funding of small regional airports (category D) will be unlikely to do so. No distinction is made between airports on the basis of ownership. Aid for new air services will normally only be allowed in respect of operations to EU destinations from categories C and D airports. State funding is permitted for a period of three years, with the amount of aid not allowed to exceed 50% of total eligible costs in any one year and not be more than 30% overall. However, for routes serving disadvantaged regions, aid may be granted for up to five years covering up to 40% of overall eligible costs.
2.2.6 Public service obligations on air services to Sardinia In March 2005 the Commission began a formal investigation into the public service obligations imposed by Italy on 18 air routes between Sardinia and airports on the Italian mainland (OJ L 75, 22.3.2005, p. 53–57). The announcement followed a preliminary investigation by the Commission over its concern that certain aspects of the Sardinia public service obligations did not conform to European legislation. In particular, the Commission wishes to assess the extent to which the routes are vital for Sardinia’s economic development and the requirement that tendering carriers operate all 18 routes.
2.2.7 IATA Passenger Tariff conferences In November 2005 the Commission presented for consultation a draft Block Exemption Regulation aimed at revising the exemption IATA passenger tariff conferences have from Article 81 of the EC Treaty. The draft Regulation proposes that exemption for tariff conferences in respect of routes within the EU is discontinued from the beginning of 2007. For routes between the EU and third countries, it is proposed that an exemption for the current arrangements continue until 30 June 2008, providing participating carriers provide data to the Commission to enable a detailed review of the situation to be undertaken in 2008.
2.2.8 Air Traffic Controllers In February 2005 the Transport Committee backed plans for a single licence for air traffic controllers with the aim to harmonise current national variations and promote recognition among EU Member States. Such a licence would simplify the process for air traffic controllers working outside their home country, and permit greater manpower flexibility in providing cross-border services within the EU.
A standard EU licence has the potential to improve safety as controllers will be required to speak and understand the English language to a satisfactory level in all Member States. The only exception would be conversation with essential airport services where the local language may be more practical.
The legislative resolution was adopted by the European Parliament in March 2005.

Analysis of the EU Air Transport Industry, 2005 23
2.2.9 European Aviation Safety Agency In November 2005 the EC extended the remit of EASA to include rulemaking and the oversight of air operations, pilot qualifications and licensing, and oversight of third country airlines operating in the EU [COM(2005) 578].
The proposal allowed for EASA to manage pilot licenses in order to ensure that they observe with the European rules on knowledge, skills, and linguistic ability. The Agency will also develop the current requirements for EU pilots, work with national authorities to issue and monitor licenses, and inspect and audit training and medical providers.
The proposal also detailed requirements for both EU and non-EU aircraft to follow when operating within the EU. The development of more detailed rules will be bases on the current intergovernmental rules of the Joint Aviation Authorities and implemented as EC regulations. This will allow them to be applied across the EU with a common legal basis. While national authorities will still issue certificates, EASA will adopt responsibility for ensuring compliance.
Furthermore the proposal confirms that EASA will become responsibly for certifying compliance to non-EU airlines in respect to minimum requirements for operating aircraft within the EU. At present no EU Member State issues such certificates.
Jacques Barrot, VP Transport, suggested that “We had a tragic summer marked by a spate of air crashes that claimed more than 500 lives. European passengers need to be assured that all aircrafts abide by the highest safety standards. I want stringent safety rules to apply in all Member States and to all airlines whether based in the EU or not”.
By 2010 the EC plans to have the entire area of aviation safety covered by a single organisation by extending the remit of EASA to include the safety and interoperability of Air Navigation Services, Air Traffic Management, and airports.
2.2.10 Aviation Noise Pollution In December 2005 the EC decided to take Latvia to the European Court of Justice for failing to adopt legislation on noise-related operating restrictions at airports within the EU. Jacques Barrot, VP Transport, stated that “Noise around airports is a particularly important issue for European citizens. Latvia must apply as soon as possible this legislation that provides for coherent solutions to noise problems around EU airports”.

Analysis of the EU Air Transport Industry, 2005 24
SECTION 3
CAPACITY
3.1 AIR SERVICES.......................................................................................25
3.2 AIRLINE START-UPS AND FAILURES, 2005 ............................................28
3.3 CAPACITY: LOW-COST CARRIERS .........................................................31

Analysis of the EU Air Transport Industry, 2005 25
3 Capacity
3.1 Air services
Figure 1 gives a picture of how well European states were connected by air transport in 2005. It represents scheduled routes operated within and between European states in June of that year. Routes are city-to-city, rather than airport pairs. As in 2004, Germany and the United Kingdom were the only states offering at least one non-stop air link to every other state included in the analysis.
Figure 1 Number of city-pair routes between and within states, June 2005
AT 8 -1 -1 -1 -1 -1 -1 -1 -1 -1 -1 -1 -1 -1 -1 -1 -1 -1 -1 -1 -1 -1 -1 -1 -1 -1 -1 -1 -1 -1 -1 -1
BE 1 0 -1 -1 -1 -1 -1 -1 -1 -1 -1 -1 -1 -1 -1 -1 -1 -1 -1 -1 -1 -1 -1 -1 -1 -1 -1 -1 -1 -1 -1 -1
BG 2 1 2 -1 -1 -1 -1 -1 -1 -1 -1 -1 -1 -1 -1 -1 -1 -1 -1 -1 -1 -1 -1 -1 -1 -1 -1 -1 -1 -1 -1 -1
CH 7 3 1 5 -1 -1 -1 -1 -1 -1 -1 -1 -1 -1 -1 -1 -1 -1 -1 -1 -1 -1 -1 -1 -1 -1 -1 -1 -1 -1 -1 -1
CY 1 1 1 1 0 -1 -1 -1 -1 -1 -1 -1 -1 -1 -1 -1 -1 -1 -1 -1 -1 -1 -1 -1 -1 -1 -1 -1 -1 -1 -1 -1
CZ 1 1 1 2 1 2 -1 -1 -1 -1 -1 -1 -1 -1 -1 -1 -1 -1 -1 -1 -1 -1 -1 -1 -1 -1 -1 -1 -1 -1 -1 -1
DE 34 8 32 23 7 11 98 -1 -1 -1 -1 -1 -1 -1 -1 -1 -1 -1 -1 -1 -1 -1 -1 -1 -1 -1 -1 -1 -1 -1 -1 -1
DK 1 2 1 3 0 2 12 7 -1 -1 -1 -1 -1 -1 -1 -1 -1 -1 -1 -1 -1 -1 -1 -1 -1 -1 -1 -1 -1 -1 -1 -1
EE 0 1 0 0 0 1 3 1 2 -1 -1 -1 -1 -1 -1 -1 -1 -1 -1 -1 -1 -1 -1 -1 -1 -1 -1 -1 -1 -1 -1 -1
ES 15 11 3 18 0 3 196 7 0 154 -1 -1 -1 -1 -1 -1 -1 -1 -1 -1 -1 -1 -1 -1 -1 -1 -1 -1 -1 -1 -1 -1
FI 2 1 0 1 2 1 8 6 2 6 27 -1 -1 -1 -1 -1 -1 -1 -1 -1 -1 -1 -1 -1 -1 -1 -1 -1 -1 -1 -1 -1
FR 7 12 1 15 2 3 34 10 1 33 2 138 -1 -1 -1 -1 -1 -1 -1 -1 -1 -1 -1 -1 -1 -1 -1 -1 -1 -1 -1 -1
GB 10 11 2 14 14 14 52 14 2 131 3 78 174 -1 -1 -1 -1 -1 -1 -1 -1 -1 -1 -1 -1 -1 -1 -1 -1 -1 -1 -1
GR 18 2 1 3 7 3 137 5 0 2 6 4 5 70 -1 -1 -1 -1 -1 -1 -1 -1 -1 -1 -1 -1 -1 -1 -1 -1 -1 -1
HR 4 3 0 3 0 2 16 1 0 0 0 5 11 0 9 -1 -1 -1 -1 -1 -1 -1 -1 -1 -1 -1 -1 -1 -1 -1 -1 -1
HU 1 1 3 3 1 1 11 1 0 4 1 3 4 2 3 0 -1 -1 -1 -1 -1 -1 -1 -1 -1 -1 -1 -1 -1 -1 -1 -1
IE 1 2 0 2 2 2 13 1 1 19 1 13 63 0 1 2 7 -1 -1 -1 -1 -1 -1 -1 -1 -1 -1 -1 -1 -1 -1 -1
IS 1 0 0 1 0 0 4 1 0 2 1 1 2 0 0 0 0 12 -1 -1 -1 -1 -1 -1 -1 -1 -1 -1 -1 -1 -1 -1
IT 13 11 2 23 2 4 89 5 1 34 6 30 47 10 3 4 7 1 118 -1 -1 -1 -1 -1 -1 -1 -1 -1 -1 -1 -1 -1
LT 1 1 0 0 0 1 10 3 1 1 1 0 1 0 0 0 1 0 1 2 -1 -1 -1 -1 -1 -1 -1 -1 -1 -1 -1 -1
LU 1 0 0 2 0 1 4 1 0 11 0 5 2 5 1 1 0 0 8 0 0 -1 -1 -1 -1 -1 -1 -1 -1 -1 -1 -1
LV 1 1 0 0 0 1 6 1 1 2 2 1 2 0 0 0 1 0 2 1 0 0 -1 -1 -1 -1 -1 -1 -1 -1 -1 -1
MT 1 1 1 2 1 1 6 1 0 0 0 5 7 1 0 1 2 0 5 0 1 0 1 -1 -1 -1 -1 -1 -1 -1 -1 -1
NL 2 1 2 3 2 1 13 3 1 19 1 8 25 16 5 1 4 1 14 1 1 1 1 4 -1 -1 -1 -1 -1 -1 -1 -1
NO 1 1 1 1 0 3 11 11 1 15 1 6 11 1 4 1 1 1 4 2 0 1 1 6 110 -1 -1 -1 -1 -1 -1 -1
PL 3 1 1 3 1 2 31 5 1 10 1 5 9 15 1 3 1 0 10 1 1 1 1 2 3 9 -1 -1 -1 -1 -1 -1
PT 3 3 1 7 0 1 32 2 0 20 3 14 23 0 0 1 4 0 5 0 4 0 0 5 2 2 28 -1 -1 -1 -1 -1
RO 4 1 1 1 1 1 9 3 0 1 0 1 1 2 0 3 0 0 20 0 0 0 1 1 0 1 0 15 -1 -1 -1 -1
SE 2 2 1 3 0 2 12 11 3 7 7 7 11 1 2 3 2 1 5 1 0 1 1 3 6 3 1 0 41 -1 -1 -1
SI 2 1 0 1 0 1 3 1 0 0 0 1 2 0 0 1 1 0 0 0 0 0 0 1 0 0 0 0 0 0 -1 -1
SK 1 1 0 1 0 4 2 1 0 1 0 2 2 1 3 0 0 0 3 0 0 0 0 1 0 1 0 0 0 0 1 -1
TR 4 3 1 7 6 1 67 4 0 2 1 5 7 2 1 1 0 0 2 0 0 1 1 8 0 1 1 1 3 1 0 38
AT BE BG CH CY CZ DE DK EE ES FI FR GB GR HR HU IE IS IT LT LU LV MT NL NO PL PT RO SE SI SK TR Source: OAG
Over the twelve months from June 2004 to the same month in 2005, scheduled air services (as published in the OAG) between a total of 335 city pairs were abandoned, but a further 711 new routes were established.
Table 3 shows the numbers of domestic city-pairs that were dropped, and the number started over the twelve month period.

Analysis of the EU Air Transport Industry, 2005 26
Table 3 Changes to domestic networks between June 2004 and June 2005
city pairsdropped started balance
Austria 1 -1Bulgaria 1 -1Croatia 1 1Denmark 2 1 -1Estonia 2 2Finland 10 -10France 5 11 6Germany 20 20Greece 5 6 1Iceland 2 -2Italy 19 23 4Netherlands 2 2Norway 2 3 1Poland 3 1 -2Portugal 3 3Romania 4 6 2Spain 14 27 13Sweden 14 5 -9Switzerland 2 2Turkey 6 7 1United Kingdom 12 51 39TOTALS 120 171 51
Source:OAG
The UK and Spain are countries showing the greatest net gain in air services. The UK had the greatest number of new city pairs linked over the year. Sweden and Finland had net losses of domestic services, further evidence of a retrenchment of domestic networks in those countries. Table 4 show the ten Finnish city pairs that lost their air links: there were no new Finnish city pairs.
Table 4 Losses to the Finnish domestic network
Betweenand
HELSINKI MARIEHAMN FinnairIVALO TAMPERE Soder AirlinesJOENSUU TAMPERE FinnairKEMI/TORNIO ROVANIEMI FinnairKITTILA TAMPERE Soder AirlinesMARIEHAMN TURKU European Executive ExpressMIKKELI SAVONLINNA Golden AirOULU TAMPERE Soder AirlinesSEINAJOKI VAASA Golden AirSAVONLINNA VARKAUS Golden Air
Airline operating in 2004
Source: OAG
Table 5 summarises the activity in the cross-border environment. The high turnover in routes abandoned and started is quite striking, particular the spectacular growth in new domestic services joining cities in Spain and the UK.

Analysis of the EU Air Transport Industry, 2005 27
Table 5 Changes to international intra-European networks, 2004-2005 Between city pairs Between city pairs Between city pairs
and dropped started balance and dropped started balance and dropped started balance
Austria Bulgaria 1 1 Estonia Finland 1 1 Italy Latvia 1 1Austria Finland 1 1 Estonia Ireland 1 1 Italy Lithuania 1 1Austria France 3 3 Estonia Sweden 2 2 Italy Luxembourg 1 -1Austria Germany 2 5 3 Estonia UK 1 1 Italy Malta 1 1Austria Greece 18 1 -17 Finland Greece 3 3 Italy Netherlands 1 5 4Austria Iceland 1 1 Finland Italy 4 4 Italy Poland 4 4Austria Italy 3 3 Finland Latvia 1 1 Italy Romania 2 5 3Austria Portugal 2 -2 Finland Portugal 1 1 Italy Sweden 1 1Austria Romania 1 1 Finland Slovenia 1 -1 Latvia Turkey 1 1Austria Slovenia 1 1 Finland Sweden 2 -2 Lithuania Norway 1 1Austria Spain 6 -6 Finland Turkey 1 1 Lithuania Sweden 3 -3Austria Switzerland 2 -2 Finland UK 1 -1 Luxembourg Poland 1 1Austria Turkey 1 -1 France Croatia 2 2 Luxembourg Sweden 1 -1Austria UK 1 2 1 France Hungary 1 1 Malta Poland 1 1Belgium Croatia 2 2 France Ireland 6 6 Netherlands Poland 1 1Belgium Cyprus 1 -1 France Italy 6 6 Netherlands Portugal 1 -1Belgium Estonia 1 1 France Latvia 1 1 Norway Poland 2 2Belgium France 4 4 France Malta 2 2 Norway Sweden 3 3Belgium Italy 2 3 1 France Netherlands 3 -3 Poland Portugal 2 2Belgium Spain 3 3 France Norway 2 2 Poland Sweden 2 2Belgium Switzerland 1 -1 France Poland 1 1 Portugal Turkey 1 1Belgium UK 1 -1 France Portugal 2 2 Spain Finland 1 2 1Bulgaria Germany 4 4 France Slovakia 1 1 Spain France 2 3 1Bulgaria Hungary 1 1 France Sweden 1 3 2 Spain Hungary 3 3Bulgaria Netherlands 1 1 France Turkey 1 1 Spain Ireland 1 6 5Bulgaria Slovakia 1 -1 France UK 8 23 15 Spain Italy 5 10 5Bulgaria Spain 2 2 Germany Croatia 9 9 Spain Latvia 1 1Bulgaria UK 1 1 Germany Denmark 1 1 Spain Lithuania 1 1Croatia Italy 1 1 Germany Estonia 1 -1 Spain Luxembourg 1 -1Croatia Luxembourg 1 1 Germany France 5 6 1 Spain Netherlands 3 1 -2Croatia Norway 3 3 Germany Greece 13 11 -2 Spain Norway 1 2 1Croatia Slovakia 1 1 Germany Hungary 4 4 Spain Poland 8 8Croatia Slovenia 1 -1 Germany Ireland 1 4 3 Spain Portugal 2 7 5Croatia Sweden 1 1 Germany Italy 10 17 7 Spain Sweden 3 1 -2Cyprus France 1 1 Germany Latvia 2 2 Spain UK 4 58 54Cyprus Germany 2 -2 Germany Lithuania 1 3 2 Sweden Turkey 1 1Cyprus Greece 1 3 2 Germany Luxembourg 1 1 Switzerland Czech Rep. 1 1Cyprus Spain 1 -1 Germany Malta 1 -1 Switzerland Finland 1 -1Cyprus Turkey 1 -1 Germany Netherlands 1 1 Switzerland France 1 3 2Cyprus UK 3 3 Germany Norway 2 2 Switzerland Germany 3 3Czech Rep. Denmark 1 1 Germany Poland 4 14 10 Switzerland Hungary 1 1Czech Rep. Germany 2 2 Germany Portugal 5 2 -3 Switzerland Iceland 1 1Czech Rep. Greece 1 1 Germany Romania 1 2 1 Switzerland Italy 1 14 13Czech Rep. Italy 1 1 Germany Slovakia 1 -1 Switzerland Netherlands 1 -1Czech Rep. Norway 1 1 Germany Slovenia 1 1 Switzerland Norway 1 -1Czech Rep. Slovakia 1 1 Germany Spain 21 12 -9 Switzerland Spain 5 5Czech Rep. Spain 1 1 Germany Sweden 2 2 Switzerland Sweden 1 1Czech Rep. UK 2 4 2 Germany Turkey 2 9 7 Switzerland Turkey 3 3Denmark Croatia 1 -1 Germany UK 3 10 7 Switzerland UK 5 4 -1Denmark Finland 3 3 Greece Italy 1 6 5 UK Croatia 3 3Denmark Greece 3 3 Greece Netherlands 1 6 5 UK Greece 2 2Denmark Italy 1 2 1 Greece Norway 1 1 UK Hungary 3 3Denmark Lithuania 1 1 Greece Poland 14 14 UK Ireland 4 13 9Denmark Norway 2 -2 Greece Slovakia 1 1 UK Italy 3 16 13Denmark Portugal 1 1 Hungary Ireland 1 1 UK Latvia 1 1Denmark Romania 1 1 Hungary Poland 1 1 UK Malta 3 3Denmark Slovakia 1 1 Hungary Sweden 2 2 UK Netherlands 3 3Denmark Spain 1 1 Ireland Italy 2 4 2 UK Norway 2 2Denmark Sweden 1 -1 Ireland Netherlands 1 1 UK Poland 5 5Denmark Turkey 2 2 Ireland Portugal 2 2 UK Portugal 11 11Denmark UK 1 2 1 Ireland Sweden 1 1 UK Slovakia 1 1
UK Sweden 1 1 Source: OAG
Figure 2 shows the city-pair services added to the European network since 1994. There was a significant growth in the number of services between June 2004 and June 2005. However, although the proportion of single-carrier routes followed a slow decline between 1994 and 2004 (to just under 69% of all European city-pairs) this was reversed in 2005. By June of that year slightly more than 70% of European schedule air services were operated by only one airline. The reason for this is likely to be found in the new point-to-point routes being opened, often by low-cost carriers. Many of these are still in an initial phase of development, with passenger demand unlikely to attract competition. The highest number of carriers operating on any European route was seven, competing for traffic between Catania and Milan.

Analysis of the EU Air Transport Industry, 2005 28
Figure 2 Evolution of European routes served by single carriers
0
1,000
2,000
3,000
4,000
1994 1999 2003 2004 2005
num
ber o
f city
-pai
r rou
tes
1
2
3
4 or more
airlinesper route
Source: OAG
3.2 Airline start-ups and failures, 2005
An indication of the degree of competition from airlines in the EU is given by the start-ups and exits. Acquisitions or alliances are discussed under section 10.
The list below shows the more prominent births and deaths that took place between January and December 2005. In some cases, operations were suspended pending reorganisation or the search for additional finance. In other cases, the AOC of the airline was withdrawn and/or they filed for bankruptcy. Some of the births were relatively short-lived.
3.2.1 Airline start-ups
Network carrier start-ups There were no births to report in 2005.
Regional airline start-ups Air Aland started operations in October 2005 using a Saab 340 aircraft
between Helsinki and Mariehamn.
Charter airline start-ups Air Italy started operations in May 2005 using two Boeing 757 aircraft.
Operates from Milan Malpensa, Verona and Rome to Eastern Europe, the Middle East, and Africa.
Alexandair a Greek MD82 operator, based in Crete, serving European charter market
BritishJet.com a UK-based airline flying MD90 aircraft to Malta for tour operators
Dubrovnik Airline commenced operations to European destinations in April 2005 using a fleet of two MD-83 and one MD-82 aircraft.

Analysis of the EU Air Transport Industry, 2005 29
Interstate Airlines based in Maastricht, began wet lease operations in July 2005 initially using an ATR 42 aircraft.
Low cost carrier start-ups Blu-Express: began operations in November 2005. This Rome Fiumicino-
based carrier is a subsidiary of the Italian charter airline Blue Panorama and began flights with two 167-seat Boeing 737-400s on a combination of domestic and international routes.
Centralwings Polish flag-carrier LOT created this low-cost subsidiary to operate a mix of scheduled and charter flights. It began services from Warsaw in February 2005 but by the end of 2005 was also operating from Krakow, Katowice, Poznan and Wroclaw.
Volareweb The original Volareweb ceased operations in November 2004 having grown (too) rapidly to become the third largest European LCC. On 1 June 2005 the airline re-launched under special administration with a modest two aircraft fleet of Airbus A320s from Milan Linate airport operating purely domestic routes plus a service to Paris.
After significant activity in 2004 the low-cost market attracted only two new operators in 2005 plus a re-launch of a previous airline. Both of the remaining start-ups were supported by parent companies re-allocating aircraft and resources suggesting that the days of all-new start-up airlines in the low-cost market may be coming to an end.
3.2.2 Airline failures
Network carrier failures There were no deaths to report in 2005
Regional airline failures Denim Airways was the scheduled subsidiary of Denim Air. In September
2005 scheduled operations ceased, two months after being acquired by the parent of Belgium’s VLM Airlines.
Air Lithuania since 1997 the airline had been a subsidiary of state-owned Lithuanian Airlines, which sold its stake to freight & logistics group Arijus in 2004. In November 2005 the airline suspended scheduled services.
Air Caledonian operated Bandeirante aircraft on scheduled services between its Glasgow base at Prestwick airport and Stornoway and Derry.
Air Exel based in Maastricht, together with the Group’s other regional carriers, AlsaceExel (Strasbourg-based) and GrandaExel (Turin) ceased operations in early 2005.
Charter airline failures Aero Flight which started operations in March 2004 from the remains of
Aero Lloyd, ceased operating in November 2005. The carrier

Analysis of the EU Air Transport Industry, 2005 30
had operated a fleet of three A320 and two A321 aircraft from German airports to holiday destinations in the Mediterranean, Balkans and Russia. The airline had 350 employees.
Air Horizons based in Paris, ceased flying in November 2005. The airline operated as Euralair Horizons before being acquired by Angel Gate Aviation in December 2003. It operated a fleet of four Boeing 737s and three Boeing 757-200s. Two of the airline’s Boeing 737s performed scheduled services to Morocco, with the rest of the fleet devoted to charter operations. The airline had accumulated debts of over €20m.
Air Scandic ceased operating in September 2005. The carrier was established in 1997 and used Air Foyle Charter Airlines (AFCAL) to operate two Airbus A300 aircraft on its behalf from May 1998, serving leisure routes to Cyprus, Turkey, Tenerife and Spain. The 317-seat A300s, acquired from Finnair, were based at Newcastle and Manchester. Air Scandic was owned by UK interests, but registered in Finland.
Fischer Air a Czech carrier which operated two Boeing 737-300 aircraft, went into voluntary liquidation in November 2005 as a result of facing strong competition from Travel Service and CSA Czech Airlines. The airline was founded in 1996.
Visig based in Las Palmas, ceased operating in December 2005. Czech tour group, Travel Service, formed the airline in 2002. A single Boeing 737-400 was operated mainly to the UK.
Four charter airlines changed their names during 2005: Hapagfly (previously known as Hapag-Lloyd), Hi Fly (previously known as Air Luxor), Jetairfly (previously known as TUI Airlines Belgium), and Thomsonfly (Britannia Airways adopted the name of the low cost scheduled UK airline owned by TUI).
Low cost carrier failures: EUjet operated Fokker 100s from Manston Airport in the UK but
ceased operations in July 2005. FlyWest a short-lived French airline reportedly ceased operations in July
2005. The airline was part of Europe Airpost which operates Boeing 737s for the French postal service. The airline was based at Brest Airport.
GEXX also known as Germania Express this German airline was taken over by dba in February 2005. dba absorbed and quickly re-allocated the fleet of 12 Fokker 100s.
JetX an Italian-based airline with an Icelandic operating licence abandoned its scheduled services in summer 2005 and reverted to being a supplier of wet-lease capacity.
MyTravelLite started a low-cost scheduled brand in 2002. The scheduled product was abandoned at the end of the summer 2005 season the capacity was absorbed into its charter operations.
Snowflake was the low-cost airline brand developed by SAS. However, SAS developed a new pricing structure and during 2005 Snowflake was absorbed back into the parent airline.

Analysis of the EU Air Transport Industry, 2005 31
3.3 Capacity: low-cost carriers
Figure 3 shows the increases in seats per week provided by low cost carriers between June 2004 and June 2005. The three largest carriers all added significant amounts of new capacity as both Ryanair and easyJet continued to take delivery of new aircraft ordered in 2002. Air Berlin continued to increase the number of seats available for seat-only sale in their low cost business.
Second tier LCCs, Flybe, Germanwings, HLX, Norwegian and Jet2 all made significant increases in capacity during the year. Most other carriers maintained capacity close to 2004 levels.
3.3.1 EasyJet and Ryanair networks from London airports Our 2004 report highlighted the differences in route selection of these two major players in the low cost sector of the market. It was argued that easyJet focuses on dense markets and offers frequency aimed at the business travel market, while Ryanair’s focus is more on less dense leisure markets where it can dominate small routes. Further analysis of the networks of these airlines gives a measure of the different strategies they adopt.
Average number of routes served per airport (2005)
• Ryanair 2.1 routes per airport
• easyJet 3.3 routes per airport
Average number of aircraft per airport served (2005)
• Ryanair 0.84 aircraft
• easyJet 1.70 aircraft
Source: ATI, easyJet, and Ryanair
Table 6 easyJet and Ryanair London airport networks, 2001 - 2005 Airline 2001 2003 2004 2005 Annualised
growth %EasyJetTotal Route Capacity 310,448 545,535 560,909 626,548 19.19Average Freq (pw) 25.1 36.3 32.1 31.6 5.95EasyJet capacity 52,246 157,046 168,944 183,149 36.83Ave. Capacity Share 17.0% 28.8% 30.1% 29.2% 14.51Ave no of competitors 4.00 2.66 2.26 2.35 -12.48No of routes with other LCAs 8 7 8 25 32.96No of routes 14 29 35 49 36.78
RyanairTotal Route Capacity 290,021 418,559 368,680 404,246 8.66Average Freq (pw) 17.1 17.3 15.1 14.8 -3.52Ryanair capacity 96,199 170,797 168,357 199,036 19.93Ave. Capacity Share 33.0% 40.8% 45.7% 49.2% 10.52Ave no of competitors 1.11 0.89 0.70 0.86 -6.18No of routes with other LCAs 5 6 9 18 37.74No of routes 35 62 65 72 19.76
Table 6 highlights the differences in the network strategies of the two main LCCs. ‘Total Route Capacity’ refers to the total number of seats offered in all routes the airlines operate on from London. Here we see easyJet operates in larger markets than Ryanair, offering a lower share of total seat capacity. Thus easyjet’s average capacity share on London routes was 29.2%, while Ryanair offered 49.2%. This manifestation

Analysis of the EU Air Transport Industry, 2005 32
of different business strategies is further illustrated in Figure 4, where Ryanair is shown to operate in a large number of small markets where the airline is either the only carrier or has just one competitor.
Figure 3 Seats provided by low-cost carriers, June 2004 and June 2005
LCC Seats per week
0 100,000 200,000 300,000 400,000 500,000 600,000 700,000 800,000 900,000
Volareweb
Smart Wings
Helvetic
MyTravelLite
FlyMe
Niki
SkyEurope
Flyglobespan
Wind Jet
Virgin Express
Wizz
Sterling
Vueling
Jet2
Norwegian
HLX
Bmibaby
Germanwings
Flybe
Air Berlin
EasyJet
Ryanair
2004 2005
Source: OAG
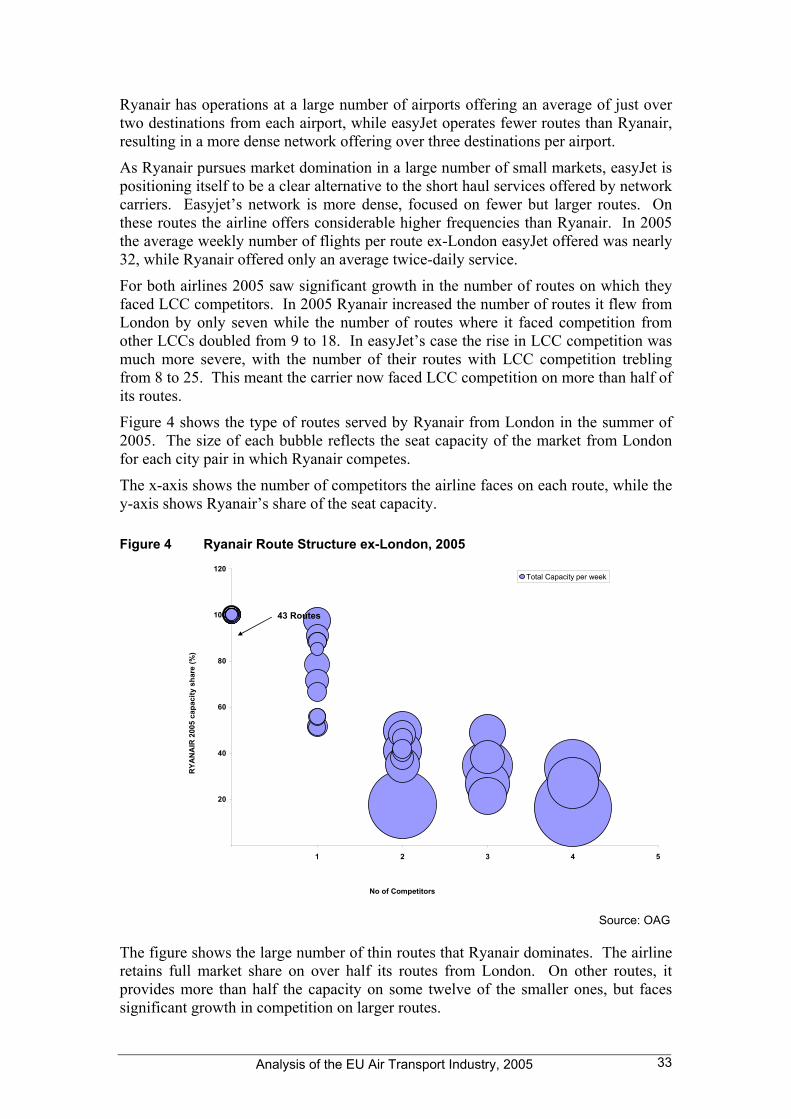
Analysis of the EU Air Transport Industry, 2005 33
Ryanair has operations at a large number of airports offering an average of just over two destinations from each airport, while easyJet operates fewer routes than Ryanair, resulting in a more dense network offering over three destinations per airport.
As Ryanair pursues market domination in a large number of small markets, easyJet is positioning itself to be a clear alternative to the short haul services offered by network carriers. Easyjet’s network is more dense, focused on fewer but larger routes. On these routes the airline offers considerable higher frequencies than Ryanair. In 2005 the average weekly number of flights per route ex-London easyJet offered was nearly 32, while Ryanair offered only an average twice-daily service.
For both airlines 2005 saw significant growth in the number of routes on which they faced LCC competitors. In 2005 Ryanair increased the number of routes it flew from London by only seven while the number of routes where it faced competition from other LCCs doubled from 9 to 18. In easyJet’s case the rise in LCC competition was much more severe, with the number of their routes with LCC competition trebling from 8 to 25. This meant the carrier now faced LCC competition on more than half of its routes.
Figure 4 shows the type of routes served by Ryanair from London in the summer of 2005. The size of each bubble reflects the seat capacity of the market from London for each city pair in which Ryanair competes.
The x-axis shows the number of competitors the airline faces on each route, while the y-axis shows Ryanair’s share of the seat capacity.
Figure 4 Ryanair Route Structure ex-London, 2005
-20
0
20
40
60
80
100
120
-1 0 1 2 3 4 5
No of Competitors
RYA
NA
IR 2
005
capa
city
sha
re (%
)
Total Capacity per week
43 Routes
Source: OAG
The figure shows the large number of thin routes that Ryanair dominates. The airline retains full market share on over half its routes from London. On other routes, it provides more than half the capacity on some twelve of the smaller ones, but faces significant growth in competition on larger routes.

Analysis of the EU Air Transport Industry, 2005 34
Figure 5 easyJet Route Structure, ex-London, 2005
-20
0
20
40
60
80
100
120
-1 0 1 2 3 4 5 6
No of Competitors
EASY
JET
2005
cap
acity
sha
re (%
)
Total capacity per week
2 Routes
Source: OAG
Figure 5 shows that on more than half easyJet’s routes the airline faces three or more competitors. Easyjet’s strategy is aimed at providing an alternative short-haul service for business travellers, leading it to focus mainly on larger routes, where it offers higher frequency as a competitive tactic.

Analysis of the EU Air Transport Industry, 2005 35
SECTION 4
AIR TRAFFIC
4.1 SCHEDULED WORLD OVERVIEW ...........................................................36
4.2 EUROPEAN PASSENGER TRAFFIC ..........................................................38
4.3 AIR CARGO ..........................................................................................48

Analysis of the EU Air Transport Industry, 2005 36
4. Air traffic
4.1 Scheduled world overview
ICAO reported continued resilience in world airline scheduled passenger traffic in 2005, following the strong rebound witnessed in 2004 after three years of poor performance. Overall, 2005 passenger traffic was some 8% above levels achieved in 2004. Figure 6 shows world passenger traffic, carried by scheduled carriers registered in the 189 ICAO subscribing states. The regions shown are those of the airlines’ registration. North American, European and Asia/Pacific airlines generate close to 90% of world RPK. European carriers were in second place, after airlines of North America, in both 1995 and ten years’ later, in 2005.
Figure 6 Scheduled airline performance, 1995 and 2005
0
200
400
600
800
1,000
1,200
1,400
Africa Asia Pacific Europe Middle East LatinAmerica
NorthAmerica
RPK
(billi
ons)
1995 2005
Source: ICAO
Focusing on growth in that ten year period to 2005, Figure 7 underlines the relatively strong increases in RPK seen in all regions, but highlights regional differences. The chart shows that although the average annual growth rate of Europe’s carriers was comfortably ahead of North American airlines, it was the Middle East which produced highest levels of growth. New carriers and expanding networks focussing on Middle Eastern hubs meant that the region’s airlines increased passenger traffic by an average close to 10% per annum over the ten years.
While the ICAO aggregate growth was just over 5% per annum, Europe was ahead at close to 6% annual increase in RPK. North America, the largest generator of RPK by a considerable margin, was a full percentage point below the aggregate average.

Analysis of the EU Air Transport Industry, 2005 37
Figure 7 Average annual growth in RPK by region, 1995-2005
0%
2%
4%
6%
8%
10%
Africa AsiaPacif ic
Europe MiddleEast
LatinAmerica
NorthAmerica
TOTAL
aver
age
annu
al g
row
th
Source: ICAO
IATA reports increases in passenger traffic carried on international scheduled services. The industry average RPK growth over 2004 was 7.6%, while ASK grew by just 6.3%. This improved efficiency, reflected in higher average load-factors, was evident in all regions (Figure 8).
At 4%, European growth in ASK was the lowest in this regional breakdown. However, European airlines generated an increase in RPK above 6%, slightly ahead of Asia/Pacific airlines, indicating that European carriers achieved significantly improved load-factors.
Figure 8 Growth in IATA total international RPK and ASK, 2004-2005
0%
3%
6%
9%
12%
15%
Africa AsiaPacif ic
Europe MiddleEast
LatinAmerica
NorthAmerica
TOTAL
grow
th o
ver 2
004
RPKASK
Source: IATA
The Middle East was again the leading region in terms growth in capacity and passenger traffic.

Analysis of the EU Air Transport Industry, 2005 38
4.2 European passenger traffic
Figure 9 shows the passenger traffic generated by European states. There is an element of double-counting, where cross-border intra-EU passengers are recorded as arrivals in one state and as departing passengers in the other. Although there is a strong, positive correlation between traffic volumes and the size of a country, its economic activity and its population, as well as other factors such as tourism flows and the relative isolation of a nation, also have an effect on passenger numbers. Within the EU-25, just under two-thirds of the passenger traffic generated involves airports in four states: UK (22%), Germany (16%), Spain (15%) and France (11%).
The UK’s leading position owes much to its dominance in the European development of the market for low-cost air travel, with the leading airlines this field, easyjet and the Irish company Ryanair, both operating multiple bases in UK. In Germany, this market was developing rapidly in 2005, in both the domestic arena as well as the cross-border intra-EU market. Spain, as Europe’s principal leisure destination, attracts the services of many low-cost and charter carriers to its Mediterranean and Canary Island airports, while at the same time the country’s well-developed domestic air transport network serves the Balearic and Canary island groups.
Figure 9 European air passenger traffic, 2005 and 2004
0
50
100
150
200
Aust
ria
Belg
ium
Cyp
rus
Cze
ch R
epub
lic
Den
mar
k
Esto
nia
Finl
and
Fran
ce
Ger
man
y
Gre
ece
Hun
gary
Icel
and
Irela
nd
Italy
Latv
ia
Lith
uani
a
Luxe
mbo
urg
Mal
ta
Net
herla
nds
Nor
way
Pola
nd
Portu
gal
Rom
ania
Slov
akia
Slov
enia
Spai
n
Swed
en
Switz
erla
nd
Uni
ted
King
dom
milli
ons
of p
asse
nger
s
2005 2004
Source: Eurostat
The wide differences in traffic volumes among the countries represented in Figure 9 hide the very high year-on-year growth recorded by countries with relatively low levels of passenger traffic. Figure 10 remedies this, showing the extent to which passenger traffic changed between 2004 and 2005.
Growth rates in the states generating the highest proportion of passengers are relatively low, although in absolute terms they are very large. The greatest growth rates are seen in the accession states, where airlines benefited from more open access to markets, and where passengers were able to travel more freely.

Analysis of the EU Air Transport Industry, 2005 39
Figure 10 Change in air passenger traffic, 2004-2005
-30%
0%
30%
60%
90%
Aust
ria
Belg
ium
Cyp
rus
Cze
ch R
epub
lic
Den
mar
k
Esto
nia
Finl
and
Fran
ce
Ger
man
y
Gre
ece
Hun
gary
Icel
and
Irela
nd
Italy
Latv
ia
Lith
uani
a
Luxe
mbo
urg
Mal
ta
Net
herla
nds
Nor
way
Pola
nd
Portu
gal
Rom
ania
Slov
akia
Slov
enia
Spai
n
Swed
en
Switz
erla
nd
Uni
ted
King
dom
grow
th o
ver 2
004
Source: Eurostat
The impact of the growth of low-cost airline activity can be seen clearly. For example, in Slovakia, where SkyEurope established a base in 2002, passenger traffic again registered an increase of over 50% between 2004 and 2005, while Latvia recorded a near doubling in traffic, albeit from a very low base, and the other two Baltic states also recorded very high increases in passenger traffic. Only Malta recorded a decline in passenger traffic. This was a relatively small fall, probably reflecting the changing pattern of tourism generated within Europe.
Figure 11 Extra-EU-25 transport of passengers: % of total in 2005 by region
Source: Eurostat

Analysis of the EU Air Transport Industry, 2005 40
Figure 11 shows the flow (by region) of EU-25 air passengers travelling outside EU-25. The distribution demonstrates quite clearly the strength of links between the EU countries and the rest of Europe, accounting for one-third of extra-EU passenger transport, and between EU and North America (close to a quarter of the total).
4.2.1 Network carriers Not surprisingly, the traffic carried by the twenty-six reporting AEA airlines in 2005 mirrored the world picture (Table 7 and Table 8). Their system-wide passenger numbers advanced by 4.5% while passenger-kms rose by 6.1%, indicating an increase in the average passenger trip length. Europe’s carriers performed most strongly in terms of RPK on the South Atlantic, where traffic was up by 12.9% over 2004. On the important North Atlantic a 0.8% increase in capacity was met by 2.0% increase in traffic, generating a comfortable increase in passenger load factor of one decimal point, to 82.6%.
European routes (domestic and cross border) produced 78% of AEA airlines’ passengers, but just 30% in terms of RPK. This RPK share was very similar to the RPK produced on the North Atlantic, which accounts for only 8.5% of total AEA passengers.
On Asia/Pacific services, passenger numbers and RPK produced were up by 11% and 12% respectively, while a lower increase in capacity supplied (ASK) resulted in average increase of 1.8 decimal points in passenger load factor. This was the second highest traffic growth region, after the South Atlantic.
Table 7 Total passenger traffic of AEA members, 2005
Passengers RPK ASK Pax load factor thousands millions millions % Domestic 102.6 55,303 83,595 66.2 Geographical Europe 149.9 155,994 230,333 67.5 Europe / North Africa 3.9 7,720 11,550 66.8 Europe/Middle East 6.5 21,415 29,085 73.6 North Atlantic 27.4 186,681 225,953 82.6 South Atlantic 4.2 36,789 44,580 82.5 Mid Atlantic 6.3 48,530 59,304 81.8 Europe/Rest Africa 7.4 49,714 63,781 77.9 Europe /Far East, Australasia 16.0 134,338 168,602 79.7 Other (non-scheduled) 9.8 22,563 29,008 77.8
SYSTEM-WIDE 334.2 719,273 946,125 76.0
Source: AEA STAR 2006
Figure 12 shows the traffic generated in 2005 and 2004 by the twelve top performing AEA airlines. Air France increased its RPK by 8.4%, squeezing ahead of Lufthansa.
All but one of these twelve airlines experienced growth in 2005. Swiss International posted a small fall in RPK, down by just half of one percent over 2004, itself down 15% over 2003. The average RPK growth among AEA airlines was just over 6.3%. Air France’s growth was outstripped by Turkish, where RPK growth topped 17% in 2005.

Analysis of the EU Air Transport Industry, 2005 41
Table 8 Scheduled passenger services of AEA members, 2005 vs 2004
Passengers RPK ASK Pax load factor Increase over 2004 (%) (% points) Domestic 3.7 5.5 4.7 0.5 Geographical Europe 4.9 6.5 3.3 2.0 Europe / North Africa 6.8 6.8 9.1 -1.4 Europe/Middle East 3.1 0.6 -4.9 4.0 North Atlantic 1.5 2.0 0.8 1.0 South Atlantic 13.2 12.9 13.3 -0.3 Mid Atlantic 5.9 6.7 4.3 1.8 Europe/Rest of Africa 3.5 4.6 4.7 -0.1 Europe /Far East, Australasia 10.9 11.6 9.1 1.8
SYSTEM-WIDE 4.5 6.1 4.3 1.3
Source: AEA STAR 2006
Figure 12 Scheduled service RPKs of selected AEA members, 2005 and 2004
0 20,000 40,000 60,000 80,000 100,000 120,000
TAP
Austrian
Turkish
Sw iss
SAS
Virgin
Alitalia
Iberia
KLM
British
Lufthansa
Air France
2005
2004
RPK millions
Source: AEA
4.2.2 Low cost carriers (LCCs) In 2005 the total number of scheduled passengers carried on recognised low-cost airlines on intra-European routes was around 115 million. Figure 13 clearly shows the continued dominance of Ryanair and easyJet. Between them the two airlines carried over 50% of all intra-European low-cost airline passengers. Ryanair and easyJet each carried four times as many passengers as Air Berlin’s City Shuttle operations. Air Berlin’s total passenger numbers were 13.54 million but this includes all the passengers carried on flight operated primarily on behalf of tour operators. A number of smaller LCCs did not report figures in 2005 for their scheduled operations. These include Smartwings, Centralwings, niki, Blu-Express, Windjet and a revived Volareweb.

Analysis of the EU Air Transport Industry, 2005 42
Figure 13 Total scheduled passengers by carrier 2005
0.0 5.0 10.0 15.0 20.0 25.0 30.0 35.0
EUJet *
Iceland Express
FlyMe
MyTravelLite *
MyAir
FlyGlobespan
flynordic
Thomsonfly ^
SkyEurope
Wizz Air
Virgin Express
Vueling
Transavia ^
Jet2.com
Sterling
Norwegian
bmibaby
hlx
Flybe.com
Germanwings
Air Berlin (City Shuttle) ^
easyJet
Ryanair
Passengers (millions) * Airline ceased operations during 2005
^ Also carried significant numbers of charter passengers
Source: Airline reports, Airline websites, Cranfield estimates
Ryanair continued to grow faster than easyJet in 2005 and thus increased its margin as market leader in terms of passengers flown. Despite some impressive growth rates amongst the smaller LCCs, in terms of volume growth easyJet and Ryanair continued to be the fastest growers.
LCCs established a number of new bases across Europe in 2005. These included:
• Bmibaby in Birmingham (7 January)
• easyJet in Basel (17 June)
• Flybe in Norwich (10 February)
• Germanwings in Berlin Schőnefeld (5 June) and Hamburg (27 November)
• Jet2.com in Newcastle (4 September)
• MyAir in Bologna (24 June)
• Ryanair in Pisa (April)
• Thomsonfly in Doncaster/Sheffield (28 April) and Bournemouth (22 March)

Analysis of the EU Air Transport Industry, 2005 43
• Vueling in Madrid (15 November)
All of these bases were in the airline’s home country with the exception of Ryanair and easyJet who set up bases in Italy and Switzerland respectively.
Figure 14 and Figure 15 show details of performance, in terms of passenger load factors, for selected routes at Ryanair’s main base at London Stansted, and for easyJet at Dortmund, their second base in Germany.
Figure 14 Ryanair load factors on selected London Stansted services 2005
0%
10%
20%
30%
40%
50%
60%
70%
80%
90%
100%
Jan Feb Mar Apr May Jun Jul Aug Sep Oct Nov Dec
Brno
Bydgoszcz
Gdansk
Granada
Grenoble
Kaunus
Lodz
Porto
Poznan
Riga
Rzeszow
Santander
Santiago de Compostela
Seville
Sczecin
Toulon
Wroclaw
Zaragoza
Grenoble
Seville
Wroclaw
Toulon
Source: Derived from CAA UK Airport and Punctuality statistics
Figure 14 shows monthly passenger load factors on a selection of routes operated by Ryanair from London Stansted. All of these routes commenced operations during 2005 with the exception of Riga, Santander and Zaragoza which all began in late 2004. All of the destinations were served on at least a daily basis. Ryanair’s ability to generate high average load factors as soon as the routes start operating is noticeable with little apparent ramp-up. However, this is achieved initially through very low fares and strong promotional activity. The chart highlights those routes that appear to be underperforming. Notable successes appear to be the routes to Wroclaw in Poland and to Kaunas in Lithuania. Ryanair’s cheap fares will clearly help consumers in these countries afford air travel, possibly for the first time.
easyJet opened their first base in Germany at Berlin Schőnefeld on 28 April 2004. The base has grown rapidly from thirteen routes in the summer of 2004 to twenty-seven routes in summer 2005. A second base was established in Germany, in Dortmund, with services there beginning on 15 July 2004, less than three months after the Berlin base. However, the Dortmund base has grown less rapidly, expanding from just eight routes in summer 2004 to eleven routes in winter 2005. During 2005 new services began from Dortmund to Barcelona, Geneva and Madrid while flights to Nice were dropped for the winter season.

Analysis of the EU Air Transport Industry, 2005 44
Figure 15 Easyjet load factors on selected Dortmund services, 2005
0%
10%
20%
30%
40%
50%
60%
70%
80%
90%
100%
Jan Feb Mar Apr May Jun Jul Aug Sep Oct Nov Dec
Alicante
Barcelona
Budapest
Krakow
London LTN
Milan MXP
Nice
Paris CDG
Prague
Rome CIA
TotalMilan Malpensa
Budapest
Barcelona
Source: Derived from destatis figures
The estimated monthly load factor, by route, for the majority of destinations served by easyJet from Dortmund is shown in Figure 15. These load factors (derived from German government statistics available through destatis.com) refer to actual passengers flown rather than passengers booked. Only the route to Palma is not analysed as here the airline competed directly with another carrier and only total route data is publicly available.
Overall it is estimated that easyJet achieved an annual average load factor from its Dortmund flights of around 76% which is very close to what it also achieved from its Berlin operations. The peak in March can be attributed to Easter falling in March in 2005. The challenge of launching new routes can clearly be seen in the performance of the new routes to Barcelona and Milan Malpensa which were launched at the end of October. Milan in particular appears to be struggling to reach the kind of load factor levels that would indicate that the route was profitable.
Thanks to their pricing policies, low-cost airlines are traditionally able to generate demand on new routes very quickly. If a route fails to deliver decent loads when yields are low it is unlikely to generate profits in the longer term. Thus low-cost carriers can often tell within a short space of time whether a new route will ultimately succeed or not.
4.2.3 Charter/Leisure airlines In 2005 there were 97 charter airlines based in Europe5 operating commercial services with aircraft seating over fifty passengers. The average length of time these carriers had been in existence was ten years, with three companies commencing operations during 2005.
5 Europe here includes the 25 EU Member States, Bulgaria, Croatia, Iceland, Norway, Romania, Switzerland and Turkey.

Analysis of the EU Air Transport Industry, 2005 45
Table 9 provides a listing of the 97 carriers; indicating country of registration, date established and fleet size in 2005. As may be seen, the countries with the largest number of passenger charter airlines are the UK (13), Turkey (11), Spain (9), France (8), Germany (8) and Italy (8). The fleets operated by the 97 airlines totalled 826 aircraft, of which 44% were flying for vertically integrated tour operating organizations, 39% for independent companies, and 17% were operated by carriers owned by other airlines. The charter airlines owned by tour operators accounted for 68% of passengers carried by the 56 airlines in 2005 (for which data could be obtained), with 19% travelling on services operated by independent carriers and 13% flying with companies owned by other airlines.
Table 9 Europe’s passenger charter airlines in 2005
Established
Fleet size
Previously known as
Established
Fleet size
Previously known as
Austria LTU Austria 2004 1 Portugal EuroAtlantic 1993 8MAP 2002 4 Hi Fly 1988 4 Air Luxor
Belgium Jetairfly 2004 7 TUI Airlines Belgium Luzair 2000 2Thomas Cook (Belgium) 2002 5 White 2000 1 Yes
Bulgaria BHAir 2001 7 Romania Romavia 1991 7Bulgarian Air Charter 2000 8 Spain Air Madrid 2003 6VIA 1990 4 Air Plus Comet 1996 10
Croatia Air Adriatic 2000 6 Futura 1989 19Dubrovnik Airline 2005 3 Girjet 2002 4
Cyprus Eurocypria 1990 4 Hola 2002 3Czech Fischer Air 1996 3 Iberworld 1998 10
Travel Service Czech 1997 8 LTE 1987 4Denmark MyTravel A/S 1994 11 Pullmantur Air 2003 3Finland Air Finland 2002 3 Visig 2003 1France Aigle Azur 1970 6 Sweden Britannia Nordic 1997 5
Air Horizons 2000 4 Falcon Air 1986 3Air Mediterranee 1997 6 Nordic Airways 2004 5Axis Airways 2001 5 Novair 1997 5Blue Line 2002 4 Viking 2003 3Corsair 1981 11 Switzerland Belair 2001 3Eagle Aviation 1999 2 Edelweiss Air 1995 4Star 1995 7 Hello 2004 3
Germany Aero Flight 2004 5 Privatair 1977 5Blue Wings 2002 1 Turkey Atlasjet International 2001 18Condor 1955 23 Fly Air 2002 9Condor Berlin 1997 13 Freebird 2001 3Germania 1978 - Inter Airlines 2002 1Hamburg Int'al 1998 6 MNG Airlines 1997 25Hapagfly 1972 35 Hapag-Lloyd Onur Air 1992 27LTU 1955 25 Pegasus 1990 14
Greece Greece Airways 2003 1 Saga Airlines 2004 3Hungary Travel Service Hungary 2001 1 Sky Airlines 2001 6Iceland Air Atlanta Icelandic 1986 35 Sunexpress 1990 10
Islandsflug 1991 19 World Focus Airline 2004 3Jet X 2004 3 UK Air Atlanta Europe 2002 3
Ireland EIR Jet 2004 3 Air Scandic 1997 2Italy Air Europe 1989 1 Astraeus 2001 9
Air Italy 2005 2 European Air Charter 1993 10Blue Panorama 1998 11 Excel 1994 12Eurofly 1989 12 First Choice 1986 30Itali Airlines 2003 5 Flightline 1989 8Lauda Italia 1992 3 FlyJet 2002 2Livingston 2003 6 Monarch 1967 28Neos 2001 4 MyTravel 1986 18
Latvia LAT Charter 1993 3 Thomas Cook (UK) 1998 23Lithuania Aurela 1996 1 Thomsonfly 1962 43 Britannia A/w
Netherlands Arkefly 2004 4 HollandExel Titan 1988 9Interstate Airlines 2005 1Martinair 1958 21Transavia 1966 28
Airlines in italics ceased operations in 2005 Sources: JP Airline-Fleets International, ICAO, IATA, ATI, Airline Business, DGAC France, UK CAA.
Table 10 provides 2005 traffic statistics for 51 of the 97 carriers referred to in the previous table, data being unobtainable for the remaining airlines.

Analysis of the EU Air Transport Industry, 2005 46
Table 10 Europe’s charter airlines’ demand in 2005, and change over 2004
millions % change millions % changeThomsonfly 9.550 10.3% 23,337 9.8%Condor 7.376 3.7% 22,245 3.4%Hapagfly 7.310 3.0% 17,246 3.7%First Choice 5.999 -1.0% 15,729 2.0%LTU 5.600 -5.4% 18,206 -1.0%Monarch 5.403 7.4% 13,549 5.8%Thomas Cook (UK) 4.937 -1.3% 14,352 0.1%Transavia 4.800 19.1% 9,946 32.5%MyTravel 4.385 -38.8% 13,808 -24.3%Atlasjet International 2.710 163.1% 3,395 n/aExcel 2.591 10.2% 7,636 18.2%MyTravel A/S 2.100 -6.3% 7,500 -7.7%Corsair 2.029 -1.5% 12,623 2.2%Martinair 1.890 4.4% 9,350 17.6%Travel Service Czech 1.810 39.2% 3,261 38.9%Sunexpress 1.700 25.0% 3,938 27.2%ArkeFly 1.560 1,560Futura 1.558 -8.3% 3,341 -13.1%Jetairfly 1.400 44.3% 3,780 58.8%Iberworld 1.166 -13.6% 3,923 2.3%World Focus Airline 1.100 57.1% n/a n/aBlue Panorama 1.020 56.9% 7,998 56.0%Thomas Cook (Belgium) 1.000 3.1% 2,375 -0.3%Fly Air 0.965 -16.8% 1,958 -22.4%Britannia Nordic 0.950 -17.4% 3,272 -19.4%Aigle Azur 0.928 23.7% 1,593 38.9%Air Mediterranee 0.878 8.4% 1,722 8.2%LTE 0.875 2.9% 2,127 43.8%Star 0.855 4.3% 2,759 -10.3%Astraeus 0.800 -16.7% 2,948 41.2%Bulgarian Air Charter 0.740 184.7% 1,262 n/aHamburg Int'al 0.730 9.0% 1,208 13.3%Air Horizons 0.654 5.5% n/a n/aEdelweiss Air 0.574 -2.7% 1,879 -20.5%Air Atlanta Europe 0.553 28.5% 5,026 12.7%Neos 0.528 7.7% 1,727 44.9%Livingston 0.522 -13.0% 1,338 -4.5%Air Adriatic 0.440 76.0% 660 152.9%Axis Airways 0.409 140.6% 914 234.8%Novair 0.400 0.0% 3,542 13.7%Belair 0.373 -1.8% 1,161 0.3%Blue Line 0.364 102.2% n/a n/aEuropean Air Charter 0.328 5.8% 1,511 7.7%BHAir 0.320 6.7% n/a n/aFlyJet 0.306 33.2% 952 26.0%Lauda Italia 0.285 -30.5% 2,362 -30.3%Titan 0.202 188.2% 323 41.6%Flightline 0.189 25.8% 141 26.7%EuroAtlantic 0.114 -36.4% 387 -6.0%Eagle Aviation 0.046 -48.9% n/a n/aRomavia 0.027 169.6% 32 102.6%
TOTAL 93.349 259,902
AirlinesPassengers RPK
Sources: JP Airline-Fleets International, ICAO, IATA, ATI, Airline Business, DGAC France, UK CAA.

Analysis of the EU Air Transport Industry, 2005 47
Overall, the number of passengers carried by these 51 companies increased by 6.3% in 2005 compared to the previous year. In terms of RPKs, the equivalent increase was 6.7%.
The top 20 airlines accounted for 81.3% of the passengers carried by these 51 carriers and 80.3% of RPKs. Figure 16 ranks these 20 carriers in terms of RPKs, indicating which form part of a major tour-operating group, which are independent and which are owned by another airline.
Figure 16 Top 20 European charter airlines in RPKs in 2005
Sources: JP Airline-Fleets International, ICAO, IATA, ATI, Airline Business, DGAC France, UK CAA.
Key factors affecting operating and financial performance in 2005 The much greater flexibility provided by the low cost scheduled airlines (LCC) in short haul markets is increasingly attracting travellers away from the conventional charter product. Most charter carriers have responded to the challenge of LCC by developing their own Internet sites providing consumers with a similar supply of information on fares and seat availability. Dynamic packaging has become the order of the day with the large tour operating organisations, empowering their clientele to assemble their own holiday packages. Two distinct strategies have been apparent in the ways in which the major tour operators have responded to LCC. One response has involved the setting up of no-frills scheduled subsidiaries, while others have sought to reduce their reliance on traditional short haul markets focussing instead on longer haul destinations with improved product features, such as increased seat pitch.
The rate of decline in demand for charter services in Europe’s short haul markets has increased in 2005. For example, while the number of package holidays abroad taken by UK residents fell by 3.4% between 2004 and 2005, those involving EU
0
5,000
10,000
15,000
20,000
25,000
Thomsonfly
CondorLTU
Hapag
fly
First C
hoice
Thomas C
ook (UK)
MyTrav
el
Monarch
Corsair
Transa
via
Martinair
Blue Pan
orama
Excel
MyTrav
el A/S
Air Atla
nta Euro
pe
Sunexpres
s
Iberworld
Jetai
rfly
Novair
Atlasje
t Inter
national
RPK
mill
ions
Tour Group
Airline subsidiary
Independent

Analysis of the EU Air Transport Industry, 2005 48
destinations declined by 8.2%. The number of charter passengers carried to and from the UK fell by 6.7% to 33.3 millions in 2005, a drop of 2.4 million over the previous year.6
The decline in charter demand has been particularly apparent in the largest short-haul markets, with the most popular destinations for UK passengers in Portugal and Spain experiencing significant falls in traffic since 2003.
Figure 17 UK short-haul charter passengers
Source: UK CAA.
4.3 Air Cargo
4.3.1 European overview In 2005, Eurostat records over 10.8 million tonnes of freight and mail were transported within the EU-15, and between those countries and other nations. This represented an increase of 3.9% over the amount carried in the previous year, and an average annual growth of 6.6% since 2003.
As in the case of passenger traffic, the overall figures mask very great differences in the traffic generated by states (Figure 18). Within the EU-25, over half of cargo traffic generated involves airports in just three states: Germany (25%), UK (20%), and France (12%).
There are great differences in the year-on-year rates of growth in cargo traffic among the countries represented in Figure 18. Figure 19 shows the extent to which cargo volumes changed between 2004 and 2005. 6 Excludes oil rig traffic.
0
2,000,000
4,000,000
6,000,000
8,000,000
10,000,000
12,000,000
14,000,000
Spain
Canari
es
Greece
Portugal
Cypru
s
Turkey
Italy
France
Tunisia
Malta
Austria
Egypt
Switzerl
and
Israe
l
2000
2003
2005

Analysis of the EU Air Transport Industry, 2005 49
The accession states appear to have generated the greatest increases in cargo transported over the one year period, recovering from a relatively poor performance in 2004. Estonia, Latvia, Lithuania recorded increases in cargo traffic of over 75%, while Slovakia retreated after its heady performance the previous year (down 50% from 2004).
Figure 18 European air freight and mail transport by state, 2005
0
500
1,000
1,500
2,000
2,500
3,000
Aust
ria
Belg
ium
Cyp
rus
Cze
ch R
epub
lic
Den
mar
k
Esto
nia
Finl
and
Fran
ce
Ger
man
y
Gre
ece
Hun
gary
Icel
and
Irela
nd
Italy
Latv
ia
Lith
uani
a
Luxe
mbo
urg
Mal
ta
Net
herla
nds
Nor
way
Pola
nd
Portu
gal
Rom
ania
Slov
akia
Slov
enia
Spai
n
Switz
erla
nd
Uni
ted
King
dom
thou
sand
s of
tonn
es
2005
Souce: Eurostat
The main players in the market showed mixed performance compared with 2003. Germany was up 8% but UK and France were both down by 1%.
Figure 19 Annual growth in air freight and mail, 2004-2005
-50%
-30%
-10%
10%
30%
50%
70%
90%
Aust
ria
Belg
ium
Cyp
rus
Cze
ch R
epub
lic
Den
mar
k
Esto
nia
Finl
and
Fran
ce
Ger
man
y
Gre
ece
Hun
gary
Icel
and
Irela
nd
Italy
Latv
ia
Lith
uani
a
Luxe
mbo
urg
Mal
ta
Net
herla
nds
Nor
way
Pola
nd
Portu
gal
Rom
ania
Slov
akia
Slov
enia
Spai
n
Switz
erla
nd
Uni
ted
King
dom
thou
sand
s of
tonn
es
Source: Eurostat
4.3.2 European airlines AEA freight traffic moved ahead in 2005, fuelled by growth of almost 6% on the important Far East and Australasian routes. This was driven by buoyant export growth from China and other Asian manufacturing countries. High growth also occurred on South American routes and between Europe and sub-Saharan Africa, but

Analysis of the EU Air Transport Industry, 2005 50
fell quite sharply within European domestic markets, and was down slightly on the routes across the North Atlantic, the second most important region.
Table 11 Air freight traffic carried by AEA carriers, 2005 vs 2004
FTKs m 2005 % change Domestic 134.6 -6.9 Geographical Europe 809.4 3.0 Europe/North Africa, Mid-East 1,102.3 1.0 North Atlantic 9,961.3 -0.3 South/Mid Atlantic 3,725.4 6.5 Europe/Rest of Africa 2,919.8 7.6 Europe/Far East, Australasia 16,852.2 6.0 Other 71.5
TOTAL 35,576.5 2.3 Source: AEA
The top ten AEA air cargo carriers’ performance in 2005 is shown in Figure 20. These accounted for 94% of total AEA traffic for that year. The top five which accounted for 80% of the total all reported strong increases in traffic compared to the previous year, especially Cargolux.
Figure 20 Top 12 AEA airline cargo traffic in 2005 and 2004
0 2,000 4,000 6,000 8,000
SAS
Iberia
Swiss
Virgin
Alitalia
British Airways
KLM
Cargolux
Air France
Lufthansa
RTK millions
2004
2005
Source: AEA
4.3.3 Integrators DHL Express division increased its revenues by 4.1% in 2005 to €18.3 billion. Acquisitions made the largest contribution to this growth, with Airborne (the US air cargo carrier) taken over the previous year. Margins on sales (EBIT divided by revenues) averaged 15.8% in 2005 compared to 16.3% in 2004. DHL Express accounts for 41% of group turnover, and worldwide employed 132,000 staff,

Analysis of the EU Air Transport Industry, 2005 51
operating at 36 hubs with 72,000 vehicles and 420 aircraft (operating for DHL). Europe accounted for 64% of turnover in 2004, and was up by only 0.1%. The highest growth occurred in the Asia/Pacific region (+23%), which accounted for 13% of total revenue for the Express Division in 2005. The Americas region generated around one quarter of turnover and grew by 5.8% in 2005. In recent years DHL’s Courier, Express and Parcels (CEP) business has grown by around 5-6% in their six core countries of Europe, and at 7-8% in foreign countries. In 2005, DHL formed a joint venture with Lufthansa Cargo called ‘LifeConEx’ based in Florida, offering the temperature-controlled specialist transport of pharmaceuticals, biotech and healthcare products.
FedEx’s international freight business, most of which goes by air, grew rapidly in the nine months to end February 2006, with revenues up 20% compared to the same period in 2005. US domestic freight also advanced by 20% for the same period from a much higher base. In terms of revenues, its International Priority package business increased strongly by 13% with the US domestic express business up by only 7%. For traditional freight, the growth occurred in the US, with a downturn in international business. FedEx’s operations on the US Gulf Coast were badly affected by a number of hurricanes between June and the end of 2005.
UPS’s International Package revenue improved to $1.2 billion, or 17.2%, for the year 2005 versus 2004, primarily due to the 13.9% volume growth for export products and revenue per piece improvements. The improvements in revenue per piece were impacted by rate changes, currency fluctuations, and the fuel surcharge applied to international shipments. Revenue increased $121m during the year due to currency fluctuations, net of hedging activity, and also increased by $133m during the year due to business acquisitions.
UPS’s export volume increased throughout the world, with strong growth in Asia and Europe. Asian export volume, which increased 29% over 2005, was driven by export growth from China. Additional flights were operated from Shanghai that were added in the fourth quarter of 2004, and express air service between the U.S. and Guangzhou, China that began in the second quarter of 2005.
UPS’s European export volume increased 13% for the year, while export volume from the U.S. and Americas also showed solid increases. International volume to/from Europe increased 12.4% for the year, due to volume growth in Canada and Europe, which also benefited from the acquisition of Messenger Service Stolica S.A. in Poland during the second quarter of 2005, and Lynx Express Ltd. in the United Kingdom in the third quarter of 2005. Excluding the impact of acquisitions, international volume increased 3.7%. UPS employs around 32,000 staff in Europe, and has a fleet of more than 7,000 ground vehicles. It operates 150 intra-European flight segments and 133 on intercontinental routes, both centred on its hub at Cologne-Bonn Airport. Worldwide it operates 268 of its own aircraft and charters a further 309. The Deutsche Post World Net annual report for 2005 estimated the European CEP market to be worth €27.5 billion in 2004, of which DHL’s share was 20%, the French Post Office (La Poste) 12%, TNT 11%, UPS 8%, the UK Royal Mail 8% and FedEx 2%.
4.3.4 Other world regions World freight tonne-kms increased by 2.5% in 2005 compared to 2004, reaching 142.6 billion. Of this total, 83% was carried on international services. Domestic air

Analysis of the EU Air Transport Industry, 2005 52
cargo rose by only 0.8% in 2005 compared to international growth of 2.9%. Table 12 shows how the growth rates varied by region, and also adds mail traffic.
Table 12 Growth of world air cargo traffic by regional, 2005 vs 2004
% change 2005 vs 2004 International & Domestic Freight tonne-kms Mail tonne-kms Africa + 6.1 + 18.8 Asia & Pacific + 3.9 + 7.8 Europe + 2.5 + 0.8 Middle East + 12.4 - 0.4 Latin America/Caribbean - 2.7 + 10.0 North America - 0.6 - 2.6 Worldwide + 2.5 + 1.9
Source: ICAO Annual Review of Civil Aviation, 2005
The total freight tonne-kms carried by the members of Association of Asia Pacific Airlines (AAPA) amounted to 51.5 billion in 2005, up 3.6% from the previous calendar year. Their freight load factor fell from 67.4% in 2004 to 66.4% in 2005. Airlines with the highest freight load factors over the year were Korean Air (76.9%), Asiana (73.4%), China Airlines (73.2%), EVA Air (72.9%) and Dragonair (72.7%). Dragonair registered the fastest growth in freight tonne-km traffic (up 31.2%), followed closely by Qantas (up 30%). Garuda Indonesia posted a decline in cargo traffic of 14.2%.
Freight and mail traffic (tonne-kms) carried by the members of the Air Transport Association of America (including six all-cargo carriers) totalled 51.9 billion in 2005, up by 0.2% compared to 2004. A fall in domestic traffic of 1.6% was offset by an increase in international air cargo traffic of 1.9%. Just under half of total FTKs were carried on domestic routes, with 26% to/from Asia/Pacific and 20% on the North Atlantic. FedEx accounted for 30.4% of the 2005 total, Atlas/Polar 17.9% and UPS 17.5%. Scheduled cargo yield was up by 15.9% in 2005, helped by a number of fuel surcharges throughout the year.
The largest US air cargo hub was Memphis, home of FedEx, with 3.6m tonnes of cargo handled in 2005, followed by Anchorage with 2.6m tonnes and Los Angeles with 1.9m tonnes.
The Arab Air Carrier Association (AACO) reported an increase in cargo tonnes carried of 20% in 2005 over 2004, reaching 2.6m tonnes. Almost all of this (97%) was carried on international services. Emirates Airlines alone accounted for just over one million tonnes of air cargo.

Analysis of the EU Air Transport Industry, 2005 53
SECTION 5
AIRLINE FINANCIAL PERFORMANCE
5.1 NETWORK AIRLINES .............................................................................54
5.2 LOW-COST CARRIERS (LCCS) AND CHARTER AIRLINES........................62
5.3 REGIONAL AIRLINES.............................................................................73
5.4 CARGO AIRLINE ECONOMIC PERFORMANCE..........................................74
5.5 OTHER MAJOR WORLD AIRLINES ..........................................................77
5.6 AVIATION FUEL....................................................................................79
5.7 EUROPEAN AIRLINE FINANCING............................................................82
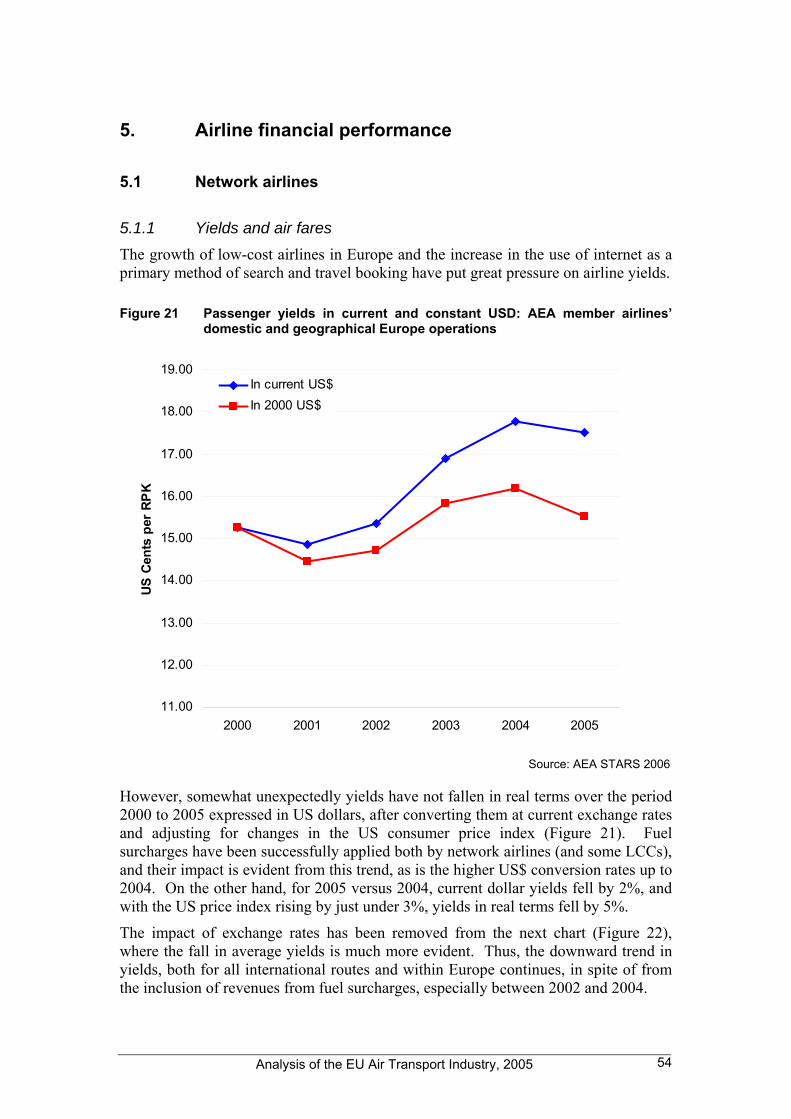
Analysis of the EU Air Transport Industry, 2005 54
5. Airline financial performance
5.1 Network airlines
5.1.1 Yields and air fares The growth of low-cost airlines in Europe and the increase in the use of internet as a primary method of search and travel booking have put great pressure on airline yields.
Figure 21 Passenger yields in current and constant USD: AEA member airlines’ domestic and geographical Europe operations
11.00
12.00
13.00
14.00
15.00
16.00
17.00
18.00
19.00
2000 2001 2002 2003 2004 2005
US C
ents
per
RP
K
In current US$In 2000 US$
Source: AEA STARS 2006
However, somewhat unexpectedly yields have not fallen in real terms over the period 2000 to 2005 expressed in US dollars, after converting them at current exchange rates and adjusting for changes in the US consumer price index (Figure 21). Fuel surcharges have been successfully applied both by network airlines (and some LCCs), and their impact is evident from this trend, as is the higher US$ conversion rates up to 2004. On the other hand, for 2005 versus 2004, current dollar yields fell by 2%, and with the US price index rising by just under 3%, yields in real terms fell by 5%.
The impact of exchange rates has been removed from the next chart (Figure 22), where the fall in average yields is much more evident. Thus, the downward trend in yields, both for all international routes and within Europe continues, in spite of from the inclusion of revenues from fuel surcharges, especially between 2002 and 2004.

Analysis of the EU Air Transport Industry, 2005 55
Figure 22 Passenger yields in current price € - AEA member airlines
80
85
90
95
100
105
2001 2002 2003 2004 2005
Inde
x (2
001
= 10
0)
Total scheduledGeographical Europe
Source: AEA STARS 2006
Table 13 shows how overall yields, both passenger and cargo, have changed in 2005 for the major European network airlines. Fuel surcharges are included in the revenues used to calculate these yields, and this helped British Airways, Iberia and Lufthansa to register reasonably good increases, and to a lesser extent Air France-KLM. British Airways were helped by an upward trend in premium traffic, especially on long-haul routes, but its longer average stage length would have reduced its yield..
Table 13 Total revenue (US$) per RTK - selected European network airlines
2005 2004 2005 vs 04 %
AIR FRANCE-KLM 93.5 91.3 2.3 BRITISH AIRWAYS 94.6 91.1 3.8 FINNAIR 169.8 169.5 0.2 IBERIA GROUP 112.6 108.4 3.8 LUFTHANSA 77.5 74.3 4.3 SAS 142.3 145.9 -2.5 SWISS 92.5 95.9 -3.5
Source: ICAO and airline annual reports
SAS and Swiss experienced a decline in overall yields compared with 2004, with little change in sector lengths but operating in a very competitive environment, and both airlines more dependent on intra-European markets.

Analysis of the EU Air Transport Industry, 2005 56
Figure 23 Premium passengers as a % of total - AEA member airlines
12
13
14
15
16
17
18
19
2001 2002 2003 2004 2005
Pre
miu
m %
of t
otal
EuropeBeyond Europe
Source: AEA 2006
Figure 23 illustrates one of the major factors contributing to an erosion in AEA airline yields. The percentage of passengers travelling in premium classes has declined sharply since 2002, such that only some 13.5% of passengers with Europe travel in business class. On long-haul service the decline has been much less marked, and there is some evidence of increasing demand for premium-class travel.
5.1.2 Costs Table 14 shows labour trends for the following European network airlines:
Aer Lingus, Air France-KLM, Alitalia, Austrian, British Airways, Czech Airlines, Finnair, Iberia, Icelandair, LOT Polish Airlines, Lufthansa, Malev, SAS, Swiss, Turkish and TAP Air Portugal
It can be seen that total employment was unchanged in 2005. Some carriers such as Alitalia reduced their headcount, and others such as Malev outsourced both ground handling and fuel supply with significant staff savings.
Table 14 Labour costs and productivity: 16 European airlines, 2004 vs 2005
2005 2004 %(pts) change
Total employees (year average x 000) 311,431 311,542 0.0 Total labour costs (US$m) 23,250 23,106 0.6 Average cost per employee ($) 74,654 74,167 0.7 Average ATKs per employee 452,633 432,282 4.7 Unit labour costs (US cents) 16.5 17.2 -3.9
Source: ICAO and airline annual reports

Analysis of the EU Air Transport Industry, 2005 57
On the other hand, some additions were noted at major carriers BA, Lufthansa and Iberia, with the Air France-KLM annual equivalents roughly unchanged.
Total labour costs for the sample of the 16 airlines rose slightly by 0.6% in 2005 to reach US$23.3 billion, with no significant change in the US dollar/€ exchange rate. Average cost per employee was little changed at US$74,600, while the European rate of inflation in the euro zone rose by around 3%. Productivity was up by 4.7%. Some of this gain may have been illusory since outsourcing switches the emphasis from managing labour to managing suppliers. However, the resultant reduction in unit labour costs of 4% was welcomed in a year of rapidly rising fuel costs. It could even be argued that rising fuel costs helped airline management reduce other costs, the most significant being labour.
Figure 24 shows labour productivity, expressed as ATKs per employee, for 16 of the largest European airlines. Changes between 2004 and 2005 are indicated, with Aer Lingus, Icelandair and Swiss improving the most. Average sector length is one factor explaining differences, but only just over 50% of such variations could be accounted for by this single factor. Austrian Airlines experienced a fall in productivity partly as a result of the addition of Slovak Airlines to the group, but also because of additions to their mainline staff in a year of low growth in output.
Figure 24 Labour productivity for selected network carriers, 2004 v 2005
0 100,000 200,000 300,000 400,000 500,000 600,000 700,000 800,000 900,000 1,000,000
AER LINGUS
AIR FRANCE-KLM
ALITALIA
AUSTRIAN
BRITISH AIRWAYS
CZECH AIRLINES
FINNAIR
IBERIA
ICELANDAIR
LOT
LUFTHANSA
MALEV
SAS
SWISS
THY
TAP AIR PORTUGAL
Average Network
ATKs per employee (000)
20052004
Source: ICAO and airline annual The other dimension of unit labour costs is the average cost per employee. This is shown in Figure 25, most of the data extracted from both airline annual reports and the ICAO Personnel statistical series. Scandinavia and Switzerland are high wage countries, and their airlines are no exception to this. Finland is also high cost, but Finnair’s average was not so high: this might be explained by the staff working for travel and tour elements to Finnair, which tend to be much lower paid than many of the scheduled airline functions.

Analysis of the EU Air Transport Industry, 2005 58
Airlines with the largest increases were Aer Lingus, Turkish and Malev. The latter would have been helped by the outsourcing of lower paid handling staff. Icelandair and Czech Airlines experienced some reductions.
Figure 25 Cost per employee for selected network carriers, 2004 v 2005
0 20,000 40,000 60,000 80,000 100,000 120,000 140,000
AER LINGUS
AIR FRANCE
ALITALIA
AUSTRIAN
BRITISH AIRWAYS
CZECH AIRLINES
FINNAIR
IBERIA
ICELANDAIR
LOT
LUFTHANSA*
MALEV
SAS
SWISS
THY
TAP AIR PORTUGAL
Average Network
Average cost per employee (US$)
20052004
* average for all group Source: ICAO and airline annual
5.1.3 Financial results The financial results of the sixteen European network airlines are analysed below, followed by airlines from the other two largest regions of the world: USA and Asia. The ICAO world scheduled airline results for 2005 indicated a preliminary operating profit of US$4.3 billion, an operating margin of only 1%.
Table 15 Financial results: major European network carriers
2005* 2004* Change (%pts) Operating margin (%) 2.9 2.1 0.8 Total revenue per RTK (US cents) 97.5 92.8 5.1 Operating cost per ATK (US cents) 66.3 62.7 5.7 Overall load factor (%) 69.8 69.0 0.8 Debt/equity ratio 2.1 2.6 -18.1 Pre-tax profit as % long-term capital 4.8 3.4 1.4 After tax profit as % equity 10.2 9.9 n/a Operating leases as % long-term capital 32.0 32.4 -0.4 Average sector length (kms)** 1,301.0 1,326.0 -1.9
* Aggregate of airlines reporting different financial year ends: largest part of FY falling in 2004 or 2005 ** based on IATA data for calendar year
Table 15 summarises the financial results for the twenty largest European network carriers for which data was available. Notable omissions were Air Malta and Cyprus Airways, as well as the airlines from the Baltic states. These are the largest AEA airlines in terms of passenger-kms apart from Olympic Airways (no data) and Spanair

Analysis of the EU Air Transport Industry, 2005 59
(part of SAS group). The table shows that the European airlines achieved a small margin of 3% in 2005, up almost 1% point compared to 2004, in a difficult year of large increases in fuel costs. This however disguises a large variation across the sample (Figure 26). The improvement was caused principally by an increase in overall load factor to almost 70%. Yields increased by 5% helped by fuel surcharges, but unit costs advanced faster in spite of the contribution of lower unit labour costs discussed above.
The weighted average rate of exchange used to convert local currencies to the US dollar was little changed over the year, even though the rate depreciated from US$1.357 at the beginning of the year to $1.1844 at the end of the calendar year. However, during the summer months of 2004 and 2005 the rates were very similar. The same held for the rate between the € and the Japanese yen. Average fuel prices were up by 42% in calendar year 2005. Some airlines end their financial year on 31 March: for example, British Airways which experienced an increase in fuel price of 38% in US dollars for the year ending 31 March 2006.
The sixteen airlines as a whole made a pre-tax profit of US$3.0 billion in 2004 increasing to $4.0 billion in 2005. Net losses were recorded in 2005 by Alitalia, SAS, Swiss and TAP Air Portugal, while British Airways, Iberia and Lufthansa all made significant improvements. The amount allowed for taxation by these airlines increased from $623m in 2004 to $1,316m in 2005.
Long-term capital has been calculated as the total of shareholders’ equity, long-term debt and capitalised finance leases (both on balance sheet), and capitalised operating leases. The latter were estimated by multiplying annual aircraft lease rentals (in the profit and loss account) by seven. Around 32% of the total capital was accounted for by operating leased aircraft in 2005 (little changed from the previous year), showing the importance of their inclusion in financial ratios.
Figure 26 Operating margins for major European network airlines, 2005 vs 2004
-15.0 -10.0 -5.0 0.0 5.0 10.0 15.0
AER LINGUS
AIR FRANCE-KLM
ALITALIA
AUSTRIAN
BRITISH AIRWAYS
CZECH AIRLINES
FINNAIR
IBERIA
ICELANDAIR
LOT
LUFTHANSA
MALEV
SAS
SWISS
THY
TAP AIR PORTUGAL
Average Network
Operating result as % operating revenue
20042005
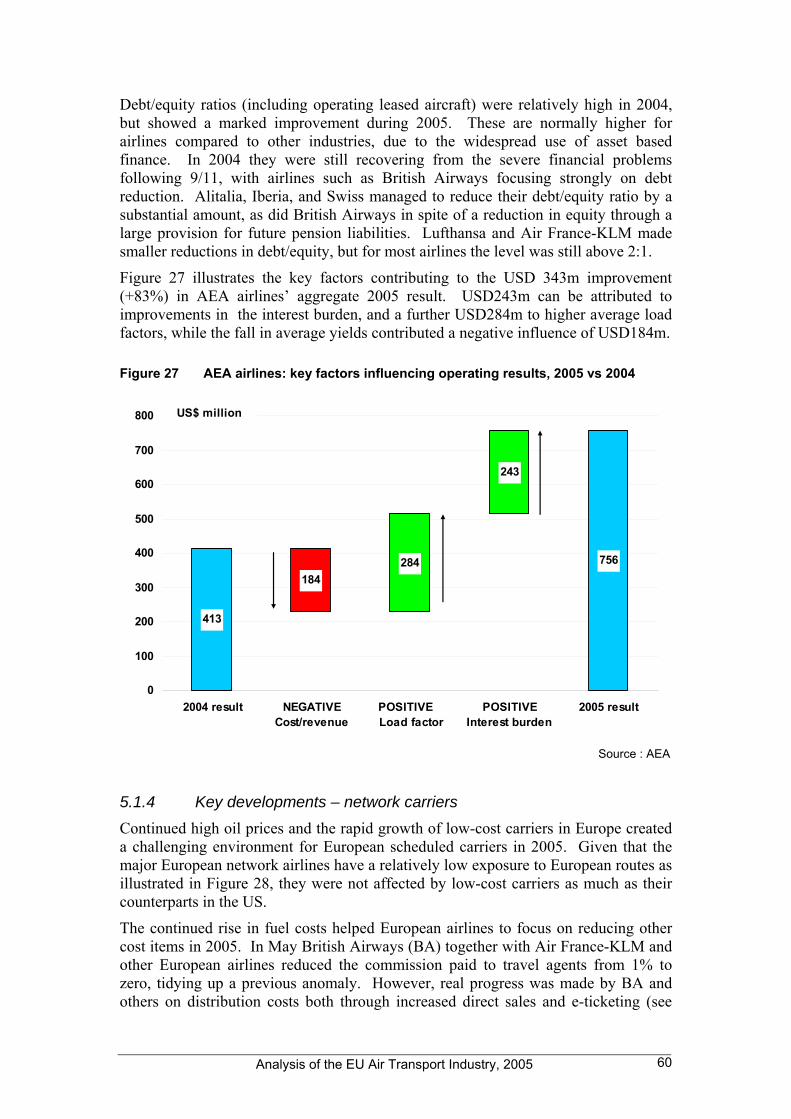
Analysis of the EU Air Transport Industry, 2005 60
Debt/equity ratios (including operating leased aircraft) were relatively high in 2004, but showed a marked improvement during 2005. These are normally higher for airlines compared to other industries, due to the widespread use of asset based finance. In 2004 they were still recovering from the severe financial problems following 9/11, with airlines such as British Airways focusing strongly on debt reduction. Alitalia, Iberia, and Swiss managed to reduce their debt/equity ratio by a substantial amount, as did British Airways in spite of a reduction in equity through a large provision for future pension liabilities. Lufthansa and Air France-KLM made smaller reductions in debt/equity, but for most airlines the level was still above 2:1.
Figure 27 illustrates the key factors contributing to the USD 343m improvement (+83%) in AEA airlines’ aggregate 2005 result. USD243m can be attributed to improvements in the interest burden, and a further USD284m to higher average load factors, while the fall in average yields contributed a negative influence of USD184m.
Figure 27 AEA airlines: key factors influencing operating results, 2005 vs 2004
413
184284
243
756
0
100
200
300
400
500
600
700
800
2004 result NEGATIVECost/revenue
POSITIVE Load factor
POSITIVEInterest burden
2005 result
US$ million
Source : AEA
5.1.4 Key developments – network carriers Continued high oil prices and the rapid growth of low-cost carriers in Europe created a challenging environment for European scheduled carriers in 2005. Given that the major European network airlines have a relatively low exposure to European routes as illustrated in Figure 28, they were not affected by low-cost carriers as much as their counterparts in the US.
The continued rise in fuel costs helped European airlines to focus on reducing other cost items in 2005. In May British Airways (BA) together with Air France-KLM and other European airlines reduced the commission paid to travel agents from 1% to zero, tidying up a previous anomaly. However, real progress was made by BA and others on distribution costs both through increased direct sales and e-ticketing (see

Analysis of the EU Air Transport Industry, 2005 61
Chapter 11). BA had already outsourced flight catering at their home base to gate Gourmet, but labour problems erupted there in August 2005 and strikes forced BA to cancel 900 flights, as well as offering reduced catering on flights that were operated. In November 2005, BA announced plans to reduce its senior and middle managers by 35% from 1,715 by March 2008 thereby saving £50m.
Figure 28 Intra-European RPK as % of total operations (2005)
0.0 10.0 20.0 30.0 40.0 50.0 60.0 70.0 80.0 90.0 100.0
Virgin Atlantic
KLM
British Airways
Air France
Austrian
Lufthansa
Swiss
Finnair
LOT
Alitalia
Iberia
TAP
Luxair
Icelandair
Czech
SAS
SN Brussels
Spanair
Malev
Turkish
Olympic
Adria Airways
bmi
JAT Airways
Tarom
Croatia Airlines
Air Malta
Cyprus Airways
Europe as % system-wide
Average all AEA members = 29%
Source: AEA STAR 2006
Air France continued to cement its relationship with KLM, launching a common frequent flyer programme, Flying Blue in June. The two airlines also harmonised the services that they offered on economy class flights. They continued to introduce self-service kiosks, with 320 in use at around 50 airports. Their combined number of full-time equivalent staff was slightly up on 2005 compared to the previous year (+0.8%).
The number of employees in the Lufthansa passenger transport business increased by 6.7% in 2005 over 2004, or by 2,342, but this was mainly due to the consolidation of Eurowings for the first time (Eurowings employed around 1,700 in 2004). The airline continued to apply its ‘Triangle’ and ‘Lean total direct cost’ efficiency programmes. Of the cost savings identified of €170m, the carrier had achieved €115m by the end of 2005. An agreement was signed in May with their cabin crew which incorporated more efficient processes and the restructuring of the regional air transport system and the introduction of point-to-point flights also helped achieve savings.
Iberia’s headcount declined by 2.1% in 2005 as a result of reductions in both flight and ground staff. Productivity advanced by 6.3%, mainly from improvements in ground staff productivity (up 6.4%), with cockpit crew and cabin crew hours per crew member up 1.5% and 3.3% respectively.
In 2005, Alitalia began to implement the four year business plan that was agreed at the time of its recapitalisation. This meant that the Airline would focus on

Analysis of the EU Air Transport Industry, 2005 62
transporting passengers and cargo, while the related technical and handling would be transferred to Alitalia Servizi for the time being 51% controlled by Alitalia. Alitalia undertook a significant reorganisation of its procurement process, giving it savings with an impact of more than €180m a year. The airline reduced its number of employees by 13.8%, with personnel costs falling by just under 10%. This was helped by changes to daily allowances. Aircraft utilisation rose by 6.8% in 2005 versus 2004.
5.2 Low-cost carriers (LCCs) and charter airlines
The financial results of the LCCs have been combined in this section with the charter carriers. This is because of the difficulty in allocating some airlines to one of the two categories. For example, Air Berlin is generally regarded as an LCC, but the airline has just over 40% of its traffic wholesaled to tour operators.
The tables below include the following airlines:
Air Berlin, easyJet, FlyMe, Norwegian, Ryanair, SkyEurope and Transavia
This covers a large part of the LCC sector, but little of the charter industry. The latter do not provide such data in their annual reports, and few have reported 2005 to ICAO (via their governments).
Table 16 Labour costs and productivity: LCC and charter airlines
2005 2004 %(pts) change
Total employees (year average x 000) 12,166 10,599 14.8 Total labour costs (US$ million) 834,547 715,877 16.6 Average cost per employee ($) 68,597 67,545 1.6 Average ATKs per employee 836,401 771,622 8.4 Unit labour costs (US cents) 8.2 8.8 -6.3
Source: ICAO and airline annual reports
These airlines expanded employment by 15%, with the average pay per employee increasing at 1.6%, well below the consumer price index. This reflects a continued strong focus on cost control. Labour productivity, which is already very high, advanced by a further 8.4% to give an improvement in unit labour costs of just over 6%. This was somewhat better than the network carriers (see previous section), and is evidence that this gap is widening overall.
Figure 29 and Figure 30 show how labour cost and productivity changed over 2005 by individual airline, for both LCCs and charter carriers. Ryanair continued to increase productivity, as did easyJet, helped by further increases in output and the benefit of economies of scale. Norwegian also recorded a substantial improvement in 2005, helping the airline into profitability for the first year (see Figure 31).

Analysis of the EU Air Transport Industry, 2005 63
Figure 29 ATK per employee, LCC, charter and regional airlines, 2004 v 2005
0 200,000 400,000 600,000 800,000 1,000,000 1,200,000
EASYJET
AIR BERLIN
NORWEGIAN
RYANAIR
FlyMe
SkyEurope
TRANSAVIA
Average LCC/Charter
ATKs per employee (000)
20052004
Both Flybe and SkyEurope are relatively small airlines, especially the former. They are unable to achieve the scale economies from labour the other airlines enjoy (Figure 29). SkyEurope can be seen in Figure 30 to be the only airline in this group to benefit from significantly lower wage rates and social costs.
Figure 30 Labour cost per employee, LCC, charter and regional airlines, 2004 v 2005
0 20,000 40,000 60,000 80,000 100,000
EASYJET
AIR BERLIN
NORWEGIAN
RYANAIR
FlyMe
SkyEurope
TRANSAVIA
Average LCC/Charter
US$ per employee
20052004
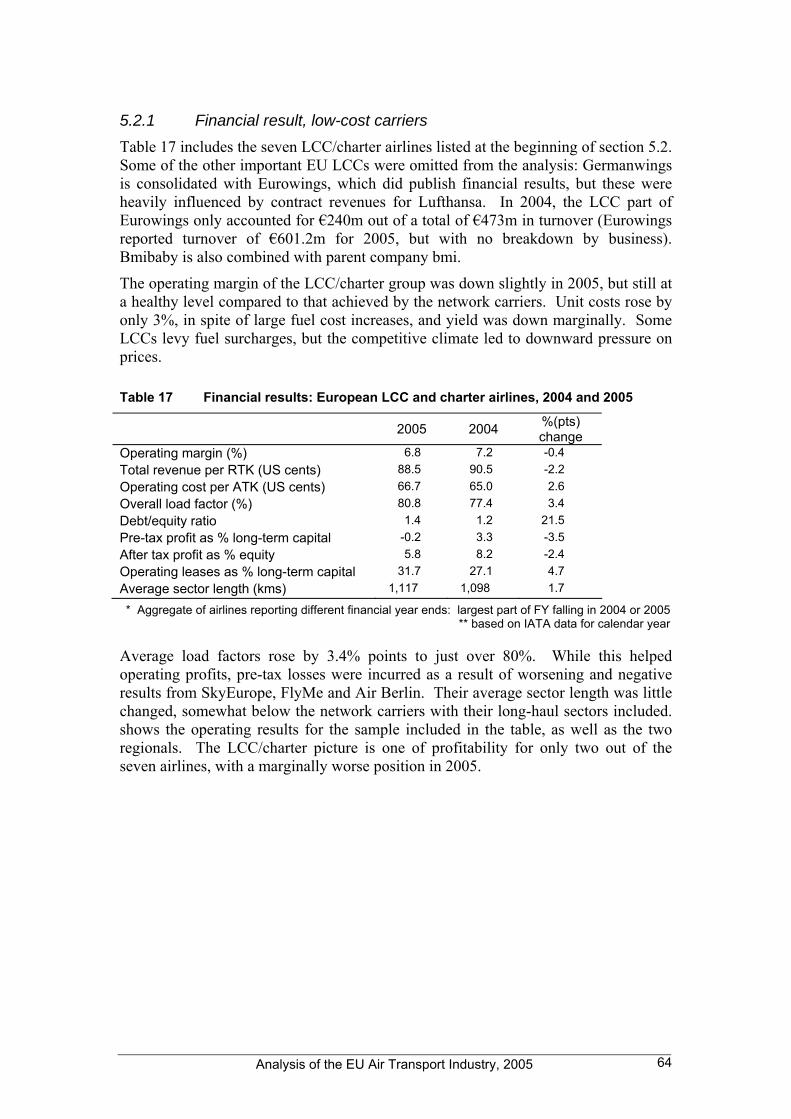
Analysis of the EU Air Transport Industry, 2005 64
5.2.1 Financial result, low-cost carriers Table 17 includes the seven LCC/charter airlines listed at the beginning of section 5.2. Some of the other important EU LCCs were omitted from the analysis: Germanwings is consolidated with Eurowings, which did publish financial results, but these were heavily influenced by contract revenues for Lufthansa. In 2004, the LCC part of Eurowings only accounted for €240m out of a total of €473m in turnover (Eurowings reported turnover of €601.2m for 2005, but with no breakdown by business). Bmibaby is also combined with parent company bmi.
The operating margin of the LCC/charter group was down slightly in 2005, but still at a healthy level compared to that achieved by the network carriers. Unit costs rose by only 3%, in spite of large fuel cost increases, and yield was down marginally. Some LCCs levy fuel surcharges, but the competitive climate led to downward pressure on prices.
Table 17 Financial results: European LCC and charter airlines, 2004 and 2005
2005 2004 %(pts) change
Operating margin (%) 6.8 7.2 -0.4 Total revenue per RTK (US cents) 88.5 90.5 -2.2 Operating cost per ATK (US cents) 66.7 65.0 2.6 Overall load factor (%) 80.8 77.4 3.4 Debt/equity ratio 1.4 1.2 21.5 Pre-tax profit as % long-term capital -0.2 3.3 -3.5 After tax profit as % equity 5.8 8.2 -2.4 Operating leases as % long-term capital 31.7 27.1 4.7 Average sector length (kms) 1,117 1,098 1.7
* Aggregate of airlines reporting different financial year ends: largest part of FY falling in 2004 or 2005 ** based on IATA data for calendar year
Average load factors rose by 3.4% points to just over 80%. While this helped operating profits, pre-tax losses were incurred as a result of worsening and negative results from SkyEurope, FlyMe and Air Berlin. Their average sector length was little changed, somewhat below the network carriers with their long-haul sectors included. shows the operating results for the sample included in the table, as well as the two regionals. The LCC/charter picture is one of profitability for only two out of the seven airlines, with a marginally worse position in 2005.

Analysis of the EU Air Transport Industry, 2005 65
Figure 31 Operating results, LCC and charter airlines
-80.0 -60.0 -40.0 -20.0 0.0 20.0 40.0
AIR NOSTRUM
PORTUGALIA
Average Regional
EASYJET
AIR BERLIN
NORWEGIAN
RYANAIR
FlyMe
SkyEurope
TRANSAVIA
Average LCC/Charter
Operating result as % operating revenue
20042005
Further to the overall analysis of the financial situation of the low cost carrier segment presented above, a number of financial and operational characteristics for 2004 and 2005 are considered for six low cost carriers: easyJet, Ryanair7, FlyMe, Flybe, SkyEurope and Air Berlin.
Figure 32 LCC unit costs, 2004 and 2005
Unit Cost
0.00
2.00
4.00
6.00
8.00
10.00
12.00
14.00
16.00
18.00
20.00
easyJet Ryanair FlyMe FlyBe SkyEurope Air Berlin
Uni
t cos
t per
ASK
US
cent
2004 2005
7 Ryanair’s financial year ends on 31st March each year. In this analysis we have considered Ryanair’s fiscal year that ended 31/3/2006 as being 2005 as 9 months of operation were conducted in 2005.

Analysis of the EU Air Transport Industry, 2005 66
Considering unit costs (operating costs per ASK) it is clear that there is a wide range of cost structures in this group of carriers. Ryanair has the lowest cost (by some degree) and managed to drive down costs further in 2005 at time when fuel price rises applied significant cost pressure on all airlines. At just about 4 cents per ASK Ryanair’s unit is 50% lower than its nearest cost rival, Air Berlin. Air Berlin, SkyEurope and easyJet have similar cost levels but Swedish carrier FlyMe and the UK’s FlyBe have cost levels about double those of the other carriers in the group.
Having a higher cost structure is not problematic if an airline can attain sufficiently high yields to cover the cost structure at sufficiently high loads. While FlyMe’s costs increased to nearly 18 cent per ASK in 2005, it managed to increase yields to 22 cents per RPK. With yields close to their unit cost level Sky Europe also needed to achieve a high load factor to be profitable. Ryanair’s yield fell in 2005 as has been the trend for a number of years, while easyJet’s remained stable. Air Berlin and FlyBe managed to achieve a small rises in yield.
Figure 33 LCC yields, 2004 and 2005
Yield
0.00
5.00
10.00
15.00
20.00
25.00
easyJet Ryanair FlyMe FlyBe SkyEurope Air Berlin
US
cent
per
RPK
2004 2005 There is less obvious differences between the airlines’ average fare levels. While Ryanair’s average fare is nearly half that of FlyBe’s, its costs are a quarter of its rival. The other airlines in the group had average fares in ranging from $80 to $110. This figure suggest that, while the cost structure a low cost carrier has may influence its pricing, the average fares achieved are influenced by market conditions and therefore airlines with higher cost structures will find it more difficult to make profits.

Analysis of the EU Air Transport Industry, 2005 67
Figure 34 LCC average fares, 2004 and 2005
Average Fares (USD)
0.00
20.00
40.00
60.00
80.00
100.00
120.00
140.00
easyJet Ryanair FlyMe FlyBe SkyEurope Air Berlin
US
Dol
lars
2004 2005 This argument is highlighted by Ryanair’s breakeven load factor (BELF) which at 60% is the lowest in this group of carriers. The difference between this figure and its actual load factor at nearly 80% suggest the airline made a significant profit in 2005.
Figure 35 LCC break-even load factors and load factor achieved, 2005
Break Even Load Factor v. Load Factor (2005)
0.0%
20.0%
40.0%
60.0%
80.0%
100.0%
120.0%
easyJet Ryanair FlyMe FlyBe SkyEurope Air Berlin
BELF Load Factor Of the others in the group, only easyJet and Flybe managed to achieve load factors in excess of their breakeven requirements. For easyJet and Air Berlin, not only are their margins very narrow, their BELFs are quite high at about 80%. It is very difficult for

Analysis of the EU Air Transport Industry, 2005 68
a scheduled airline to achieve a load factor much higher than 80% and therefore to increase their profitability levels both airlines would need to drive down their BELF by increasing yields or reducing costs significantly.
In both FlyMe and SkyEurope’s case, the airlines’ BELFs greatly exceed their actual load factors explaining why these carriers made significant losses, clearly shown by operating ratios of 69% and 78% respectively. While FlyBe has managed to turn a loss in 2004 into a small profit in 2005, Air Berlin has moved from a loss to nearly breakeven. Only Ryanair has achieved significant profitability with an operating ratio of 128%.
Figure 36 LCC operating ratios, 2004 and 2005
Operating Ratios, 2004 v. 2005
0%
20%
40%
60%
80%
100%
120%
140%
easyJet Ryanair FlyMe FlyBe SkyEurope Air Berlin
2004 2005 The low cost business model is partially dependent on achieving high aircraft utilisation in short haul markets. By working its aircraft assets hard, a low cost carrier can share its overhead and aircraft ownership costs over large number of hours and customers. Here we see that easyjet and Air Berlin both achieved similar high levels of utilisation. Ryanair’s slightly lower utilisation is caused by flying slightly shorter sectors than easyJet, but it achieves an average 6.2 sectors operation per day for each aircraft it operates while easyJet’s average is 5.8.

Analysis of the EU Air Transport Industry, 2005 69
Figure 37 LCC aircraft utilisation, 2004 and 2005
Aircraft Utilisation
0.0
2.0
4.0
6.0
8.0
10.0
12.0
14.0
easyJet Ryanair FlyBe SkyEurope Air Berlin
Ave
rage
airc
raft
hour
s pe
r day
2004 2005 While FlyBe’s utilisation is a function of its regional service history, SkyEurope’s cost structure could be significantly improved by better utilisation.
Figure 38 LCC capacity (ASK) per employee, 2004 and 2005
ASK per employee
0
2,000
4,000
6,000
8,000
10,000
12,000
14,000
easyJet Ryanair FlyMe FlyBe SkyEurope Air Berlin
ASK
('00
0s) p
er e
mpl
oyee
2004 2005 Looking at the productivity of the employees of a low cost carrier is somewhat problematic as the results will be influenced by the degree of outsourcing practiced by the airline and accurate figures for outsourcing are not easily available. Looking at ASK per employee we see Ryanair and Air Berlin achieving very similar high

Analysis of the EU Air Transport Industry, 2005 70
productivity from their staff. EasyJet’s figure is not as high its two main competitors, but FlyMe, FlyBe and SkyEurope have very poor productivity scores on this metric.
Figure 39 LCC operating revenue per employee, 2004 and 2005
Op revenue per employee
$-
$100,000
$200,000
$300,000
$400,000
$500,000
$600,000
$700,000
easyJet Ryanair FlyMe FlyBe SkyEurope Air Berlin
2004 2005 With their higher yield figures, FlyMe and FlyBe do slightly better when operating revenue per employee is considered, but both are considerably below the levels achieved by the three leading LCCs, each achieving over $600,000 operating revenue per employee.
Figure 40 LCC passengers per employee, 2004 and 2005
Passengers carried per employee
0
2,000
4,000
6,000
8,000
10,000
12,000
easyJet Ryanair FlyMe FlyBe SkyEurope Air Berlin
2004 2005 The impact of Ryanair’s larger aircraft size than its main rivals, easyJet and Air Berlin is clearly seen when considering passengers carried per employee. Here easyJet’s

Analysis of the EU Air Transport Industry, 2005 71
performance is better than Air Berlin’s which operate similar sized aircraft at similar sector lengths due to it’s 7% higher load factor. FlyBe’s performance here is partially due to smaller aircraft size but SkyEurope needs to further improve its employee productivity in future years to have a viable model.
5.2.3 Major Tour Operating Groups Table 18 lists the largest tour operators with charter airline subsidiaries in operation in 2005. There were four changes of name of the carriers owned by the TUI Group during the year. The UK’s largest charter carrier, Britannia Airways, adopted the same name as the Group’s UK-based low cost scheduled operator, Thomsonfly; Hapag-Lloyd changed its name to Hapagfly; HollandExel was renamed Arkefly; and TUI Airlines (Belgium) adopted the name Jetairfly. The policy reflects the trend of tour operating groups towards the adoption of common branding for the various elements of their businesses.
Table 18 Charter airline subsidiaries of Europe’s largest tour operators
TUI Thomas Cook MyTravel First Choice Kuoni Arkefly Condor MyTravel First Choice Edelweiss Britannia Nordic Condor Berlin MyTravel A/S Novair Corsair SunExpress Hapagfly Thomas Cook (Belgium) Jetairfly Thomas Cook (UK) Thomsonfly
First Choice First Choice increased its earnings by 17.2% in 2005 compared to 2004 giving the organisation an operating margin of 4.5% (Table 19). Its turnover rose by 11.3% over the same period. The organisation’s strategy of reducing its dependence on short haul mainstream holiday destinations, developing a better quality long haul product, and acquiring specialist niche market tour operators appears to be proving successful. Table 20 gives details of the company’s share of passengers by length of haul. First Choice Airways operated with a fleet of 30 aircraft in 2005, two fewer than in 2004.
Table 19 Financial performance of First Choice
Earnings* (£m) Turnover (£m) 2002 75.7 2183 2003 90.7 2249 2004 98.6 2318 2005 115.6 2579
* Profit (loss) before tax , exceptional items and goodwill. Source: First Choice Annual Reports.
Table 20 Split of First Choice passengers by length of haul
Short-haul (%) Medium-haul (%) Long-haul (%) Total (000) 2003 44.6 49.9 5.6 2906 2004 41.0 52.8 6.2 2809 2005 36.5 56.4 7.1 2703
Source: First Choice Annual Reports.

Analysis of the EU Air Transport Industry, 2005 72
MyTravel
MyTravel considerably improved its financial performance in 2005, transforming an operating loss of £47m into a profit £52.5m. When exceptional items and goodwill are taken into account the group’s loss was £18.3m, a considerable gain on the 2004 loss of £153.4m. Overall, the tour operating group’s turnover fell by 9.2% compared to 2004 (see Table 21 ). MyTravel reduced the fleet operated by its two in-house airlines in summer 2005 by eight to 36 compared to a year earlier. The numbers of passengers carried by the two carriers in 2005 declined by 31%. Overall, the group’s turnover has fallen by one third since 2002.
Table 21 Financial performance of MyTravel
Earnings (£m) Turnover (£m) 2002 (11.9) 4379 2003 (411.3) 4190 2004 (47.1) 3204 2005 52.5 2910
Source: MyTravel Annual Reports.
TUI The TUI group’s Tourism division increased its earnings marginally by 2% in 2005 compared to 2004 yielding an operating margin of 2.6% (Table 22). Overall, the Tourism division’s turnover rose by 5.8% over the same period, with a total of 21.6 million passengers8 purchasing a TUI tourism product. While earnings increased substantially in the Central Europe division (by 33%) and in the Northern Europe division (by 40%), TUI recorded a loss of €9.6m in its Western division. In 2004, its Western division generated earnings of €39.5m.
Table 22 Financial performance of TUI’s tourism division
Earnings (€m) Turnover (€m) 2002 336 12416 2003 208 12671 2004 353 13319 2005 360 14097
Source: TUI Group Annual Reports.
Thomas Cook The Thomas Cook Group returned to profit in 2005 after incurring losses over the previous four years. In 2005, the group generated earnings of €154.4m compared to a loss of €34.5m the previous year (Table 23). Turnover rose by 2.4% to €7661m. Its improved financial performance was due to a major restructuring involving a continued reduction in staffing (down from 24,628 in 2004 to 23,306 in 2005). The group’s German carrier, Condor, produced earnings of €20.5m in 2005 in sharp contrast to the loss of €38m incurred in 2004.
8 This figure includes passengers flying with low cost subsidiaries, Hapag-Lloyd Express and Thomsonfly.

Analysis of the EU Air Transport Industry, 2005 73
Table 23 Financial performance of Thomas Cook Group
Earnings (€m) Turnover (€m) 2002 (26.8) 8059 2003 (151.0) 7242 2004 (34.5) 7479 2005 154.4 7661
Source: Thomas Cook Group Annual Reports.
Kuoni Kuoni’s earnings decreased by 5.6% in 2005 compared to 2004 yielding an operating margin of 3.3%. Turnover rose by 3% in 2005 compared to a year earlier. Kuoni Group employees averaged 6943 during 2005.
Table 24 Financial performance of Kuoni Group
Earnings* (CHFm) Turnover (CHFm) 2002 120.7 3739 2003 102.4 3295 2004 127.6 3581 2005 120.4 3688
* EBITA Source: Kuoni Group Annual Reports.
5.3 Regional airlines
Only two European regionals published separate accounts: Air Nostrum and Portugalia. Air Nostrum improved their profitability in 2005, while Portugalia’s losses increased (Table 25).
Table 25 Financial results: Air Nostrum and Portugalia
Air Nostrum Portugalia
2005 2004 %(pts) change 2005 2004 %(pts)
change
Operating margin (%) 5.1 6.2 1.1 -17.8 -8.7 9.1
Total revenue per RTK (US cents) 304.0 340.9 -10.8 207.6 214.1 -3.1
Operating cost per ATK (US cents) 172.1 185.6 -7.3 124.6 126.6 -1.6
Overall load factor (%) 59.7 58.0 -1.6 51.0 54.4 3.4
Debt/equity ratio 9.6 11.5 -16.5 n/a 5.2 n/a
Pre-tax profit as % long-term capital 2.6 2.4 -0.2 n/a n/a n/a
After tax profit as % equity 27.7 29.5 1.8 n/a n/a n/a
Operating leases as % long-term capital 66.0 65.7 -0.3 38.2 45.3 7.1
Average sector length (kms) 552.0 534.0 3.4 930.0 883.0 5.3
Source: ICAO financial data for calendar years

Analysis of the EU Air Transport Industry, 2005 74
Air Nostrum yields were down 11% and Portugalia’s by 3%. Competition from LCCs must have put considerable pressure on yields. Load factors are the lowest of the different airline business models, and in Portugalia’s case, declined by 3.4 decimal points. Formerly, higher yields compensated for very low load factors, but the changing mix of traffic makes these more difficult to achieve. Both carriers managed to reduce unit costs, by 7% in the case of Air Nostrum, but by just 1.6% for Portugalia.
Air Nostrum made greater use of aircraft on operating lease than the other airline types. The independent Air Nostrum had a 9.6:1 debt/equity ratio in 2005, a small improvement on 2004 (with operating leases capitalised and included), with Portugalia moving to a negative ratio in 2005 and thus technical insolvency.
Table 26 includes available data on Europe’s top revenue-producing regional airlines in 2005, comparing it with their performance the previous year. CCM and Malmo Aviation are the only ones recording reduced revenues. Malmo’s reduced revenue carried through into an increased net loss, while Alitalia Express also worsened in terms of its net position, albeit on sharply improved revenues (up 23% over 2004).
Table 26 Top-twenty European regionals in terms of revenue (USD million) 2005 Country Revenues Operating margin Net result Net margin Year
$ million change 2005 2004 2005 2004 2005 2004 endEurowings Germany 745 27.3% 2.5% 3.1% 20.4 8.0 2.7% 1.4% Dec-05Air Nostrum (Iberia Regional) Spain 691 13.5% 5.1% 28.1 25.5 4.1% 4.2% Dec-05Régional France 660 Mar-06Lufthansa CityLine Germany 652 3.4% 11.8% 13.8% 86.3 26.1 13.3% 4.1% Dec-05BA Connect UK 640 estimate
Brit Air France 529 9.4% 6.8% 4.8% 16.5 11.5 3.1% 2.3% Mar-06Aegean Airlines Greece 417 20.5% 6.4% 3.9% 25.4 10.5 6.1% 3.0% Dec-05Widerøe's Flyveselskap Norway 362 23.0% 4.1% 4.9% 10.4 11.4 2.9% 3.6% Dec-05Alitalia Express Italy 305 23.0% 0.2% 2.3% -0.8 -0.3 -0.3% -0.1% Dec-05CityJet Ireland 280 9.2% 8.8% 8.8% 19.4 19.2 6.9% 7.5% Mar-06Austrian Arrows Austria 253 18.1% 9.8% 6.5% 13.6 4.5 5.4% 2.1% Dec-05Blue1 Finland 226 30.5% 3.5% -7.0% 8.2 -15.1 3.6% -8.5% Dec-05CCM Airlines France 200 -0.2% 1.2% 6.7 3.2% Mar-06PGA Portugalia Portugal 200 estimate
Binter Canarias Spain 197 10.6% 8.7% 7.7% 11.8 12.6 6.0% 7.0% Dec-05Malmö Aviation Sweden 161 -8.0% -4.5% -6.0% -7.0 -10.8 -4.4% -6.0% Dec-05bmi Regional UK 148 4.9% 14.6% 10.1% 9.8 2.7 6.6% 1.9% Dec-05Air Greenland Greenland 144 3.7% 8.3% 12.5% 6.8 10.8 4.7% 7.7% Dec-05airBaltic Latvia 143 63.8% Dec-05Cimber Air Denmark 124 17.4% Apr-06
Source: Airline Business
5.4 Cargo airline economic performance
Many of Europe’s shorter dedicated air cargo services are operated by trucks rather than aircraft. As there is little data available on airport to airport truck services, this section focuses on air services
Airline Business (November 2006) reported that air cargo revenues earned by the top-100 cargo carriers in 2005 were around US$68 billion. In this total, revenues for the all-cargo airlines were US$30 billion in 2005, of which $21 billion was accounted for by one carrier, FedEx. The profitability of cargo carried on passenger flights depends on the method of cost allocation, and IATA no longer publishes these estimates.
The all-cargo airlines shown in Figure 41 made a combined profit of US$740m in 2005, or a margin on revenues of 5.4% (versus 5.2% in 2004). Their net profit was

Analysis of the EU Air Transport Industry, 2005 75
US$222m, or 1.6% of revenues (versus 2.0% in 2004). The only European all-cargo carrier, Cargolux, made an operating profit of US$205m in 2005, with a margin of 14.4%, and a net margin of 6.2%. The largest all-cargo carriers (in terms of total revenues) in 2005 are shown in Figure 41.
FedEx and UPS have been excluded from the above figure because they do not report the profitability of their air cargo operations, only their total operations including door-to-door products. Together they generated US$25 billion of air cargo revenue, compared with the total revenue of the sample shown in Figure 41 of $14 billion, although a large part of their air cargo turnover is from domestic US operations.
Lufthansa, Singapore Airlines, SAS and Varig have all formed air cargo subsidiaries, entirely separate from their air passenger operations. However, in terms of turnover, none of these approaches the size of FedEx. UPS is also significantly smaller, but has a much larger ground transport operation than FedEx.
Lufthansa’s cargo subsidiary made an operating profit of €134m in 2005 (an operating margin of 3.9%) much improved from the €42m profit in 2004. SAS’s cargo subsidiary made an operating profit of US$18m in 2005 (an operating margin of 4%) compared to a profit of $10m in 2004. However, it should be noted that the revenues and margins of these subsidiaries are entirely dependent on the rates for lower deck capacity agreed with their passenger divisions.
Figure 41 Top 10 all-cargo airlines worldwide in 2005 (and % change over 2004)
-2.0 0.0 2.0 4.0 6.0 8.0 10.0 12.0 14.0 16.0 18.0
LH Cargo
SAS Cargo
AF Cargo
Cargolux
SQ Cargo
Nippon Cargo
ABX Airlines
Varig Log
Total
Operating margin (%)
2004/052005/06
Source: ATI and airline annual reports and accounts
In addition to the above airlines, the largest cargo revenues generated by European passenger carriers are Air France-KLM with revenues in 2005 of US$3,498m, followed some way behind by British Airways with $884m, Martinair with $874m (the airline also operates passenger charters), and Alitalia with $587m. AF-KLM’s cargo revenues only accounted for 13% of total group operating revenues, with 6% for British Airways, 63% for Martinair and 10% for Alitalia.

Analysis of the EU Air Transport Industry, 2005 76
Figure 42 shows that AEA cargo yields have firmed since 2001, after a period of decline. These are expressed in US dollars, and the dollar weakness has been a major factor in this more recent trend. Transatlantic yields are the lowest with the North Atlantic and the South Atlantic both just over 24 US cents per tonne-km in 2005. The Far East yield was 33 cents/tonne-km and the intra-European yield 77 cents, reflecting the much shorter average sector length. There is likely to be more integrator competition on the North Atlantic, with trucks feeding hubs on both sides. Integrators tend to siphon off some of the higher yielding traffic.
If yields in 2005 are compared with 2004, the North Atlantic routes recorded 3.5% increase in current terms, the South Atlantic 1.1%, Far East 7.5% and Europe a decline of 0.4%.
Little data is released on the operating costs of carrying air cargo on both network carriers and integrators. The only major EU all-cargo carrier, Cargolux, provided a cost breakdown, reporting an increase in the share of fuel in total operating costs rising from 29.7% in 2004 to 38.1% in 2005, well above the ICAO average for 2005 of around 24%. Personnel costs were down almost 2.1% points to 13.0%, while trucking costs fell from 8.2% to 7.0%. The average cost per employee rose by 2% to US$122,400 in 2005. In 2005, the airline spent $101m on aircraft rentals, of which 68% (58% in 2004) was on ACMI leases, 23% being aircraft on operating leases (only 12% in 2004), and 11% block space rentals (30% in 2004). Depreciation accounted for a further $78m of aircraft expenses in 2005 ($89m in 2004).
Figure 42 Index of AEA airline air cargo yields by region
60
70
80
90
100
110
120
130
1991 1992 1993 1994 1995 1996 1997 1998 1999 2000 2001 2002 2003 2004 2005
US
$ In
dex
(199
1 =
100)
North Atlantic South Atlantic Europe/Far East Geographical Europe
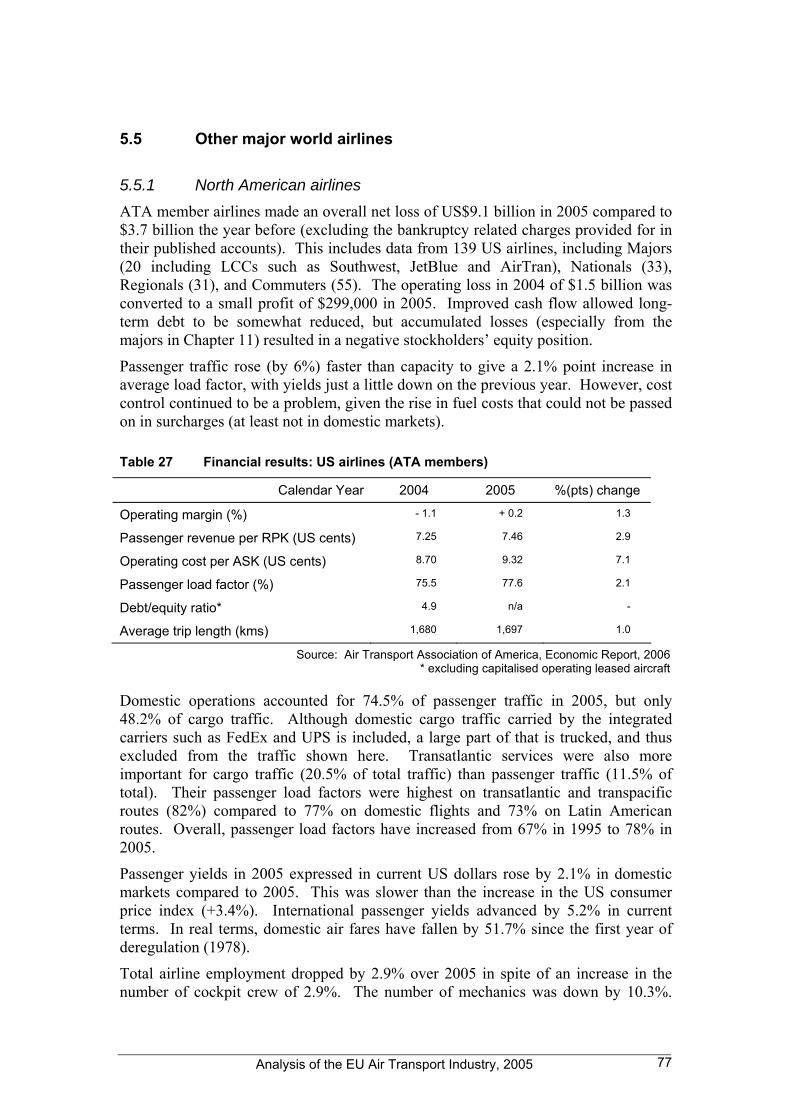
Analysis of the EU Air Transport Industry, 2005 77
5.5 Other major world airlines
5.5.1 North American airlines ATA member airlines made an overall net loss of US$9.1 billion in 2005 compared to $3.7 billion the year before (excluding the bankruptcy related charges provided for in their published accounts). This includes data from 139 US airlines, including Majors (20 including LCCs such as Southwest, JetBlue and AirTran), Nationals (33), Regionals (31), and Commuters (55). The operating loss in 2004 of $1.5 billion was converted to a small profit of $299,000 in 2005. Improved cash flow allowed long-term debt to be somewhat reduced, but accumulated losses (especially from the majors in Chapter 11) resulted in a negative stockholders’ equity position.
Passenger traffic rose (by 6%) faster than capacity to give a 2.1% point increase in average load factor, with yields just a little down on the previous year. However, cost control continued to be a problem, given the rise in fuel costs that could not be passed on in surcharges (at least not in domestic markets).
Table 27 Financial results: US airlines (ATA members)
Calendar Year 2004 2005 %(pts) change
Operating margin (%) - 1.1 + 0.2 1.3
Passenger revenue per RPK (US cents) 7.25 7.46 2.9
Operating cost per ASK (US cents) 8.70 9.32 7.1
Passenger load factor (%) 75.5 77.6 2.1
Debt/equity ratio* 4.9 n/a -
Average trip length (kms) 1,680 1,697 1.0
Source: Air Transport Association of America, Economic Report, 2006 * excluding capitalised operating leased aircraft
Domestic operations accounted for 74.5% of passenger traffic in 2005, but only 48.2% of cargo traffic. Although domestic cargo traffic carried by the integrated carriers such as FedEx and UPS is included, a large part of that is trucked, and thus excluded from the traffic shown here. Transatlantic services were also more important for cargo traffic (20.5% of total traffic) than passenger traffic (11.5% of total). Their passenger load factors were highest on transatlantic and transpacific routes (82%) compared to 77% on domestic flights and 73% on Latin American routes. Overall, passenger load factors have increased from 67% in 1995 to 78% in 2005.
Passenger yields in 2005 expressed in current US dollars rose by 2.1% in domestic markets compared to 2005. This was slower than the increase in the US consumer price index (+3.4%). International passenger yields advanced by 5.2% in current terms. In real terms, domestic air fares have fallen by 51.7% since the first year of deregulation (1978).
Total airline employment dropped by 2.9% over 2005 in spite of an increase in the number of cockpit crew of 2.9%. The number of mechanics was down by 10.3%.

Analysis of the EU Air Transport Industry, 2005 78
The average compensation fell by 6.1% to $73,055, with benefits and pension contributions down by 8.3%.
5.5.2 Asia/Pacific airlines Table 28 shows financial results for seventeen member airlines of the Association of Asia Pacific Airlines for both 2004/05 and 2005/06 (year to end March). The two members that did not report were Dragonair and Air New Zealand, and JAL provided data only for its international operations. The financial year was to end of March.
Net income for the seventeen member airlines of the Association of Asia Pacific Airlines plummeted 69 per cent to $1.1 billion for the 2005-06 financial year. Meanwhile, operating costs surged 15.9 per cent, seven points above the global average. The main money-drainer was fuel costs, which jumped 43 per cent to $18.8bn
The results show the rebound from the year 2003/04 which was severely affected by SARS. Strong traffic growth pushed up the passenger load factor by 1.6 points (in spite of capacity being up by 10.5%) and helped the yield to increase by 7.8%. With costs up by 6.5%, helped by a rise of 38% in average fuel prices, the operating margin improved significantly by 3.5% points to a reasonably good level by international airline standards.
Table 28 Financial results: Asia/Pacific airlines (AAPA members)
Calendar Year 2005/06 2004/05 %(pts) change Operating margin (%) 2.2 5.8 - 3.6 Total revenue per RTK (US cents) 69.2 66.1 4.7 Operating cost per ATK (US cents) 46.1 42.6 8.3 Overall load factor (%) 68.2 68.4 - 0.2 Breakeven load factor (%) 66.7 64.4 2.3 Debt/equity ratio* 1.0 1.3 - 12.1 Average trip length (kms) 2,079 2,039 2.0
Source: Association of Asia pacific Airlines, Annual Report, 2005/06 * based on total long-term liabilities (excluding capitalised operating leased aircraft)
Total employment by the airlines was roughly unchanged in 2005/06 at 209,300 employees, with the average pay rising by 4.1% to just over US$52,800 and labour costs per ATK up by only 1.5%. However, fuel costs rose from 21% of total operating costs to 26% in 2005/06.
5.5.3 South American airlines In Brazil, Varig faced increasing competition both domestically from TAM and Gol and internationally, and had recorded large net losses in every year since 2001. As a result it filed for bankruptcy in 2005 under new laws that gave it 240 days to reorganise. By the end of 2005, it was still operating under administration and creditors were pressing for court action. It produced an operating loss of US$40.6m in 2005 on turnover of $2,810m, with a large net loss of $612m.

Analysis of the EU Air Transport Industry, 2005 79
Also in Brazil, the LCC Gol produced an operating profit of US$ 257m in the year to end December 2005, compared to $197m the year before. Its net margin was maintained at a very healthy level of just over 19% of sales ($1.1 billion in 2005).
Varig’s other competitor, TAM Linhas Aereas made an operating profit of US$177m in 2005, well up from $101m in 2004, but its 2005 net margin was only 3.3% on sales of $2.3 billion.
In Argentina, the major national carrier reported both operating and net profits for 2004, but did not release figures for 2005, even though some time had elapsed since the end of their financial year.
The national carrier of Chile, LAN Airlines made an operating profit of $45m on turnover of $750m in 2005, with a net profit of $32m. The airline also operated subsidiary airlines in Peru and Ecuador.
5.5.4 Airlines from other regions Russia extends from Europe to Asia and thus does not fit the categories above, neither do its airlines report to regional airline associations. However, Aeroflot is in the top fifty airlines in terms of international passenger traffic carried. In 2005, Aeroflot’s turnover was US$2,540m, up by 18% compared to 2004. Its operating profit was $297m, with a margin on revenues of 11.7%. Its net income was $190m giving it one of the industry’s highest net margins of 7.5%. Profits both at the operating and net level were well up on 2004 levels. None of the other larger Russian airlines report profits, and do not approach Aeroflot in size (eg Transaero having only $349m of total revenue in 2005, up by 34% over 2004).
Emirates Airlines’ operating revenues were up by 27% in the financial year to end March 2006, producing an operating margin of 11.5% (down from 14.4% the previous year). Its net margin was 10.7% in 2005/06. Unit costs were up by 9.9%, and average yields by 5.2%, with a small rise in overall load factor from 65.1% in 2004/05 to 65.8% in the latest year. The average number of employees was 17,296 in 2005/06, up by 9% from the previous year, resulting in a sizeable increase in staff productivity.
The largest airline in Africa, South African Airways, reported an operating profit of R414m in 2005/06, down by 37% compared to 2004/05. The operating margin declined from 3.8% in 2004/05 to 2.2% in 2005/06 on total revenues of R19,175m (US$3 billion). Net profit was R301m (US$49m) for the airline, although the group made only R65m (US$10m) as a result of the loss from a discontinued operation (the 49% stake in Air Tanzania). The airline was still technically insolvent, with negative shareholders’ equity. The go-ahead was given for SAA to start its own LCC.
5.6 Aviation fuel
Average spot fuel price in 2005 was 168.1 US cents per gallon, an increase of 42.9% compared to the previous year. The range over the year also grew, widening to a high of 223.2 US cents per gallon and a low of 118.8 cents (Table 29).
The average fuel cost per gallon paid by airlines depends on market prices, individual contracts and gains or losses from hedging activities. Individual contracts tend to be similar, with some discounts for volume and variations depending on transport costs from the nearest refinery.

Analysis of the EU Air Transport Industry, 2005 80
The share of fuel costs in total operating costs reported by the world’s scheduled airlines by ICAO rose from13.6% in 2003 to 17.2% in 2004. The share advanced again in 2005 to a preliminary estimate of 23-24%, still below the 1981 high of 29.1%.
Table 29 Average aviation fuel price trends
US cents per US gallon*
Average High Low Standard deviation
2000 86.1 107.6 72.3 21.7 2001 71.5 81.9 50.3 16.1 2002 68.3 84.6 53.5 15.9 2003 82.7 104.9 69.6 17.8 2004 117.6 156.8 92.1 35.4 2005 168.1 223.2 118.8 43.4
* from Lufthansa cargo website: average of the principal spot markets (Rotterdam, Mediterranean, Far East Singapore, US-Gulf, and US westcoast)
Figure 43 shows the average aviation fuel price and the margin over crude oil, commonly called the crack spread. This has increased sharply since 2002, with the shortage of jet refining capacity and strong demand for the other middle distillates which are produced in much larger volumes. Some diversion to military supplies was also evident.
Figure 43 Average aviation fuel price and margin over crude oil, 1989-2005
0.0
10.0
20.0
30.0
40.0
50.0
60.0
70.0
1989 1990 1991 1992 1993 1994 1995 1996 1997 1998 1999 2000 2001 2002 2003 2004 2005
Prem
ium
(US
cent
s/ga
llon)
0.0
20.0
40.0
60.0
80.0
100.0
120.0
140.0
160.0
180.0
200.0
Pric
e (U
S ce
nts/
gallo
n)
Refiner margin (l-h axis) Jet kerosene end-user price (r-h axis)
Source: US EIA
Table 30 shows the extent and type of hedging activity for the larger non-US airlines that provide the information. Of the US majors, only Southwest, Delta and Continental had any significant hedge contracts for the year 2005.
Some of the large increases in fuel costs were passed on to the consumer in the form of fuel surcharges. These are differentiated according to length of haul by many airlines.

Analysis of the EU Air Transport Industry, 2005 81
Table 30 FY2005/06 fuel needs hedged at YE2004/05: European airlines
%
hedged
Average price
(US$/barrel)
Value $m** Products Instruments
British Airways (2004/05) 418 n/a Collars & swaps
January to March 2005 80 32.00
April to June 2005 60 36.00
July to September 2005 50 37.00
October to December 05 50 37.00
Air France (2004/05) 1,528 n/a Options & swaps
Year 2005/06 81 n/a
Lufthansa (2004) Options & other
Year 2005 70 41.70*
Iberia (2004) 1st half 05 n/a 37.50 Jet fuel Swaps
* on only 35% of annual needs
** market value of fuel hedge derivatives outstanding at financial year end Source: Airline annual reports and websites.
The Association of European Airlines members reported fuel costs for their scheduled services to have accounted for 20% of total operating costs in 2005, up from 12% in 2003. Table 31 shows that there were increases in the fuel surcharges during 2005, first in March/April, next in June/July and finally in September.
Table 31 Fuel surcharges announced by major EU airlines in 2005 (€)
Long-haul BA LH AF IB January 14 17 25 15 March 23 April 27 33 34 June 36 July 37 37 September 44 52 43 34 December 44 52 43 34 Short/medium-haul BA LH AF IB January 6 7 6 7 March 9 April 7 8 15 June 12 July 9 10 September 12 12 12 15 December 12 12 12 15
Source: ABN Amro and airline press releases
Over the year as a whole they were up by between €18 and €35 per long-haul sector, and between €5-8 for a short/medium-haul sector, at least for the major EU carriers.

Analysis of the EU Air Transport Industry, 2005 82
According to estimates from ABN Amro (Airlines & Airports, 5 October 2005), passenger fuel surcharges for British Airways will be 4.6% of total passenger revenues for the financial year ending 31 March 2006. For the same year, Air France-KLM’s passenger surcharges will amount to 7.3%, and for the year ending 31 December 2005 Lufthansa’s percentage will be 5.5% and Iberia’s 9.3%.
Many LCCs now also levy fuel surcharges, some of them recouping total fuel costs rather than the increases incurred from a baseline. However, neither easyJet nor Ryanair do, although the surcharges imposed by their competitors allow them to adjust their prices accordingly.
5.7 European airline financing
Table 32 shows the principal financial flows for the largest EU airlines in 2005. All the network airlines were able to finance fixed asset capital investment from internal cash flows. British Airways continued to impose strict controls on capital spending, using cash to pay off loans and lower the debt/equity ratio. Both the LCCs had relatively large numbers of aircraft deliveries to finance: easyJet did this from internal funds and sale/leasebacks. Ryanair used ExIm Bank guaranteed loans for most of its deliveries, with some sale/leasebacks.
Table 32 Cash flow summary for major EU airlines, 2005/06
€ million AF-KLM BA Iberia Lufthansa SAS easyJet Ryanair TOTAL
FY ending: 31/3/06 31/3/06 31/12/05 31/12/05 31/12/05 30/0/05 31/3/06
Cash flow from operations 2,656 1,968 134 2,381 191 247 511 8,089
Purchase of fixed assets -2,544 -416 -36 -1,122 -178 -361 -632 -5,289
Acquisitions of subsidiaries/associates -58 -10 -79 -488 19 0 0 -617
Disposals of subsidiaries/associates 852 1 821 368 67 0 0 1,292
Sale of fixed assets 227 13 36 158 238 202 2 876
New equity issued 0 0 0 0 3 5 8
New debt/loans 1,410 0 14 287 -265 213 550 2,209
% new fixed assets from cash flow 104 473 372 212 107 68 81 100
Exchange rate €/local currency 1.00 1.47 1.00 1.00 9.28 1.46 1.00
Source: Airline annual reports for 2005/06
Air France-KLM has had the largest investment programme of the sample of airlines in the above table (which included taking a 23.4% stake in the consortium making the bid for Amadeus). However, these were financed entirely from cash flow, further supported by €227m from the sale of property, plant and equipment, and €817m from its sale of its stake in Amadeus in July 2005.
Lufthansa also generated cash from sale of its Amadeus shares, as did Iberia (which also took 11.68% of the company that bought out Amadeus), but both airlines had

Analysis of the EU Air Transport Industry, 2005 83
their investments well covered by cash flow. SAS generated cash from sale and leaseback of aircraft, but had very modest purchases of fixed assets.
Between 2003 and 2005 there was a greater financing role from banks and leasing companies for the world’s airlines as a whole (Figure 44). This was helped by the gradual recovery of the industry, and coupled with a small increase in cash flow and new equity sources. Direct support from manufacturers is only a last resort, and as the airlines’ fortunes picked up, this source declined sharply. Export credit support was also well down in 2005.
Figure 44 Sources of aircraft financing for Boeing deliveries, 2003 and 2005
0 5 10 15 20 25 30 35 40
Manufacturers
Export credits
Cash/other sources
Bank debt
Leasing companies
Percent of total
20052003
Source: Boeing in Airline Fleet & Network Management, May/June 2006

Analysis of the EU Air Transport Industry, 2005 84
SECTION 6
AIRPORTS
6.1 GENERAL TRAFFIC TRENDS ..................................................................85
6.2 TRAFFIC GROWTH AT EUROPEAN AIRPORTS .........................................86
6.3 DEVELOPMENTS IN AIRPORT OWNERSHIP .............................................88
6.4 REGULATION / GOVERNMENT POLICY...................................................92
6.5 FINANCIAL PERFORMANCE...................................................................92
6.6 KEY DEVELOPMENTS EEA TOP TEN AIRPORT OPERATORS....................95
6.7 DEPARTURE DELAYS ............................................................................98

Analysis of the EU Air Transport Industry, 2005 85
6. Airports
6.1 General traffic trends
ACI airports recorded strong, world-wide growth in 2005. Passenger throughput increased by 5.5%. Reflecting the regional growth reported in other sections of this report, Asia Pacific airports were again in the lead, showing higher than average growth comfortable ahead of increases recorded in European and North American passenger demand (Figure 45). European airports posted significant increases in traffic, somewhat ahead of North America.
Cargo traffic performance recorded the same ranking among the three regions. The corresponding increase in European cargo traffic, at 2.7%, over two percentage point higher than North America’s growth, but well below the 5.8% recorded by Asia Pacific airports.
Figure 45 ACI airports by region, 2005 traffic change over 2004
7.0%
5.8%5.1%
2.7%
4.0%
0.3%
Passengers Freight
Asia Pacific Europe North America
Figure 46 shows the place of European airports within the world’s twenty busiest. US airports dominate the group in terms of passenger traffic. Europe’s busiest airports, London Heathrow, Paris Charles de Gaulle and Frankfurt, grew in terms of annual passenger throughput by a similar rate to that achieved at some of the major US airports, although there were some striking differences.
Among the US airports, Dallas Fort Worth recorded an overall fall in passenger numbers compared to Atlanta’s almost 3% growth, and on the other side of the Atlantic, London Heathrow managed to increase passenger throughput by less than one percent; Paris Charles de Gaulle achieved 5% growth and Madrid was, again, Europe’s fastest growing airport in the world’s top twenty, increasing its passenger traffic in 2005 by 8.4%.

Analysis of the EU Air Transport Industry, 2005 86
However, the two fastest growing major airports in 2005 were in the Asian region. Hong Kong posted an annual growth rates just under ten percent, while Beijing reflected China’s expanding economy, reaching a 17.5% increase in passengers over 2004, which itself was a massive 50% above 2003 levels.
Figure 46 Eurpopean airports in the world’s top twenty (by passengers), 2005
0
20,000,000
40,000,000
60,000,000
80,000,000
Atla
nta
ATL
Chi
cago
OR
D
Lond
on L
HR
Toky
o H
ND
Los
Ang
eles
LA
X
Dal
las
DFW
Par
is C
DG
Fran
kfur
t FR
A
Am
ster
dam
AM
S
Las
Veg
as L
AS
Den
ver D
EN
Mad
rid M
AD
New
Yor
k JF
K
Pho
enix
PH
X
Bei
jing
PE
K
Hon
g K
ong
HK
G
Hou
ston
IAH
Ban
gkok
BK
K
Min
neap
olis
MS
P
Det
roit
DTW
-5%
5%
15%
25%
ATL
OR
D
LHR
HN
D
LAX
DFW
CD
G
FRA
AM
S
LAS
DE
N
MA
D
JFK
PH
X
PE
K
HK
G
IAH
BK
K
MS
P
DTW
% g
row
th o
ver 2
004
Source: ACI
6.2 Traffic growth at European airports
Average year-on-year growth of passenger traffic in 2005 at Europe’s top twenty airports was 4.6%. As seen in the preceding section, this is below growth rates achieved by a number of airports in the Asia Pacific region. However, the average masks very high growth at a number of airports and quite disappointing performance in passenger terms at the continent’s largest hubs. While Barcelona and Madrid both recorded annual increases in passenger traffic of over 8%, London’s capacity-constrained Heathrow maintained its position as Europe’s busiest airport by a comfortable margin, but managed an increase passengers numbers by half a million, representing just 0.8% traffic growth.

Analysis of the EU Air Transport Industry, 2005 87
Figure 47 Passenger traffic at the top 20 ACI Europe airports, 2005
0
10,000,000
20,000,000
30,000,000
40,000,000
50,000,000
60,000,000
70,000,000Lo
ndon
LH
R
Par
is C
DG
Fran
kfur
t FR
A
Am
ster
dam
AM
S
Mad
rid M
AD
Lond
on L
GW
Rom
e FC
O
Mun
ich
MU
C
Bar
celo
na B
CN
Par
is O
RY
Man
ches
ter M
AN
Lond
on S
TN
Pal
ma
PM
I
Cop
enha
gen
CP
H
Mila
n M
XP
Dub
lin D
UB
Zuric
h ZR
H
Sto
ckho
lm A
RN
Bru
ssel
s B
RU
Osl
o O
SL
0%
2%
4%
6%
8%
10%
12%
LHR
CD
G
FRA
AM
S
MA
D
LGW
FCO
MU
C
BC
N
OR
Y
MA
N
STN
PM
I
CP
H
MX
P
DU
B
ZRH
AR
N
BR
U
OS
L
grow
th o
ver 2
004
Source: ACI Europe
There were significant levels of growth in passenger traffic at many of Europe’s smaller airports.
The accession states once more figured among the airports returning the highest growth statistics. At Riga traffic increased by 77% and by almost 50% at Bratislava, Vilnius grew by close to 30% and Budapest reported growth of 25%. Expansion in traffic from Bratislava and the two Baltic state airports was from a relatively low base, and quite clearly the activities of low-cost carriers were essential to fuelling, and maintaining this growth (Figure 48).

Analysis of the EU Air Transport Industry, 2005 88
Figure 48 Passenger traffic for a selection of smaller European airports, 2005
0
3,000,000
6,000,000
9,000,000
12,000,000
15,000,000
18,000,000
21,000,000
Ath
ens
ATH
Lisb
on L
IS
Hel
sink
i HE
L
Pra
gue
PR
G
Bud
apes
tB
UD
War
saw
W
AW
Larn
aca
LCA
Buc
hare
stO
TP
Mal
ta M
LA
Rig
a R
IX
Sof
ia
Kef
lavi
k K
EF
Luxe
mbo
urg
LUX
Zagr
eb Z
AG
Talli
nn T
LL
Bra
tisla
vaB
TS
Viln
ius
VN
O
Ljub
ljana
LJU
5% 5% 3%
11%
25%
16% 15%
0%
16%
11%
3%
10%
40%
48%
29%
16%
4.2%
0%
10%
20%
30%
40%
50%
ATH LI
S
HE
L
PR
G
BU
D
WA
W
LCA
OTP
MLA RIX
KE
F
LUX
ZAG
TLL
BTS
VN
O
LJU
grow
th o
ver 2
004
77%
Source: ACI Europe, ATI and airport websites
6.3 Developments in airport ownership
The top twenty airport authorities (operating revenue) in the European Economic Area are listed in Table 33. Also included are the top two airport authorities from the group of accession states. The table also lists the core airports (fully owned) associated with these entities. Some airport authorities such as Unique Zurich Airport and Flughafen Wien are responsible for managing one airport while there are several examples of airport authorities managing networks of airports such as Norway’s Avinor and Spain’s Aena.

Analysis of the EU Air Transport Industry, 2005 89
Table 33 Top twenty EEA airport operators and top two from accession states, 2005
Core airports
BAA (UK) Heathrow, Gatwick, Stansted, Aberdeen, Edinburgh, Glasgow, South’ton
Aena (Spain) Madrid, Barcelona and 44 other Spanish airports
Fraport (Germany) Frankfurt Main
Aéroports de Paris (France) Paris Charles de Gaulle, Paris Orly, Paris Le Bourget and 10 airfields
Schiphol Group (Netherlands) Amsterdam, Rotterdam, Lelystad
Flughafen München (Germany) Munich
Avinor (Norway) Oslo, Bergen and 44 other Norwegian airports
Luftfarstverket (Sweden) Stockholm Arlanda, Gothenburg & 17 other Swedish airports
Aeroporti di Roma (Italy) Rome Fiumicino, Rome Ciampino
Manchester Airports Group (UK) Manchester, East Midlands, Bournemouth, Humberside
Dublin Airport Auth’y (Ireland) Dublin, Cork, Shannon
SEA Aeroporti di Milano (Italy) Milan Linate, Milan Malpensa
Flughafen Wien (Austria) Vienna
Unique Zurich Airport (Switz’d) Zurich
Copenhagen Airport (Denmark) Copenhagen Kastrup, Roskilde
Athens International (Greece) Athens
BIAC (Brussels) Brussels
Flughafen Düsseldorf (Germany) Düsseldorf
ANA Portugal Lisbon, Porto, Faro, Horta, Ponta Delgada, Santa Maria, Flores
CAA Finland (Finland) Helsinki and 25 other Finnish Airports
Polish Airports State Ent (Poland) Warsaw, Rzeszów, Zielona
Prague Airport* (Czech Rep) Prague
* Formerly Czech Airports Authority
Table 34 lists the proportion of share capital held by the private sector, national government, regional government and municipal authorities in 2005. Of the 22 airports included in the list, only one is 100% privately-owned while the equity of another nine airport authorities is shared between the private and public sector interests. The remaining twelve airport operators are wholly owned by public sector interests whether it be the national government, regional authority or municipal council.
In 2005 the German Federal government sold its 18.3% stake in Fraport. By the end of the year 47.7% of shares in Fraport were held by private interests including a 5% stake held by Lufthansa. Fraport itself finally divested itself of its 30% share in the company set up to build and operate the new international passenger terminal in Manila. In the same year Fraport secured the concession to manage Cairo airport in Egypt. The UK’s BAA, which withdrew from management of Oman’s airports in 2004, added to its portfolio of overseas airport interests in 2005 by securing a 75% stake in Budapest Airport. Macquarie, which has equity holdings in several EU airports, purchased 11.3% of Copenhagen Airport – this stake was subsequently raised to 51% in December 2005. Macquarie also secured Aeroporti di Roma’s shares in the Airports Authority of South Africa. Copenhagen airport was also active during 2005 in airport procurement activity raising its stake in Mexican airports operator

Analysis of the EU Air Transport Industry, 2005 90
ASUR from 36% to 49% in addition to securing the tender to operate Bulgarian airports Bourgas and Varna. Also in 2005, Czech Airports Authority transferred two regional airports to local authority control leaving it with responsibility for managing only Prague.
There were no significant airport privatisations in 2005. However, during the year, the French government continued with its preparations for the part-privatisation of Aéroports de Paris while the Dutch Parliament’s second chamber approved a Government bill to partially privatise the Schiphol Group.
Of the 22 airport operators included in Table 34, twelve have established overseas operations, taking advantage of increased opportunities afforded by the proliferation of airport privatisations since the mid-1990s. These overseas interests are either in the form of equity stakes, concession agreements or management contracts.
Table 34 Share ownership structure for major European airports, 2005
Private Sector
National Government
Regional Government
Municipal
BAA 100
Aena 100
Fraport 41.42 6.58 31.70 20.30
Aéroports de Paris 100.00
Schiphol Group 75.80 24.20
Flughafen München 26.00 51.00 23.00
Avinor 100
Luftfarstverket 100
Aeroporti di Roma 96.99 1.58 1.43
Manchester Airports Group 100
Dublin Airport Authority 100
SEA Aeroporti di Milano 0.88 14.56 84.56
Flughafen Wien 60.00 20.00 20.00
Unique Zurich Airport 47.84 46.76 5.40
Copenhagen Airport 60.80 39.20
Athens International 45.00 55.00
BIAC 70.00 30.00
Flughafen Düsseldorf 50.00 50.00
ANA Portugal 100
CAA Finland 100
Polish Airports State Enterprise 100
Prague Airport (Czech Rep) 100
Source: complied from airport annual reports and other sources
Equity stakes are usually in the form of minority shareholding in consortia that include other investors. Also fairly common is the retention of some degree of government control through minority equity stakes in partially privatised airports (e.g. Brussels) or through the establishment of long-term concession agreements with airport investors (e.g. London Luton airport).

Analysis of the EU Air Transport Industry, 2005 91
Table 35 Interests in other airports by major European airport, 2005
North America Europe
Middle-East / Africa
Asia South & Central America
Australasia
BAA
Baltimore Pittsburgh Indianapolis Boston
Naples Budapest
Australia PacPerth Melbourne Launceston N Territories
Aena
GAPA Mexico Cartagena Calli Barranquilla
Fraport Hahn, Hannover Antalya
Lima Brisbane
Aéroports de Paris Liege
Beijing Phnom Penh Siem Reap
Schiphol Group JFK (IAT) Eindhoven Aruba Brisbane Flughafen München No other airport interests Avinor No other airport interests Luftfarstverket No other airport interests
Aeroporti di Roma Genova SAC
Manchester Airports Gr No other airport interests
Dublin Airport Authority BirminghamDusseldorf Hamburg
SEA Aeroporti di Milano
Naples Orio al SerioRimini
Argentina Guayaquil
Flughafen Wien
Istanbul Malta Riga Cuidad Real
Tehran
Unique Zurich Airport Bangalore
Porlamar Calama La Serena Puerto Mont
Copenhagen Airport Newcastle Bourgas Varna
Hainan ASURMexico
Athens International No other airport interests BIAC No other airport interests Flughafen Düsseldorf No other airport interests ANA Portugal ANAM ADA CAA Finland No other airport interests
Polish Airports State Enterprise
Bydgoszcz Gdańsk Katowice Kraków Poznań Szczecin Szczytno-Szymany Wrocław
Prague Airport No other airport interests

Analysis of the EU Air Transport Industry, 2005 92
6.4 Regulation / government policy
The European Commission issued guidelines on how airports and regional governments should offer financial support to airlines starting new routes. These new guidelines are aimed at airports handling less than five million passengers per year and include limiting the aid timeframe to three years and ensuring that aid diminishes over the period and is linked to start-up costs.
The European Commission withdrew €12.8m in aid awarded to Athens International Airport after it broke regulations governing publicity and advertising. These regulations relate to the failure to install temporary billboards showing the European Commission as co-financers of a development project at the airport.
The Commission approved a regional airport financing scheme made available by the German Government. The programme limits aid to the development of infrastructure at regional airports.
The Commission supported a request by the UK Office of Fair Trading to refer the proposed acquisition of Exeter Airport by Macquarie and Ferrovial to the UK Competition Authority. The request was made on the basis that the proposed transaction could adversely affect airport competition in the South-West of England in light of the fact that both buyers hold existing equity interests in nearby Bristol Airport.
The Dutch Ministry of Finance announced that public floatation was its preferred mode of selling its 75.8% share in the Schiphol Group and that the country’s second chamber had approved a bill granting the government legal power to sell a proportion of its equity stake in the company.
The French Ministry of Transport announced that it was going to proceed with the part-privatisation of Aéroports de Paris in 2006.
The Finnish Government announced that with effect from January 1 2006 the regulatory functions of CAA Finland would be transferred to a new civil aviation authority. The responsibility for managing Finland’s airports and air traffic system would be undertaken by a new entity called Finavia. This moves follows a similar decision undertaken by Sweden which from January 1 2005 had transferred responsibility for regulation from Luftfartsverket to a new Civil Aviation Authority.
The Danish Government announced plans to abolish its tax on domestic and international departures from airports within its jurisdiction.
6.5 Financial performance
Figure 49 shows the average operating and net margins for the group of EEA airport operators referred to earlier, covering the financial years 2001 to 2005.

Analysis of the EU Air Transport Industry, 2005 93
Figure 49 Aggregate results for some leading EEA airport operators 2001 -2005 9
19.3% 18.9% 18.3%
22.0% 21.6%
8.3% 8.6% 8.2%9.7% 10.4%
0%
5%
10%
15%
20%
25%
2001 2002 2003 2004 2005
Operating MarginNet Margin
Source: complied from airline business survey of airports and airport annual reports
Operating margin declined from 2001 to 2003 followed by a sharp improvement from 2003 to 2004, and little change to 2005. Over this period, the business environment has become much more challenging for airports. Increased security expenditure driven by tighter regulations set by European Commission and national governments have raised costs quite substantially. Some airport operators have also been affected by rising energy prices. The airline market has also become much more volatile while growth has been very modest on several domestic air travel markets. Airline traffic growth, the key variable which drives revenues, has been modest at airports dominated by network carriers. In contrast, at those airports that host low cost carrier services the traffic stimulation effects have boosted revenues, particularly from non-aeronautical sources such as retail and car parking. On the other hand, revenue growth from aeronautical charges has been less robust due to the constraining effects of government economic regulation.
Figure 50 Change in operating revenues, top ten EEA airport operators, 2005 v 2004
7.6%
5.1% 5.1%6.6%
4.5%3.5%
-2.6%
4.7%3.1%
-4%
-2%
0%
2%
4%
6%
8%
10%
BAAAen
a
Fraport
Aéropo
rts de
Pari
s
Schiph
ol Grou
pAvin
or
Luftfa
rstve
rket
Aeropo
rti di
Roma
Manch
ester
Airport
s Grou
p
Source: complied from airport annual reports
9 Provisional - 2005 data for Aena and Polish Airports not yet published.

Analysis of the EU Air Transport Industry, 2005 94
In terms of operating revenue, strongest growth was reported by BAA followed by Schiphol Group. The only exception was at Sweden’s Luftfartsverket where there was a fall in operating revenue – this was mainly due to the effects of transferring regulatory functions to a new Civil Aviation Authority.
Figure 51 Operating margins, EEA operators, 2004 and 2005
0%
5%
10%
15%
20%
25%
30%
35%
40%
45%
BAAAen
a
Fraport
Aéropo
rts de
Pari
s
Schiph
ol Grou
pAvin
or
Luftfa
rstve
rket
Aeropo
rti di
Roma
Manch
ester
Airp
orts G
roup
Dublin
Airp
ort A
uthori
ty
SEA Aero
porti
di Mila
no
Flugha
fen W
ien
Unique
(Zuri
ch)
Copen
hage
n Airp
orts
Athens
Inter
natio
nal
Brusse
ls Int
ernati
onal
ANA Port
ugal
CAA Finlan
d
Polish
Airp
orts
Prague
Airp
ort
20052004
Figure 51 shows operating margin achieved by each of the group of EEA airport operators in 2004 and 2005. Some airport operators such as BAA, Avinor and Copenhagen experienced a decline in operating margin.
Figure 52 Net margin by EEA operator 2004 and 2005
-10%
-5%
0%
5%
10%
15%
20%
25%
30%
BAAAen
a
Fraport
Aéropo
rts de
Pari
s
Schiph
ol Grou
pAvin
or
Luftfa
rstve
rket
Aeropo
rti di
Roma
Manch
ester
Airp
orts G
roup
Dublin
Airp
ort A
uthori
ty
SEA Aero
porti
di Mila
no
Flugha
fen W
ien
Unique
(Zuri
ch)
Copen
hage
n Airp
orts
Athens
Inter
natio
nal
Brusse
ls Int
ernati
onal
ANA Port
ugal
CAA Finlan
d
Polish
Airp
orts
Prague
Airp
ort
20052004
The sharp fall in the latter case was largely as a result of increased staff expenditure driven by tighter security requirements. Rising security costs appear to be more than offset by strong revenue growth which has produced improved margins for several

Analysis of the EU Air Transport Industry, 2005 95
airport operators compared to 2004. This includes, for example, Schiphol Group. The operating margin at Athens also improved but as a result of the implementation of cost reduction measures.
Incorporating the effects of interest income, expenses and taxation, fourteen operators achieved an improvement between 2004 and 2005. Munich Airport, which incurred a net loss in 2004, achieved a small positive margin in 2005. The sale of its equity stake in Airports of South Africa combined with reduced financial expenses resulted in a significant improvement in net margin for Aeroporti di Roma.
6.6 Key developments EEA top ten airport operators
6.6.1 BAA BAA outlined plans to redevelop London Heathrow Terminal 2. Under these plans it is expected that the existing terminal would be demolished and replaced by a facility capable of handling 30 million passengers per year in time for the 2012 Olympic Games. The plans are, however, subject to planning approval. BAA also signalled that it is planning to have a second runway operational at London Stansted by around 2010-2012.
BAA completed the purchase of a management contact and equity stake in Budapest Airport. The transaction, which was worth approximately €1.8 billion, consisted of a 75% equity stake in the airport operator and a 75-year asset management contract.
BAA’s operating revenue increased by 7.5% between 2004-5 and 2003-4 financial periods. During the same period, there was a modest deterioration in operating margin caused mainly by rising security and energy costs, and higher capital expenditure incurred at all three London airports. Net margin also declined from 26% to 23% over the same period.
BAA airports collectively processed 2% more passengers in 2004-5 with strong growth reported at Southampton (13%) and London Stansted airports (9%).
6.6.2 Aena Aena and UK air traffic management operator NATS announced that they were joining forces to develop a new automated air traffic control system to manage traffic within their respective jurisdictions.
Spanish airport development company ACDL which is 10% owned by Aena completed the purchase of 93% of UK airport operator TBI.
Information regarding Aena’s financial performance in 2005 was not available at the time of writing.
6.6.3 Fraport During 2005 Fraport sold its 30% equity stake in the company that was established to build and operate the new international airport terminal at Manila (PIATCO). Fraport also secured a contract to manage Cairo.
The German Federal Government sold its 18% stake in the company while Lufthansa became owners of 5% of Fraport after securing shares on the open market.

Analysis of the EU Air Transport Industry, 2005 96
Fraport outlined plans to enable Frankfurt Airport to cope with A380 aircraft operations. The proposals included plans to develop twelve contact gate positions. The new proposed third terminal will also provide an additional six aircraft stands capable of hosting A380 operations.
Fraport’s operating revenue increased by 5.1% between 2004 and 2005. During this period there was an improvement in operating margin from 14% to 15% assisted by the implementation of various cost-cutting measures. Also reported was a slight increase in net margin from 6.1% to 6.7%.
6.6.4 Aéroports de Paris (AdP) AdP announced that it would spend €100m on replacing the Terminal 2E roof structure at Paris Charles de Gaulle. This followed an enquiry into the partial collapse of the structure in May 2004 which resulted in four fatalities.
Standard and Poors reduced its credit rating of AdP from AAA to AA. This was as a consequence of a change in the legal status of the company from public enterprise to private law company which effectively removes the French government’s guarantee on AdP’s obligations. This change in the legal status of the entity is part of a series of measures aimed at preparing the company for partial privatisation in 2006.
AdP announced that it was constructing a new regional terminal facility at Paris CDG airport to cater for short-haul aircraft operations capable of handling equipment up to the size of the Fokker 100 jet.
AdP announced that it will spend €11m in building three new parking positions for A380 freighter aircraft at Paris CDG.
Overall passenger traffic handled by AdP airports (CDG and Orly) increased by 4.4% between 2004 and 2005. Operating revenue increased by just over 5% while there was a 4.6% increase in costs. Operating margin increased from 16.9% to 17.3% while there was also an improvement in net margin from 7.3% to 9.4%.
6.6.4 Schiphol Group The second chamber of the Dutch Parliament approved a government bill to sell a portion of the state’s equity stake in the Schiphol Group which operates Amsterdam Airport. In order for the bill to become law it must have the approval of the first chamber.
The new Pier H at Amsterdam Airport became operational in 2005 designed for low cost carrier operations. Easyjet, Thompsonfly, Bmibaby, Jet2 and Sky Europe became the first carriers to use the new facility.
Passenger traffic handed by Schiphol Group’s core airports increased by 4% over the period 2004-2005. Rising traffic volume contributed to an increase in operating revenue of 6.7% while costs rose by 1.6%. Operating margin in 2005 was 32% compared to 28% in 2004. Net profit margin increases from 17% to 20% over the same period.
6.6.5 Flughafen München (Munich Airport) Flughafen München announced that it was initiating the planning process for a third runway. The airport operators indicated that the existing runway system will only be

Analysis of the EU Air Transport Industry, 2005 97
able to accommodate traffic up to 2008 and that a third runway was needed to cope with future demand.
Flughafen München opened a new freight hall in 2005 enabling the airport to increase freight handling capacity.
Munich Airport handled 6.7% more passengers in 2005 than in 2004. This explains the 4.5% increase in operating revenue achieved in 2005. However, with costs rising faster at 4.8%, operating margin declined from 2.5% to 2.3% over the same period. Net margin in contrast improved from -8.3% in 2004 to 0.8% in 2005.
6.6.6 Avinor Traffic handled by Avinor’s 45 airports increased by 5% between 2004 and 2005 mainly due to growth in international passengers handled at Oslo.
Operating revenue increased by 3.5% between 2004 and 2005. This was in spite of a substantial reduction in the government subsidy awarded to assist in the recovery of costs at smaller regional airports. Revenue growth was driven mainly by increases in passenger traffic. More specifically, non-aeronautical revenue increased by 15% partly assisted by the opening of the first duty-free arrival store in Norway.
Operating margin, however, fell from 19.6% to 15.5% due to higher costs as a result of increased pension provisions and the reduction in government subsidy for regional airports. Net margin declined from 9.1% to 7.3% over the same period.
6.6.7 Luftfartsverket (LFV) Airports managed by Sweden’s Luftfartsverket handled in total 4.6% more passengers in 2005 than in 2004. Within this figure, there were substantial differences in the performance of airports with increases reported at Stockholm Arlanda and Gothenburg. Growth at the former airport was driven mainly by expansion in the international market and growth at the latter airport mainly attributable to low cost carrier entry in the domestic market. Several smaller airports in the network, however, experienced reductions in traffic which may threaten their future viability. LFV is planning to transfer the management of four of its loss-making regional airports to local municipalities.
Construction began on a new cargo terminal at Stockholm Arlanda Airport - expected to be completed in 2006.
Both operating revenues and costs declined between 2004 and 2005 by 2.6% and 2.9% respectively. This was primarily attributed to the transfer of regulatory functions to the new civil aviation authority (Luftfartsstyrelesen). Operating margin increased from 9.2% to 9.5% while net profit increased from 1.7% to 2.9% over the same period.
6.6.8 Aeroporti di Roma Total passengers handled by AdR’s two airports (Fiumicino and Ciampino) increased by 7.4% between 2004 and 2005. While a decline in traffic was reported on domestic routes, most of the growth was attributable to international routes and in particular low cost carrier expansion at Ciampino. Passenger growth at Fiumicino was a modest 2%.

Analysis of the EU Air Transport Industry, 2005 98
The 4.7% increase in operating revenue was mainly due to the substantial improvement in non-aeronautical revenues over the same period (21.5%)
Operating margin improved slightly from 21% to 22% between 2004 and 2005 while net margin increased considerably from 1.1% to 13.6% during the same period mainly due to the effects of selling the companies equity stake in Airports of South Africa.
6.6.9 Manchester Airports Group (MAG) Passenger traffic handled by MAG airports increased by 3% between financial years 2003-4 and 2004-5. Growth at Manchester and Bournemouth more than offset traffic decline at Nottingham and Humberside. Total operating revenue increased by 3.1%. Revenue growth was particularly strong in terms of non-aeronautical activities increasing by 6.3% over the same period. There was, however, a decline in operating margin from 25% to 22% caused by higher growth in security, pensions and energy costs. Net margin also declined from 19.8% to 15.7%.
6.7 Departure delays
The European Regions Airline Association (ERA) publishes departure punctuality data relating to airlines that voluntarily report on a monthly basis to the ERA Directorate by reporting airlines. Table 36 shows the percentage of flights departing on time, and within sixty minutes of their scheduled departure time, by month.
Table 36 Departure punctuality: overall performance for ERA regional airlines
% flights on time % flights within 60 minutes 2004 2005 change 2004 2005 change January 84 85 1 97 97 0
February 86 84 -2 98 97 -1
March 89 85 -4 98 97 -1
April 91 88 -3 99 98 -1
May 90 87 -3 99 98 -1
June 89 86 -3 99 97 -2
July 87 85 -2 99 97 -2
August 88 88 0 99 98 -1
September 88 87 -1 98 98 0
October 87 85 -2 98 97 -1
November 87 83 -4 98 96 -2
December 86 81 -5 98 96 -2
Average 88 85 -2 98 97 -1
Source: ERA, 2006
The number of on-time departures fell by 2% to 85%. This includes those flights departing within 15 minutes of their scheduled departure time. Only January 2005 recorded an improvement on the same month in 2004. In December 2005 just 81% of flights departed on time, down 5% on the same month in 2004.
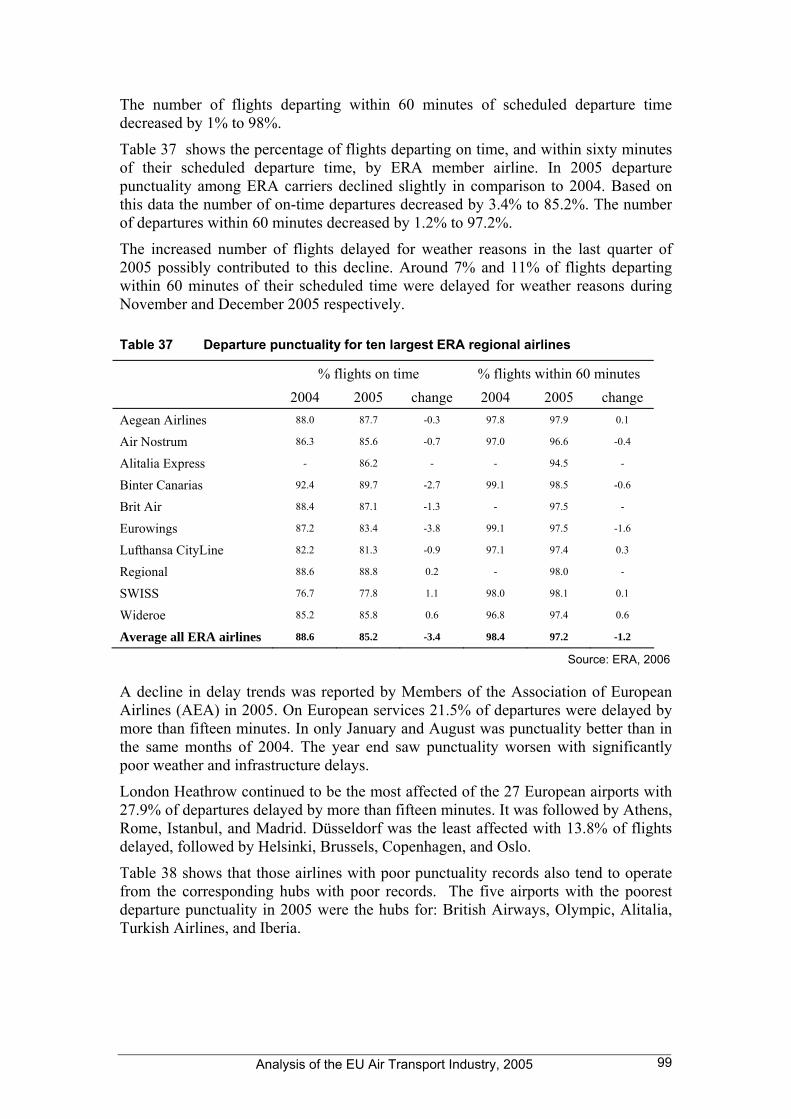
Analysis of the EU Air Transport Industry, 2005 99
The number of flights departing within 60 minutes of scheduled departure time decreased by 1% to 98%.
Table 37 shows the percentage of flights departing on time, and within sixty minutes of their scheduled departure time, by ERA member airline. In 2005 departure punctuality among ERA carriers declined slightly in comparison to 2004. Based on this data the number of on-time departures decreased by 3.4% to 85.2%. The number of departures within 60 minutes decreased by 1.2% to 97.2%.
The increased number of flights delayed for weather reasons in the last quarter of 2005 possibly contributed to this decline. Around 7% and 11% of flights departing within 60 minutes of their scheduled time were delayed for weather reasons during November and December 2005 respectively.
Table 37 Departure punctuality for ten largest ERA regional airlines
% flights on time % flights within 60 minutes 2004 2005 change 2004 2005 change Aegean Airlines 88.0 87.7 -0.3 97.8 97.9 0.1
Air Nostrum 86.3 85.6 -0.7 97.0 96.6 -0.4
Alitalia Express - 86.2 - - 94.5 -
Binter Canarias 92.4 89.7 -2.7 99.1 98.5 -0.6
Brit Air 88.4 87.1 -1.3 - 97.5 -
Eurowings 87.2 83.4 -3.8 99.1 97.5 -1.6
Lufthansa CityLine 82.2 81.3 -0.9 97.1 97.4 0.3
Regional 88.6 88.8 0.2 - 98.0 -
SWISS 76.7 77.8 1.1 98.0 98.1 0.1
Wideroe 85.2 85.8 0.6 96.8 97.4 0.6
Average all ERA airlines 88.6 85.2 -3.4 98.4 97.2 -1.2
Source: ERA, 2006
A decline in delay trends was reported by Members of the Association of European Airlines (AEA) in 2005. On European services 21.5% of departures were delayed by more than fifteen minutes. In only January and August was punctuality better than in the same months of 2004. The year end saw punctuality worsen with significantly poor weather and infrastructure delays.
London Heathrow continued to be the most affected of the 27 European airports with 27.9% of departures delayed by more than fifteen minutes. It was followed by Athens, Rome, Istanbul, and Madrid. Düsseldorf was the least affected with 13.8% of flights delayed, followed by Helsinki, Brussels, Copenhagen, and Oslo.
Table 38 shows that those airlines with poor punctuality records also tend to operate from the corresponding hubs with poor records. The five airports with the poorest departure punctuality in 2005 were the hubs for: British Airways, Olympic, Alitalia, Turkish Airlines, and Iberia.

Analysis of the EU Air Transport Industry, 2005 100
Table 38 AEA departure delay rates on intra-European services
% flights > 15 minutes 2004 2005 change Düsseldorf 13.9 13.8 -0.1
Helsinki 13.0 15.5 2.5
Brussels 13.9 15.7 1.8
Copenhagen 14.1 16.1 2.0
Oslo 12.9 16.2 3.3
Stockholm 14.4 16.7 2.3
Paris Orly 17.2 19.6 2.4
Geneva 15.9 19.6 3.7
Larnaca 15.3 19.6 4.3
Lisbon 18.0 20.1 2.1
Frankfurt 18.2 20.2 2.0
Milan Linate 16.3 20.2 3.9
Zurich 26.1 21.3 -4.8
Manchester 19.3 21.3 2.0
Munich 20.7 21.5 0.8
Milan Malpensa 18.6 23.0 4.4
Vienna 24.8 23.3 -1.5
Amsterdam 23.6 23.3 -0.3
Dublin 23.5 24.1 0.6
London Gatwick 16.9 24.2 7.3
Paris CDG 22.7 25.0 2.3
Barcelona 20.7 25.5 4.8
Madrid 23.7 25.9 2.2
Istanbul 22.6 26.2 3.6
Rome 23.5 26.7 3.2
Athens 18.1 26.9 8.8
London Heathrow 27.8 27.9 0.1
Average 19.1 21.5 2.4
Source: AEA, 2005, 2006

Analysis of the EU Air Transport Industry, 2005 101
SECTION 7
AIR TRAFFIC CONTROL
7.1 GALILEO ............................................................................................102
7.2 EUROPEAN SINGLE SKY .....................................................................104
7.3 DELAYS..............................................................................................107

Analysis of the EU Air Transport Industry, 2005 102
7 Air Traffic Control
7.1 Galileo
7.1.1 Introduction Much of the developments on Galileo during the year revolved around the discussions on which of the two rival consortia were going to be awarded the satellite navigation concession. The decision not to award the concession was attributed to the strength of both bids (plus some political pressure) and by the end of the year the two consortia were working together as a single entity and that the concession contract was expected to be signed in 2006. Additional national stakeholders joined the Galileo programme including China, Israel, Ukraine, India and Morocco, giving the programme a truly international flavour.
7.1.2 Satellite Development In early 2005 the European Space Agency and Galileo Industries signed a preliminary contract for the in-orbit validation (IOV) phase of the Galileo satellite navigation programme. The initial €150m contract allowed work to begin on the first four Galileo satellites. The full €950m contract for the IOV phase was expected to be finalised by the middle of the year. The IOV phase covers construction of the four satellites, their launch in 2008 and the development and operation of the initial ground infrastructure. This would be followed by a deployment phase, when 26 more satellites will be launched to complete the constellation and the full ground network will be installed.
Under a test phase contract awarded in July 2003, two different Galileo test satellites are being built, the first scheduled for launch by a Russian Soyuz booster in 2005. Digital signal generation technology and an atomic clock for Europe's Galileo global positioning system test satellites have been integrated successfully. Tested at EADS Astrium's Portsmouth, UK facility, the clock and signal generator produce the primary navigation signal with which users will find their location. The test satellites will validate Galileo technologies in orbit before the 30 satellites needed for the constellation are launched.
The two companies involved in satellite development are Astrium and Surrey Satellites Technology (SSTL); they will provide their own platforms for their respective test satellites. However, the core GPS technology is based on European Space Agency specifications and provided by a range of suppliers. Prime contractors for the antennas are Alenia and Casa; for the frequency generator unit, Nortech Datensysteme; and for the atomic clock monitoring control, Alcatel Espacio; and the atomic clocks Switzerland's Temex and EADS Astrium. Each Galileo satellite will use two atomic clocks.
7.1.3 Operating Concession Groups The preferred bidder for the Galileo satellite navigation concession was expected to be selected on 1 March by the Galileo Joint Undertaking (GJU) organisation, which is managing the development phase of the project. Note that in February 2004 GJU

Analysis of the EU Air Transport Industry, 2005 103
selected two teams as bidders for the concession to operate the European satellite constellation. These were iNavsat, led by Inmarsat, Thales and EADS Space; and the Eurely consortium with its leading partners Alcatel, Finmeccanica, Spanish air traffic management body Aena and Spanish satellite operator Hispasat.
The surprise decision by GJU not to announce the award of the concession on 1 March to either of the bidding consortia – iNavSat and Eurely – was attributed to be due to the strength of both bids. Negotiations then commenced for the work to be shared between the two consortia. In June 2005 the two competing consortia bidding to operate the Galileo civil satellite constellation submitted a joint bid for the concession after the management organisation opted to combine their complementary individual approaches rather than select a preferred candidate. Eurely and INavSat stated that merging their individual resources would provide greater benefits and ensure that the programme was delivered on time.
By November 2005 it was expected that the contract to operate the European Galileo satellite navigation system would now be signed by the end of the second quarter of 2006. The two bidders, iNavsat and EUrely, have become a single entity with the working name Merged Consortia. Throughout the remainder of 2005 the combined team was in talks with the Galileo Joint Undertaking (GJU), the European Union and European Space Agency organisation that is managing the development phase.
7.1.4 Financing In August 2005 there were concerns that Europe’s Galileo navigation satellite programme may be further delayed following disagreement among the major partner nations over extra funding, linked to industrial returns. At the end of 2004, the European Space Agency (ESA) revealed that the overall cost of Galileo would have to rise from €1.1 billionto €1.5 billion. Half of the €400m increase will come from the European Commission, but at a meeting of member states’ delegates last month, the four major partners, France, Germany, Italy and the UK, failed to agree on how the extra money should be linked to the substantial future commercial returns from the programme.
In November 2005 the European Space Agency’s industrial policy and navigation programme committees gave the go-ahead for additional financing of Galileo’s first industrial phase, which will see four satellites placed into orbit to assess the system’s key technologies. One of the first satellites, integrated by Alcatel Alenia Space in its Rome facility, will be launched early in 2006.
7.1.4 Stakeholders In March China’s National Remote Sensing Centre (NRSCC) awarded a contract for development of technologies under the country’s agreement to invest €200m in the European Galileo satellite navigation programme. China is the first non-European Union participant in the Galileo project, in which the NRSCC is the EU-designated Chinese partner. Including the €5m entrance fee, China is investing €70m in the first phase to develop technologies and equipment for Galileo. Mandated to choose domestic research institutes and companies to undertake the work, NRSCC signed a contract with state holding company China Galileo Industries. The company is owned by China Aerospace Science & Technology, China Electronics Technology Group, China Satcom and the China Academy of Space Technology.

Analysis of the EU Air Transport Industry, 2005 104
In May the Israeli Industry Centre for Research and Development, Matimop, joined the Galileo programme, sealing a co-operation agreement signed in 2004 between Israel and the European Union. At the beginning of June Ukraine also received approval for participation in developing the Galileo programme Galileo. Ukraine became the third non-EC country after China and Israel to formally join the Galileo programme. The agreement signed provided for joint activities with Ukraine in sectors such as industrial manufacturing, market development, certification and technology. It will also allow Ukraine to participate in Galileo by taking a stake in the Galileo Joint Undertaking which manages the project.
In June it was announced that by the end of July seven development projects will be placed with Chinese organisations for Galileo, the European satellite navigation programme. The decision was announced following a meeting earlier in the month between Galileo Joint Undertaking (GJU) organisation and the National Remote Sensing Center of China on Chinese participation in the development phase.
In September it was announced that India is to join the Galileo programme, becoming the fourth non-EU state to participate in the programme behind Ukraine, China and Israel. The agreement will ensure availability of high-quality Galileo services within India as well as co-operative efforts to establish regional satellite augmentation systems.
In November, Morocco became the latest country, and the first in Africa, to formally agree participate in the Galileo programme, becoming fifth non-European Union state to sign a co-operation pact on Galileo, joining Ukraine, China, Israel and India. At this time, nine other countries were also in discussions regarding participation.
7.2 European Single Sky
7.2.1 Introduction Most of the developments in 2005 were linked to various aspects of planned future co-operation and consolidation of air traffic management activities. The United Kingdom and Ireland commissioned a study to examine the creation of a single block of airspace over both countries and the oceanic areas of the North Atlantic presently under their control. The CEATS saga continued to rumble along with final agreement between the countries still being awaited by the end of the year. Spain and Portugal commenced an examination into the rationalization of their ATC operations and the EC has provided funding to the Skaane project which is linked to the coupling of Danish and Swedish air traffic services. Joint ventures were set up for the development of next generation air traffic management systems, one group being NAYS and the other being Slovenia, the Czech Republic and Austria.
7.2.2 British / Irish Airspace Developments In early 2005 UK airspace authority National Air Traffic Services (NATS) began assessing the implications of creating a functional block of airspace with its Irish counterpart this summer having appointed a consultant, Helios Technology, to carry out the study and present its conclusions at the end of May. The study would examine operational, technical, regulatory, financial and other aspects of the proposal. The study conclusion was that the UK and Irish airspace authorities could achieve airspace management flexibility, more efficient operations, and save costs by setting up a

Analysis of the EU Air Transport Industry, 2005 105
functional block of airspace (FAB) combining the two organisations’ areas of responsibility.
At present, four flight information regions (FIRs) are overseen by the two organisations: the London and Scottish FIRs cover a total of some 901,000km2, while the Shannon FIR and the vast Shanwick Oceanic FIR, ten times greater than Shannon airspace, together span nearly 2.6 million km2. The proposals are forecast to deliver annual efficiency savings of €7-10m and airlines are expected to save €10-30m through better routing and fewer delays.
The study suggested the FAB should cover the whole of the Shanwick Oceanic flight information region, which extends halfway across the Atlantic. The airspace would be run from three area control centres (ACC) – Shannon in Ireland, Prestwick in Scotland and Swanwick in England. A new Prestwick is being built for service entry in 2008-9 and its launch will determine the earliest date of operation for the new Anglo-Irish FAB.
7.2.3 CEATS In May 2005 at a meeting in Luxembourg the ministers and other representatives from the Central European Air Traffic Services (CEATS) states signed a declaration to implement the project as soon as possible. In order to maintain momentum on the programme the ministers agreed to address stray issues, such as regulation, civil-military co-ordination, decision-making and social dialogue, through a high-level joint working group. This working group, comprising representatives from the ministers as well as pan-European air navigation agency Eurocontrol, would put before a ministerial conference a proposal to satisfy these issues. Five states have ratified the CEATS agreement and, at the meeting, ministers invited the remaining three – Slovenia, Slovakia and Croatia – to do the same.
The following month it was announced that CEATS programme had been cleared for implementation. Although transport ministers from only five of the nations have signed the resolution so far, the other three have promised their support as they proceed, and were themselves committed “to take a final position” by the end of the following year.
7.2.4 Portugal /Spanish initiatives Portuguese and Spanish air navigation service providers agreed to explore the creation of a unified functional block of airspace in line with the Single European Sky initiative. Spanish air traffic service Aena and counterpart Nav Portugal will conduct a feasibility study for a “common cross-border” airspace block to be managed by the two sides. It will comprise three phases. The first would assess airspace organisation and management, civil-military co-ordination, and service delivery models. A second phase would examine institutional arrangements for joint performance-based air navigation service provision, as well as systems specification, while the third will study training requirements and working conditions. Results of the study should be presented in October 2006.
7.2.5 Project Finance In May 2005 EC regulators included a Scandinavian air traffic management scheme among a group of nine projects to receive funding under the trans-European Transport
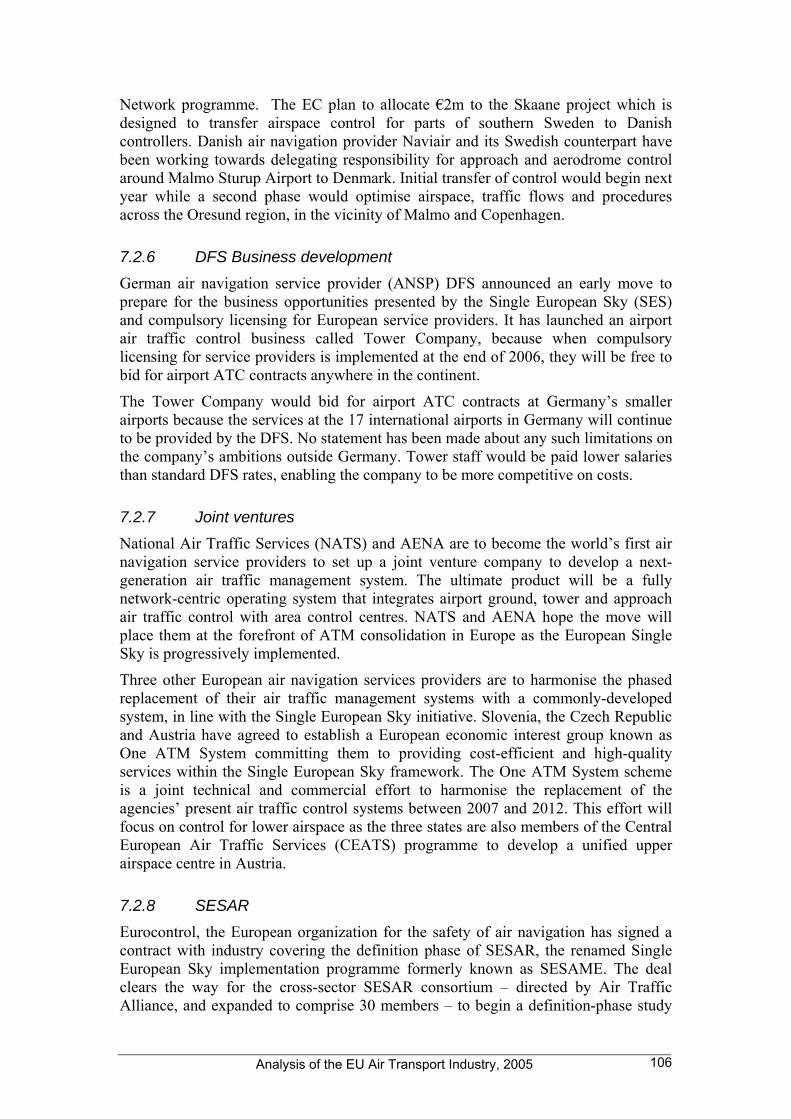
Analysis of the EU Air Transport Industry, 2005 106
Network programme. The EC plan to allocate €2m to the Skaane project which is designed to transfer airspace control for parts of southern Sweden to Danish controllers. Danish air navigation provider Naviair and its Swedish counterpart have been working towards delegating responsibility for approach and aerodrome control around Malmo Sturup Airport to Denmark. Initial transfer of control would begin next year while a second phase would optimise airspace, traffic flows and procedures across the Oresund region, in the vicinity of Malmo and Copenhagen.
7.2.6 DFS Business development German air navigation service provider (ANSP) DFS announced an early move to prepare for the business opportunities presented by the Single European Sky (SES) and compulsory licensing for European service providers. It has launched an airport air traffic control business called Tower Company, because when compulsory licensing for service providers is implemented at the end of 2006, they will be free to bid for airport ATC contracts anywhere in the continent.
The Tower Company would bid for airport ATC contracts at Germany’s smaller airports because the services at the 17 international airports in Germany will continue to be provided by the DFS. No statement has been made about any such limitations on the company’s ambitions outside Germany. Tower staff would be paid lower salaries than standard DFS rates, enabling the company to be more competitive on costs.
7.2.7 Joint ventures National Air Traffic Services (NATS) and AENA are to become the world’s first air navigation service providers to set up a joint venture company to develop a next-generation air traffic management system. The ultimate product will be a fully network-centric operating system that integrates airport ground, tower and approach air traffic control with area control centres. NATS and AENA hope the move will place them at the forefront of ATM consolidation in Europe as the European Single Sky is progressively implemented.
Three other European air navigation services providers are to harmonise the phased replacement of their air traffic management systems with a commonly-developed system, in line with the Single European Sky initiative. Slovenia, the Czech Republic and Austria have agreed to establish a European economic interest group known as One ATM System committing them to providing cost-efficient and high-quality services within the Single European Sky framework. The One ATM System scheme is a joint technical and commercial effort to harmonise the replacement of the agencies’ present air traffic control systems between 2007 and 2012. This effort will focus on control for lower airspace as the three states are also members of the Central European Air Traffic Services (CEATS) programme to develop a unified upper airspace centre in Austria.
7.2.8 SESAR Eurocontrol, the European organization for the safety of air navigation has signed a contract with industry covering the definition phase of SESAR, the renamed Single European Sky implementation programme formerly known as SESAME. The deal clears the way for the cross-sector SESAR consortium – directed by Air Traffic Alliance, and expanded to comprise 30 members – to begin a definition-phase study

Analysis of the EU Air Transport Industry, 2005 107
to draw up six marker points for progress towards establishing a European air traffic management master plan. While the definition phase was formally launched at the Paris air show in June 2005, negotiations on the contract had still to be finalised.
The two-year definition effort, jointly funded by the European Commission and Eurocontrol, will last until the beginning of 2008. Of the overall €60m cost, the value of the contract to the SESAR consortium amounts to about €43m. Within four months the consortium completed an overall analysis of the current air transport framework. Within nineteen months the consortium hopes to have defined performance targets and concepts to meet these, as well as an implementation sequence for suitable strategies. Over the final five-month period the master plan will bring together recommendations from the air transport industry and draw up a firm work programme for initial implementation.
It is expected that SESAR will triple the capacity of European air traffic control infrastructure resulting in a large reduction in delays, and halve the cost of airspace management. More efficient trajectories will also cut the environmental impact from aircraft emissions, reducing them by 10% per flight. Definition of the master plan will mark the first phase of SESAR. This will be followed by a development phase running to 2013 before an industry-funded deployment phase moves into effect between 2014 and 2020. For the development phase, the Commission proposed to set up a specific management structure, a Joint Undertaking, following the example of GALILEO. The SESAR Joint Undertaking will be a legal entity, forming a partnership between public authorities (EU, Eurocontrol) and the private sector. The SESAR Joint Undertaking is expected to be created at the beginning of 2007, and will manage a budget of around €2.1 billion, evenly shared the European Community, Eurocontrol and the industry.
7.3 Delays
Eurocontrol produces delay statistics from two sources: the Central Office for Delay Analysis (CODA), which obtains data direct from airlines; and the Central Flow Management Unit (CFMU) which compares scheduled with actual slot times. CODA’s annual report for 2005 reports total flights (from CFMU data) to have increased by 4% for 2005, compared to 2003, to over nine million. Domestic flights, which accounted for 37% of 2005 traffic, increased by 2% whereas international traffic increased by 5%.
The average delay per movement, for all causes of delay, was 11.3 minutes for departure traffic (up 9% on 2004) and 11 minutes for arrival traffic (an increase of 3% on 2004). Around half the departure delays in 2005 were attributed to airlines, 19% to airports and 11% to en-route flow control. These figures are identical to those for 2004. The data for 2003, 2004 and 2005 is summarized in Table 39.
Airport delays may be due to a variety of causes including security, or slot (runway) restrictions at either the origin or destination airport. En-route (Air Traffic Flow management ~ AFTM) delays can be attributed to one or more of capacity / demand mismatching, weather, equipment failures and staff shortages.
In 2005, lack of ATC capacity accounted for 38% of the total ATFM delay followed by weather with 27%, airport facilities with 17%, ATC staffing with 5% and ATC equipment with 4%. Compared with 2004, there was an increase in the airport

Analysis of the EU Air Transport Industry, 2005 108
facilities and industrial action categories and a decrease in the ATC capacity and ATC equipment categories.
Table 39 Primary cause of departure delays, 2003 - 2005
Percent 2003 2004 2005
Airline 47 50 50 Airport 21 19 19 En-route 13 11 11 Weather 13 11 13 Security 4 5 4 Misc. 2 4 3 Total 100 100 100
As for individual departure airports, Rome (Fiumicino) had the highest average delay per movement in 2005 (16.4 minutes) followed by Milan Linate, Milan Malpensa, Venice Tessera and Paris CDG. The highest average delay for destination airports was experienced at London Gatwick (15.4 minutes) followed by London Heathrow, Madrid and London Luton. The airport-pair routes with the highest average delay, in minutes per movement, were:
Milan Malpensa London Heathrow 21.2
Rome Fiumicino Catania 20.7
Madrid London Heathrow 20.1
Edinburgh London Gatwick 20.0
London Heathrow Madrid 19.7

Analysis of the EU Air Transport Industry, 2005 109
SECTION 8
THE ENVIRONMENT
8.1 THE YEAR IN BRIEF ............................................................................110
8.2 AIRCRAFT ENGINE EMISSIONS...........................................................112
8.3 EMISSIONS TRADING SCHEME ...........................................................113
8.4 EU AIRLINE EMISSIONS .....................................................................114

Analysis of the EU Air Transport Industry, 2005 110
8. The environment
8.1 The year in brief
January 2005 began with airline groups supporting the call for aviation to be included in a European Union emissions trading scheme instead of allowing the industry to be taxed. It was thought that members of the Association of European Airlines (AEA) would eventually favour emissions trading through concern over its alternative. UK airlines were already involved in a national emissions trading scheme, with British Airways and Virgin Atlantic supporting any scheme covering the whole of the European Union (EU). The European arm of Airports Council International (ACI) announced its board backed a move to ‘extend the scope of the EU emissions trading scheme to include the climate change impact of aircraft in flight’. Meanwhile the European Express Association (EEA) sought a solution from the ICAO to prevent an unfair competition with other parts of the world.
February 2005 finally welcomed the United Nations Kyoto Treaty on measures to reduce global warming into effect. While emissions from domestic aviation are included in States' reduction targets, the limitation and reduction of those from international aviation are subject to a collective agreement of developed countries working through ICAO. Proposals for an emissions tax on aviation fuel were discussed at the monthly meeting of EU finance ministers in Brussels. There were no firm policy initiatives but discussion did focus on whether such a tax could be used to increase aid to developing countries or be spent on improving the environment.
In March 2005 aviation was identified as both the single most polluting mode of transport and the fastest growing source of greenhouse gas emissions: the UK Green Party estimated that aviation accounts for just over 3.5% of carbon dioxide (CO2) emissions. Yet a report by the Intergovernmental Panel on Climate Change suggested emissions from aircraft could be responsible for up to 15% of the overall global warming produced by human activities by 2050 at current rates of increase. They predicted that unless current aviation policy was radically changed CO2 emissions from the industry will have increased by 588% between 1992 and 2050, and nitrogen dioxide (NOx) pollution by 411%.
In March 2005 delegates at the Aviation and Environment Summit in Geneva were told by industry groups, including Airports Council International (ACI), the Civil Air Navigation Services Organisation (CANSO), the International Air Transport Association (IATA), and the International Civil Aviation Organisation (ICAO), that little had been achieved in educating the public and policymakers about the lengths taken by the industry to reduce noise by 70% and halve fuel consumption in the last 40 years. Assad Kotaite, president of the ICAO council, said that civil aviation is responsible for only 3.5% of global greenhouse gas emissions, yet it is portrayed as one of the largest contributors.
June 2005 saw the European Commission being presented with views from stakeholders involved in efforts to reduce the climate change impact of aviation during the environment-focused Green Week. Karl-Heinz Florenz, a German member of the European Parliament, was one to agree that emissions trading would force airlines to demand more fuel-efficient aircraft rather than buy additional credits. He

Analysis of the EU Air Transport Industry, 2005 111
considered it the most efficient way to reduce aircraft engine emissions through lower fuel consumption.
In July 2005 the draft results of a study by consultants CE Delft for the European Commission concluded that it is technically and legally feasible to include aviation in the existing emissions trading scheme. Environmental groups meanwhile vowed to step up their efforts to persuade the governments of EU members to impose a tax on aviation fuel. Jeff Gazzard of Green Skies, the umbrella organisation for a group of European environmental interests, said: ‘The supply side gains, coming from more efficient equipment, are limited to around 1-2% a year, while air transport is forecast to grow by 5% each year, so we need to find a way to reduce demand as well’.
In September the Commission published its long awaited Communication, Reducing the climate change impact of aviation [COM(2005)459]. It concluded that a comprehensive approach was needed including higher priority for research and development aimed at 'greening' aviation, modernisation of Air Traffic Management, continued work to remove obstacles to the taxation of aviation fuel and further effort in ICAO to improve technical design standards to limit emissions at source.
October 2005 heard Giovanni Bisignani, Director General of the International Air Transport Association, remain critical of the scheme, saying: ‘Member states of the International Civil Aviation Organisation, including all EU members, are committed to deciding a course of action on aviation emissions in 2007. A European solution is no solution at all. Unilateral regional efforts will only distract from this process’. This came as environmental groups feared a decision to include airlines in the emissions trading scheme could be hindered by the International Emissions Trading Association (IETA), a heavy industry lobby, which is worried about rising carbon costs.
November 2005 observed warnings from the United States that plans to bring all carriers operating within Europe into the emissions trading scheme would face legal challenges. The Federal Aviation Administration (FAA) voiced concerns that such an extension would raise issues on the grounds that it violated the Chicago Convention ban on taxing aviation fuel or emissions. Carl Burleson, Environment and Energy Director for the FAA said: ‘The EU should be like a laboratory, with emissions trading restricted to its borders. That way it can be used as a case study for ICAO if the rest of the world later adopts a scheme’.
November 2005 also saw Eurocontrol launch a web-based training tool aimed at improving awareness of the environmental effects of aviation. It believed a widespread approach to reducing aviation pollution is necessary; including air traffic management which is thinks is one of the most significant potential sources of emissions reduction. George Paulson, Director for Safety, Airspace, Airports and Information Services at Eurocontrol, said the tool will ‘give operational staff indications of the actions they can take to help reduce the impact of aviation on the environment’.
In December, Peter Gammeltoft, Head of Unit for Air Transport within DG ENV informed the Aviation Working Group (AWG) looking at the options for bringing aviation within the EU ETS : ‘We would like to have as wide a scope as possible for environmental reasons. We would also like to avoid any impact on competitiveness for European carriers’. He also made clear that the entry into force of a legislative proposal would depend among other things on how quickly the legislative process was completed, which was a matter for the European Parliament and Council.

Analysis of the EU Air Transport Industry, 2005 112
8.2 Aircraft engine emissions
The evidence supplied by British Airways to the UK Stern review on the economics of climate change in December 2005 made an analysis of air transport emissions in 2050. It used estimates of growth in aviation and fuel efficiency to suggest that air transport may not absorb the majority of the available allocation of CO2 for the whole economy in a carbon constrained world.
Table 40 UK air transport CO2 emissions in 2050, as a percentage of 2000 UK total emissions baseline
Air Travel Growth (per annum) Fuel Efficiency Gain (per annum) 2.5% 3.0% 3.5%
1.0% 11.4% 14.6% 18.6%
1.5% 8.9% 11.3% 14.4%
2.0% 6.9% 8.8% 11.2%
Source: British Airways, December 2005
Table 40 shows that the Department for Transport estimated that in 2000 air transport generated 5.5% of total UK CO2 emissions. By 2050 these emissions are predicted to be between 6.9% and 18.6% of the 2000 UK total depending on the rate at which air transport grows and the level of fuel efficiency achieved.
Table 41 Global air transport CO2 emissions 2050, as % of 1992 total global emissions baseline
Air Travel Growth (per annum) Fuel Efficiency Gain (per annum) 3.0% 3.5% 4.0%
1.0% 6.2% 8.2% 10.9%
1.5% 4.6% 6.1% 8.1%
2.0% 3.4% 4.6% 6.0%
Source: British Airways, December 2005
Table 41 shows that global air transport in 2050 emissions are forecast to have risen to between 3.4% and 10.9% of the 1992 global total. This again depends on the rate at which air transport grows and the level of fuel efficiency achieved.
Table 42 Air transport emissions in a carbon-constrained world, as % of total emissions in 2050, assuming 60% cut on baseline
Low* Mid-range* High*
UK 17% 28% 46%
Global 9% 15% 27% *Low=low growth, high fuel efficiency, Mid-range=medium growth, medium fuel efficiency, High=high growth, low fuel efficiency
Source: British Airways, December 2005
Table 42 shows the potential level of emissions in a carbon constrained world where CO2 has been reduced by around 60% as recommended by leading figures in the scientific community.

Analysis of the EU Air Transport Industry, 2005 113
The mid-range estimates show that the share of carbon emissions from air transport could rise to approximately 15% globally, within a range of 9% to 27%. Such emissions could rise to a mid-range estimate of 28%, within a range of 17% to 46%.
8.3 Emissions trading scheme
In July 2005 the Dutch consultancy, CE Delft, published its study: ‘Giving Wings to Emission Trading’. The report explored the viability of including international aviation in the EU Emissions Trading Scheme. Its inclusion was in order to moderate the climatic impacts of aviation by encouraging airlines to integrate them in their business objectives. It was concluded that the introduction of emissions trading for aviation, specifically in respect of CO2 emissions, does not appear to pose any of the challenges that have not already arisen in the context of the existing EU emissions trading scheme. The report took into account the possibility for including non-CO2 impacts in the future. It suggests that emission trading is an option that can be considered along with other policy instruments to deal with the impact of aviation on climate change.
The Commission’s September Communication, referred to in section 8.1, announced the intention, underpinned by an Impact Assessment, that examined a range of possible policy options and economic instruments, to extend the EU Emission Trading System to include aviation. This would help to internalise the environmental cost of its emissions and give the sector a clearer incentive to act to limit and reduce them. Emissions trading was considered the most cost-effective instrument compared to fuel taxation and emission charges and should involve the least cost to the industry. In addition such an approach had the best prospect of extension to other countries and regions in due course. The Communication also announced that an Aviation Working Group (AWG) comprising representatives of a wide range of stakeholders would be established to consider the modalities of bringing aviation within the EU ETS. And that the Commission would aim to table a legislative proposal by the end of 2006.
In December 2005 British Airways submitted evidence to the UK Stern review on the economics of climate change. It believed that including air transport within the existing emissions trading scheme would be the most environmentally effective and economically efficient instrument for dealing with CO2 emissions from air transport. Initially within the EU, an emissions trading scheme should ultimately aspire to form part of an international recognised approach. The linking of CO2 emissions in air transport with the EU scheme would be a significant step towards the global objective in spite of the largely different regional pressures on addressing climate change.
BA's evidence to the Stern Review considered it crucial for any market distortions from an emissions trading scheme to be minimised in order to gain acceptance in such a highly competitive market. To avoid a competitive imbalance and high financial burdens, emissions allowances should be distributed free of charge. It also argued that it is essential that a harmonised EU-level approach to allocation and target setting is adopted for air transport to prevent distortions in competition occurring. While emissions trading should initially apply to air services within the EU (domestic and intra-European flights) a long-term international framework should eventually be agreed through the appropriate international bodies.

Analysis of the EU Air Transport Industry, 2005 114
8.4 EU airline emissions
In 2005 the top three EU network carriers recorded very similar fuel efficiency, with Air France-KLM edging ahead. The Advisory Council for Aeronautics Research in Europe (ACARE) targets a 50% reduction in CO2 emissions per passenger-km. Leaving aside the fact that the comparison below uses RTKs and not passenger-kms, the past year has not contributed to moving towards this target with the combined results for these carriers down on last year. The average age of the fleets of the five carriers included in the table increased from 8.6 years to 9.2 years, with deliveries of new aircraft slow, in particular for British Airways. The average sector length over which the aircraft were operated rose by 4.5% in 2005, which should have resulted in some efficiency gains (Table 43).
Of the LCCs, Air Berlin achieved high fuel efficiency in 2005 (11.2 RTK/gallon), but operate over longer stage lengths (average 1,517 km) than Ryanair (936 km), which managed 9.0 RTK/gallon.
Table 43 Fuel consumption for major EU airlines, 2005 vs 2004
Fuel consumption RTK/gallon* Average sector Average fleet
2005 % change vs 2004 length (km) Age (years) Air France-KLM 10.2 1.2 1,463 9.1
British Airways 9.5 -0.5 1,791 9.5
Lufthansa 10.1 -1.5 1,247 9.4
Iberia 6.9 4.3 1,275 7.9
SAS 8.8 n/a 793 9.9
* Not comparable with data in previous annual report
Source: Airline annual and environmental reports
Table 44 shows a comparison of CO2 and NOx emissions for the aircraft of five major EU airlines in both 2004 and 2005. An average increase of around 6% and 5% was recorded for CO2 and NOx emissions respectively from 2003 to 2004, and now records around 5% and 7% respectively from 2004 to 2005.
Table 44 Change in pollutants emitted for major EU airlines, 2004 v 2005
Aircraft CO2 emissions (million tonnes)
Aircraft NOx emissions (000 tonnes)
2004 2005 % change 2004 2005 % change
Air France-KLM 25.3 26.4 4.1% 123.5 131.9 6.4%
British Airways 15.8 16.1 1.9% n/a n/a n/a
Lufthansa 20.6 21.3 3.3% 96.0 97.3 1.3%
SAS 3.7 4.2 11.7% 14.1 16.2 13.0%
Total/Average 16.4 17.0 5.2% 77.9 81.8 6.9%
Source: Airline annual and environmental reports
As in 2004, British Airways again reported the slowest increase in emissions in 2005 perhaps due to a slower expansion in comparison to the other airlines. In 2005 its

Analysis of the EU Air Transport Industry, 2005 115
global emissions of CO2 from all mainline flights was 16.1 million tonnes, which represented 3% of all CO2 emissions.
The 2005 Corporate Responsibility Report published by British Airways recognises that concentrations of ground and low level emissions of nitrogen oxides (NOx) is a cause of concern for local communities and airport employees. It reports that Heathrow, Gatwick, and New York JFK are the airports most affected by its NOx emissions, accounting for nearly half of its overall total. The percentage of British Airways global landing and take-off NOx emissions in 2005 was 40.5% at Heathrow (up 1% on the previous year), 6.5% at Gatwick, and 2.6% at New York JFK. The airline seeks to optimise its procedures to reduce these emissions by applying the maximum take-off thrust reductions.

Analysis of the EU Air Transport Industry, 2005 116
SECTION 9
CONSUMER ISSUES
9.1 Introduction......................................................................................117
9.2 Business passengers.....................................................................118
9.3 The leisure travel market...............................................................121

Analysis of the EU Air Transport Industry, 2005 117
9 Consumer Issues
9.1 Introduction
The latest evidence continues to indicate that leisure travel within Europe is growing faster than business travel. Table 45, derived from UK CAA passenger survey data, compares international scheduled traffic flows from five major UK airports to a number of European countries in 2003 and 2005. Overall across these thirteen countries traffic grew by just over 5% per annum. However, leisure traffic grew by 6.4% per annum and business traffic by 2.5%. This meant that the share of leisure traffic on these country-pairs increased from 69.4% in 2003 to 70.9% in 2005.
Despite the overall share of leisure traffic gaining 1.5 percentage points, out of the thirteen countries analysed eight showed market share gains for business traffic. Traffic from the UK to Austria, Belgium, Denmark, Ireland, Netherlands, Portugal, Sweden and Switzerland showed business traffic growing faster (or declining less quickly) than leisure traffic. The traditional leisure destinations of France, Italy and Spain continued to see faster growth in the leisure market and these larger markets more than offset the losses in the smaller markets. The significant overall decline in the Belgian market can be attributed to the improvements in recent years in the Eurostar rail service from London to Brussels.
Table 45 Scheduled passengers from major UK airports by purpose of travel and country
2003 Passengers
(000s)
2005 Passengers
(000s)
Annual % growth
2003 - 2005 Leisure share
Leisure share
Destination Business Leisure Business Leisure Business Leisure 2003 2005
Austria 320.6 750.6 430.3 858.0 15.9 6.9 70.1% 66.6%
Belgium 730.4 677.1 577.6 375.4 -11.1 -25.5 48.1% 39.4%
Denmark 603.5 998.0 753.8 1,067.5 11.8 3.4 62.3% 58.6%
Finland 260.0 278.7 261.5 367.6 0.3 14.8 51.7% 58.4%
France 2,087.9 4,763.6 1,866.2 4,905.8 -5.5 1.5 69.5% 72.4%
Germany 2,961.1 4,163.3 3,272.8 4,754.0 5.1 6.9 58.4% 59.2%
Ireland 1,760.5 4,854.9 2,116.5 5,433.4 9.6 5.8 73.4% 72.0%
Italy 1,785.6 5.652.6 1,773.5 6,249.1 -0.3 5.1 76.0% 77.9%
Netherlands 1,622.2 1,956.1 1,557.8 1,800.5 -2.0 -4.1 54.7% 53.6%
Portugal 391.4 1,407.3 372.8 1,318.7 -2.4 -3.2 78.2% 78.0%
Spain 1,547.4 7,407.4 1,734.3 10,610.6 5.9 19.7 82.7% 86.0%
Sweden 682.9 1,240.7 828.8 1,302.0 10.2 2.4 64.5% 61.1%
Switzerland 1,174.7 1,894.1 1,204.4 1,748.7 1.3 -3.9 61.7% 59.2%
Total 15,928.3 36,044.3 16,750.3 40,791.3 2.5 6.4 69.4% 70.9%
Source data aggregated from CAA surveys for the four major London airports (Heathrow, Gatwick, Luton and Stansted) and Manchester in 2003 and 2005

Analysis of the EU Air Transport Industry, 2005 118
Further analysis of the UK CAA Passenger Survey Reports for 2003 and 2005 reveals other interesting trends:
The socio-economic profile of passengers travelling for leisure purposes at the two major London airports for low-cost air travel (Stansted and Luton) shows that the share of passengers who come from the lowest socio-economic groups (D and E) has increased at Luton from 8.5% in 2003 to 11.5% in 2005 and at Stansted from 7.8% to 9.5% during the same period suggesting that low-cost carriers are increasingly attracting passengers from the less affluent sections of society.
However, further analysis shows that the proportion of passengers from the most affluent socio-economic groups (A and B) is also increasing, at Luton from 32.8% to 34.0% and at Stansted from 33.5% to 41.1% between 2003 and 2005.
The idea that consumers are taking more frequent but shorter holidays appears to be supported by the data on average trip length. At Stansted the average trip length for UK originating passengers travelling on international scheduled flights for leisure purposes declined from 7.4 days in 2003 to 6.9 days in 2005. For foreign originating passengers the reduction was even more significant from 7.3 days to 6.4 days. However at Luton airport there was less of a change with foreign passengers reducing their average trip length slightly but for UK passengers there was a slight increase.
9.2 Business passengers
In the 2004 EU Annual Report noted the growing importance of price as a key driver of business travel decision-making (particularly in the short haul market). A 2005 research report by Morgan Stanley emphasised the relative importance that price has assumed in the business travel market. In this study, price is evaluated at similar levels of importance as service and routing. It is interesting to note that while the IATA Corporate Air Travel Study from 2004 showed service elements as being subordinate to price, this study shows that service has dramatically increased in importance relative to price and routing.
Figure 53 Important factors in choosing an airline (2004 – 2005)
23%27%
34%
16%
44%
12%
44%
0%
Price Service Routes / directflight
Other
20052004
Source: Morgan Stanley survey results, 2005

Analysis of the EU Air Transport Industry, 2005 119
An annual survey of mainly UK business travellers by Company Barclaycard perhaps supports the Morgan Stanley report view that service is once again becoming more important to business travellers (Table 46). Full service airlines British Airways and Virgin increased their popularity with business travellers while bmibaby fell in popularity. Of the low cost carriers, only easyJet maintained its position. The results suggest that proportion of travellers willing to use LCCs for business has reached a plateau at about 70% of the market. Indeed the data suggest that there has been a slight increase in the proportion of travel taken in business class products.
Table 46 Business traveller behaviour and attitudes
Traveller behaviour and attitudes 1998/99 2001/2002 2002/2003 2003/2004 2004/2005
Favourite airline for business travel
British Airways 58% 47% 46% 35% 43%
KLM 5% 4% 4% 7% 4%
bmi/bmibaby 6% 6% 9% 5% 3%
Virgin 4% Not in Top 5 6% 4% 7%
easyJet 1% 6% 4% 6% 6%
Ryanair Not in Top 5 3% 1% Not in Top 5 Not in Top 5
Use low cost airlines for business travel? 28% 62% n/a 69% 71%
Travellers used e-tickets 19% 57% 64% 67% n/a
Percentage of annual business travel in Business Class 33% 41% 38% 27% 29%
Source: Company Barclaycard
Indeed, according to AEA data, British Airways has enjoyed a slight increase in the proportion of travellers using business class products for intra-European travel. However, this pattern is not repeated across the rest of AEA carriers, with a 1% fall in the number of trips taken in business class. Particularly hit were Lufthansa and SAS, perhaps as business travellers migrate to the LCCs which have grow in importance in the two airlines’ home markets. In a 2005 study, shortly to be published, over fifty aviation executives and analysts reached the consensus that the long term prognosis for business class products for short haul travel in Europe was not good, with 80% of respondents agreeing with the statement ‘business class products will no longer provided on the short haul market by 2015’10.
10 Mason, K. and Alamdari, F. (2007), “EU network carriers, low cost carriers and consumer behaviour: A Delphi study of future trends”, Journal of Air Transport Management.
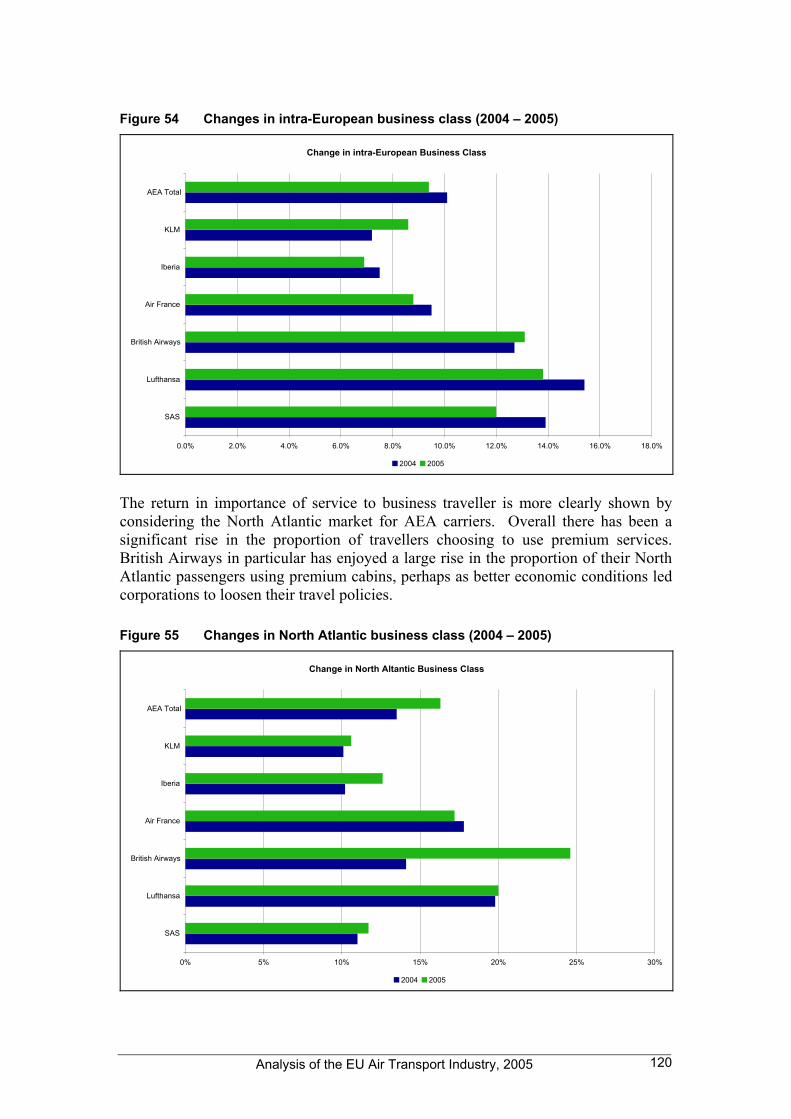
Analysis of the EU Air Transport Industry, 2005 120
Figure 54 Changes in intra-European business class (2004 – 2005)
Change in intra-European Business Class
0.0% 2.0% 4.0% 6.0% 8.0% 10.0% 12.0% 14.0% 16.0% 18.0%
SAS
Lufthansa
British Airways
Air France
Iberia
KLM
AEA Total
2004 2005 The return in importance of service to business traveller is more clearly shown by considering the North Atlantic market for AEA carriers. Overall there has been a significant rise in the proportion of travellers choosing to use premium services. British Airways in particular has enjoyed a large rise in the proportion of their North Atlantic passengers using premium cabins, perhaps as better economic conditions led corporations to loosen their travel policies.
Figure 55 Changes in North Atlantic business class (2004 – 2005)
Change in North Altantic Business Class
0% 5% 10% 15% 20% 25% 30%
SAS
Lufthansa
British Airways
Air France
Iberia
KLM
AEA Total
2004 2005

Analysis of the EU Air Transport Industry, 2005 121
One area that may have a future impact on the business travel market is the growing awareness of the environmental impact business travel has. The European corporate travel buyer association, the Institute of Travel Management, finished 2005 indicating that Corporate Social Responsibility (CRS) was likely to become a major issue in coming years. The ITM consequently launched a strategy for a greener approach to travel. This included more videoconferencing, efforts to "carbon-neutralise" air travel, and taking suppliers' green record into account. How companies can reduce the demand for air travel while maintaining economic growth will depend on how effectively companies assess the reasons why an executive is travelling and what is return on investment does the trip offer. Video-conferencing is most likely to be suited to replacing travel for internal company meetings and a 2005 survey of business travellers11 found that 30% of business travel is for this reason. However, most analysts believe video-conferencing will not reduce the demand for travel in the coming years12
9.3 The leisure travel market
In December 2005 the UK CAA published a report entitled “Demand for Outbound Leisure Air Travel and its Key Drivers”. It concluded that demand for outbound leisure travel from the UK may be relatively immature. Despite a rapid growth in recent years expenditure on overseas holidays (including air fares) still accounted for a relatively small proportion of total consumer expenditure. It predicted that as prosperity per household increased a growing share of expenditure could be spent on holidays abroad.
A detailed examination of historic data suggested that the income elasticity of outbound leisure air travel varies between 1.5 and 1.8 depending on the geographical destination market. Demand was most responsive to income changes on the North American market where a 10% increase in total consumer expenditure is expected to boost demand by 18%, all other factors being equal. A similar increase in total consumer expenditure is expected to boost demand for the Rest of the World and Western Europe by 16% and 15% respectively.
There was some evidence that elasticities in long-haul markets may have declined somewhat between 2000 and 2003. However, this was not interpreted necessarily as a clear sign that long-haul holidays were becoming less fashionable but that the impact of a number of external shocks (such as 9/11 and SARS) had had a particularly strong impact on long-haul demand. In contrast no decline in elasticities was identified in the Western Europe market.
The report also explored the hypothesis that demand for leisure air travel is elastic with respect to changes in air fares. The evidence collected suggested that this may be true in the case of traffic to some more popular short-haul destinations served by no frills airlines. Overall, however, the demand for leisure air travel was found to be moderately inelastic with respect to changes in air fares alone in all three aggregate geographical destination markets. The finding that demand for leisure air travel in aggregate was inelastic with respect to air fares alone was considered intuitively
11 Mason, K. (2006), “The value and usage of ticket flexibility for short haul business travellers”, Journal of Air Transport Management, Vol. 12, pp. 92 -97. 12 Mason, K., and Alamdari, F. ibid.

Analysis of the EU Air Transport Industry, 2005 122
plausible given that air fares typically account for just under one-third of the total costs of travel abroad.
A stated preference survey was undertaken at London Stansted airport which helped reconcile the findings from the econometric analysis that, on the one hand, demand for air travel is overall inelastic with respect to air fares alone, but, on the other hand that individual operators may experience a highly price sensitive reaction from their markets. The findings implied that while a route specific increase in air fares would cause more than proportionate reduction in the number of trips on a route level, the effect at the level of the market would be smaller because many passengers are willing to travel somewhere else cheaper. The survey also suggested that demand becomes more elastic at higher fare levels.
Analysis of the EU Air Transport Industry, 2005 123
SECTION 10
AIRLINE ALLIANCES
10.1 Performance of the major alliance groups .................................124
10.2 Strategic partnerships and European airlines............................126

Analysis of the EU Air Transport Industry, 2005 124
10 Airline alliances
10.1 Performance of the major alliance groups
It is difficult to say how much extra revenue is gained, or costs saved through economies of scale by those members of an airline alliance. Star Alliance and Sky Team do no reveal their figures, while Oneworld disclosed that its alliance fares and corporate sales products generated around $400m among its eight members in 2005. It shows that the main benefits come from code sharing activities within the alliance.
The three global alliances, Star Alliance, Sky Team, and Oneworld, accounted for over 54% of world RPKs in 2005. Between them they carried over 47% of all passengers, and had a revenue share of over 57%. The market shares for these three alliance groups are shown in Table 47. Now that they carry the majority of world passenger traffic, they are battling not just for the international market but for the domestic market too.
Table 47 Alliance Group Market Shares, 2005
Pax (RPK m) Pax (RPK %) Pax (m) Pax (%) Rev ($m) Rev Share (%)
Star Alliance 763,194 20.9% 371 18.9% 98,514 24.5%
Oneworld 547,099 15.0% 221 11.4% 57,242 14.4%
Sky Team 675,515 18.6% 329 17.0% 73,638 18.4%
Total 1,985,808 54.5% 921 47.3% 229,394 57.3%
Source: IATA
Figure 56 Share of IATA airline traffic by alliance group, 2005
21%
19%
15%
45%Star AllianceSky TeamOneworldOther
Source: IATA
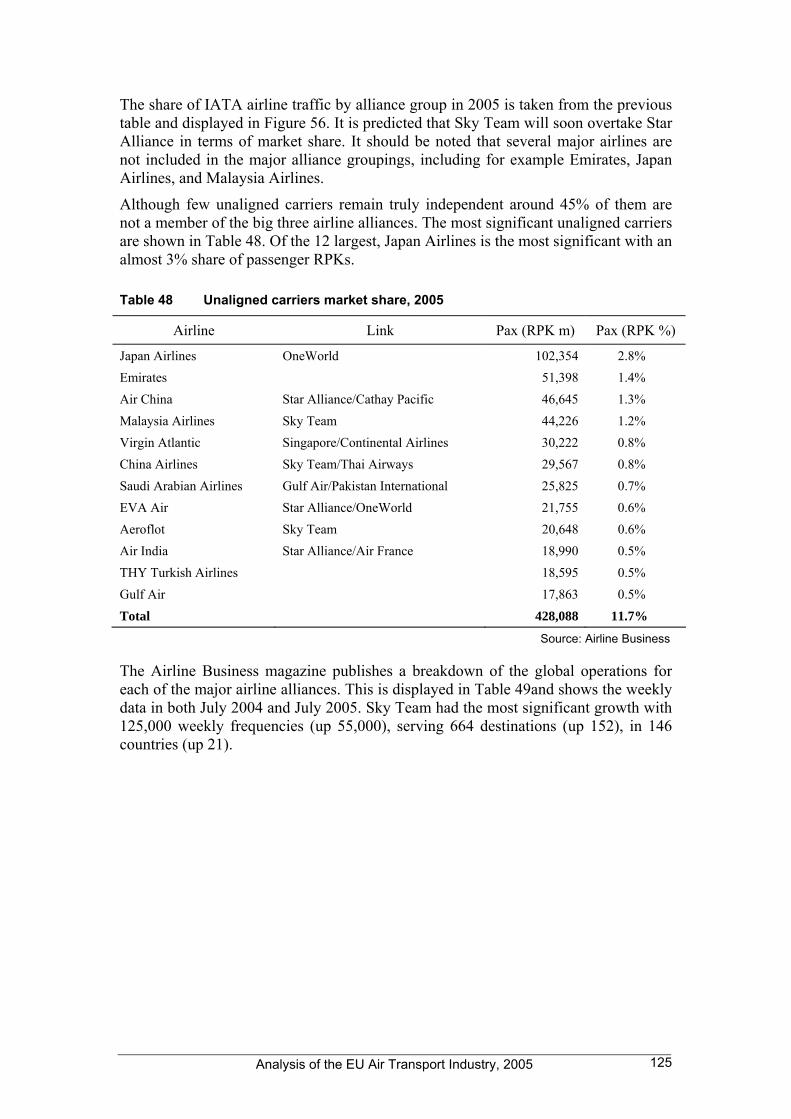
Analysis of the EU Air Transport Industry, 2005 125
The share of IATA airline traffic by alliance group in 2005 is taken from the previous table and displayed in Figure 56. It is predicted that Sky Team will soon overtake Star Alliance in terms of market share. It should be noted that several major airlines are not included in the major alliance groupings, including for example Emirates, Japan Airlines, and Malaysia Airlines.
Although few unaligned carriers remain truly independent around 45% of them are not a member of the big three airline alliances. The most significant unaligned carriers are shown in Table 48. Of the 12 largest, Japan Airlines is the most significant with an almost 3% share of passenger RPKs.
Table 48 Unaligned carriers market share, 2005
Airline Link Pax (RPK m) Pax (RPK %)
Japan Airlines OneWorld 102,354 2.8% Emirates 51,398 1.4% Air China Star Alliance/Cathay Pacific 46,645 1.3% Malaysia Airlines Sky Team 44,226 1.2% Virgin Atlantic Singapore/Continental Airlines 30,222 0.8% China Airlines Sky Team/Thai Airways 29,567 0.8% Saudi Arabian Airlines Gulf Air/Pakistan International 25,825 0.7% EVA Air Star Alliance/OneWorld 21,755 0.6% Aeroflot Sky Team 20,648 0.6% Air India Star Alliance/Air France 18,990 0.5% THY Turkish Airlines 18,595 0.5% Gulf Air 17,863 0.5% Total 428,088 11.7%
Source: Airline Business
The Airline Business magazine publishes a breakdown of the global operations for each of the major airline alliances. This is displayed in Table 49and shows the weekly data in both July 2004 and July 2005. Sky Team had the most significant growth with 125,000 weekly frequencies (up 55,000), serving 664 destinations (up 152), in 146 countries (up 21).

Analysis of the EU Air Transport Industry, 2005 126
Table 49 Weekly global operations
Total Destinations
Duplicate Destinations
Countries Serves
Frequencies '000s
ASK billions
Star Alliance
July 2004 798 317 140 121 28.0
July 2005 770 270 140 120 29.5
Change -28 -47 0 -1 1.5
OneWorld
July 2004 591 210 136 67 19.9
July 2005 549 157 133 63 19.4
Change -42 -53 -3 -4 -0.5
Sky Team
July 2004 512 120 125 70 13.4
July 2005 664 328 146 125 26.2
Change 152 208 21 55 12.8
Airline Business, 2004, 2005
There have been a series of peaks in alliance formation since the Airline Business magazine began monitoring the trend in 1994. Table 50 shows the number of airlines and alliances increased over the last decade. By 2005 a total of 114 airlines had formed 956 alliances, with an average of 8.4 alliances per airline..
Table 50 Trend in airline alliance formation
Year Number of airlines
Number of alliances
Average per airline
1994 68 280 4.1
1995 77 324 4.2
1996 86 390 4.5
1997 89 363 4.1
1998 98 502 5.1
1999 102 513 5.0
2003 108 838 7.8
2004 112 930 8.3
2005 114 956 8.4
Source: Airline Business
10.2 Strategic partnerships and European airlines
An important part of the European airline business has always been collaboration. The airline alliance activity seen in 2005 continues to show no sign or slowing with the

Analysis of the EU Air Transport Industry, 2005 127
industry witnessing a significant number of tactical and strategic partnerships. Table 51 shows a list of all agreements involving European carriers in 2005.
The philosophy behind strategic alliances continues to encompass the following factors:
• An increase in the level of traffic through access to new markets and traffic feed which would otherwise not have been possible.
• An ability to code share which has the effect of upgrading interline connections to online status, offering substantial advantages in selling, especially in terms of CRS display.
• A greater marketing power through increased joint market share, frequent flyer programme combination, ease of baggage transfer, single check-in for multiple sector trips, and shared airport lounges.
• An increase in load factors through improved traffic feed and through fares
• The use of joint scheduling and hub coordination to increase operational efficiency
• The use of cost reductions through the operation of joint services and rationalisation of schedules, reciprocal sales arrangements, joint ventures such as catering and maintenance, and the joint purchasing of supplies.
• An improvement of customer benefits
The concept of airline alliances originally developed to earn revenue. As regulation restricted airlines from merging they decided to grow revenue through their membership of an alliance. It was envisaged that aircraft could be purchased in bulk, operations could be synergised, and prices would ultimately come down. This was to some extent successful except that joint aircraft purchases became impossibly difficult. The future may see savings come from direct sales, distribution, ticketing, and scheduling.
The largest second-tier growth came during the summer of 2005 with Sky Team welcoming Air Europa, Copa Airlines, Kenya Airways, Tarom, and Portugalia, to its associate membership programme. It also prepares to have Aeroflot and China Southern Airlines join the scheme. The Air France takeover of KLM is expected to result in changes to Sky Team and the KLM-Northwest Airlines partnership in particular.
Star Alliance saw Adria Airways, Blue1, and Croatia Airlines, join its regional membership programme. It gained Swiss through its ownership of Lufthansa and expected to have South African Airways join next April.
Oneworld will have Malev join as a full member next year. While its historic growth has been limited it is hoping to use Cathay Pacific’s stake in Air China to gain a foothold in China. It may also use relationships between Air Sahara and both American Airlines and British Airways to expand into India. It is also actively trying to persuade Japan Airlines to join the alliance.
Lufthansa and TAP Air Portugal have started an extensive strategic cooperation. As of 1st February 2005, the two airlines offer code-sharing flights. Also in other areas such as baggage handling, airport services and lounges, coordinated procedures will all contribute to an improvement in travel comfort for the passengers.

Analysis of the EU Air Transport Industry, 2005 128
Table 51 Airline alliances (code shares) commenced by European airlines in 2005
Airline 1 Global Alliance
IATA Code Airline 2
Aegean Airlines LH Lufthansa Aeroflot Russian Airlines KM Air Malta Aeroflot Russian Airlines AZ Alitalia AeroSvit Airlines CY Cyprus Airways Air Canada Star Alliance AP Air One Air Europa MU China Eastern Airlines Air France Sky Team CO Continental Airlines Air Malta SU Aeroflot Russian Airlines Air Malta DM Maersk Air Air Malta QF Qantas Airways Air Mauritius LT LTU International Airways Air One AC Air Canada Air One TP TAP Portugal Alitalia SkyTeam SU Aeroflot Russian Airlines All Nippon Airways Star Alliance LO LOT Polish Airlines Austrian Airlines Star Alliance SA South African Airways Austrian Airlines Star Alliance TP TAP Portugal China Eastern Airlines UX Air Europa Continental Airlines SkyTeam AF Air France Cyprus Airways VV AeroSvit Airlines Kuwait Airways TK THY Turkish Airlines LOT Polish Airlines Star Alliance NH All Nippon Airways LOT Polish Airlines Star Alliance SK Scandinavian Airlines LTU International Airways MK Air Mauritius Lufthansa Star Alliance A3 Aegean Airlines Lufthansa Star Alliance TP TAP Portugal Maersk Air KM Air Malta Qantas Airways OneWorld KM Air Malta Royal Air Maroc TK THY Turkish Airlines Scandinavian Airlines Star Alliance LO LOT Polish Airlines South African Airways OS Austrian Airlines Spanair Star Alliance TP TAP Portugal TAP Portugal Star Alliance AP Air One TAP Portugal Star Alliance OS Austrian Airlines TAP Portugal Star Alliance LH Lufthansa TAP Portugal Star Alliance JK Spanair TAP Portugal Star Alliance UA United Airlines THY Turkish Airlines KU Kuwait Airways THY Turkish Airlines AT Royal Air Maroc United Airlines Star Alliance TP TAP Portugal Virgin Atlantic Airways DJ Virgin Blue Virgin Blue VS Virgin Atlantic Airways
Source: Airline Business
Members of the airlines’ frequent flyer programmes, Miles and More and Navigator, can collect miles as of 1st February 2005 on flights of the respective other airline. The redemption of miles with the respective other airline will be made possible by the admission of TAP to the Star Alliance which is scheduled for spring 2005.

Analysis of the EU Air Transport Industry, 2005 129
At the same time TAP will transfer its operations and passenger check-in facilities to the Star Alliance/Lufthansa terminals at Frankfurt Airport (Terminal 1) and at Munich Airport (Terminal 2), in order to provide its passengers with rapid and convenient transfers between TAP and Lufthansa as well as the other partner airlines.

Analysis of the EU Air Transport Industry, 2005 130
SECTION 11
AIRLINE DISTRIBUTION

Analysis of the EU Air Transport Industry, 2005 131
11 Airline Distribution
The development of the internet as a suitable alternative method of distribution has enabled the airlines to bring greater pressure to bear on the established means of distribution and 2005 represented a year of continued positioning and repositioning in the distribution field. This comes as major airlines strive to refine their distribution strategies so they can connect more directly with their customers.
The low cost carriers have shown the internet can be a very effective means of distribution with most LCCs achieving over 85% of sales through this very low cost channel.
Table 52 Proportion of European LCC sales made online
% Jet2.com 97 bmibaby 95 FlyMe 95 Vueling 94 Ryanair 94 easyJet 94 Germanwings 94 hlx 90 flybe 85 Monarch Scheduled 85 Sterling 85 Wizz Air 85 Norwegian 75 Virgin Express 70 SkyEurope 56 Air Berlin 52
Source: Airline websites
In 2004, British Airways attempted to move as many bookings as possible to its cheapest distribution channel, the internet. During 2005 British Airways sold 54% of short haul point-to-point non-premium services on their own website (BA.com), and across their entire network the airline sold 25% of its tickets via this channel. This level was ahead of its planned channel shift strategy reported in the 2004 EU Annual Report and by selling via BA.com it avoided both agency and GDS fees. Airlines argue that for the most simple itineraries and within their home markets the travel agent has limited advisory work to do and the GDS cost does not reflect its fees to list the inventory and record the sale.
In response, the Travel Management Companies (these former travel agents now gain most of their revenues direct from travellers in the form of service fees) recognise that for simple itineraries (70% of journeys are point to point13) they have to be able offer travellers low cost booking options like self-booking tools, and for the remaining 30% of bookings offer travel clients a number of alternative booking methods.
13 Richard Lovell, Carlon WagonLit Travel, 2005

Analysis of the EU Air Transport Industry, 2005 132
While most airlines had removed all or most travel agency commissions by 2005, the remaining few cut their agency payments in 200514. Having achieved significant savings from these cuts, the airlines have focused increasingly on the Global Distribution Systems in a bid to further drive down their distribution costs.
Table 53 Distribution costs for airlines as a percentage of ticket costs
Distribution third parties Cost as % of ticket prices
GDS 8 – 11%
Travel Agency 1 – 2 %
Mercantile (Credit Card) fee 2 – 3%
UATP (Universal Air Travel Plan), Airline Business July 2005
Examining the distribution chain it is clear that GDS fees now represent the largest single item in the distribution chain for airlines. The GDSs account for some 65% of all air bookings15. Airlines globally spend $5 billion per annum on GDS fees (Airline Business, July 2005). The GDSs have well established global communication networks that enable airlines to list, virtually instantaneously, their inventories of available seats and prices. Since their establishment in the 1970s the airlines have been the principal shareholders of the main GDSs and were consequently regulated to ensure that every airline’s inventory was listed in the same fashion on all systems. However after most US airlines divested themselves of their GDS shareholding the US deregulated the GDS market in 2003 enabling airlines to negotiate ‘content-for-discount’ deals with preferred GDSs.
While US carriers have divested of GDSs, the GDSs with the largest market share in Europe with 49% of the market, Amadeus, was 45.7% owned by Lufthansa, Iberia and Air France.
Table 54 GDS market structure by region
USA/ Canada
Central/ South America
Europe/ Middle East
Asia/ Pacific
Global Average
Amadeus 9% 38% 49% 15% 26%
Galileo 21% 6% 31% 15% 22%
Sabre 42% 50% 13% 4% 24%
Worldspan 28% 6% 8% 4% 14%
Abacus 19% 4%
Topas 4% 1%
Infini 4% 1%
TravelSky 36% 8%
Source: Star Alliance, 2005
14 For example, Air France in April 2005 stopped paying any commission to travel agents that charge consumers for their services which led to a 14.2% reduction in its distribution costs in 2005 15 Richard Clarke, Travel Technology Research

Analysis of the EU Air Transport Industry, 2005 133
In 2005 most airlines were in the second of a three year deal with GDSs that gave the airline a discount on fees for continued full content provision. However the airlines still wish to see a reduction in their cost exposure to the GDSs, and the growth of the internet as a suitable alternative method by which airlines can distribute tickets has led to airlines pursuing channel shift strategies (as described in the Cranfield ‘Analysis of the EU Air transport industry, 2004’) and to seek new Internet Protocol (IP) distribution solutions.
The sixteen airline strong Star Alliance requested proposals from a number of Global Distribution New Entrants (GNE) to help reduce their collective $11 billion annual spend on distribution of which GDS fees accounted for nearly $2 billion. Companies such as G2 Switchworks and ITA Software were invited to develop methods by with customers could access the airlines’ inventories directly via their websites but in an integrated fashion using IP infrastructure at a significantly lower cost than traditional GDS methods. This move has sent the GDSs the very clear message that airlines are willing to seek out the lowest cost way to distribute their product.
Table 55 Star Alliance’s $11bn distribution costs
Distribution activity Proportion of distribution costs
Promotion and advertising 20% media 8% personnel 2% loyalty programmes 2% other 7% CRS /GDS fees 18% Credit card fees 18% Sales 22% sales force/reservations 5% benefits 6% management and staff 3% other 8% Commissions (passenger) 19% Commissions (cargo) 1%
Source: Star Alliance
The potential threat of GNEs has meant the main GDSs (Sabre, Amadeus, Galileo and Worldspan) are having to address the underlying complaints of the airlines:
• For simple bookings the GDS systems offer more sophistication (and thereby cost) than the airlines need
• For all bookings the costs have been rising without any transparently obvious reason at the same time that the GDSs have been enjoying very high levels of profitability.
Consequently, the GDSs are looking at new business models that enable them to offer a better value proposition to the full-service carriers, while also looking to offer new products to attract low-cost carriers that have mainly avoided GDS listings. In short the GDSs recognise they need to change their business model to offer better value and also recognise that as more bookings are made directly, they need to diversify into new areas such as IT services and adding other online travel-related content, such as

Analysis of the EU Air Transport Industry, 2005 134
hotels and car hire. Amadeus, for example noted that it had attracted 25 small low cost carriers onto a new low-cost value service it had introduced and was seeking to sign up some large LCCs. EasyJet is one large LCC that is considering listing on such a service16 as it seeks to increase the proportion of business travellers flying with them, and, without a GDS listing, corporate travellers may not see its fares on their companys’ self booking tools. Cendant, the owner of Galileo, has recently bought the airline internet portal Orbitz indicating that GDSs are increasingly looking to a number of new business models to serve the market in the internet age.
As travellers become increasingly used to the fare transparency offered by the internet and travel suppliers, and intermediaries are attracted to it due to its low costs, the effort required by the traveller to find the lowest fare has increased dramatically. Meta-search engines for travel are gaining a small if growing share of the travel market. These engines search dozens of sites at once, searching airlines, hotels, resorts, rental car firms and others for any offering that meets the traveller’s search demands. The results are then presented according to the travellers search criteria. The search engine makes money from a referral commission paid by the supplier for the traveller clicking from the meta-search engine through to their websites.
While this market is very small at the moment (2% according to Airline Business, July 2005) the developing interest from major internet companies such as Yahoo and Google may mean this channel will grow in importance in the future.
On of the key goals of IATA’s Simplifying the Business programme is to achieve 100% e-ticketing by the end of 2007. Removing the need for paper tickets in the airline industry will significantly reduce costs for airlines both in producing paper tickets during the sales process and also at the airport.
Figure 57 E-Ticket penetration by IATA airlines by region
Source: IATA
16 PhoCusWright Distribution executive conference in Paris, April 2005

Analysis of the EU Air Transport Industry, 2005 135
IATA estimates that the cost of producing an e-ticket is $1 compared to $10 for a paper ticket. If the industry achieves 100% e-ticketing it would save the industry an estimated $3 billion per annum. By November 2005, 40% of all tickets recorded in IATA’s BSPs (Billing and Settlement Plans) were sold as e-tickets, with Europe achieving about 60% in December 2005 and some airlines exceeding this level significantly (e.g. by December 2005, BA issued 84% of tickets in e-ticket format)
Interline e-ticketing is particularly hard to achieve especially for airlines that interline with airlines in less developed regions. IATA’s programme appears to be on-track but irrespective of whether the programme delivers its 100% objective the progress so far has helped airlines remove an unnecessary and significant cost burden.

Analysis of the EU Air Transport Industry, 2005 136
SECTION 12
AIRCRAFT AND MANUFACTURERS
12.1 Large airliners (over 120 seats) ...................................................137
12.2 Regional airliners............................................................................138

Analysis of the EU Air Transport Industry, 2005 137
12 Aircraft and manufacturers
12.1 Large airliners (over 120 seats)
2005 was a record breaking year for both Airbus and Boeing with net orders for their commercial airliners totalling 2,057, with a total book value estimated to be around $193 billion. Unlike the previous record year, 1998, when the US carriers dominated the order book, the emerging markets of the Middle East, Asia and Latin America and the Low Cost Carriers of Europe accounted for much of total.
Airbus, for the third year running, bettered its US rival with 52% market share in terms of net orders, although, due to the American manufacturer’s increased orders for wide-bodies, it is estimated that the market share by value was more like 43% to Airbus and 57% for Boeing.
The number of aircraft delivered by Airbus and Boeing in 2005 was 668. Airbus’ total was 378 (up from 320 in 2004) while Boeing’s was 290 (up by five on the previous year).
12.1.1 Airbus The A320 family gained the lion’s share (86%) of the European manufacturer’s orders with some 912 net orders, following particularly the placement of large orders by operators in China, and India. In the wide-body market the A330 and A340 made up 79 net orders while the A350 gained 87 orders and the A380 picked up 20 new orders.
The A380 made its maiden flight on 27 April 2005 and so began the 18 month test programme of flight trials and certification for the new superjumbo.
The recently launched A350 continued to be promoted by Airbus, although increasingly airlines and leasing companies were voicing concerns about its competitiveness compared with the more radical Boeing 787.
The average value per aircraft for Airbus in 2005 was about $80m - a decrease of some 13% on 2004 figures, possibly due to the preponderance of narrow body orders. The total value of sales of Airbus in 2005 was estimated as being $27.3 billion, around 8.5% up on the previous year.
12.1.2 Boeing The Boeing 737NG family continued to be the most popular family for the US manufacturer with a total of 569 net orders received in 2005.
235 orders were received for the 787 (formerly known as the 7E7); 154 for the 777; 43 for the 747 family (including 18 for the newly launched 747-8) and 15 for the 767, the latter being for freighter variants.
Boeing’s 787 reached a number of milestones in 2005, namely the firming of the configuration, building of the first composite fuselage sections and the unveiling of the flight deck.

Analysis of the EU Air Transport Industry, 2005 138
At the large aircraft end of the market, Boeing launched the 747-8 Intercontinental – offering a stretch over the current 747-400 aircraft. They also launched a freighter variant of the 777.
The latest passenger variant of the 777 family, the 777-200LR, set a new record for the longest distance flown non-stop by a commercial airliner with an eastbound flight from Hong Kong to London which covered 21,578 km (11,664 nm) and lasted 22 hours and 42 minutes.
Meanwhile the last 757 was delivered marking the end of a 23 year and over 1,000 aircraft production run. Boeing also announced that it would be ceasing production of the ill-fated 717 aircraft in 2006. Initially developed by McDonnell Douglas as the MD-95, the aircraft was inherited when Boeing took over its US rival, but it soon became an orphan in its new home, since it competed with the smaller variants of the highly successful 737NG family.
The average value of aircraft sold by Boeing in 2005 was $109m, 5.8% up on the previous year and some 37% more than the respective value for Airbus (again illustrating the different mix of aircraft ordered). Meanwhile the total value of sales generated by Boeing in 2005 was estimated at $22.7 billion, an increase of 7.8% on the previous year.
12.2 Regional airliners
The market for regional airliners in 2005 saw orders for small regional jets continue to decline, but the resurgence of the turboprop.
12.2.1 ATR The Franco-Italian turboprop manufacturer had its best annual orderbook for over ten years with a total of 90 aircraft ordered, compared to 12 in 2004, helped by a major order for 30 aircraft from Air Deccan. Production of the ATR42 and 72 increased from 13 in 2004 to 15 in 2005.
12.2.2 AvCraft and Raytheon AvCraft filed for insolvency in March having struggled to make a business from the 328 production line it had acquired when Fairchild Dornier gave up in 2002. Raytheon made no new sales of its long-running 1900 aircraft although it is still being marketed.
12.2.3 Bombardier The Canadian manufacturer’s net orders plummeted in 2005 to 60, down from 162 in 2004. In terms of orders for its regional jets it experienced a net loss of one order (mainly due to the dramatic fall off in 50 seat orders, it suffered a net loss of 69 CRJ200 orders in 2005). This was compensated for by the relative success of its turboprops with 10 Dash8Q300s and 49 Q400s ordered in the year
In terms of deliveries, regional jets were down from 175 in 2004 to 125 in 2005 while its Q Series doubled from 19 to 28.

Analysis of the EU Air Transport Industry, 2005 139
12.2.4 Embraer Total net orders for the Brazilian manufacturer totalled 90, representing a drop of 18 over 2004. The ERJ family suffered a net loss of seven orders in the year mirroring the collapse in the 50-seat market. However, the EJet family fared better with 97 orders booked.
Overall deliveries at Embraer in 2005 at 120 showed a 10% decline on 2004’s figures with small jet deliveries almost halved to 46 aircraft and with 72 of the E-jet family delivered.
The tables below indicate the numbers of aircraft ordered from and delivered by the major western commercial aircraft manufacturers. Table 56 includes the narrow-body and wide-body aircraft manufactured by Airbus and Boeing. Data includes A319CJ and Boeing BBJ. In the column ‘changes’ a negative entry refers to cancellations, while a positive number indicates orders converted from one model to another, without a ‘new’ order taking place.
Table 56 Jet airliner orders and deliveries 2005 2004
Deliveries Orders Changes Net Orders Backlog Deliveries Net Orders
Airbus
A300 9 7 -37 -30 15 12 2
A310 0 0 0 0 5 0 0
A318 9 41 -5 36 69 10 -18
A319 142 206 +3 209 446 87 105
A320 121 568 -4 564 959 101 185
A321 17 103 0 103 178 35 7
A330 56 64 -10 54 186 47 48
A340-300 4 3 -3 0 5 5 0
A340-500/600 20 12 0 12 68 23 27
A350 0 87 0 87 87 0 0
A380 0 20 0 20 159 0 10
Airbus total 378 1,111 -56 1,055 2,177 320 366
Boeing
717 13 0 -14 -14 5 12 8
737 212 574 -5 569 1,133 202 147
747-400 13 30 -5 25 44 15 10
747-8 0 18 0 18 18 0 0
767 10 19 -4 15 30 9 9
777 40 153 +1 154 288 36 42
787 0 235 0 235 291 0 56
Boeing total 290 1,029 -27 1,002 1,809 285 272
Grand total 668 2,140 -83 2,057 3,986 605 638
Source: Flight International

Analysis of the EU Air Transport Industry, 2005 140
Table 57 Regional jet airliner orders and deliveries
2005 2004
Seats Deliveries Orders Backlog Deliveries Orders Backlog
AvCraft
328Jet* 33 6 -6 0 8 18 12
Bombardier
CRJ100/200 50 35 -69 19 75 69 123
CRJ440 40 12 11 0 33 0 1
CRJ700-701 70 49 43 64 52 51 70
CRJ700-705 75 15 0 0 0 -10 15
CRJ900 90 14 14 20 15 20 20 Bombardier
total 125 -1 103 175 130 229
Embraer
ERJ-135 37 2 0 15 1 1 17
ERJ-140 44 0 0 20 0 0 20
ERJ-145 50 46 -7 10 87 9 66
170 70 46 40 106 46 38 112
175 78 14 7 8 0 15 15
190 98 12 36 179 0 45 155
195 108 0 14 29 0 0 15
Embraer total 120 90 367 134 108 400
Grand total 251 83 470 317 256 641
Source: Flight International
Table 58 Turboprop airliner orders and deliveries
2005 2004 Seats Deliveries Orders Backlog Deliveries Orders Backlog
ATR ATR 42 48 5 17 16 5 1 4 ATR 72 68 10 73 73 8 11 10
ATR total 15 90 89 13 12 14 Bombardier
Dash 8 Q200 37 1 2 2 1 1 1 Dash 8 Q300 50 9 10 21 8 18 20 Dash 8 Q400 74 18 49 57 10 13 26
Bombardier total 28 61 80 19 32 47 Raytheon
Beech 1900 19 0 0 0 1 1 0 Grand total 43 151 169 33 45 61
Source: Flight International

Analysis of the EU Air Transport Industry, 2005 141
SECTION 13
PUBLIC SERVICE OBLIGATIONS
13.1 INTRODUCTION ..................................................................................142
13.2 USE OF THE PUBLIC SERVICE OBLIGATION (PSO)....................... 142
13.3 PSO TENDERING...............................................................................143

Analysis of the EU Air Transport Industry, 2005 142
13 Public Service Obligation (PSO)
13.1 Introduction
One of the consequences of deregulating Europe’s airline industry has been the need to provide direct subsidies in order to ensure the continuation of air services to remoter communities. EU Member States are allowed to award subsidies for such operations under Article 4 of Council Regulation (EEC) No. 2408/92 on Access for Community Air Carriers to Intra-Community Air Routes. They are administered, awarded and funded by both national and regional governments, either directly or indirectly through associated agencies. In Finland, Greece, Iceland, Ireland, Norway, Portugal and Sweden, national government departments administer air service PSOs, while in France, Germany, Italy and Spain, administration is in the hands of regional authorities. In the UK, where PSOs only exist in Scotland, the Scottish Executive is responsible for administering the routes operated from Glasgow and the respective regional authority for services provided in Orkney, Shetland and Western Isles.
13.2 Use of the PSO
Ten Member States (Finland, France, Germany, Greece, Ireland, Italy, Portugal, Spain, Sweden and the UK) and two European Economic Area countries (Iceland and Norway) had PSOs in 2005, with France and Norway accounting for around one half of these. During 2005 an additional forty PSO were imposed, while on six routes the obligations were lifted (Table 59). This information relates only to the publication of the lifting or imposition of obligations in the Official Journal.
PSOs require the operating carrier to adhere to fixed levels of service for the duration of the contract. In the majority of cases, the airline is required to provide a minimum daily service frequency and/or number of seats, with the administering authority determining what this should be. There are often specific timetabling requirements to which the operator must comply. Many of these are there to enable passengers to undertake day return trips and to make convenient onward connections. In addition, there have been an increasing number of conditions set relating to the type of aircraft that must be employed.
The maximum fare that may be charged on PSO routes is stipulated. Wide variations exist however in these levels for routes of similar distance and traffic volumes, with certain countries being much more generous to travellers in terms of setting lower maximum fares and paying higher levels of subvention.

Analysis of the EU Air Transport Industry, 2005 143
Table 59 PSO lifted and imposed during 2005
Finland France Iceland Norway imposed imposed lifted imposed Imposed*
Helsinki-Mikkeli La Rochelle-Lyon Corsica-Lyon Reykjavik-Bildudalur Lakselv-Tromsø Helsinki-Savonlinna La Rochelle-Poitiers Corsica-Montpellier Reykjavik-Gjogur Andenes-Bodø Helsinki-Varkaus Le Havre-Rouen Reykjavik-Hofn Andennes- Tromsø Le Havre-Strasbourg Reykjavik-Saudarkrokur Svolvær- Bodø St Brieuc-Nantes Akureyri-Grimsey Leknes- Bodø St Brieuc-Paris Akureyri-Vopnafjordur Røst-Bodø Narvik-Bodø Brønnøysund-Bodø Brønnøysund-Trondheim Sandnessjøen-Bodø Sandnessjøen-Trondheim Mo I Rana-Bodø Mo I Rana-Trondheim Mosjøen-Bodø Mosjøen-Trondheim Namsos-Trondheim Rørvik-Trondheim Florø-Oslo Florø-Bergen Førde-Oslo Førde-Bergen Sogndal-Oslo Sogndal-Bergen Sandane-Oslo Sandane-Bergen Ørsta-Volda-Oslo Ørsta-Volda-Bergen Fagernes-Oslo Røros-Oslo
* The Norwegian PSO routes are tendered for in 16 route groupings, some of which may be combined. Source: Wilmer, Cutler, Pickering, Hale and Dorr, 2005.
13.3 PSO tendering
It is clear that most PSO routes continue to be operated by locally based airlines. It would appear that carriers with previous experience of operating such routes have an advantage over new entrants. The comparatively short time allowed between notification that a carrier’s tender has been selected and when it must commence operation has been cited by some airlines as a deterrent to submitting a bid. This is particularly the case when a carrier based in one Member State is contemplating a PSO bid on a route in another country. The leasing of aircraft, the setting up of an operating base and the arranging of crewing, ground handling, maintenance, etc., all take time and may represent a significant outlay to a small carrier. In the event of not winning the tender round, such an airline may be faced with significant sunk costs.
Norway has the largest number of PSO routes in operation and is the most open in terms of the information it provides in respect of the tendering process. Initially, the

Analysis of the EU Air Transport Industry, 2005 144
Norwegian Government required that its PSO routes be tendered for all together in one bid, but subsequently the routes have been offered in fifteen separate groupings in order to encourage more airlines to tender. In the most recent tendering round covering the period 2003-2006, the possibility of combining route areas in the bidding process has been introduced. The use of different sized aircraft has also been permitted, to encourage bids from smaller operators. The net effect of these changes has been positive with an increase in the number of bids received from carriers other than the long established operator, Widerøe, and a 5.2% decrease in the annual operating subsidy. Table 60 shows the number of bids received for each of the route areas and the winning carrier in each case.
Table 60 Norwegian PSO routes 2003-2006
Route area Tendering carriers Winning tender
1 Widerøe, Arctic Air Widerøe
2 Widerøe, Arctic Air Widerøe
3 Norwegian Air Shuttle, Widerøe, Kato Airline Norwegian Air Shuttle*
4 Norwegian Air Shuttle, Widerøe, Kato Airline Norwegian Air Shuttle*
5 Widerøe Widerøe
6 Widerøe Widerøe
7 Kato Airline, Arctic Air, Widerøe Kato Airline
8 Kato Airline, Arctic Air, Widerøe Kato Airline
9 Widerøe, Kato Airline, Coast Air Widerøe
10 Widerøe, Arctic Air Widerøe
11 Danish Air Transport, Widerøe, Coast Air Danish Air Transport
12 Widerøe, Coast Air Widerøe
13 Widerøe, Coast Air Widerøe
14 Coast Air, Danish Air Transport, European Executive Express, Arctic Air Coast Air
15 Widerøe, Coast Air, Danish Air Transport, European Executive Express, Kato Airline Widerøe
* Norwegian Air Shuttle later gave notice that it wished to withdraw from the contract. Source: Ministry of Transport and Communications, Norway.
Norway’s Ministry of Transport and Communications provides a great deal of information to prospective bidders, including details of the subsidy levels sought by each carrier during previous tendering rounds, the amount of traffic carried and revenue generated on each route, the proportion of full fare traffic by route and the amount of transfer traffic on each sector. In this way an accurate picture of demand levels can be provided to would-be operators, thereby reducing some of the uncertainty associated with operating in a new market. Despite this, the level of subvention required by tendering carriers to operate specific route area PSOs in Norway reveals some wide variation. Figure 58 and Figure 59 show the amounts of subsidy required by the airlines tendering for two of the route areas covering the period 2003-2006. The names of the bidding carriers and the actual route areas are excluded here for reasons of confidentiality.

Analysis of the EU Air Transport Industry, 2005 145
Figure 58 First Route Example: Tenders for 2003-2006
Source: Ministry of Transport and Communications, Norway.
Figure 59 Second Route Example: Tenders for 2003-2006
Source: Ministry of Transport and Communications, Norway.
0
50
100
150
200
250
Airline 1 Airline 2 Airline 3 Last operator
Cos
t Ind
ex
Previous Tender Round
0
20
40
60
80
100
120
140
160
Airline 1 Airline 2 Airline 3 Last operator
Cos
t Ind
ex
Previous Tender Round