Embed Size (px)
Citation preview
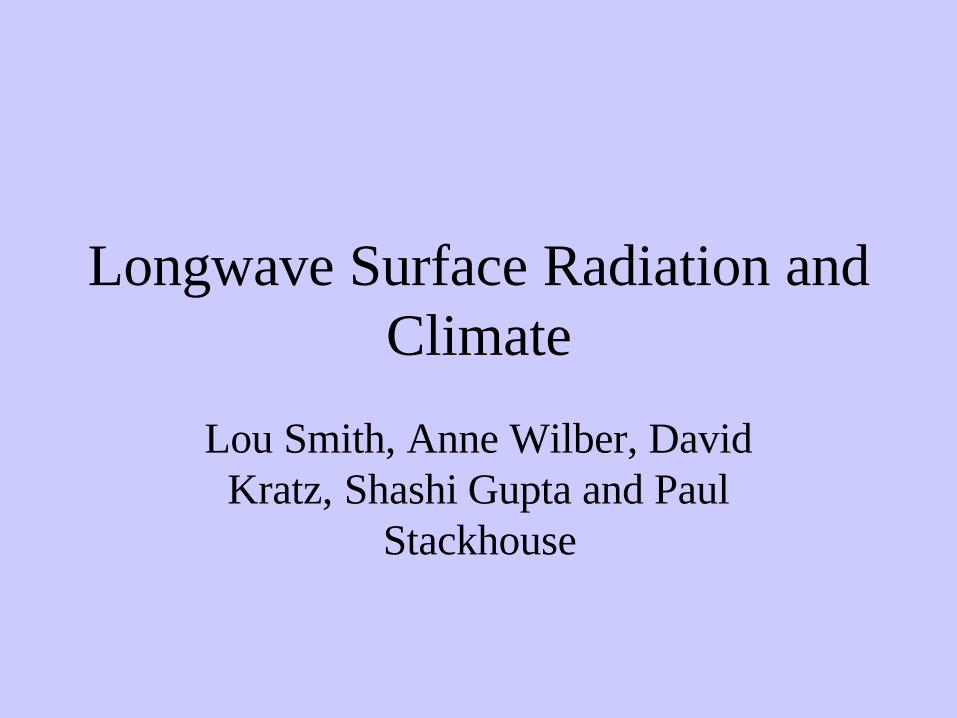
Longwave Surface Radiation and Climate
Lou Smith, Anne Wilber, David Kratz, Shashi Gupta and Paul
Stackhouse

QUESTION:
•What is the Climatological Relation of the Surface Downward Longwave Flux to the Surface Upward Longwave Flux?
•We Use the Surface Radiation Budget Data Set of NASA Langley Research Center to Examine this Question.
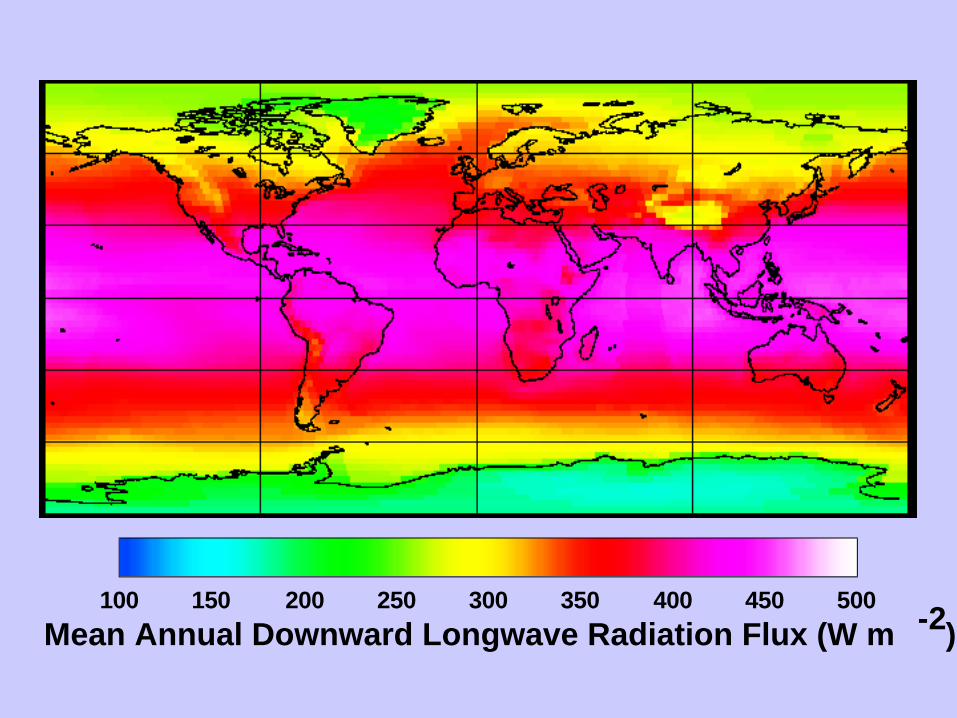
100 150 200 250 300 350 400 450 500
Mean Annual Downward Longwave Radiation Flux (W m -2)
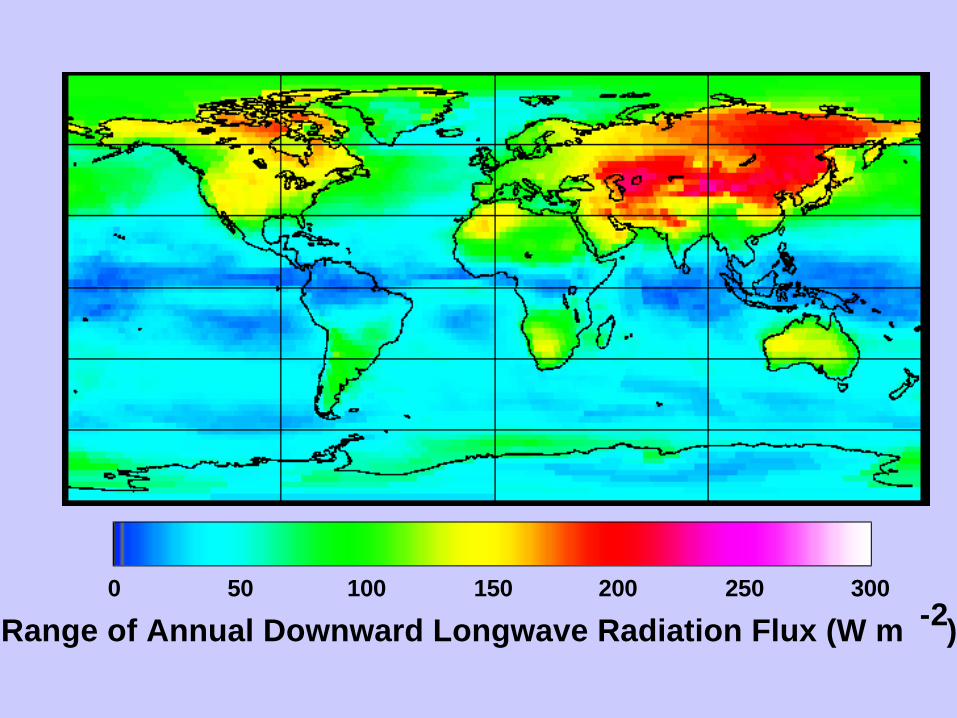
0 50 100 150 200 250 300
Range of Annual Downward Longwave Radiation Flux (W m -2)
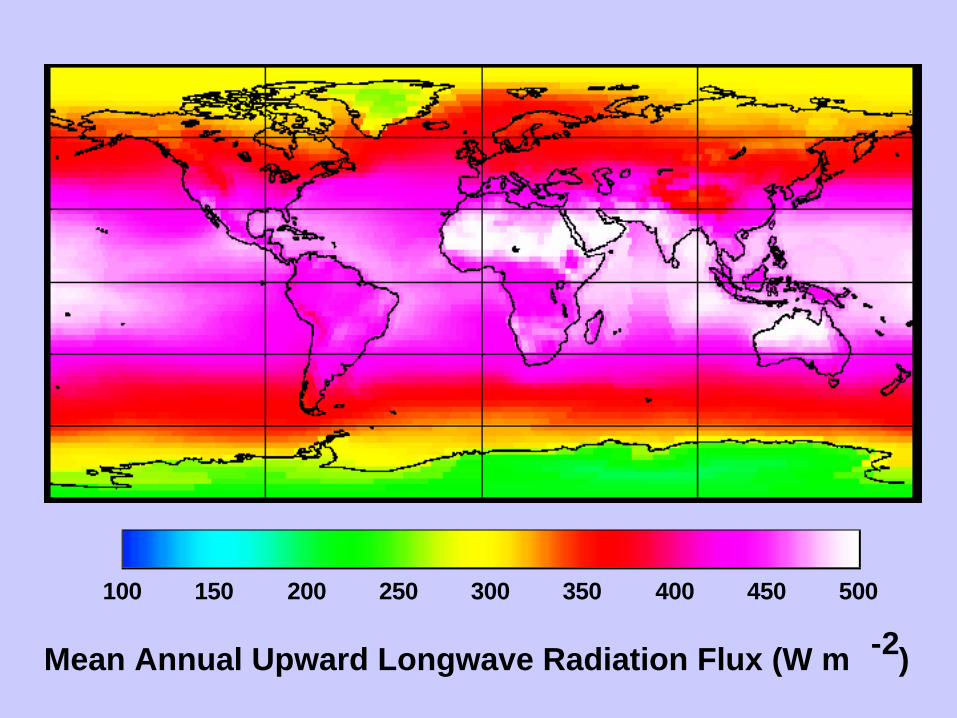
100 150 200 250 300 350 400 450 500
Mean Annual Upward Longwave Radiation Flux (W m -2)
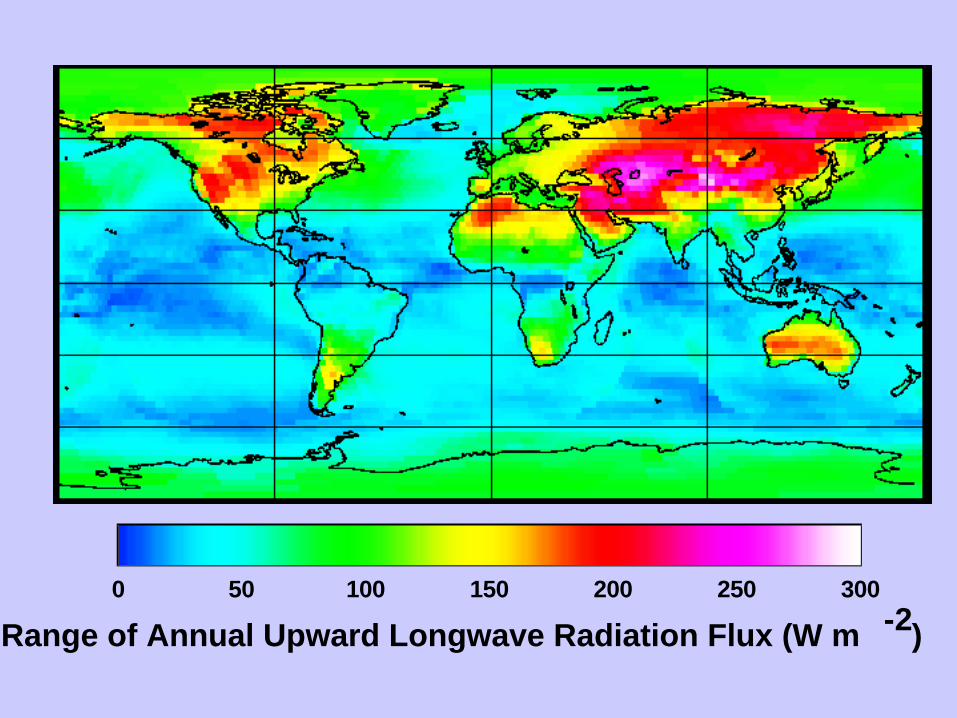
0 50 100 150 200 250 300
Range of Annual Upward Longwave Radiation Flux (W m -2)
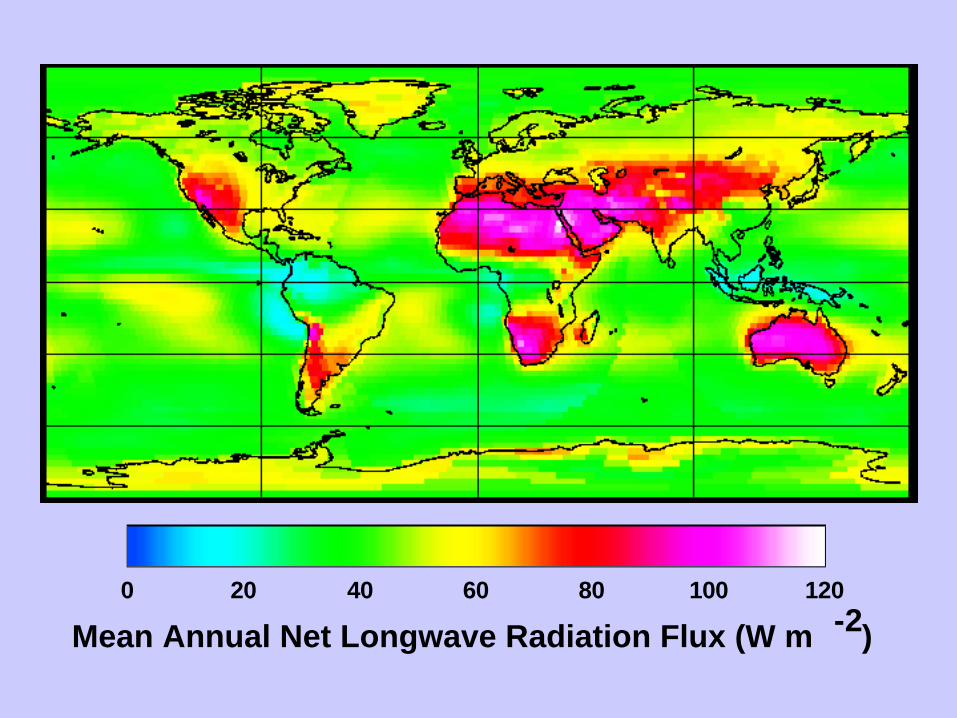
0 20 40 60 80 100 120
Mean Annual Net Longwave Radiation Flux (W m -2)
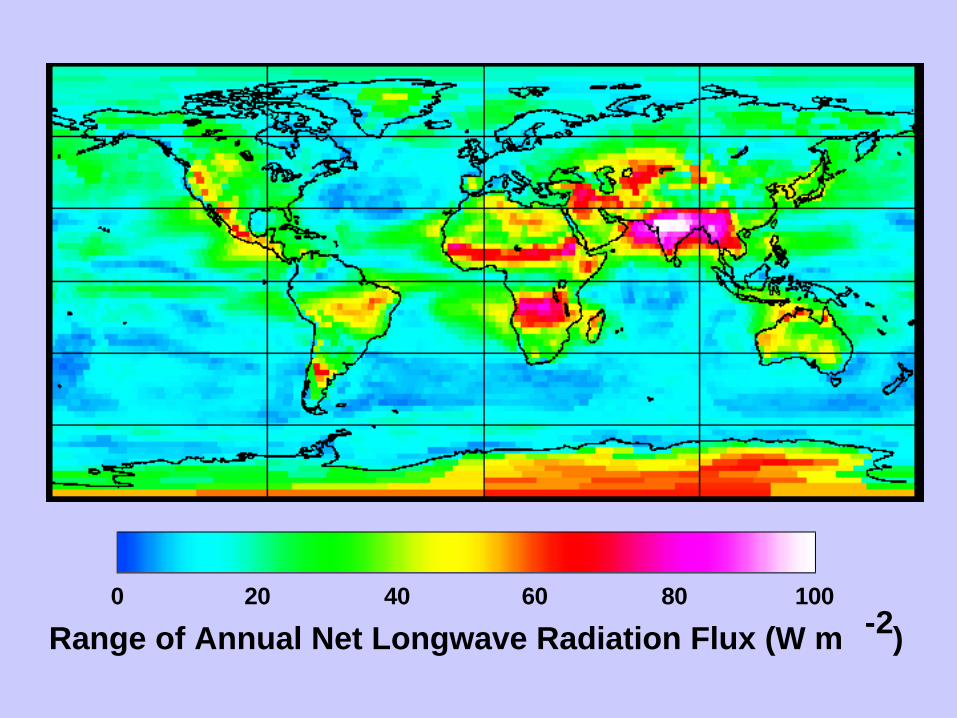
0 20 40 60 80 100
Range of Annual Net Longwave Radiation Flux (W m -2)
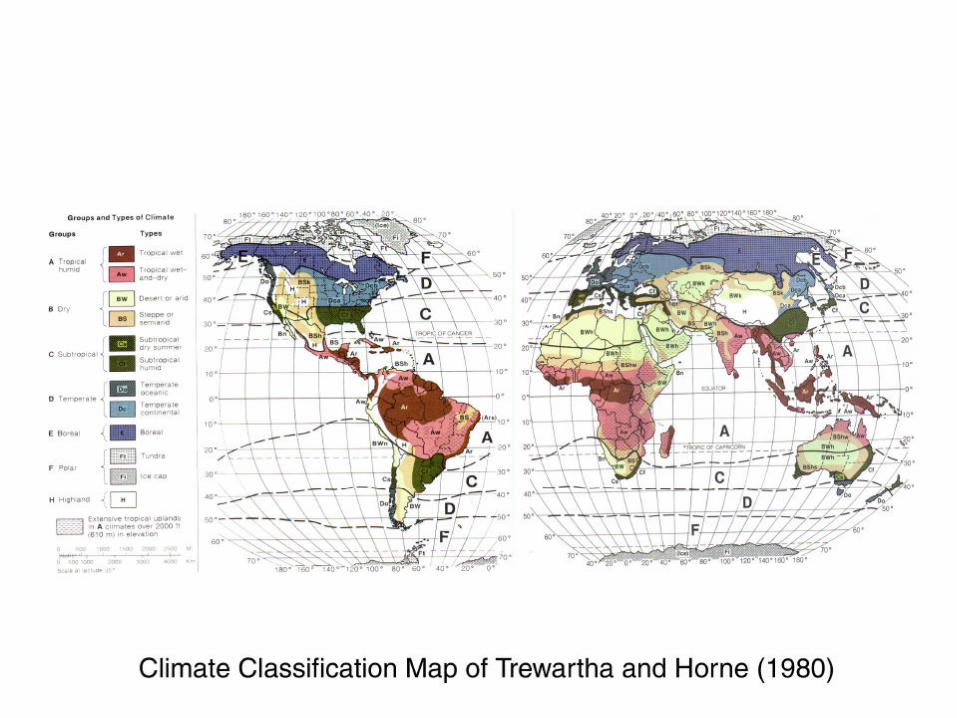
The Net Surface Longwave Flux is much smaller than the upward and downward components. The patterns of map of annual range appear to match those of the climate classifications
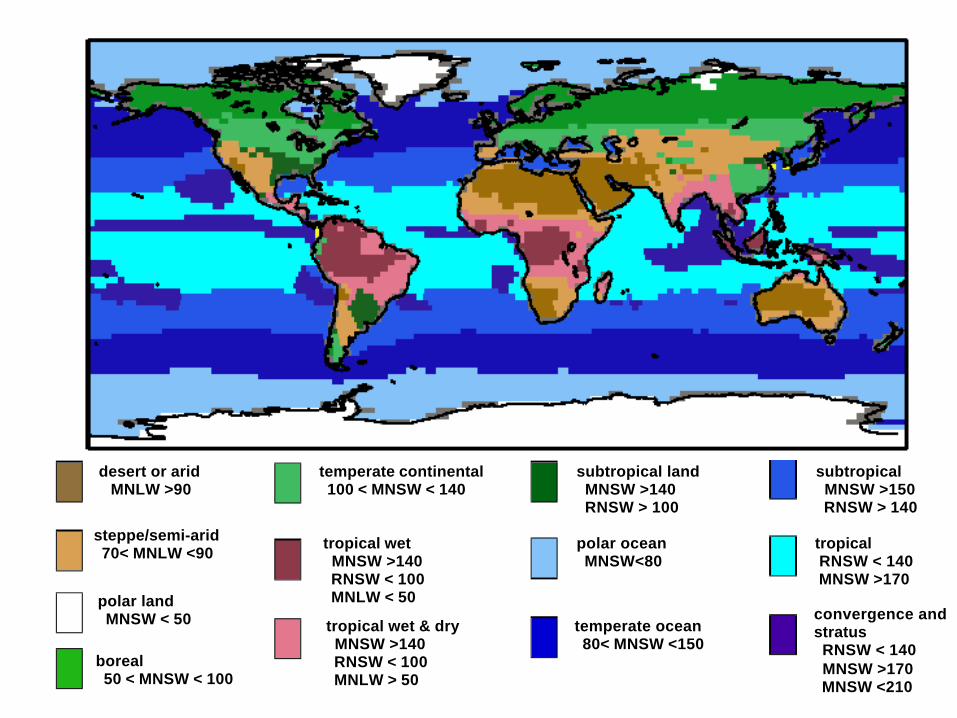
polar land MNSW < 50
desert or arid MNLW >90
tropical wet MNSW >140 RNSW < 100 MNLW < 50
temperate continental 100 < MNSW < 140
subtropical MNSW >150 RNSW > 140
tropical RNSW < 140 MNSW >170
temperate ocean 80< MNSW <150
polar ocean MNSW<80
convergence and stratus RNSW < 140 MNSW >170 MNSW <210
steppe/semi-arid 70< MNLW <90
tropical wet & dry MNSW >140 RNSW < 100 MNLW > 50
subtropical land MNSW >140 RNSW > 100
boreal 50 < MNSW < 100
We selected a number of sites representing many climate classes and plotted monthly means of Downward Longwave vs UpwardLongwave Flux for each site.
-90
-60
-30
0
30
60
90
-180 -150 -120 -90 -60 -30 0 30 60 90 120 150 180
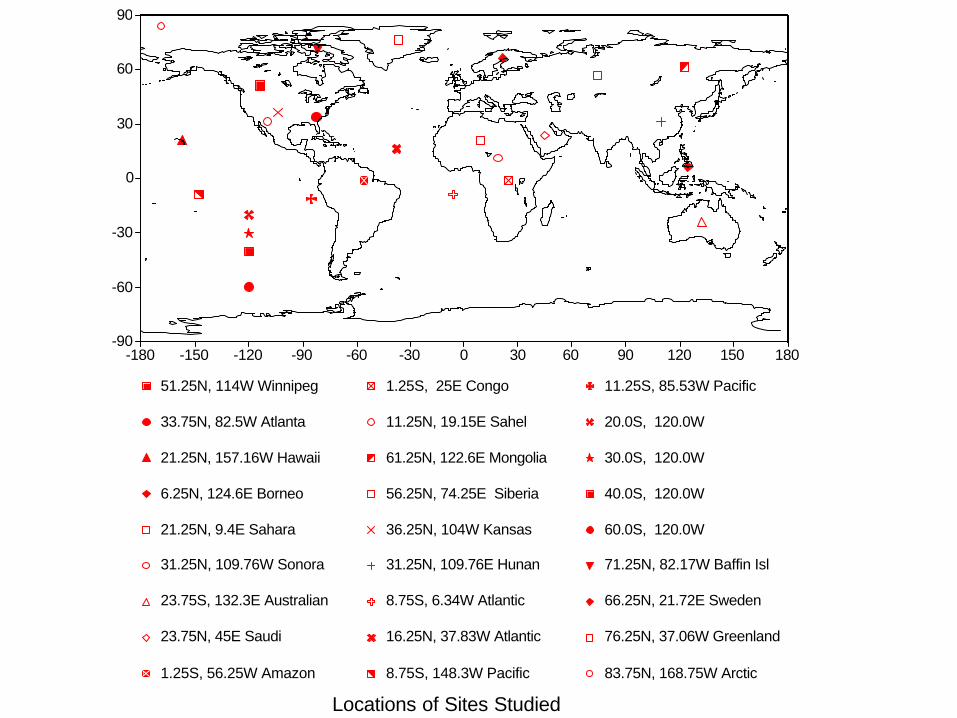
51.25N, 114W Winnipeg
33.75N, 82.5W Atlanta
21.25N, 157.16W Hawaii
6.25N, 124.6E Borneo
21.25N, 9.4E Sahara
31.25N, 109.76W Sonora
23.75S, 132.3E Australian
23.75N, 45E Saudi
1.25S, 56.25W Amazon
1.25S, 25E Congo
11.25N, 19.15E Sahel
61.25N, 122.6E Mongolia
56.25N, 74.25E Siberia
36.25N, 104W Kansas
31.25N, 109.76E Hunan
8.75S, 6.34W Atlantic
16.25N, 37.83W Atlantic
8.75S, 148.3W Pacific
11.25S, 85.53W Pacific
20.0S, 120.0W
30.0S, 120.0W
40.0S, 120.0W
60.0S, 120.0W
71.25N, 82.17W Baffin Isl
66.25N, 21.72E Sweden
76.25N, 37.06W Greenland
83.75N, 168.75W Arctic
Locations of Sites Studied
100
200
300
400
500
600
100 200 300 400 500 600Surface Upward LW Flux (W m-2)
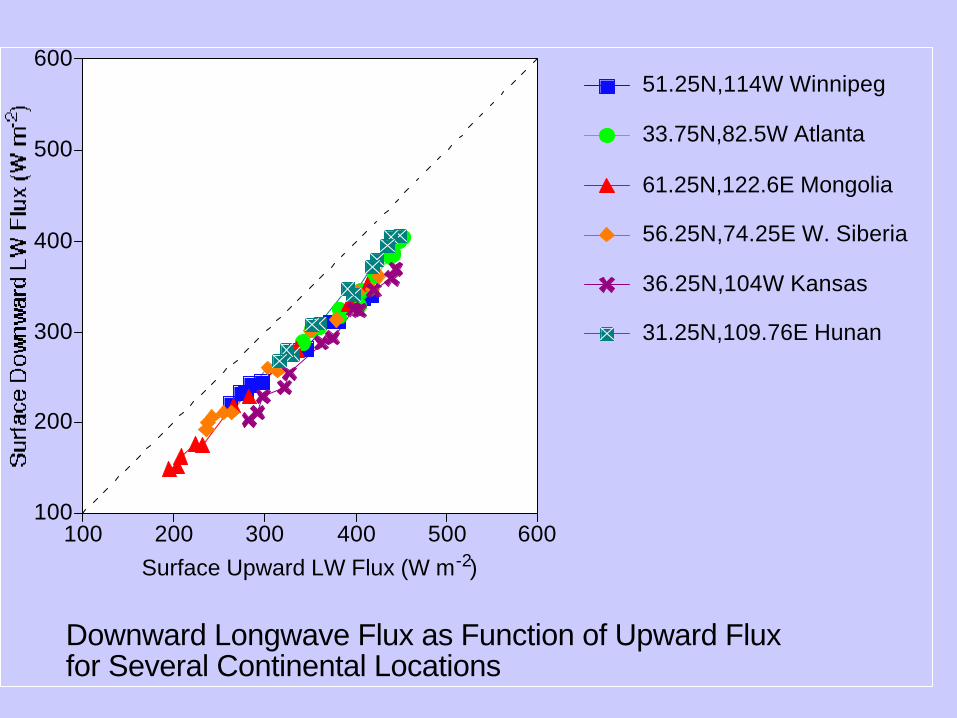
51.25N,114W Winnipeg
33.75N,82.5W Atlanta
61.25N,122.6E Mongolia
56.25N,74.25E W. Siberia
36.25N,104W Kansas
31.25N,109.76E Hunan
Downward Longwave Flux as Function of Upward Fluxfor Several Continental Locations
100
200
300
400
500
600
100 200 300 400 500 600
Surface Upward LW Flux (W m -2)
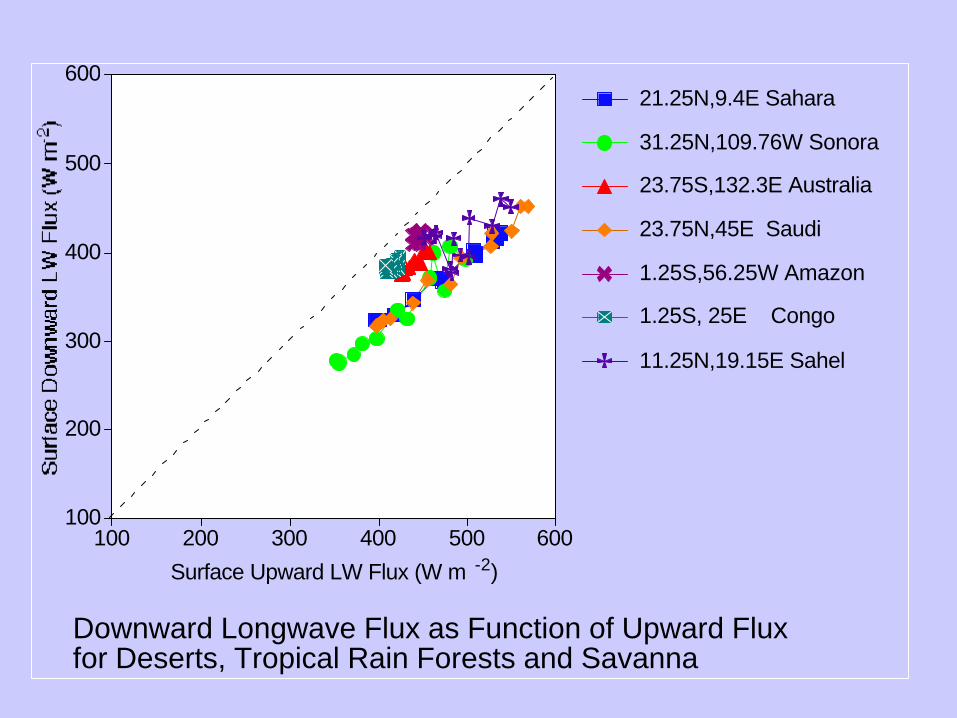
21.25N,9.4E Sahara
31.25N,109.76W Sonora
23.75S,132.3E Australia
23.75N,45E Saudi
1.25S,56.25W Amazon
1.25S, 25E Congo
11.25N,19.15E Sahel
Downward Longwave Flux as Function of Upward Fluxfor Deserts, Tropical Rain Forests and Savanna
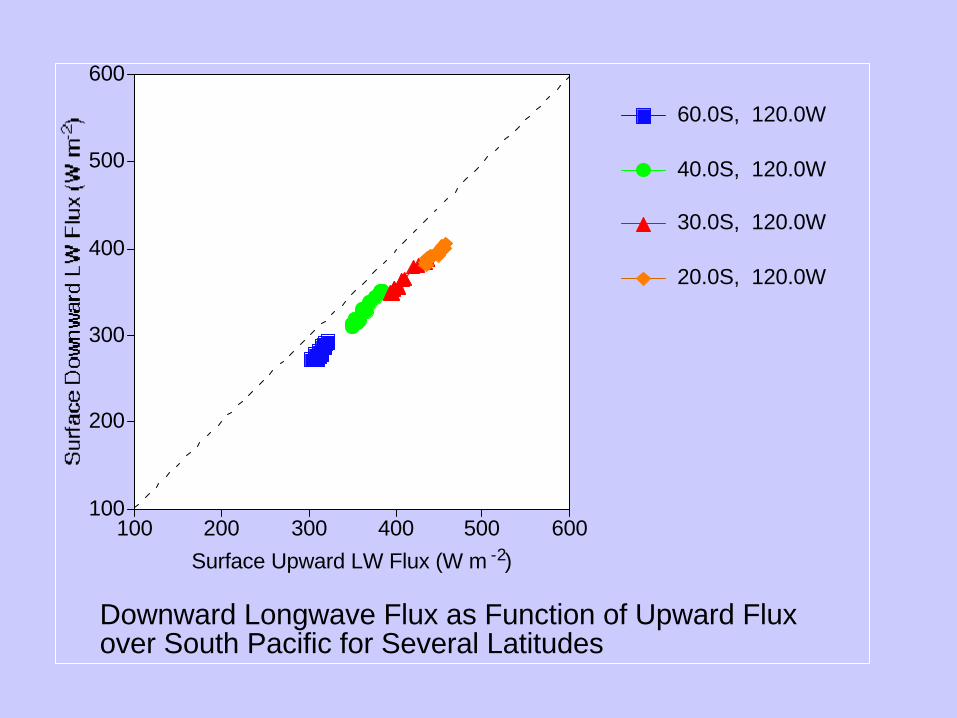
100
200
300
400
500
600
100 200 300 400 500 600Surface Upward LW Flux (W m -2)
60.0S, 120.0W
40.0S, 120.0W
30.0S, 120.0W
20.0S, 120.0W
Downward Longwave Flux as Function of Upward Fluxover South Pacific for Several Latitudes
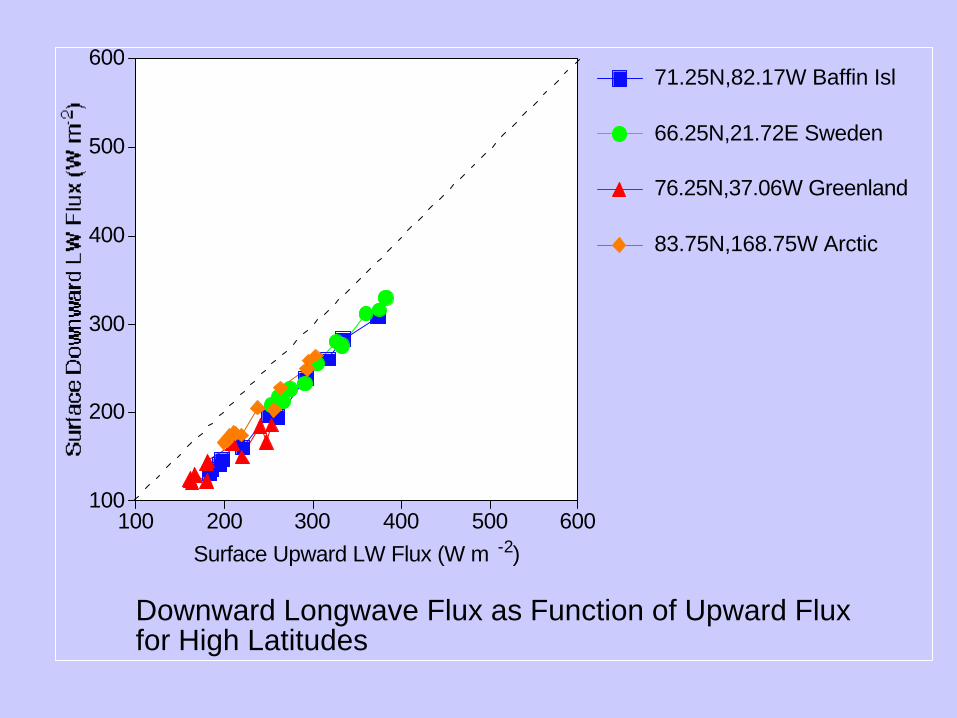
100
200
300
400
500
600
100 200 300 400 500 600Surface Upward LW Flux (W m -2)
71.25N,82.17W Baffin Isl
66.25N,21.72E Sweden
76.25N,37.06W Greenland
83.75N,168.75W Arctic
Downward Longwave Flux as Function of Upward Fluxfor High Latitudes
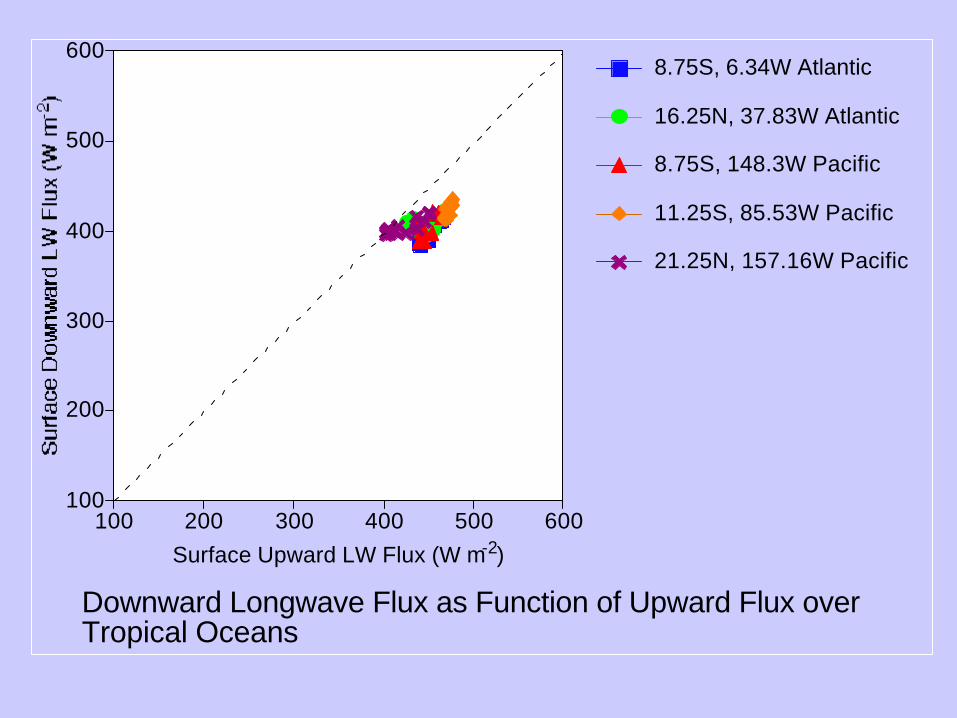
100
200
300
400
500
600
100 200 300 400 500 600Surface Upward LW Flux (W m-2)
8.75S, 6.34W Atlantic
16.25N, 37.83W Atlantic
8.75S, 148.3W Pacific
11.25S, 85.53W Pacific
21.25N, 157.16W Pacific
Downward Longwave Flux as Function of Upward Flux overTropical Oceans
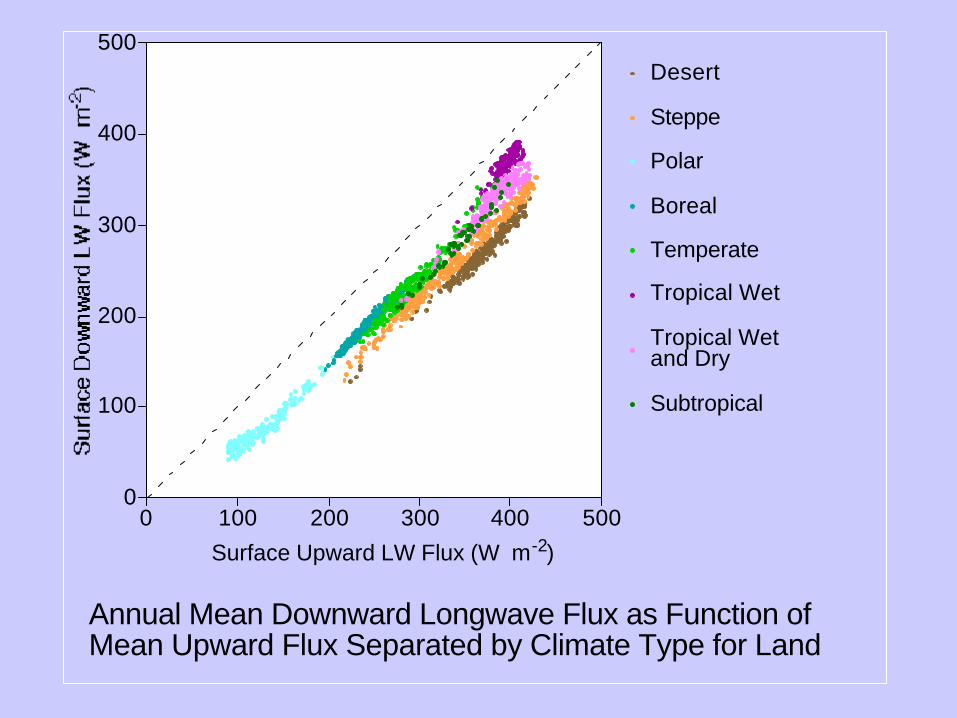
0
100
200
300
400
500
0 100 200 300 400 500
Surface Upward LW Flux (W m-2)
Desert
Steppe
Polar
Boreal
Temperate
Tropical Wet
Tropical Wet and Dry
Subtropical
Annual Mean Downward Longwave Flux as Function ofMean Upward Flux Separated by Climate Type for Land
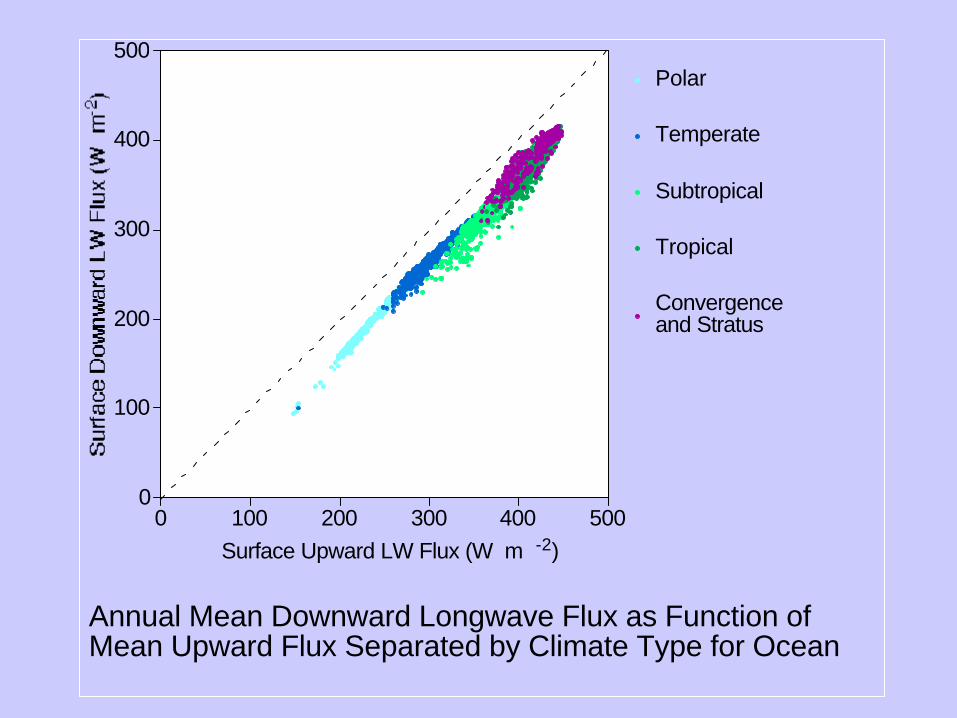
0
100
200
300
400
500
0 100 200 300 400 500Surface Upward LW Flux (W m -2)
Polar
Temperate
Subtropical
Tropical
Convergence and Stratus
Annual Mean Downward Longwave Flux as Function ofMean Upward Flux Separated by Climate Type for Ocean
The annual cycle of Downward vs UpwardLongwave Flux at the surface is a characteristic of the climate class.
CONCLUSIONS: •The relation between monthly mean downward and upward longwave surface fluxes of region is a characteristic of its climate classification.
•A plot of regional annual mean DownwardLongwave Flux vs Upward Flux is partitioned into various climate classes.
•The annual range on monthly mean Net Surface Longwave Flux is a characteristic of the climate class.