Embed Size (px)
Citation preview

Air Quality Strategy
Best Practice Guidance
For Inland Fleet Operators
August 2018
air quality strategy: inland fleet operators
page three
air quality strategy: inland fleet operators
page two
1. Emission GoalsThe PLA have been working with inland operators of theRiver Thames to investigate best practices to reduceemissions (NOX and PM) released into the air by vessels,as part of the Air Quality Strategy. This strategy hasbeen created to address public health andenvironmental concerns in relation to air quality.
IntroductionAs part of the PLA’s Air Quality Strategy for the Tidal Thames, thisguidance seeks to outline and deliver the best practice for inlandfleets operating in the River Thames across 5 areas; Technology,Fuel, Design and Maintenance, Operation and Fundingopportunities. The purpose of this best practice is to provideoperators with information and evidence on how changing smallparts of their operation could improve air emissions, reduce fuelconsumptions and save money. These best practices arerecommendations not requirements for reducing inland airemissions to reach PLA’s Air Quality targets in Table 1.
2026 2031 2041 Overarching
� PM – 20%reduction
� NOX – 20%reduction
� PM – 40%reduction
� NOX – 40%reduction
� PM – 50%reduction
� NOX – 50%reduction
Reduction in CO2
Reduction in allother emissionsproduced on theThames
Table 1: PLA air reduction targets adopted for the Air Quality Strategy. Source: PLA Air Quality Strategy, 2018.
DefinitionsCO2 – Carbon DioxideDEF – Diesel Exhaust FluidDraft – The vertical distance betweenthe waterline and the bottom of thevessel hullECA – Emission Control AreaEGR – Exhaust Gas Recirculation ESI - Environmental Ship IndexEU – European UnionGHG – Green House GasesGLA – Greater London AuthorityHFO – Heavy Fuel OilIMO – International MaritimeOrganisationKW – KilowattLNG – Liquefied Natural GasLSF / LSD / LSMGO – Low SulphurFuel/Diesel/Marine Gas OilMCR – Maximum Continuous RatingNOx – Nitrogen OxidesNECA– Nitrogen Emission Control AreaPM – Particulate MatterSCR – Selective Catalytic ReductionSOx – Sulphur OxidesSECA – Sulphur Emission Control AreaTFL – Transport for LondonULSF / ULSD / ULSMGO – Ultra LowSulphur Fuel/Diesel/Marine Gas OilWIF – Water-in-Fuel
Introduction p3
1. Emission Goals p3
1.1 Strategy Aim p3
1.2 Air Quality Targets p3
2. Technological Solutions p4
2.1 Engine Regulatory p4
Systems
2.1.1 Exhaust Gas p4
Recirculation (EGR)
2.1.2 Selective Catalytic p4
Reduction (SCR)
2.2 Shore side Power p5
2.2.Bow Bulb Retrofit p6
3. Fuel Types p6
3.1 Ultra Low Sulphur Fuel p6
3.2 Other Current p6
Fuel Options
3.3 Fuel Additives p7
3.4 Future Alternative Fuels p8
4. Design and Maintenance p9
4.1 Hull Design p9
4.2 Anti-fouling Paints p9
4.3 Maintenance p10
5. Operational Solutions p10
5.1 Vessel Idling p10
5.2 Driving in Transit p10
6. Funding Opportunities
Contents
1.1 – Strategy Aim
The Reduction in harmfulemissions to air from marinesources within the tidal RiverThames, whilst facilitating thePort and London’s future growth.
MARPOL Annex VI NOX emissions fromdiesel engines installed or constructed on orafter 1st January in a NECA are limited toTier III standards.
EU Regulations require that inland vesselsmust use 0.001% Sulphur content. The 2020emission reductions were; 68% for SO2, 49%for NOx, 39% for PM10 and 45% for PM2.5 ofthe levels in 2000.
UK Merchant Shipping Act focuses on fuel,design and emissions for ships and inlandwaterway vessels in close proximity to urbanareas and at berth which does not currentlyhave an exhaust gas cleaner.
Non-road Mobile Machinery legislation sets emission parameters for engines whichoperate in inland waterways such as the river Thames.
1.2 – Air Quality Targets

air quality strategy: inland fleet operatorsair quality strategy: inland fleet operators
page fivepage four
2. Technological Solutions2.1 – Engine Regulatory Systems
An engine regulatory system is a technologywhich improves the efficiency and reducesemissions from a diesel engine. Two mainregulator systems could enable operators toreduce NOX emissions.
2.1.1 – Exhaust Gas Recirculation (EGR)
EGR reduces NOx from diesel engines by first cooling 30-40% of the exhaust gasses,then combining it with high pressure freshair before being recirculated into thecylinder. Emission Control Area EGR modewhich is Tier III compliant for inland regionscan reduce emissions by:
%
NOX PM
Figure 1: EGR Eemission savings
Figure 4: SCR emission savings
Figure 3: SCR components in a diesel engine
2.1.2 – Selective Catalytic Reduction (SCR)
SCR is an active emission regulatortechnology which injects Diesel ExhaustFluid (DEF) through a special catalyticchamber into the hot exhaust stream of adiesel engine.
Engine
NON
CO
PM
H O
CO
HC
PM
Urea SCR
Urea DosingSystem
NH OxidateCatalyst
OxidationCatalyst
Reduced emissions using ECA-EGRReduced emissions using SCR
NOX CO2 lower boundary
CO2 upper boundary
PM lower boundary
PM upperboundary
90% 50-90% 30-50%
Both EGR’s and SCR’s come in variousshapes and sizes and will work well withvarious engine types. However, additionalspace in the engine will be necessary andthese extra engine components may add
weight to the vessel which could impactthe stability and speed of lightweightvessels. Operational changes are requiredfor the use of Urea and maintenance offilters.
Exhaust receiverEGR string
Shut-down valve
Pre-scrubber
FGR cooler
Scrubber
WMC
WMC
Cooler
Main string
Cylinderbypass
Basic T/C
EGR blowerChange-over
valve
Scavenger receiver
This system can reach operationaltemperature within 10-15 minutes ifthe engine has been previously run inthe previous 6-10hours.
Emissions at berth are often the result ofauxiliary engines and boilers, used to poweron-board activities. To reduce these atberth emissions, it is advised that inlandvessel operators turn off their engines andtake advantage of shoreside power.Shoreside power is where electricity isprovided to the vessels from the grid,transferred from the shore to the vessel via
a cable reel system.
Shoreside power has the ablitiy tocontribute to reductions of NOX, PM andCO2 emissions and is currently being usedas a technological soultion by many inlandoperators. It may not be applicable at siteswhere the vessel does not stay long, i.e. atpassenger piers or operational wharves.
2.2 – Shoreside Power
Case study: Cory Riverside Energy
Cory River Energy vessels are connected toshore-side power when at berth at Charlton.This helps Cory Riverside Energy to reduce thelevel of fuel burnt and emissions released.From October 2017, Charlton has beenpowered by 100% renewable electricity as partof a zero-carbon power scheme organised byOfgem. Cory Riverside Energy are also activelyexploring other solutions, to improve their engines to Tier III standard.
74% 85%
The EGR systems include an EGR valve,filter, cooler and pickup, which all must beinspected every 6 months and replacedevery 12.
Figure 2: EGR components in a diesel engine. Source:Hasen et al

air quality strategy: inland fleet operators
page sevenpage six
air quality strategy: inland fleet operators
2.3 – Bow Bulb Retrofit
For larger freight vessels with a highspeed-length ratio on the inlandThames, a bow bulb may be necessaryto produce a second wave which isdesigned to cancel out/reduce the waveproduced by the boat, hence reducingdrag resistance. These bulbs arecommonly used in internationalshipping; however they can also be usedin inland waterways.
A bow bulb can reducewave resistance by 10%,saving fuel and emissions(table 2). A cargo vessel
between 250-400 tonsbenefits the most from a bulb, howeverdue to bulbs coming in various shapesand sizes, working well with variousvessel lengths, weight and style.
10%
Fuel
CO2
NOX
PM10
SO2
%
109
347
5.65
0.229
0.371
3.1%
258
817
13.32
0.541
0.876
3.0%
518
2,644
26.78
1.088
1.761
1.8%
885
2,808
45.7
1.858
3.009
2.2%
Ton/yr Cargo vessel(250-400 ton)
Barge(450-650 ton)
Canal ship(max 1350)
Total
from the river. Successful trials are alsolimited to currently learn from, howeveras trials are carried out case studies willbe shared on the PLA’s website.Operators should carry out their owninvestigations when consideringalternative fuels with the enginemanufacturers.
3. Fuel Types3.1 – Ultra Low-Sulphur Fuel
All inland vessels must use a fuel with a sulphur content that does not exceed 0.001 sulphur content.
3.2 – Other Current Fuel Options
LNG and Biofuels are currently a new opportunity for operators, with challenges relating to the lack of infrastructure and access to the fuel
LNG fuel is compatible with four-stroke (single fuel and compressionignition), two-stroke (with a premixchamber and direct injector) andsteam turbine propulsion engines.LNG requires 70% more space than aHFO tank, therefore moreappropriate for larger inlandvessels. PLA are currentlylooking into the useLNG on the Thames.LNG can reduce NOx by:
85-90%
A synthetic biodiesel can be madeentirely of vegetable oil products.Biofuels themselves are consideredto be carbon neutral as the CO2
produced from combustionbalances the CO2
extracted from theatmosphere as thefuel grows.Biofuels can reducePM emissions by:
35%
3.3 – Fuel Additives
Water emulsion can be injected into thefuel in the combustion chamber to act asan additive. The water helps to breakdown the fuel into smaller droplets,improving complete combustion rate.
~1% NOx can be reduced with 1% ofwater emulsion. This is already currentlybeing used by international shippingwhere 10% of water-in-fuel emulsioncan save:
2-5%Fuel
consumptionsaved
~3.8%Average cost
saving
~20%NOX reduction
Water-in-fuel (WIF) additives could beintroduced into inland vessels along theThames however the success of wateradded to the fuel depends on theengine load (as engine load and WIFincreases so does NOX emissionreductions, Figure 5). The WIF injectors
which inject the water into the fuel havea life time of ~4 years, whereas theremaining WIF equipment has a life timeof ~12 years. Installation costs formarine vessels are shown in figure 6:
500,000
450,000
400,000
350,000
300,000
250,000
200,000
150,000
100,000
50,000
05000 10000 15000 20000 25000 30000 35000
MCR (kw)
EUR
Injectors equipment
40
35
30
25
20
15
10
50.0 0.1 0.2 0.3 0.4 0.5 0.6 0.7 0.8 0.9
water/fuel vol. ratio (--)
NO
X e
mis
sio
n (g
/k w
h)
10% load25% load50% load75% load100% load
Figure5: Measured NOx reductions from exhaust gas atvarious engine loads and WIF concentrations. Source:Andresen and Nyggard, 2011.
Figure 6: Installation costs of WIF NOx reduction systemfor small (<6,000 KW), medium (>6,000-<15,000) andlarge (>15,000) engines.
air quality strategy: inland fleet operators
page nine
air quality strategy: inland fleet operators
page eight
4. Design and Maintenance3.4 – Future Alternative Fuels
Biofuel
Electricity
Hydrogen
Ammonia
Cost
Emissions
Cost
Emissions
Cost
Emissions
Cost
Emissions
Low Central High
Green Electricity
Low Central High
Green Ammonia
Low Central High
Green Hydrogen
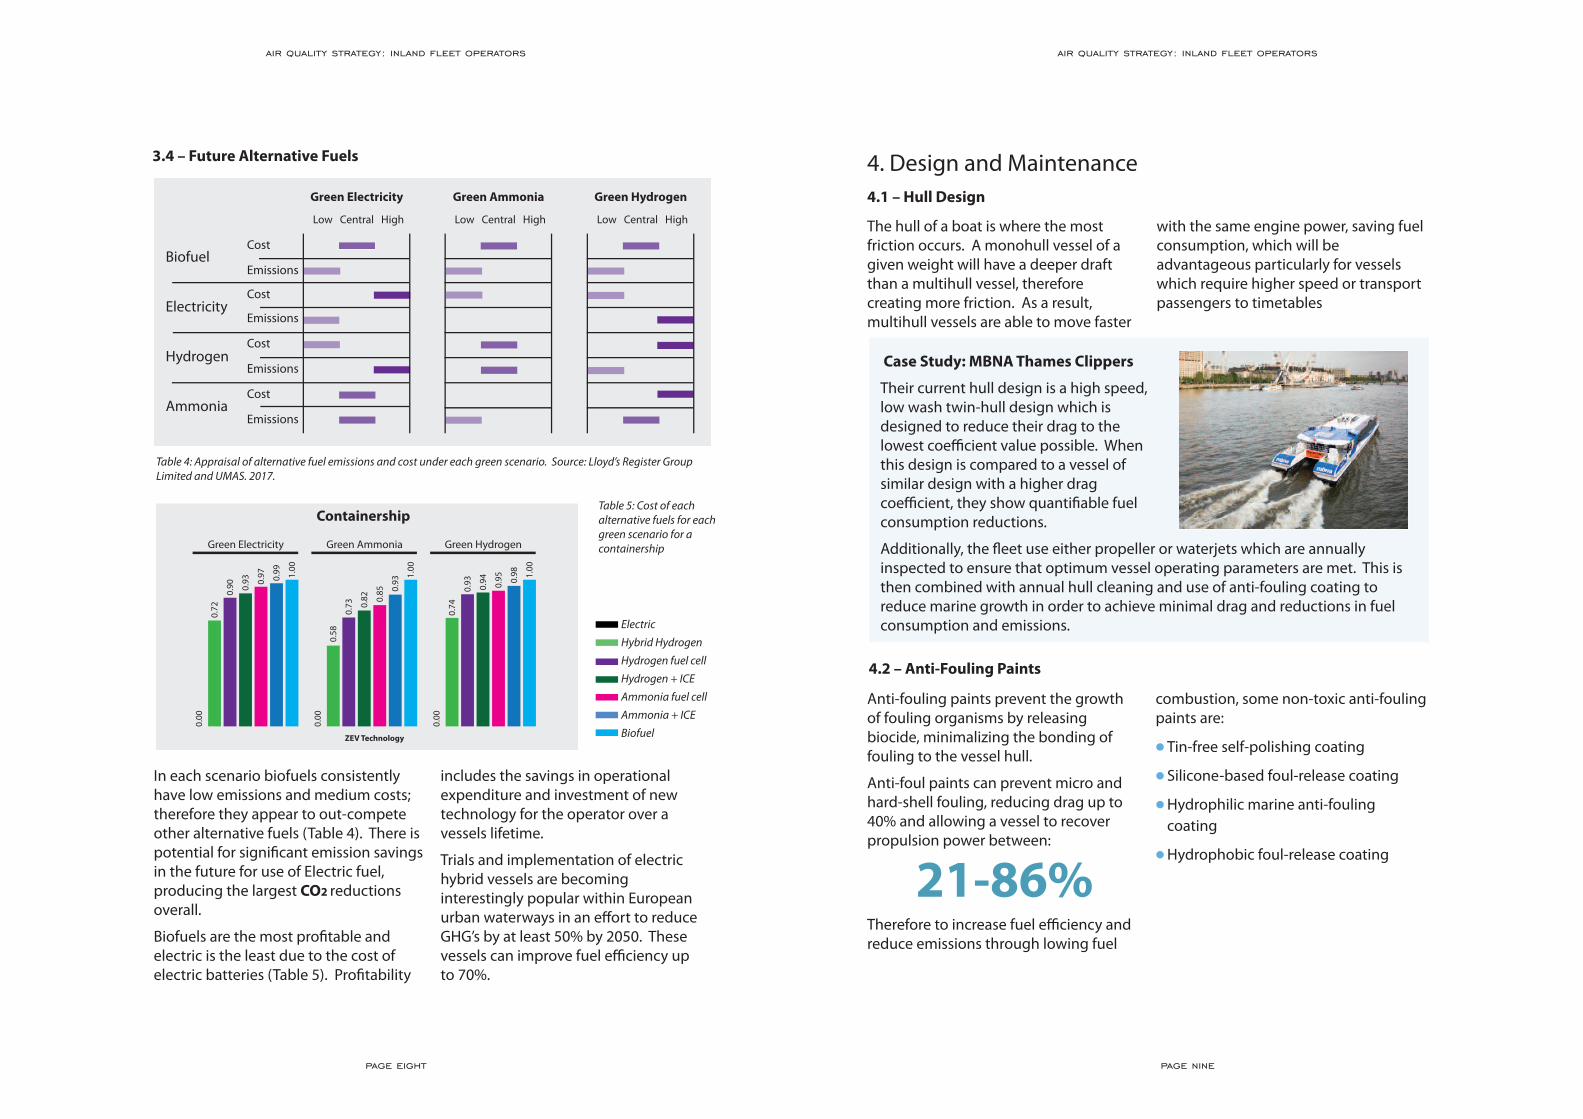
Table 4: Appraisal of alternative fuel emissions and cost under each green scenario. Source: Lloyd’s Register GroupLimited and UMAS. 2017.
In each scenario biofuels consistentlyhave low emissions and medium costs;therefore they appear to out-competeother alternative fuels (Table 4). There ispotential for significant emission savingsin the future for use of Electric fuel,producing the largest CO2 reductionsoverall.
Biofuels are the most profitable andelectric is the least due to the cost ofelectric batteries (Table 5). Profitability
includes the savings in operationalexpenditure and investment of newtechnology for the operator over avessels lifetime.
Trials and implementation of electrichybrid vessels are becominginterestingly popular within Europeanurban waterways in an effort to reduceGHG’s by at least 50% by 2050. Thesevessels can improve fuel efficiency up to 70%.
Green Electricity
0.00
0.72
0.90 0.
93 0.97 0.99 1.00
0.58
0.73 0.
82 0.85 0.
93
1.00
0.74
0.93 0.94 0.95 0.
98 1.00
Green Ammonia
0.00
Green Hydrogen
0.00
ZEV Technology
ContainershipTable 5: Cost of eachalternative fuels for eachgreen scenario for acontainership
Electric
Hybrid Hydrogen
Hydrogen fuel cell
Hydrogen + ICE
Ammonia fuel cell
Ammonia + ICE
Biofuel
The hull of a boat is where the mostfriction occurs. A monohull vessel of agiven weight will have a deeper draftthan a multihull vessel, thereforecreating more friction. As a result,multihull vessels are able to move faster
with the same engine power, saving fuelconsumption, which will beadvantageous particularly for vesselswhich require higher speed or transportpassengers to timetables
4.1 – Hull Design
Case Study: MBNA Thames Clippers
Their current hull design is a high speed,low wash twin-hull design which isdesigned to reduce their drag to thelowest coefficient value possible. Whenthis design is compared to a vessel ofsimilar design with a higher dragcoefficient, they show quantifiable fuelconsumption reductions.
Additionally, the fleet use either propeller or waterjets which are annuallyinspected to ensure that optimum vessel operating parameters are met. This isthen combined with annual hull cleaning and use of anti-fouling coating toreduce marine growth in order to achieve minimal drag and reductions in fuelconsumption and emissions.
Anti-fouling paints prevent the growthof fouling organisms by releasingbiocide, minimalizing the bonding offouling to the vessel hull.
Anti-foul paints can prevent micro andhard-shell fouling, reducing drag up to40% and allowing a vessel to recoverpropulsion power between:
Therefore to increase fuel efficiency andreduce emissions through lowing fuel
combustion, some non-toxic anti-foulingpaints are:
� Tin-free self-polishing coating
� Silicone-based foul-release coating
� Hydrophilic marine anti-foulingcoating
� Hydrophobic foul-release coating
4.2 – Anti-Fouling Paints
21-86%

air quality strategy: inland fleet operators
page eleven
air quality strategy: inland fleet operators
page ten
1,000500 1,500 2,000 1,000500 1,500 2,0000
10
20
30
40
50
0
10
20
30
40
50Fuel rate for Southwark Fuel rate for Kew
Engine speed (rpm) Engine speed (rpm)
Fuel
Rat
e (I/
hr)
Fuel
Rat
e (I/
hr)
Some guidelines to keep a wellmaintained engine to reduce fuelconsumption and emissions are:
� Check cooling system strainer is not plugged
� Ensure freshwater circuits have enoughantifreeze to prevent rust
� Check the flow of coolant to preventdamage to rubber impellers andcylinders
� Annual check the hose connectionsand bands
� Check water pump seals/ values for corrosion
� Check filters regularly to ensure areclean and blocked
� Ensure valves are working and replacethem if possible (not all valves can be replaced)
� Ensure there is enough lubrication toprevent corrosion to internal workings
4.3 – Maintenance
5. Operational Solutions
Some marine engines need a warm upperiod, which has lead to behaviorhabits to leave the engine running whena vessel is idle. When this happens NOxand PM emissions can double and causeup to 38% increase in fuel consumptionwhen compared to the emissionsemitted from a vessel traveling at 75%engine power.
This is a major source of air pollutionand needs to be minimalized throughpre-heating equipment whilst slowlymoving the vessel along the Thames,unloaded, before adding any strain andpower demand on the engine. This
warm-up period can also be reduced ifthe engine has previously run in theprevious 6-10 hours. Many engines canbe started sooner and can warm.
To tackle idling vessels, operators arerecommended to:� Reduce the time a vessel is left idling
at berth. � A newer vessel requires less warm-up
time.
� A vessel with a pre-warming heaterwill also reduce idling.
� Turn off the engine and switch toshore power or generator power whennot needed.
5.1 – Vessel Idling
5.2 – Driving in Transit
5.2.1 – Efficient Driving
Figure 6: PLA energy curves for bridge harbour launches
This can be done via reducing engine power from:
380KW/1050rpm
6.5 knots
Save 70% in Fuel
Consumption
Reducing speed or rpm will reduce fuelconsumption, fuel costs and emissionscreated for each trip. An engine can berun at a high rpm with no additionalbenefit on its speed.
Recommendations for operators are:
� Drive at a lower rpm.
� Try to keep between ~700-1050rpm(<10 knots) to drive the mostefficiently, when able to i.e. not inservices.
� Use energy curves to identify theefficient areas of engine activity.
5.2.2 – Working with the Tides
The direction of the tides can affect thefrictional force of the water on the boat,influencing the drag and engine power.When a vessel works against the tide,engine power is lost as the engine triesto overcome the tidal force. Whereas, ifa vessel works with the tide, less enginepower is required resulting in reducedemissions and savings in fuelconsumption and cost. This may require
operators to adapt their scheduledtimetable in order to work with thetides. This may not appropriate ifoperating to a timetable in bothdirections, or for safety reasons but canbe used by operators maneuvering withthe tide or able to adapt.
Working with the tides can potentially:
662KW/1850rpm
8.5 knots 5.2.3 – Push Vs Pull Tugs
Tugs and Barges can be transported eitherfrom being pushed from behind or pulledfrom in front. Using a tug to push, operatorscould see a:
~30 Save in energy needed totransport a load.
~13 Shorter journey time andspeed increase.
~25- Reductions in NOX andCO2 emissions
However, these results must be consideredwith caution due to the lack of availableliterature and the need for further researchfor a conclusive result. Safety of theoperation must also be considered beforethis option is used.
This is the equivalent of reducing their speed from:
to
to

air quality strategy: inland fleet operators
5. Funding Opportunities
Air Quality andEnvironment Programmeby TFL
This fund is for transportnetwork projects withinLondon which showreductions in NOx, PM andCO2 to improve publichealth, over the next 5years (2017-2022).
This could be important forexpanding inland riverservices on the Thames.
This fund is to encouragethe London transportnetwork to become zero-emissions by 2050 andsupport the acceleration ofthe uptake of zero emissiontechnologies.
Air Quality Project Fundingby Borough’sThere is a grant schemesubject to meeting criteria:� Reducing air pollutionemissions.
� Reducing exposure ofemissions to humans.
� Increasing awareness of airpollution.
� Have measurable impacton air quality.
� Have wider benefits forlocal area.
Many London, Kent andEssex boroughs have theirown air quality funds whichcould apply to inlandoperators.
Mayor’s Air Quality Fundby the GLA
A £20 million fundingscheme to fund (over 10years) for London Boroughair quality projects to loweremissions, introduce electriccharging points and createlow emission constructionpartnerships.
Summer 2018, funding forboroughs to introduce newair quality projects inLondon will be open forapplications. Inland vesseloperators are therefore ableto contact their boroughswith air quality projects toincorporate into theseapplications.
CUSTODIANS OF THETIDAL THAMES
PROTECT I IMPROVE I PROMOTE
www.pla.co.uk@LondonPortAuth
www.youtube.com/portoflondon01474-562200