Embed Size (px)
Citation preview

336 USDA Forest Service Proceedings RMRS-P-15-VOL-5. 2000
In: Cole, David N.; McCool, Stephen F.; Borrie, William T.; O’Loughlin,Jennifer, comps. 2000. Wilderness science in a time of change conference—Volume 5: Wilderness ecosystems, threats, and management; 1999 May 23–27; Missoula, MT. Proceedings RMRS-P-15-VOL-5. Ogden, UT: U.S. Depart-ment of Agriculture, Forest Service, Rocky Mountain Research Station.
Ellen M. Porter is a Biologist, Air Quality Branch, U.S. Fish and WildlifeService, c/o NPS-AIR, P.O. Box 25287, Denver, CO 80225 U.S.A., e-mail:[email protected]
Air Quality Management in U.S. Fish andWildlife Service Wilderness AreasEllen M. Porter
Abstract—Proper management of air resources is vital to main-taining the wilderness character of an area. Air pollution can affectnatural resources and has caused injury to vegetation,bioaccumulation of mercury in fish, eutrophication of coastal eco-systems and visibility impairment in U.S. Fish and Wildlife Service(FWS) wilderness areas. Sources of air pollution include powerplants, incinerators, industry, automobiles, dust and fires. Emis-sions from these sources can be transported long distances andaffect areas otherwise considered to be pristine. The FWS uses acombination of monitoring, special studies, participation in theregulatory process and review of new sources of air pollution in itsair quality management strategy.
The U.S. Fish and Wildlife Service (FWS) manages 20.7million acres in 76 wilderness areas. These wildernessareas range in size from the eight-million acre MollieBeattie Wilderness Area in Alaska to the two-acre Wiscon-sin Islands Wilderness Area in Wisconsin. Twenty-one ofthe wilderness areas managed by FWS in the NationalWildlife Refuge System are designated Class I air qualityareas (fig. 1) and receive special protection under the CleanAir Act (Public Law No. 101-549). Only a very smalladditional amount of air pollution (from 1977 levels) can bepermitted in Class I areas.
Class I areas include the following federal lands that werein existence on August 7, 1977: national parks exceeding6,000 acres; national wilderness areas exceeding 5,000 acres;national memorial parks exceeding 5,000 acres; and inter-national parks. In addition, tribes have designated certaintribal lands as Class I. Congress gave the FWS and the otherfederal land managers for Class I areas an “affirmativeresponsibility to protect all those air quality related values(including visibility) of such lands....” (Senate Report No. 95-127, 95th Congress, 1st Session, 1977). Air quality-relatedvalues include vegetation, wildlife, water, soils, visibilityand geological, archeological, historical and cultural re-sources. Despite this special protection, many of the re-sources in these areas are being impacted or have thepotential to be impacted by air pollutants.
Common air pollutants of ecological significance includesulfur and nitrogen oxides, ammonia, ozone, particulatematter, volatile organic compounds and metals. These pol-lutants are either emitted directly from sources, including
power plants, incinerators, industries, automobiles and firesor, as in the case with ozone, are formed downwind of sourcesas emissions react and transform. Other downwind reactionsproduce fine aerosols and particles, including sulfates andnitrates, which may eventually be deposited into ecosystems.
Impacts to wilderness resources from air pollution includeacidification of lakes, streams and soil; eutrophication ofestuaries and near-shore coastal waters; direct toxicity tosensitive species; changes in species composition; changes innutrient cycling; bioaccumulation of toxins in food chains;and visibility impairment.
Acidification may occur when sulfur and nitrogen com-pounds combine with moisture and transform to acids in theatmosphere, soil or water. Acids may be buffered by natu-rally occurring base cations, such as calcium and magne-sium. However, in lakes, streams and soils with low amountsof base cations (or with high acid inputs), acid-neutralizingcapacity is lost, and acidification occurs (National AcidPrecipitation Assessment Program 1990a). Acid-sensitivespecies of fish and invertebrates, and the wildlife thatdepend on them, may be lost from the ecosystem. (Griffithand others 1995). In addition, increased acidity mobilizesmetals, such as aluminum and mercury, that are toxic toplants and wildlife (National Acid Precipitation AssessmentProgram 1990b). In high-elevation spruce-fir forests in-creased acidity has resulted in winter foliar injury andsubsequent dieback (Thornton and others 1994). Aciditymay also cause changes in soil nutrient cycling (Aber andothers 1995; Johnson and Lindberg 1992).
In addition to having an acidification effect nitrogen fromair pollution may have a fertilizing effect on ecosystems(Vitousek and others 1997; Paerl 1993). Nitrogen can bedeposited into ecosystems in the form of nitrates, ammo-nium ions and other compounds. In natural systems, includ-ing designated wilderness areas, nitrogen may cause anunwanted increase in primary production and a shift inspecies composition to nitrogen-loving species. In estuariesand coastal waters along the Atlantic and Gulf coasts, forexample, excess nitrogen stimulates eutrophication charac-terized by algae blooms, decreased water clarity, deteriora-tion and loss of sea grasses, and hypoxia (Ecological Societyof America 1997). In some areas, this has resulted in the lossof important invertebrate, fish and wildlife species. Al-though much of the nitrogen entering estuaries is fromterrestrial runoff, a significant portion comes from theatmosphere. In estuary studies to date, atmospheric nitro-gen comprises from 10%-50% of the total nitrogen enteringthe system (Paerl 1995).
Certain air pollutants have a direct toxic effect on sensi-tive species. Ozone is the most important of the phytotoxicpollutants and enters the stomates of plants along with thenormal constituents of air. Once inside the leaf, ozone (or

USDA Forest Service Proceedings RMRS-P-15-VOL-5. 2000 337
its byproducts) reacts with cell membranes and other cellcomponents, causing injury or death of leaf tissues. Onbroad-leaved plants, ozone injury may appear as darkstipples. On conifers, ozone injury may appear as chloroticmottle (Chappelka and Chevone 1992). In addition, ozonemay cause reductions in plant growth and reproduction(Manning and Krupa 1991).
Other air pollutants, including mercury and other toxicmetals, bioaccumulate when deposited into ecosystems.Mercury, for example, can accumulate up the food chain bya factor of a million or more (Schroeder and Munthe 1998).Mercury tends to accumulate in aquatic food chains, reach-ing toxic levels in certain fish species (Facemire and others1995). Wildlife and humans consuming such fish may be atrisk of neurological and reproductive damage (U.S. Environ-mental Protection Agency 1997).
In addition to effects on plants, wildlife, water and soils,air pollutants reduce visibility. Fine particles of sulfates,nitrates, organics, soot and other compounds absorb orscatter light, reducing our ability to see wildland featuresclearly. Pollutant haze has become a common feature of thelandscape (National Research Council 1993).
Air Quality ManagementStrategy _______________________
To better understand the effects of air pollutants on FWSlands, and to ensure protection of air quality and air quality-related values, the FWS has developed an air quality man-agement strategy. This strategy includes monitoring, spe-cial studies, participation in the regulatory developmentprocess and review and evaluation of new sources of airpollution near FWS areas.
Air Pollutant MonitoringThe FWS conducts air quality monitoring in partnership
with several national programs, including the National At-mospheric Deposition Program, the Mercury Deposition Net-work Program and the Interagency Monitoring of ProtectedVisual Environments Program. Because air pollutants tendto be well-dispersed in the atmosphere (in the absence ofstrong local sources), monitoring to characterize wildernessair quality is conducted in an adjacent nonwilderness area.Thus, impacts to the wilderness from monitoring activitiesare avoided.
Figure 1—U.S. Fish and Wildlife Service Class I areas.
338 USDA Forest Service Proceedings RMRS-P-15-VOL-5. 2000
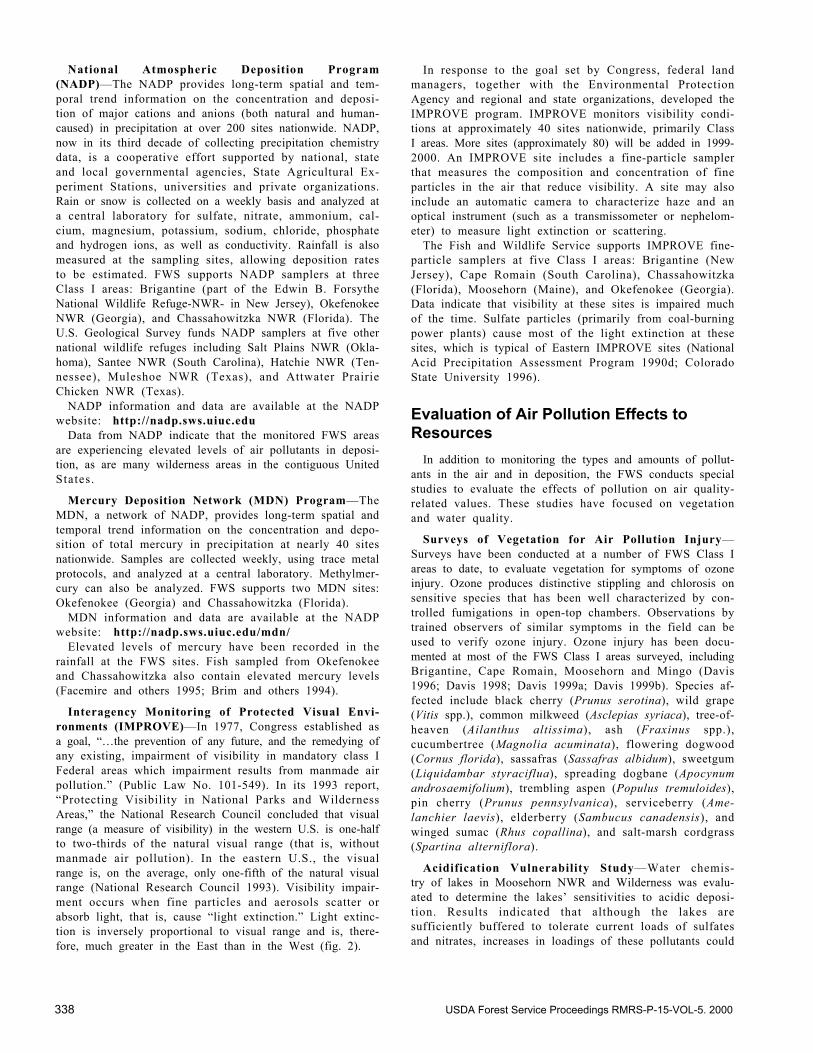
National Atmospheric Deposition Program(NADP)—The NADP provides long-term spatial and tem-poral trend information on the concentration and deposi-tion of major cations and anions (both natural and human-caused) in precipitation at over 200 sites nationwide. NADP,now in its third decade of collecting precipitation chemistrydata, is a cooperative effort supported by national, stateand local governmental agencies, State Agricultural Ex-periment Stations, universities and private organizations.Rain or snow is collected on a weekly basis and analyzed ata central laboratory for sulfate, nitrate, ammonium, cal-cium, magnesium, potassium, sodium, chloride, phosphateand hydrogen ions, as well as conductivity. Rainfall is alsomeasured at the sampling sites, allowing deposition ratesto be estimated. FWS supports NADP samplers at threeClass I areas: Brigantine (part of the Edwin B. ForsytheNational Wildlife Refuge-NWR- in New Jersey), OkefenokeeNWR (Georgia), and Chassahowitzka NWR (Florida). TheU.S. Geological Survey funds NADP samplers at five othernational wildlife refuges including Salt Plains NWR (Okla-homa), Santee NWR (South Carolina), Hatchie NWR (Ten-nessee), Muleshoe NWR (Texas), and Attwater PrairieChicken NWR (Texas).
NADP information and data are available at the NADPwebsite: http://nadp.sws.uiuc.edu
Data from NADP indicate that the monitored FWS areasare experiencing elevated levels of air pollutants in deposi-tion, as are many wilderness areas in the contiguous UnitedStates.
Mercury Deposition Network (MDN) Program—TheMDN, a network of NADP, provides long-term spatial andtemporal trend information on the concentration and depo-sition of total mercury in precipitation at nearly 40 sitesnationwide. Samples are collected weekly, using trace metalprotocols, and analyzed at a central laboratory. Methylmer-cury can also be analyzed. FWS supports two MDN sites:Okefenokee (Georgia) and Chassahowitzka (Florida).
MDN information and data are available at the NADPwebsite: http://nadp.sws.uiuc.edu/mdn/
Elevated levels of mercury have been recorded in therainfall at the FWS sites. Fish sampled from Okefenokeeand Chassahowitzka also contain elevated mercury levels(Facemire and others 1995; Brim and others 1994).
Interagency Monitoring of Protected Visual Envi-ronments (IMPROVE)—In 1977, Congress established asa goal, “…the prevention of any future, and the remedying ofany existing, impairment of visibility in mandatory class IFederal areas which impairment results from manmade airpollution.” (Public Law No. 101-549). In its 1993 report,“Protecting Visibility in National Parks and WildernessAreas,” the National Research Council concluded that visualrange (a measure of visibility) in the western U.S. is one-halfto two-thirds of the natural visual range (that is, withoutmanmade air pollution). In the eastern U.S., the visualrange is, on the average, only one-fifth of the natural visualrange (National Research Council 1993). Visibility impair-ment occurs when fine particles and aerosols scatter orabsorb light, that is, cause “light extinction.” Light extinc-tion is inversely proportional to visual range and is, there-fore, much greater in the East than in the West (fig. 2).
In response to the goal set by Congress, federal landmanagers, together with the Environmental ProtectionAgency and regional and state organizations, developed theIMPROVE program. IMPROVE monitors visibility condi-tions at approximately 40 sites nationwide, primarily ClassI areas. More sites (approximately 80) will be added in 1999-2000. An IMPROVE site includes a fine-particle samplerthat measures the composition and concentration of fineparticles in the air that reduce visibility. A site may alsoinclude an automatic camera to characterize haze and anoptical instrument (such as a transmissometer or nephelom-eter) to measure light extinction or scattering.
The Fish and Wildlife Service supports IMPROVE fine-particle samplers at five Class I areas: Brigantine (NewJersey), Cape Romain (South Carolina), Chassahowitzka(Florida), Moosehorn (Maine), and Okefenokee (Georgia).Data indicate that visibility at these sites is impaired muchof the time. Sulfate particles (primarily from coal-burningpower plants) cause most of the light extinction at thesesites, which is typical of Eastern IMPROVE sites (NationalAcid Precipitation Assessment Program 1990d; ColoradoState University 1996).
Evaluation of Air Pollution Effects toResources
In addition to monitoring the types and amounts of pollut-ants in the air and in deposition, the FWS conducts specialstudies to evaluate the effects of pollution on air quality-related values. These studies have focused on vegetationand water quality.
Surveys of Vegetation for Air Pollution Injury—Surveys have been conducted at a number of FWS Class Iareas to date, to evaluate vegetation for symptoms of ozoneinjury. Ozone produces distinctive stippling and chlorosis onsensitive species that has been well characterized by con-trolled fumigations in open-top chambers. Observations bytrained observers of similar symptoms in the field can beused to verify ozone injury. Ozone injury has been docu-mented at most of the FWS Class I areas surveyed, includingBrigantine, Cape Romain, Moosehorn and Mingo (Davis1996; Davis 1998; Davis 1999a; Davis 1999b). Species af-fected include black cherry (Prunus serotina), wild grape(Vitis spp.), common milkweed (Asclepias syriaca), tree-of-heaven (Ailanthus altissima), ash (Fraxinus spp.),cucumbertree (Magnolia acuminata), flowering dogwood(Cornus florida), sassafras (Sassafras albidum), sweetgum(Liquidambar styraciflua), spreading dogbane (Apocynumandrosaemifolium), trembling aspen (Populus tremuloides),pin cherry (Prunus pennsylvanica), serviceberry (Ame-lanchier laevis), elderberry (Sambucus canadensis), andwinged sumac (Rhus copallina), and salt-marsh cordgrass(Spartina alterniflora).
Acidification Vulnerability Study—Water chemis-try of lakes in Moosehorn NWR and Wilderness was evalu-ated to determine the lakes’ sensitivities to acidic deposi-tion. Results indicated that although the lakes aresufficiently buffered to tolerate current loads of sulfatesand nitrates, increases in loadings of these pollutants could

USDA Forest Service Proceedings RMRS-P-15-VOL-5. 2000 339
Figure 2—Light extinction coefficient, calculated from aerosol concentrations measured by IMPROVE (National Park Service Air ResourcesDivision).
reduce buffering capacity and increase the risk of acidifica-tion (Kahl and James 1996).
Eutrophication Vulnerability Study—Water chemis-try, phytoplankton and sea grasses have been examinedfrom 1996 to the present at Chassahowitzka to evaluatenutrient and trophic status, phytoplankton species composi-tion and density, and sea grass health and distribution.Table 1 summarizes water quality parameters for Chas-sahowitzka. In the first two years of the study, 1996-1997,water quality and trophic state were considered good. Water
clarity was high, and chlorophyll and nutrient concentrationswere low. However, in 1998, water quality and trophic statewere considered poor. Significant algae blooms were noted,with loss of water clarity and low dissolved oxygen concen-trations. Nitrogen was found to be the limiting nutrient inthis system (Dixon 1998). Further work will be conducted in1999 to evaluate whether the poor water quality observed in1998 affected sea grass health.
The studies described above were limited to a smallnumber of FWS Class I areas. However, it is likely that otherFWS areas are experiencing similar effects. For example,ozone injury to vegetation probably occurs in many FWSareas, particularly in the eastern U.S. and certain areas inthe West (California), because of the high ozone concentra-tions that are typical of these areas. Atmospheric nitrogen isprobably contributing to eutrophication at many FWS areasalong the Gulf and Atlantic coasts. And, visibility impair-ment affects all FWS areas in the contiguous United States.
Participation in the RegulatoryDevelopment Process
The FWS routinely reviews and comments on legislationand rule-making regarding air quality, including recentregulations pertaining to ozone, particulate matter, re-gional haze and new source review. In addition, the agency
Table 1—Average water quality parameters for coastal stations inChassahowitzka National Wildlife Refuge (Dixon 1998).
Chlorophyll aDate micrograms/liter IN:IPa TSIb
May 1996 3 3 31May 1997 2 5 30September 1997 2 11 35May 1998 18 4 60July 1998 18 3 57
aInorganic nitrogen:inorganic phosphorous (IN:IP) ratio below 10 indicatesthat phytoplankton growth is nitrogen-limited.
bTrophic State Index (TSI) value below 50 indicates good water quality. TSIabove 50 indicates poor water quality.
340 USDA Forest Service Proceedings RMRS-P-15-VOL-5. 2000
participates in regional air quality partnerships includingthe Grand Canyon Visibility Transport Commission, theWestern Regional Air Partnership, and others. The FWSworks with states to develop their State ImplementationPlans for the Clean Air Act. Participation in these forumsensures that FWS concerns for air quality and air quality-related values under its jurisdiction are addressed.
Review and Evaluation of New Sources ofAir Pollution
The Environmental Protection Agency or state permit-ting authority is required to notify the FWS (or appropriatefederal land manager) of any permit application from amajor source of emissions that may affect a Class I area.The facility must (1) use best available emissions controltechnology, (2) demonstrate that emissions will not causeor contribute to violations of the National Ambient AirQuality Standards or Class I increments (the maximumallowable increase in a pollutant, designated by the CleanAir Act), and (3) demonstrate that emissions will not causeor contribute to adverse impacts to air quality-relatedvalues in the Class I area. The FWS, together with theNational Park Service, has developed guidance for Class Iarea analyses that is available to air pollution permitapplicants (Bunyak 1993). The FWS is given the opportu-nity to review and comment on the proposed source’scontrol technology, air quality impacts and air quality-related values impacts. The FWS may recommend bettercontrol technology, lower emission rates or lower produc-tion rates to mitigate potential impacts to the Class I area.In addition, the agency may ask for additional analyses toprovide adequate information to evaluate potential im-pacts. If its concerns are not addressed, and the FWSdetermines that there is potential for adverse impacts to aClass I area from the proposed source’s emissions, the FWSmay appeal the permit.
In summary, the air quality management strategy of theFWS is designed to increase understanding and ensureprotection of air quality and air quality-related values onFWS lands. Continued progress in understanding air pollu-tion and its effects will enable the FWS Air Quality Manage-ment Program to more effectively protect its wildernessresources.
References _____________________Aber, J. D.; Magill, A.; McNulty, S. G.; Boone, R. D.; Nadelhoffer, K. J.;
Downs, M.; Hallett, R. 1995. Forest biogeochemistry and primaryproduction altered by nitrogen saturation. Water, Air and SoilPollution. 85: 1665-1670.
Brim, M.; Bateman, D.; Jarvis, R. 1994. Mercury concentrations in fishesof the Chassahowitzka National Wildlife Refuge. U.S. Fish andWildlife Service Publication No. PCFO-EC 94-01. Panama City, FL.
Bunyak, John. 1993. Permit application guidance for new airpollution sources. National Park Service Natural Resources Re-port 93/09. Denver, CO.
Chappelka, Arthur H.; Chevone, Boris I. 1992. Tree responses to ozone.In: Lefohn, Allen S., ed. Surface level ozone exposures and theireffects on vegetation. Chelsea, MI: Lewis Publishers: 271-324.
Colorado State University. Cooperative Institute for Research inthe Atmosphere. 1996. IMPROVE, Interagency Monitoring ofProtected Visual Environments. Spatial and seasonal patterns
and long term variability of the composition of the haze in theUnited States: an analysis of data from the IMPROVE network.
Davis, Donald D. 1996. Evaluation of ambient ozone injury on the foliageof vegetation in the Edwin B. Forsythe National Wildlife Refuge,Brigantine, NJ: 1996 Observations. Pennsylvania State University.
Davis, Donald D. 1998. Evaluation of ambient ozone injury on thefoliage of vegetation in the Cape Romain National Wildlife Refuge,South Carolina: 1997 Observations. Pennsylvania State University.
Davis, Donald D. 1999a. Evaluation of ozone injury on vegetation inthe Moosehorn National Wildlife Refuge, Maine: 1998 Observa-tions. Pennsylvania State University.
Davis, Donald D. 1999b. Evaluation of ozone injury on vegetation inthe Mingo National Wildlife Refuge, Missouri: 1998 Observa-tions. Pennsylvania State University.
Dixon, L. Kellie. 1998. Chassahowitzka National Wildlife RefugeStatus and Trends. Mote Marine Laboratory Technical ReportNumber 579. Sarasota, Florida.
Facemire, C.; Augspurger, T.; Bateman, D.; Brim, M.; Conzelmann, P.;Delchamps, S.; Douglas, E.; Inmon, L.; Looney, K.; Lopez, F.;Masson, G.; Morrison, D.; Morse, N.; Robison, A. 1995. Impacts ofmercury contamination in the southeastern United States. Water,Air, and Soil Pollution. 80: 923-926.
Griffith, Michael B.; Perry, Sue A.; Perry, William B. 1995.Macroinvertebrate communities in headwater streams affectedby acidic precipitation in the Central Appalachians. Journal ofEnvironmental Quality. 24: 233-238.
Johnson, D.; Lindberg, S. (eds). 1992. Atmospheric Deposition andForest Nutrient Cycling. Springer-Verlag, New York. 707 p.
Kahl, Steve; James, Cary. 1996. Lake Chemistry in MoosehornNational Wildlife Refuge, Maine, 1995. Water Research Insti-tute, University of Maine, Orono.
Manning, William J.; Krupa, Sagar V. 1992. Experimental method-ology for studying the effects of ozone on crops and trees. In:Lefohn, Allen S., ed. Surface level ozone exposures and theireffects on vegetation. Chelsea, MI: Lewis Publishers: 93-156.
National Acid Precipitation Assessment Program. 1990a. AcidicDeposition: State of Science and Technology, Report 10, Water-shed and lake processes affecting surface water acid-base chem-istry. Washington, D.C.
National Acid Precipitation Assessment Program. 1990b. AcidicDeposition: State of Science and Technology, Report 13, Biologi-cal effects of changes in surface water acid-base chemistry.Washington, D.C.
National Acid Precipitation Assessment Program. 1990c. AcidicDeposition: State of Science and Technology, Report 16, Changesin forest health and productivity in the United States and Canada.Washington, D.C.
National Acid Precipitation Assessment Program. 1990d. AcidicDeposition: State of Science and Technology, Report 24, Visibil-ity: Existing and Historical Conditions–Causes and Effects.Washington, D.C.
National Research Council. 1993. Protecting visibility in nationalparks and wilderness areas. Washington, D.C.: National Acad-emy Press. 466 p.
Paerl, Hans W. 1993. Emerging role of atmospheric nitrogen depo-sition in coastal eutrophication: biogeochemical and trophic per-spectives. Canadian Journal of Fisheries and Aquatic Science. 50:2254-2269.
Paerl, Hans W. 1995. Coastal eutrophication in relation to atmosphericnitrogen deposition: current perspectives. Ophelia. 41: 237-259.
Schroeder, William H.; Munthe, John. 1998. Atmospheric mer-cury—an overview. Atmospheric Environment 32(5): 809-822.
Thornton, F. C.; Joslin, J. D.; Pier, P. A.; Neufeld, H.; Seiler, J. R.;Hutcherson, J. D. 1994. Cloudwater and ozone effects upon highelevation red spruce: a summary of study results from WhitetopMountain, Virginia. Journal of Environmental Quality. 23(6):1158-1167.
U.S. Environmental Protection Agency. 1997. Mercury Study Re-port to Congress, Vol. VII: Characterization of human health andwildlife risks from mercury exposure in the United States. EPA-452/R-97-009.
Vitousek, Peter M.; Aber, John D.; Howarth, Robert W.; Likens,Gene E.; Matson, Pamela A.; Schindler, David W.; Schlesinger,William H.; Tilman, David G. 1997. Human alteration of theglobal nitrogen cycle: sources and consequences. EcologicalApplications. 7(3): 737-750.


![An NADP-specific Electron-bifurcating [FeFe]-hydrogenase in a](https://img.pdfslide.us/doc/110x75/620492434b1be21e4726ceca/an-nadp-specific-electron-bifurcating-fefe-hydrogenase-in-a.jpg)