Embed Size (px)
Citation preview

Dyscalculia in Further and Higher Education
NADP 2010 1
• Definitions and Prevalence
• Screening
• Supporting Students
Presentation
NADP 2010 2

Towards a Definition
NADP 2010 3

Mathematics Disorder: "as measured by a standardised test that is given individually, the person's mathematical ability is substantially less than would be expected from the person’s age, intelligence and education. This deficiency materially impedes academic achievement or daily living"
DSM-IV (2000)
NADP 2010 4
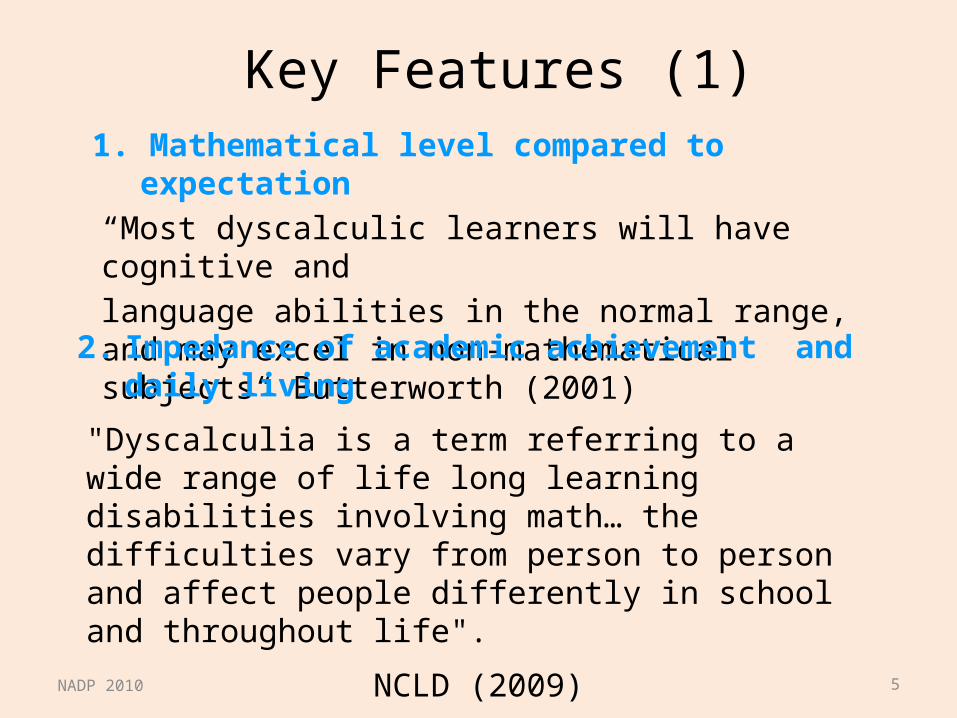
1. Mathematical level compared to expectation
“Most dyscalculic learners will have cognitive and
language abilities in the normal range, and may excel in non-mathematical subjects“ Butterworth (2001)
Key Features (1)
2. Impedance of academic achievement and daily living
"Dyscalculia is a term referring to a wide range of life long learning disabilities involving math… the difficulties vary from person to person and affect people differently in school and throughout life".
NCLD (2009)
NADP 2010 5
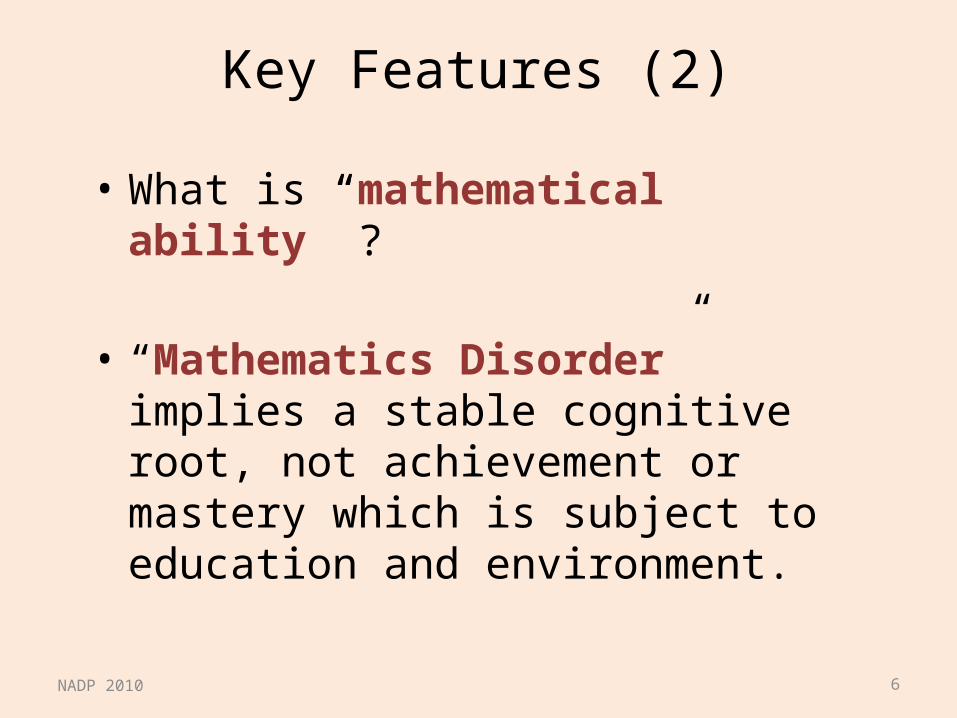
• What is “mathematical ability” ?
• “Mathematics Disorder” implies a stable cognitive root, not achievement or mastery which is subject to education and environment.
Key Features (2)
NADP 2010 6
Dyscalculia is a condition that affects the ability to acquire arithmetical skills. Dyscalculic learners may have difficulty understanding simple number concepts, lack an intuitive grasp of numbers, and have problems learning number facts and procedures. Even if they produce a correct answer or use a correct method, they may do so mechanically and without confidence
The National Numeracy Strategy DfES (2001)
NADP 2010 7
• “acquire ” emphasises acquisition rather than carrying out arithmetic procedures.
• “difficulty understanding simple number concepts, lack an intuitive grasp of numbers” placing understanding at the core of dyscalculia
Key Features (1)
NADP 2010 8

“A lack of a true comprehension or understanding of maths will be a key characteristic of dyscalculic people”
Chinn S. (2006)
Key Features (2)
“Learning number facts and procedures” : more dyslexia related?
NADP 2010 9
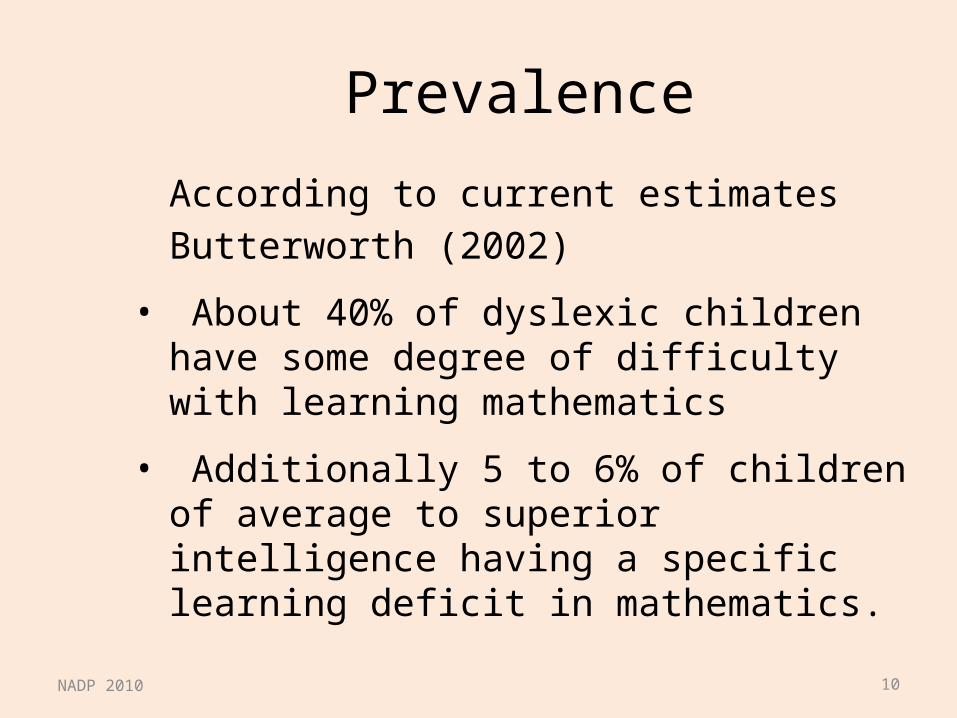
According to current estimates
Butterworth (2002)
• About 40% of dyslexic children have some degree of difficulty with learning mathematics
• Additionally 5 to 6% of children of average to superior intelligence having a specific learning deficit in mathematics.
Prevalence
NADP 2010 10
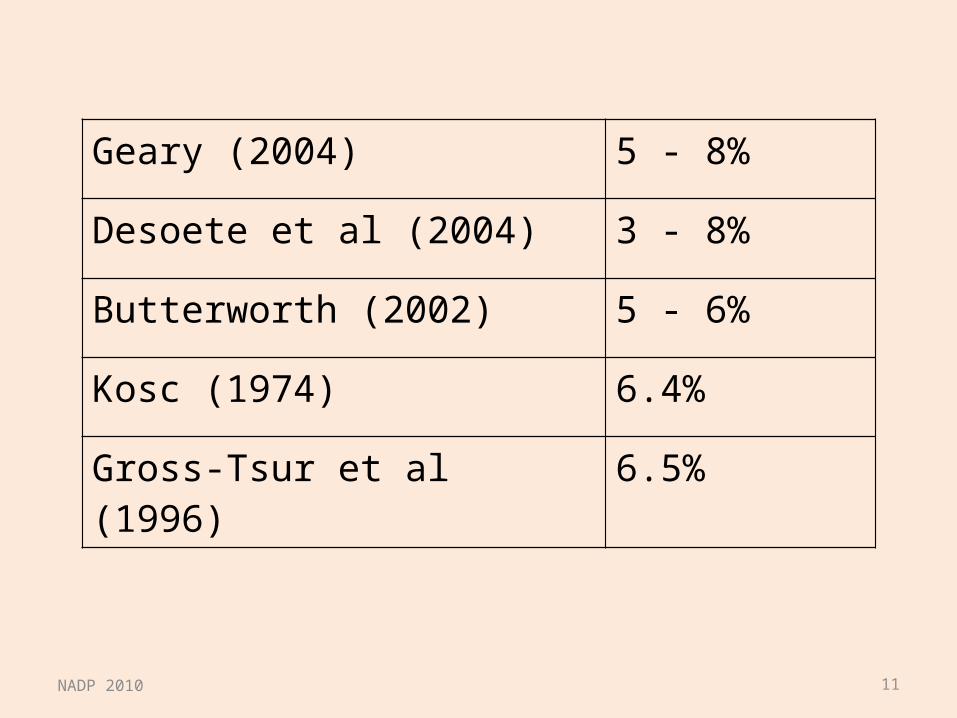
Geary (2004) 5 - 8%
Desoete et al (2004) 3 - 8%
Butterworth (2002) 5 - 6%
Kosc (1974) 6.4%
Gross-Tsur et al (1996) 6.5%
NADP 2010 11
12
A first-line screening tool for dyscalculia focusing on
Understanding Mathematics
NADP 2010
Developed by Trott and Beacham, Loughborough University
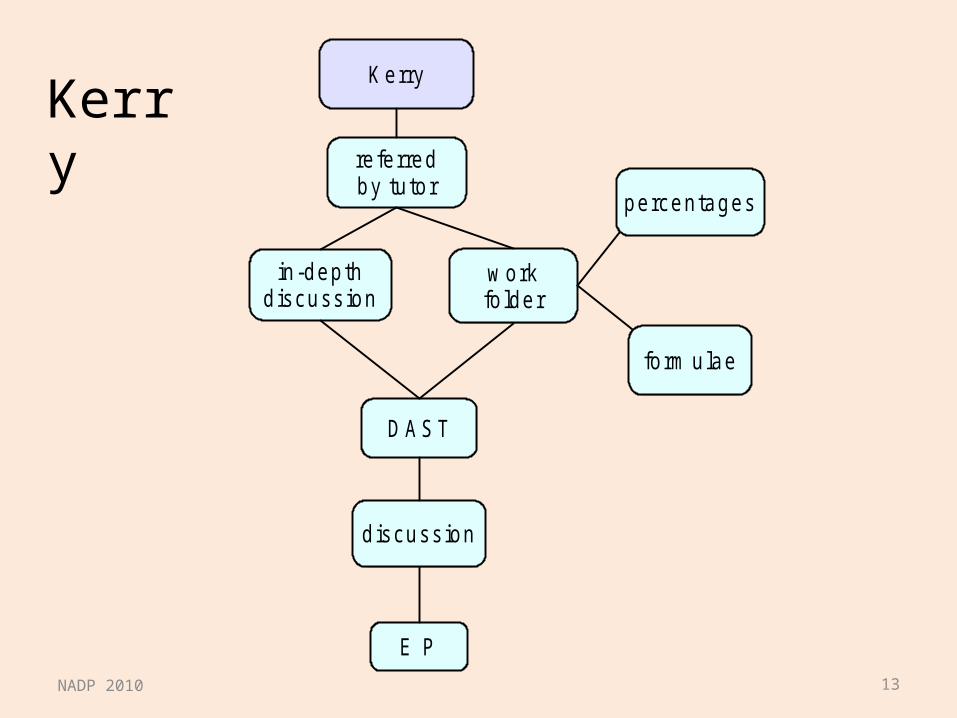
K erry
d iscuss ion
in-depthd iscuss ion
re ferredby tu tor
w orkfo lder
percentages
E P
form ulae
D A S T
13
Kerry
NADP 2010
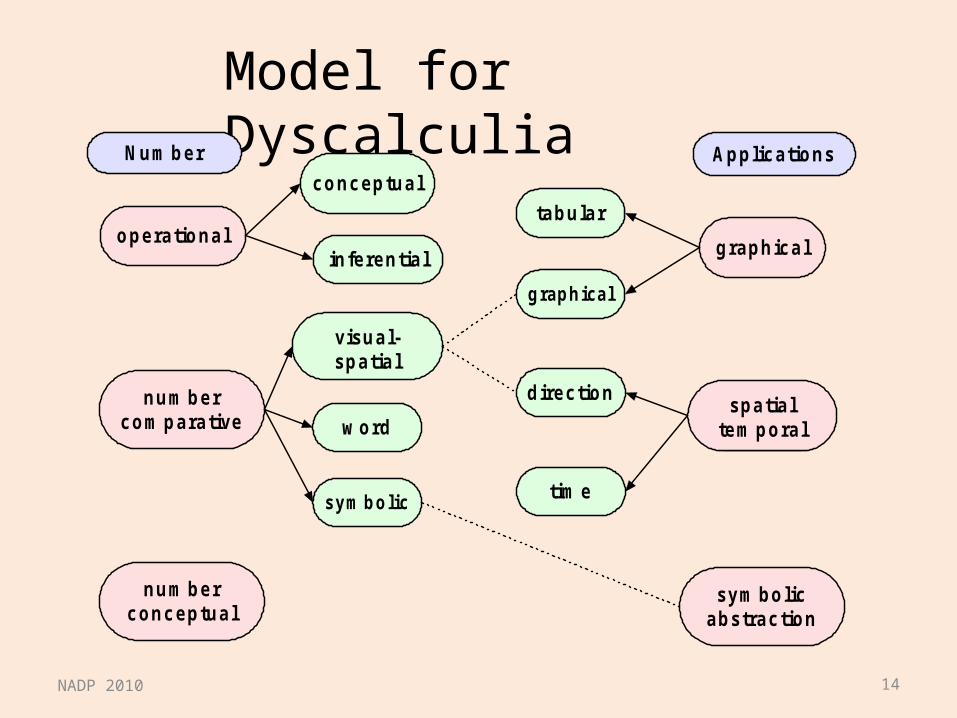
Model for Dyscalculia
num berconceptual
inferential
tabular
w ord
visual-spatial
direction
graphical
operational
num bercom parative
spatialtem poral
graphical
sym bolicabstraction
sym bolic
conceptual
tim e
Num ber Applications
14NADP 2010
15
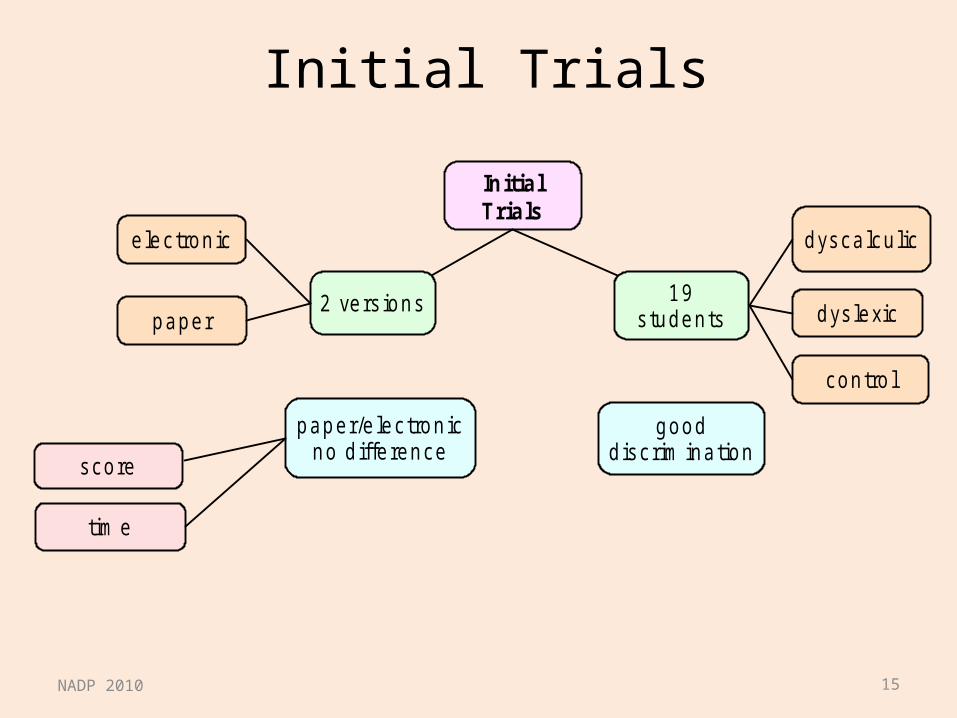
InitialTrials
dys lexic
gooddisc rim ination
e lec tron ic
paper
contro l
paper/e lec tron icno d iffe rence
19s tudents
dysca lcu lic
tim e
2 vers ions
score
Initial Trials
NADP 2010
16
• Involved 30 participants• Organised into three equal groups
– Dyscalculic– Dyslexic– Control
• Covered a range of academic subjects
Further Trials
NADP 2010
17
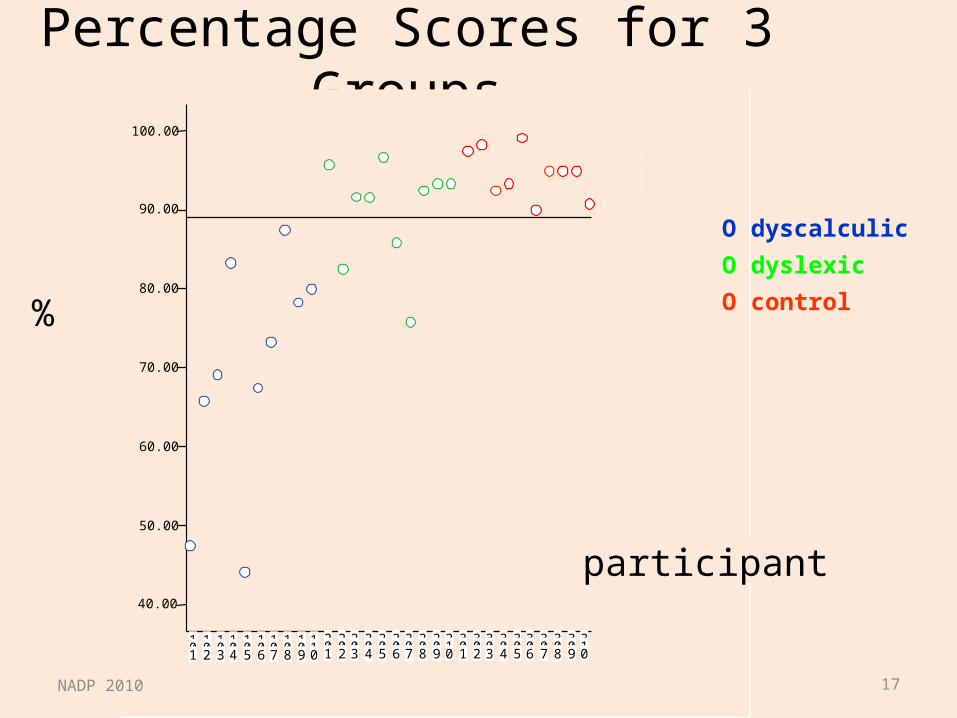
Percentage Scores for 3 Groups
%
101
102
103
104
105
106
107
108
109
110
201
202
203
204
205
206
207
208
209
210
301
302
303
304
305
306
307
308
309
310
participant40.00
50.00
60.00
70.00
80.00
90.00
100.00
O dyscalculic
O dyslexic
O control
NADP 2010
18
0
20
40
60
80
100
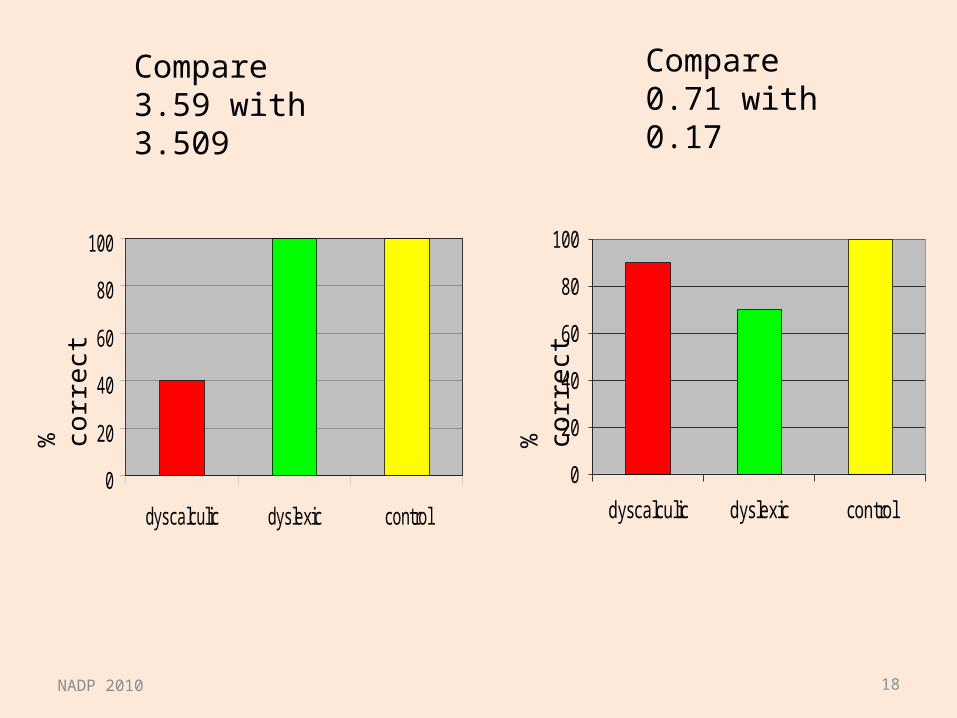
dyscalculic dyslexic control
0
20
40
60
80
100
dyscalculic dyslexic control
Compare 0.71 with 0.17
% c
orre
ct
Compare 3.59 with 3.509
% c
orre
ct
NADP 2010

19
0
20
40
60
80
100
dyscalculic dyslexic control
0
20
40
60
80
100
dyscalculic dyslexic controlNADP 2010
20
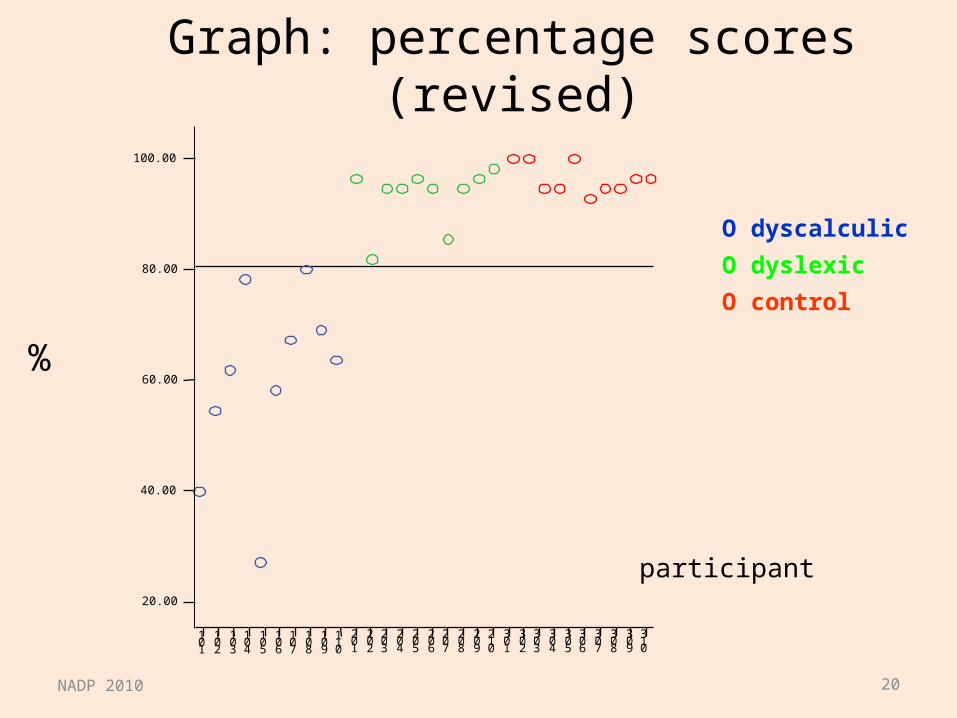
Graph: percentage scores (revised)
%
101
102
103
104
105
106
107
108
109
110
201
202
203
204
205
206
207
208
209
210
301
302
303
304
305
306
307
308
309
310
participant20.00
40.00
60.00
80.00
100.00
O dyscalculic
O dyslexic
O control
NADP 2010

21
Further Trials
sm all sca legenera lpopu la tion dysca lcu lic
ind ividua l
data
large sca le
paper basedw hole c lass e lec tron ic
504s tudents
2nd and 8 thpercentile ranks
low
severe lyat riskvery low
at risk
Further Trials
NADP 2010
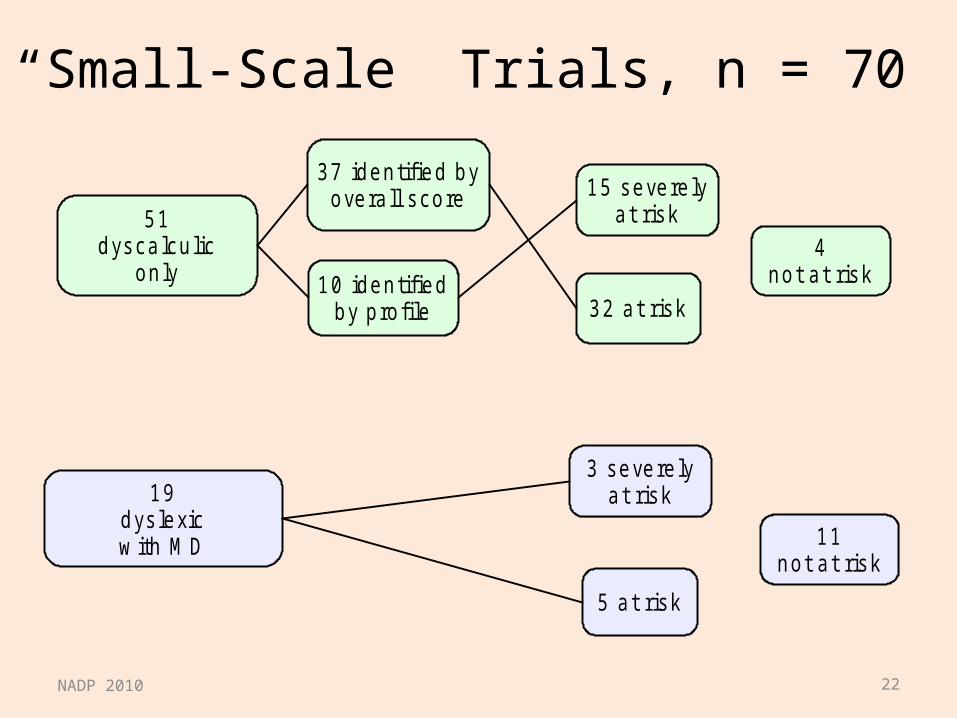
19dys lexicw ith M D
5 at risk
3 severe lya t risk
11not a t risk
51dysca lcu lic
on ly
15 severe lyat risk
37 identified byovera ll score
32 a t risk10 identified
by pro file
4not a t risk
22
“Small-Scale” Trials, n = 70
NADP 2010
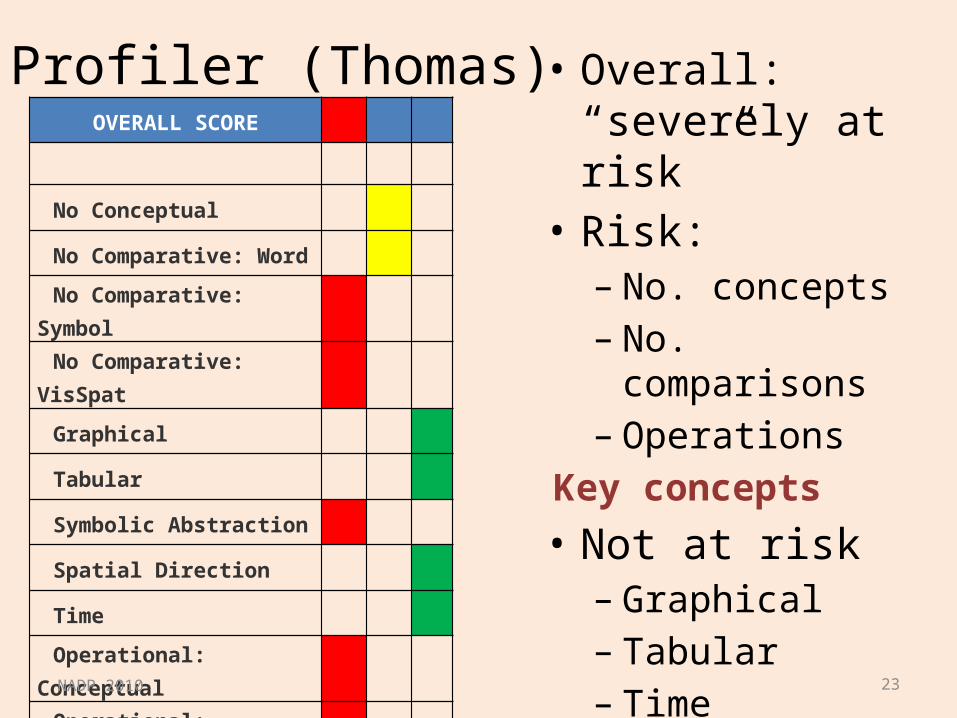
• Overall: “severely at risk ”
• Risk:– No. concepts– No. comparisons– Operations
Key concepts
• Not at risk– Graphical – Tabular – Time – Spatial
More visual applications
OVERALL SCORE
No Conceptual
No Comparative: Word
No Comparative: Symbol
No Comparative: VisSpat
Graphical
Tabular
Symbolic Abstraction
Spatial Direction
Time
Operational: Conceptual
Operational: Inferential
Profiler (Thomas)
NADP 2010 23
NADP 2010 24
• Online large-scale screener for dyscalculia• On-line delivery of screening tool to identify
students at risk with minimal staff input• Profiler identifies students requiring further
investigation that can be:– In depth interview– Referral for further testing

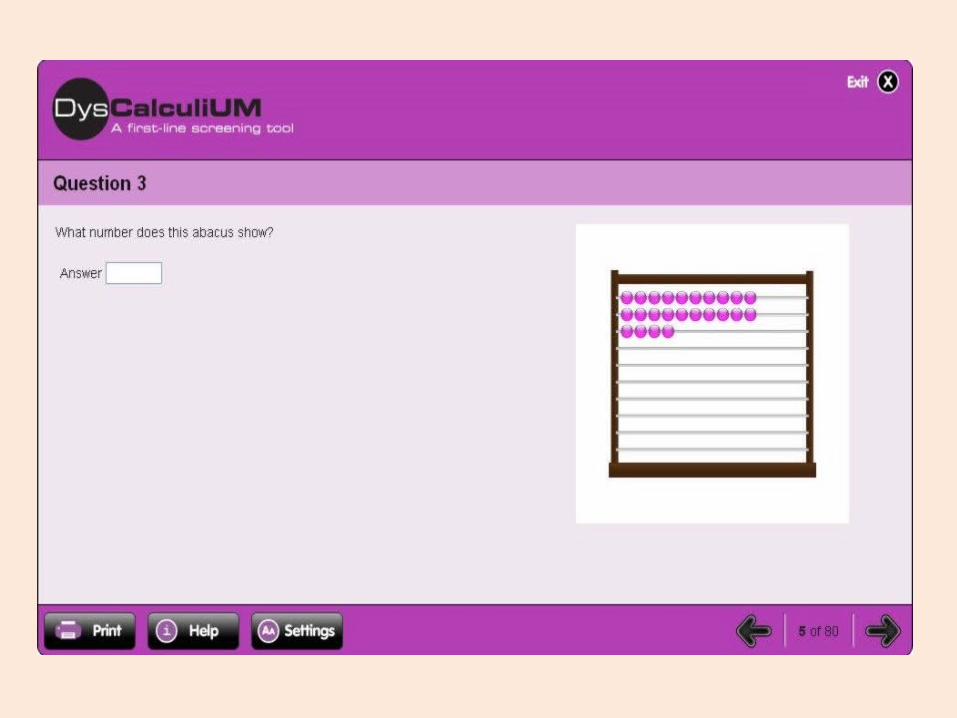
Learner accesses DysCalculiUM
portal
• Completes screener
• Results automatically analysed
Tutor access DysCalculiU
M portal
• Reviews students results & profiles
• Identify students who are at risk
Further investigation of difficulties
DysCalculiUM process

One-to-one Support for the Dyscalculic Student
A Case Study: Liam
NADP 2010 28
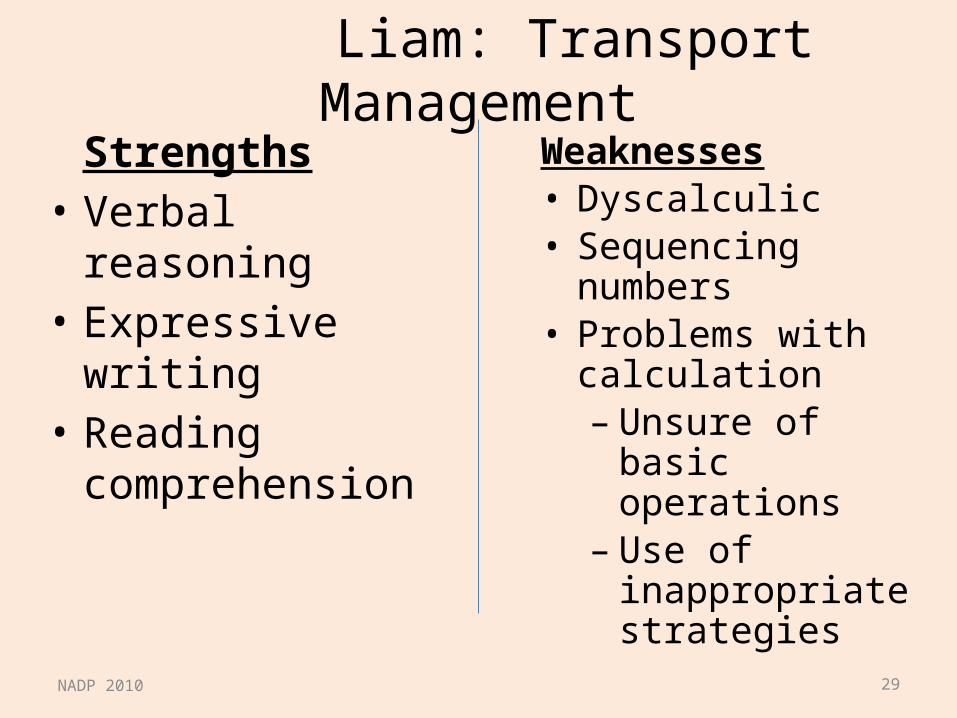
Weaknesses• Dyscalculic• Sequencing
numbers• Problems with
calculation– Unsure of basic
operations– Use of
inappropriate strategies
Liam: Transport Management
Strengths• Verbal reasoning• Expressive
writing• Reading
comprehension
NADP 2010 29
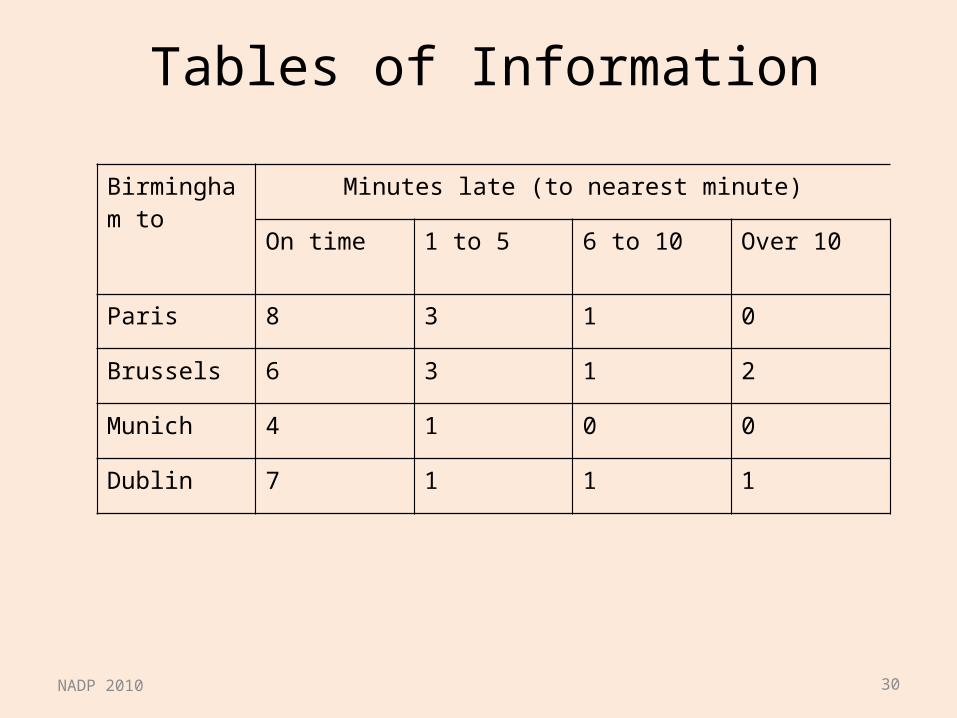
Birmingham to
Minutes late (to nearest minute)
On time 1 to 5 6 to 10 Over 10
Paris 8 3 1 0
Brussels 6 3 1 2
Munich 4 1 0 0
Dublin 7 1 1 1
Tables of Information
NADP 2010 30
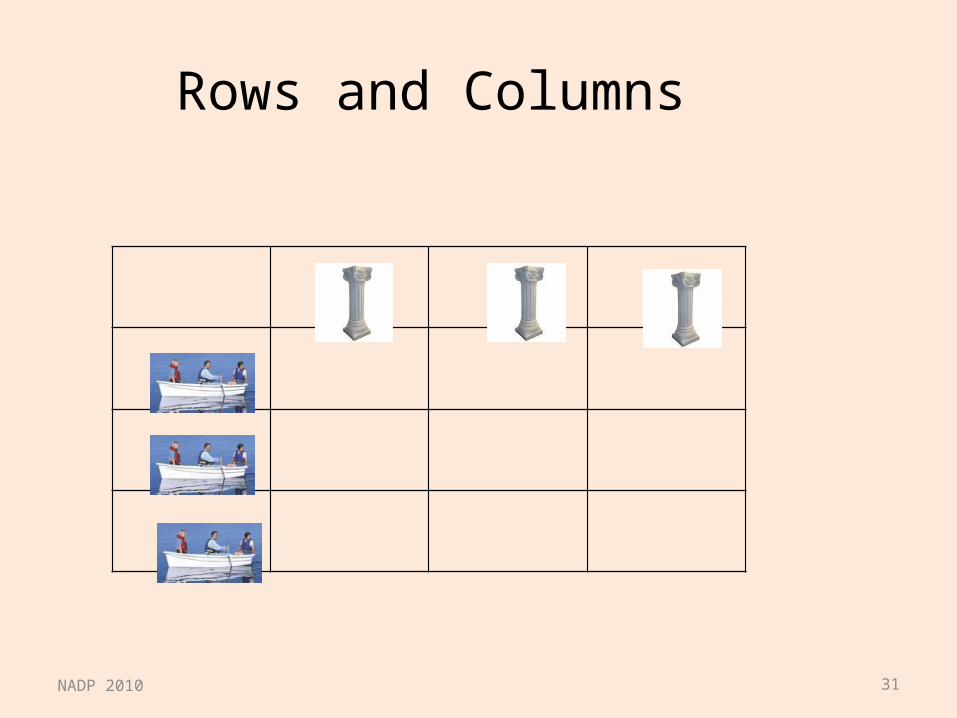
Rows and Columns
NADP 2010 31
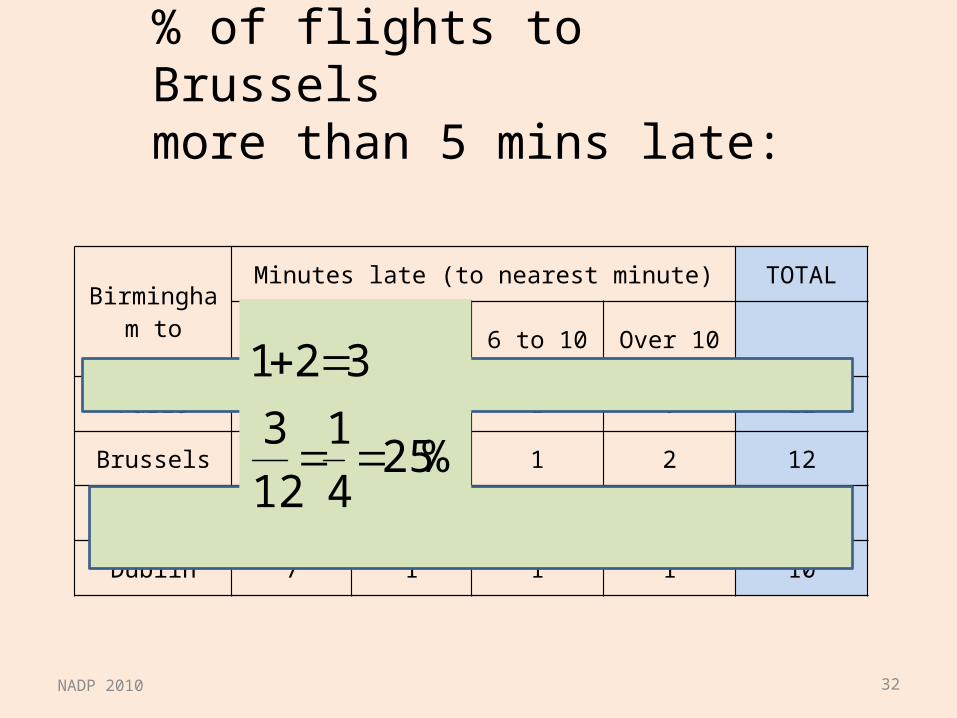
Birmingham to
Minutes late (to nearest minute) TOTAL
On time 1 to 5 6 to 10 Over 10
Paris 8 3 1 0 12
Brussels 6 3 1 2 12
Munich 4 1 0 0 5
Dublin 7 1 1 1 10
% of flights to Brussels more than 5 mins late:
%254
1
12
3
321
NADP 2010 32

12 flights
3 late
312
1003
12
1001
%10012
flights
flight
flights
Alternative Approaches
10012
3
NADP 2010 33
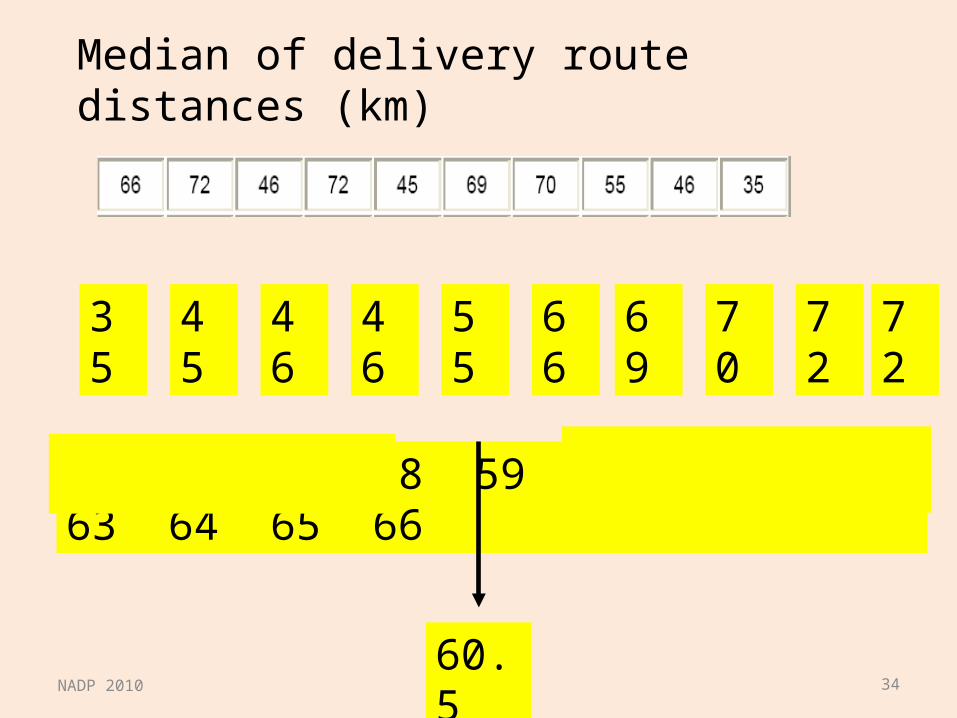
6635 46 55 706945 7246 72
55 56 57 58 59 60 61 62 63 64 65 66
60.5
Median of delivery route distances (km)
NADP 2010 34

http://incompetech.com/beta/plainGraphPaper/
Resources
NADP 2010 35
36
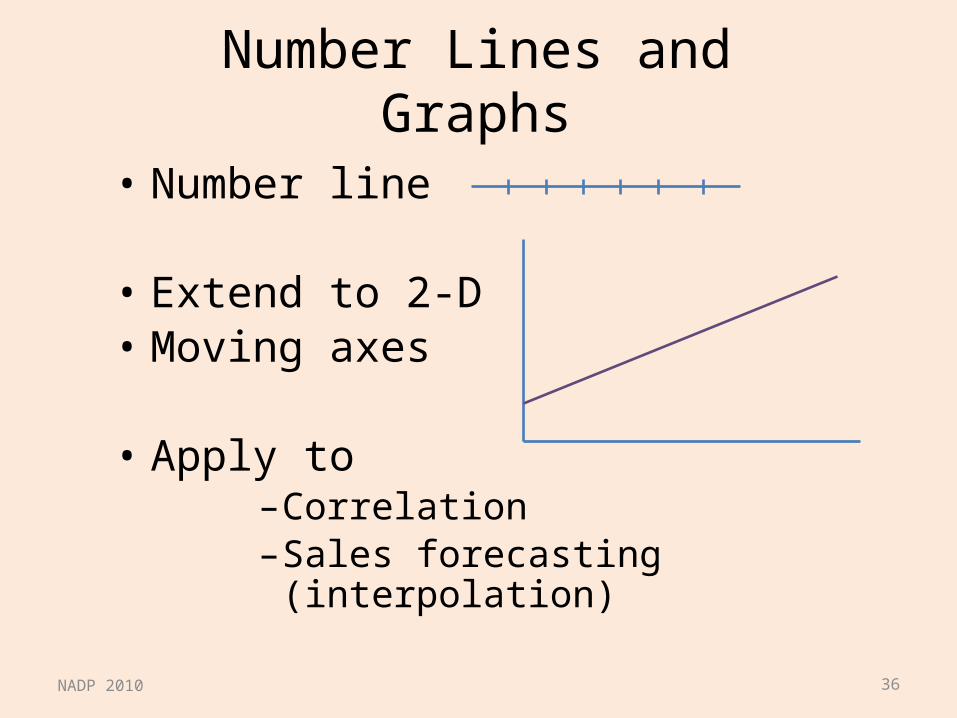
• Number line
• Extend to 2-D• Moving axes
• Apply to –Correlation–Sales forecasting (interpolation)
Number Lines and Graphs
NADP 2010
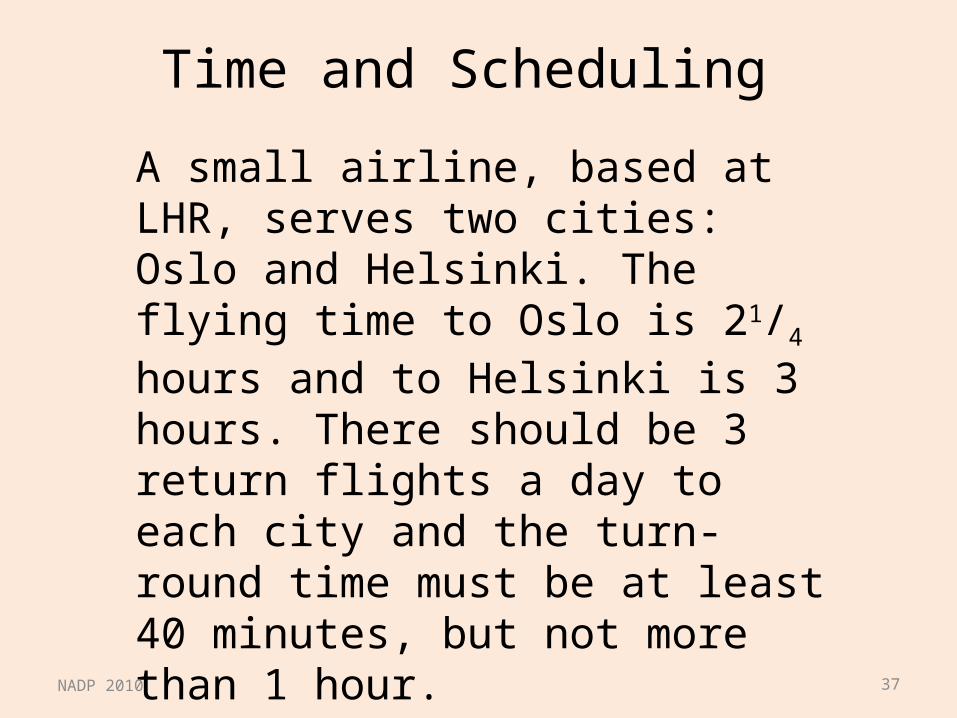
A small airline, based at LHR, serves two cities: Oslo and Helsinki. The flying time to Oslo is 21/4 hours and to Helsinki is 3 hours. There should be 3 return flights a day to each city and the turn-round time must be at least 40 minutes, but not more than 1 hour. Construct a schedule.
Time and Scheduling
NADP 2010 37
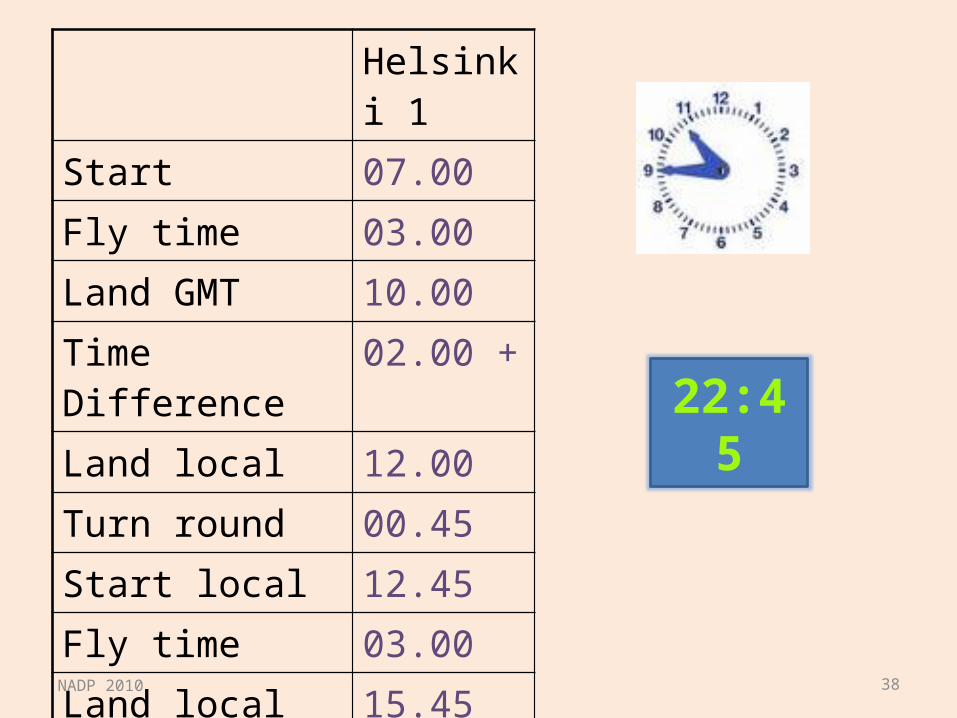
Helsinki 1
Start 07.00
Fly time 03.00
Land GMT 10.00
Time Difference 02.00 +
Land local 12.00
Turn round 00.45
Start local 12.45
Fly time 03.00
Land local 15.45
Time difference 02.00 -
Land GMT 13.45
22:45
NADP 2010 38

L
O H
07.0010.0016.00 12.00
15.0021.00
12.4515.4521.45
13.4516.4522.45
07.0014.0018.0010.15
17.1521.15
11.0018.0022.00
12.4519.4523.45
NADP 2010 39
There is an urgent need for:• Effective screening and assessment• An understanding of student support
needs
With appropriate support the dyscalculic student can move forward and succeed.
Dyscalculia: The Way Forward
NADP 2010 40