Embed Size (px)
Citation preview

AIR QUALITY LIFE INDEX® | SEPTEMBER 2021
Annual Update By Ken Lee and Michael Greenstone
Index®
Introducing the Air Quality Life IndexTwelve Facts about Particulate Air Pollution, Human Health, and Global Policy
By Michael Greenstone and Claire Qing Fan, Energy Policy Institute at the University of Chicago
NOVEMBER 2018
Index®
NEW YORK CITY 1973NEW YORK CITY 2018
Executive Summary Over the past year, Covid-19 lockdowns shut industries down and forced vehicles off the roads, momentarily bringing blue skies to some of the most polluted regions on Earth. In India, clean air allowed some communities to view the snow-capped Himalayas for the first time in years. But on the other side of the world, a different story unfolded. Cities like Chicago, New York, and Boston—where blue skies have been the norm for decades, due to strong clean air policies—experienced pollution warnings as wildfires, exacerbated by a drier and hotter climate, sent clouds of smoke to cities thousands of miles away.
These remarkable events illustrate that air pollution is not only a global challenge, but is also intertwined with climate change. Both challenges are primarily caused by the same culprit: fossil fuel emissions from power plants, vehicles and other industrial sources. More than ever before, the world urgently needs strong policies to reduce its dependence on fossil fuels. The data supports this need. The Air Quality Life Index (AQLI) shows that strong pollution policies pay back in additional years of life for people across the world. The AQLI’s latest data reveals that reducing air pollution to meet the World Health Organization’s (WHO) guideline would add 2.2 years onto global life expectancy.
China is an important model of progress. In 2013, China experienced some of its highest pollution levels to that point, and public awareness and criticism reached new heights. The following year, Chinese Premier Li Keqiang declared a “war against pollution,” allocating substantial public resources to combating pollution. China’s strict policy action led to a swift reduction in pollution. Since 2013, particulate pollution in China has declined by 29 percent, adding about 1.5 years onto average life expectancy assuming these reductions are sustained. To place China’s success into context, it took several decades and recessions for the United States and Europe to achieve the same pollution reductions that China was able to accomplish in 6 years, even as it continued to grow its economy.
China’s war against pollution demonstrates that progress is indeed possible, even in the world’s most polluted countries.
In this report, we utilize updated AQLI data to illustrate the opportunities that countries have to allow their people to enjoy healthier and longer lives.
In no region of the world are these opportunities greater than South Asia, which includes four of the five most polluted countries in the world. In Bangladesh, India, Nepal, and Pakistan, the AQLI data reveal that the average person would live 5.6 years longer if pollution were reduced to meet the WHO guideline. Due to South Asia’s high population and pollution concentrations, the region accounts for 58 percent of total life years lost due to particulate pollution exceeding the WHO guideline. The benefits of clean air policy are even greater in the Indo-Gangetic plains of Northern India, where 480 million people regularly breathe pollution levels that exceed those found in Europe and North America by an order of magnitude.
Air pollution is also a major threat in the Southeast Asian metropolises of Bangkok, Ho Chi Minh City, and Jakarta. In these cities, the average resident stands to gain 2 to 5 years of life expectancy if pollution levels were reined in to meet the WHO guideline. Meanwhile, in Central and West Africa, the effects of particulate pollution on life expectancy are comparable to those of well-known threats like HIV/AIDS and malaria. In the Niger Delta region of Nigeria, the air quality is on par with South Asia, with the average resident on track to lose nearly 6 years of life expectancy if pollution trends continue.
The AQLI data is yet another warning that the stakes are higher than ever to reduce fossil fuel emissions. Working unseen inside the human body, the deadly effects of PM2.5 on the heart, lungs, and other systems have a more devastating impact on life expectancy than communicable diseases like tuberculosis, behavioral killers like cigarette smoking, and even war. Without strong policies to reduce fossil fuels and bring global air pollution levels down to meet the WHO guideline, billions of life-years will be lost. At the same time, climate-induced wildfires will only worsen air pollution, along with other dire climate consequences.
METHODOLOGY
The life expectancy calculations made by the AQLI are based on a pair of peer-reviewed studies, Chen et al. (2013) and Ebenstein et al. (2017), co-authored by Milton Friedman Distinguished Service Professor in Economics Michael Greenstone, that draw on a unique natural experiment in China. By comparing two subgroups of the population that experienced prolonged exposure to different levels of particulate air pollution, the studies are able to plausibly isolate the effect of particulate air pollution from other factors that affect health. The more recent of the two studies found that
sustained exposure to an additional 10 μg/m3 of PM10 reduces life expectancy by 0.64 years. Calculated in terms of PM2.5
, this means that each additional 10 μg/m3 of PM2.5 exposure reduces life expectancy by 0.98 years. The AQLI applies
this relationship to global, satellite-derived PM2.5 measurements to determine the gains in life expectancy that could be achieved from cleaner air in communities around the world.
The contrasting experiences of blue skies in polluted regions and hazy skies in normally clean regions offer up two visions
of what the future could hold. The difference between those futures lies in policies to reduce fossil fuels.
2 | 2021 Annual Update AQLI
View from Pathankot in Punjab, India after Covid-19 lockdowns reduced air pollution, April 2020. Some residents reported seeing the peaks of the Himalayas for the first time in 30 years. Source: Twitter @PARASRISHI
Wildfires burning out of control across the Western United States cause hazy skies throughout New York City, July 20, 2021 Source: Getty Images
Note: The WHO changed its particulate pollution guidance on September 22, 2021. The data here reflects the previous guidance.
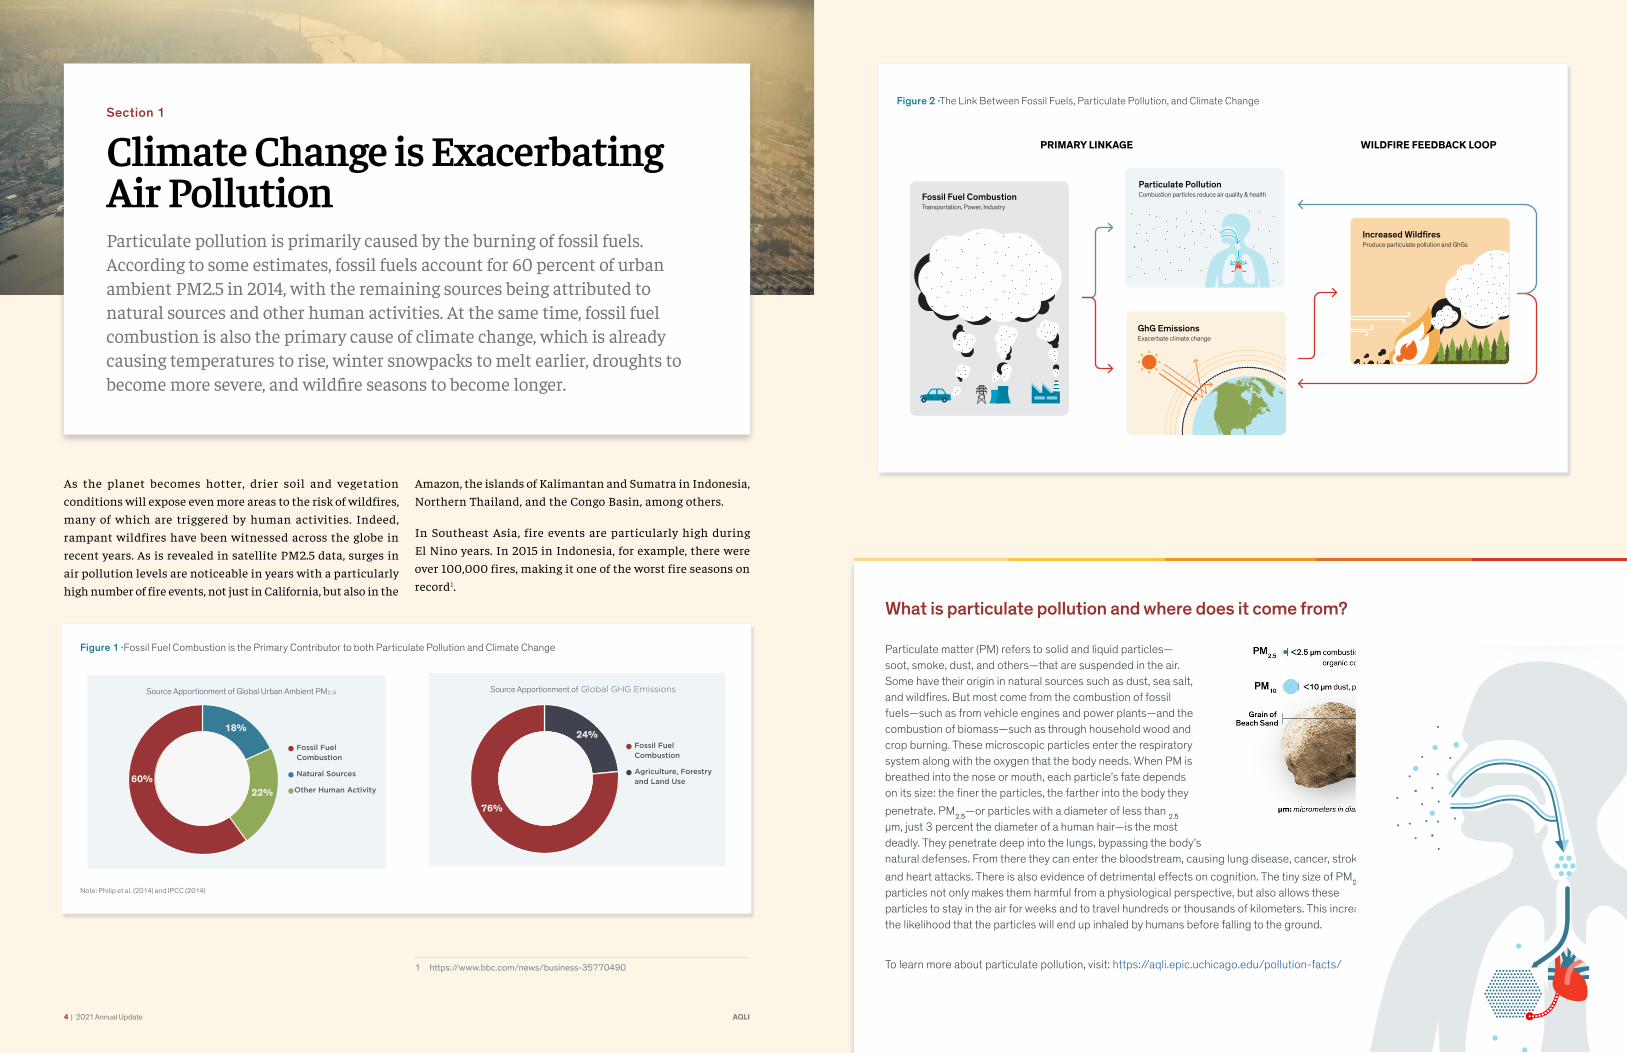
Figure 2 ·The Link Between Fossil Fuels, Particulate Pollution, and Climate ChangeSection 1
Climate Change is Exacerbating Air PollutionParticulate pollution is primarily caused by the burning of fossil fuels. According to some estimates, fossil fuels account for 60 percent of urban ambient PM2.5 in 2014, with the remaining sources being attributed to natural sources and other human activities. At the same time, fossil fuel combustion is also the primary cause of climate change, which is already causing temperatures to rise, winter snowpacks to melt earlier, droughts to become more severe, and wildfire seasons to become longer.
As the planet becomes hotter, drier soil and vegetation conditions will expose even more areas to the risk of wildfires, many of which are triggered by human activities. Indeed, rampant wildfires have been witnessed across the globe in recent years. As is revealed in satellite PM2.5 data, surges in air pollution levels are noticeable in years with a particularly high number of fire events, not just in California, but also in the
Amazon, the islands of Kalimantan and Sumatra in Indonesia, Northern Thailand, and the Congo Basin, among others.
In Southeast Asia, fire events are particularly high during El Nino years. In 2015 in Indonesia, for example, there were over 100,000 fires, making it one of the worst fire seasons on record1.
1 https://www.bbc.com/news/business-35770490
Figure 1 ·Fossil Fuel Combustion is the Primary Contributor to both Particulate Pollution and Climate Change
Note: Philip et al. (2014) and IPCC (2014)
Source Apportionment of Global Urban Ambient PM2.5
Fossil Fuel Combustion
Natural Sources
Other Human Activity
18%
60%22%
Source Apportionment of Global GHG Emissions
Fossil Fuel Combustion
Agriculture, Forestry and Land Use
24%
76%
What is particulate pollution and where does it come from?
Particulate matter (PM) refers to solid and liquid particles—soot, smoke, dust, and others—that are suspended in the air. Some have their origin in natural sources such as dust, sea salt, and wildfires. But most come from the combustion of fossil fuels—such as from vehicle engines and power plants—and the combustion of biomass—such as through household wood and crop burning. These microscopic particles enter the respiratory system along with the oxygen that the body needs. When PM is breathed into the nose or mouth, each particle’s fate depends on its size: the finer the particles, the farther into the body they
penetrate. PM2.5—or particles with a diameter of less than 2.5
μm, just 3 percent the diameter of a human hair—is the most deadly. They penetrate deep into the lungs, bypassing the body’s natural defenses. From there they can enter the bloodstream, causing lung disease, cancer, strokes,
and heart attacks. There is also evidence of detrimental effects on cognition. The tiny size of PM2.5 particles not only makes them harmful from a physiological perspective, but also allows these particles to stay in the air for weeks and to travel hundreds or thousands of kilometers. This increases the likelihood that the particles will end up inhaled by humans before falling to the ground.
To learn more about particulate pollution, visit: https://aqli.epic.uchicago.edu/pollution-facts/
Introducing the Air Quality Life IndexTwelve Facts about Particulate Air Pollution, Human Health, and Global Policy
By Michael Greenstone and Claire Qing Fan, Energy Policy Institute at the University of Chicago
NOVEMBER2018
Index®
NEWYORKCITY1973NEWYORKCITY2018
WILDFIRE FEEDBACK LOOPPRIMARY LINKAGE
Particulate PollutionCombustion particles reduce air quality & health
GhG EmissionsExacerbate climate change
Fossil Fuel CombustionTransportation, Power, Industry
Increased WildfiresProduce particulate pollution and GhGs
4 | 2021 Annual Update AQLI
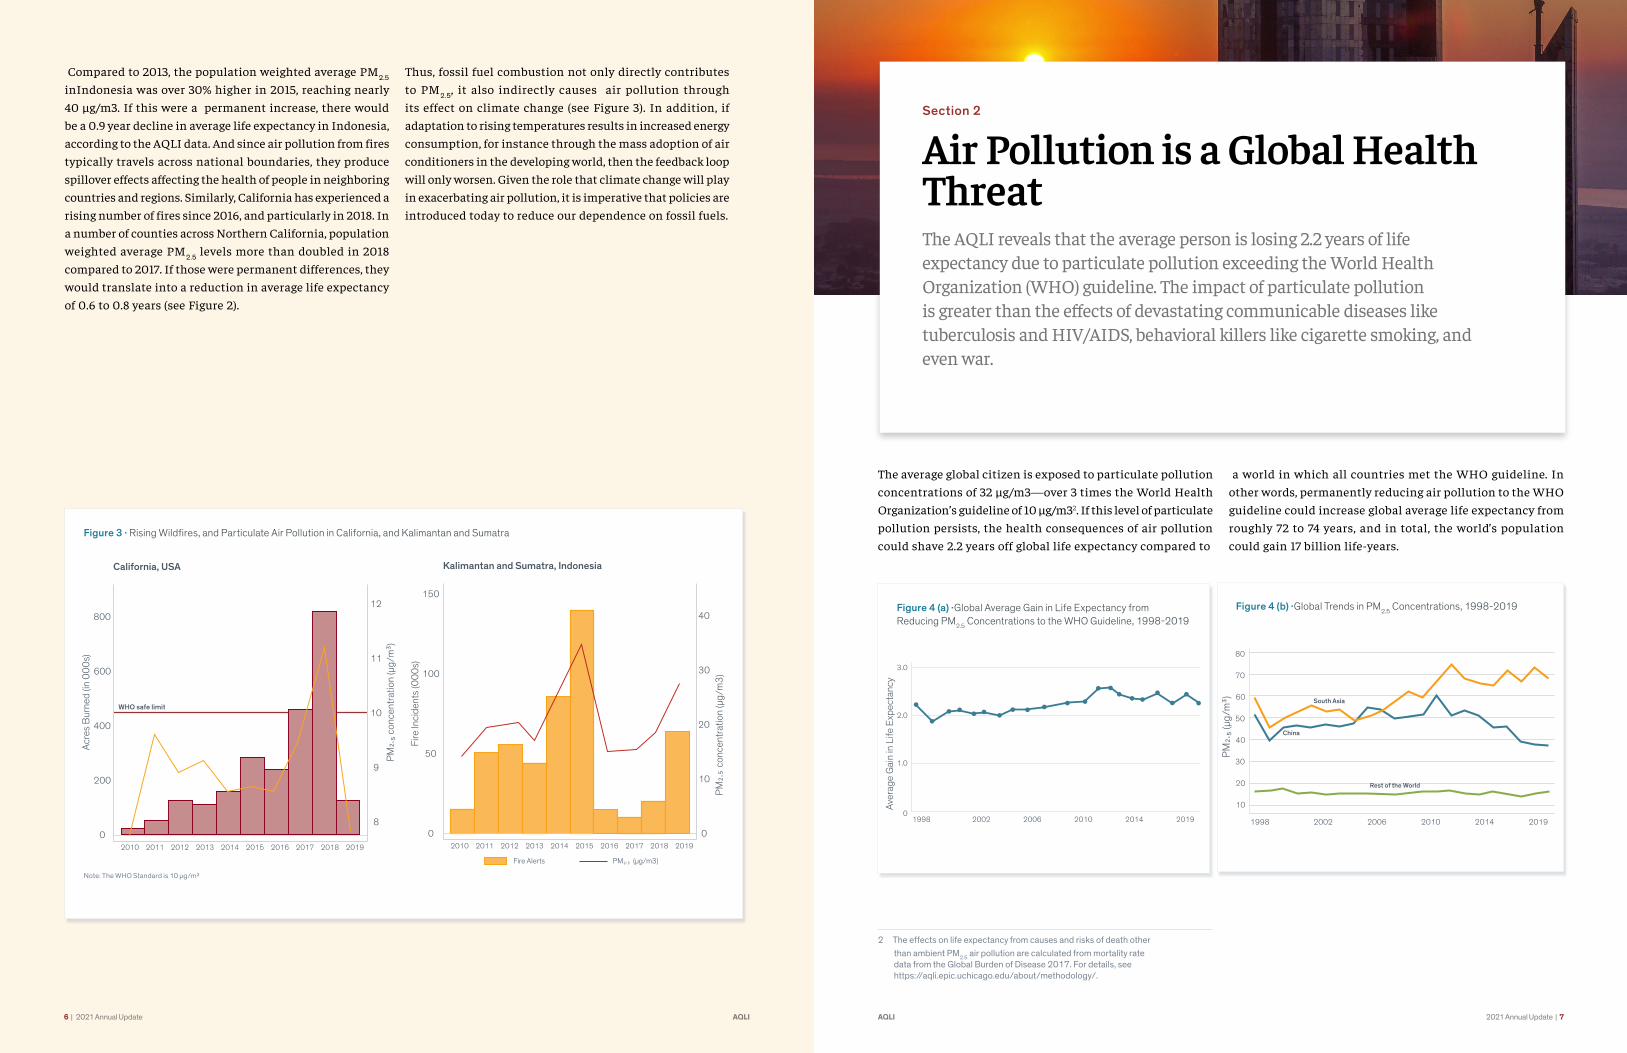
Figure 3 · Rising Wildfires, and Particulate Air Pollution in California, and Kalimantan and Sumatra
Note: The WHO Standard is 10 µg/m³
Compared to 2013, the population weighted average PM2.5 inIndonesia was over 30% higher in 2015, reaching nearly 40 μg/m3. If this were a permanent increase, there would be a 0.9 year decline in average life expectancy in Indonesia, according to the AQLI data. And since air pollution from fires typically travels across national boundaries, they produce spillover effects affecting the health of people in neighboring countries and regions. Similarly, California has experienced a rising number of fires since 2016, and particularly in 2018. In a number of counties across Northern California, population weighted average PM2.5 levels more than doubled in 2018 compared to 2017. If those were permanent differences, they would translate into a reduction in average life expectancy of 0.6 to 0.8 years (see Figure 2).
Thus, fossil fuel combustion not only directly contributes to PM2.5, it also indirectly causes air pollution through its effect on climate change (see Figure 3). In addition, if adaptation to rising temperatures results in increased energy consumption, for instance through the mass adoption of air conditioners in the developing world, then the feedback loop will only worsen. Given the role that climate change will play in exacerbating air pollution, it is imperative that policies are introduced today to reduce our dependence on fossil fuels.
800
600
400
200
0
12
11
10
9
8
2010 2011 2012 2013 2014 2015 2016 2017 2018 2019
WHO safe limit
California, USA
Acre
s B
urne
d (in
000
s)
PM
2.5 c
once
ntra
tion
(µg/
m3)
Section 2
Air Pollution is a Global Health ThreatThe AQLI reveals that the average person is losing 2.2 years of life expectancy due to particulate pollution exceeding the World Health Organization (WHO) guideline. The impact of particulate pollution is greater than the effects of devastating communicable diseases like tuberculosis and HIV/AIDS, behavioral killers like cigarette smoking, and even war.
The average global citizen is exposed to particulate pollution concentrations of 32 µg/m3—over 3 times the World Health Organization’s guideline of 10 µg/m32. If this level of particulate pollution persists, the health consequences of air pollution could shave 2.2 years off global life expectancy compared to
2 The effects on life expectancy from causes and risks of death other than ambient PM2.5 air pollution are calculated from mortality rate data from the Global Burden of Disease 2017. For details, see https://aqli.epic.uchicago.edu/about/methodology/.
a world in which all countries met the WHO guideline. In other words, permanently reducing air pollution to the WHO guideline could increase global average life expectancy from roughly 72 to 74 years, and in total, the world’s population could gain 17 billion life-years.
Figure 4 (a) ·Global Average Gain in Life Expectancy from Reducing PM2.5 Concentrations to the WHO Guideline, 1998-2019
0
1.0
2.0
3.0
1998 2002 2006 2010 2014 2019
Aver
age
Gai
n in
Life
Exp
ecta
ncy
Figure 4 (b) ·Global Trends in PM2.5 Concentrations, 1998-2019
10
20
40
60
1998 2002 2006 2010 2014 2019
PM
2.5 (
µg/m
3)
30
50
80
70
South Asia
China
Rest of the World
150
100
50
0
40
30
20
10
02010 2011
Fire Alerts PM2.5 (µg/m3)
2012 2013 2014 2015 2016 2017 2018 2019
Kalimantan and Sumatra, Indonesia
Fire
Inci
dent
s (0
00s)
PM
2.5
conc
entr
atio
n (µ
g/m
3)
6 | 2021 Annual Update AQLI AQLI 2021 Annual Update | 7

Measured in terms of life expectancy, ambient particulate pollution is consistently the world’s greatest risk to human health. First-hand cigarette smoke, for instance, reduces global average life expectancy by about 1.9 years. Alcohol use reduces life expectancy by 9 months; unsafe water and sanitation, 7 months; HIV/AIDS, 4 months; malaria, 3 months; and conflict and terrorism, just 7 days (see Figure 5). Thus, the impact of particulate pollution on life expectancy is comparable to that of smoking, almost three times that of alcohol and drug use and unsafe water, five times that of HIV/AIDS, and 114 times that of conflict and terrorism.
Air pollution is so deadly because for the majority of people living in polluted countries, it is nearly impossible to avoid. Whereas it is possible to quit smoking or take precautions against diseases, everyone must breathe air. Thus, air pollution affects many more people than any of these other conditions. Across the world, 6.2 billion people—82 percent of the global population, live in areas where PM2.5 exceeds the WHO guideline. Other risk factors such as HIV/AIDS, tuberculosis, and war have a larger impact among the affected, but they affect far fewer people. In 2017, for example, the people who died from HIV/AIDS died prematurely by roughly 53 years. And although 36 million people were afflicted with this condition, the number of people affected is just a fraction of the 6.2 billion people breathing polluted air.
Figure 6 · Potential Gain in Life Expectancy from Permanently Reducing PM2.5 from 2019 Concentrations to the WHO Guideline in the Most Populated Countries in the World
Population (Millions) Years of Life Expectancy Gained if Reduce PM2.5 to WHO Guideline Percent of Potential Person-Years Gained Globally if Reduce PM2.5 to WHO Guideline
10 20 400
Mexico
Russia
Bangladesh
Nigeria
Brazil
Pakistan
Indonesia
United States
India
China
0 500 21000 0 2 4 6
Figure 7 · Particulate Pollution Concentrations in 2019 and GDP per Capita
80
50
60
70
40
10
0
20
30
100 1,000 10,000 100,000
South AsiaEast & Southeast AsiaCentral & West AfricaLatin AmericaRest of World
Mea
n P
M2.
5 Con
cent
ratio
n (2
019)
GDP per capita (USD)
USAUK
BRA
ETH
DRC
NGA
CHNIDN
PER
IND
BGD
PAK
WHO limit
Figure 5 · Life Expectancy Impact of PM2.5 and Unassociated Causes/Risks of Death
Fortunately, strong clean air policies—particularly those targeting fossil fuel combustion—can reduce particulate pollution concentrations and increase life expectancies, along with the co-benefit of reducing the greenhouse gas emissions that cause climate change.
Since 2011, pollution concentrations have declined in China and other countries due to changes in air quality policies. Based on 2011 particulate pollution concentrations in China, average life expectancy would be 4.7 years lower relative to what it would be if air quality met WHO standards. Based on 2019 concentrations, however, the impact on life expectancy is 2.6 years. In other words, China’s clean air policies have improved average life expectancy by roughly 2.6 years.
The improvement in air quality in some locations, coupled with the spike in pollution in other areas, is evidence of the fact that air pollution is a stubborn problem. Although global pollution concentrations have declined since 2011, the decrease is almost entirely attributed to China. In fact, three-quarters of the world’s reductions in pollution have come from China since they began their “war against pollution” in 2013. South Asia, in contrast, experienced stable or rising air pollution levels over that same period (see Figures 4(a) and 4(b)).
Overall, global particulate pollution concentrations are roughly the same today, at 32 µg/m3, as they were in 1998. Though pollution has fluctuated over time and across regions, the most extreme levels of pollution today are consistently found in the industrializing countries of
the developing world. These countries are burning high amounts of fossil fuels without the policy safeguards that are in place in many developed countries (see Figure 7). The remainder of this report will further describe where pollution has increased and decreased over time, and what this means in terms of the most important measure that exists: longer lives.
0
0.5
1
1.5
2
2.5
Aver
age
Life
Exp
ecta
ncy
Los
t per
Per
son
PM.25 relative to
WHO
Smoking Alcohol and drug
use
Unsafe water,
sanitation
Road injuries
HIV/AIDS Malaria Conflict and
terrorism
AQLI 2021 Annual Update | 8 AQLI 2021 Annual Update | 9
Beijing, China

Bangladesh, India, Nepal and Pakistan account for nearly a quarter of the global population and consistently rank among the top five most polluted countries in the world. As a result, South Asia accounts for 60 percent of the person-years that are expected to be lost globally due to pollution levels exceeding the WHO guideline. Average life expectancy across these four countries would be 5.6 years higher if pollution concentrations complied with the WHO guideline.
India is the most polluted country in the world, with more than 510 million people—or about 40 percent of the country’s population—living in the Indo-Gangetic plains of Northern
India where pollution levels regularly exceed those found anywhere else in the world by an order of magnitude. The residents of this region, which includes the megacities of Delhi and Kolkata, are on track to lose more than 9 years of life expectancy if 2019 concentrations persist (See Figure 6).
Alarmingly, India’s high levels of air pollution have expanded geographically over time. Compared to a couple decades ago, particulate pollution is no longer a feature of the Indo-Gangetic plains alone. Pollution has increased so much in the states of Maharashtra and Madhya Pradesh, for example, that the average person in those states is now losing an additional 2.5 to 2.9 years of life expectancy, relative to the early 2000s.
Trailing close behind India is Bangladesh, where residents could live 5.4 years longer if pollution levels met the WHO guideline. In the most polluted part of the country, Dhaka, residents could live 7.7 years longer. In Nepal, the average resident could live 5 years longer, with those in the highly-polluted outer Terai region standing to gain 6.7 years, if the WHO guideline were met. In Pakistan, the average resident could live 4.2 years longer, with those in Lahore, the second largest city, living 5 years longer.
In each of these countries, the impact of air pollution on life expectancy is substantially higher than that of other large health threats. Smoking, for instance, reduces life expectancy in these countries by as much as 1.8 years; unsafe water and sanitation by as much as 1.2 years; and alcohol and drug use by about a year of lost life years.
Section 3
The Greatest Impacts of Air Pollution Remain Concentrated in South AsiaSouth Asia is home to the most polluted countries on Earth, with prolonged exposure to air pollution cutting life expectancy short by 5.6 years if current levels persist. The estimated impacts are even greater across Northern India, the region that experiences the most extreme levels of air pollution in the world.
The average resident of these four countries is exposed to particulate pollution levels that are 35 percent higher than at the turn of the century. Had pollution levels in 2000 remained constant over time, the residents in these countries would be on track to lose 4.8 years of life expectancy—not the near 6 years that they stand to lose today.
The increase in South Asian air pollution over time is not surprising. Over the last two decades, industrialization, economic development, and population growth have led to skyrocketing energy demand and fossil fuel use across the region. In India and Pakistan, the number of vehicles on the road has increased about four-fold since the early 2000s. In Bangladesh, the number of motor vehicles roughly tripled from 20103 to 2020. In Bangladesh, India, Nepal, and Pakistan combined, electricity generation from fossil fuels tripled from 1998 to 20174. Crop burning, brick kilns, and other industrial activities have also contributed to rising particulates in the region.
The increase in energy use has led to higher living standards and economic output, which have undoubtedly enhanced well-being. Yet the concomitant rise in particulate pollution has had serious consequences, and energy demand in non-OECD regions is only projected to continue growing. Without concerted policy action, the threat of air pollution will also grow.
Fortunately, more and more people in these countries are recognizing the severity of the problem, and governments are
3 Statistical Year Book of India, 2017, Table 20.4; Pakistan Statistical Pocket Book, 2006, Table 17.5 and Pakistan Today, 2019; Bangladesh Road Transport Authority, 2020.
4 US Energy Information Administration.
beginning to respond. In 2019, for example, the Government of India declared a “war on pollution” and launched its National Clean Air Programme (NCAP) with the stated goal of reducing 2017 particulate pollution levels by 20 to 30 percent by the year 2024. Since then, India has adopted fuel emissions standards that are on par with European Union standards. Although the NCAP targets are non-binding, achieving and sustaining such a reduction would increase India’s national life expectancy by as much as 1.7 years, and by as much as 3.1 years for residents of Delhi.
Other countries across South Asia are beginning to take policy actions as well. In Pakistan, the government began installing more pollution monitors and shutting down factories in highly polluted districts during the winter months, when energy demand for heating is high. Similarly, Bangladesh is expanding its monitoring capacity and real-time air pollution measurements are expected to soon cover eight cities, up from the four that are covered today5.
Pakistan and Bangladesh have both encouraged brick kiln owners to shift to cleaner technologies. In Bangladesh, where brick kilns are responsible for about 60 percent of the particulate pollution in Dhaka, the law governing brick kiln production was amended in 2019 to prohibit the establishment of brick kilns near residential, commercial, agricultural, and environmentally sensitive areas. In addition, the government is planning to phase out the use of bricks in favor of concrete blocks by 2025 in order to lessen the damage to both the quality of the air and topsoil.
5 Ministry of Environment and Forests, Government of People’s republic of Bangladesh
Figure 8 · Change in Potential Gain in Life Expectancy from Reducing PM2.5 to the WHO Guideline in South Asia, 2000-2019
Figure 9 · Distribution of Person-Years Gained if PM2.5 is Reduced to WHO Guideline Around the World
Note: India, China, Bangladesh, Indonesia, and Pakistan rank as the top five countries globally in terms of the gain in person-years from reducing PM2.5 concentrations to the WHO guideline.
2000 Million
1500
1000
500
0
0 0-1 6-7 8-9 >91-2 2-3 3-4 4-5 5-6 7-8
China
India
Bangladesh
Pakistan
Indonesia
OECD
Rest of the World
People
Years of Life Lost Relative to WHO Guideline
-2.0 to -0.5
-0.5 to -0.1
-0.1 - 0
0 - 0.1
0.1 - 0.5
0.5 - 2.0
>2.0
Years of Change in Life
Expectancy
10 | 2021 Annual Update AQLI AQLI 2021 Annual Update | 11
Section 4
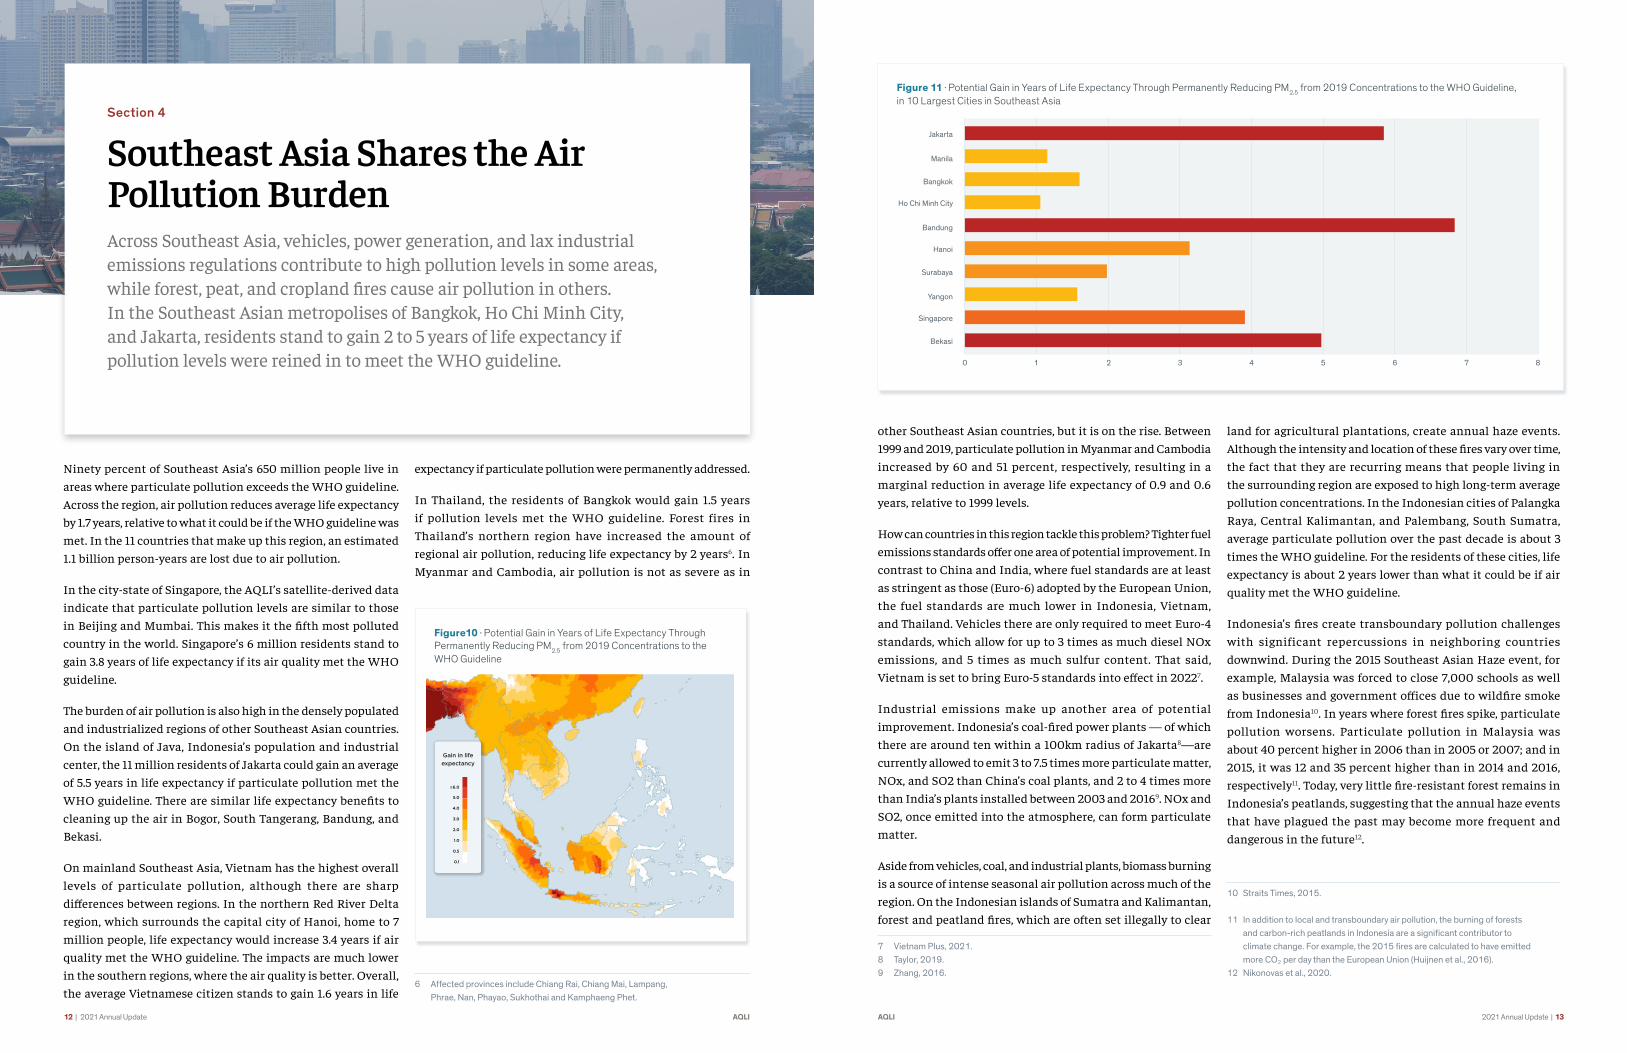
Southeast Asia Shares the Air Pollution BurdenAcross Southeast Asia, vehicles, power generation, and lax industrial emissions regulations contribute to high pollution levels in some areas, while forest, peat, and cropland fires cause air pollution in others. In the Southeast Asian metropolises of Bangkok, Ho Chi Minh City, and Jakarta, residents stand to gain 2 to 5 years of life expectancy if pollution levels were reined in to meet the WHO guideline.
Ninety percent of Southeast Asia’s 650 million people live in areas where particulate pollution exceeds the WHO guideline. Across the region, air pollution reduces average life expectancy by 1.7 years, relative to what it could be if the WHO guideline was met. In the 11 countries that make up this region, an estimated 1.1 billion person-years are lost due to air pollution.
In the city-state of Singapore, the AQLI’s satellite-derived data indicate that particulate pollution levels are similar to those in Beijing and Mumbai. This makes it the fifth most polluted country in the world. Singapore’s 6 million residents stand to gain 3.8 years of life expectancy if its air quality met the WHO
guideline.
The burden of air pollution is also high in the densely populated and industrialized regions of other Southeast Asian countries. On the island of Java, Indonesia’s population and industrial center, the 11 million residents of Jakarta could gain an average of 5.5 years in life expectancy if particulate pollution met the WHO guideline. There are similar life expectancy benefits to cleaning up the air in Bogor, South Tangerang, Bandung, and Bekasi.
On mainland Southeast Asia, Vietnam has the highest overall levels of particulate pollution, although there are sharp differences between regions. In the northern Red River Delta region, which surrounds the capital city of Hanoi, home to 7 million people, life expectancy would increase 3.4 years if air quality met the WHO guideline. The impacts are much lower in the southern regions, where the air quality is better. Overall, the average Vietnamese citizen stands to gain 1.6 years in life
expectancy if particulate pollution were permanently addressed.
In Thailand, the residents of Bangkok would gain 1.5 years if pollution levels met the WHO guideline. Forest fires in Thailand’s northern region have increased the amount of regional air pollution, reducing life expectancy by 2 years6. In Myanmar and Cambodia, air pollution is not as severe as in
6 Affected provinces include Chiang Rai, Chiang Mai, Lampang, Phrae, Nan, Phayao, Sukhothai and Kamphaeng Phet.
other Southeast Asian countries, but it is on the rise. Between 1999 and 2019, particulate pollution in Myanmar and Cambodia increased by 60 and 51 percent, respectively, resulting in a marginal reduction in average life expectancy of 0.9 and 0.6 years, relative to 1999 levels.
How can countries in this region tackle this problem? Tighter fuel emissions standards offer one area of potential improvement. In contrast to China and India, where fuel standards are at least as stringent as those (Euro-6) adopted by the European Union, the fuel standards are much lower in Indonesia, Vietnam, and Thailand. Vehicles there are only required to meet Euro-4 standards, which allow for up to 3 times as much diesel NOx emissions, and 5 times as much sulfur content. That said, Vietnam is set to bring Euro-5 standards into effect in 20227.
Industrial emissions make up another area of potential improvement. Indonesia’s coal-fired power plants — of which there are around ten within a 100km radius of Jakarta8—are currently allowed to emit 3 to 7.5 times more particulate matter, NOx, and SO2 than China’s coal plants, and 2 to 4 times more than India’s plants installed between 2003 and 20169. NOx and SO2, once emitted into the atmosphere, can form particulate matter.
Aside from vehicles, coal, and industrial plants, biomass burning is a source of intense seasonal air pollution across much of the region. On the Indonesian islands of Sumatra and Kalimantan, forest and peatland fires, which are often set illegally to clear
7 Vietnam Plus, 2021.8 Taylor, 2019.9 Zhang, 2016.
land for agricultural plantations, create annual haze events. Although the intensity and location of these fires vary over time, the fact that they are recurring means that people living in the surrounding region are exposed to high long-term average pollution concentrations. In the Indonesian cities of Palangka Raya, Central Kalimantan, and Palembang, South Sumatra, average particulate pollution over the past decade is about 3 times the WHO guideline. For the residents of these cities, life expectancy is about 2 years lower than what it could be if air quality met the WHO guideline.
Indonesia’s fires create transboundary pollution challenges with significant repercussions in neighboring countries downwind. During the 2015 Southeast Asian Haze event, for example, Malaysia was forced to close 7,000 schools as well as businesses and government offices due to wildfire smoke from Indonesia10. In years where forest fires spike, particulate pollution worsens. Particulate pollution in Malaysia was about 40 percent higher in 2006 than in 2005 or 2007; and in 2015, it was 12 and 35 percent higher than in 2014 and 2016, respectively11. Today, very little fire-resistant forest remains in Indonesia’s peatlands, suggesting that the annual haze events that have plagued the past may become more frequent and dangerous in the future12.
10 Straits Times, 2015.
11 In addition to local and transboundary air pollution, the burning of forests and carbon-rich peatlands in Indonesia are a significant contributor to climate change. For example, the 2015 fires are calculated to have emitted more CO₂ per day than the European Union (Huijnen et al., 2016).
12 Nikonovas et al., 2020.
Figure10 · Potential Gain in Years of Life Expectancy Through Permanently Reducing PM2.5 from 2019 Concentrations to the WHO Guideline
2.0
1.0
0.5
5.0
≥6.0
4.0
3.0
0.1
Gain in life expectancy
Figure 11 · Potential Gain in Years of Life Expectancy Through Permanently Reducing PM2.5 from 2019 Concentrations to the WHO Guideline, in 10 Largest Cities in Southeast Asia
0 1 2 3 4 5 6 7 8
Bekasi
Singapore
Yangon
Surabaya
Hanoi
Bandung
Ho Chi Minh City
Bangkok
Manila
Jakarta
12 | 2021 Annual Update AQLI AQLI 2021 Annual Update | 13
Section 5
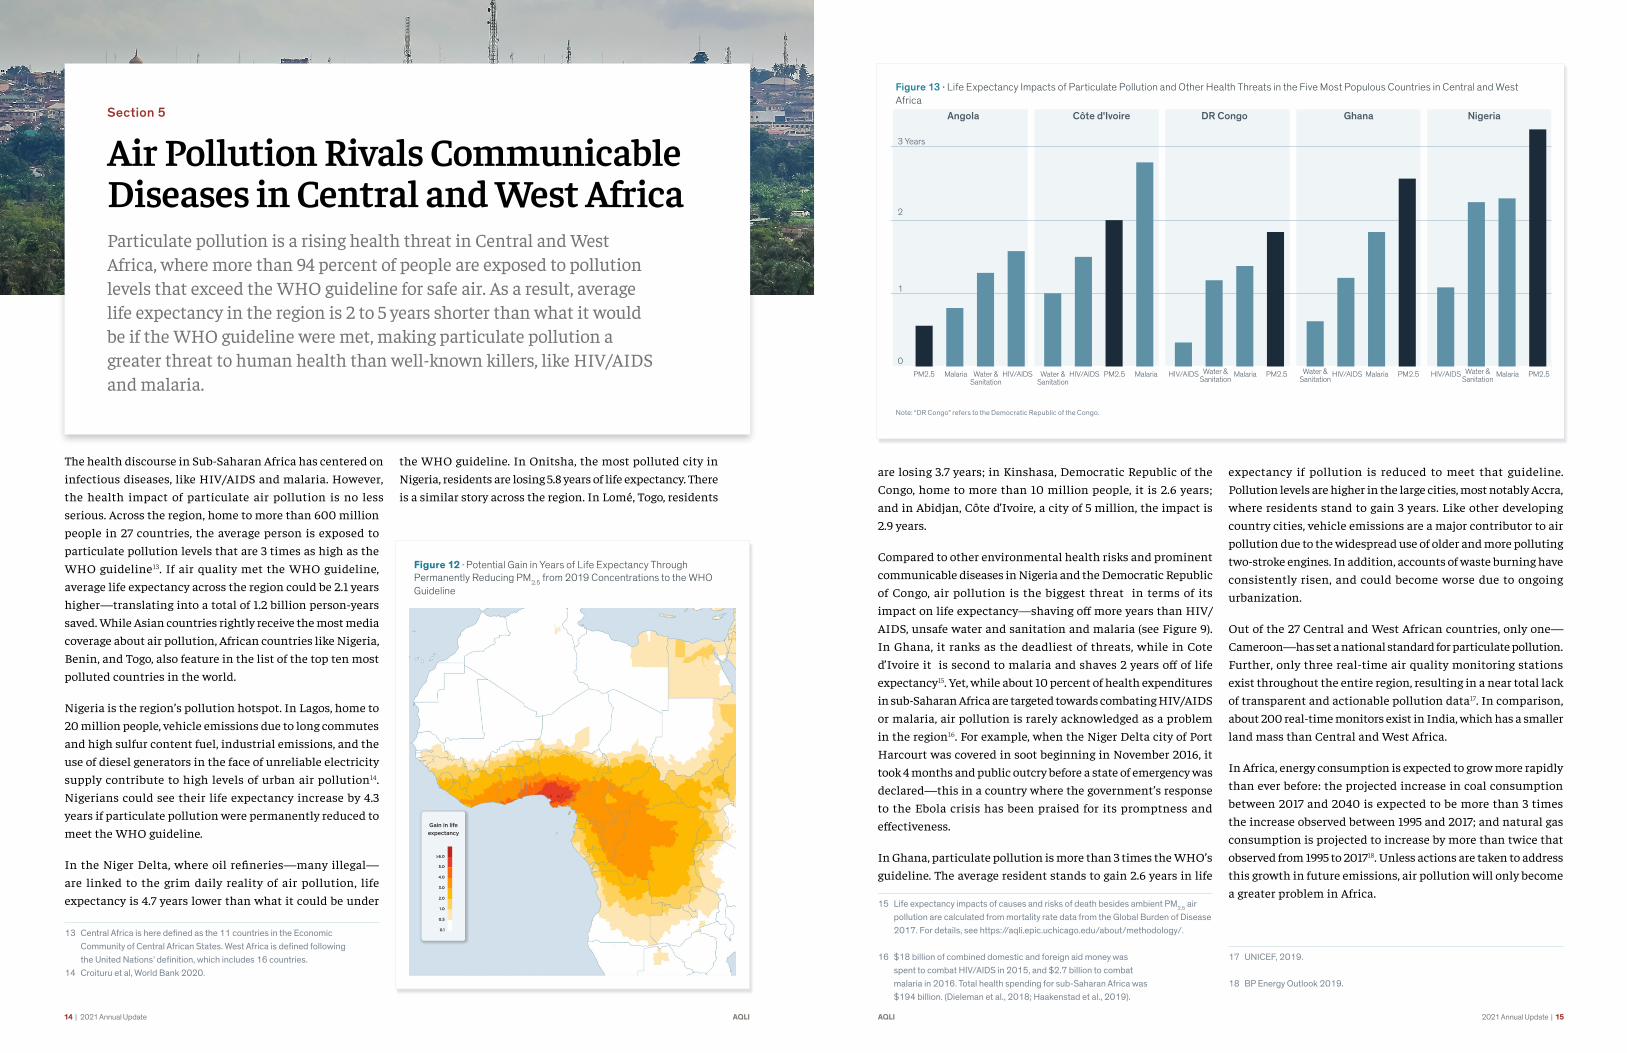
Air Pollution Rivals Communicable Diseases in Central and West AfricaParticulate pollution is a rising health threat in Central and West Africa, where more than 94 percent of people are exposed to pollution levels that exceed the WHO guideline for safe air. As a result, average life expectancy in the region is 2 to 5 years shorter than what it would be if the WHO guideline were met, making particulate pollution a greater threat to human health than well-known killers, like HIV/AIDS and malaria.
2.0
1.0
0.5
5.0
≥6.0
4.0
3.0
0.1
Gain in life expectancy
The health discourse in Sub-Saharan Africa has centered on infectious diseases, like HIV/AIDS and malaria. However, the health impact of particulate air pollution is no less serious. Across the region, home to more than 600 million people in 27 countries, the average person is exposed to particulate pollution levels that are 3 times as high as the WHO guideline13. If air quality met the WHO guideline, average life expectancy across the region could be 2.1 years higher—translating into a total of 1.2 billion person-years saved. While Asian countries rightly receive the most media coverage about air pollution, African countries like Nigeria, Benin, and Togo, also feature in the list of the top ten most polluted countries in the world.
Nigeria is the region’s pollution hotspot. In Lagos, home to 20 million people, vehicle emissions due to long commutes and high sulfur content fuel, industrial emissions, and the use of diesel generators in the face of unreliable electricity supply contribute to high levels of urban air pollution14. Nigerians could see their life expectancy increase by 4.3 years if particulate pollution were permanently reduced to meet the WHO guideline.
In the Niger Delta, where oil refineries—many illegal—are linked to the grim daily reality of air pollution, life expectancy is 4.7 years lower than what it could be under
13 Central Africa is here defined as the 11 countries in the Economic Community of Central African States. West Africa is defined following the United Nations’ definition, which includes 16 countries.
14 Croituru et al, World Bank 2020.
the WHO guideline. In Onitsha, the most polluted city in Nigeria, residents are losing 5.8 years of life expectancy. There is a similar story across the region. In Lomé, Togo, residents
Figure 12 · Potential Gain in Years of Life Expectancy Through Permanently Reducing PM2.5 from 2019 Concentrations to the WHO Guideline
Figure 13 · Life Expectancy Impacts of Particulate Pollution and Other Health Threats in the Five Most Populous Countries in Central and West Africa
Note: “DR Congo” refers to the Democratic Republic of the Congo.
PM2.5 Malaria Water & Sanitation
PM2.5HIV/AIDS Water & Sanitation
HIV/AIDS Malaria MalariaHIV/AIDS PM2.5
Angola Côte d'Ivoire DR Congo NigeriaGhana
3 Years
2
1
0Water &
SanitationMalariaHIV/AIDS PM2.5Water &
SanitationMalariaHIV/AIDS PM2.5Water &
Sanitation
are losing 3.7 years; in Kinshasa, Democratic Republic of the Congo, home to more than 10 million people, it is 2.6 years; and in Abidjan, Côte d’Ivoire, a city of 5 million, the impact is 2.9 years.
Compared to other environmental health risks and prominent communicable diseases in Nigeria and the Democratic Republic of Congo, air pollution is the biggest threat in terms of its impact on life expectancy—shaving off more years than HIV/AIDS, unsafe water and sanitation and malaria (see Figure 9). In Ghana, it ranks as the deadliest of threats, while in Cote d’Ivoire it is second to malaria and shaves 2 years off of life
expectancy15. Yet, while about 10 percent of health expenditures in sub-Saharan Africa are targeted towards combating HIV/AIDS or malaria, air pollution is rarely acknowledged as a problem in the region16. For example, when the Niger Delta city of Port Harcourt was covered in soot beginning in November 2016, it took 4 months and public outcry before a state of emergency was declared—this in a country where the government’s response to the Ebola crisis has been praised for its promptness and effectiveness.
In Ghana, particulate pollution is more than 3 times the WHO’s guideline. The average resident stands to gain 2.6 years in life
15 Life expectancy impacts of causes and risks of death besides ambient PM2.5 air pollution are calculated from mortality rate data from the Global Burden of Disease 2017. For details, see https://aqli.epic.uchicago.edu/about/methodology/.
16 $18 billion of combined domestic and foreign aid money was spent to combat HIV/AIDS in 2015, and $2.7 billion to combat malaria in 2016. Total health spending for sub-Saharan Africa was $194 billion. (Dieleman et al., 2018; Haakenstad et al., 2019).
expectancy if pollution is reduced to meet that guideline. Pollution levels are higher in the large cities, most notably Accra, where residents stand to gain 3 years. Like other developing country cities, vehicle emissions are a major contributor to air pollution due to the widespread use of older and more polluting two-stroke engines. In addition, accounts of waste burning have consistently risen, and could become worse due to ongoing urbanization.
Out of the 27 Central and West African countries, only one—Cameroon—has set a national standard for particulate pollution. Further, only three real-time air quality monitoring stations
exist throughout the entire region, resulting in a near total lack of transparent and actionable pollution data17. In comparison, about 200 real-time monitors exist in India, which has a smaller land mass than Central and West Africa.
In Africa, energy consumption is expected to grow more rapidly than ever before: the projected increase in coal consumption between 2017 and 2040 is expected to be more than 3 times the increase observed between 1995 and 2017; and natural gas consumption is projected to increase by more than twice that observed from 1995 to 201718. Unless actions are taken to address this growth in future emissions, air pollution will only become a greater problem in Africa.
17 UNICEF, 2019.
18 BP Energy Outlook 2019.
2.0
1.0
0.5
5.0
≥6.0
4.0
3.0
0.1
Gain in life expectancy
14 | 2021 Annual Update AQLI AQLI 2021 Annual Update | 15

Section 6
More than Half of Latin Americans are Breathing Polluted AirParticulate pollution levels vary greatly across Latin America. In countries like Argentina, Paraguay, and Costa Rica, air quality generally meets the WHO guideline. However, other countries like Peru, Colombia, Bolivia, and Brazil feature pollution hotspots, where particulate pollution concentrations are 2 to 3 times greater than the WHO guideline. In these hotspots, the average resident stands to gain 1 to 2 years of life expectancy from cleaner air.
Figure 15 · Potential Gain in Life Expectancy from Permanently Reducing PM2.5 from 2019 Concentrations to the WHO GuidelineMore than half of the 611 million people in Latin America are exposed to PM2.5 levels that exceed the WHO guideline. Although the average gain in life expectancy from cleaning the air is relatively low across the continent (roughly 5 months), the number is substantially higher in Latin America’s hotspots. For instance, it is 4.7 years in Lima, the capital of Peru; and 1.8 and 2.2 years in the Colombian cities of Bogota and Medellin, respectively.
Vehicle emissions are primarily responsible for poor air quality in Latin America’s major hotspot cities. For example, in 2019, Bogota and Cali ranked first and tenth in the world in average commute duration19. Long commutes are indicative of high levels of traffic congestion and higher levels of individual pollution exposure since commuters end up spending more time outside and on the roads. Across the region, driving restrictions have been a popular policy prescription. For example, license plate-based restrictions were introduced in Santiago, Chile in 1986, and in Mexico City in 1989. Following these two programs, several more Latin American cities introduced similar restrictions.
Latin America’s air pollution is not only limited to its cities. Rural residents in Colombia also face high levels of PM2.5. For example, in Tolima, a rural region that is also the most polluted department in Colombia, the average level of particulate pollution in 2019 was 33 μg/m3. The use of household solid fuels is a major contributor to air pollution in these areas.
19 INRIX, 2020
In Brazil, particulate pollution levels are twice the WHO recommended threshold across the Amazonas, primarily due to the burning of the rainforests. The fires are a result of deforestation and illegal fires set to clear land for farming and cattle grazing. The 4.2 million residents of the area can gain up to a year of life expectancy if the WHO guideline was permanently met.
Figure 14 · Potential Gain in Years of Life Expectancy Through Permanently Reducing PM2.5 from 2019 Concentrations to the WHO Guideline, in 10 Largest Cities in Latin America
0 0.5 1 21.5 2.5 3 3.5 4 4.5 5
Cali
Medellín
Quito
Buenos Aires
Santiago
Rio de Janeiro
Bogotá
Lima
Mexico City
São Paulo
2.0
1.0
0.5
5.0
≥6.0
4.0
3.0
0.1
Gain in life expectancy
16 | 2021 Annual Update AQLI AQLI 2021 Annual Update | 17
Mexico City, Mexico

Section 7
China is Winning its “War Against Pollution”China was able to reduce its particulate pollution by 29 percent between 2013 and 2019—dropping the country from its top five ranking in recent years and making up three-quarters of the reductions in air pollution across the world. If these reductions are sustained, China’s people can expect to live 1.5 years longer. To put China’s success into context, it took several decades and recessions for the United States and Europe to achieve the same pollution reductions.
Figure 16 · Change in Potential Gain in Life Expectancy from Reducing PM2.5 to the WHO Guideline in China, 2013-2019
-2.0 to -0.5
-0.5 to -0.1
-0.1 - 0
0 - 0.1
0.1 - 0.5
0.5 - 2.0
>2.0
Years of Change in Life
Expectancy
Figure 17 · Potential Gain in Years of Life Expectancy Through Permanently Reducing PM2.5 from 2019 Concentrations to the WHO Guideline.
2.0
1.0
0.5
5.0
≥6.0
4.0
3.0
0.1
Gain in life expectancy
In China, public concern about worsening air pollution began rising in the late 1990s. Beginning in 2008, the U.S. embassy in Beijing began publicly posting readings from its own air quality monitor on Twitter and the State Department website, and residents quickly pointed out discrepancies between the embassy data and the local government’s air quality reports. In 2013, China experienced some of its highest pollution levels to that point, and public criticism reached new heights. At the same time, Chen et al. (2013) published their Huai River study, which found that high air pollution had cut the lifespans of people in
northern China by about 5 years compared to those living in the south. The severity of the problem was clear.
The very next year, Premier Li Keqiang declared a “war against pollution.” The National Air Quality Action Plan set aside $270 billion and the Beijing city government set aside an additional $120 billion to reduce ambient air pollution. Across all urban areas, the Plan aimed to reduce particulate matter (PM10) by 10 percent in 2017, relative to 2012 levels. The most heavily polluted areas in the country, including Beijing-Tianjin-Hebei, the Pearl River Delta, and the Yangtze River Delta, were given specific targets.
The government’s strategies for achieving these goals included building pollution reduction into local officials’ incentives, so promotions depended on both environmental audits and economic performance; prohibiting new coal-fired plants in some regions and requiring existing coal
plants to reduce emissions or be replaced with natural gas; increasing renewable energy generation; reducing iron and steel making capacity in industry; restricting the number of cars on the road in large cities; and increasing transparency and better enforcing emissions standards. In 2013-2014, the government rolled out a nationwide network of air quality monitors that report pollution readings automatically. Statistical analysis shows that this network has alleviated the problem of underreporting of pollution concentrations by government officials, hence making accurate real-time air pollution information available to the public so they
can take appropriate defensive measures20.
Due to these actions, all of the targets set by the National Air Quality Action Plan, which expired in 2017, were met. As a result, between 2013 and 2019, particulate pollution exposure declined by an average of 29 percent across the Chinese population. China was among the five most polluted countries in the world each year from 1998 to 2016, but fell out of the top five after 2017 thanks to this reduction. If the reduction is sustained, it would equate to a gain in life expectancy of 1.5 years (Figure 12, Table 1). The Beijing-Tianjin-Hebei area, one of China’s most polluted areas in 2013, saw a 33 percent reduction in particulate pollution, translating into a gain of 2.6 years of life expectancy for its 109 million residents, if sustained.
20 Greenstone et al., 2020
To put the scale and speed of China’s progress into context, it’s useful to compare it to the United States and Europe after their periods of industrialization. In the United States, following the passage of the Clean Air Act, it took almost three decades and five recessions to achieve about the same percent decline. In Europe, after their environment agency was created, it took about two decades and two recessions to achieve approximately China’s percent reduction. While China reduced its pollution by 29 percent, real per capita gross domestic product grew by 45.5 percent.
China’s government, however, remained acutely aware that the country’s air pollution was still a serious problem—the average particulate pollution concentration in 2019 was still more than 3 times the WHO guideline. Reducing pollution to meet that guideline would mean an additional increase in life expectancy for the Chinese people of 2.6 years (see Figure 17). In Hebei and Henan provinces, home to much of the country’s coal and steel industries, residents could see their life expectancies rise by up to an additional
4 years if pollution declined to meet the WHO guideline.To achieve further improvements, the Chinese government announced in July 2018 a new plan for 2018-2020. Regions that did not meet the national air quality standard of 35 µg/m3 would need to reduce their particulate pollution levels by 18 percent relative to 2015 concentrations21. In the provinces of Tianjin, Hebei, Henan, and Beijing, a decrease of such a scale would allow residents to gain a year of life expectancy. Although the national targets are less ambitious than those set for 2013-2017, some prefectures set more stringent targets for themselves in their local five-year plans. Beijing, for example, committed itself to a 30 percent reduction from 2015 levels by 2020, which if sustained would translate into a life expectancy benefit of 1.7 years. Tianjin, Hebei, Beijing, Shanghai, and other provinces have already reduced their particulate pollution levels by more than 18 percent, relative to 2015 levels.
21 China Ministry of Ecology and Environment, 2018.
Table 1 · 10 Most Populous Prefectures
PrefecturePopulation
(Millions)
2015 PM2.5
Concentration (µg/m3)
Potential Life Expectancy Gains
from an 18% Reduction, relative to
2015 Levels2019 PM2.5
Concentration (µg/m3)Percent Decrease in PM2.5
since 2013
Years of Life Expectancy
Gained between 2013 and 2019
Chongqing 30.0 42 0.7 34 41 2.3
Shanghai 24.1 48 0.8 33 26 1.1
Beijing 20.5 58 1.0 44 36 2.4
Chengdu, Sichuan 13.9 54 1.0 45 45 3.6
Tianjin 13.6 66 1.2 49 41 3.3
Guangzhou, Guangdong 13.2 34 0.6 33 16 0.6
Baoding, Hebei 11.6 70 1.2 57 32 2.7
Harbin, Heilongjiang 11.1 55 1.0 42 9 0.4
Suzhou, Jiangsu 10.8 53 0.9 39 29 1.6
Shenzhen, Guangdong 10.8 29 0.5 26 22 0.7
18 | 2021 Annual Update AQLI AQLI 2021 Annual Update | 19

Section 8
Decades of Reducing Pollution in the United States, Europe and Japan Deliver BenefitsAfter sustained enforcement of strong air pollution policies, the United States, Europe, and Japan have seen significant reductions in particulate pollution, and their citizens are living longer because of it. Their experience provides case studies of success.
Figure 20 · Gain in Life Expectancy Due to Change in PM2.5 in Japan, 1998-2019
-2.0 to -0.5
-0.5 to -0.1
-0.1 - 0
0 - 0.1
0.1 - 0.5
0.5 - 2.0
>2.0
Years of Change in Life
Expectancy
Europe, Japan, and the United States, which make up 16 percent of the world’s population, account for about 2 percent of the health burden from particulate pollution. However, it was not always this way. Places like London—once known as “the big smoke”—Los Angeles—dubbed the “smog capital of the world”—and Osaka—once the “big smoke”—used to be as polluted as the most polluted countries today.
Since that time, the offshoring of polluting industries and, crucially, well-implemented air pollution policies have played large roles in attaining cleaner air. For example, in
the United States, the Clean Air Act was enacted in 1970. The Act established the National Ambient Air Quality Standards (NAAQS), setting maximum allowable concentrations of particulate matter, among other pollutants. It also created emissions standards for pollution sources, leading industrial facilities to install pollution control technologies and automakers to produce cleaner, more fuel-efficient vehicles. Further, it required each state government to devise its own plan for achieving and sustaining compliance with the standards.
The Act rapidly improved the air Americans breathed22.
22 Several factors that could have affected air pollution have been at play simultaneously since 1970, but research supports an outsize role of the Clean Air Act. For example, Shapiro and Walker (2018) decompose the decline in emissions from manufacturing plants from 1990-2008 into the portions caused by (1) the use of pollution
By 1980, albeit aided by the economic slowdown of the 1970s, the United States recorded a 50 percent decrease in particulate pollution compared to 1970 and a 44 percent decrease in ambient concentrations of SO2, a precursor to particulate matter23. Today, on average, Americans are exposed to 62 percent less particulate pollution than they would have been in 1970. And, they’re living longer lives because of it, with life expectancy increasing by 1.4 years for the average American from 1970 to today24. For those living in the former smog capital of Los Angeles, particulate pollution has declined by almost 57 percent since 1970, extending life expectancy for the average Angeleno by 1.4 years. In Philadelphia and Washington, DC, the gain is 2.6 and 3.3 years.
The history of Europe tells a similar story. Among the policy improvements, the European Environment Agency was created in the mid-1990s to provide independent information to policymakers and the public. In subsequent years, the European Union set emissions targets, created a
abatement technologies as required by CAA environmental regulations, (2) changes in what Americans produce (i.e. offshoring of pollution-intensive industries), and (3) increases in production efficiency. They find that the total pollution emissions decline is primarily driven by (1).
23 Hunt and Lillis, 1981.
24 These estimates are based on the 236 US counties for which 1970 PM2.5 concentrations could be estimated. Details on how 1970 particulate pollution concentrations and life expectancy changes since 1970 were estimated are available at aqli.epic.uchicago.edu/policy-impacts.
pollution standard, and introduced a comprehensive clean air program with support measures to ensure that targets are met. The European Union’s air pollution regulations, such as fuel emissions standards, have formed the basis of standards in many other countries from Argentina to India to Turkey.
Today, on average, Europeans are exposed to 27 percent less particulate pollution than they were two decades ago, gaining 4 months of life expectancy because of it. Areas that were historically more polluted have seen even greater gains.
In the 1990s, Japan tightened its environmental policies, including through the enactment of the Basic Environment Law. An improvement on two earlier rules, the new law included restrictions on industrial emissions and the establishment of environmental pollution control programs, among other changes. Later, in 2001, the country’s
Environment Agency was promoted to full-fledged Ministry of the Environment. The people of Japan are now living healthier and longer lives thanks to a 34 percent decline in particulate pollution over the last two decades.
Due to the vast improvements in the quality of the air in the United States and Europe, the potential for further progress remains but the potential health benefits are concentrated in specific areas and are limited on average. In the United States, 10 percent of the population lives in areas where particulate pollution exceeds the WHO guideline. Residents of California’s Central Valley have consistently been exposed to particulate pollution above both the WHO guideline and the nation’s own air quality standard. Those living in this region stand to gain up to 5 months of life expectancy if air quality were kept below the WHO guideline rather than at the 2018 level—a year
when California saw intense wildfires that contributed to the pollution.
Figure 18 · Potential Gain in Years of Life Expectancy Through Permanently Reducing PM2.5 from 2019 Concentrations to the WHO Guideline.
-2.0 to -0.5
-0.5 to -0.1
-0.1 - 0
0 - 0.1
0.1 - 0.5
0.5 - 2.0
>2.0
Years of Change in Life
Expectancy
Figure 19 · Gain in Life Expectancy Due to Change in PM2.5 in Europe, 1998-2019
-2.0 to -0.5
-0.5 to -0.1
-0.1 - 0
0 - 0.1
0.1 - 0.5
0.5 - 2.0
>2.0
Years of Change in Life
Expectancy
20 | 2021 Annual Update AQLI AQLI 2021 Annual Update | 21
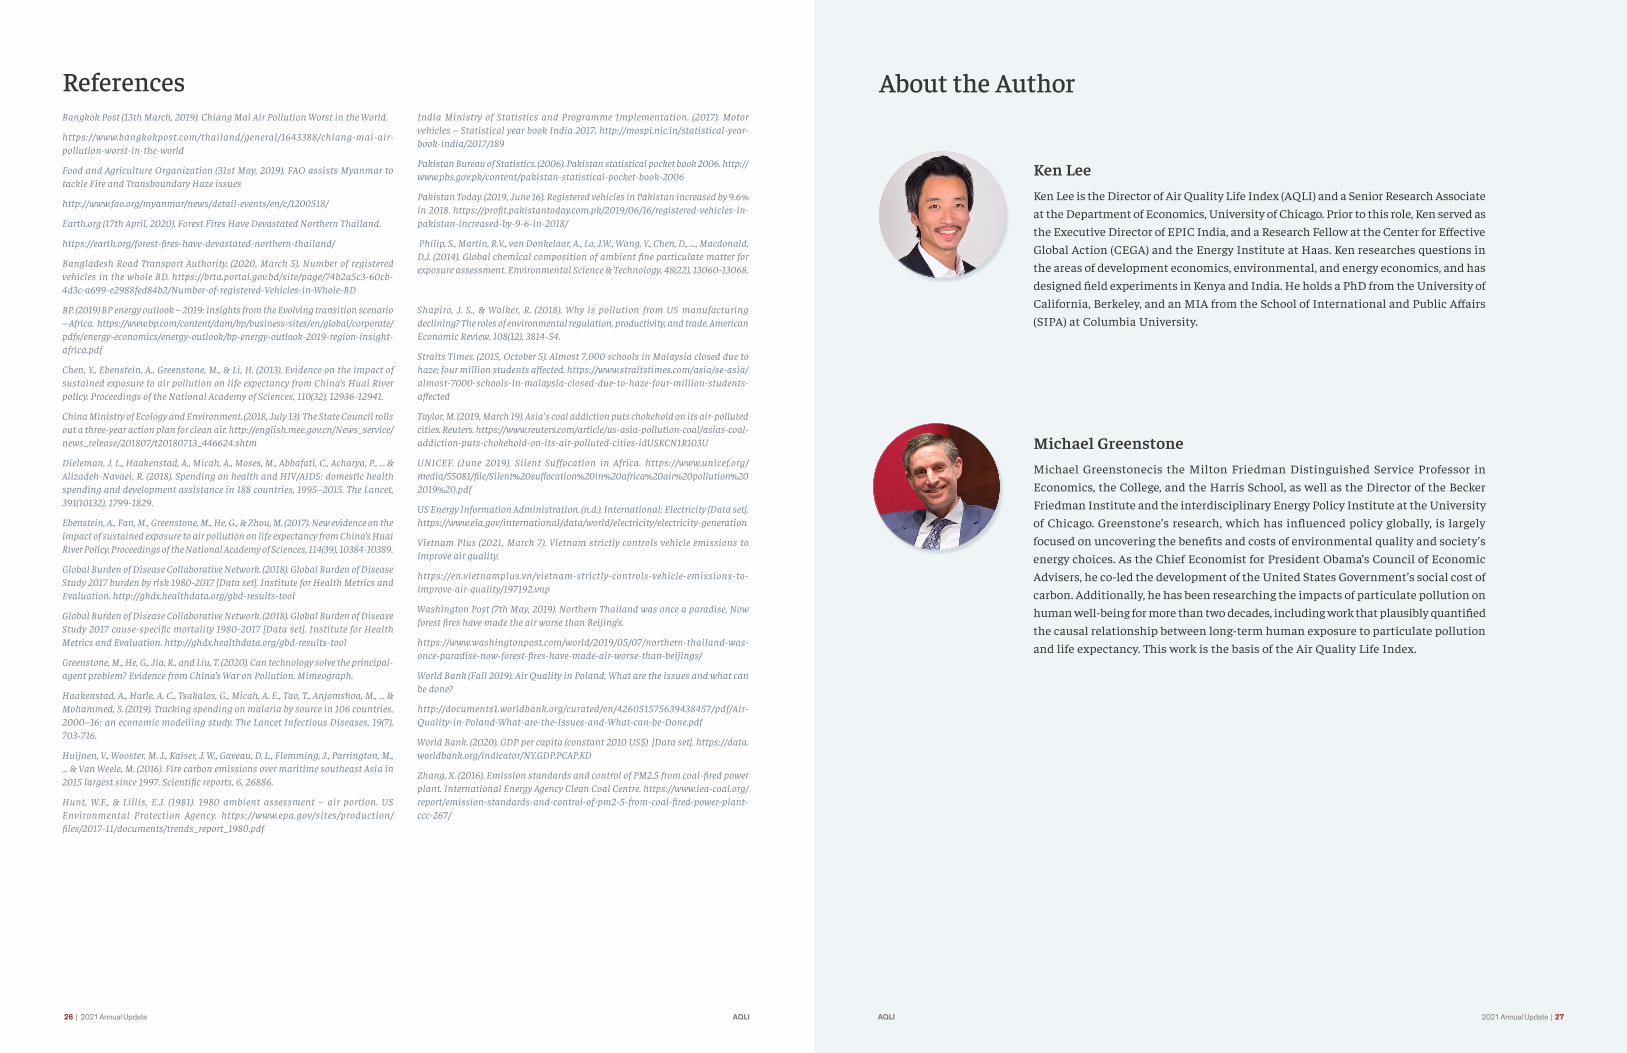
Afghanistan 31 10 2.1 2.1
Akrotiri and Dhekelia 12 0 0.2
Albania 12 15 0.2 0.0
Algeria 6 0 0.0
American Samoa 1 0 0.0
Andorra 5 25 0.0 0.0
Angola 16 0 0.6
Anguilla 1 0 0.0
Antigua and Barbuda 1 0 0.0
Argentina 7 15 0.0 0.0
Armenia 17 0 0.7
Aruba 3 0 0.0
Australia 9 8 0.2 0.3
Austria 13 25 0.3 0.0
Azerbaijan 12 0 0.3
Bahamas 3 0 0.0
Bahrain 35 0 2.4
Bangladesh 65 15 5.4 4.9
Barbados 1 0 0.0
Belarus 14 15 0.3 0.0
Belgium 12 25 0.2 0.0
Belize 9 0 0.0
Benin 40 0 3.0
Bermuda 2 30 0.0 0.0
Bhutan 35 0 2.4
Bolivia 14 10 0.4 0.4
Bonaire, Sint Eustatius and Saba 2 0 0.0
Bosnia and Herzegovina 16 25 0.6 0.0
Botswana 8 0 0.0
Brazil 8 0 0.1
British Virgin Islands 2 0 0.0
Brunei 16 0 0.6
Bulgaria 16 25 0.6 0.0
Burkina Faso 15 0 0.5
Burundi 20 0 0.9
Cambodia 17 0 0.7
Cameroon 34 10 2.4 2.4
Canada 7 10 0.0 0.0
Cape Verde 2 0 0.0
Caspian Sea 10 0 0.1
Cayman Islands 6 0 0.0
Central African Republic 32 0 2.2
Chad 23 0 1.3
Chile 11 20 0.2 0.0
China 37 35 2.6 0.6
Christmas Island 4 0 0.0
Cocos Islands 3 0 0.0
Colombia 24 25 1.4 0.2
Comoros 2 0 0.0
Cook Islands 1 0 0.0
Costa Rica 6 0 0.0
Croatia 13 25 0.3 0.0
Cuba 5 0 0.0
Curaçao 3 0 0.0
Cyprus 12 25 0.2 0.0
Czech Republic 15 25 0.5 0.0
Cote d'Ivoire 30 0 2.0
Democratic Republic of 29 0 1.8
Denmark 11 25 0.1 0.0
Djibouti 25 0 1.4
Dominica 2 0 0.0
Dominican Republic 7 15 0.0 0.0
Ecuador 14 15 0.4 0.1
Egypt 12 0 0.2
El Salvador 12 15 0.2 0.0
Equatorial Guinea 26 0 1.6
Eritrea 18 0 0.8
Estonia 8 25 0.0 0.0
Ethiopia 18 0 0.8
Falkland Islands 1 0 0.0
Faroe Islands 2 0 0.0
Fiji 2 0 0.0
Finland 7 25 0.0 0.0
France 10 25 0.1 0.0
French Guiana 10 0 0.0
French Polynesia 1 0 0.0
French Southern 4 0 0.0
Gabon 22 0 1.2
Gambia 9 0 0.0
Georgia 14 0 0.4
Germany 11 25 0.2 0.0
Ghana 36 0 2.6
Gibraltar 7 0 0.0
Greece 10 25 0.1 0.0
Greenland 1 0 0.0
Grenada 1 0 0.0
Guadeloupe 2 25 0.0 0.0
* No national standard specified ** 10 µg/m3
Appendix Table Additional Years of Life
Expectancy if PM2.5 is Reduced to:
Country
PM2.5
Concentration, 2019 (µ g/m3)
National Standard (µ g/m3)
WHO Guideline**
National Standard
Additional Years of Life Expectancy if PM2.5 is
Reduced to:
Country
PM2.5
Concentration, 2019 (µ g/m3)
National Standard (µ g/m3)
WHO Guideline**
National Standard
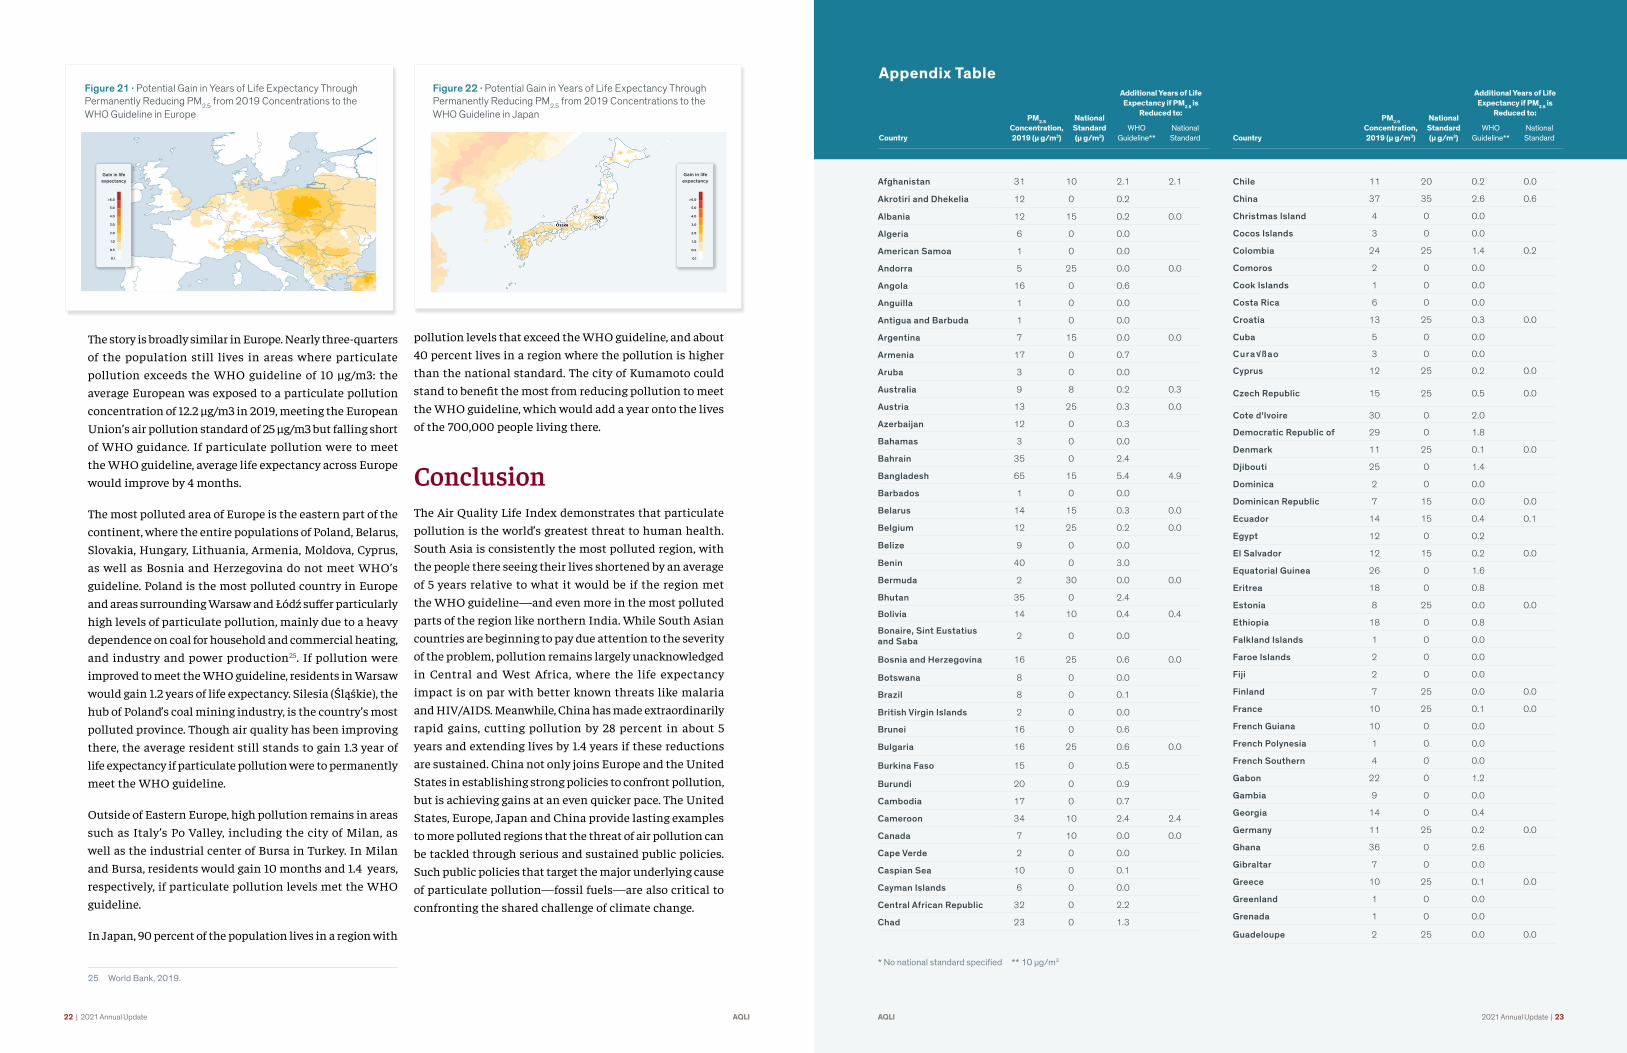
The story is broadly similar in Europe. Nearly three-quarters of the population still lives in areas where particulate pollution exceeds the WHO guideline of 10 µg/m3: the average European was exposed to a particulate pollution concentration of 12.2 µg/m3 in 2019, meeting the European Union’s air pollution standard of 25 µg/m3 but falling short of WHO guidance. If particulate pollution were to meet the WHO guideline, average life expectancy across Europe would improve by 4 months.
The most polluted area of Europe is the eastern part of the continent, where the entire populations of Poland, Belarus, Slovakia, Hungary, Lithuania, Armenia, Moldova, Cyprus, as well as Bosnia and Herzegovina do not meet WHO’s guideline. Poland is the most polluted country in Europe and areas surrounding Warsaw and Łódź suffer particularly high levels of particulate pollution, mainly due to a heavy dependence on coal for household and commercial heating, and industry and power production25. If pollution were improved to meet the WHO guideline, residents in Warsaw would gain 1.2 years of life expectancy. Silesia (Śląśkie), the hub of Poland’s coal mining industry, is the country’s most polluted province. Though air quality has been improving there, the average resident still stands to gain 1.3 year of life expectancy if particulate pollution were to permanently meet the WHO guideline.
Outside of Eastern Europe, high pollution remains in areas such as Italy’s Po Valley, including the city of Milan, as well as the industrial center of Bursa in Turkey. In Milan and Bursa, residents would gain 10 months and 1.4 years, respectively, if particulate pollution levels met the WHO guideline.
In Japan, 90 percent of the population lives in a region with
25 World Bank, 2019.
pollution levels that exceed the WHO guideline, and about 40 percent lives in a region where the pollution is higher than the national standard. The city of Kumamoto could stand to benefit the most from reducing pollution to meet the WHO guideline, which would add a year onto the lives of the 700,000 people living there.
ConclusionThe Air Quality Life Index demonstrates that particulate pollution is the world’s greatest threat to human health. South Asia is consistently the most polluted region, with the people there seeing their lives shortened by an average of 5 years relative to what it would be if the region met the WHO guideline—and even more in the most polluted parts of the region like northern India. While South Asian countries are beginning to pay due attention to the severity of the problem, pollution remains largely unacknowledged in Central and West Africa, where the life expectancy
impact is on par with better known threats like malaria and HIV/AIDS. Meanwhile, China has made extraordinarily rapid gains, cutting pollution by 28 percent in about 5 years and extending lives by 1.4 years if these reductions are sustained. China not only joins Europe and the United States in establishing strong policies to confront pollution, but is achieving gains at an even quicker pace. The United States, Europe, Japan and China provide lasting examples to more polluted regions that the threat of air pollution can be tackled through serious and sustained public policies. Such public policies that target the major underlying cause of particulate pollution—fossil fuels—are also critical to confronting the shared challenge of climate change.
Figure 22 · Potential Gain in Years of Life Expectancy Through Permanently Reducing PM2.5 from 2019 Concentrations to the WHO Guideline in Japan
2.0
1.0
0.5
5.0
≥6.0
4.0
3.0
0.1
Gain in life expectancy
-2.0 to -0.5
-0.5 to -0.1
-0.1 - 0
0 - 0.1
0.1 - 0.5
0.5 - 2.0
>2.0
Years of Change in Life
Expectancy
Figure 21 · Potential Gain in Years of Life Expectancy Through Permanently Reducing PM2.5 from 2019 Concentrations to the WHO Guideline in Europe
2.0
1.0
0.5
5.0
≥6.0
4.0
3.0
0.1
Gain in life expectancy
22 | 2021 Annual Update AQLI AQLI 2021 Annual Update | 23

Romania 14 25 0.4 0.0
Russia 13 25 0.3 0.0
Rwanda 23 0 1.3
Saint Helena 2 0 0.0
Saint Kitts and Nevis 2 0 0.0
Saint Lucia 2 0 0.0
Saint Pierre and Miquelon 2 0 0.0
Saint Vincent and the Grenadines 2 0 0.0
Saint-Barthélemy 2 0 0.0
Saint-Martin 2 0 0.0
Samoa 1 0 0.0
San Marino 9 0 0.0
Saudi Arabia 30 15 1.9 1.4
Senegal 7 0 0.0
Serbia 17 25 0.7 0.0
Seychelles 1 0 0.0
Sierra Leone 20 0 1.0
Singapore 48 12 3.8 3.6
Sint Maarten 2 0 0.0
Slovakia 17 25 0.7 0.0
Slovenia 11 0 0.2
Solomon Islands 3 0 0.0
Somalia 8 0 0.2
South Africa 9 20 0.1 0.0
South Korea 23 25 1.3 0.1
South Sudan 21 0 1.0
Spain 6 25 0.0 0.0
Sri Lanka 19 25 0.9 0.0
Sudan 16 0 0.6
Suriname 10 0 0.0
Swaziland 10 0 0.0
Sweden 8 25 0.0 0.0
Switzerland 11 0 0.1
Syria 13 0 0.3
São Tomé and Príncipe 13 0 0.3
Taiwan 17 15 0.6 0.2
Tajikistan 23 0 1.3
Tanzania 9 0 0.1
Thailand 22 25 1.2 0.1
Timor-Leste 11 0 0.1
Togo 39 0 2.8
Tonga 1 0 0.0
Trinidad and Tobago 2 15 0.0 0.0
Tunisia 4 0 0.0
Turkey 17 0 0.6
Turkmenistan 11 0 0.2
Turks and Caicos Islands 2 25 0.0 0.0
Tuvalu 1 0 0.0
Uganda 18 0 0.7
Ukraine 13 0 0.3
United Arab Emirates 31 0 2.1
United Kingdom 10 25 0.1 0.0
United States 8 12 0.0 0.0
Uruguay 4 0 0.0
Uzbekistan 23 0 1.2
Vanuatu 3 0 0.0
Vatican City 9 0 0.0
Venezuela 11 0 0.3
Vietnam 26 25 1.6 0.5
Virgin Islands, U.S. 2 12 0.0 0.0
Wallis and Futuna 1 0 0.0
Western Sahara 2 0 0.0
Yemen 25 0 1.5
Zambia 11 0 0.2
Zimbabwe 7 0 0.0
Aland 6 0 0.0
Guam 2 12 0.0 0.0
Guatemala 17 10 0.7 0.7
Guernsey 7 0 0.0
Guinea 17 0 0.7
Guinea-Bissau 13 0 0.3
Guyana 7 0 0.0
Haiti 8 0 0.0
Honduras 13 0 0.3
Hungary 15 25 0.5 0.0
Iceland 3 0 0.0
India 70 40 5.9 3.1
Indonesia 35 0 2.5
Iran 20 10 1.0 1.0
Iraq 17 0 0.7
Ireland 5 25 0.0 0.0
Isle of Man 5 0 0.0
Israel 10 25 0.0 0.0
Italy 11 25 0.3 0.0
Jamaica 10 15 0.0 0.0
Japan 13 15 0.3 0.0
Jersey 7 0 0.0
Jordan 10 15 0.1 0.0
Kazakhstan 14 0 0.4
Kenya 8 35 0.1 0.0
Kiribati 14 0 0.6
Kosovo 17 0 0.6
Kuwait 26 15 1.6 1.1
Kyrgyzstan 19 0 0.9
Laos 27 0 1.7
Latvia 10 25 0.0 0.0
Lebanon 12 0 0.2
Lesotho 6 0 0.0
Liberia 26 0 1.6
Libya 4 0 0.0
Liechtenstein 10 0 0.0
Lithuania 13 25 0.3 0.0
Luxembourg 9 25 0.0 0.0
Macedonia 16 0 0.6
Madagascar 4 0 0.0
Malawi 9 8 0.0 0.1
Malaysia 29 35 1.8 0.2
Mali 10 0 0.1
Malta 4 0 0.0
Marshall Islands 0 0 0.0
Martinique 2 25 0.0 0.0
Mauritania 4 0 0.0
Mauritius 1 0 0.0
Mayotte 2 25 0.0 0.0
Mexico 12 15 0.3 0.1
Micronesia 1 0 0.0
Moldova 12 0 0.2
Monaco 8 0 0.0
Mongolia 9 25 0.2 0.0
Montenegro 12 20 0.2 0.0
Montserrat 2 0 0.0
Morocco 6 0 0.0
Mozambique 7 0 0.0
Myanmar 23 0 1.3
Namibia 7 0 0.0
Nauru 1 0 0.0
Nepal 61 0 5.0
Netherlands 13 25 0.3 0.0
New Caledonia 3 25 0.0 0.0
New Zealand 4 0 0.0
Nicaragua 8 0 0.0
Niger 15 0 0.5
Nigeria 44 0 3.4
Niue 1 0 0.0
Norfolk Island 3 0 0.0
North Korea 21 0 1.1
Northern Cyprus 12 0 0.2
Northern Mariana Islands 2 0 0.0
Norway 6 15 0.0 0.0
Oman 30 0 2.0
Pakistan 50 15 3.9 3.4
Palau 2 0 0.0
Palestina 10 0 0.0
Panama 10 0 0.1
Papua New Guinea 6 0 0.0
Paraguay 9 15 0.0 0.0
Peru 30 15 2.1 1.8
Philippines 12 25 0.3 0.0
Poland 20 25 0.9 0.0
Portugal 4 25 0.0 0.0
Puerto Rico 2 15 0.0 0.0
Qatar 37 0 2.6
Republic of Congo 28 0 1.8
Reunion 2 0 0.0
Additional Years of Life Expectancy if PM2.5 is
Reduced to:
Country
PM2.5
Concentration, 2019 (µ g/m3)
National Standard (µ g/m3)
WHO Guideline**
National Standard
Additional Years of Life Expectancy if PM2.5 is
Reduced to:
Country
PM2.5
Concentration, 2019 (µ g/m3)
National Standard (µ g/m3)
WHO Guideline**
National Standard
Additional Years of Life Expectancy if PM2.5 is
Reduced to:
Country
PM2.5
Concentration, 2019 (µ g/m3)
National Standard (µ g/m3)
WHO Guideline**
National Standard
Additional Years of Life Expectancy if PM2.5 is
Reduced to:
Country
PM2.5
Concentration, 2019 (µ g/m3)
National Standard (µ g/m3)
WHO Guideline**
National Standard
* No national standard specified ** 10 µg/m3* No national standard specified ** 10 µg/m3
24 | 2021 Annual Update AQLI AQLI 2021 Annual Update | 25
ReferencesBangkok Post (13th March, 2019). Chiang Mai Air Pollution Worst in the World.
https://www.bangkokpost.com/thailand/general/1643388/chiang-mai-air-pollution-worst-in-the-world
Food and Agriculture Organization (31st May, 2019). FAO assists Myanmar to tackle Fire and Transboundary Haze issues
http://www.fao.org/myanmar/news/detail-events/en/c/1200518/
Earth.org (17th April, 2020). Forest Fires Have Devastated Northern Thailand.
https://earth.org/forest-fires-have-devastated-northern-thailand/
Bangladesh Road Transport Authority. (2020, March 5). Number of registered vehicles in the whole BD. https://brta.portal.gov.bd/site/page/74b2a5c3-60cb-4d3c-a699-e2988fed84b2/Number-of-registered-Vehicles-in-Whole-BD
BP. (2019) BP energy outlook – 2019: insights from the Evolving transition scenario – Africa. https://www.bp.com/content/dam/bp/business-sites/en/global/corporate/pdfs/energy-economics/energy-outlook/bp-energy-outlook-2019-region-insight-africa.pdf
Chen, Y., Ebenstein, A., Greenstone, M., & Li, H. (2013). Evidence on the impact of sustained exposure to air pollution on life expectancy from China’s Huai River policy. Proceedings of the National Academy of Sciences, 110(32), 12936-12941.
China Ministry of Ecology and Environment. (2018, July 13). The State Council rolls out a three-year action plan for clean air. http://english.mee.gov.cn/News_service/news_release/201807/t20180713_446624.shtm
Dieleman, J. L., Haakenstad, A., Micah, A., Moses, M., Abbafati, C., Acharya, P., ... & Alizadeh-Navaei, R. (2018). Spending on health and HIV/AIDS: domestic health spending and development assistance in 188 countries, 1995–2015. The Lancet, 391(10132), 1799-1829.
Ebenstein, A., Fan, M., Greenstone, M., He, G., & Zhou, M. (2017). New evidence on the impact of sustained exposure to air pollution on life expectancy from China’s Huai River Policy. Proceedings of the National Academy of Sciences, 114(39), 10384-10389.
Global Burden of Disease Collaborative Network. (2018). Global Burden of Disease Study 2017 burden by risk 1980-2017 [Data set]. Institute for Health Metrics and Evaluation. http://ghdx.healthdata.org/gbd-results-tool
Global Burden of Disease Collaborative Network. (2018). Global Burden of Disease Study 2017 cause-specific mortality 1980-2017 [Data set]. Institute for Health Metrics and Evaluation. http://ghdx.healthdata.org/gbd-results-tool
Greenstone, M., He, G., Jia, R., and Liu, T. (2020). Can technology solve the principal-agent problem? Evidence from China’s War on Pollution. Mimeograph.
Haakenstad, A., Harle, A. C., Tsakalos, G., Micah, A. E., Tao, T., Anjomshoa, M., ... & Mohammed, S. (2019). Tracking spending on malaria by source in 106 countries, 2000–16: an economic modelling study. The Lancet Infectious Diseases, 19(7), 703-716.
Huijnen, V., Wooster, M. J., Kaiser, J. W., Gaveau, D. L., Flemming, J., Parrington, M., ... & Van Weele, M. (2016). Fire carbon emissions over maritime southeast Asia in 2015 largest since 1997. Scientific reports, 6, 26886.
Hunt, W.F., & Lillis, E.J. (1981). 1980 ambient assessment – air portion. US Environmental Protection Agency. https://www.epa.gov/sites/production/files/2017-11/documents/trends_report_1980.pdf
India Ministry of Statistics and Programme Implementation. (2017). Motor vehicles – Statistical year book India 2017. http://mospi.nic.in/statistical-year-book-india/2017/189
Pakistan Bureau of Statistics. (2006). Pakistan statistical pocket book 2006. http://www.pbs.gov.pk/content/pakistan-statistical-pocket-book-2006
Pakistan Today. (2019, June 16). Registered vehicles in Pakistan increased by 9.6% in 2018. https://profit.pakistantoday.com.pk/2019/06/16/registered-vehicles-in-pakistan-increased-by-9-6-in-2018/
Philip, S., Martin, R.V., van Donkelaar, A., Lo, J.W., Wang, Y., Chen, D., …, Macdonald, D.J. (2014). Global chemical composition of ambient fine particulate matter for exposure assessment. Environmental Science & Technology, 48(22), 13060-13068.
Shapiro, J. S., & Walker, R. (2018). Why is pollution from US manufacturing declining? The roles of environmental regulation, productivity, and trade. American Economic Review, 108(12), 3814-54.
Straits Times. (2015, October 5). Almost 7,000 schools in Malaysia closed due to haze; four million students affected. https://www.straitstimes.com/asia/se-asia/almost-7000-schools-in-malaysia-closed-due-to-haze-four-million-students-affected
Taylor, M. (2019, March 19). Asia's coal addiction puts chokehold on its air-polluted cities. Reuters. https://www.reuters.com/article/us-asia-pollution-coal/asias-coal-addiction-puts-chokehold-on-its-air-polluted-cities-idUSKCN1R103U
UNICEF. (June 2019). Silent Suffocation in Africa. https://www.unicef.org/media/55081/file/Silent%20suffocation%20in%20africa%20air%20pollution%202019%20.pdf
US Energy Information Administration. (n.d.). International: Electricity [Data set]. https://www.eia.gov/international/data/world/electricity/electricity-generation
Vietnam Plus (2021, March 7). Vietnam strictly controls vehicle emissions to improve air quality.
https://en.vietnamplus.vn/vietnam-strictly-controls-vehicle-emissions-to-improve-air-quality/197192.vnp
Washington Post (7th May, 2019). Northern Thailand was once a paradise. Now forest fires have made the air worse than Beijing’s.
https://www.washingtonpost.com/world/2019/05/07/northern-thailand-was-once-paradise-now-forest-fires-have-made-air-worse-than-beijings/
World Bank (Fall 2019). Air Quality in Poland, What are the issues and what can be done?
http://documents1.worldbank.org/curated/en/426051575639438457/pdf/Air-Quality-in-Poland-What-are-the-Issues-and-What-can-be-Done.pdf
World Bank. (2020). GDP per capita (constant 2010 US$) [Data set]. https://data.worldbank.org/indicator/NY.GDP.PCAP.KD
Zhang, X. (2016). Emission standards and control of PM2.5 from coal-fired power plant. International Energy Agency Clean Coal Centre. https://www.iea-coal.org/report/emission-standards-and-control-of-pm2-5-from-coal-fired-power-plant-ccc-267/
About the Author
Ken Lee
Ken Lee is the Director of Air Quality Life Index (AQLI) and a Senior Research Associate at the Department of Economics, University of Chicago. Prior to this role, Ken served as the Executive Director of EPIC India, and a Research Fellow at the Center for Effective Global Action (CEGA) and the Energy Institute at Haas. Ken researches questions in the areas of development economics, environmental, and energy economics, and has designed field experiments in Kenya and India. He holds a PhD from the University of California, Berkeley, and an MIA from the School of International and Public Affairs (SIPA) at Columbia University.
Michael Greenstone
Michael Greenstonecis the Milton Friedman Distinguished Service Professor in Economics, the College, and the Harris School, as well as the Director of the Becker Friedman Institute and the interdisciplinary Energy Policy Institute at the University of Chicago. Greenstone’s research, which has influenced policy globally, is largely focused on uncovering the benefits and costs of environmental quality and society’s energy choices. As the Chief Economist for President Obama’s Council of Economic Advisers, he co-led the development of the United States Government’s social cost of carbon. Additionally, he has been researching the impacts of particulate pollution on human well-being for more than two decades, including work that plausibly quantified the causal relationship between long-term human exposure to particulate pollution and life expectancy. This work is the basis of the Air Quality Life Index.
26 | 2021 Annual Update AQLI AQLI 2021 Annual Update | 27

ABOUT THE AIR QUALITY LIFE INDEX
The AQLI is a pollution index that translates particulate air pollution into perhaps the most important metric that exists: its impact on life expectancy. Developed by the University of Chicago’s Milton Friedman Distinguished Service Professor in Economics Michael Greenstone and his team at the Energy Policy Institute at the University of Chicago (EPIC), the AQLI is rooted in recent research that quantifies the causal relationship between long-term human exposure to air pollution and life expectancy. The Index then combines this research with hyper-localized, global particulate measurements, yielding unprecedented insight into the true cost of particulate pollution in communities around the world. The Index also illustrates how air pollution policies can increase life expectancy when they meet the World Health Organization’s guideline for what is considered a safe level of exposure, existing national air quality standards, or user-defined air quality levels. This information can help to inform local communities and policymakers about the importance of air pollution policies in concrete terms.
ABOUT EPIC
The Energy Policy Institute at the University of Chicago (EPIC) is confronting the global energy challenge by working to ensure that energy markets provide access to reliable, affordable energy, while limiting environmental and social damages. We do this using a unique interdisciplinary approach that translates robust, data-driven research into real-world impacts through strategic outreach and training for the next generation of global energy leaders.
aqli.epic.uchicago.edu @UChiAir #AQLI
/UChicagoEnergyepic.uchicago.edu @UChiEnergy
![Index [] · 1 Index Company profile Company profile Air filter Urethane air filter / Mini collection Air filter Carburetor air filter Carbon fiber light-weight filter](https://img.pdfslide.us/doc/110x75/5adceab27f8b9aeb668c2bf7/index-index-company-profile-company-profile-air-filter-urethane-air-filter-.jpg)