Embed Size (px)
Citation preview

1
Price records in all regions & sectors mark ‘full house’ for first time since 2007
National average asking price
Rightmove measured 88,694 asking prices this month nationally, circa 95% of the UK market. The properties were put on sale by estate agents from 12th September to 9th October 2021 and advertised on Rightmove.co.uk.
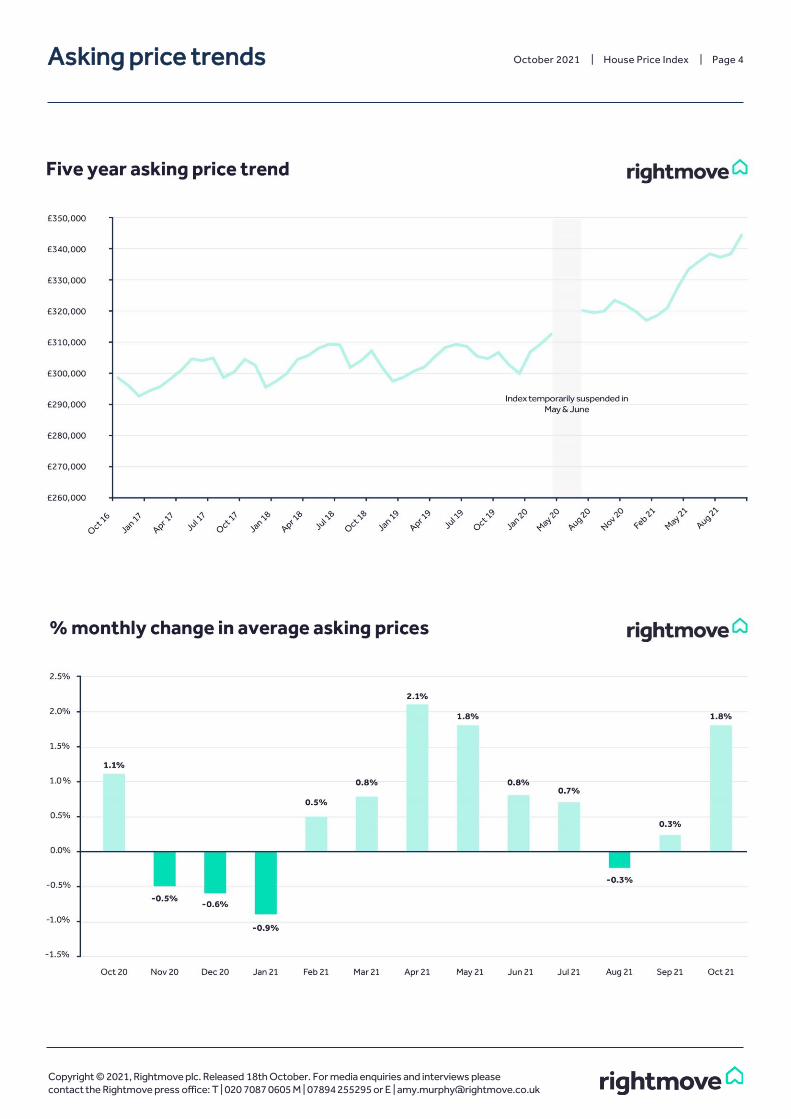
• Price of property coming to market jumps by 1.8% (+£5,983) this month, the biggest rise at this time of year since October 2015
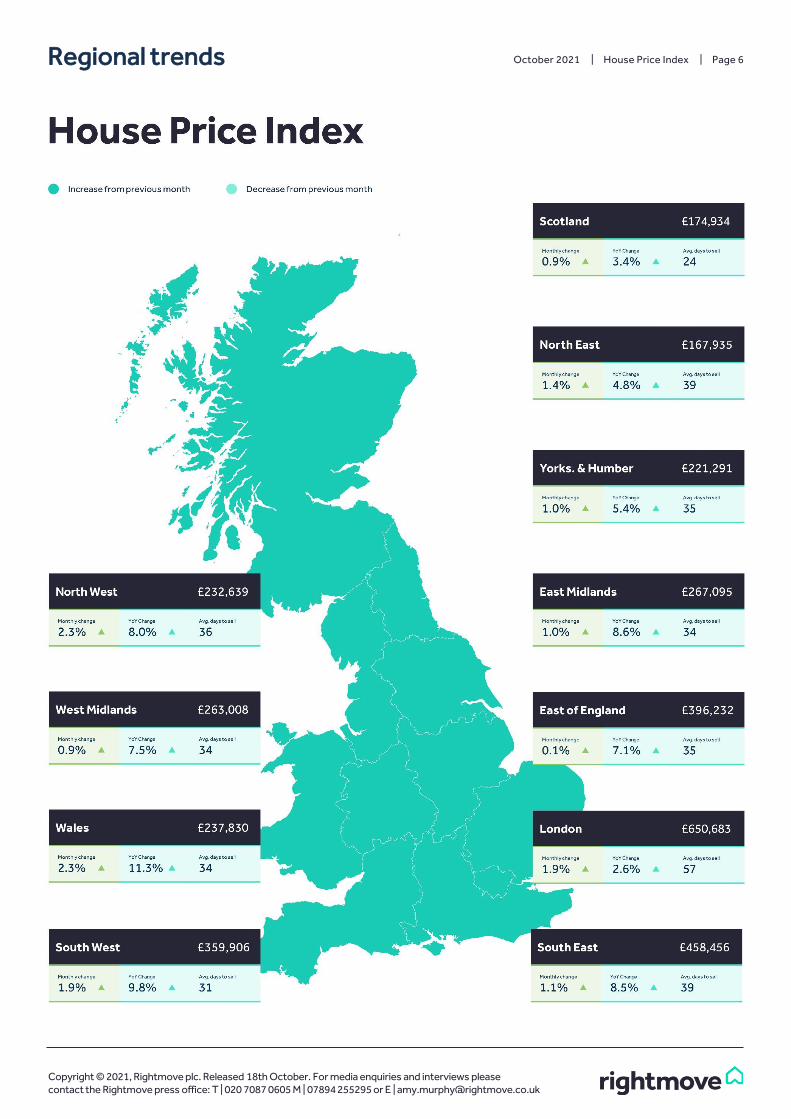
• Market delivers a ‘full house’ for first time since March 2007, with price records in all regions of Great Britain and in all property market sectors (first-time buyer, second stepper and top of the ladder)
• Strong housing market fundamentals and a window of opportunity to buy before a potential interest rate rise keep activity robust despite end of final stamp duty incentive:
• Number of sales being agreed was up 15.2% in September, versus 2019’s ‘normal market’ comparison• Number of new properties coming to market ticks up compared to summer, but not enough to satisfy strong
autumn demand from buyers• 2021 has been the year of the power buyer - those with their property already sold subject to contract or
who have nothing to sell - and thus have the best negotiating hand to secure their ideal home in these ‘full house’ market conditions
Copyright © 2021, Rightmove plc. Released 18th October. For media enquiries and interviews please contact the Rightmove press office: T | 020 7087 0605 M | 07894 255295 or E | [email protected]
October 2021
House Price IndexThe largest monthly sample of residential property prices
National average asking price
Avg. asking price
£344,445
£338,462
National average asking price by market sector (excluding inner London)
Monthly change
+1.8%
+0.3%
Month
October 2021
September 2021
Annual change
+6.5%
+5.8%
Index
266.3
261.6
September 2021
£209,056
£311,230
£620,121
October 2021
£210,672
£315,486
£630,819
Sector
First time buyers
Second-steppers
Top of the ladder
Monthly change
+0.8%
+1.4%
+1.7%
Annual change
+4.5%
+7.5%
+9.6%
Monday 18th October 2021

2
October 2021 | House Price Index | Page 2
Tim Bannister, Rightmove’s Director of Property Data comments: “Competition for property for sale remains hot this autumn, with average prices jumping by almost £6,000 in the month. Although more properties are coming to market, the level is still not enough to replenish the stock that’s being snapped up. Consequently, new price records have been set across the board, with every region of Great Britain and all of the three market sectors of first-time buyer, second-stepper and top of the ladder hitting all-time highs. This ‘full house’ is an extremely rare event, happening for the first time since March 2007. The stock shortages started after the first lockdown, and they look set to continue with the underlying housing market fundamentals remaining strong, and an additional incentive to buy and fix your mortgage interest rate before a widely expected rate rise. Mortgage interest rates are lower than they have ever been before and lenders are keen to lend in a competitive market, with employment and wage growth also robust. The number of sales agreed continue to be strong despite the end of the stamp duty incentives.”
Copyright © 2021, Rightmove plc. Released 18th October. For media enquiries and interviews please contact the Rightmove press office: T | 020 7087 0605 M | 07894 255295 or E | [email protected]
Overview
The price of property coming to market has surged past last month’s record and jumped by an average of 1.8% (+£5,983) this month. This is the highest percentage monthly rise at this time of year since October 2015. In addition, this is the first time since March 2007 that Rightmove has recorded a ‘full house’, with all market sectors and all regions of Great Britain having hit new record price highs in the same month. The continued fast turnover of property for sale and a window of opportunity to buy before a potential interest rate rise seem to have overcome the final expiry of all stamp duty incentives and are keeping activity robust.
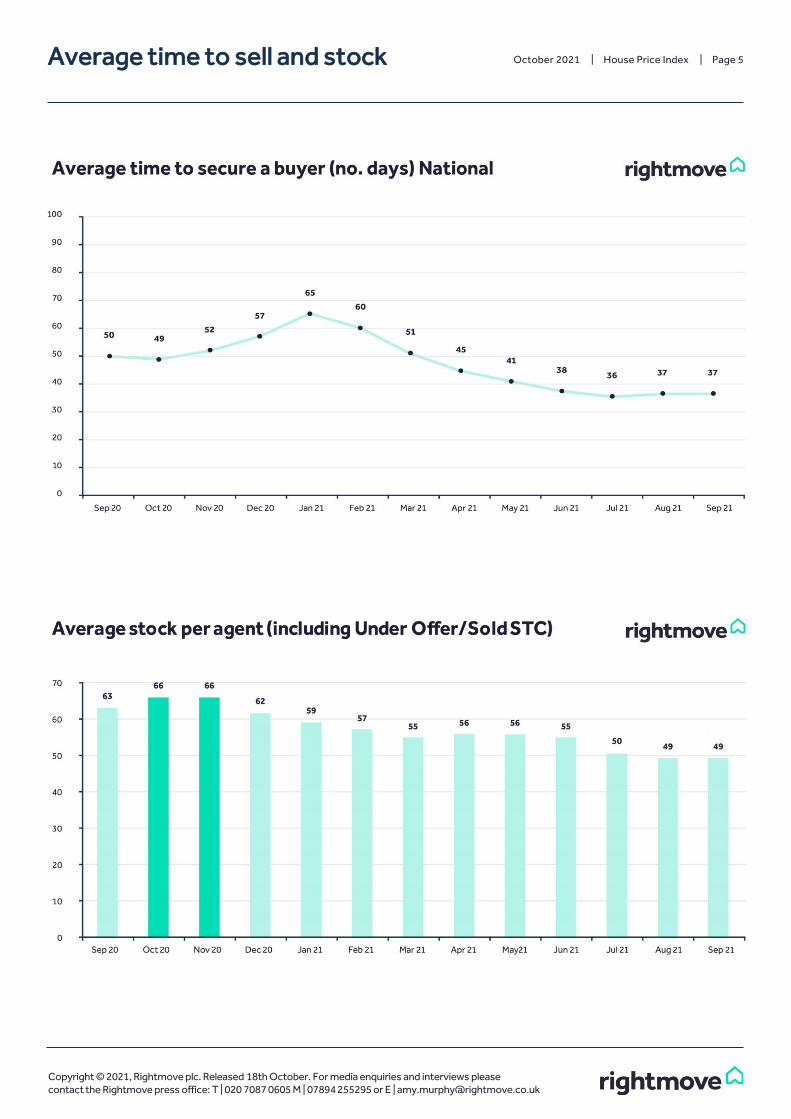
Bannister says: “2021 has been the year of the power buyer, with those in the most powerful position to proceed quickly and with most certainty ruling the roost over other buyers who have to sell but have yet to come to market. One agent’s analysis that 87% of their sales agreed were snapped up by buyers who were already in a position to proceed is fairly typical of reports from many agents. Buyers being able to prove they are mortgage-ready or have cash in the bank helps them get up the pecking order. Whilst available stock for sale is still close to record lows, there are signs that this has stopped falling and is stabilising this month, so fresh new choice is slowly growing. As we approach the end of the year, many prospective buyers may be distracted by a more normal family Christmas than in 2020, giving more determined buyers who have already sold their own property an opportunity to act fast and buy with less competition.”
The number of sales being agreed was up by 15.2% in September compared to the same period in 2019, which is the best ‘normal market’ comparison. This high level of demand is stalling a recovery in the depleted available stock for sale despite a continuing upward trend in properties coming to market. The latest weekly snapshot shows that the number of new sellers coming to market is still marginally down on the same period in 2019, but only by 3.2% as opposed to 9.3% for the period as a whole. This continuing imbalance, with demand outstripping supply and leading to record prices, presents an opportunity for owners looking to sell and cash out if they are downsizing or not needing to buy another property.
The window is also open for movers who wish to sell and buy again before a likely interest rate rise, which is widely expected as the Bank of England seeks to control resurgent inflation. In these ‘full house’ market conditions, with many homes being snapped up quickly and sellers having a choice of competing buyers, those buyers who have already sold their own property subject to contract or have nothing to sell will have the most powerful negotiating hand to secure their ideal home. Estate agents report that owners who are motivated to move are putting their property on the market before they have set their heart on an onward purchase, and once they have sold their own subject to contract their new status as a ‘power buyer’ helps them to secure a suitable property when it comes on the market.

3
October 2021 | House Price Index | Page 3
Copyright © 2021, Rightmove plc. Released 18th October. For media enquiries and interviews please contact the Rightmove press office: T | 020 7087 0605 M | 07894 255295 or E | [email protected]
Agents’ Views
Overview
Mark Ross, Managing Director of Redbrik, said: “Stock shortages continue to drive prices upwards, though accurate pricing rather than over-pricing is very important to get prospective buyers through the door. We expect prices to continue to rise, albeit at a steadier pace. This should give buyers and sellers more confidence to come to the market as they better understand the less frantic conditions. Extrapolating the market fluctuations, we’ve seen property firmly re-establish itself as a reliable long-term investment for owner-occupiers and investors alike. While we expect a 0.5% increase in the mortgage rate over the next six months, we predict rates will remain comparatively low as banks, and building societies compete for business.
“We’re advising sellers to start planning their moves for 2022 now by taking advantage of the blue skies and getting their marketing organised, so they’re ready to go. With buyers prepared to wait to allow chains to be built, sellers can be confident in coming to market and get a jump start on their competition. Downsizers, particularly, should look to market early so that they can take advantage of the premium (and therefore the value gap) they are likely to receive before stock levels recover. The property market rollercoaster of the past 18 months has highlighted the vital importance of a buyer’s position. Our data shows that 87% of offers accepted are from 'proceedable' buyers, cementing what we knew to be true; buyers need to plan ahead to put themselves in the best position to move.”
Nick Menzies, Area Partner for The Robinson Jackson Group said: “With properties achieving record values, selling first before buying is key right now. Not only does it put a home-mover in the strongest position, it also provides an accurate budget for what they can afford to buy. If someone sets out with £350,000 in their mind and achieves £375,000 for their property, they now have £25,000 more to spend. The extra money can really open up more homes for them to look at which they wouldn’t have considered affordable if they hadn’t gone to market and sold first. Also, if you don’t already have a sale agreed on your property, the level of current buyer activity means it’s likely that ‘the one’ for you has already had a lot of interest from buyers who may be in a better position to proceed quickly.”
4
October 2021 | House Price Index | Page 4
Copyright © 2021, Rightmove plc. Released 18th October. For media enquiries and interviews please contact the Rightmove press office: T | 020 7087 0605 M | 07894 255295 or E | [email protected]
Asking price trends
5
October 2021 | House Price Index | Page 5
Copyright © 2021, Rightmove plc. Released 18th October. For media enquiries and interviews please contact the Rightmove press office: T | 020 7087 0605 M | 07894 255295 or E | [email protected]
Average time to sell and stock
6
October 2021 | House Price Index | Page 6
Copyright © 2021, Rightmove plc. Released 18th October. For media enquiries and interviews please contact the Rightmove press office: T | 020 7087 0605 M | 07894 255295 or E | [email protected]
Regional trends
7
October 2021 | House Price Index | Page 7
Copyright © 2021, Rightmove plc. Released 18th October. For media enquiries and interviews please contact the Rightmove press office: T | 020 7087 0605 M | 07894 255295 or E | [email protected]
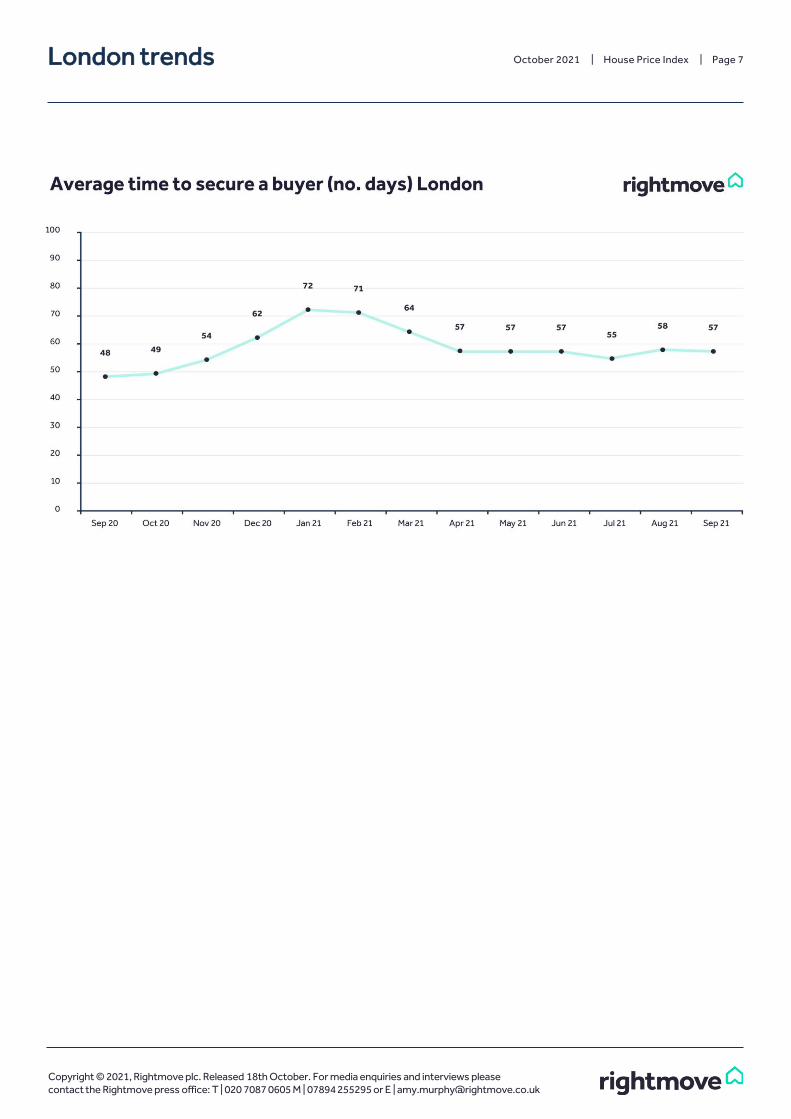
London trends

8
Asking price trends
Borough data is based on a three-month rolling average and can be used as an indicator of overall price trends in each borough over time.
It is not directly comparable with the overall London monthly figures.
Borough Avg. price October 2021 Monthly change Annual change
Bexley £454,774 1.0% 5.9%
Barking and Dagenham £349,645 0.9% 5.8%
Croydon £473,690 1.6% 5.1%
Kingston upon Thames £652,071 1.5% 4.6%
Havering £445,012 1.6% 4.0%
Bromley £586,499 0.1% 3.9%
Hounslow £570,942 1.4% 3.6%
Merton £675,147 0.7% 3.6%
Enfield £484,018 -0.4% 3.3%
Kensington and Chelsea £1,554,254 -0.3% 3.3%
Harrow £597,308 1.1% 3.3%
Westminster £1,369,667 0.2% 3.2%
Richmond upon Thames £894,007 0.9% 2.7%
Barnet £669,340 0.2% 2.7%
Sutton £507,219 -0.8% 2.7%
Redbridge £486,133 0.2% 2.4%
Greenwich £477,959 0.4% 2.3%
Brent £615,119 1.3% 2.2%
Wandsworth £809,064 -1.0% 2.0%
Waltham Forest £518,964 -0.1% 1.7%
Newham £437,946 1.4% 1.4%
Hillingdon £515,857 -0.7% 1.4%
Tower Hamlets £569,644 -0.8% 1.0%
Lambeth £657,059 2.6% 0.7%
Hackney £653,676 -1.7% -0.4%
Lewisham £494,329 0.7% -1.0%
Hammersmith and Fulham £929,220 -2.2% -1.6%
Southwark £630,773 -0.1% -1.8%
Haringey £644,501 3.2% -1.9%
Ealing £566,918 -0.3% -2.1%
Camden £952,470 -0.8% -3.7%
Islington £735,525 -0.5% -5.6%
October 2021 | House Price Index | Page 8
Copyright © 2021, Rightmove plc. Released 18th October. For media enquiries and interviews please contact the Rightmove press office: T | 020 7087 0605 M | 07894 255295 or E | [email protected]
9
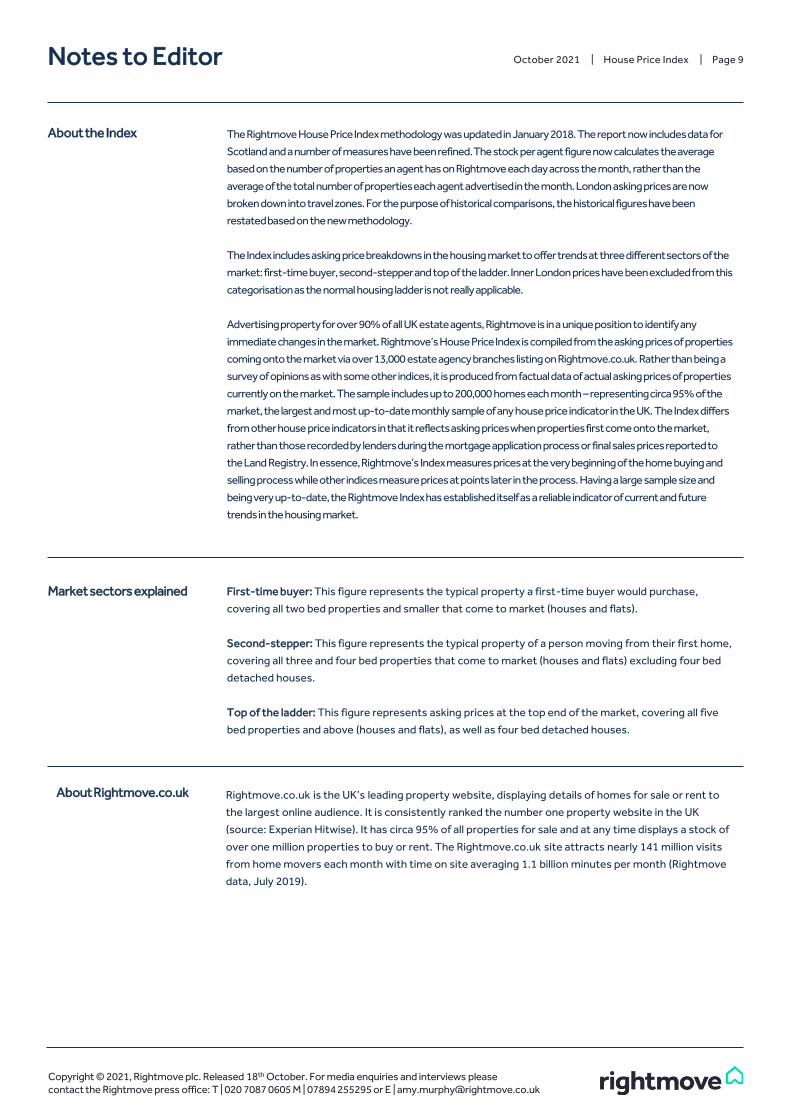
About the Index
Copyright © 2021, Rightmove plc. Released 18th October. For media enquiries and interviews please contact the Rightmove press office: T | 020 7087 0605 M | 07894 255295 or E | [email protected]
The Rightmove House Price Index methodology was updated in January 2018. The report now includes data for
Scotland and a number of measures have been refined. The stock per agent figure now calculates the average
based on the number of properties an agent has on Rightmove each day across the month, rather than the
average of the total number of properties each agent advertised in the month. London asking prices are now
broken down into travel zones. For the purpose of historical comparisons, the historical figures have been
restated based on the new methodology.
The Index includes asking price breakdowns in the housing market to offer trends at three different sectors of the
market: first-time buyer, second-stepper and top of the ladder. Inner London prices have been excluded from this
categorisation as the normal housing ladder is not really applicable.
Advertising property for over 90% of all UK estate agents, Rightmove is in a unique position to identify any
immediate changes in the market. Rightmove’s House Price Index is compiled from the asking prices of properties
coming onto the market via over 13,000 estate agency branches listing on Rightmove.co.uk. Rather than being a
survey of opinions as with some other indices, it is produced from factual data of actual asking prices of properties
currently on the market. The sample includes up to 200,000 homes each month – representing circa 95% of the
market, the largest and most up-to-date monthly sample of any house price indicator in the UK. The Index differs
from other house price indicators in that it reflects asking prices when properties first come onto the market,
rather than those recorded by lenders during the mortgage application process or final sales prices reported to
the Land Registry. In essence, Rightmove’s Index measures prices at the very beginning of the home buying and
selling process while other indices measure prices at points later in the process. Having a large sample size and
being very up-to-date, the Rightmove Index has established itself as a reliable indicator of current and future
trends in the housing market.
Market sectors explained First-time buyer: This figure represents the typical property a first-time buyer would purchase,
covering all two bed properties and smaller that come to market (houses and flats).
Second-stepper: This figure represents the typical property of a person moving from their first home,
covering all three and four bed properties that come to market (houses and flats) excluding four bed
detached houses.
Top of the ladder: This figure represents asking prices at the top end of the market, covering all five
bed properties and above (houses and flats), as well as four bed detached houses.
Rightmove.co.uk is the UK’s leading property website, displaying details of homes for sale or rent to
the largest online audience. It is consistently ranked the number one property website in the UK
(source: Experian Hitwise). It has circa 95% of all properties for sale and at any time displays a stock of
over one million properties to buy or rent. The Rightmove.co.uk site attracts nearly 141 million visits
from home movers each month with time on site averaging 1.1 billion minutes per month (Rightmove
data, July 2019).
About Rightmove.co.uk
October 2021 | House Price Index | Page 9 Notes to Editor


![House Price Index [December 2014 - ONS]](https://img.pdfslide.us/doc/110x75/55a8a85e1a28abd6508b4879/house-price-index-december-2014-ons.jpg)