Embed Size (px)
Citation preview

27-May-2016Prepared for – Vopak Terminals Pty Ltd – ABN: 67 004 754 750
Vopak Terminal B4Vopak Terminals Pty Ltd27-May-2016
Air Quality ImpactAssessmentVopak Terminal B4 - State Significant Development

AECOM Vopak Terminal B4Air Quality Impact Assessment
27-May-2016Prepared for – Vopak Terminals Pty Ltd – ABN: 67 004 754 750
Air Quality Impact AssessmentVopak Terminal B4 - State Significant Development
Client: Vopak Terminals Pty Ltd
ABN: 67 004 754 750
Prepared byAECOM Australia Pty Ltd17 Warabrook Boulevard, Warabrook NSW 2304, PO Box 73, Hunter Region MC NSW 2310, AustraliaT +61 2 4911 4900 F +61 2 4911 4999 www.aecom.comABN 20 093 846 925
27-May-2016
Job No.: 60344169
AECOM in Australia and New Zealand is certified to the latest version of ISO9001, ISO14001, AS/NZS4801 and OHSAS18001.
© AECOM Australia Pty Ltd (AECOM). All rights reserved.
AECOM has prepared this document for the sole use of the Client and for a specific purpose, each as expressly stated in the document. No otherparty should rely on this document without the prior written consent of AECOM. AECOM undertakes no duty, nor accepts any responsibility, to anythird party who may rely upon or use this document. This document has been prepared based on the Client’s description of its requirements andAECOM’s experience, having regard to assumptions that AECOM can reasonably be expected to make in accordance with sound professionalprinciples. AECOM may also have relied upon information provided by the Client and other third parties to prepare this document, some of whichmay not have been verified. Subject to the above conditions, this document may be transmitted, reproduced or disseminated only in its entirety.

AECOM Vopak Terminal B4Air Quality Impact Assessment
27-May-2016Prepared for – Vopak Terminals Pty Ltd – ABN: 67 004 754 750
Quality InformationDocument Air Quality Impact Assessment
Ref 60344169
Date 27-May-2016
Prepared by Adam Plant / Dave Claughton
Reviewed by David Rollings
Revision History
Revision Revision Date DetailsAuthorised
Name/Position Signature
1 25-May-2016 Draft Simon MurphyProject Manager
2 27-May-2016 Report for EPA Simon MurphyProject Manager

AECOM Vopak Terminal B4Air Quality Impact Assessment
27-May-2016Prepared for – Vopak Terminals Pty Ltd – ABN: 67 004 754 750
This page has been left blank intentionally.

AECOM Vopak Terminal B4Air Quality Impact Assessment
27-May-2016Prepared for – Vopak Terminals Pty Ltd – ABN: 67 004 754 750
Table of Contents1.0 Introduction 1
1.1 Project Overview 11.2 Scope of Work 11.3 Secretary’s Environmental Assessment Requirements 11.4 Structure of Report 2
2.0 Project Description 32.1 Proposed Vopak Site B4 3
2.1.1 Development Location 32.1.2 Infrastructure 32.1.3 Project Construction 52.1.4 Project Operations 5
2.2 Vopak Site B 75W Modification 62.3 Bulk Liquid Berths 62.4 Vopak Bitumen 7
3.0 Existing Environment 83.1 Air Quality 83.2 Regional Meteorology 8
4.0 Assessment Criteria 95.0 Assessment Methodology 10
5.1 Cumulative Assessment Methodology 105.2 Sources Assessed in the Dispersion Model 125.3 Emission and Dispersion Models 12
5.3.1 TANKS Emission Model 125.3.2 TAPM Meteorological Model 135.3.3 CALPUFF Air Dispersion Model Suite 13
5.4 Model Setup 145.5 Assessment Scenarios 155.6 Sensitive Receptors 16
6.0 Dispersion Model Inputs 186.1 Meteorology 186.2 Terrain 186.3 Building Wake Effects 186.4 Source Characteristics 18
6.4.1 Bulk Liquid Berths 196.4.2 Storage Tanks 196.4.3 Site B Gantry Vapour Emissions 216.4.4 Fugitive Emissions 22
6.5 Emission Rates 226.6 Limitations and Conservatism of Dispersion Modelling 24
7.0 Dispersion Modelling Results 257.1 Typical Maximum Operational Assessment 257.2 Specific Residential Receptor Assessment 29
8.0 Tiered Procedure for Estimating Ground-Level Ozone Impacts from Stationary Sources – Site B4 318.1 Region Classification 318.2 Threshold Assessment 318.3 Level 1 Screening Assessment 318.4 Best Management Practice (BMP) Review 32
9.0 Recommended Mitigation Measures 339.1 Construction Mitigation Measures 339.2 Operational Mitigation Measures 34
10.0 Conclusion 3511.0 References 36
Appendix AMeteorological Data Analyses A

AECOM Vopak Terminal B4Air Quality Impact Assessment
27-May-2016Prepared for – Vopak Terminals Pty Ltd – ABN: 67 004 754 750
Appendix BTANKS Details B
Appendix CEmission Rates C
Appendix DLiterature and Documentation D
Appendix EPredicted Concentration Isopleths E
List of Tables
Table 1 Secretary’s Environmental Assessment Requirements 2Table 2 Structure of Report 2Table 3 Proposed Tanks 3Table 4 Proposed Timeline for Each Stage of Construction Activities 5Table 5 NSW EPA Assessment Criteria 9Table 6 Background Data Summary 11Table 7 Benzene Residential Receptor Background Data 12Table 8 Summary of Model Input Parameters 14Table 9 Residential Sensitive Receptors 16Table 10 Storage Tank Details 19Table 11 Fuel Composition – Substance Proportions (NPI) 21Table 12 Vopak Site B VRU Stack Emission Parameters 21Table 13 Gantry Sample Concentration Summary (pre- VRU) (AECOM 2015b) 22Table 14 Pipeline Parameters – Site B and B4 22Table 15 Modelled Emission Rates 23Table 16 Maximum Cumulative Predicted Ground Level Concentrations At or Beyond the Site
Boundary 99.9th Percentile (mg/m3) 25Table 17 Maximum Site B4 Predicted Ground Level Concentrations At or Beyond the Site
Boundary 99.9th Percentile (mg/m3) 27Table 18 Benzene Residential Receptor Predicted Maximum Ground Level Concentrations 99.9 th
Percentile (mg/m3) 30
List of Figures
Figure 1 Project Location and Site Plan 4Figure 2 Sensitive Receptor Locations 17Figure 3 Maximum Cumulative Benzene Isopleth 99.9th Percentile (Criterion 29 ug/m3) 26Figure 4 Maximum Cumulative Cumene Isopleth 99.9th Percentile 28

AECOM Vopak Terminal B4Air Quality Impact Assessment
27-May-2016Prepared for – Vopak Terminals Pty Ltd – ABN: 67 004 754 750
1
1.0 Introduction
1.1 Project OverviewThis Air Quality Impact Assessment (AQIA) was prepared by AECOM Australia Pty Ltd (AECOM) to support theEnvironmental Impact Statement (EIS) prepared on behalf of Vopak Terminals Pty Ltd (Vopak) for a StateSignificant Development (SSD) application for the Stage B4 Expansion Project. The expansion project consists ofthe construction and operation of a petroleum tank farm at Port Botany, NSW, which would consist of sevenstorage tanks with a total nominal capacity of 200 ML (the Project).
The main potential sources of air emissions associated with the proposed development are vapour emissions(volatile organic compounds, or VOCs) from the storage and transfer of fuels. The purpose of this assessmentwas to estimate the emissions of VOCs from the facility and the resultant concentrations of these pollutants atsensitive receptor locations. This report provides details of the methodology and results of the dispersionmodelling of VOC emissions.
The assessment has been undertaken with consideration of the cumulative impacts of other Vopak operatedfacilities in Port Botany, and also addresses the emissions and impacts from the existing Site B Terminal asproposed under their current Section 75W Development Modification 2650515. The 75W Modification proposesan increase in site throughout from 3,950ML per year to 7,800ML.
1.2 Scope of WorkThe assessment was undertaken in accordance with the NSW Environment Protection Authority (NSW EPA)Approved Methods for the Modelling and Assessment of Air Pollutants in NSW (The Approved Methods) (DEC2005). Impacts from the operation of the B4 terminal have been included in the dispersion model CALPUFF,together with the emissions from the adjacent Vopak Site B (as modified under 75W Modification 2650515), BulkLiquid Berths and the nearby Vopak Bitumen facility. These sites have been included in the one air dispersionmodel as they are all integral to the operation of Vopak B4. In addition, the Vopak Bitumen facility has also beenincluded in the dispersion model as the site is also operated by Vopak. Emissions from other nearby facilities,such as the Terminals liquid storage facility, have been included as background values and not specificallymodelled.
The assessment considered the following pertinent information from the stated facilities:
Vopak Site B4:
- Storage tank emissions from working and standing losses due to operation of seven new storage tanks(nominally three combustible and four flammable).
Vopak Site B:
- An increase in storage tank emissions due to an increase in throughput from 3,950Mlpa to the proposed7,800Mlpa, with a mixture of petroleum, diesel, biodiesel, ethanol and jet fuel stored on-site.
- The continued operation of the existing vapour recovery system on the truck loading gantry, accommodatingfor the proposed increase in throughput.
Bulk Liquid Berths:
- Emissions from the Bulk Liquid Berths due to fugitive emissions from pipework, flanges and other fittings.
Vopak Bitumen:
- Operation of the vapour combustion unit.
- Bitumen storage tank breathing losses.
1.3 Secretary’s Environmental Assessment RequirementsIn preparing this AQIA, consideration has been given to the NSW Planning and Environment (P&E) Secretary’sEnvironmental Assessment Requirements (SEARs) issued for the project (SSD 7000) on 30 April 2015. The keymatters raised by the Secretary, and where this report addresses them, are outlined in Table 1.
AECOM Vopak Terminal B4Air Quality Impact Assessment
27-May-2016Prepared for – Vopak Terminals Pty Ltd – ABN: 67 004 754 750
2
Table 1 Secretary’s Environmental Assessment Requirements
Secretary’s Environmental Assessment Requirement Section Addressed
A quantitative assessment of the air quality and odour impacts of thedevelopment on surrounding receivers Section 7.0
Details of mitigation, management and monitoring measures for preventingand/or minimising emissions Section 10.0
An assessment of the potential greenhouse gas emissions of the proposeddevelopment Addressed in the Site B4 AQIA.
1.4 Structure of ReportThe structure of the remainder of the report is provided in Table 2.Table 2 Structure of Report
Section Brief
Section 1 Assessment overview
Section 2 Provides a description of the Project
Section 3 Describes the existing environment, including a review of existing air quality and local climateconditions
Section 4 Outlines the impact assessment criteria used in this assessment
Section 5 Detailed description of the air quality assessment methodology, specifically emissions anddispersion models applied
Section 6 Identifies the inputs required for the dispersion model and includes meteorology, terrain, sourcecharacteristics and emission rate
Section 7 Assessment of the potential air quality impacts of the Project on the local air shed and providesassessment of relevant criteria against identified sensitive receptors
Section 8 Assessment of the ozone generation and potential impacts as a result of the Project
Section 9 Describes the mitigation measures that are currently used at the Facility or that arerecommended to be implemented as part of the Project
Section 10 Provides the study conclusions

AECOM Vopak Terminal B4Air Quality Impact Assessment
27-May-2016Prepared for – Vopak Terminals Pty Ltd – ABN: 67 004 754 750
3
2.0 Project DescriptionThe following sections provides a brief background to the primary facility being assessed, Vopak site B4, andsecondly those facilities that have been included in the air dispersion model.
2.1 Proposed Vopak Site B4The Project consists of the construction and operation of a liquid fuels (finished or refined petroleum) storagedepot. This would involve the construction of seven storage tanks with a total nominal capacity of 200 ML. Vopakproposes to undertake the Project in two stages:
- Stage 1 (B4A):
· Construction of three storage tanks and bunding dedicated to ADO (diesel fuel with a nominal totalcapacity of 105,000 m3);
· Construction of new pipelines/culverts to inter-connect with the Site B (B1) manifold;
· Installation of manifold/transfer pumps and connections to utilities; and
· Extension of existing Site B fire protection system to the B4A site.
- Stage 2 (B4B):
· Construction of four storage tanks (nominal combined total capacity of 95,000 m3) capable of storingany Class 3 combustible product;
· Construction of additional transfer pipelines to Site B manifold systems; and
· New fire protection system complying with AS 1940 requirements.
2.1.1 Development Location
The existing Site is located on part of the former Qenos Hydrocarbon Terminal at 39 Friendship Road, PortBotany, which protrudes into Botany Bay. The site is approximately 12 km south-east of the Sydney CentralBusiness District. Vopak currently operates the Site B Terminal in Port Botany located at 20 Friendship Road.
The site is surrounded by industrial properties, including operations handling containers, bulk liquids andpetrochemicals. Sydney Airport is located to the northwest of the site. Closest residential areas are locatedapproximately 1.4 km to the east of the site, across Yarra Bay.
2.1.2 Infrastructure
The dimensions of the proposed Site B4 tanks are summarised in Table 3.Table 3 Proposed Tanks
Area Tank No. Diameter(m)
Height(m)
ShellVolume (m3)
Safe FillVolume (m3)
OperatingVolume (m3) Product
B4A
110-01 43.5 24.7 36,700 35,200 33,700
Diesel110-02 43.5 24.7 36,700 35,200 33,700
110-03 43.5 24.7 36,700 35,200 33,700
B4B
110-04 41 24 31,600 30,300 29,000Gasoline/petroleum
110-05 41 24 31,600 30,300 29,000
110-06 29 24 15,800 15,000 14,500
110-07 29 24 15,800 15,000 14,500
Area B4A tanks would be made from carbon steel, each with an aluminium geodesic dome roof (no internalfloating roof). Area B4B tanks would be carbon steel floating roof tanks with aluminium geodesic dome roofs. Alltanks would be painted white.

ÊÑÐßÕ
ÑÎ×Ù×Ò
ÑÎ×Ù×Ò
ÌÛÎÓ×ÒßÔÍ
ÌÛÎÓ×ÒßÔÍ
ÌÇÒÛ
ÊÑÐßÕ
ÊÑÐßÕ
ÛÔÙßÍ
ÜÐ ÉÑÎÔÜ
ÐßÌÎ×ÝÕ
ÍÌÛÊÛÜÑÎÛÍ
Í×ÝÌÔ
ÌØÛ ÕÒËÝÕÔÛ
ÌÆßÒÛÎÑÍ×ÒÊÛÍÌÓÛÒÌÍ
ÐßÌÎ×ÝÕ ÐÑÎÌÍÛÎÊ×ÝÛÍ
ÐßÌÎ×ÝÕ ÐÑÎÌÍÛÎÊ×ÝÛÍ
ÐÑÌß
Ê×ÍßÔÑÙ×ÍÌ×ÝÍ
ÝËÍÌÑÓÍ
ÞÛÌÌÛÎÊßÔÛ
ÞßËÔÜÛÎÍÌÑÒÛ
Ç¿®®¿Þ¿§
Þ¿²µ
É¿´
´
Ó±´·²»¿«¨
б·²¬
Þ®±¬¸»®±²Ü±½µ
Ø¿§»
ܱ½µ
Ò±ò ï
Ò±ò ïß
Ò±ò î
Ò±ò í
Ò±ò îß
Ò±ò ê
Ò±ò ë
Ò±ò ì
ͧ¼²»§ Ø¿«´¿¹»
É¿®»¸±«» Ú¿½· ·́¬§
Ý¿´¬» ̈ͧ¼²»§
Ì»®³·²¿´
Þ« Ì»®³·²¿´øÒÍÉ Í¬¿¬»
Ì®¿²·¬÷
Þ±¬¿²§ Ô¿©²Ý»³»¬»®§
б®¬Þ±¬¿²§
Ç¿®®¿ Þ¿§Þ·½»²¬»²²·¿´
п®µ
Ú®»²½¸³¿²Þ¿§
Þ«³¾±®¿
б·²¬
Ç¿®®¿
б·²¬
Ô¿ л®±«»
б·²¬
Þ«
³¾
±®¿
¸Ð
±·²
¬Î
±¿
¼
ײ¬ »
® ó¬ »®³
· ²¿
´ß
½½
»
Î
±¿
¼
ݸ¿®´±¬¬» Î
±¿¼
Ú®·»²¼¸·°Î±¿¼
Ú·
¸¾
«®²
α
¿¼
Í·³¾´·
¬ α¿¼
Ю·
²½»
±º
É¿´»
Ü
®·ª»
л²®¸§² α¿¼
Ó· ·́¬¿
®§Î
±¿¼
ӽݿ«´»
§ ͬ®
»»¬
б®¬Þ±¬¿²§
ÐÎÑÖÛÝÌ ßÎÛß
ÞïñÞî
Ï»²±
Þí
Þì
ð èðð³ìðð
Í·¬» ¾±«²¼¿®§
ᮬ Þ±¬¿²§ ¾±«²¼¿®§
п®µ ¿²¼ ®»»®ª»
Ó¿¶±® ®±¿¼
Ó·²±® ®±¿¼
ο·´©¿§
É¿¬»®½±«®»
Ю±°±»¼ ¬¿²µ
ÕÛÇ
Í×ÌÛ ÔÑÝßÌ×ÑÒ
Ú×ÙËÎÛ î
Û²ª·®±²³»²¬¿´ ׳°¿½¬ ͬ¿¬»³»²¬Ê±°¿µ Ì»®³·²¿´ô ᮬ Þ±¬¿²§ô Ò»© ͱ«¬¸ É¿´»
ÄЮ±
¶»½
¬Äê
ðí
ìì
ïê
çÄì
òÌ»
½¸
©±®µ
¿®»
¿Äì
òë Ù
®¿°¸
·½ÄÚ
×ÙË
ÎÛ
ÍÄÛ
×ÍÄê
ðí
ìì
ïê
ç Ú
î Í
·¬»
Ô±½
¿¬·
±²
ïí
ðè
îð
ïë
ÌÑ
λª
ß

AECOM Vopak Terminal B4Air Quality Impact Assessment
27-May-2016Prepared for – Vopak Terminals Pty Ltd – ABN: 67 004 754 750
5
2.1.3 Project Construction
The proposed construction timetable is for work to commence in Quarter 4, 2016 and be completed by early 2018.An indicative program of works for the construction phase, relative to the main construction activities, is shown inTable 4.Table 4 Proposed Timeline for Each Stage of Construction Activities
Item Description Start(Week)
Finish(Week)
Mobilisation
- Initial mobilisation of construction team to the site andestablishment of construction infrastructure such asconstruction office, car parking laydown areas.
- Establish construction site fencing and security measures.
1 9
Civil works - Modify site drainage to isolate and control runoff from theconstruction site;
- Bund wall sub base preparation;- Construct vertical bund walls;- Prepare for and construct tank foundation; and- Apply asphalt to remaining hardstand areas.
10 14
Tank works - Fabrication and installation of tanks in Site B4- Hydrostatic testing of tanks
15 54
Fire and safetysystems installation
- Piping installation for connection to fire ring main.- Installation of fire water sprays systems.- Installation of fire detection system.
23 54
Electrical works- Installation of electrical control systems- Connection to existing Vopak terminal management systems.- Connection to utility electrical supplies.
25 56
Commissioning- Testing and commissioning of fuel movement and storage
systems.- Testing and commissioning of fire management systems.
57 70
Activities that have the potential to result in airborne pollutants during the construction phase include earthmovingduring site preparation and handling of any excavated material. Prior to construction activities taking place, aConstruction Environmental Management Plan (CEMP) would be prepared to address the management ofpotential environmental impacts associated with construction activities. The CEMP would include measures tomanage and mitigate air quality and odour emissions. As the works would be intermittent in nature, theimplementation of an appropriate CEMP is expected to adequately mitigate any construction emissions from theSite as discussed in Section 9.1. As such, Construction emissions were not assessed quantitatively in the AQIA.
2.1.4 Project Operations
The Project would facilitate the following operations:
- Ship unloading to Site B4 directly from Bulk Liquid Berth 1 and 2 via Site B;
- Tank to tank transfers with Site B; and
- Tank recirculation.
The Project will be connected to the existing Site B Vopak Terminal truck load-out gantry. Vopak recently lodged amodification application for the Site B consent, which sought approval for the increase in throughput of the gantry.
The main emissions of interest for fuel storage activities are VOCs. VOCs are organic compounds with a vapourpressure exceeding 0.13 kPa at a temperature of 20oC. VOCs have been implicated as a precursor in theproduction of photochemical smog, which causes atmospheric haze, eye irritation and respiratory problems.VOCs can be emitted from storage tanks, filling stations vents, pipelines and process equipment leaks at plantassociated with fuel storage. The primary emission sources are storage tank and pipeline losses.

AECOM Vopak Terminal B4Air Quality Impact Assessment
27-May-2016Prepared for – Vopak Terminals Pty Ltd – ABN: 67 004 754 750
6
2.2 Vopak Site B 75W ModificationThe following section provides a brief description of the Vopak Site B 75W Modification, with the full details of theModification provided in the following report:
- PlanCom May (2015) Section 75W Modification – MP 06_0089 – Modification 2 – EnvironmentalAssessment, Vopak Terminals Sydney Pty Ltd, Site B Bulk Liquids Storage Terminal.
The existing Site B Terminal is adjacent to the Bulk Liquids Berths (BLB). At present the total annual approvedproduct throughput is 3,950,000 m3 (3,950 ML) and it is proposed to increase the total approved productthroughput to 7,800,000 m3 (7,800 ML).
The proposed changes to the Site B Facility as part of the 75W modification include the following:
- West Entry Northern Approach Roadways - requiring the need to lease an additional 2,870 m2 of land fromNSW Ports to the north and west of Site B plus the modification to the Simblist Road intersection withFriendship Road;
- Construction of Three New Road Tanker Loading Bays (Bays 7 & 8 and Bay 9);
- Installation of additional transfer pumps and product supply pipelines to existing RT Pump Manifolds;
- Construction of One Road Tanker Unloading Bay for Biofuels, Additives and other ancillary productstogether with RT unloading pumps;
- Construction of a New Drivers’ Amenities Building at Fishburn Road entrance;
- Ship Import debottlenecking of inlet manifolds, tank import pipelines and tank inlets, inclusive of tank-to-tankand tank recirculation piping and pump facilities as well as instrumentation for quantity and quality control toincrease flowrates;
- Ship debottlenecking of tank outlets, pipelines and transfer pumps as well as instrumentation for quantityand quality control to increase flowrates;
- Additional Ship connection Marine Loading Arm complete with berth and terminal import line and manifoldextensions to increase the number of simultaneous shipping operations;
- Civil, Structural, Piping, Electrical and Instrumentation Works for the above; and
- Increase in the size of the approved Warehouse (8m x 12m) near the Fire Pump House. The proposal is toextend the Warehouse to be 12m x 20m.
2.3 Bulk Liquid BerthsThe below provides a brief description of the Bulk Liquids Berths, with full details provided in the following report:
- SKM (2007) Bulk Liquids Berth No. 2 – Port Botany – Air Quality Impact Assessment.
Two Bulk Liquids Berths (BLB) at Port Botany, No’s 1 and 2 (BLB 1 and BLB 2), service the discharge and loadrequirements of the petrochemical industry in New South Wales. The BLB is a shared common user facilityoperated by NSW Ports. Hazardous and non-hazardous bulk liquids, petrochemicals and gases are transferredby pipeline to nearby industry storage facilities which are operated by private companies, including Vopak. Bulkliquids (which include VOC containing liquids such as petroleum) are discharged from the BLBs to the liquidstorage terminals via MLA connected to the Ship Manifold pipework.

AECOM Vopak Terminal B4Air Quality Impact Assessment
27-May-2016Prepared for – Vopak Terminals Pty Ltd – ABN: 67 004 754 750
7
2.4 Vopak BitumenThe below provides a brief description of the Vopak Bitumen facility, with full details provided in the followingreport:
- Pacific Environment Limited (2015) Vopak Terminals Sydney Pty Ltd – Air Quality Assessment For VopakBitumen Storage Facility - Vopak Terminals Sydney Pty Ltd.
The Vopak bitumen facility includes three 7,300 m3 tanks for the storage of bitumen products, gantry facilities forloading and in-line blending bitumen road tankers, a thermal oil and heating system and furnace and a dedicatedpipeline for bitumen unloading from ships. A vapour combustion unit treats large tank vapours during shipunloading operations and truck venting during filling.
The source characteristics, emission rates and other details of the Vopak Bitumen facility have been sourceddirectly from PEL 2015 (as provided in Appendix D). The source details have not been reproduced in this B4report.

AECOM Vopak Terminal B4Air Quality Impact Assessment
27-May-2016Prepared for – Vopak Terminals Pty Ltd – ABN: 67 004 754 750
8
3.0 Existing Environment
3.1 Air QualityThe pollutants of prime interest in NSW are ozone and particulates, with levels of these pollutants approaching orexceeding the national standards prescribed in the National Environment Protection Measure for Ambient AirQuality (NEPM) on occasion. The Vopak facility is not expected to generate significant levels of ozone orparticulates.
Port Botany is the major NSW port for the handling of containers, bulk liquids and petrochemicals. Theinternational and domestic airport terminals are located nearby, as are major arterial roads and the botany FreightRail line. Industrial uses dominate the surrounding area, including the sections of Banksmeadow and Matravilleabutting Port Botany.
No local monitoring of VOCs was identified at the time of preparation of this report. Despite this lack of relevantmonitoring data, a cumulative assessment utilising predicted local VOC concentrations (including adjacent VOCsources) has been undertaken (refer to Section 5.1).
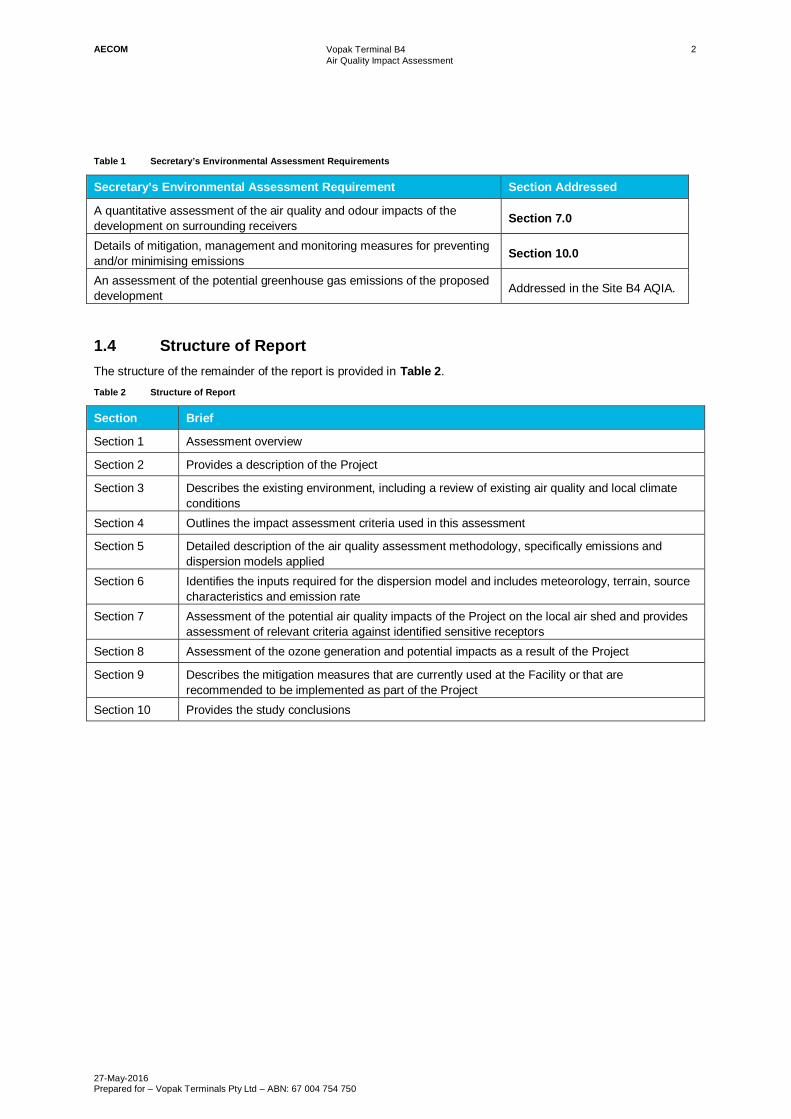
3.2 Regional MeteorologyThe Bureau of Meteorology (BOM) records long-term meteorological data at a number of automatic weatherstations around the country. The station that best represents the site is located at Sydney Airport, approximately4.5 kilometres northwest of the Vopak B4 site, across Botany Bay. A summary of the long-term data recorded atthis station is provided below; more data are provided in Appendix B.
The warmest temperatures occur between November and March, with the warmest average maximumtemperatures occurring in January (26.5ºC). The coldest temperatures are recorded in the winter months, with thelowest average minimum temperature occurring in July (7.2ºC).
The highest average rainfall is recorded in June (122.8 mm), while September is the driest month (60.2 mm).Humidity in the area is typically between 50 and 74 %. Average wind speeds range from 12.6 – 25.3 kilometresper hour, and are typically higher at 3 pm compared to 9 am. Winds are predominantly from the northwest at9 am, with also frequent winds from the western direction. At 3 pm, the winds swing around to predominantly blowfrom the northeast and southeast. Southerly winds are common both in the morning and afternoon.

AECOM Vopak Terminal B4Air Quality Impact Assessment
27-May-2016Prepared for – Vopak Terminals Pty Ltd – ABN: 67 004 754 750
9
4.0 Assessment CriteriaThe EPA specifies impact assessment criteria for a range of pollutants (DEC, 2005). The criteria and associatedaveraging periods for the pollutants considered in this assessment are shown in Table 5.The pollutants representthose included in the National Pollutant Inventory (NPI) TANKS database as being constituents of diesel andgasoline fuel for which the EPA has impact assessment criteria.Table 5 NSW EPA Assessment Criteria
Pollutant Criteria (mg/m3) AveragingPeriod Percentile Applicable location
Benzene 29 1 hour 99.9th At and beyond the boundary of the facility
Cumene 21 1 hour 99.9th At the nearest existing or likely off-sitesensitive receptor
Cyclohexane 19,000 1 hour 99.9th At and beyond the boundary of the facility
Ethylbenzene 8,000 1 hour 99.9th At and beyond the boundary of the facility
n-Hexane 3,200 1 hour 99.9th At and beyond the boundary of the facility
Toluene 360 1 hour 99.9th At the nearest existing or likely off-sitesensitive receptor
Xylenes 190 1 hour 99.9th At the nearest existing or likely off-sitesensitive receptor
Due to the proximity of local industrial receptors, all pollutant concentrations were assessed at the site boundaryof Site B and B4and beyond (with the exclusion of areas over water).
A level 2 assessment has been applied. The tank fuel throughputs and tank design data are site specific and themeteorological data was created specific for the project site. The meteorological data used included acombination of prognostic TAPM data and surface station data from the local area in accordance with theguidance document “Generic Guidance and Optimum Model Settings for the CALPUFF Modelling System forInclusion into the Approved Methods for the Modelling and Assessment of Air Pollutants in New South Wales”Barclay & Scire (2011). The data included surface information from Sydney Airport BoM station approximately5km to the northwest of the site and is considered appropriate for use in the assessment.
The VOC speciation data used were based on the Australian Government provided NPI default values. It isAECOMs experience that these values are considered to be conservative and would likely result in anoverestimation of actual emissions. Recent work on a similar tank farm showed a diesel liquid benzenepercentage composition of closer to 0.004% rather than the default NPI value of 0.03%, and a cumene value of0.02% compared to the default 0.96%.
Given the above information, the application of a level 2 assessment for the Project is considered a reasonableapproach.

AECOM Vopak Terminal B4Air Quality Impact Assessment
27-May-2016Prepared for – Vopak Terminals Pty Ltd – ABN: 67 004 754 750
10
5.0 Assessment Methodology
5.1 Cumulative Assessment MethodologyIn areas where significant pollutant levels may be expected due to emissions beyond that contributed by theproject seeking approval, a cumulative assessment may be required. The primary pollutants of concern in relationto the Project are VOCs. A review of operations in Port Botany identified that Vopak is likely to be a primarycontributor of VOCs in the immediate area. The operators in the adjacent area are identified on Figure 1.
In order to look at the cumulative impact of the entire Vopak Petroleum Site B facility and associatedinfrastructure, emissions from the BLB pipe loses, storage tanks from Site B (at the proposed 75W throughput),tanker loading gantry emissions from the existing Site B gantry (at the proposed 75W modification design), andstorage tanks from the proposed site B4 have been included in the dispersion model. In addition, the VopakBitumen emissions have been included in the model as it is also operated by Vopak. Vopak Site A wasdecommissioned in March 2014 and has therefore been assumed to have no contribution to the cumulativeimpact.
In addition to the modelled sources provided above, the assessment has also taken into consideration thepotential impacts from the following nearby notable emitters of VOCs, with a brief summary of each facilityprovided below:
- Terminals Pty Ltd Bulk Liquid Services; and
- Terminals Pty Ltd Bitumen Facility.
The identified facilities have undertaken air quality impact assessments in order to gain planning approval or inresponse to EPA directives for their current operational designs. The most recent reports prepared for the sites,and those that were used to estimate the background values for this Vopak assessment, are as follows with abrief summary of each facility provided below:
- Terminals Pty Ltd – Botany Stage 5B Expansion - Air Quality Impact Assessment, August 2013 GHD;
- Terminals Pty Ltd – Report for Port Botany Terminal Upgrade – Air Assessment, July 2008, GHD; and
- Terminals Pty Ltd – Report for Bitumen Import and Dispatch Facility, Port Botany – Air Assessment, April2011, GHD.
Terminals have owned and operated the existing bulk liquid storage and handling facility for hazardous and non-hazardous bulk liquids at Port Botany since 1979. The original facility has undergone three subsequentexpansions, each involving the construction of additional storage capacity. Terminals Pty Ltd provides bulk liquidstorage, handling and repackaging services, import shipping of hazardous and non-hazardous liquid chemicals.The facility is located at 45 Friendship Road Port Botany, and is adjacent to the B4 site to the north east. The siteincludes 65 tanks ranging in size from 200m3 to 8,000m3, with a total capacity of 53,000m3.
Terminals Bitumen is located on Simblist Road, Port Botany, and is adjacent to the Terminals liquid facility. Itcovers approximately 6,000m2 leased from Sydney Ports. The site has a storage capacity of 24,000m3 includingnine storage tanks and associated infrastructure, as well as a two bay truck loading gantry.
Each of the above facilities air assessments predicted VOC impacts in the area adjacent to their site, although thedata is often very limited. The data provided in the reports has been modified in order to be applicable to the B4assessment in the following ways.
Terminals Liquid Storage:
- The most recent air modelling for the Terminals Liquid Storage site was reported in GHD 2008 andassessed a total capacity of 72,780m3. Benzene emissions and impacts were reported primarily at fourresidential receptors, as well as reporting one ground level concentration (GLC) at or beyond the boundary.The maximum GLC reported was 15 ug/m3, however the provided contours show this to be over water. Theapproximate GLC at the boundary of the B4 site is shown as 5 ug/m3;
- In 2013 a qualitative assessment was undertaken to assess the increase in VOC emissions from theaddition of 12 new tanks on the site. The assessment reported an increase in VOC emissions from the siteof 0.7%. The GLC at the B4 boundary reported in GHD 2008 has therefore been factored up by 0.7% togain a final background benzene value for the Terminals liquid storage facility of 5.04 ug/m3; and

AECOM Vopak Terminal B4Air Quality Impact Assessment
27-May-2016Prepared for – Vopak Terminals Pty Ltd – ABN: 67 004 754 750
11
- Neither report provided speciated VOC impacts. The estimation of pollutants other than benzene has beenundertaken in accordance with the speciation profile provided in Section 6.4.3.
Terminals Bitumen Facility:
- The most recent air modelling for the Terminals Bitumen Facility was reported in GHD 2011 and assessedthe current approved operations. GLCs were estimated for several VOCs at the residential receptors andreported a maximum benzene value of 0.0077 ug/m3 at a residential receptor. GLC contours were providedfor benzene in the area adjacent to the site and showed a maximum value at the B4 boundary ofapproximately 0.002 ug/m3; and
- GLC contours were not provided for VOCs other than benzene. The ratio of each VOC to benzene from thereported residential GLCs were calculated and applied to the benzene B4 boundary GLC to gain thespeciated VOC concentrations. The estimation of pollutants other than benzene has been undertaken inaccordance with the speciation profile provided in Section 6.4.3.
A summary of the background values at the boundary of the Site B4 to be applied in the assessment are providedin Table 6.Table 6 Background Data Summary
Pollutant Criteria(mg/m3)
Predicted Maximum Ground Level Concentration (ug/m3)Terminals LiquidStorage Terminals Bitumen Total Background
Benzene 29 5.04 0.0020 5.04
Cumene 21 0.081 0.000032 0.081
Cyclohexane 19,000 4.25 0.0017 4.25
Ethylbenzene 8,000 0.46 0.0000086 0.46
n-Hexane 3,200 10.14 0.0040 10.14
Toluene 360 6.43 0.0022 6.43
Xylenes 190 1.99 0.0025 1.99
Given the reasonably low GLCs of the pollutants in Table 6, with the exception of benzene, these levels havebeen applied to all receptor locations at or beyond the boundary of the Vopak sites, including residentialreceptors. Benzene values were estimated at several sensitive receptors for the Terminals Liquid Storage Facilityand have been applied as the background for each. Where a sensitive receptor identified in this B4 assessmentwas not modelled, the value at the nearest sensitive receptor was applied. The Terminals Bitumen Facility onlyreported one maximum residential GLC. This GLC has been applied to all residential receptors. A summary ofbenzene background values for each residential receptor identified is provided in Table 7; details of the receptorsare provided in Section 5.6.

AECOM Vopak Terminal B4Air Quality Impact Assessment
27-May-2016Prepared for – Vopak Terminals Pty Ltd – ABN: 67 004 754 750
12
Table 7 Benzene Residential Receptor Background Data
ReceptorID Receptor Description
Ground Level Concentration (ug/m3)TerminalsLiquid Storage
TerminalsBitumen
TotalBackground
1 Matraville Public School, Matraville 2.62 0.0077 2.63
2 St Agnes Primary School, Matraville 2.62 0.0077 2.63
3 Matraville High School, Chifley 2.62 0.0077 2.63
4 St Andrews Primary School, Malabar 2.62 0.0077 2.63
5 Malabar Public School, Malabar 2.62 0.0077 2.63
6 23 Adina Avenue, Phillip Bay 4.63 0.0077 4.64
7 61 Yarra Road, Phillip Bay 4.63 0.0077 4.64
8 52 Eyre Street, Chifley 2.62 0.0077 2.63
9 26 Moorina Avenue, Matraville 2.62 0.0077 2.63
10 5 Clonard Way, Little Bay 4.63 0.0077 4.64
11 Botany Golf Club, Banksmeadow 1.91 0.0077 1.92
12 Elaroo Avenue, Yarra Point 4.63 0.0077 4.64
13 La Perouse Point, ANZAC Parade 3.83 0.0077 3.83
5.2 Sources Assessed in the Dispersion ModelIn order to look at the cumulative impact of the entire Vopak Petroleum Site B facility, directly associatedinfrastructure, and Vopak Bitumen Facility, the following operations were included in the air dispersion model:
- Proposed Site B4 storage tank emissions;
- Bulk Liquids Berth 1 and 2 fugitive emissions;
- Existing Site B storage tank emissions (inclusive of B1, B2 & B3) and the proposed 75W modification designand throughput of 7,800ML per year;
- Existing Site B tanker loading gantry emissions with the modifications as proposed in the 75W modification,specifically the operation of 9 loading bays with the existing VRU system;
- Vopak Bitumen vapour combustor unit; and
- Vopak Bitumen storage tank breathing losses.
The source characteristics, emission rates and other details of the Vopak Bitumen facility have been sourceddirectly from PEL 2015 (as provided in Appendix D). Scenario 6 was chosen as it best represents typicaloperations; operating the Vapour Control Unit (VCU) only during transfers from a ship, the emissions from tworoad tanker loading activities via the VCU and fugitive emissions. It was assumed that bypass of the VCU wouldnot occur under typical operations. The source details have not been reproduced in this B4 report. The 2015report was prepared for the EPA and have therefore been assumed to be valid and fit for purpose. As such, noefforts have been made to review or validate the information provided in the report.
5.3 Emission and Dispersion Models5.3.1 TANKS Emission Model
Emission rates for the fuel storage tanks were generated using the TANKS program. TANKS is a Windows-basedcomputer software program that estimates VOC and hazardous air pollutant (HAP) emissions from fixed- andfloating-roof storage tanks. TANKS is based on the emission estimation procedures from Chapter 7 of EPA'sCompilation Of Air Pollutant Emission Factors (AP-42). TANKS uses chemical, meteorological, roof fitting, and rimseal data to generate emissions estimates for several types of storage tanks including:

AECOM Vopak Terminal B4Air Quality Impact Assessment
27-May-2016Prepared for – Vopak Terminals Pty Ltd – ABN: 67 004 754 750
13
- Vertical and horizontal fixed roof tanks;
- Internal and external floating roof tanks;
- Domed external floating roof tanks; and
- Underground tanks.
5.3.2 TAPM Meteorological Model
TAPM predicts three-dimensional meteorology, including terrain-induced circulations. TAPM is a PC-basedinterface that is connected to databases of terrain, vegetation and soil type, leaf area index, sea-surfacetemperature, and synoptic-scale meteorological analyses for various regions around the world. TAPM is used topredict meteorological parameters at both ground level and at heights of up to 8,000 m above the surface; thesedata are required by the CALPUFF model. The TAPM output file requires processing through a program such asCALTAPM to generate a file that is used within CALMET to generate the three-dimensional wind fields requiredby the CALPUFF dispersion model.
The NSW EPA has released guidance documentation (Barclay and Scire, 2011) on the optimum settings for theuse of the CALPUFF modelling system. One modelling approach provided in the document is the use of a ‘HybridMode’ whereby numerical prognostic three-dimensional meteorological model data, in a 3D.DAT file, along withsurface observation data gained from a representative nearby surface monitoring station, are combined. TheCALTAPM program converts the TAPM data into a 3D.DAT file, which can be input directly into the CALMETmeteorological processer.
5.3.3 CALPUFF Air Dispersion Model Suite
Various air dispersion models are required for the successful modelling of air quality impacts from the Site. Theseare: The Air Pollution Model (TAPM), which is used to generate prognostic meteorological data; CALTAPM, whichis used to process the TAPM output into a format suitable for input into the CALMET model; CALMET, whichgenerates three-dimensional wind fields used in the dispersion modelling; CALPUFF, which predicts themovement and concentration of pollutants; and CALPOST, which is used to process the CALPUFF output files.
CALPUFF is the NSW EPA model of choice for areas that are affected by coastal breezes, coastal fumigation orcomplex terrain. The Project site is located in a coastal area and, hence, the CALPUFF model was chosen for usein the AQIA. The CALPUFF modelling system consists of three main components and a set of pre-processing andpost-processing programs. The main components of the modelling system are CALMET (a diagnostic three-dimensional meteorological model), CALPUFF (an air quality dispersion model), and CALPOST (a post-processing package). The main CALPUFF related software package programs are described in the followingsections.
5.3.3.1 CALMET
CALMET is a meteorological model that develops hourly wind and temperature fields on a three-dimensionalgridded modelling domain. Associated two-dimensional fields such as mixing height, surface characteristics anddispersion properties are also included in the file produced by CALMET. CALMET produces a meteorological filethat is used within the CALPUFF model to predict the movement of pollution.
5.3.3.2 CALPUFF
CALPUFF is a non-steady-state three-dimensional Gaussian puff model developed for the US EnvironmentalProtection Agency (US EPA) and approved by the NSW EPA for use in situations where basic Gaussian plumemodels are not effective, such as areas with complex meteorological or topographical conditions, including coastalareas with re-circulating sea breezes. The CALPUFF model substantially overcomes the basic limitations of thesteady-state Gaussian plume models, and as such, was chosen as the most suitable dispersion model for theAQIA and Site Model. Some examples of applications for which CALPUFF may be suitable include:
- Near-field impacts in complex flow or dispersion situations:
· Complex terrain;
· Stagnation, inversion, recirculation, and fumigation conditions;
· Overwater transport and coastal conditions; and
· Light wind speed and calm wind conditions.

AECOM Vopak Terminal B4Air Quality Impact Assessment
27-May-2016Prepared for – Vopak Terminals Pty Ltd – ABN: 67 004 754 750
14
- Long range transport;
- Visibility assessments and Class I area impact studies;
- Criteria pollutant modelling, including application to development applications;
- Secondary pollutant formation and particulate matter modelling; and
- Buoyant area and line sources (e.g. forest fires and aluminium reduction facilities).
5.3.3.3 CALPOST
The CALPOST program is used to process the outputs of the CALPUFF program into a format defined by theuser. Results can be tabulated for selected options including percentiles, selected days, gridded results ordiscrete locations, and can be adjusted to account for chemical transformation and background values.
The program default settings were used for the CALPOST program, ensuring that the correct averaging periods,percentiles and receptors were selected to meet the NSW EPA ambient pollutant criteria assessed (DEC, 2005).
5.4 Model SetupA summary of the data and parameters used as inputs to TAPM, CALMET and CALPUFF is shown in Table 8.Details of the TANKS inputs (and outputs) are provided in Appendix B. The CALMET and CALPUFF settingshave been chosen in accordance with the following documents:
- Barclay & Scire (2011). Generic Guidance and Optimum Model Settings for the CALPUFF Modelling Systemfor Inclusion into the Approved Methods for the Modelling and Assessment of Air Pollutants in New SouthWales; and
- DEC (2005). Approved Methods for the Modelling and Assessment of Air Pollutants in New South Wales.Table 8 Summary of Model Input Parameters
Parameter Input
TAPM
Horizontal resolution 40 x 40 grid points; outer grid spacing 30,000 m x 30,000 m with aninner grid spacing of 1,000 metres.
Grid centre coordinates 33 deg 59 min E, 151 deg 13 min S
Vertical levels Defaults
Land use data Default TAPM database
Simulation length 1 January – 31 December 2014CALMET (v6.42)
Meteorological grid domain 35 km x 35 km
Meteorological grid resolution 250 metre resolution (140 x 140 grid cells)
Reference grid coordinate (centre) 335182 E, 6238801 S
Cell face heights in vertical grid 0, 20, 40, 80, 160, 320, 640, 1200, 2000 and 3000 m
Simulation length 1 year (2014)
Surface meteorological stations Sydney Airport (BoM) 2014
Upper air meteorological station No upper air stations. The 3-dimensional gridded prognostic datafrom TAPM (M3d) were used as the initial guess wind-field forCALMET
Terrain and land use data Terrain elevations were extracted from the NASA Shuttle RadarTopography Mission Version 3 data set (SRTM1 30 metre resolution).Land use data taken from GLCC Australia Pacific (~1 km resolution)
TERRAD (Terrain radius of influence) 10km

AECOM Vopak Terminal B4Air Quality Impact Assessment
27-May-2016Prepared for – Vopak Terminals Pty Ltd – ABN: 67 004 754 750
15
Parameter Input
RMAX1 (Radius of influence ofmeteorological stations: surface) 1km
RMAX2 (Radius of influence ofmeteorological stations: aloft) 10km
R1 (Observation weighting: surface) 5
R2 (Observation weighting: aloft) 20
IEXTRP (Vertical extrapolation of surfacewind observation)
- 4 (extrapolate using similarity theory, exclude upper air observationsfrom layer 1)
BIAS (NZ) (Layer dependent weightingfactor for initial guess field) 0 (default)
CALPUFF (v7.2.1)
Computational grid 10 km x 10 km approximately centred on the site
Sampling grid 4 km x 4 km with a nesting factor of 5 (~49 metres spacing),approximately centred on the site; converted to discrete receptors
Number of sensitive receptors The sampling grid was converted to discrete receptor locations. Anadditional 13 residential receptors have been included as discussedpreviously.
Dispersion option Dispersion coefficient. use turbulence computed frommicrometeorology
Meteorological modelling period 1 January 2014 – 31 December 2014
The CALMET settings have been selected in accordance with Barclay & Scire 2011. A review of the preparedCALMET meteorological data using the above settings, as provided in Appendix B, shows a strong correlationbetween measured surface patterns and predicted data. It is therefore concluded that the meteorological dataused in the assessment is fit for purpose.
Note that the CALMET meteorological file has been updated since the initial Vopak B4 assessment in order toaccommodate the release of the 30m SRTM data and to further align with Barclay & Scire 2011.
5.5 Assessment ScenariosThe dispersion modelling was undertaken for maximum typical operating conditions. The scenario has beencreated by selecting a representative number of fuel loading arms for the tankers per hour, together with theexpected loading time of a tanker and the selection of representative residual tanker fuels (resulting in remnantvapours in the empty tankers). Combustible refers to diesel while flammable refers to petroleum.
The details of the operational parameters adopted for the modelling scenario are as follows (further details areprovided in Section 6.4):
- Continuous operation of the Facility (24 hours per day, 7 days per week, 365 days per year);
- A VRU with an efficiency of 93.57 percent as identified in site testing (Ektimo 2015, Appendix D);
- Storage tank emissions calculated using TANKS based on the tank designations in Section 6.4.2;
- A total of 9 gantry bays (6 existing and 3 proposed), loading 3.5 tankers per hour per bay, with an averagetruck loaded volume of 36m3, with a calculated total flow of 1,134m3/hr; and
- Residual fuel in tankers ratio of 1/3 combustible (diesel) to 2/3 flammable (petroleum).
Advice from Vopak suggests that 3.5 tankers per bay per hour is a conservative normal operating maximum, andthat generally there is likely to be less than this value resulting in lower emissions.

AECOM Vopak Terminal B4Air Quality Impact Assessment
27-May-2016Prepared for – Vopak Terminals Pty Ltd – ABN: 67 004 754 750
16
Further details of the calculation method are provided in Section 6.4.3. It is envisaged that by looking at hourlytanker loading information that the best hourly emissions assessment would be achieved, avoiding the possibleremoval of peak emissions if an annual averaged mass calculation was applied.
5.6 Sensitive ReceptorsAs indicated in Section 4.0, the impact assessment criteria for the pollutants assessed are applied either at thesite boundary and beyond or at the closest existing or future sensitive receptor, depending on the pollutant. Inorder to provide a thorough assessment of pollutant concentrations surrounding the facility, a grid 4 km x 4 kmwith a 50 metre spacing, centred approximately on the site, was assessed. Additionally, receptors were placedalong the approximate boundary of the Project. Concentrations predicted at on-site locations were excluded fromthe results. The receptors are shown in Figure 2 indicated as blue crosses.
Sensitive receptors are generally defined as residential areas, hospitals, schools and similar facilities. In additionto the above gridded receptors and boundary receptors, sensitive receptors have been selected and identified inaccordance with previous assessments for consistency. The sensitive receptors assessed are summarised inTable 9 and shown in Figure 2.Table 9 Residential Sensitive Receptors
Receptor # Receptor DescriptionX Coordinate Y Coordinatem m
1 Matraville Public School, Matraville 336377 6241348
2 St Agnes Primary School, Matraville 336628 6241013
3 Matraville High School, Chifley 337889 6240355
4 St Andrews Primary School, Malabar 338106 6240430
5 Malabar Public School, Malabar 338156 6240701
6 23 Adina Avenue, Phillip Bay 337019 6238494
7 61 Yarra Road, Phillip Bay 336641 6238493
8 52 Eyre Street, Chifley 337049 6239809
9 26 Moorina Avenue, Matraville 336345 6240209
10 5 Clonard Way, Little Bay 337171 6239080
11 Botany Golf Club, Banksmeadow 334852 6240659
12 Elaroo Avenue, Yarra Point 336468 6238404
13 La Perouse Point, ANZAC Parade 336621 6237803

AECOM Vopak Terminal B4Air Quality Impact Assessment
27-May-2016Prepared for – Vopak Terminals Pty Ltd – ABN: 67 004 754 750
17
Figure 2 Sensitive Receptor Locations

AECOM Vopak Terminal B4Air Quality Impact Assessment
27-May-2016Prepared for – Vopak Terminals Pty Ltd – ABN: 67 004 754 750
18
6.0 Dispersion Model InputsThe inputs used in the modelling are described in the following sections.
6.1 MeteorologyThe meteorological data are used by the CALPUFF model in different ways to estimate the dispersion of airpollutants:
- Ambient temperature is used to incorporate thermal buoyancy effects when calculating the rise anddispersion of pollutant plumes;
- Wind direction determines the direction in which pollutants will be carried;
- Wind speed influences the dilution and entrainment of the plume into the air continuum;
- Atmospheric stability class is a measure of atmospheric turbulence and the dispersive properties of theatmosphere. Most dispersion models utilise six stability classes, ranging from A (very unstable) to F(stable/very stable); and
- Vertical mixing height is the height at which vertical mixing occurs in the atmosphere.
Meteorological data for the period January – December 2014 were used in this assessment. Prognosticmeteorological data were generated using TAPM for upper air conditions for a 40 km x 40 km grid with a 1 km gridspacing centred close to the Vopak site. The TAPM output (processed using CALTAPM) was then used, withsurface station data from the Bureau of Meteorology monitoring station at Sydney Airport, as input into theCALMET meteorological module to compute the wind fields used by CALPUFF. Sydney Airport is approximately5 kilometres northwest of the Vopak site, across Botany Bay. Analyses of the meteorological data used in themodelling are provided in Appendix B. The analysis concluded that the data were considered to berepresentative of meteorological conditions around the site.
For the TANKS model, the Australian database was used. The database contains meteorological data for SydneyAirport, which were selected for this assessment.
6.2 TerrainDigital terrain data used to generate the upper air prognostic meteorological data were obtained from the TAPM 9second DEM database covering an area of 40 km by 40 km on a 1 km grid, roughly centred on the Vopak facility.For the CALMET model, the geophysical processor was used to convert land use and terrain data from WebGIS(SRTM1 for terrain at approximately a 30 metre resolution) and GLCC Australia Pacific (approximate 1 kilometreresolution) throughout the meteorological domain.
6.3 Building Wake EffectsThe dispersion of pollutants emitted from stack sources may be affected by aerodynamic wakes generated bywinds having to flow around buildings. Building wakes generally decrease the distance downwind at which stackplumes comes into contact with the ground, which may result in higher ground level pollutant concentrationscloser to the emission source.
The Site B VRU is a point source, while the storage tank emissions have also been assessed as point sources inorder to adequately assess potential building wake affects. The Prime building wake algorithm was used in theassessment as per EPA guidance (DEC 2005). All storage tanks and dominant structures have been included inthe model.
6.4 Source CharacteristicsFuel storage tanks are sources of fugitive emissions. Details of the tank parameters and emission rates areprovided in the following sections.

AECOM Vopak Terminal B4Air Quality Impact Assessment
27-May-2016Prepared for – Vopak Terminals Pty Ltd – ABN: 67 004 754 750
19
6.4.1 Bulk Liquid Berths
There are now two Bulks Liquids Berths, No’s 1 and 2 (BLB 1 and BLB 2). BLB 2 was approved by the NSWDepartment of Planning in 2008 and NSW Ports officially opened on 21 February 2014 to cater for growingdemand in this industry sector. The Bulk Liquids Berth at Port Botany services the discharge and loadrequirements of the petrochemical industry in New South Wales. Hazardous and non-hazardous bulk liquids,petrochemicals and gases are transferred by pipeline to nearby industry storage facilities which are operated byprivate companies.
Bulk liquids (which include VOC containing liquids such as petroleum) will be discharged from the BLBs to theliquid storage terminals via flexible hoses or marine loading arms (MLA) for petroleum products connected to theShip Manifold discharge pipework. VOC emissions have been estimated for the valves and flanges associatedwith BLB operations. Emissions were estimated using the Emission Estimation Technique Manual for PetroleumRefining (Commonwealth Government, 1999). Screening information was not available, and as such averageemission factors were used together with the number of fittings for the berth. The parameters applied in theassessment are consistent with those in the approved document Bulk Liquids Berth No. 2 – Port Botany – AirQuality Impact Assessment (SKM 2007).
6.4.2 Storage Tanks
The storage tanks would be designed to AP1650 and operated in accordance with the requirements of AS 1940;The storage and handling of flammable and combustible liquids. In complying with these standards, the followingsafety features would be installed:
- Tank level instruments (high and low) with independent high/low alarms;
- Tank vents with anti-flash gauze to prevent potential for sparking and ignition from external sources;
- Multi-level temperature measurements; and
- Water draining facilities to prevent water build up in the tank and potential corrosion in the tank base.
The TANKS emissions estimation model was used to calculate the predicted total VOC emissions from thestorage tanks using the parameters provided in Table 10. Input and output data from the TANKS model isprovided in Appendix C. The tanks types listed are defined as Vertical Fixed Roof Tank (VFR) and DomedExternal Floating Roof (DEFR).Table 10 Storage Tank Details
Tank ID No. Product Tank Type Tank Diameter (ft) Volume(gal) Throughput(gal/yr)
Site B
101 Jet DEFR 118.1 4650462 68899241
102 Jet DEFR 118.1 4650462 68899241
103 Jet DEFR 118.1 4650462 68899241
104 Avcat (Jet) DEFR 65.6 1433554 21238909
105 98 DEFR 65.6 1434610 41949872
206 95 DEFR 91.9 2822457 77208946
207 95 DEFR 91.9 2812682 77208946
208 98 DEFR 91.9 2818230 82593160
309 98 DEFR 39.4 511229 14960008
310 Bio Diesel DEFR 39.4 510964 8011640
311 98 DEFR 39.4 510700 14960008
312 91 DEFR 39.4 510964 13007287
621 Diesel DEFR 120 6393659 155206146
622 Diesel DEFR 120 6393659 155206146

AECOM Vopak Terminal B4Air Quality Impact Assessment
27-May-2016Prepared for – Vopak Terminals Pty Ltd – ABN: 67 004 754 750
20
Tank ID No. Product Tank Type Tank Diameter (ft) Volume(gal) Throughput(gal/yr)
623 Jet DEFR 120 6393659 94725691
624 Ethanol DEFR 62.6 1741083 18369752
625 Ethanol DEFR 49.2 800624 8443396
726 91 DEFR 123.8 6801321 173047328
727 91 DEFR 88.6 3479260 88523493
728 98 DEFR 88.6 3479260 101813098
729 91 DEFR 123.8 6801321 173047328
730 98 DEFR 54.1 1299339 38022387
940 Diesel DEFR 114.8 5846499 141923835
941 ULP DEFR 65.6 1909115 48567259
942 91 DEFR 117.8 6150859 156497489
943 Diesel DEFR 117.8 6150859 149312160
Site B4
110-01 Diesel VFR 142.71 9246020 221904480
110-02 Diesel VFR 142.71 9246020 221904480
110-03 Diesel VFR 142.71 9246020 221904480
110-04 ULP DEFR 134.51 8221033 197304792
110-05 ULP DEFR 134.51 8221033 197304792
110-06 ULP DEFR 95.14 4247886 101949264
110-07 ULP DEFR 95.14 4247886 101949264VFR - Vertical Fixed Roof TankDEFR - Domed External Floating Roof
Site operations also encompass the use of additive and slops tanks. These tanks are small in size and have anextremely low turnover when compared to the large storage tanks. The additives used on site are not volatileorganic liquids due to their low vapour pressure. Any emissions from this source would be negligible and havenot been quantitatively reviewed in this assessment.
The product component databases prepared for Australian fuel for the NPI were used for the TANKS modelling.The default values of the fuel type compositions were compared against the values in the current NPI EmissionEstimation Technique Manual. The diesel values were found to be the same, and were used for the TANKSemission estimations. The database did not contain default values for gasoline; as such, the unleaded petrolvalues published in the NPI EET (DSEWPC, 2012) were entered manually into the TANKS program and used tocalculate emissions from the proposed gasoline tanks. A copy of the TANKS output is provided in Appendix C.
Site B and B4 Storage tank emission rates were calculated using the TANKS emission estimation model. Thefuel throughput of each tank was evenly allocated to each month of the year within TANKS and the outputsprovided in monthly emission rates to account for seasonal atmospheric influences. The monthly emission rateswere estimated in kilograms per month and calculated back to grams per second (g/s) for each month for use inthe dispersion model and are provided in Appendix C.

AECOM Vopak Terminal B4Air Quality Impact Assessment
27-May-2016Prepared for – Vopak Terminals Pty Ltd – ABN: 67 004 754 750
21
Table 11 Fuel Composition – Substance Proportions (NPI)
SubstanceTypical Liquid Composition (%)
Diesel (ADO) UnleadedPetrol (ULP) 95 98 Jet Kerosene
Benzene 0.03 0.933 1.003 1.007 0.367
Cumene 0.975 0.100 0.120 0.170 2.830
Cyclohexane 0.010 0.765 0.990 1.100 1.200
Ethylbenzene 0.110 1.533 1.763 1.805 0.517
n-Hexane 0.010 1.830 1.520 2.025 4.650
Toluene 0.100 5.603 7.093 19.650 0.180
Xylenes 0.345 7.747 8.980 9.730 1.880
Source: Table 2: Minimum amount of individual substances in fuel stored to trip the Category 1 reporting threshold (10 tonnes),DSEWPC (2012).
The monthly emissions of the above pollutants in pounds were converted to an emission rate for each tank ingrams per second assuming constant emissions (24/7/365). These were used as the emission rates in CALPUFFas an hourly varying emissions file. Each tank was modelled as a point source at the peak of the tank in order toadequately account for building wake influences. The model was set with no vertical momentum as the pipesgenerally exhaust in a down facing position.
6.4.3 Site B Gantry Vapour Emissions
Emissions from the truck filling gantries are generated when tankers are filled with fuel on site; as the tankers areloaded residual vapours from the empty tankers are expelled and captured by the gantry system. The compositionof the expelled vapours is dependent on the previous contents of the tanker. The tanker being filled at the Facilitymay have previously contained either combustibles (i.e. diesel) or flammables (i.e. petroleum), resulting inresidual vapours from either of these fuels. Flammable fuels generally have higher concentrations of VOCs thancombustible fuels.
After the vapour within the empty tanker is displaced and collected by the gantry vapour collection system (VCS),it is directed to the VRU. The volumetric flow rate of the gantry VRU emissions is dependent on the road tankerfilling activities at that time, that is, the rate at which the air is displaced in the road tanker, tank compartment isthe driver of the air flow through the VRU. The typical operational scenario modelled assumes a flow rate of1,134m3/hr and together with the diameter was used to calculate the velocity. The VRU stack emissioncharacteristics are provided in Table 12.Table 12 Vopak Site B VRU Stack Emission Parameters
Parameter Units Value
Temperature ºC Assumed ambient
Height above ground m 10
Internal exhaust diameter m 0.2
Velocity m/s 10.03
The modelling has assumed a stack venting 10m above ground level with vertical momentum i.e. no witches’ hat,T-junctions or other units that may limit the stacks vertical velocity. Vopak has confirmed that the approved andbuilt Site B 75W modification design would meet this stack height and orientation requirement.
The volumetric flow rate of the displaced tanker vapour is used to calculate the emission rate for the pollutants ofconcern using sample vapour concentration data collected for a similar facility (AECOM 2015b). The studycollected samples directly from the tanker vapour outlet lines in June 2015; sampling was undertaken before anymitigation measures. Two samples were collected from combustible tankers and four from flammable tankers

AECOM Vopak Terminal B4Air Quality Impact Assessment
27-May-2016Prepared for – Vopak Terminals Pty Ltd – ABN: 67 004 754 750
22
using Summa Canisters and sent to the NATA-certified ALS laboratories (accreditation number 825) for analysisof VOC composition in accordance with USEPA method TO-15.
The sampling results are summarised in Table 13. The maximum combustible value was applied, while the upperquartile value from flammables was used in the assessment and presented in the table.Table 13 Gantry Sample Concentration Summary (pre- VRU) (AECOM 2015b)
Fuel Type*Concentration (mg/m3)
Benzene Cumene Cyclo-hexane
Ethyl-benzene Hexane Xylenes Toluene
Combustible 26 4 78 27 143 114 90
Flammable 613 44 650 473 2625 7440 2060*denotes the fuel type that was previously carried by the road tanker prior to entering the measured bay
The concentrations shown in Table 13 were used with the source parameters provided in this AQIA to estimateemissions of individual VOCs from the gantry, together with a VRU efficiency of 93.57 per cent (Ektimo 2015).
6.4.4 Fugitive Emissions
Fugitive emissions from Site B and B4 storage tank pipe networks were estimated using the Emission EstimationTechnique Manual for Petroleum Refining (Commonwealth Government, 1999). Screening information was notavailable, and as such average emission factors were used together with the estimated number of fittings. Theemission factor and number of fittings applied are summarised in Table 14 and were used to estimate the TVOCemission rate in g/s, which was then speciated to individual compound emission rates. Fugitive emissions weremodelled as volume sources located at various locations on each site.Table 14 Pipeline Parameters – Site B and B4
Pipe Loss Source EmissionFactor (kg/hr)
Count of sourcesB1 B2 B3 B4
Connections / flanges 0.00006 600 250 450 439
Valves 0.0017 120 50 90 285
Pump seals 0.012 1.2 0.5 0.9 4
Compressors 0.0894 0 0 0 0
Pressure relief valves 0.0447 0 0 0 0
Open ended lines 0.0015 0 0 0 0
6.5 Emission RatesThe storage tank monthly emission rates were estimated in kilograms per month and calculated back to gramsper second (g/s) for each month for use in the dispersion model. The emission rates for the assessed project SiteB4 are provided in Appendix C. Due to the number of tanks on Site B, the monthly emission rates are notprovided in this report. The estimated emission rates for all other sources are provided in Table 15.

AECOM Vopak Terminal B4Air Quality Impact Assessment
27-May-2016Prepared for – Vopak Terminals Pty Ltd – ABN: 67 004 754 750
23
Table 15 Modelled Emission Rates
Facility Source EmissionBenzene Cumene Cyclohexane Ethylbenzene n-Hexane Toluene Xylenesg/s g/s g/s g/s g/s g/s g/s
VOPAK Site B
Gantry VRU 8.46E-03 3.20E-04 9.31E-03 6.57E-03 3.64E-02 1.01E-01 2.84E-02
Pipe losses 4.81E-09 3.02E-10 4.65E-09 3.76E-09 1.53E-08 4.60E-08 9.80E-09
Tank Venting Varying TANKS output
VOPAK Site B4Pipe losses 4.87E-09 3.07E-10 4.71E-09 3.81E-09 1.55E-08 4.66E-08 9.94E-09
Tank Venting Varying TANKS output
BLB1 Pipe losses 5.43E-03 3.42E-04 5.26E-03 4.25E-03 1.73E-02 5.20E-02 1.11E-02
BLB2 Pipe losses 5.43E-03 3.42E-04 5.26E-03 4.25E-03 1.73E-02 5.20E-02 1.11E-02
VOPAK Bitumen
Vapour Combustion Unit 1.37E-05 8.62E-07 1.33E-05 1.07E-05 4.37E-05 1.31E-04 2.79E-05
Tank 1 7.07E-06 4.45E-07 6.84E-06 5.53E-06 2.25E-05 6.76E-05 1.44E-05
Tank 2 9.19E-08 5.78E-09 8.89E-08 7.19E-08 2.93E-07 8.79E-07 1.87E-07
Tank 3 2.91E-06 1.83E-07 2.81E-06 2.28E-06 9.28E-06 2.78E-05 5.93E-06
Gantry Fugitive 9.13E-06 5.75E-07 8.83E-06 7.15E-06 2.91E-05 8.74E-05 1.86E-05

AECOM Vopak Terminal B4Air Quality Impact Assessment
27-May-2016Prepared for – Vopak Terminals Pty Ltd – ABN: 67 004 754 750
24
6.6 Limitations and Conservatism of Dispersion ModellingThe atmosphere is a complex, physical system, and the movement of air in a given location is dependent on anumber of variables, including temperature, topography and land use, as well as larger-scale synoptic processes.Dispersion modelling is a method of simulating the movement of air pollutants in the atmosphere usingmathematical equations. The model equations necessarily involve the current understanding of the complexenvironmental interactions and chemical reaction processes involved, available input data, processing time anddata storage limitations. The model configuration particularly affects model predictions during certainmeteorological conditions and source emission types. For example, the prediction of pollutant dispersion underlow wind speed conditions (typically defined as those less than 1 m/s) or for low-level, non-buoyant sources, isproblematic for most dispersion models. To accommodate these effects, the model is configured to provideconservative estimates of pollutant concentrations at particular locations.
The results of dispersion modelling, therefore, provide an overly conservative indication of the worst likely level ofpollutants within the modelling domain. While the models, when used appropriately and with high quality inputdata, can provide very good indications of the scale of pollutant concentrations and the likely locations of themaximum concentrations occurring, their outputs should not be considered to be representative of exact pollutantconcentrations at any given location or point in time.
Information from literature sources have been used in this assessment, specifically adjacent facility air qualityassessments. These reports were prepared for the EPA for the purposes of Development Applications orresponding to a Pollution Reduction Program notice and have therefore been assumed to be valid and fit forpurpose. As such, no further validation of the information provided in these reports has been undertaken for thisassessment.

AECOM Vopak Terminal B4Air Quality Impact Assessment
27-May-2016Prepared for – Vopak Terminals Pty Ltd – ABN: 67 004 754 750
25
7.0 Dispersion Modelling ResultsThe NSW EPA’s assessment criteria for the assessed pollutants apply to the 99.9th percentile for site-specificassessments, such as this AQIA. The data are presented for principle air toxics, individual air toxics andindividual odorous air pollutants assessed at or beyond the plant boundary. Although individual odorous airpollutants are generally assessed at the nearest sensitive receptor, given the proximity of industrial receptors, ator beyond the boundary was conservatively assessed.
An additional assessment of the residential sensitive receptors has been provided to clarify any impact the Projectmay have on the local residential community.
7.1 Typical Maximum Operational AssessmentThe predicted maximum cumulative ground level concentrations for typical maximum operations at or beyond thesite boundary, including residential receptors, resulting from the dispersion model are summarised in Table 16.The data is provided for the maximum cumulative impact at any modelled receptor, with predicted concentrationisopleths for all pollutants provided in Appendix E. The maximum cumulative value has been further broken upinto its source contributions from Site B4, Site B, Vopak Bitumen & BLB pipe losses, and the background valuesas identified in Section 5.1.Table 16 Maximum Cumulative Predicted Ground Level Concentrations At or Beyond the Site Boundary 99.9th Percentile (mg/m3)
Pollutant Criteria(mg/m3)
Maximum Predicted 99.9th Percentile Concentration (mg/m3)
Cumulative% of CriteriaCumulative*
Contribution to Cumulative
Site B4 Site BVopakbitumen &BLB1/2
Background
Benzene 29 25.41 0.414 19.96 <0.0001 5.04 88%
Cumene 21 15.7 0.0005 0.0003 0.08 15.81 75%
Cyclohexane 19,000 23.06 0.197 18.61 <0.0001 4.25 <1%
Ethylbenzene 8,000 15.66 <0.0001 15.20 <0.0001 0.46 <1%
n-Hexane 3,200 73.53 0.496 62.89 0.0081 10.14 2%
Toluene 360 197.92 0.537 190.95 <0.0001 6.43 55%
Xylenes 190 42.19 0.452 39.75 <0.0001 1.99 22%* Cumulative concentrations are the sum of contemporaneous impacts from Site B4, Site B, Vopak bitumen & BLB1/2 andbackground.
As shown, the predicted maximum cumulative pollutant concentrations were all below their respectiveassessment criteria. The following observations can be made:
- The cumulative contribution predicts that benzene would have the highest contribution of the EPA criteriarepresenting 88%. The predicted benzene isopleth for the area dajcent to the site is provided in Figure 3;
- The Site B4 contribution to this maximum cumulative benzene value is 1.4% of the EPA criterion, with theSite B contributing the highest proportion; and
- As shown in the figures provided, the maximum cumulative impact for all pollutants except cumene waslocated at the boundary of Site B adjacent to the VECS; and
- The maximum cumene impact occurred at the boundary of Site B4. Cumene is present at higher levels indiesel than gasoline, resulting in the highest cumene emissions occurring adjacent to the cumene storagetanks at site B4.
The assessment predicts that no adverse impacts are likely to occur as a result of the Vopak B4 facilities typicaloperations at and beyond the site boundary or at residential receptors. The assessment also suggests that thefacilities contribution to the maximum cumulative VOC level is low.

AECOM Vopak Terminal B4Air Quality Impact Assessment
27-May-2016Prepared for – Vopak Terminals Pty Ltd – ABN: 67 004 754 750
26
Figure 3 Maximum Cumulative Benzene Isopleth 99.9th Percentile (Criterion 29 ug/m3)

AECOM Vopak Terminal B4Air Quality Impact Assessment
27-May-2016Prepared for – Vopak Terminals Pty Ltd – ABN: 67 004 754 750
27
In order to gain a better picture of the maximum influence that the assessed project, Site B4, may have on thelocal area, Table 17 has been provided which shows the values for the location with the maximum impact fromSite B4 and the contribution from the other sources at this time.Table 17 Maximum Site B4 Predicted Ground Level Concentrations At or Beyond the Site Boundary 99.9th Percentile (mg/m3)
Pollutant Criteria(mg/m3)
Maximum Predicted 99.9th Percentile Concentration (mg/m3)Cumulative% of CriteriaSite B4 Site B*
Vopakbitumen& BLB1/2*
Background* Cumulative*
Benzene 29 9.7 0.0036 0.0049 5.04 14.76 51%
Cumene 21 15.7 0.0005 0.0003 0.08 15.81 75%
Cyclohexane 19,000 3.3 0.0040 0.0048 4.25 7.59 <1%
Ethylbenzene 8,000 3.6 0.0020 0.0039 0.46 4.10 <1%
n-Hexane 3,200 5.2 0.0159 0.0158 10.14 15.36 <1%
Toluene 360 9.6 0.0236 0.0473 6.43 16.08 4%
Xylenes 190 9.5 0.0062 0.0101 1.99 11.54 6%* Contemporaneous value at the time and location of the maximum Site B4 impact. Cumulative concentrations are the sum ofcontemporaneous impacts from Site B4, Site B, Vopak bitumen & BLB1/2 and background.
As shown, the predicted pollutant concentrations were all below their respective assessment criteria. Thefollowing observations are made:
- The cumulative contribution, when sorted by the maximum Site B4 contribution, predicts that cumene wouldhave the highest contribution of the EPA criteria representing 75%. This is the same result as the maximumgridded due to the contribution of the diesel tanks as previously discussed. The maximum cumulativecumene isopleth is provided in Figure 4;
- The maximum contribution of Site B4 to the EPA criteria is for cumene with 75%, representing the dominantsource of the cumulative impact;
- The maximum impacts occurred at the boundary of Site B4 for all pollutants.
The assessment predicts that no adverse impacts are likely to occur as a result of the Vopak B4 facilities typicaloperations at and beyond the site boundary or at residential receptors.

AECOM Vopak Terminal B4Air Quality Impact Assessment
27-May-2016Prepared for – Vopak Terminals Pty Ltd – ABN: 67 004 754 750
28
Figure 4 Maximum Cumulative Cumene Isopleth 99.9th Percentile

AECOM Vopak Terminal B4Air Quality Impact Assessment
27-May-2016Prepared for – Vopak Terminals Pty Ltd – ABN: 67 004 754 750
29
7.2 Specific Residential Receptor AssessmentThe predicted maximum cumulative impacts provided include the selected residential receptors, and as themaximum cumulative values met the EPA criteria, subsequently the EPA criteria are also expected to be met at allresidential receptors.
In order the further clarify the predicted cumulative impacts at the residential receptors, the cumulative maximum99.9th percentile GLC values have been provided Table 18. As shown, the predicted pollutant concentrationswere all well below the assessment criteria. The maximum cumulative contribution to the EPA criteria was forbenzene at Receptor 12 (Elaroo Avenue, Yarra Point) at 20%. Note that of this 5.3 ug.m3 maximum, 4.6ug/m3 isfrom background emissions not related to Vopak operations. Subsequently, the modelled Vopak impacts at thismaximum residential receptor location represent 2% of the benzene criterion
The data show that the GLCs met the relevant assessment criteria at all residential receptors for all pollutants.Figures showing the predicted maximum cumulative concentrations are provided in Appendix E.

AECOM Vopak Terminal B4Air Quality Impact Assessment
27-May-2016Prepared for – Vopak Terminals Pty Ltd – ABN: 67 004 754 750
30
Table 18 Benzene Residential Receptor Predicted Maximum Ground Level Concentrations 99.9th Percentile (mg/m3)
# Receptor DescriptionCumulative Ground Level Concentration (ug/m3)Benzene Cumene Cyclohexane Ethylbenzene n-Hexane Toluene Xylenes
EPA Criterion (ug/m3) 29 21 19,000 8,000 3,200 360 190
1 Matraville Public School, Matraville 2.9 0.3 4.5 0.6 10.8 7.9 2.4
2 St Agnes Primary School,Matraville 2.9 0.3 4.5 0.6 10.8 7.9 2.4
3 Matraville High School, Chifley 2.9 0.4 4.5 0.6 10.9 8.2 2.4
4 St Andrews Primary School,Malabar 2.9 0.3 4.5 0.6 10.8 8.1 2.4
5 Malabar Public School, Malabar 2.9 0.3 4.4 0.6 10.7 7.7 2.3
6 23 Adina Avenue, Phillip Bay 5.1 0.5 4.6 0.7 11.1 8.6 2.6
7 61 Yarra Road, Phillip Bay 5.2 0.7 4.6 0.8 11.4 9.2 2.8
8 52 Eyre Street, Chifley 3.1 0.5 4.6 0.7 11.2 8.8 2.6
9 26 Moorina Avenue, Matraville 3.0 0.5 4.5 0.7 11.1 8.7 2.6
10 5 Clonard Way, Little Bay 5.1 0.5 4.6 0.7 11.1 8.4 2.6
11 Botany Golf Club, Banksmeadow 2.4 0.5 4.7 0.8 11.7 10.5 2.9
12 Elaroo Avenue, Yarra Point 5.3 0.9 4.6 0.8 11.4 9.5 2.8
13 La Perouse Point, ANZAC Parade 4.4 0.7 4.6 0.8 11.4 9.4 2.8

AECOM Vopak Terminal B4Air Quality Impact Assessment
27-May-2016Prepared for – Vopak Terminals Pty Ltd – ABN: 67 004 754 750
31
8.0 Tiered Procedure for Estimating Ground-Level OzoneImpacts from Stationary Sources – Site B4
Assessment of the air quality impacts from stationary sources of oxides of nitrogen (NOx) and VOCs needs toconsider the potential generation of ground-level ozone. The NSW EPA have developed a tiered approach toozone impact assessment for this purpose (ENVIRON 2011). The assessment framework includes:
- Guidance on the application of a level 1 assessment – screening procedure; and
- Guidance on the application of a level 2 assessment – refined procedure.
The steps required under the tiered procedure, as they apply to the assessment, are provided in the followingsections in accordance and with reference to the tiered procedure document (ENVIRON 2011).
8.1 Region ClassificationThe initial step involves the classification of the region within which the source is to be located as either an ozone“attainment area” or “non-attainment area” based 1 hour and 4 hour average ozone concentrations recorded overa five year period. The different categories have varying assessment criteria for triggering the need for an ozoneassessment; non-attainment areas have stricter thresholds. The assessment document identified that for 2006-2010 the Sydney region is defined as a non-attainment area, a result that is highly likely should the most recent 5year period be assessed. This report assumes that the Vopak B4 site is located in a non-attainment area.
8.2 Threshold AssessmentThe second step in the procedure involves the evaluation of the source’s emissions against the new or modifiedsource thresholds for NOx and VOC emissions. Total emissions from the new or modified source, from allindividual emission units, are compared to the emission thresholds.
For a source with emissions below the relevant emission threshold, an ozone impact assessment is not required.Where source emissions are above the relevant emission threshold, a Level 1 assessment should be undertakenusing the Level 1 screening procedure tool.
To be consistent with the cumulative assessment of Vopak emissions in Port Botany, the total tonnes per year ofVOCs emitted for Vopak sites B1, B2, B3 (GHD 2006) and B4 (current assessment; Appendix D) have beencalculated and compared against the thresholds.
The reported tonnes per annum (tpa) from B1, B2 and B3, including emissions from storage tanks and truckloading (gantry) was 68 tpa VOC. The estimated tpa from the B4 facility, as calculated from the TANKS dataprovided in Appendix D, is 26 tpa VOC. No significant stationary NOx sources are expected from the Vopaksites. The total cumulative VOC emission from the Vopak sites is 86 tpa (0.236 t/day).
The non-attainment threshold applicable for a modified source (applicable as the review is cumulatively assessingthe Vopak sites) for the application of a Level 1 Screening Assessment is >35 tpa. The assessment triggers thisthreshold and hence a Level 1 Screening Assessment is required.
8.3 Level 1 Screening AssessmentCriteria for determining the significance of predicted incremental increase in ambient ozone concentrations fornon-attainment areas comprise the evaluation of sources against a screening impact level (SIL) of 0.5 ppb andagainst the maximum allowable increment of 1 ppb.
In cases where the maximum ozone increment is below the SIL and/or below the relevant maximum allowableincrement, further ozone impact assessment is not required but a best management practice (BMP) determinationshould be undertaken for the source.
In the event the impacts are greater than the maximum allowable increment, the EPA may consider the impact ofthe source on local and regional air quality and may require that a Level 2 refined assessment be undertaken forthe source.
To undertake the Level 1 Screening Assessment the EPA (with ENVIRON 2011) has created a Level 1 ScreeningTool and is available on the EPA website (http://www.epa.nsw.gov.au/air/appmethods.htm). Specific data is

AECOM Vopak Terminal B4Air Quality Impact Assessment
27-May-2016Prepared for – Vopak Terminals Pty Ltd – ABN: 67 004 754 750
32
entered into the tool, including source region and the tonnes per day of VOC and NOx, and the ozone impacts arecalculated. In the case of this assessment, the calculated Vopak cumulative tonnes/day (previously provided as0.236 t/day VOC) was entered into the model and the incremental and cumulative ozone values calculated by thetool. The results of the tool calculation are provided below:
- Maximum 1-hr Ozone Increment = 0.080 ppb (threshold is 1 ppb); and
- Maximum 4-hr Ozone Increment = 0.054 ppb (threshold is 1 ppb).
The results of the tool show that the designated thresholds are not exceeded and therefore no further ozoneassessment is required. A review of BMP is provided in Section 8.4.
Note that there are no significant stationary sources of NOx at the Vopak sites, although mobile vehicle NOxemissions from the truck loading are notable at 23 tpa NOx. VOC emissions from mobile vehicles is also notableat 7 tpa. The EPA assessment applies to stationary sources only. However, should the mobile vehicle NOx andVOC emissions be included in the assessment (totalling 117tpa, 0.320 t/day) the threshold would still not beexceeded (0.11 ppb 1 hour increment and 0.073 ppb 4 hour increment).
8.4 Best Management Practice (BMP) ReviewThe operations for the Vopak B4 site are relative simple, being an arrangement of liquid storage tanks. Thegasoline tanks are designed with with a geodesic dome with full contact aluminium internal floating roof, while thediesel allocated tanks have a fixed geodesic domed roof. The design of the tanks relevant to the type of fuelstored is industry standard (API 650).
With respect to the adjacent Vopak sites, the truck loading gantry emissions are filtered through a vapourrecovery unit (VRU). The use of a VRU for truck loading emissions is industry standard and regulated by theNSW POEO Act and regulations.

AECOM Vopak Terminal B4Air Quality Impact Assessment
27-May-2016Prepared for – Vopak Terminals Pty Ltd – ABN: 67 004 754 750
33
9.0 Recommended Mitigation Measures
9.1 Construction Mitigation MeasuresMitigation of air quality impacts relating to construction works essentially relates to management such works. Forany construction activity, the focus should be on implementing a strict dust and air quality management regime.Mitigation measures for the Project are to be detailed in the Construction Environmental Management Plan(CEMP). All reasonable and feasible management measures should be documented and employed wherepracticable to do so. Management plans and monitoring programs should be suitably documented for easyreference throughout the process.
Vopak has prepared CEMPs as part of the construction of the existing neighbouring facilities and for subsequentmodifications, which provide the framework for the implementation of environmental management requirementsnecessary for the construction phase of the Project. Prior to each construction phase the CEMP was updated andreviewed by the relevant agency stakeholders as nominated by the Project Approval. Subject to approval, theProject will also be subject to a specific CEMP that incorporates the outcomes and recommendations of the EIS.
A key objective of the CEMP is to clearly outline the procedures to address and manage potential environmentalimpacts associated with the activities. As a minimum, the plan should outline the following aspects related to theworks:
- Environmental Policy;
- Environmental Management Structure, Communication and Responsibility;
- Approval and Licensing Requirements;
- Reporting;
- Emergency Contacts and Response;
- Environmental Management Activities and Controls;
- Environmental Monitoring;
- Complaints;
- Corrective Action; and
- Environmental Management Plan Review.
The mitigation measures recommended for inclusion for the construction period are as follows:
- All vehicles and plant/equipment should be fitted with appropriate emission control equipment and beserviced and maintained in accordance with the manufacturers’ specifications. Smoke from vehicles/plantshould not be visible for more than ten seconds;
- Trucks entering and leaving the premises that are carrying loads of dust-generating materials must havetheir loads covered at all times, except during loading and unloading;
- Hard surfaces or paving should be used where possible, as unpaved routes can account for a significantproportion of fugitive dust emissions, particularly during dry/windy conditions. Routes should be inspectedregularly and repaired when necessary, and roads should be swept and watered as required to limit dirt/dustbuild up and potential dust generation during windy conditions;
- Any areas on site that are not covered with hard surfaces should be vegetated wherever possible tominimise wind erosion and associated dust generation;
- All vehicles should be switched off when not in use for extended periods;
- Use of water carts and/or road sweeping to minimise dust generation. The frequency of operation is to beincreased during dry windy conditions which create a higher potential for dust generation;
- Wetting and covering of stockpiles where hazardous material has been encountered;
- Active excavation area works are wet down with hoses; and
- Housekeeping is maintained to keep exposed areas to a minimum.

AECOM Vopak Terminal B4Air Quality Impact Assessment
27-May-2016Prepared for – Vopak Terminals Pty Ltd – ABN: 67 004 754 750
34
9.2 Operational Mitigation MeasuresOperational mitigation measures are those implemented after operations have commenced in accordance with itsdevelopment consent. Operational mitigation measures focus on undertaking of specific activities in a mannerdesigned to minimise environmental impacts.
An Air Quality Management Plan (AQMP) should be prepared in accordance with conditions of consent and theEnvironment Protection Licence for Project. The following information should be included:
- Sensitive receptors in proximity to the site;
- The legislative framework and standards applicable to the operation;
- Potential contributors to off-site pollutant impacts, including the pollutants that are of concern;
- Mitigation measures required to minimise the operation’s effects on local air quality;
- Contingency plans for complaints and pollution incidents; and
- Review and reporting protocols.
The modelling has assumed a stack venting 10m above ground level with vertical momentum i.e. no witches’ hat,T-junctions or other units that may limit the stacks vertical velocity. Vopak has confirmed that the approved andbuilt Site B 75W modification design would meet this stack height and orientation requirement.

AECOM Vopak Terminal B4Air Quality Impact Assessment
27-May-2016Prepared for – Vopak Terminals Pty Ltd – ABN: 67 004 754 750
35
10.0 ConclusionAECOM conducted an assessment of the potential effects on air quality associated with the operation of theproposed Vopak Site B4, which consists of bulk liquid fuel storage at Port Botany, NSW. Vopak proposes toimport approximately 2,520 ML of diesel and 2,266 ML of gasoline per annum by ship, which would be stored intanks prior to dispatch via truck. The site would have a total storage capacity of around 200 ML. This assessmenthas also incorporated the operation of the existing Vopak Site B facility and amendments to Site B as proposed intheir current S75 W modification Environmental Assessment. In addition to potential emissions from Vopakoperations this assessment undertook a review of other potential VOC sources in proximity to the project andincorporated this into a cumulative assessment to cover the major VOC emissions sources in Port Botany.
This assessment investigated the effects of the proposed operations on the air quality of the surroundingenvironment. The assessment of air emissions was limited to VOCs during operation of the proposed facility.VOC concentrations at sensitive receptor locations were estimated through dispersion modelling using theCALPUFF program. A cumulative assessment including local VOC emissions was included.
The results of the modelling predicted that all assessed VOC concentrations would be less than the relevant EPAguideline criteria at all sensitive receptor locations assessed at and beyond the site boundary and at residentialareas.
In accordance with EPA requirements, a tiered approach to ozone impact assessment was undertaken for theProject. The assessment identified that the site triggered the requirements to undertake a level 1 assessmentbased on total annual VOC emissions. The Tier 1 assessment confirmed that the Project emissions do not triggerfurther thresholds and as such no further assessment beyond the Tier 1 assessment undertaken was required.
The air quality impact assessment predicts that the operation of the proposed Vopak B4 is not expected toadversely affect the air environment or the amenity of sensitive receptors.

AECOM Vopak Terminal B4Air Quality Impact Assessment
27-May-2016Prepared for – Vopak Terminals Pty Ltd – ABN: 67 004 754 750
36
11.0 ReferencesAECOM (2015), Vopak Site B4 – State Significant Development – Environment Impact Assessment.
AECOM (2015b). Air Quality Impact Assessment - Stolthaven Mayfield Fuel Terminal - SSD_6664 MOD1 –Throughput Increase to 1,300ML.
Barclay, J. & Scire, J. (2011). Generic Guidance and Optimum Model Settings for the CALPUFF ModellingSystem for Inclusion into the Approved Methods for the Modelling and Assessment of Air Pollutants in New SouthWales. Office of Environment and Heritage NSW: Sydney.
Commonwealth Government (1999) Emission Estimation Technique Manual for Petroleum Refining.
DEC. (2005). Approved Methods for the Modelling and Assessment of Air Pollutants in New South Wales.Department of Environment and Conservation (NSW): Sydney.
Department of Sustainability, Environment, Water, Population and Communities. (2012). Emission EstimationTechnique Manual for Fuel and Organic Liquid Storage, Version 3.3.
ENVIRON (2011), Tiered Procedure for Estimating Ground-Level Ozone Impacts from Stationary Sources.ENVIRON Australia Pty Ltd.
GHD (2006), Proposed Expansion to Site B Bulk Liquids Storage Terminal – Environmental Assessment
GHD (2007), Vopak Terminals Sydney and Natural Fuels Australia Ltd – Proposed Sydney Biodiesel TerminalEnvironmental Assessment.
GHD (2008), Terminals Pty Ltd – Report for Port Botany Terminal Upgrade – Air Assessment.
GHD (2011), Terminals Pty Ltd – Report for Bitumen Import and Dispatch Facility, Port Botany – Air Assessment.
GHD (2013), Terminals Pty Ltd – Botany Stage 5B Expansion - Air Quality Impact Assessment.
National Inventory by Economic Sector, Australian Government Department of the Environment (2013). NationalInventory by Economic Sector, http://ageis.climatechange.gov.au/ANZSIC.aspx; accessed 13 May 2015
PlanCom (2015), Section 75W Modification – MP 06_0089 – Modification 2 – Environmental Assessment, VopakTerminals Sydney Pty Ltd, Site B Bulk Liquids Storage Terminal.
SKM (2007) Bulk Liquids Berth No. 2 – Port Botany – Air Quality Impact Assessment.
Stopford, M. (1997). Maritime Economics. Routledge.
Pacific Environment Limited (2015), Vopak Terminals Sydney Pty Ltd – Air Quality Assessment For VopakBitumen Storage Facility - Vopak Terminals Sydney Pty Ltd.

AECOM Vopak Terminal B4Air Quality Impact Assessment
27-May-2016Prepared for – Vopak Terminals Pty Ltd – ABN: 67 004 754 750
37
This page has been left blank intentionally.

AECOM Vopak Terminal B4Air Quality Impact Assessment
27-May-2016Prepared for – Vopak Terminals Pty Ltd – ABN: 67 004 754 750
A
aAppendix A
Meteorological DataAnalyses

AECOM Vopak Terminal B4Air Quality Impact Assessment
27-May-2016Prepared for – Vopak Terminals Pty Ltd – ABN: 67 004 754 750
a-1
Appendix A Meteorological Data Analyses
Wind roses were prepared to compare the data used in the modelling to data recorded at Sydney Airport over thelonger term. The BoM website provides historical wind roses for 9am and 3pm only, so in order to analyse theCALMET data wind roses for the combined years 2013, 2014 and 2015 have been prepared for annual andseasonal time periods. The wind rose comparison is provided over page, comparing the CALMET data centredon the airport against the BoM Sydney Airport data.
The annual wind roses were similar, showing strong components from the north-easterly, north-westerly andsouth directions, with lesser winds present from all other directions. The annual percentage of calms were similarwith 0.7 % for CALMET versus 0.2 % for BoM. A review of the seasonal wind roses shows a strong correlationbetween CALMET and BoM.
The wind directions at 9 am showed similar data, with a large proportion of winds from the northwest and south.The 3 pm wind roses both showed a strong north-easterly component for both datasets, however the SydneyAirport data did show a larger southerly and easterly component. The wind speeds recorded at BoM weregenerally stronger than those predicted by CALMET.
A review of the CALMET wind speed categories is provided below. The data show that winds are typically mild tohigh with 85% of the winds between 2.1 and 8.8 m/s. Given the coastal location of the Airport this is considered areasonable representation. This is further justified by the three year (2013-2015) data from the below wind rosesreporting a calm percentage of 0.2%, meaning high winds are expected.
Figure Wind Speed Frequency Distribution
A review of the wind speeds by hour of day has been provided over page. The data show typical trends, with theaverage strongest winds in the daytime hours and lowest at nigh time. There is a notable range between themaximum and minimum, however the 10th percentile to 90th percentile data shows a balanced range.

AECOM Vopak Terminal B4Air Quality Impact Assessment
27-May-2016Prepared for – Vopak Terminals Pty Ltd – ABN: 67 004 754 750
a-2
Figure Wind Speed Distribution by Hour of Day
A review of the stability classes for CALMET centred on the airport and on the Vopak B4 site. The data showmostly neutral conditions (condition D) at both locations, with slightly more variability at the Vopak B4 site.
Figure Stability Class Frequency
A summary of the Sydney Airport long term Climatic data is provided at the end of this section.

AECOM Vopak Terminal B4Air Quality Impact Assessment
27-May-2016Prepared for – Vopak Terminals Pty Ltd – ABN: 67 004 754 750
a-3
CALMET Airport 2014 vs BoM Sydney Airport Long Term
CALMET Airport – Annual, all hours 2014 BoM Sydney Airport – Annual, 2013-2015
CALMET Airport – Annual, 9 am, 2014 BoM Sydney Airport – Annual, 9 am, 1939 – 2010
NORTH
SOUTH
WEST EAST
2%
4%
6%
8%
10%
WIND SPEED(m/s)
>= 11.10
8.80 - 11.10
5.70 - 8.80
3.60 - 5.70
2.10 - 3.60
0.50 - 2.10
Calms: 0.66%
NORTH
SOUTH
WEST EAST
2%
4%
6%
8%
10%
WIND SPEED(m/s)
>= 11.10
8.80 - 11.10
5.70 - 8.80
3.60 - 5.70
2.10 - 3.60
0.50 - 2.10
Calms: 0.18%
NORTH
SOUTH
WEST EAST
3%
6%
9%
12%
15%
WIND SPEED(m/s)
>= 11.10
8.80 - 11.10
5.70 - 8.80
3.60 - 5.70
2.10 - 3.60
0.50 - 2.10
Calms: 0.00%

AECOM Vopak Terminal B4Air Quality Impact Assessment
27-May-2016Prepared for – Vopak Terminals Pty Ltd – ABN: 67 004 754 750
a-4
CALMET Airport – Annual, 3 pm, 2014 BoM Sydney Airport – Annual, 3 pm, 1939 - 2010
CALMET Airport – Summer, 2014 BoM Sydney Airport – Summer, 2013-2015
NORTH
SOUTH
WEST EAST
4%
8%
12%
16%
20%
WIND SPEED(m/s)
>= 11.10
8.80 - 11.10
5.70 - 8.80
3.60 - 5.70
2.10 - 3.60
0.50 - 2.10
Calms: 0.27%
NORTH
SOUTH
WEST EAST
4%
8%
12%
16%
20%
WIND SPEED(m/s)
>= 11.10
8.80 - 11.10
5.70 - 8.80
3.60 - 5.70
2.10 - 3.60
0.50 - 2.10
Calms: 0.93%
NORTH
SOUTH
WEST EAST
4%
8%
12%
16%
20%
WIND SPEED(m/s)
>= 11.10
8.80 - 11.10
5.70 - 8.80
3.60 - 5.70
2.10 - 3.60
0.50 - 2.10
Calms: 0.19%
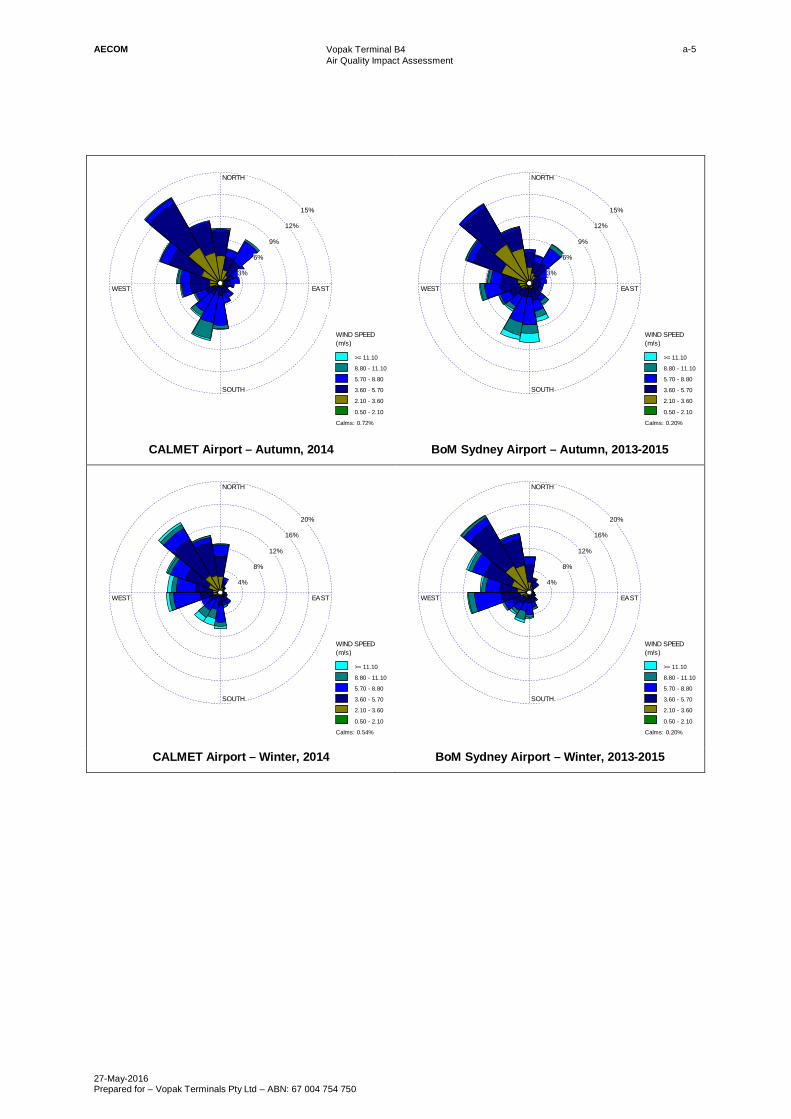
AECOM Vopak Terminal B4Air Quality Impact Assessment
27-May-2016Prepared for – Vopak Terminals Pty Ltd – ABN: 67 004 754 750
a-5
CALMET Airport – Autumn, 2014 BoM Sydney Airport – Autumn, 2013-2015
CALMET Airport – Winter, 2014 BoM Sydney Airport – Winter, 2013-2015
NORTH
SOUTH
WEST EAST
3%
6%
9%
12%
15%
WIND SPEED(m/s)
>= 11.10
8.80 - 11.10
5.70 - 8.80
3.60 - 5.70
2.10 - 3.60
0.50 - 2.10
Calms: 0.72%
NORTH
SOUTH
WEST EAST
3%
6%
9%
12%
15%
WIND SPEED(m/s)
>= 11.10
8.80 - 11.10
5.70 - 8.80
3.60 - 5.70
2.10 - 3.60
0.50 - 2.10
Calms: 0.20%
NORTH
SOUTH
WEST EAST
4%
8%
12%
16%
20%
WIND SPEED(m/s)
>= 11.10
8.80 - 11.10
5.70 - 8.80
3.60 - 5.70
2.10 - 3.60
0.50 - 2.10
Calms: 0.54%
NORTH
SOUTH
WEST EAST
4%
8%
12%
16%
20%
WIND SPEED(m/s)
>= 11.10
8.80 - 11.10
5.70 - 8.80
3.60 - 5.70
2.10 - 3.60
0.50 - 2.10
Calms: 0.20%

AECOM Vopak Terminal B4Air Quality Impact Assessment
27-May-2016Prepared for – Vopak Terminals Pty Ltd – ABN: 67 004 754 750
a-6
CALMET Airport – Spring, 2014 BoM Sydney Airport – Spring, 2013-2015
NORTH
SOUTH
WEST EAST
3%
6%
9%
12%
15%
WIND SPEED(m/s)
>= 11.10
8.80 - 11.10
5.70 - 8.80
3.60 - 5.70
2.10 - 3.60
0.50 - 2.10
Calms: 0.46%
NORTH
SOUTH
WEST EAST
3%
6%
9%
12%
15%
WIND SPEED(m/s)
>= 11.10
8.80 - 11.10
5.70 - 8.80
3.60 - 5.70
2.10 - 3.60
0.50 - 2.10
Calms: 0.15%

AECOM Vopak Terminal B4Air Quality Impact Assessment
27-May-2016Prepared for – Vopak Terminals Pty Ltd – ABN: 67 004 754 750
a-4
Climate Averages: Sydney Airport AMO (Site Number 066037) – 1939 - 2015
Statistics Jan Feb Mar Apr May Jun Jul Aug Sep Oct Nov Dec Annual Years
Average temperature (oC)Maximum 26.5 26.4 25.3 22.9 20 17.6 17 18.3 20.6 22.6 24.1 25.8 22.3 76 1939 2015Minimum 18.9 19.1 17.6 14.2 10.9 8.7 7.2 8.2 10.5 13.2 15.4 17.5 13.5 76 1939 2015Average rainfallRainfall (mm) 94 111.9 115.4 109.3 98.7 122.8 69.9 77 60.2 70.7 81.5 74.1 1085.4 86 1929 2015Number of days of rain ≥ 1 mm 8 8.6 9.2 8.6 8.5 8.8 6.6 6.9 6.8 7.8 8.4 7.8 96 86 1929 2015Average 9 am conditionsTemperature (°C) 22.4 22.3 21.1 18.2 14.6 11.9 10.8 12.5 15.7 18.4 19.9 21.6 17.4 71 1939 20109 am relative humidity (%) 70 73 73 71 73 74 71 65 62 61 64 66 69 60 1939 20109 am wind speed (km/h) 14.4 13.8 12.9 12.9 12.6 13.4 13.3 14.4 15.5 16.3 16 14.8 14.2 70 1939 2010Average 3 pm conditionsTemperature (°C) 24.8 24.8 23.9 21.7 19 16.6 16.1 17.2 19 20.7 22.1 23.9 20.8 71 1939 20103 pm relative humidity (%) 60 63 61 59 58 57 52 49 51 54 56 58 57 60 1939 20103 pm wind speed (km/h) 24.1 23 21 19.3 17.1 17.8 18.2 20.8 23.1 24.6 25.3 25.2 21.6 70 1939 2010Source: http://www.bom.gov.au/climate/averages/tables/cw_066037.shtml; accessed 14 May 2015

AECOM Vopak Terminal B4Air Quality Impact Assessment
27-May-2016Prepared for – Vopak Terminals Pty Ltd – ABN: 67 004 754 750
a-6
This page has been left blank intentionally.

AECOM Vopak Terminal B4Air Quality Impact Assessment
27-May-2016Prepared for – Vopak Terminals Pty Ltd – ABN: 67 004 754 750
B
bAppendix B
TANKS Details

AECOM Vopak Terminal B4Air Quality Impact Assessment
27-May-2016Prepared for – Vopak Terminals Pty Ltd – ABN: 67 004 754 750
b-1
Appendix B TANKS Details
TANKS 4.0.9dEmissions Report - Detail Format
Tank Indentification and Physical Characteristics
IdentificationUser Identification: VOPAK 110-04 & 110-05City: Sydney Airport AmoState: NSWCompany: VOPAKType of Tank: Domed External Floating Roof TankDescription: Domed extrenal floating roof tanks for gasoline (assumed ULP)
Tank DimensionsDiameter (ft): 134.51Volume (gallons): 8,221,033.00Turnovers: 24.00
Paint CharacteristicsInternal Shell Condition: Light RustShell Color/Shade: Aluminum/SpecularShell Condition Good
Roof CharacteristicsType: Double DeckFitting Category Typical
Tank Construction and Rim-Seal SystemConstruction: WeldedPrimary Seal: Mechanical ShoeSecondary Seal None
Deck Fitting/Status QuantityAccess Hatch (24-in. Diam.)/Bolted Cover, Gasketed 1Automatic Gauge Float Well/Unbolted Cover, Ungasketed 1Vacuum Breaker (10-in. Diam.)/Weighted Mech. Actuation, Gask. 2Unslotted Guide-Pole Well/Ungasketed Sliding Cover 1Gauge-Hatch/Sample Well (8-in. Diam.)/Weighted Mech. Actuation, Gask. 1Roof Drain (3-in. Diameter)/Open 2Roof Leg (3-in. Diameter)/Adjustable, Double-Deck Roofs 40Rim Vent (6-in. Diameter)/Weighted Mech. Actuation, Gask. 1
Meterological Data used in Emissions Calculations: Sydney Airport Amo, NSW (Avg Atmospheric Pressure = 14.74 psia)
Page 1 of 24TANKS 4.0 Report
15/12/2015file:///C:/TANKS/Run%20Files/summarydisplay.htm

TANKS 4.0.9dEmissions Report - Detail FormatLiquid Contents of Storage Tank
VOPAK 110-04 & 110-05 - Domed External Floating Roof TankSydney Airport Amo, NSW
Daily Liquid Surf.Temperature (deg F)
LiquidBulk
Temp Vapor Pressure (psia)Vapor
Mol.LiquidMass
VaporMass Mol. Basis for Vapor Pressure
Mixture/Component Month Avg. Min. Max. (deg F) Avg. Min. Max. Weight. Fract. Fract. Weight Calculations
Gasoline (RVP 10) Jan 74.38 66.31 82.45 64.84 5.7233 N/A N/A 66.4970 92.84 Option 4: RVP=10, ASTM Slope=3 Benzene 1.7176 N/A N/A 78.1100 0.0093 0.0039 78.11 Option 2: A=6.905, B=1211.033, C=220.79 Cumene (Isopropyl benzene) 0.0861 N/A N/A 120.2000 0.0010 0.0000 120.20 Option 2: A=6.9636, B=1460.793, C=207.78 Cyclohexane 1.7659 N/A N/A 84.1600 0.0077 0.0033 84.16 Option 2: A=6.841, B=1201.53, C=222.65 Ethyl benzene 0.1760 N/A N/A 106.1700 0.0153 0.0007 106.17 Option 2: A=6.975, B=1424.255, C=213.21 Gasoline (RVP 10) 6.8023 N/A N/A 66.0000 0.8149 0.9701 92.00 Option 4: RVP=10, ASTM Slope=3 Hexane (-n) 2.7482 N/A N/A 86.1700 0.0183 0.0123 86.17 Option 2: A=6.876, B=1171.17, C=224.41 Toluene 0.5091 N/A N/A 92.1300 0.0560 0.0070 92.13 Option 2: A=6.954, B=1344.8, C=219.48 Xylene (-m) 0.1473 N/A N/A 106.1700 0.0775 0.0028 106.17 Option 2: A=7.009, B=1462.266, C=215.11Gasoline (RVP 10) Feb 73.73 66.39 81.07 64.84 5.6548 N/A N/A 66.4942 92.84 Option 4: RVP=10, ASTM Slope=3 Benzene 1.6889 N/A N/A 78.1100 0.0093 0.0039 78.11 Option 2: A=6.905, B=1211.033, C=220.79 Cumene (Isopropyl benzene) 0.0842 N/A N/A 120.2000 0.0010 0.0000 120.20 Option 2: A=6.9636, B=1460.793, C=207.78 Cyclohexane 1.7371 N/A N/A 84.1600 0.0077 0.0033 84.16 Option 2: A=6.841, B=1201.53, C=222.65 Ethyl benzene 0.1724 N/A N/A 106.1700 0.0153 0.0007 106.17 Option 2: A=6.975, B=1424.255, C=213.21 Gasoline (RVP 10) 6.7217 N/A N/A 66.0000 0.8149 0.9703 92.00 Option 4: RVP=10, ASTM Slope=3 Hexane (-n) 2.7051 N/A N/A 86.1700 0.0183 0.0122 86.17 Option 2: A=6.876, B=1171.17, C=224.41 Toluene 0.4995 N/A N/A 92.1300 0.0560 0.0069 92.13 Option 2: A=6.954, B=1344.8, C=219.48 Xylene (-m) 0.1442 N/A N/A 106.1700 0.0775 0.0028 106.17 Option 2: A=7.009, B=1462.266, C=215.11Gasoline (RVP 10) Mar 72.23 65.18 79.29 64.84 5.4992 N/A N/A 66.4877 92.84 Option 4: RVP=10, ASTM Slope=3 Benzene 1.6242 N/A N/A 78.1100 0.0093 0.0038 78.11 Option 2: A=6.905, B=1211.033, C=220.79 Cumene (Isopropyl benzene) 0.0799 N/A N/A 120.2000 0.0010 0.0000 120.20 Option 2: A=6.9636, B=1460.793, C=207.78 Cyclohexane 1.6720 N/A N/A 84.1600 0.0077 0.0032 84.16 Option 2: A=6.841, B=1201.53, C=222.65 Ethyl benzene 0.1641 N/A N/A 106.1700 0.0153 0.0006 106.17 Option 2: A=6.975, B=1424.255, C=213.21 Gasoline (RVP 10) 6.5386 N/A N/A 66.0000 0.8149 0.9706 92.00 Option 4: RVP=10, ASTM Slope=3 Hexane (-n) 2.6076 N/A N/A 86.1700 0.0183 0.0121 86.17 Option 2: A=6.876, B=1171.17, C=224.41 Toluene 0.4781 N/A N/A 92.1300 0.0560 0.0068 92.13 Option 2: A=6.954, B=1344.8, C=219.48 Xylene (-m) 0.1372 N/A N/A 106.1700 0.0775 0.0027 106.17 Option 2: A=7.009, B=1462.266, C=215.11Gasoline (RVP 10) Apr 68.85 62.48 75.22 64.84 5.1600 N/A N/A 66.4732 92.84 Option 4: RVP=10, ASTM Slope=3 Benzene 1.4853 N/A N/A 78.1100 0.0093 0.0038 78.11 Option 2: A=6.905, B=1211.033, C=220.79 Cumene (Isopropyl benzene) 0.0708 N/A N/A 120.2000 0.0010 0.0000 120.20 Option 2: A=6.9636, B=1460.793, C=207.78 Cyclohexane 1.5322 N/A N/A 84.1600 0.0077 0.0032 84.16 Option 2: A=6.841, B=1201.53, C=222.65 Ethyl benzene 0.1467 N/A N/A 106.1700 0.0153 0.0006 106.17 Option 2: A=6.975, B=1424.255, C=213.21 Gasoline (RVP 10) 6.1391 N/A N/A 66.0000 0.8149 0.9714 92.00 Option 4: RVP=10, ASTM Slope=3 Hexane (-n) 2.3978 N/A N/A 86.1700 0.0183 0.0119 86.17 Option 2: A=6.876, B=1171.17, C=224.41 Toluene 0.4325 N/A N/A 92.1300 0.0560 0.0066 92.13 Option 2: A=6.954, B=1344.8, C=219.48 Xylene (-m) 0.1226 N/A N/A 106.1700 0.0775 0.0026 106.17 Option 2: A=7.009, B=1462.266, C=215.11Gasoline (RVP 10) May 65.20 59.77 70.62 64.84 4.8130 N/A N/A 66.4576 92.84 Option 4: RVP=10, ASTM Slope=3 Benzene 1.3466 N/A N/A 78.1100 0.0093 0.0036 78.11 Option 2: A=6.905, B=1211.033, C=220.79 Cumene (Isopropyl benzene) 0.0620 N/A N/A 120.2000 0.0010 0.0000 120.20 Option 2: A=6.9636, B=1460.793, C=207.78 Cyclohexane 1.3922 N/A N/A 84.1600 0.0077 0.0031 84.16 Option 2: A=6.841, B=1201.53, C=222.65 Ethyl benzene 0.1298 N/A N/A 106.1700 0.0153 0.0006 106.17 Option 2: A=6.975, B=1424.255, C=213.21
Page 2 of 24TANKS 4.0 Report
15/12/2015file:///C:/TANKS/Run%20Files/summarydisplay.htm
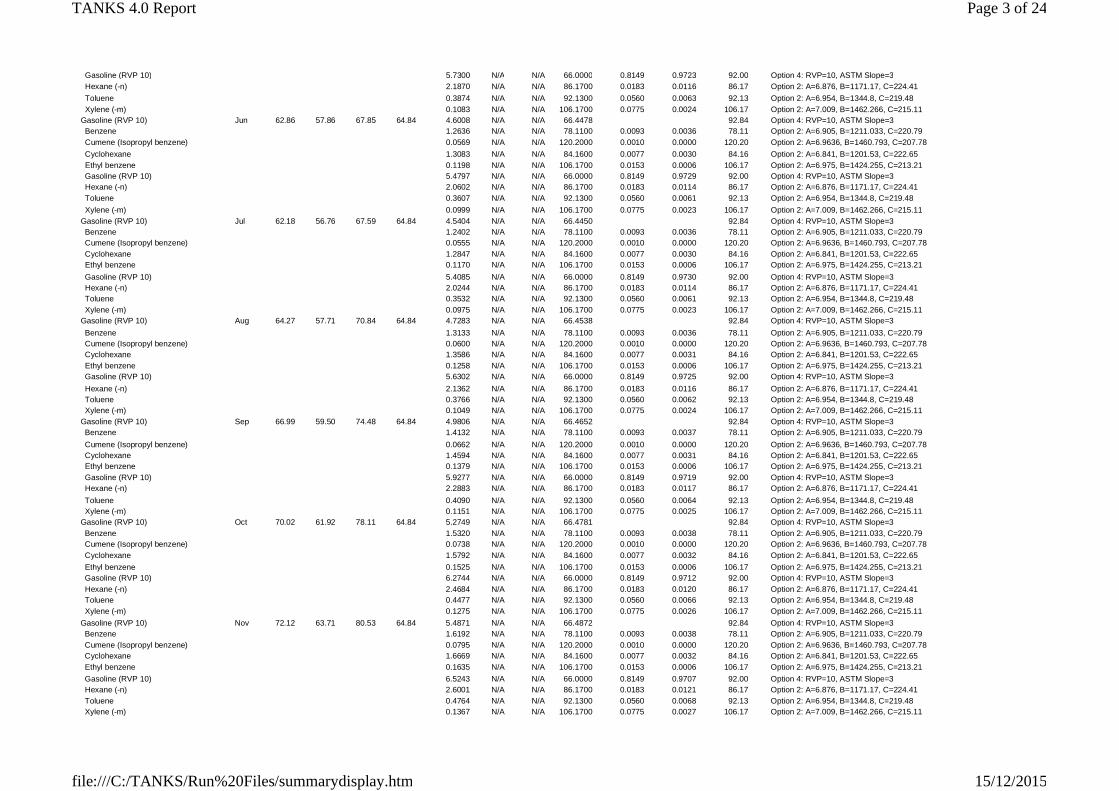
Gasoline (RVP 10) 5.7300 N/A N/A 66.0000 0.8149 0.9723 92.00 Option 4: RVP=10, ASTM Slope=3 Hexane (-n) 2.1870 N/A N/A 86.1700 0.0183 0.0116 86.17 Option 2: A=6.876, B=1171.17, C=224.41 Toluene 0.3874 N/A N/A 92.1300 0.0560 0.0063 92.13 Option 2: A=6.954, B=1344.8, C=219.48 Xylene (-m) 0.1083 N/A N/A 106.1700 0.0775 0.0024 106.17 Option 2: A=7.009, B=1462.266, C=215.11Gasoline (RVP 10) Jun 62.86 57.86 67.85 64.84 4.6008 N/A N/A 66.4478 92.84 Option 4: RVP=10, ASTM Slope=3 Benzene 1.2636 N/A N/A 78.1100 0.0093 0.0036 78.11 Option 2: A=6.905, B=1211.033, C=220.79 Cumene (Isopropyl benzene) 0.0569 N/A N/A 120.2000 0.0010 0.0000 120.20 Option 2: A=6.9636, B=1460.793, C=207.78 Cyclohexane 1.3083 N/A N/A 84.1600 0.0077 0.0030 84.16 Option 2: A=6.841, B=1201.53, C=222.65 Ethyl benzene 0.1198 N/A N/A 106.1700 0.0153 0.0006 106.17 Option 2: A=6.975, B=1424.255, C=213.21 Gasoline (RVP 10) 5.4797 N/A N/A 66.0000 0.8149 0.9729 92.00 Option 4: RVP=10, ASTM Slope=3 Hexane (-n) 2.0602 N/A N/A 86.1700 0.0183 0.0114 86.17 Option 2: A=6.876, B=1171.17, C=224.41 Toluene 0.3607 N/A N/A 92.1300 0.0560 0.0061 92.13 Option 2: A=6.954, B=1344.8, C=219.48 Xylene (-m) 0.0999 N/A N/A 106.1700 0.0775 0.0023 106.17 Option 2: A=7.009, B=1462.266, C=215.11Gasoline (RVP 10) Jul 62.18 56.76 67.59 64.84 4.5404 N/A N/A 66.4450 92.84 Option 4: RVP=10, ASTM Slope=3 Benzene 1.2402 N/A N/A 78.1100 0.0093 0.0036 78.11 Option 2: A=6.905, B=1211.033, C=220.79 Cumene (Isopropyl benzene) 0.0555 N/A N/A 120.2000 0.0010 0.0000 120.20 Option 2: A=6.9636, B=1460.793, C=207.78 Cyclohexane 1.2847 N/A N/A 84.1600 0.0077 0.0030 84.16 Option 2: A=6.841, B=1201.53, C=222.65 Ethyl benzene 0.1170 N/A N/A 106.1700 0.0153 0.0006 106.17 Option 2: A=6.975, B=1424.255, C=213.21 Gasoline (RVP 10) 5.4085 N/A N/A 66.0000 0.8149 0.9730 92.00 Option 4: RVP=10, ASTM Slope=3 Hexane (-n) 2.0244 N/A N/A 86.1700 0.0183 0.0114 86.17 Option 2: A=6.876, B=1171.17, C=224.41 Toluene 0.3532 N/A N/A 92.1300 0.0560 0.0061 92.13 Option 2: A=6.954, B=1344.8, C=219.48 Xylene (-m) 0.0975 N/A N/A 106.1700 0.0775 0.0023 106.17 Option 2: A=7.009, B=1462.266, C=215.11Gasoline (RVP 10) Aug 64.27 57.71 70.84 64.84 4.7283 N/A N/A 66.4538 92.84 Option 4: RVP=10, ASTM Slope=3 Benzene 1.3133 N/A N/A 78.1100 0.0093 0.0036 78.11 Option 2: A=6.905, B=1211.033, C=220.79 Cumene (Isopropyl benzene) 0.0600 N/A N/A 120.2000 0.0010 0.0000 120.20 Option 2: A=6.9636, B=1460.793, C=207.78 Cyclohexane 1.3586 N/A N/A 84.1600 0.0077 0.0031 84.16 Option 2: A=6.841, B=1201.53, C=222.65 Ethyl benzene 0.1258 N/A N/A 106.1700 0.0153 0.0006 106.17 Option 2: A=6.975, B=1424.255, C=213.21 Gasoline (RVP 10) 5.6302 N/A N/A 66.0000 0.8149 0.9725 92.00 Option 4: RVP=10, ASTM Slope=3 Hexane (-n) 2.1362 N/A N/A 86.1700 0.0183 0.0116 86.17 Option 2: A=6.876, B=1171.17, C=224.41 Toluene 0.3766 N/A N/A 92.1300 0.0560 0.0062 92.13 Option 2: A=6.954, B=1344.8, C=219.48 Xylene (-m) 0.1049 N/A N/A 106.1700 0.0775 0.0024 106.17 Option 2: A=7.009, B=1462.266, C=215.11Gasoline (RVP 10) Sep 66.99 59.50 74.48 64.84 4.9806 N/A N/A 66.4652 92.84 Option 4: RVP=10, ASTM Slope=3 Benzene 1.4132 N/A N/A 78.1100 0.0093 0.0037 78.11 Option 2: A=6.905, B=1211.033, C=220.79 Cumene (Isopropyl benzene) 0.0662 N/A N/A 120.2000 0.0010 0.0000 120.20 Option 2: A=6.9636, B=1460.793, C=207.78 Cyclohexane 1.4594 N/A N/A 84.1600 0.0077 0.0031 84.16 Option 2: A=6.841, B=1201.53, C=222.65 Ethyl benzene 0.1379 N/A N/A 106.1700 0.0153 0.0006 106.17 Option 2: A=6.975, B=1424.255, C=213.21 Gasoline (RVP 10) 5.9277 N/A N/A 66.0000 0.8149 0.9719 92.00 Option 4: RVP=10, ASTM Slope=3 Hexane (-n) 2.2883 N/A N/A 86.1700 0.0183 0.0117 86.17 Option 2: A=6.876, B=1171.17, C=224.41 Toluene 0.4090 N/A N/A 92.1300 0.0560 0.0064 92.13 Option 2: A=6.954, B=1344.8, C=219.48 Xylene (-m) 0.1151 N/A N/A 106.1700 0.0775 0.0025 106.17 Option 2: A=7.009, B=1462.266, C=215.11Gasoline (RVP 10) Oct 70.02 61.92 78.11 64.84 5.2749 N/A N/A 66.4781 92.84 Option 4: RVP=10, ASTM Slope=3 Benzene 1.5320 N/A N/A 78.1100 0.0093 0.0038 78.11 Option 2: A=6.905, B=1211.033, C=220.79 Cumene (Isopropyl benzene) 0.0738 N/A N/A 120.2000 0.0010 0.0000 120.20 Option 2: A=6.9636, B=1460.793, C=207.78 Cyclohexane 1.5792 N/A N/A 84.1600 0.0077 0.0032 84.16 Option 2: A=6.841, B=1201.53, C=222.65 Ethyl benzene 0.1525 N/A N/A 106.1700 0.0153 0.0006 106.17 Option 2: A=6.975, B=1424.255, C=213.21 Gasoline (RVP 10) 6.2744 N/A N/A 66.0000 0.8149 0.9712 92.00 Option 4: RVP=10, ASTM Slope=3 Hexane (-n) 2.4684 N/A N/A 86.1700 0.0183 0.0120 86.17 Option 2: A=6.876, B=1171.17, C=224.41 Toluene 0.4477 N/A N/A 92.1300 0.0560 0.0066 92.13 Option 2: A=6.954, B=1344.8, C=219.48 Xylene (-m) 0.1275 N/A N/A 106.1700 0.0775 0.0026 106.17 Option 2: A=7.009, B=1462.266, C=215.11Gasoline (RVP 10) Nov 72.12 63.71 80.53 64.84 5.4871 N/A N/A 66.4872 92.84 Option 4: RVP=10, ASTM Slope=3 Benzene 1.6192 N/A N/A 78.1100 0.0093 0.0038 78.11 Option 2: A=6.905, B=1211.033, C=220.79 Cumene (Isopropyl benzene) 0.0795 N/A N/A 120.2000 0.0010 0.0000 120.20 Option 2: A=6.9636, B=1460.793, C=207.78 Cyclohexane 1.6669 N/A N/A 84.1600 0.0077 0.0032 84.16 Option 2: A=6.841, B=1201.53, C=222.65 Ethyl benzene 0.1635 N/A N/A 106.1700 0.0153 0.0006 106.17 Option 2: A=6.975, B=1424.255, C=213.21 Gasoline (RVP 10) 6.5243 N/A N/A 66.0000 0.8149 0.9707 92.00 Option 4: RVP=10, ASTM Slope=3 Hexane (-n) 2.6001 N/A N/A 86.1700 0.0183 0.0121 86.17 Option 2: A=6.876, B=1171.17, C=224.41 Toluene 0.4764 N/A N/A 92.1300 0.0560 0.0068 92.13 Option 2: A=6.954, B=1344.8, C=219.48 Xylene (-m) 0.1367 N/A N/A 106.1700 0.0775 0.0027 106.17 Option 2: A=7.009, B=1462.266, C=215.11
Page 3 of 24TANKS 4.0 Report
15/12/2015file:///C:/TANKS/Run%20Files/summarydisplay.htm

Gasoline (RVP 10) Dec 73.77 65.37 82.18 64.84 5.6592 N/A N/A 66.4944 92.84 Option 4: RVP=10, ASTM Slope=3 Benzene 1.6908 N/A N/A 78.1100 0.0093 0.0039 78.11 Option 2: A=6.905, B=1211.033, C=220.79 Cumene (Isopropyl benzene) 0.0843 N/A N/A 120.2000 0.0010 0.0000 120.20 Option 2: A=6.9636, B=1460.793, C=207.78 Cyclohexane 1.7389 N/A N/A 84.1600 0.0077 0.0033 84.16 Option 2: A=6.841, B=1201.53, C=222.65 Ethyl benzene 0.1726 N/A N/A 106.1700 0.0153 0.0007 106.17 Option 2: A=6.975, B=1424.255, C=213.21 Gasoline (RVP 10) 6.7269 N/A N/A 66.0000 0.8149 0.9703 92.00 Option 4: RVP=10, ASTM Slope=3 Hexane (-n) 2.7079 N/A N/A 86.1700 0.0183 0.0122 86.17 Option 2: A=6.876, B=1171.17, C=224.41 Toluene 0.5001 N/A N/A 92.1300 0.0560 0.0069 92.13 Option 2: A=6.954, B=1344.8, C=219.48 Xylene (-m) 0.1444 N/A N/A 106.1700 0.0775 0.0028 106.17 Option 2: A=7.009, B=1462.266, C=215.11
Page 4 of 24TANKS 4.0 Report
15/12/2015file:///C:/TANKS/Run%20Files/summarydisplay.htm

TANKS 4.0.9dEmissions Report - Detail Format
Detail Calculations (AP-42)
VOPAK 110-04 & 110-05 - Domed External Floating Roof TankSydney Airport Amo, NSW
Month: January February March April May June July August September October November DecemberRim Seal Losses (lb): 528.5384 Seal Factor A (lb-mole/ft-yr): 5.8000 Seal Factor B (lb-mole/ft-yr (mph)^n): 0.3000 Average Wind Speed (mph): 0.0000 Seal-related Wind Speed Exponent: 2.1000 Value of Vapor Pressure Function: 0.1223 Vapor Pressure at Daily Average Liquid Surface Temperature (psia): 5.7233 Tank Diameter (ft): 134.5100 Vapor Molecular Weight (lb/lb-mole): 66.4970 Product Factor: 1.0000
Withdrawal Losses (lb): 23.9433 Net Throughput (gal/mo.): 16,442,066.0000 Shell Clingage Factor (bbl/1000 sqft): 0.0015 Average Organic Liquid Density (lb/gal): 5.8161 Tank Diameter (ft): 134.5100
Roof Fitting Losses (lb): 65.0242 Value of Vapor Pressure Function: 0.1223 Vapor Molecular Weight (lb/lb-mole): 66.4970 Product Factor: 1.0000 Tot. Roof Fitting Loss Fact.(lb-mole/yr): 95.9800 Average Wind Speed (mph): 0.0000
Total Losses (lb): 617.5059Roof Fitting Loss Factors
Roof Fitting/Status Quantity KFa(lb-mole/yr) KFb(lb-mole/(yr mph^n)) m Losses(lb)Access Hatch (24-in. Diam.)/Bolted Cover, Gasketed 1 1.60 0.00 0.00 1.1048Automatic Gauge Float Well/Unbolted Cover, Ungasketed 1 14.00 5.40 1.10 9.6666Vacuum Breaker (10-in. Diam.)/Weighted Mech. Actuation, Gask. 2 6.20 1.20 0.94 8.5618Unslotted Guide-Pole Well/Ungasketed Sliding Cover 1 31.00 150.00 1.40 21.4045Gauge-Hatch/Sample Well (8-in. Diam.)/Weighted Mech. Actuation, Gask. 1 0.47 0.02 0.97 0.3245Roof Drain (3-in. Diameter)/Open 2 1.50 0.21 1.70 2.0714Roof Leg (3-in. Diameter)/Adjustable, Double-Deck Roofs 40 0.82 0.53 0.14 22.6474Rim Vent (6-in. Diameter)/Weighted Mech. Actuation, Gask. 1 0.71 0.10 1.00 0.4902
Page 5 of 24TANKS 4.0 Report
15/12/2015file:///C:/TANKS/Run%20Files/summarydisplay.htm

Page 6 of 24TANKS 4.0 Report
15/12/2015file:///C:/TANKS/Run%20Files/summarydisplay.htm
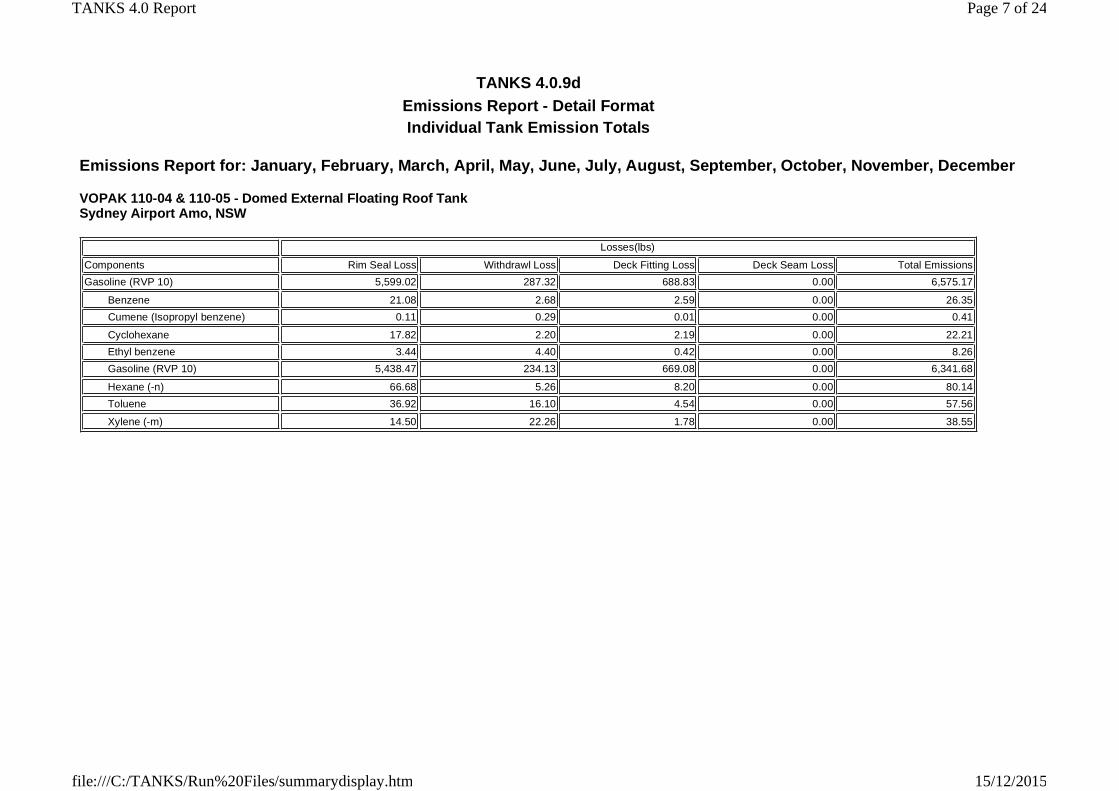
TANKS 4.0.9dEmissions Report - Detail FormatIndividual Tank Emission Totals
Emissions Report for: January, February, March, April, May, June, July, August, September, October, November, December
VOPAK 110-04 & 110-05 - Domed External Floating Roof TankSydney Airport Amo, NSW
Losses(lbs)
Components Rim Seal Loss Withdrawl Loss Deck Fitting Loss Deck Seam Loss Total EmissionsGasoline (RVP 10) 5,599.02 287.32 688.83 0.00 6,575.17
Benzene 21.08 2.68 2.59 0.00 26.35 Cumene (Isopropyl benzene) 0.11 0.29 0.01 0.00 0.41
Cyclohexane 17.82 2.20 2.19 0.00 22.21 Ethyl benzene 3.44 4.40 0.42 0.00 8.26 Gasoline (RVP 10) 5,438.47 234.13 669.08 0.00 6,341.68
Hexane (-n) 66.68 5.26 8.20 0.00 80.14 Toluene 36.92 16.10 4.54 0.00 57.56
Xylene (-m) 14.50 22.26 1.78 0.00 38.55
Page 7 of 24TANKS 4.0 Report
15/12/2015file:///C:/TANKS/Run%20Files/summarydisplay.htm

TANKS 4.0.9dEmissions Report - Detail Format
Tank Indentification and Physical Characteristics
IdentificationUser Identification: VOPAK 110-01, -02, -03City: Sydney Airport AmoState: NSWCompany: VOPAKType of Tank: Vertical Fixed Roof TankDescription: VOPAK vertical fixed roof free venting tanks for B4A - diesel
Tank DimensionsShell Height (ft): 79.89Diameter (ft): 142.71Liquid Height (ft) : 77.26Avg. Liquid Height (ft): 49.21Volume (gallons): 9,246,020.00Turnovers: 24.00Net Throughput(gal/yr): 221,904,480.00Is Tank Heated (y/n): N
Paint CharacteristicsShell Color/Shade: Aluminum/SpecularShell Condition GoodRoof Color/Shade: Aluminum/SpecularRoof Condition: Good
Roof CharacteristicsType: DomeHeight (ft) 13.78Radius (ft) (Dome Roof) 142.71
Breather Vent SettingsVacuum Settings (psig): 0.00Pressure Settings (psig) 0.00
Meterological Data used in Emissions Calculations: Sydney Airport Amo, NSW (Avg Atmospheric Pressure = 14.74 psia)
Page 8 of 24TANKS 4.0 Report
15/12/2015file:///C:/TANKS/Run%20Files/summarydisplay.htm
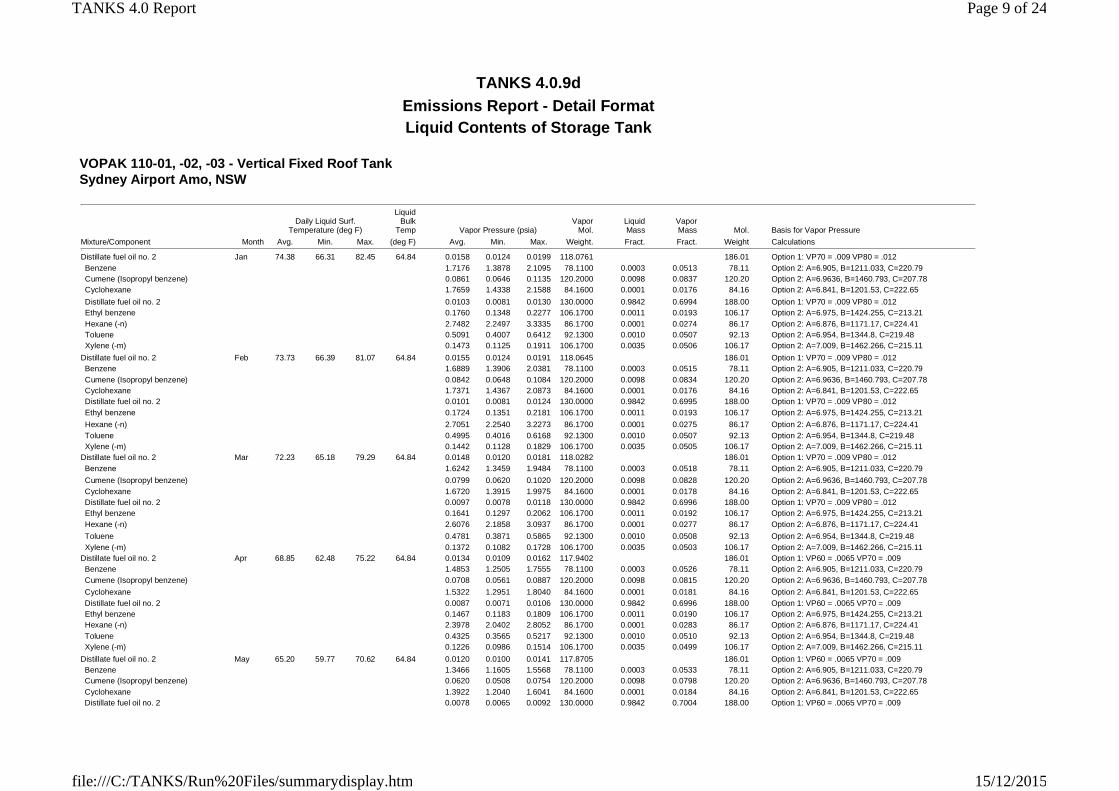
TANKS 4.0.9dEmissions Report - Detail FormatLiquid Contents of Storage Tank
VOPAK 110-01, -02, -03 - Vertical Fixed Roof TankSydney Airport Amo, NSW
Daily Liquid Surf.Temperature (deg F)
LiquidBulk
Temp Vapor Pressure (psia)Vapor
Mol.LiquidMass
VaporMass Mol. Basis for Vapor Pressure
Mixture/Component Month Avg. Min. Max. (deg F) Avg. Min. Max. Weight. Fract. Fract. Weight Calculations
Distillate fuel oil no. 2 Jan 74.38 66.31 82.45 64.84 0.0158 0.0124 0.0199 118.0761 186.01 Option 1: VP70 = .009 VP80 = .012 Benzene 1.7176 1.3878 2.1095 78.1100 0.0003 0.0513 78.11 Option 2: A=6.905, B=1211.033, C=220.79 Cumene (Isopropyl benzene) 0.0861 0.0646 0.1135 120.2000 0.0098 0.0837 120.20 Option 2: A=6.9636, B=1460.793, C=207.78 Cyclohexane 1.7659 1.4338 2.1588 84.1600 0.0001 0.0176 84.16 Option 2: A=6.841, B=1201.53, C=222.65 Distillate fuel oil no. 2 0.0103 0.0081 0.0130 130.0000 0.9842 0.6994 188.00 Option 1: VP70 = .009 VP80 = .012 Ethyl benzene 0.1760 0.1348 0.2277 106.1700 0.0011 0.0193 106.17 Option 2: A=6.975, B=1424.255, C=213.21 Hexane (-n) 2.7482 2.2497 3.3335 86.1700 0.0001 0.0274 86.17 Option 2: A=6.876, B=1171.17, C=224.41 Toluene 0.5091 0.4007 0.6412 92.1300 0.0010 0.0507 92.13 Option 2: A=6.954, B=1344.8, C=219.48 Xylene (-m) 0.1473 0.1125 0.1911 106.1700 0.0035 0.0506 106.17 Option 2: A=7.009, B=1462.266, C=215.11Distillate fuel oil no. 2 Feb 73.73 66.39 81.07 64.84 0.0155 0.0124 0.0191 118.0645 186.01 Option 1: VP70 = .009 VP80 = .012 Benzene 1.6889 1.3906 2.0381 78.1100 0.0003 0.0515 78.11 Option 2: A=6.905, B=1211.033, C=220.79 Cumene (Isopropyl benzene) 0.0842 0.0648 0.1084 120.2000 0.0098 0.0834 120.20 Option 2: A=6.9636, B=1460.793, C=207.78 Cyclohexane 1.7371 1.4367 2.0873 84.1600 0.0001 0.0176 84.16 Option 2: A=6.841, B=1201.53, C=222.65 Distillate fuel oil no. 2 0.0101 0.0081 0.0124 130.0000 0.9842 0.6995 188.00 Option 1: VP70 = .009 VP80 = .012 Ethyl benzene 0.1724 0.1351 0.2181 106.1700 0.0011 0.0193 106.17 Option 2: A=6.975, B=1424.255, C=213.21 Hexane (-n) 2.7051 2.2540 3.2273 86.1700 0.0001 0.0275 86.17 Option 2: A=6.876, B=1171.17, C=224.41 Toluene 0.4995 0.4016 0.6168 92.1300 0.0010 0.0507 92.13 Option 2: A=6.954, B=1344.8, C=219.48 Xylene (-m) 0.1442 0.1128 0.1829 106.1700 0.0035 0.0505 106.17 Option 2: A=7.009, B=1462.266, C=215.11Distillate fuel oil no. 2 Mar 72.23 65.18 79.29 64.84 0.0148 0.0120 0.0181 118.0282 186.01 Option 1: VP70 = .009 VP80 = .012 Benzene 1.6242 1.3459 1.9484 78.1100 0.0003 0.0518 78.11 Option 2: A=6.905, B=1211.033, C=220.79 Cumene (Isopropyl benzene) 0.0799 0.0620 0.1020 120.2000 0.0098 0.0828 120.20 Option 2: A=6.9636, B=1460.793, C=207.78 Cyclohexane 1.6720 1.3915 1.9975 84.1600 0.0001 0.0178 84.16 Option 2: A=6.841, B=1201.53, C=222.65 Distillate fuel oil no. 2 0.0097 0.0078 0.0118 130.0000 0.9842 0.6996 188.00 Option 1: VP70 = .009 VP80 = .012 Ethyl benzene 0.1641 0.1297 0.2062 106.1700 0.0011 0.0192 106.17 Option 2: A=6.975, B=1424.255, C=213.21 Hexane (-n) 2.6076 2.1858 3.0937 86.1700 0.0001 0.0277 86.17 Option 2: A=6.876, B=1171.17, C=224.41 Toluene 0.4781 0.3871 0.5865 92.1300 0.0010 0.0508 92.13 Option 2: A=6.954, B=1344.8, C=219.48 Xylene (-m) 0.1372 0.1082 0.1728 106.1700 0.0035 0.0503 106.17 Option 2: A=7.009, B=1462.266, C=215.11Distillate fuel oil no. 2 Apr 68.85 62.48 75.22 64.84 0.0134 0.0109 0.0162 117.9402 186.01 Option 1: VP60 = .0065 VP70 = .009 Benzene 1.4853 1.2505 1.7555 78.1100 0.0003 0.0526 78.11 Option 2: A=6.905, B=1211.033, C=220.79 Cumene (Isopropyl benzene) 0.0708 0.0561 0.0887 120.2000 0.0098 0.0815 120.20 Option 2: A=6.9636, B=1460.793, C=207.78 Cyclohexane 1.5322 1.2951 1.8040 84.1600 0.0001 0.0181 84.16 Option 2: A=6.841, B=1201.53, C=222.65 Distillate fuel oil no. 2 0.0087 0.0071 0.0106 130.0000 0.9842 0.6996 188.00 Option 1: VP60 = .0065 VP70 = .009 Ethyl benzene 0.1467 0.1183 0.1809 106.1700 0.0011 0.0190 106.17 Option 2: A=6.975, B=1424.255, C=213.21 Hexane (-n) 2.3978 2.0402 2.8052 86.1700 0.0001 0.0283 86.17 Option 2: A=6.876, B=1171.17, C=224.41 Toluene 0.4325 0.3565 0.5217 92.1300 0.0010 0.0510 92.13 Option 2: A=6.954, B=1344.8, C=219.48 Xylene (-m) 0.1226 0.0986 0.1514 106.1700 0.0035 0.0499 106.17 Option 2: A=7.009, B=1462.266, C=215.11Distillate fuel oil no. 2 May 65.20 59.77 70.62 64.84 0.0120 0.0100 0.0141 117.8705 186.01 Option 1: VP60 = .0065 VP70 = .009 Benzene 1.3466 1.1605 1.5568 78.1100 0.0003 0.0533 78.11 Option 2: A=6.905, B=1211.033, C=220.79 Cumene (Isopropyl benzene) 0.0620 0.0508 0.0754 120.2000 0.0098 0.0798 120.20 Option 2: A=6.9636, B=1460.793, C=207.78 Cyclohexane 1.3922 1.2040 1.6041 84.1600 0.0001 0.0184 84.16 Option 2: A=6.841, B=1201.53, C=222.65 Distillate fuel oil no. 2 0.0078 0.0065 0.0092 130.0000 0.9842 0.7004 188.00 Option 1: VP60 = .0065 VP70 = .009
Page 9 of 24TANKS 4.0 Report
15/12/2015file:///C:/TANKS/Run%20Files/summarydisplay.htm

Ethyl benzene 0.1298 0.1077 0.1556 106.1700 0.0011 0.0188 106.17 Option 2: A=6.975, B=1424.255, C=213.21 Hexane (-n) 2.1870 1.9022 2.5059 86.1700 0.0001 0.0289 86.17 Option 2: A=6.876, B=1171.17, C=224.41 Toluene 0.3874 0.3278 0.4559 92.1300 0.0010 0.0511 92.13 Option 2: A=6.954, B=1344.8, C=219.48 Xylene (-m) 0.1083 0.0897 0.1301 106.1700 0.0035 0.0493 106.17 Option 2: A=7.009, B=1462.266, C=215.11Distillate fuel oil no. 2 Jun 62.86 57.86 67.85 64.84 0.0111 0.0094 0.0130 117.7778 186.01 Option 1: VP60 = .0065 VP70 = .009 Benzene 1.2636 1.1004 1.4463 78.1100 0.0003 0.0540 78.11 Option 2: A=6.905, B=1211.033, C=220.79 Cumene (Isopropyl benzene) 0.0569 0.0472 0.0683 120.2000 0.0098 0.0791 120.20 Option 2: A=6.9636, B=1460.793, C=207.78 Cyclohexane 1.3083 1.1430 1.4929 84.1600 0.0001 0.0186 84.16 Option 2: A=6.841, B=1201.53, C=222.65 Distillate fuel oil no. 2 0.0072 0.0061 0.0085 130.0000 0.9842 0.6996 188.00 Option 1: VP60 = .0065 VP70 = .009 Ethyl benzene 0.1198 0.1007 0.1419 106.1700 0.0011 0.0188 106.17 Option 2: A=6.975, B=1424.255, C=213.21 Hexane (-n) 2.0602 1.8095 2.3386 86.1700 0.0001 0.0294 86.17 Option 2: A=6.876, B=1171.17, C=224.41 Toluene 0.3607 0.3088 0.4197 92.1300 0.0010 0.0514 92.13 Option 2: A=6.954, B=1344.8, C=219.48 Xylene (-m) 0.0999 0.0838 0.1185 106.1700 0.0035 0.0491 106.17 Option 2: A=7.009, B=1462.266, C=215.11Distillate fuel oil no. 2 Jul 62.18 56.76 67.59 64.84 0.0108 0.0090 0.0129 117.7424 186.01 Option 1: VP60 = .0065 VP70 = .009 Benzene 1.2402 1.0668 1.4363 78.1100 0.0003 0.0543 78.11 Option 2: A=6.905, B=1211.033, C=220.79 Cumene (Isopropyl benzene) 0.0555 0.0453 0.0677 120.2000 0.0098 0.0789 120.20 Option 2: A=6.9636, B=1460.793, C=207.78 Cyclohexane 1.2847 1.1089 1.4828 84.1600 0.0001 0.0187 84.16 Option 2: A=6.841, B=1201.53, C=222.65 Distillate fuel oil no. 2 0.0070 0.0059 0.0084 130.0000 0.9842 0.6992 188.00 Option 1: VP60 = .0065 VP70 = .009 Ethyl benzene 0.1170 0.0969 0.1407 106.1700 0.0011 0.0188 106.17 Option 2: A=6.975, B=1424.255, C=213.21 Hexane (-n) 2.0244 1.7577 2.3235 86.1700 0.0001 0.0295 86.17 Option 2: A=6.876, B=1171.17, C=224.41 Toluene 0.3532 0.2982 0.4165 92.1300 0.0010 0.0515 92.13 Option 2: A=6.954, B=1344.8, C=219.48 Xylene (-m) 0.0975 0.0806 0.1175 106.1700 0.0035 0.0491 106.17 Option 2: A=7.009, B=1462.266, C=215.11Distillate fuel oil no. 2 Aug 64.27 57.71 70.84 64.84 0.0116 0.0093 0.0142 117.8389 186.01 Option 1: VP60 = .0065 VP70 = .009 Benzene 1.3133 1.0956 1.5658 78.1100 0.0003 0.0536 78.11 Option 2: A=6.905, B=1211.033, C=220.79 Cumene (Isopropyl benzene) 0.0600 0.0470 0.0760 120.2000 0.0098 0.0795 120.20 Option 2: A=6.9636, B=1460.793, C=207.78 Cyclohexane 1.3586 1.1381 1.6132 84.1600 0.0001 0.0185 84.16 Option 2: A=6.841, B=1201.53, C=222.65 Distillate fuel oil no. 2 0.0076 0.0060 0.0093 130.0000 0.9842 0.7002 188.00 Option 1: VP60 = .0065 VP70 = .009 Ethyl benzene 0.1258 0.1002 0.1568 106.1700 0.0011 0.0188 106.17 Option 2: A=6.975, B=1424.255, C=213.21 Hexane (-n) 2.1362 1.8021 2.5195 86.1700 0.0001 0.0290 86.17 Option 2: A=6.876, B=1171.17, C=224.41 Toluene 0.3766 0.3073 0.4588 92.1300 0.0010 0.0512 92.13 Option 2: A=6.954, B=1344.8, C=219.48 Xylene (-m) 0.1049 0.0833 0.1310 106.1700 0.0035 0.0492 106.17 Option 2: A=7.009, B=1462.266, C=215.11Distillate fuel oil no. 2 Sep 66.99 59.50 74.48 64.84 0.0126 0.0099 0.0159 117.9149 186.01 Option 1: VP60 = .0065 VP70 = .009 Benzene 1.4132 1.1517 1.7220 78.1100 0.0003 0.0529 78.11 Option 2: A=6.905, B=1211.033, C=220.79 Cumene (Isopropyl benzene) 0.0662 0.0502 0.0864 120.2000 0.0098 0.0806 120.20 Option 2: A=6.9636, B=1460.793, C=207.78 Cyclohexane 1.4594 1.1951 1.7703 84.1600 0.0001 0.0182 84.16 Option 2: A=6.841, B=1201.53, C=222.65 Distillate fuel oil no. 2 0.0082 0.0064 0.0103 130.0000 0.9842 0.7003 188.00 Option 1: VP60 = .0065 VP70 = .009 Ethyl benzene 0.1379 0.1067 0.1766 106.1700 0.0011 0.0189 106.17 Option 2: A=6.975, B=1424.255, C=213.21 Hexane (-n) 2.2883 1.8886 2.7548 86.1700 0.0001 0.0286 86.17 Option 2: A=6.876, B=1171.17, C=224.41 Toluene 0.4090 0.3250 0.5105 92.1300 0.0010 0.0510 92.13 Option 2: A=6.954, B=1344.8, C=219.48 Xylene (-m) 0.1151 0.0888 0.1478 106.1700 0.0035 0.0495 106.17 Option 2: A=7.009, B=1462.266, C=215.11Distillate fuel oil no. 2 Oct 70.02 61.92 78.11 64.84 0.0138 0.0107 0.0176 117.9470 186.01 Option 1: VP70 = .009 VP80 = .012 Benzene 1.5320 1.2316 1.8906 78.1100 0.0003 0.0524 78.11 Option 2: A=6.905, B=1211.033, C=220.79 Cumene (Isopropyl benzene) 0.0738 0.0550 0.0980 120.2000 0.0098 0.0821 120.20 Option 2: A=6.9636, B=1460.793, C=207.78 Cyclohexane 1.5792 1.2759 1.9395 84.1600 0.0001 0.0180 84.16 Option 2: A=6.841, B=1201.53, C=222.65 Distillate fuel oil no. 2 0.0090 0.0070 0.0114 130.0000 0.9842 0.6990 188.00 Option 1: VP70 = .009 VP80 = .012 Ethyl benzene 0.1525 0.1160 0.1985 106.1700 0.0011 0.0191 106.17 Option 2: A=6.975, B=1424.255, C=213.21 Hexane (-n) 2.4684 2.0112 3.0074 86.1700 0.0001 0.0282 86.17 Option 2: A=6.876, B=1171.17, C=224.41 Toluene 0.4477 0.3504 0.5670 92.1300 0.0010 0.0511 92.13 Option 2: A=6.954, B=1344.8, C=219.48 Xylene (-m) 0.1275 0.0967 0.1663 106.1700 0.0035 0.0502 106.17 Option 2: A=7.009, B=1462.266, C=215.11Distillate fuel oil no. 2 Nov 72.12 63.71 80.53 64.84 0.0148 0.0114 0.0188 118.0247 186.01 Option 1: VP70 = .009 VP80 = .012 Benzene 1.6192 1.2931 2.0102 78.1100 0.0003 0.0518 78.11 Option 2: A=6.905, B=1211.033, C=220.79 Cumene (Isopropyl benzene) 0.0795 0.0587 0.1064 120.2000 0.0098 0.0827 120.20 Option 2: A=6.9636, B=1460.793, C=207.78 Cyclohexane 1.6669 1.3382 2.0594 84.1600 0.0001 0.0178 84.16 Option 2: A=6.841, B=1201.53, C=222.65 Distillate fuel oil no. 2 0.0096 0.0074 0.0122 130.0000 0.9842 0.6996 188.00 Option 1: VP70 = .009 VP80 = .012 Ethyl benzene 0.1635 0.1233 0.2144 106.1700 0.0011 0.0192 106.17 Option 2: A=6.975, B=1424.255, C=213.21 Hexane (-n) 2.6001 2.1054 3.1859 86.1700 0.0001 0.0277 86.17 Option 2: A=6.876, B=1171.17, C=224.41 Toluene 0.4764 0.3702 0.6074 92.1300 0.0010 0.0508 92.13 Option 2: A=6.954, B=1344.8, C=219.48 Xylene (-m) 0.1367 0.1028 0.1798 106.1700 0.0035 0.0503 106.17 Option 2: A=7.009, B=1462.266, C=215.11
Page 10 of 24TANKS 4.0 Report
15/12/2015file:///C:/TANKS/Run%20Files/summarydisplay.htm

Distillate fuel oil no. 2 Dec 73.77 65.37 82.18 64.84 0.0155 0.0120 0.0198 118.0653 186.01 Option 1: VP70 = .009 VP80 = .012 Benzene 1.6908 1.3527 2.0956 78.1100 0.0003 0.0515 78.11 Option 2: A=6.905, B=1211.033, C=220.79 Cumene (Isopropyl benzene) 0.0843 0.0624 0.1125 120.2000 0.0098 0.0834 120.20 Option 2: A=6.9636, B=1460.793, C=207.78 Cyclohexane 1.7389 1.3984 2.1448 84.1600 0.0001 0.0176 84.16 Option 2: A=6.841, B=1201.53, C=222.65 Distillate fuel oil no. 2 0.0101 0.0078 0.0129 130.0000 0.9842 0.6995 188.00 Option 1: VP70 = .009 VP80 = .012 Ethyl benzene 0.1726 0.1305 0.2258 106.1700 0.0011 0.0193 106.17 Option 2: A=6.975, B=1424.255, C=213.21 Hexane (-n) 2.7079 2.1963 3.3128 86.1700 0.0001 0.0275 86.17 Option 2: A=6.876, B=1171.17, C=224.41 Toluene 0.5001 0.3894 0.6364 92.1300 0.0010 0.0507 92.13 Option 2: A=6.954, B=1344.8, C=219.48 Xylene (-m) 0.1444 0.1089 0.1895 106.1700 0.0035 0.0505 106.17 Option 2: A=7.009, B=1462.266, C=215.11
Page 11 of 24TANKS 4.0 Report
15/12/2015file:///C:/TANKS/Run%20Files/summarydisplay.htm

TANKS 4.0.9dEmissions Report - Detail Format
Detail Calculations (AP-42)
VOPAK 110-01, -02, -03 - Vertical Fixed Roof TankSydney Airport Amo, NSW
Month: January February March April May June July August September October November DecemberStanding Losses (lb): 359.2188 Vapor Space Volume (cu ft): 602,281.9370 Vapor Density (lb/cu ft): 0.0003 Vapor Space Expansion Factor: 0.0609 Vented Vapor Saturation Factor: 0.9694
Tank Vapor Space Volume: Vapor Space Volume (cu ft): 602,281.9370 Tank Diameter (ft): 142.7100 Vapor Space Outage (ft): 37.6531 Tank Shell Height (ft): 79.8900 Average Liquid Height (ft): 49.2120 Roof Outage (ft): 6.9751
Roof Outage (Dome Roof) Roof Outage (ft): 6.9751 Dome Radius (ft): 142.7100 Shell Radius (ft): 71.3550
Vapor Density Vapor Density (lb/cu ft): 0.0003 Vapor Molecular Weight (lb/lb-mole): 118.0761 Vapor Pressure at Daily Average Liquid Surface Temperature (psia): 0.0158 Daily Avg. Liquid Surface Temp. (deg. R): 534.0495 Daily Average Ambient Temp. (deg. F): 72.2500 Ideal Gas Constant R (psia cuft / (lb-mol-deg R)): 10.731 Liquid Bulk Temperature (deg. R): 524.5100 Tank Paint Solar Absorptance (Shell): 0.3900 Tank Paint Solar Absorptance (Roof): 0.3900 Daily Total Solar Insulation Factor (Btu/sqft day): 2,038.0000
Vapor Space Expansion Factor Vapor Space Expansion Factor: 0.0609 Daily Vapor Temperature Range (deg. R): 32.2630 Daily Vapor Pressure Range (psia): 0.0076 Breather Vent Press. Setting Range(psia): 0.0000 Vapor Pressure at Daily Average Liquid Surface Temperature (psia): 0.0158 Vapor Pressure at Daily Minimum Liquid Surface Temperature (psia): 0.0124 Vapor Pressure at Daily Maximum Liquid Surface Temperature (psia): 0.0199 Daily Avg. Liquid Surface Temp. (deg R): 534.0495 Daily Min. Liquid Surface Temp. (deg R): 525.9837 Daily Max. Liquid Surface Temp. (deg R): 542.1152 Daily Ambient Temp. Range (deg. R): 13.9000
Vented Vapor Saturation Factor Vented Vapor Saturation Factor: 0.9694 Vapor Pressure at Daily Average Liquid: Surface Temperature (psia): 0.0158
Page 12 of 24TANKS 4.0 Report
15/12/2015file:///C:/TANKS/Run%20Files/summarydisplay.htm

Vapor Space Outage (ft): 37.6531
Working Losses (lb): 821.9557 Vapor Molecular Weight (lb/lb-mole): 118.0761 Vapor Pressure at Daily Average Liquid Surface Temperature (psia): 0.0158 Net Throughput (gal/mo.): 18,492,040.0000 Annual Turnovers: 24.0000 Turnover Factor: 1.0000 Maximum Liquid Volume (gal): 9,246,020.0000 Maximum Liquid Height (ft): 77.2600 Tank Diameter (ft): 142.7100 Working Loss Product Factor: 1.0000
Total Losses (lb): 1,181.1745
Page 13 of 24TANKS 4.0 Report
15/12/2015file:///C:/TANKS/Run%20Files/summarydisplay.htm

Page 14 of 24TANKS 4.0 Report
15/12/2015file:///C:/TANKS/Run%20Files/summarydisplay.htm

TANKS 4.0.9dEmissions Report - Detail FormatIndividual Tank Emission Totals
Emissions Report for: January, February, March, April, May, June, July, August, September, October, November, December
VOPAK 110-01, -02, -03 - Vertical Fixed Roof TankSydney Airport Amo, NSW
Losses(lbs)
Components Working Loss Breathing Loss Total EmissionsDistillate fuel oil no. 2 8,401.54 3,229.04 11,630.59
Benzene 440.64 169.02 609.66 Cumene (Isopropyl benzene) 686.17 264.32 950.48
Cyclohexane 151.47 58.08 209.56 Distillate fuel oil no. 2 5,878.07 2,259.11 8,137.18 Ethyl benzene 160.19 61.64 221.83
Hexane (-n) 236.94 90.81 327.75 Toluene 428.35 164.55 592.90
Xylene (-m) 419.72 161.52 581.24
Page 15 of 24TANKS 4.0 Report
15/12/2015file:///C:/TANKS/Run%20Files/summarydisplay.htm

TANKS 4.0.9dEmissions Report - Detail Format
Tank Indentification and Physical Characteristics
IdentificationUser Identification: VOPAK 110-06 & 110-07City: Sydney Airport AmoState: NSWCompany: VOPAKType of Tank: Domed External Floating Roof TankDescription: Domed External Floating Roof Tanks - gasoline - B4B
Tank DimensionsDiameter (ft): 95.14Volume (gallons): 4,247,886.00Turnovers: 24.00
Paint CharacteristicsInternal Shell Condition: Light RustShell Color/Shade: Aluminum/SpecularShell Condition Good
Roof CharacteristicsType: Double DeckFitting Category Typical
Tank Construction and Rim-Seal SystemConstruction: WeldedPrimary Seal: Mechanical ShoeSecondary Seal None
Deck Fitting/Status QuantityAccess Hatch (24-in. Diam.)/Bolted Cover, Gasketed 1Automatic Gauge Float Well/Unbolted Cover, Ungasketed 1Vacuum Breaker (10-in. Diam.)/Weighted Mech. Actuation, Gask. 1Unslotted Guide-Pole Well/Ungasketed Sliding Cover 1Gauge-Hatch/Sample Well (8-in. Diam.)/Weighted Mech. Actuation, Gask. 1Roof Drain (3-in. Diameter)/Open 1Roof Leg (3-in. Diameter)/Adjustable, Double-Deck Roofs 25Rim Vent (6-in. Diameter)/Weighted Mech. Actuation, Gask. 1
Meterological Data used in Emissions Calculations: Sydney Airport Amo, NSW (Avg Atmospheric Pressure = 14.74 psia)
Page 16 of 24TANKS 4.0 Report
15/12/2015file:///C:/TANKS/Run%20Files/summarydisplay.htm

TANKS 4.0.9dEmissions Report - Detail FormatLiquid Contents of Storage Tank
VOPAK 110-06 & 110-07 - Domed External Floating Roof TankSydney Airport Amo, NSW
Daily Liquid Surf.Temperature (deg F)
LiquidBulk
Temp Vapor Pressure (psia)Vapor
Mol.LiquidMass
VaporMass Mol. Basis for Vapor Pressure
Mixture/Component Month Avg. Min. Max. (deg F) Avg. Min. Max. Weight. Fract. Fract. Weight Calculations
Gasoline (RVP 10) Jan 74.38 66.31 82.45 64.84 5.7233 N/A N/A 66.4970 92.84 Option 4: RVP=10, ASTM Slope=3 Benzene 1.7176 N/A N/A 78.1100 0.0093 0.0039 78.11 Option 2: A=6.905, B=1211.033, C=220.79 Cumene (Isopropyl benzene) 0.0861 N/A N/A 120.2000 0.0010 0.0000 120.20 Option 2: A=6.9636, B=1460.793, C=207.78 Cyclohexane 1.7659 N/A N/A 84.1600 0.0077 0.0033 84.16 Option 2: A=6.841, B=1201.53, C=222.65 Ethyl benzene 0.1760 N/A N/A 106.1700 0.0153 0.0007 106.17 Option 2: A=6.975, B=1424.255, C=213.21 Gasoline (RVP 10) 6.8023 N/A N/A 66.0000 0.8149 0.9701 92.00 Option 4: RVP=10, ASTM Slope=3 Hexane (-n) 2.7482 N/A N/A 86.1700 0.0183 0.0123 86.17 Option 2: A=6.876, B=1171.17, C=224.41 Toluene 0.5091 N/A N/A 92.1300 0.0560 0.0070 92.13 Option 2: A=6.954, B=1344.8, C=219.48 Xylene (-m) 0.1473 N/A N/A 106.1700 0.0775 0.0028 106.17 Option 2: A=7.009, B=1462.266, C=215.11Gasoline (RVP 10) Feb 73.73 66.39 81.07 64.84 5.6548 N/A N/A 66.4942 92.84 Option 4: RVP=10, ASTM Slope=3 Benzene 1.6889 N/A N/A 78.1100 0.0093 0.0039 78.11 Option 2: A=6.905, B=1211.033, C=220.79 Cumene (Isopropyl benzene) 0.0842 N/A N/A 120.2000 0.0010 0.0000 120.20 Option 2: A=6.9636, B=1460.793, C=207.78 Cyclohexane 1.7371 N/A N/A 84.1600 0.0077 0.0033 84.16 Option 2: A=6.841, B=1201.53, C=222.65 Ethyl benzene 0.1724 N/A N/A 106.1700 0.0153 0.0007 106.17 Option 2: A=6.975, B=1424.255, C=213.21 Gasoline (RVP 10) 6.7217 N/A N/A 66.0000 0.8149 0.9703 92.00 Option 4: RVP=10, ASTM Slope=3 Hexane (-n) 2.7051 N/A N/A 86.1700 0.0183 0.0122 86.17 Option 2: A=6.876, B=1171.17, C=224.41 Toluene 0.4995 N/A N/A 92.1300 0.0560 0.0069 92.13 Option 2: A=6.954, B=1344.8, C=219.48 Xylene (-m) 0.1442 N/A N/A 106.1700 0.0775 0.0028 106.17 Option 2: A=7.009, B=1462.266, C=215.11Gasoline (RVP 10) Mar 72.23 65.18 79.29 64.84 5.4992 N/A N/A 66.4877 92.84 Option 4: RVP=10, ASTM Slope=3 Benzene 1.6242 N/A N/A 78.1100 0.0093 0.0038 78.11 Option 2: A=6.905, B=1211.033, C=220.79 Cumene (Isopropyl benzene) 0.0799 N/A N/A 120.2000 0.0010 0.0000 120.20 Option 2: A=6.9636, B=1460.793, C=207.78 Cyclohexane 1.6720 N/A N/A 84.1600 0.0077 0.0032 84.16 Option 2: A=6.841, B=1201.53, C=222.65 Ethyl benzene 0.1641 N/A N/A 106.1700 0.0153 0.0006 106.17 Option 2: A=6.975, B=1424.255, C=213.21 Gasoline (RVP 10) 6.5386 N/A N/A 66.0000 0.8149 0.9706 92.00 Option 4: RVP=10, ASTM Slope=3 Hexane (-n) 2.6076 N/A N/A 86.1700 0.0183 0.0121 86.17 Option 2: A=6.876, B=1171.17, C=224.41 Toluene 0.4781 N/A N/A 92.1300 0.0560 0.0068 92.13 Option 2: A=6.954, B=1344.8, C=219.48 Xylene (-m) 0.1372 N/A N/A 106.1700 0.0775 0.0027 106.17 Option 2: A=7.009, B=1462.266, C=215.11Gasoline (RVP 10) Apr 68.85 62.48 75.22 64.84 5.1600 N/A N/A 66.4732 92.84 Option 4: RVP=10, ASTM Slope=3 Benzene 1.4853 N/A N/A 78.1100 0.0093 0.0038 78.11 Option 2: A=6.905, B=1211.033, C=220.79 Cumene (Isopropyl benzene) 0.0708 N/A N/A 120.2000 0.0010 0.0000 120.20 Option 2: A=6.9636, B=1460.793, C=207.78 Cyclohexane 1.5322 N/A N/A 84.1600 0.0077 0.0032 84.16 Option 2: A=6.841, B=1201.53, C=222.65 Ethyl benzene 0.1467 N/A N/A 106.1700 0.0153 0.0006 106.17 Option 2: A=6.975, B=1424.255, C=213.21 Gasoline (RVP 10) 6.1391 N/A N/A 66.0000 0.8149 0.9714 92.00 Option 4: RVP=10, ASTM Slope=3 Hexane (-n) 2.3978 N/A N/A 86.1700 0.0183 0.0119 86.17 Option 2: A=6.876, B=1171.17, C=224.41 Toluene 0.4325 N/A N/A 92.1300 0.0560 0.0066 92.13 Option 2: A=6.954, B=1344.8, C=219.48 Xylene (-m) 0.1226 N/A N/A 106.1700 0.0775 0.0026 106.17 Option 2: A=7.009, B=1462.266, C=215.11Gasoline (RVP 10) May 65.20 59.77 70.62 64.84 4.8130 N/A N/A 66.4576 92.84 Option 4: RVP=10, ASTM Slope=3 Benzene 1.3466 N/A N/A 78.1100 0.0093 0.0036 78.11 Option 2: A=6.905, B=1211.033, C=220.79 Cumene (Isopropyl benzene) 0.0620 N/A N/A 120.2000 0.0010 0.0000 120.20 Option 2: A=6.9636, B=1460.793, C=207.78 Cyclohexane 1.3922 N/A N/A 84.1600 0.0077 0.0031 84.16 Option 2: A=6.841, B=1201.53, C=222.65 Ethyl benzene 0.1298 N/A N/A 106.1700 0.0153 0.0006 106.17 Option 2: A=6.975, B=1424.255, C=213.21
Page 17 of 24TANKS 4.0 Report
15/12/2015file:///C:/TANKS/Run%20Files/summarydisplay.htm

Gasoline (RVP 10) 5.7300 N/A N/A 66.0000 0.8149 0.9723 92.00 Option 4: RVP=10, ASTM Slope=3 Hexane (-n) 2.1870 N/A N/A 86.1700 0.0183 0.0116 86.17 Option 2: A=6.876, B=1171.17, C=224.41 Toluene 0.3874 N/A N/A 92.1300 0.0560 0.0063 92.13 Option 2: A=6.954, B=1344.8, C=219.48 Xylene (-m) 0.1083 N/A N/A 106.1700 0.0775 0.0024 106.17 Option 2: A=7.009, B=1462.266, C=215.11Gasoline (RVP 10) Jun 62.86 57.86 67.85 64.84 4.6008 N/A N/A 66.4478 92.84 Option 4: RVP=10, ASTM Slope=3 Benzene 1.2636 N/A N/A 78.1100 0.0093 0.0036 78.11 Option 2: A=6.905, B=1211.033, C=220.79 Cumene (Isopropyl benzene) 0.0569 N/A N/A 120.2000 0.0010 0.0000 120.20 Option 2: A=6.9636, B=1460.793, C=207.78 Cyclohexane 1.3083 N/A N/A 84.1600 0.0077 0.0030 84.16 Option 2: A=6.841, B=1201.53, C=222.65 Ethyl benzene 0.1198 N/A N/A 106.1700 0.0153 0.0006 106.17 Option 2: A=6.975, B=1424.255, C=213.21 Gasoline (RVP 10) 5.4797 N/A N/A 66.0000 0.8149 0.9729 92.00 Option 4: RVP=10, ASTM Slope=3 Hexane (-n) 2.0602 N/A N/A 86.1700 0.0183 0.0114 86.17 Option 2: A=6.876, B=1171.17, C=224.41 Toluene 0.3607 N/A N/A 92.1300 0.0560 0.0061 92.13 Option 2: A=6.954, B=1344.8, C=219.48 Xylene (-m) 0.0999 N/A N/A 106.1700 0.0775 0.0023 106.17 Option 2: A=7.009, B=1462.266, C=215.11Gasoline (RVP 10) Jul 62.18 56.76 67.59 64.84 4.5404 N/A N/A 66.4450 92.84 Option 4: RVP=10, ASTM Slope=3 Benzene 1.2402 N/A N/A 78.1100 0.0093 0.0036 78.11 Option 2: A=6.905, B=1211.033, C=220.79 Cumene (Isopropyl benzene) 0.0555 N/A N/A 120.2000 0.0010 0.0000 120.20 Option 2: A=6.9636, B=1460.793, C=207.78 Cyclohexane 1.2847 N/A N/A 84.1600 0.0077 0.0030 84.16 Option 2: A=6.841, B=1201.53, C=222.65 Ethyl benzene 0.1170 N/A N/A 106.1700 0.0153 0.0006 106.17 Option 2: A=6.975, B=1424.255, C=213.21 Gasoline (RVP 10) 5.4085 N/A N/A 66.0000 0.8149 0.9730 92.00 Option 4: RVP=10, ASTM Slope=3 Hexane (-n) 2.0244 N/A N/A 86.1700 0.0183 0.0114 86.17 Option 2: A=6.876, B=1171.17, C=224.41 Toluene 0.3532 N/A N/A 92.1300 0.0560 0.0061 92.13 Option 2: A=6.954, B=1344.8, C=219.48 Xylene (-m) 0.0975 N/A N/A 106.1700 0.0775 0.0023 106.17 Option 2: A=7.009, B=1462.266, C=215.11Gasoline (RVP 10) Aug 64.27 57.71 70.84 64.84 4.7283 N/A N/A 66.4538 92.84 Option 4: RVP=10, ASTM Slope=3 Benzene 1.3133 N/A N/A 78.1100 0.0093 0.0036 78.11 Option 2: A=6.905, B=1211.033, C=220.79 Cumene (Isopropyl benzene) 0.0600 N/A N/A 120.2000 0.0010 0.0000 120.20 Option 2: A=6.9636, B=1460.793, C=207.78 Cyclohexane 1.3586 N/A N/A 84.1600 0.0077 0.0031 84.16 Option 2: A=6.841, B=1201.53, C=222.65 Ethyl benzene 0.1258 N/A N/A 106.1700 0.0153 0.0006 106.17 Option 2: A=6.975, B=1424.255, C=213.21 Gasoline (RVP 10) 5.6302 N/A N/A 66.0000 0.8149 0.9725 92.00 Option 4: RVP=10, ASTM Slope=3 Hexane (-n) 2.1362 N/A N/A 86.1700 0.0183 0.0116 86.17 Option 2: A=6.876, B=1171.17, C=224.41 Toluene 0.3766 N/A N/A 92.1300 0.0560 0.0062 92.13 Option 2: A=6.954, B=1344.8, C=219.48 Xylene (-m) 0.1049 N/A N/A 106.1700 0.0775 0.0024 106.17 Option 2: A=7.009, B=1462.266, C=215.11Gasoline (RVP 10) Sep 66.99 59.50 74.48 64.84 4.9806 N/A N/A 66.4652 92.84 Option 4: RVP=10, ASTM Slope=3 Benzene 1.4132 N/A N/A 78.1100 0.0093 0.0037 78.11 Option 2: A=6.905, B=1211.033, C=220.79 Cumene (Isopropyl benzene) 0.0662 N/A N/A 120.2000 0.0010 0.0000 120.20 Option 2: A=6.9636, B=1460.793, C=207.78 Cyclohexane 1.4594 N/A N/A 84.1600 0.0077 0.0031 84.16 Option 2: A=6.841, B=1201.53, C=222.65 Ethyl benzene 0.1379 N/A N/A 106.1700 0.0153 0.0006 106.17 Option 2: A=6.975, B=1424.255, C=213.21 Gasoline (RVP 10) 5.9277 N/A N/A 66.0000 0.8149 0.9719 92.00 Option 4: RVP=10, ASTM Slope=3 Hexane (-n) 2.2883 N/A N/A 86.1700 0.0183 0.0117 86.17 Option 2: A=6.876, B=1171.17, C=224.41 Toluene 0.4090 N/A N/A 92.1300 0.0560 0.0064 92.13 Option 2: A=6.954, B=1344.8, C=219.48 Xylene (-m) 0.1151 N/A N/A 106.1700 0.0775 0.0025 106.17 Option 2: A=7.009, B=1462.266, C=215.11Gasoline (RVP 10) Oct 70.02 61.92 78.11 64.84 5.2749 N/A N/A 66.4781 92.84 Option 4: RVP=10, ASTM Slope=3 Benzene 1.5320 N/A N/A 78.1100 0.0093 0.0038 78.11 Option 2: A=6.905, B=1211.033, C=220.79 Cumene (Isopropyl benzene) 0.0738 N/A N/A 120.2000 0.0010 0.0000 120.20 Option 2: A=6.9636, B=1460.793, C=207.78 Cyclohexane 1.5792 N/A N/A 84.1600 0.0077 0.0032 84.16 Option 2: A=6.841, B=1201.53, C=222.65 Ethyl benzene 0.1525 N/A N/A 106.1700 0.0153 0.0006 106.17 Option 2: A=6.975, B=1424.255, C=213.21 Gasoline (RVP 10) 6.2744 N/A N/A 66.0000 0.8149 0.9712 92.00 Option 4: RVP=10, ASTM Slope=3 Hexane (-n) 2.4684 N/A N/A 86.1700 0.0183 0.0120 86.17 Option 2: A=6.876, B=1171.17, C=224.41 Toluene 0.4477 N/A N/A 92.1300 0.0560 0.0066 92.13 Option 2: A=6.954, B=1344.8, C=219.48 Xylene (-m) 0.1275 N/A N/A 106.1700 0.0775 0.0026 106.17 Option 2: A=7.009, B=1462.266, C=215.11Gasoline (RVP 10) Nov 72.12 63.71 80.53 64.84 5.4871 N/A N/A 66.4872 92.84 Option 4: RVP=10, ASTM Slope=3 Benzene 1.6192 N/A N/A 78.1100 0.0093 0.0038 78.11 Option 2: A=6.905, B=1211.033, C=220.79 Cumene (Isopropyl benzene) 0.0795 N/A N/A 120.2000 0.0010 0.0000 120.20 Option 2: A=6.9636, B=1460.793, C=207.78 Cyclohexane 1.6669 N/A N/A 84.1600 0.0077 0.0032 84.16 Option 2: A=6.841, B=1201.53, C=222.65 Ethyl benzene 0.1635 N/A N/A 106.1700 0.0153 0.0006 106.17 Option 2: A=6.975, B=1424.255, C=213.21 Gasoline (RVP 10) 6.5243 N/A N/A 66.0000 0.8149 0.9707 92.00 Option 4: RVP=10, ASTM Slope=3 Hexane (-n) 2.6001 N/A N/A 86.1700 0.0183 0.0121 86.17 Option 2: A=6.876, B=1171.17, C=224.41 Toluene 0.4764 N/A N/A 92.1300 0.0560 0.0068 92.13 Option 2: A=6.954, B=1344.8, C=219.48 Xylene (-m) 0.1367 N/A N/A 106.1700 0.0775 0.0027 106.17 Option 2: A=7.009, B=1462.266, C=215.11
Page 18 of 24TANKS 4.0 Report
15/12/2015file:///C:/TANKS/Run%20Files/summarydisplay.htm

Gasoline (RVP 10) Dec 73.77 65.37 82.18 64.84 5.6592 N/A N/A 66.4944 92.84 Option 4: RVP=10, ASTM Slope=3 Benzene 1.6908 N/A N/A 78.1100 0.0093 0.0039 78.11 Option 2: A=6.905, B=1211.033, C=220.79 Cumene (Isopropyl benzene) 0.0843 N/A N/A 120.2000 0.0010 0.0000 120.20 Option 2: A=6.9636, B=1460.793, C=207.78 Cyclohexane 1.7389 N/A N/A 84.1600 0.0077 0.0033 84.16 Option 2: A=6.841, B=1201.53, C=222.65 Ethyl benzene 0.1726 N/A N/A 106.1700 0.0153 0.0007 106.17 Option 2: A=6.975, B=1424.255, C=213.21 Gasoline (RVP 10) 6.7269 N/A N/A 66.0000 0.8149 0.9703 92.00 Option 4: RVP=10, ASTM Slope=3 Hexane (-n) 2.7079 N/A N/A 86.1700 0.0183 0.0122 86.17 Option 2: A=6.876, B=1171.17, C=224.41 Toluene 0.5001 N/A N/A 92.1300 0.0560 0.0069 92.13 Option 2: A=6.954, B=1344.8, C=219.48 Xylene (-m) 0.1444 N/A N/A 106.1700 0.0775 0.0028 106.17 Option 2: A=7.009, B=1462.266, C=215.11
Page 19 of 24TANKS 4.0 Report
15/12/2015file:///C:/TANKS/Run%20Files/summarydisplay.htm

TANKS 4.0.9dEmissions Report - Detail Format
Detail Calculations (AP-42)
VOPAK 110-06 & 110-07 - Domed External Floating Roof TankSydney Airport Amo, NSW
Month: January February March April May June July August September October November DecemberRim Seal Losses (lb): 373.8395 Seal Factor A (lb-mole/ft-yr): 5.8000 Seal Factor B (lb-mole/ft-yr (mph)^n): 0.3000 Average Wind Speed (mph): 0.0000 Seal-related Wind Speed Exponent: 2.1000 Value of Vapor Pressure Function: 0.1223 Vapor Pressure at Daily Average Liquid Surface Temperature (psia): 5.7233 Tank Diameter (ft): 95.1400 Vapor Molecular Weight (lb/lb-mole): 66.4970 Product Factor: 1.0000
Withdrawal Losses (lb): 17.4913 Net Throughput (gal/mo.): 8,495,772.0000 Shell Clingage Factor (bbl/1000 sqft): 0.0015 Average Organic Liquid Density (lb/gal): 5.8161 Tank Diameter (ft): 95.1400
Roof Fitting Losses (lb): 51.4746 Value of Vapor Pressure Function: 0.1223 Vapor Molecular Weight (lb/lb-mole): 66.4970 Product Factor: 1.0000 Tot. Roof Fitting Loss Fact.(lb-mole/yr): 75.9800 Average Wind Speed (mph): 0.0000
Total Losses (lb): 442.8054Roof Fitting Loss Factors
Roof Fitting/Status Quantity KFa(lb-mole/yr) KFb(lb-mole/(yr mph^n)) m Losses(lb)Access Hatch (24-in. Diam.)/Bolted Cover, Gasketed 1 1.60 0.00 0.00 1.1048Automatic Gauge Float Well/Unbolted Cover, Ungasketed 1 14.00 5.40 1.10 9.6666Vacuum Breaker (10-in. Diam.)/Weighted Mech. Actuation, Gask. 1 6.20 1.20 0.94 4.2809Unslotted Guide-Pole Well/Ungasketed Sliding Cover 1 31.00 150.00 1.40 21.4045Gauge-Hatch/Sample Well (8-in. Diam.)/Weighted Mech. Actuation, Gask. 1 0.47 0.02 0.97 0.3245Roof Drain (3-in. Diameter)/Open 1 1.50 0.21 1.70 1.0357Roof Leg (3-in. Diameter)/Adjustable, Double-Deck Roofs 25 0.82 0.53 0.14 14.1546Rim Vent (6-in. Diameter)/Weighted Mech. Actuation, Gask. 1 0.71 0.10 1.00 0.4902
Page 20 of 24TANKS 4.0 Report
15/12/2015file:///C:/TANKS/Run%20Files/summarydisplay.htm

Page 21 of 24TANKS 4.0 Report
15/12/2015file:///C:/TANKS/Run%20Files/summarydisplay.htm

TANKS 4.0.9dEmissions Report - Detail FormatIndividual Tank Emission Totals
Emissions Report for: January, February, March, April, May, June, July, August, September, October, November, December
VOPAK 110-06 & 110-07 - Domed External Floating Roof TankSydney Airport Amo, NSW
Losses(lbs)
Components Rim Seal Loss Withdrawl Loss Deck Fitting Loss Deck Seam Loss Total EmissionsGasoline (RVP 10) 3,960.23 209.90 545.29 0.00 4,715.42
Benzene 14.91 1.96 2.05 0.00 18.92 Cumene (Isopropyl benzene) 0.08 0.21 0.01 0.00 0.30
Cyclohexane 12.61 1.61 1.74 0.00 15.95 Ethyl benzene 2.43 3.22 0.33 0.00 5.98 Gasoline (RVP 10) 3,846.67 171.04 529.66 0.00 4,547.37
Hexane (-n) 47.16 3.84 6.49 0.00 57.50 Toluene 26.12 11.76 3.60 0.00 41.47
Xylene (-m) 10.26 16.26 1.41 0.00 27.93
Page 22 of 24TANKS 4.0 Report
15/12/2015file:///C:/TANKS/Run%20Files/summarydisplay.htm

AECOM Vopak Terminal B4Air Quality Impact Assessment
27-May-2016Prepared for – Vopak Terminals Pty Ltd – ABN: 67 004 754 750
C
cAppendix C
Emission Rates

AECOM Vopak Terminal B4Air Quality Impact Assessment
27-May-2016Prepared for – Vopak Terminals Pty Ltd – ABN: 67 004 754 750
c-1
Appendix C Emission Rates
TANK MonthMonthly Emission Rate g/s
Benzene Cumene Cyclohexane Ethylbenzene Hexane Toluene Xylene
DT01
January 1.03E-02 1.67E-02 3.52E-03 3.86E-03 5.48E-03 1.01E-02 1.01E-02
February 1.06E-02 1.71E-02 3.63E-03 3.96E-03 5.65E-03 1.04E-02 1.04E-02
March 9.37E-03 1.50E-02 3.21E-03 3.47E-03 5.01E-03 9.19E-03 9.10E-03
April 8.57E-03 1.33E-02 2.95E-03 3.11E-03 4.61E-03 8.32E-03 8.14E-03
May 7.32E-03 1.10E-02 2.52E-03 2.59E-03 3.96E-03 7.02E-03 6.77E-03
June 6.93E-03 1.01E-02 2.39E-03 2.41E-03 3.77E-03 6.59E-03 6.30E-03
July 6.76E-03 9.83E-03 2.33E-03 2.34E-03 3.68E-03 6.42E-03 6.11E-03
August 7.50E-03 1.11E-02 2.59E-03 2.63E-03 4.06E-03 7.17E-03 6.88E-03
September 8.54E-03 1.30E-02 2.94E-03 3.06E-03 4.61E-03 8.24E-03 8.00E-03
October 9.22E-03 1.44E-02 3.17E-03 3.37E-03 4.95E-03 8.99E-03 8.83E-03
November 1.01E-02 1.61E-02 3.45E-03 3.73E-03 5.39E-03 9.87E-03 9.77E-03
December 1.02E-02 1.66E-02 3.51E-03 3.84E-03 5.47E-03 1.01E-02 1.01E-02
DT02
January 1.03E-02 1.67E-02 3.52E-03 3.86E-03 5.48E-03 1.01E-02 1.01E-02
February 1.06E-02 1.71E-02 3.63E-03 3.96E-03 5.65E-03 1.04E-02 1.04E-02
March 9.37E-03 1.50E-02 3.21E-03 3.47E-03 5.01E-03 9.19E-03 9.10E-03
April 8.57E-03 1.33E-02 2.95E-03 3.11E-03 4.61E-03 8.32E-03 8.14E-03
May 7.32E-03 1.10E-02 2.52E-03 2.59E-03 3.96E-03 7.02E-03 6.77E-03
June 6.93E-03 1.01E-02 2.39E-03 2.41E-03 3.77E-03 6.59E-03 6.30E-03
July 6.76E-03 9.83E-03 2.33E-03 2.34E-03 3.68E-03 6.42E-03 6.11E-03
August 7.50E-03 1.11E-02 2.59E-03 2.63E-03 4.06E-03 7.17E-03 6.88E-03
September 8.54E-03 1.30E-02 2.94E-03 3.06E-03 4.61E-03 8.24E-03 8.00E-03
October 9.22E-03 1.44E-02 3.17E-03 3.37E-03 4.95E-03 8.99E-03 8.83E-03
November 1.01E-02 1.61E-02 3.45E-03 3.73E-03 5.39E-03 9.87E-03 9.77E-03
December 1.02E-02 1.66E-02 3.51E-03 3.84E-03 5.47E-03 1.01E-02 1.01E-02
DT03
January 1.03E-02 1.67E-02 3.52E-03 3.86E-03 5.48E-03 1.01E-02 1.01E-02
February 1.06E-02 1.71E-02 3.63E-03 3.96E-03 5.65E-03 1.04E-02 1.04E-02
March 9.37E-03 1.50E-02 3.21E-03 3.47E-03 5.01E-03 9.19E-03 9.10E-03
April 8.57E-03 1.33E-02 2.95E-03 3.11E-03 4.61E-03 8.32E-03 8.14E-03
May 7.32E-03 1.10E-02 2.52E-03 2.59E-03 3.96E-03 7.02E-03 6.77E-03
June 6.93E-03 1.01E-02 2.39E-03 2.41E-03 3.77E-03 6.59E-03 6.30E-03
July 6.76E-03 9.83E-03 2.33E-03 2.34E-03 3.68E-03 6.42E-03 6.11E-03
August 7.50E-03 1.11E-02 2.59E-03 2.63E-03 4.06E-03 7.17E-03 6.88E-03

AECOM Vopak Terminal B4Air Quality Impact Assessment
27-May-2016Prepared for – Vopak Terminals Pty Ltd – ABN: 67 004 754 750
c-2
TANK MonthMonthly Emission Rate g/s
Benzene Cumene Cyclohexane Ethylbenzene Hexane Toluene Xylene
September 8.54E-03 1.30E-02 2.94E-03 3.06E-03 4.61E-03 8.24E-03 8.00E-03
October 9.22E-03 1.44E-02 3.17E-03 3.37E-03 4.95E-03 8.99E-03 8.83E-03
November 1.01E-02 1.61E-02 3.45E-03 3.73E-03 5.39E-03 9.87E-03 9.77E-03
December 1.02E-02 1.66E-02 3.51E-03 3.84E-03 5.47E-03 1.01E-02 1.01E-02
GT04
January 4.31E-04 6.17E-06 3.62E-04 1.28E-04 1.31E-03 9.27E-04 5.94E-04
February 4.68E-04 6.77E-06 3.94E-04 1.40E-04 1.42E-03 1.01E-03 6.50E-04
March 4.05E-04 5.99E-06 3.41E-04 1.23E-04 1.23E-03 8.77E-04 5.72E-04
April 3.81E-04 5.94E-06 3.21E-04 1.20E-04 1.16E-03 8.33E-04 5.59E-04
May 3.33E-04 5.51E-06 2.81E-04 1.09E-04 1.01E-03 7.37E-04 5.11E-04
June 3.23E-04 5.56E-06 2.73E-04 1.08E-04 9.83E-04 7.21E-04 5.11E-04
July 3.06E-04 5.34E-06 2.59E-04 1.04E-04 9.34E-04 6.86E-04 4.89E-04
August 3.25E-04 5.46E-06 2.74E-04 1.07E-04 9.89E-04 7.21E-04 5.04E-04
September 3.62E-04 5.81E-06 3.05E-04 1.16E-04 1.10E-03 7.95E-04 5.43E-04
October 3.81E-04 5.83E-06 3.21E-04 1.18E-04 1.16E-03 8.29E-04 5.51E-04
November 4.18E-04 6.18E-06 3.52E-04 1.27E-04 1.27E-03 9.04E-04 5.90E-04
December 4.23E-04 6.12E-06 3.56E-04 1.27E-04 1.29E-03 9.12E-04 5.88E-04
GT05
January 4.31E-04 6.17E-06 3.62E-04 1.28E-04 1.31E-03 9.27E-04 5.94E-04
February 4.68E-04 6.77E-06 3.94E-04 1.40E-04 1.42E-03 1.01E-03 6.50E-04
March 4.05E-04 5.99E-06 3.41E-04 1.23E-04 1.23E-03 8.77E-04 5.72E-04
April 3.81E-04 5.94E-06 3.21E-04 1.20E-04 1.16E-03 8.33E-04 5.59E-04
May 3.33E-04 5.51E-06 2.81E-04 1.09E-04 1.01E-03 7.37E-04 5.11E-04
June 3.23E-04 5.56E-06 2.73E-04 1.08E-04 9.83E-04 7.21E-04 5.11E-04
July 3.06E-04 5.34E-06 2.59E-04 1.04E-04 9.34E-04 6.86E-04 4.89E-04
August 3.25E-04 5.46E-06 2.74E-04 1.07E-04 9.89E-04 7.21E-04 5.04E-04
September 3.62E-04 5.81E-06 3.05E-04 1.16E-04 1.10E-03 7.95E-04 5.43E-04
October 3.81E-04 5.83E-06 3.21E-04 1.18E-04 1.16E-03 8.29E-04 5.51E-04
November 4.18E-04 6.18E-06 3.52E-04 1.27E-04 1.27E-03 9.04E-04 5.90E-04
December 4.23E-04 6.12E-06 3.56E-04 1.27E-04 1.29E-03 9.12E-04 5.88E-04
GT06
January 3.09E-04 4.48E-06 2.60E-04 9.28E-05 9.38E-04 6.67E-04 4.30E-04
February 3.36E-04 4.91E-06 2.83E-04 1.02E-04 1.02E-03 7.26E-04 4.71E-04
March 2.91E-04 4.35E-06 2.45E-04 8.91E-05 8.84E-04 6.32E-04 4.14E-04
April 2.74E-04 4.31E-06 2.31E-04 8.67E-05 8.32E-04 6.00E-04 4.05E-04
May 2.39E-04 4.01E-06 2.02E-04 7.89E-05 7.28E-04 5.31E-04 3.71E-04

AECOM Vopak Terminal B4Air Quality Impact Assessment
27-May-2016Prepared for – Vopak Terminals Pty Ltd – ABN: 67 004 754 750
c-3
TANK MonthMonthly Emission Rate g/s
Benzene Cumene Cyclohexane Ethylbenzene Hexane Toluene Xylene
June 2.32E-04 4.04E-06 1.96E-04 7.86E-05 7.06E-04 5.20E-04 3.70E-04
July 2.20E-04 3.88E-06 1.86E-04 7.52E-05 6.70E-04 4.95E-04 3.55E-04
August 2.33E-04 3.97E-06 1.97E-04 7.77E-05 7.10E-04 5.20E-04 3.66E-04
September 2.60E-04 4.22E-06 2.19E-04 8.40E-05 7.90E-04 5.73E-04 3.93E-04
October 2.73E-04 4.23E-06 2.30E-04 8.56E-05 8.31E-04 5.97E-04 3.99E-04
November 3.00E-04 4.49E-06 2.52E-04 9.19E-05 9.10E-04 6.51E-04 4.27E-04
December 3.04E-04 4.44E-06 2.56E-04 9.18E-05 9.22E-04 6.57E-04 4.25E-04
GT07
January 3.09E-04 4.48E-06 2.60E-04 9.28E-05 9.38E-04 6.67E-04 4.30E-04
February 3.36E-04 4.91E-06 2.83E-04 1.02E-04 1.02E-03 7.26E-04 4.71E-04
March 2.91E-04 4.35E-06 2.45E-04 8.91E-05 8.84E-04 6.32E-04 4.14E-04
April 2.74E-04 4.31E-06 2.31E-04 8.67E-05 8.32E-04 6.00E-04 4.05E-04
May 2.39E-04 4.01E-06 2.02E-04 7.89E-05 7.28E-04 5.31E-04 3.71E-04
June 2.32E-04 4.04E-06 1.96E-04 7.86E-05 7.06E-04 5.20E-04 3.70E-04
July 2.20E-04 3.88E-06 1.86E-04 7.52E-05 6.70E-04 4.95E-04 3.55E-04
August 2.33E-04 3.97E-06 1.97E-04 7.77E-05 7.10E-04 5.20E-04 3.66E-04
September 2.60E-04 4.22E-06 2.19E-04 8.40E-05 7.90E-04 5.73E-04 3.93E-04
October 2.73E-04 4.23E-06 2.30E-04 8.56E-05 8.31E-04 5.97E-04 3.99E-04
November 3.00E-04 4.49E-06 2.52E-04 9.19E-05 9.10E-04 6.51E-04 4.27E-04
December 3.04E-04 4.44E-06 2.56E-04 9.18E-05 9.22E-04 6.57E-04 4.25E-04

AECOM Vopak Terminal B4Air Quality Impact Assessment
27-May-2016Prepared for – Vopak Terminals Pty Ltd – ABN: 67 004 754 750
D
dAppendix D
Literature andDocumentation

AECOM Vopak Terminal B4Air Quality Impact Assessment
27-May-2016Prepared for – Vopak Terminals Pty Ltd – ABN: 67 004 754 750
d-1
Appendix D Literature and Documentation

Report
AIR QUALITY ASSESSMENT FOR VOPAK BITUMEN STORAGE FACILITY
VOPAK TERMINALS SYDNEY PTY LTD
Job ID. 20528B
13 October 2015

Job ID 20528B | AQU-NW-001-20528 ii
20528 Air Quality Assessment Vopak Bitumen Storage Facility Final.docx
PROJECT NAME: Air Quality Assessment For Vopak Bitumen Storage
Facility
JOB ID: 20528B
DOCUMENT CONTROL NUMBER AQU-NW-001-20528
PREPARED FOR: Vopak Terminals Sydney Pty Ltd
APPROVED FOR RELEASE BY: Damon Roddis
DISCLAIMER & COPYRIGHT: This report is subject to the copyright statement
located at www.pacific-environment.com © Pacific
Environment Operations Pty Ltd ABN 86 127 101 642
DOCUMENT CONTROL
VERSION DATE COMMENT PREPARED BY REVIEWED BY
Final 13/10/15 Final Angelo Rouggos
Li Fitzmaurice Damon Roddis
Pacific Environment Operations Pty Ltd: ABN 86 127 101 642
BRISBANE
Level 1, 59 Melbourne Street, South Brisbane Qld 4101
PO Box 3306, South Brisbane Qld 4101
Ph: +61 7 3004 6400
Fax: +61 7 3844 5858
Unit 1, 22 Varley Street
Yeerongpilly, Qld 4105
Ph: +61 7 3004 6460
ADELAIDE
35 Edward Street, Norwood SA 5067
PO Box 3187, Norwood SA 5067
Ph: +61 8 8332 0960
Fax: +61 7 3844 5858
SYDNEY Suite 1, Level 1, 146 Arthur Street
North Sydney, NSW 2060
Ph: +61 2 9870 0900
Fax: +61 2 9870 0999
MELBOURNE
Level 10, 224 Queen Street
Melbourne Vic 3000
Ph: +61 3 9036 2637
Fax: +61 2 9870 0999
PERTH
Level 1, Suite 3
34 Queen Street, Perth WA 6000
Ph: +61 8 9481 4961
Fax: +61 2 9870 0999
Job ID 20528B | AQU-NW-001-20528 iii
20528 Air Quality Assessment Vopak Bitumen Storage Facility Final.docx
DISCLAIMER
Pacific Environment acts in all professional matters as a faithful advisor to the Client and exercises all
reasonable skill and care in the provision of its professional services.
Reports are commissioned by and prepared for the exclusive use of the Client. They are subject to and
issued in accordance with the agreement between the Client and Pacific Environment. Pacific
Environment is not responsible for any liability and accepts no responsibility whatsoever arising from the
misapplication or misinterpretation by third parties of the contents of its reports.
Except where expressly stated, Pacific Environment does not attempt to verify the accuracy, validity or
comprehensiveness of any information supplied to Pacific Environment for its reports.
Reports cannot be copied or reproduced in whole or part for any purpose without the prior written
agreement of Pacific Environment.
Where site inspections, testing or fieldwork have taken place, the report is based on the information
made available by the client or their nominees during the visit, visual observations and any subsequent
discussions with regulatory authorities. The validity and comprehensiveness of supplied information has
not been independently verified and, for the purposes of this report, it is assumed that the information
provided to Pacific Environment is both complete and accurate. It is further assumed that normal
activities were being undertaken at the site on the day of the site visit(s), unless explicitly stated otherwise.

Job ID 20528B | AQU-NW-001-20528 iv
20528 Air Quality Assessment Vopak Bitumen Storage Facility Final.docx
EXECUTIVE SUMMARY
Overview
Pacific Environment has been commissioned by Vopak Terminals Sydney Pty Ltd (Vopak) to prepare an
Air Quality Assessment for the ‘as built’ bitumen import, storage and distribution facility (the Vopak
bitumen facility) located at Lot 12, 49 Friendship Road, Port Botany, NSW.
The Vopak bitumen facility includes three 7,300 m3 tanks for the storage of bitumen products, gantry
facilities for loading and in-line blending bitumen road tankers, a thermal oil and heating system and
furnace and a dedicated pipeline for bitumen unloading from ships. A vapour combustion unit treats
large tank vapours during ship unloading operations and truck venting during filling.
This Air Quality Assessment has been prepared to address an EPA Prevention Notice, in addition to
providing information as to potential odour emissions and effective odour management. A summary of
where the requirements of the EPA Prevention Notice comments have been addressed within this
document is provided below:
EPA Prevention Notice Comments Relevant Section of AQIA
1, 2, 3 and 7 N/A
4. (a) Potential odour sources including but not limited to vents from
Product Tanks 1, 2 and 3; truck loading; and fugitive emission from pipe
work and other sources;
Section 7
(b) Potential for variability in the amount of odour generated due to
variability in the odour emission rate of products stored; and
Section 8
(c) Different mitigation and/or management strategies including but not
limited to:
Running the Vapor Combustor Unit (VCU) continuously, with
vapours from only one of the three product tanks directed to the
VCU at any one time;
Section 7, Section 8
Running the VCU continuously, with vapours from all the three
product tanks directed to the VCU at any time when transfers of
bitumen from a ship to the premises are not taking place; and;
Section 7, Section 8
Running the VCU only during transfers of bitumen from a ship to
the premises (as currently stated in Odour Management
Procedures prepared by Vopak Terminals Sydney Pty Limited
dated 20 November 2014).
Section 7, Section 8
5. The AQIA must include recommendations to ensure the bitumen plant
can be operated without offensive odours occurring beyond the
premises boundary, including whether any future mitigation measures are
required in order for the bitumen plant to be operated in an
environmentally satisfactory matter.
Section 10
6. The AQIA must, if applicable, include proposed updates to Vopak's
bitumen odour management procedures based on the findings of the
AQIA. Section 10

Job ID 20528B | AQU-NW-001-20528 v
20528 Air Quality Assessment Vopak Bitumen Storage Facility Final.docx
Emissions
The main potential sources of emissions to air are associated with the operation of the vapour combustion
unit (VCU), bypass stack, road tanker loading (RTL) and storage tank breathing losses from product tanks
1, 2 and 3.
Information provided on the ‘as built’ plant design, along with source testing of tank headspace, has
been used to develop an odour emission inventory. This was subsequently applied within a quantitative
air dispersion modelling study to evaluate the potential impacts on local air quality due to Vopak’s
bitumen handling operations.
Conservatively estimated odour emission rates were used as input data for atmospheric dispersion
modelling. The CALPUFF model was chosen to perform dispersion modelling for this assessment.
In addition to odour, potential impacts of the criteria air pollutants benzene and hydrogen sulfide have
been assessed using data from tank headspace sampling completed at the Vopak facility.
Dispersion Modelling
The atmospheric dispersion modelling results have been assessed against the NSW Environment
Protection Authority (EPA) assessment criteria to provide an air quality impact assessment for the Vopak
bitumen facility.
Based on the results of the modelling study, the emissions are predicted to be minor and air quality goals
are not expected to be compromised.

Job ID 20528B | AQU-NW-001-20528 vi
20528 Air Quality Assessment Vopak Bitumen Storage Facility Final.docx
CONTENTS
1 INTRODUCTION 1 1.1 Scope of Work 2
2 PROJECT DESCRIPTION AND LOCAL SETTING 3 2.1 Introduction 3 2.2 Local Setting 5 2.3 Topography 7
3 AIR QUALITY PARAMETERS 8 3.1 Expected Emissions from the Vopak Bitumen Facility 8 3.2 Odour 9 3.3 Volatile Organic Compounds 10
4 AIR QUALITY CRITERIA 11
5 EXISTING AMBIENT AIR QUALITY 13 5.1 Odour 13 5.2 Volatile Organic Compounds 13
6 METEOROLOGY 14 6.1 Long Term Meteorological Data Analysis 14 6.2 Meteorological Modelling 15
6.2.1 TAPM 15 6.2.2 Onsite Meteorological Data Analysis (CALMET) 15
6.3 Atmospheric Stability 17
7 EMISSIONS ESTIMATION 20 7.1 Assessment Approach 20 7.2 Pollutant Dispersion Modelling 20
7.2.1 CALPUFF 20 7.3 Model Scenarios 21 7.4 Model Inputs 22
7.4.1 Vapour Combustion Unit 22 7.4.2 Road Tanker Loadout 22 7.4.3 Bypass Stack 22 7.4.4 Tank Breathing 23
7.5 Source Locations 23 7.6 Peak-to-Mean Ratio 24 7.7 Source Sampling 24 7.8 Building Wake Effects 24 7.9 Modelled Emission Rates 24
8 MODELLING RESULTS 25 8.1 Fugitive Emissions from RTL Gantry Sensitivity Analysis 25 8.2 Assessment of Impacts 25 8.3 Cumulative Impacts 35
9 RECOMMENDATIONS 36 9.1 Odour Emission Control 36 9.2 Bitumen Odour Management Procedures 37
10 CONCLUSIONS 38
11 REFERENCES 39
APPENDIX A STEPHENSONS 2015 REPORT EXTRACT A-1
APPENDIX B EMISSION ESTIMATES B-1

Job ID 20528B | AQU-NW-001-20528 vii
20528 Air Quality Assessment Vopak Bitumen Storage Facility Final.docx
List of Figures
Figure 2.1: Site Layout 4
Figure 2.2: Local Setting and Selected Sensitive Receptors 6
Figure 2.3 Three-Dimensional Representation of Regional Topography 7
Figure 6.1: Annual and Seasonal Windroses for Port Botany, July 2014 – June 2015 (CALMET generated)
16
Figure 6.2: Annual statistics of 1/L by hour of the day 18
Figure 6.3: Annual distribution of stability type by hour of the day 19
Figure 8.1: Predicted 99th Percentile 1-second Odour Concentrations – Scenario 4 27
Figure 8.2: Predicted 99th Percentile 1-second Odour Concentrations – Scenario 5 28
Figure 8.3: Predicted 99th Percentile 1-second Odour Concentrations – Scenario 6 29
Figure 8.4: Predicted 99th Percentile 1-second Odour Concentrations – Scenario 8 30
Figure 8.5: Predicted 99th Percentile 1-second Odour Concentrations – Scenario 8 (b) 31
Figure 8.6: Predicted 99.9th Percentile 1-hour Benzene Concentrations – Scenario 8 33
Figure 8.7: Predicted 99th Percentile 1-second Hydrogen Sulfide Concentrations – Scenario 8 34
List of Tables
Table 2.1: Selected Discrete Closest Receptor Locations 5
Table 4.1: Benzene Assessment Criterion, 99.9th Percentile of 1 hour average Concentrations 11
Table 4.2: Odour Assessment Criteria, 99th Percentile of 1-second average Concentrations 11
Table 4.3: Hydrogen Sulfide Assessment Criteria, 99th Percentile of 1-second average Concentrations 12
Table 4.4: Factors for estimating peak concentration 12
Table 5.1: Predicted Ground Level Concentrations at Terminals Facility 13
Table 6.1: Monthly Climate Statistics for Sydney Airport 14
Table 6.2: Inverse of the Monin-Obukhov length L with respect to Atmospheric Stability 18
Table 7.1: Summary of Model Scenarios 21
Table 7.2: Modelling Emission Parameters from Vapour Combustion Unit 22
Table 7.3: Modelling Emission Parameters from Bypass Stack 23
Table 7.4: Modelling Emission Parameters from Tank Venting (Breathing Losses) 23
Table 7.5: Sampling Results from Stephensons Report (2015) 24
Table 8.1: Odour Sensitivity Analysis: Scenario 6 25
Table 8.2: Maximum Predicted Odour Concentrations (99th Percentile 1-second average) Scenarios 1-9
26
Table 8.3: Scenario 8: Benzene and Hydrogen Sulfide 32
Table 9.1: Odour Emission Source Percentage Contribution: Receptor 6 36
Table 9.2: Emission Source Percentage Contribution: Receptor 12 36

Job ID 20528B | AQU-NW-001-20528 1
20528 Air Quality Assessment Vopak Bitumen Storage Facility Final.docx
1 INTRODUCTION
Pacific Environment (PE; formerly PAEHolmes) completed an air quality / odour impact assessment of
the (then proposed) facility in November 2011, Air Quality Assessment – Port Botany Bitumen Storage
Facility. This assessment was completed as part of the development application process for Vopak
Terminals Sydney Pty Ltd (Vopak).
In late 2012, PE evaluated various options for the pollution control at the bitumen facility as part of the
facility’s detailed design. This was in light of both a proposed change in specification of bitumen to be
handled at the site (potential H2S concentrations and %LEL in tank head space) as well as the site’s
energy efficiency.
Additional air emission scenarios were then evaluated in early 2013 based on a new design point for
normal operation (100% LEL and 300ppm H2S in the tank head vapour space, air dilution of 3:1 for ship
discharge and Road Tanker Loading (RTL) emissions).
The original intent of the air quality assessment, based on discussions with Vopak on 3 July 2015, was
to complete an update of the PE air quality / odour assessment (AQIA) using the ‘as built’ design /
geometry, combined with updated meteorology and emission data.
However, in the interim, Vopak received a Notice of Preventative Action from NSW Environment
Protection Authority (EPA; Prevention Notice Number 1531474). This Prevention Notice includes a
prescriptive requirement for completion of an AQIA, as follows:
Air Quality Impact Assessment
1. On or before Thursday, 23 July 2015, Vopak must engage a suitably qualified and
experienced consultant (“the consultant”) that is capable of fulfilling the requirements of this
Prevention Notice relating to the Air Quality Impact Assessment.
2. The consultant must prepare an Air Quality Impact Assessment (AQIA) of the premises.
3. The AQIA must:
be prepared in accordance with the requirements of the Approved Methods for
the Modelling and Assessment of Air Pollutants in New South Wales (2005).
make appropriate reference to the Assessment and Management of Odour from
Stationary Sources in NSW: Technical Framework (2006) and Management of Odour
from Stationary Sources in NSW: Technical Notes (2006); and
consider the requirements of the Protection of the Environment Operations (Clean
Air) Regulation 2010 as applicable.
4. The AQIA must include an assessment of:
a) Potential odour sources including but not limited to vents from Product Tanks 1, 2
and 3; truck loading; and fugitive emission from pipe work and other sources;
b) Potential for variability in the amount of odour generated due to variability in the
odour emission rate of products stored; and
c) Different mitigation and/or management strategies including but not limited to:
i. Running the Vapor Combustor Unit (VCU) continuously, with vapours from
only one of the three product tanks directed to the VCU at any one time;
ii. Running the VCU continuously, with vapours from all the three product tanks
directed to the VCU at any time when transfers of bitumen from a ship to
the premises are not taking place; and;
iii. Running the VCU only during transfers of bitumen from a ship to the
premises (as currently stated in Odour Management Procedures prepared
by Vopak Terminals Sydney Pty Limited dated 20 November 2014).
5. The AQIA must include recommendations to ensure the bitumen plant can be operated
without offensive odours occurring beyond the premises boundary, including whether any
future mitigation measures are required in order for the bitumen plant to be operated in an
environmentally satisfactory matter.

Job ID 20528B | AQU-NW-001-20528 2
20528 Air Quality Assessment Vopak Bitumen Storage Facility Final.docx
6. The AQIA must, if applicable, include proposed updates to Vopak's bitumen odour
management procedures based on the findings of the AQIA.
The current document has therefore been designed to meet the requirements of the Prevention
Notice while capturing the requirements of Vopak’s original brief.
In addition to odour, potential impacts of the criteria air pollutants benzene and hydrogen sulfide have
been assessed using data from tank headspace sampling completed at the Vopak facility.
1.1 Scope of Work
Based on the above understanding, the scope of work, to meet the requirements of the Prevention
Notice is as follows:
Evaluation of potential odour sources including but not limited to vents from Product Tanks 1, 2
and 3; truck loading
NB: it is understood that Vopak have provided feedback to the EPA and that fugitive emissions from
pipe work and other sources (outside of RTL emissions) will not be quantitatively assessed at this stage.
Evaluate the potential for variability in the amount of odour generated due to variability in
the odour emission rate of products stored
Quantify the effect of different mitigation and/or management strategies including but not
limited to:
Running the Vapour Combustor Unit (VCU) continuously, with vapours from only one of
the three product tanks directed to the VCU at any one time;
Running the VCU continuously, with vapours from all the three product tanks directed to
the VCU at any time when transfers of bitumen from a ship to the premises are not taking
place; and
Running the VCU only during transfers of bitumen from a ship to the premises (as currently
stated in Odour Management Procedures prepared by Vopak Terminals Sydney Pty
Limited dated 20 November 2014).
Provide recommendations to ensure the bitumen plant can be operated without offensive
odours occurring beyond the premises boundary, including whether any future mitigation
measures are required to achieve this.
Provide proposed updates to Vopak's bitumen odour management procedures, as required,
based on the findings of the AQIA.

Job ID 20528B | AQU-NW-001-20528 3
20528 Air Quality Assessment Vopak Bitumen Storage Facility Final.docx
2 PROJECT DESCRIPTION AND LOCAL SETTING
2.1 Introduction
The facility receives products (approximately 100,000 tonnes per year) via ship from the Bulk Liquids
Berth (BLB1) in Port Botany. Bitumen products are imported into three tanks of up to 7,300 m3 each and
the typical parcel size would be 5-10 kt per shipment. There are approximately 8-16 shipments per
annum.
The bitumen is stored at approximately 140-150°C and loaded out at approximately 180°C. The facility
stores up to three imported bitumen grades. Various grades may be generated by blending the stored
grades through an inline blending system during Road Tanker loading (RTL). The facility operates 24
hours a day, 365 days a year.
The bitumen facility consists of the construction and operation of:
Three tanks each with a capacity of 7,300 m³. The tanks are 22m in diameter and have an
overall height of 23 m. Each tank has four vents for tank breathing losses to atmosphere.
However during normal operation only one of these will be open. These tanks will be used to
store the three grades of bitumen;
A Vapour Combustion Unit (VCU) located near the Friendship Road boundary for treating
large tank vapours during ship unloading operations and truck venting during filling;
A two Bay Road Tanker Loading Gantry for driver self-loading of bitumen products. Operations
occur 24 hours per day, 365 days a year;
A pipeline dedicated to bitumen unloading from BLB1. The unloading capacity minimum rate
is 100 m3/hour with electric heat tracing and insulation/cladding; and
A thermal oil system and incinerator operating on natural gas to fulfil the following heating
applications:
Heating of bulk storage tanks using hot oil coils;
Heating of bitumen loading line heat exchangers (loading lines x 3);
The ‘As Built’ plant layout is presented in Figure 2.1 showing emission points and the layout of the site.

Job ID 20528B | AQU-NW-001-20528 4
20528 Air Quality Assessment Vopak Bitumen Storage Facility Final.docx
Figure 2.1: Site Layout

Job ID 20528B | AQU-NW-001-20528 5
20528 Air Quality Assessment Vopak Bitumen Storage Facility Final.docx
2.2 Local Setting
The Vopak bitumen facility is located on Lot 103 DP 1182871, 49 Friendship Road, Port Botany, NSW.
The site is located in an industrial area and is approximately 5 km southeast of the Sydney Airport.
There are several suburbs located within a 3 km radius of the site including Banksmeadow (north-
northwest), Matraville (north-northeast), Chifley (east-northeast), Little Bay (east-southeast) and Phillip
Bay (south-southeast). A number of child care facilities, schools and aged care facilities are located
within these townships. Figure 2.2 shows the key components, the local setting and selected sensitive
receptor locations.
The discrete receptor locations presented in Table 2.1 were chosen for the purposes of assessing
impacts from the facility. These locations are the closest potentially affected residential and sensitive
locations to the site. A discrete receptor is placed at the entry/exit to the site to evaluate impacts to
truck drivers lining up at the gate for potentially long periods of time.
Table 2.1: Selected Discrete Closest Receptor Locations
ID Location Easting (m) Northing (m) Elevation (m) Approximate Distance
from Site (m) and Direction
1 Matraville Public School 336821 6240701 17.9 1.9 km NE
2 St Agnes School 336628 6241013 26.0 2.1 km NNE
3 Matraville High School 337889 6240355 39.4 2.6 km ENE
4 St Andrews Primary School 338106 6240430 36.9 2.8 km ENE
5 Malabar Public School 338156 6240701 20.9 3.0 km NE
6 23 Adina Avenue, Phillip
Bay 337019 6238494 29.3 1.7 km SE
7 61 Yarra Rd, Philip Bay 336641 6238493 19.0 1.3 km SE
8 52 Eyre St, Chifley 337049 6239809 28.8 1.6 km ENE
9 26 Moorina Av, Matraville 336345 6240209 16.2 1.3 km NE
10 5 Clonard Way, Little Bay 337171 6239080 18.1 1.6 km ESE
11 Botany Golf Course 334852 6240659 4.7 1.6 km WNW
12 Friendship Road 335476 6239298 4.0 Entry/exit to site

Job ID 20528B | AQU-NW-001-20528 6
20528 Air Quality Assessment Vopak Bitumen Storage Facility Final.docx
Figure 2.2: Local Setting and Selected Sensitive Receptors
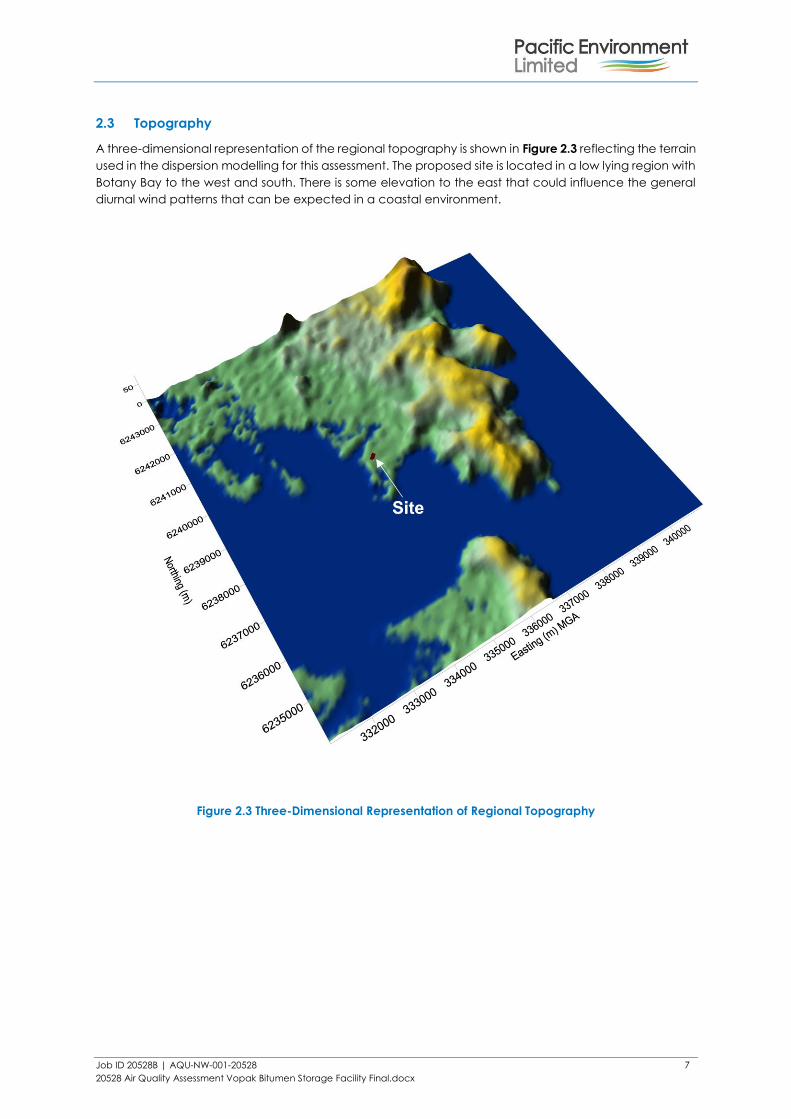
Job ID 20528B | AQU-NW-001-20528 7
20528 Air Quality Assessment Vopak Bitumen Storage Facility Final.docx
2.3 Topography
A three-dimensional representation of the regional topography is shown in Figure 2.3 reflecting the terrain
used in the dispersion modelling for this assessment. The proposed site is located in a low lying region with
Botany Bay to the west and south. There is some elevation to the east that could influence the general
diurnal wind patterns that can be expected in a coastal environment.
Figure 2.3 Three-Dimensional Representation of Regional Topography

Job ID 20528B | AQU-NW-001-20528 8
20528 Air Quality Assessment Vopak Bitumen Storage Facility Final.docx
3 AIR QUALITY PARAMETERS
3.1 Expected Emissions from the Vopak Bitumen Facility
Odorous emissions are the primary air quality emissions of concern from the Vopak bitumen facility. The
key odour producing sources at the facility include:
Operation of the vapour combustion unit (VCU) during both ship unloading to the storage tanks
and truck loading within the gantry;
Emissions leaving through the bypass stack;
Fugitive emissions resulting from RTL within the gantry;
Bitumen storage tank breathing losses.
The displaced vapour headspace that occurs during ship unloading and RTL operations is typically
treated by the VCU. Further descriptions of the proposed scenarios and the anticipated emissions are
outlined in Section 7.3.
It is acknowledged that the VCU is not running continuously. The VCU was principally designed to capture
emissions from tank tops during ship discharges. When the tank inlet valve opens ready for a ship import,
the fan / VCU starts up and the ductwork leading from the tank roof is opened by a remotely controlled
valve on the tank roof. Hence, the air within the tank roof space is displaced and drawn by the fan to
the VCU whilst the tank is filling. Similarly, for the RTL operations the fan / VCU starts up when a road tanker
is connected and ready to fill.
When there are no transfer operations occurring, the fan / VCU is shut-down and the tanks sit in a static
state at approximately 150 ºC and vent to atmosphere. Accordingly, these tank breathing losses need
to be evaluated in terms of their emissions to air.

Job ID 20528B | AQU-NW-001-20528 9
20528 Air Quality Assessment Vopak Bitumen Storage Facility Final.docx
3.2 Odour
The determination of air quality goals for odour and their use in assessing odour impacts is recognised as
a difficult topic in air pollution science. The topic has received considerable attention in recent years and
the procedures for assessing odour impacts using dispersion models have been refined considerably.
There is still considerable debate in the scientific community about appropriate odour goals.
The NSW EPA (2005) has developed odour goals used to assess the likelihood of nuisance impact arising
from the emission of odour.
There are two factors that need to be considered:
■ what "level of exposure" to odour is considered acceptable to meet current community standards
in NSW; and
■ how can dispersion models be used to determine if a source of odour meets the goals which are
based on this acceptable level of exposure.
The term "level of exposure" has been used to reflect the fact that odour impacts are determined by
several factors the most important of which are:
■ the Frequency of the exposure;
■ the Intensity of the odour;
■ the Duration of the odour episodes; and
■ the Offensiveness of the odour (the so-called FIDO factors).
In determining the offensiveness of an odour it needs to be recognised that for most odours the context
in which an odour is perceived is also relevant. Some odours, for example the smell of sewage, hydrogen
sulfide, butyric acid, landfill gas etc., are likely to be judged offensive regardless of the context in which
they occur. Other odours such as the smell of jet fuel may be acceptable at an airport, but not in a
house, and diesel exhaust may be acceptable near a busy road, but not in a restaurant.
In summary, whether or not an individual considers an odour to be a nuisance will depend on the FIDO
factors outlined above and although it is possible to derive formulae for assessing odour annoyance in a
community, the response of any individual to an odour is still unpredictable. Odour goals need to take
account of these factors.
The difference between odour goals is based on considerations of risk of odour impact rather than
differences in odour acceptability between urban and rural areas. For a given odour level there will be
a wide range of responses in the population exposed to the odour. In a densely populated area there
will therefore be a greater risk that some individuals within the community will find the odour
unacceptable than in a sparsely populated area.
Job ID 20528B | AQU-NW-001-20528 10
20528 Air Quality Assessment Vopak Bitumen Storage Facility Final.docx
3.3 Volatile Organic Compounds
Organic hydrocarbons are comprised of a collection of various volatile organic compounds (VOCs), and
several of these compounds may be toxic. Of the primary VOCs, benzene is being assessed in this air
quality assessment.
Air toxics are present in the air in low concentrations, however characteristics such as toxicity or
persistence means they can be hazardous to human, plant or animal life. There is evidence that cancer,
birth defects, genetic damage, immuno-deficiency, respiratory and nervous system disorders can be
linked to exposure to occupational levels of air toxins. Organic hydrocarbons also include reactive
organic compounds, which play a role in the formation of photochemical smog.

Job ID 20528B | AQU-NW-001-20528 11
20528 Air Quality Assessment Vopak Bitumen Storage Facility Final.docx
4 AIR QUALITY CRITERIA
The tanks holding organic hydrocarbons (finished fuel products) have the potential to release a
collection of various fugitive emissions, several of which may be toxic at high concentrations.
Organic hydrocarbons may be present in the air in low concentrations, however characteristics such as
toxicity or persistence means they can be potentially hazardous to human, plant or animal life. There is
evidence that cancer, birth defects, genetic damage, immuno-deficiency, respiratory and nervous
system disorders can be linked to exposure to occupational levels of such air toxics.
Organic hydrocarbons also include reactive organic compounds, which play a role in the formation of
photochemical smog. There are no impact assessment criteria specified for total VOCs, however
modelling predictions can be compared to the impact assessment criteria for individual organic
pollutants that may be present in the fugitive headspace gases.
For this assessment, the predicted concentration of benzene has been compared against the NSW EPA’s
1-hour average criteria outlined in their “Approved Methods for Modelling and Assessment of Air
Pollutants in NSW” (the Approved Methods)(NSW EPA, 2005). Section 7.2.2 of the Approved Methods
allows for this pollutant to be assessed at the 99.9th percentile for Level 2 impact assessments.
Table 4.1 summarises the benzene criteria relevant for the site.
Table 4.1: Benzene Assessment Criterion, 99.9th Percentile of 1 hour average Concentrations
Pollutant Standards Averaging Period Source
Benzene 0.029 mg/m3 1-Hour NSW EPA (2005)(assessment criteria)
In addition to health impacts, the NSW OEH lists impact assessment criteria for complex mixtures of
odorous air pollutants. Table 4.2 lists the odour glc criterion to be exceeded not more than 1% of the time,
for different population densities. For adjacent industrial lots a less stringent criterion should be applicable
as these areas would not be expected to be populated for long continuous periods of time. However,
for residential areas further away the more stringent criterion of 2 OU would apply.
Table 4.2: Odour Assessment Criteria, 99th Percentile of 1-second average Concentrations
Population of Affected Community Impact Assessment Criteria for Complex Mixtures of
Odourous Air Pollutants (OU)
Urban (2000) and/or schools and hospitals 2.0
~500 3.0
~125 4.0
~30 5.0
~10 6.0
~2 7.0

Job ID 20528B | AQU-NW-001-20528 12
20528 Air Quality Assessment Vopak Bitumen Storage Facility Final.docx
Hydrogen sulfide, like odour, is an assessment criteria based on a function of population density as per
Table 4.3. This odorous pollutant is assessed at the 1.38 µg/m3 criterion.
Table 4.3: Hydrogen Sulfide Assessment Criteria, 99th Percentile of 1-second average Concentrations
Population of Affected Community Impact Assessment Criteria (µg/m2)
Urban (2000) and/or schools and hospitals 1.38
~500 2.07
~125 2.76
~30 3.45
~10 4.14
~2 4.83
It is a common practice to use dispersion models to determine compliance with odour goals. This
introduces a complication because Gaussian dispersion models are only able to directly predict
concentrations over an averaging period of 3-minutes or greater. The human nose, however, responds
to odours over periods of the order of a second or so. During a 3-minute period, odour levels can fluctuate
significantly above and below the mean depending on the nature of the source.
To determine more rigorously the ratio between the one-second peak concentrations and 3-minute and
longer period average concentrations (referred to as peak-to-mean ratio) that might be predicted by a
Gaussian dispersion model, EPA commissioned a study by Katestone Scientific Pty Ltd (1995, 1998). The
peak-to-mean ratio for a range of circumstances are listed in Table 4.4. The ratio is also dependent on
atmospheric stability and the distance from the source.
Table 4.4: Factors for estimating peak concentration
Source Type Pasquill-Gifford stability class Near field
P/M60*
Far field
P/M60
Area A, B, C, D 2.5 2.3
E, F 2.3 1.9
Line A – F 6 6
Surface point A, B, C 12 4
D, E, F 25 7
Tall wake-free point A, B, C 17 3
D, E, F 35 6
Wake-affected point A – F 2.3 2.3
Volume A – F 2.3 2.3
*Ratio of peak 1-second average concentrations to mean 1-hour average concentrations
The EPA Approved Methods take account of this peaking factor and the goals shown in Table 4.2 and
Table 4.3 are based on nose response time.

Job ID 20528B | AQU-NW-001-20528 13
20528 Air Quality Assessment Vopak Bitumen Storage Facility Final.docx
5 EXISTING AMBIENT AIR QUALITY
Air quality standards and goals are used to assess the total pollutant level in the environment, including
the contribution from specific projects and existing sources. To fully assess impacts against all the relevant
air quality standards and goals, it is necessary to have information on the background concentrations to
which the site is likely to contribute.
Existing industrial odour sources in the vicinity of the site include the nearby Qenos, Origin Energy,
Australian Container Freight Services as well as Vopak’s other operations.
A bitumen import and dispatch facility similar to the Vopak Bitumen Terminal is operating on the land
adjacent south west of the Vopak facility site by Terminals Pty Ltd (Terminals). An air quality assessment
(AQA) was undertaken for the Terminals facility in April 2011 (GHD, 2011). The Terminals AQA included
assessment of odour, VOCs and products of combustion.
5.1 Odour
There is no measured odour data for the Port Botany area. However, the Air Quality Assessment for the
Terminals facility (GHD, 2011) modelled odour concentrations associated with the site. The predicted
peak odour concentration at ground level was 0.1 OU along Simblist Road. This concentration will be
used as the respective background level for odour.
5.2 Volatile Organic Compounds
The Air Quality Assessment for the Terminals facility (GHD, 2011) also predicted potential impacts for VOCs
(speciated) as a result of the proposed Terminals facility. The maximum predicted ground level
concentrations are well below the relevant OEH Impact Assessment Criteria.
The predicted ground level concentration for benzene is summarised in Table 5.1.
Table 5.1: Predicted Ground Level Concentrations at Terminals Facility
Pollutant 99.9th Percentile Predicted glc
[mg/m3]
OEH Impact Assessment Criterion
[mg/m3]
Benzene 7.7 E-06 0.029

Job ID 20528B | AQU-NW-001-20528 14
20528 Air Quality Assessment Vopak Bitumen Storage Facility Final.docx
6 METEOROLOGY
6.1 Long Term Meteorological Data Analysis
Table 6.1 presents the temperature, humidity and rainfall data for the closest Bureau of Meteorology site
located at Sydney Airport (Site number 0660371), approximately 5.3 km north-east of the site. Relative
humidity data consist of monthly averages of 9 am and 3 pm readings. Also presented are monthly
averages of maximum and minimum temperatures. Rainfall data consist of mean monthly rainfall and
the average number of rain days per month.
The annual average maximum and minimum temperatures recorded at the Sydney Airport station are
22.3°C and 13.5 °C, respectively. On average, December is the hottest month with average maximum
temperatures of 25.8°C. July is the coldest month, with an average minimum temperature of 7.2°C. The
annual average relative humidity reading collected at 9am is 69% and at 3pm the annual average is
57%. The month with the highest relative humidity on average is June with 9am averages of 74% and
August has with the lowest relative humidity with 3pm averages of 49%.
Rainfall data collected at the Sydney Airport station show that June is the wettest month, with an average
rainfall of 122.5 mm over an average of 8.8 rain days. The average annual rainfall is 1084.5 mm with an
average of 96.0 rain days per year.
Table 6.1: Monthly Climate Statistics for Sydney Airport
Heading Jan Feb Mar Apr May Jun Jul Aug Sep Oct Nov Dec
Mean maximum
temperature (°C) 26.5 26.4 25.3 22.9 20.0 17.6 17.0 18.3 20.6 22.6 24.1 25.8
Mean minimum
temperature (°C)
18.9 19.1 17.6 14.2 11.0 8.7 7.2 8.2 10.5 13.2 15.4 17.5
Mean rainfall
(mm)
94.0 111.9 115.4 109.3 98.6 122.5 69.6 76.7 60.2 70.7 81.5 74.1
Mean 9am
temperature (°C)
22.4 22.3 21.1 18.2 14.6 11.9 10.8 12.5 15.7 18.4 19.9 21.6
Mean 9am
relative humidity
(%)
70 73 73 71 73 74 71 65 62 61 64 66
Mean 9am wind
speed (km/h)
14.4 13.8 12.9 12.9 12.6 13.4 13.3 14.4 15.5 16.3 16.0 14.8
Mean 3 pm
temperature (ºC) 24.8 24.8 23.9 21.7 19.0 16.6 16.1 17.2 19.0 20.7 22.1 23.9
Mean 3pm
relative humidity
(%)
60 63 61 59 58 57 52 49 51 54 56 58
Mean 3pm wind
speed (km/h)
24.1 23.0 21.0 19.3 17.1 17.8 18.2 20.8 23.1 24.6 25.3 25.2
Site name: SYDNEY AIRPORT AMO, Site number: 066037, Latitude: 33.95 °S Longitude: 151.17 °E

Job ID 20528B | AQU-NW-001-20528 15
20528 Air Quality Assessment Vopak Bitumen Storage Facility Final.docx
6.2 Meteorological Modelling
The local meteorology was modelled using TAPM and CALMET models. Output from TAPM, plus regional
observational weather station data was entered into CALMET, a meteorological pre-processor endorsed
by the US EPA and recommended by the NSW OEH for use in non-steady state conditions. From this, a 1-
year representative meteorological dataset suitable for use in the 3-dimensional plume dispersion model,
CALPUFF, was compiled. Details on the model configuration and data inputs are provided in the following
sections.
The choice of the CALMET/CALPUFF modelling system for this study is based on the fact that simple
Gaussian dispersion models such as AUSPLUME assume that the meteorological conditions are uniform
spatially over the entire modelling domain for any given hour. While this may be valid for some
applications, in complex flow situations, such as coastal environments, the meteorological conditions
may be more accurately simulated using a wind field model such as CALMET.
6.2.1 TAPM
The Air Pollution Model, or TAPM, is a three dimensional meteorological and air pollution model
developed by the CSIRO Division of Atmospheric Research. Detailed description of the TAPM model and
its performance is provided elsewhere (Hurley, 2002a, 2002b; Hibberd et al., 2003; Luhar & Hurley, 2003).
TAPM solves the fundamental fluid dynamics and scalar transport equations to predict meteorology and
(optionally) pollutant concentrations. It consists of coupled prognostic meteorological and air pollution
concentration components. The model predicts airflow important to local scale air pollution, such as sea
breezes and terrain induced flows, against a background of larger scale meteorology provided by
synoptic analyses.
For the Assessment, TAPM was setup with 4 domains, composed of 25 grids along both the x and the y
axes, centred on -33˚58.5’ Latitude and 151˚13.5’ Longitude. Each nested domain had a grid resolution
of 20 km, 10 km, 3 km and 1 km respectively. The 3D output for innermost domain was used to drive
CALMET as an initial guess field, in combination with observed surface data.
Default TAPM terrain values are based on a global 30-second resolution (approximately 1 km) dataset
provided by the US Geological Survey, Earth Resources Observation Systems (EROS). Default land use
and soils data sets for TAPM were used (Hurley, 2002a).
TAPM was used to generate gridded prognostic data (3D.dat) for the CALMET modelling domain.
6.2.2 Onsite Meteorological Data Analysis (CALMET)
Figure 6.1 presents CALMET generated on-site annual and seasonal windroses for the modelling year (July
2014 – June 2015). CALMET is a meteorological pre-processor that includes a wind field generator
containing objective analysis and parameterised treatments of slope flows, terrain effects and terrain
blocking effects. The pre-processor produces fields of wind components, air temperature, relative
humidity, mixing height and other micro-meteorological variables to produce the three-dimensional
meteorological fields that are utilised in the CALPUFF dispersion model. CALMET uses the meteorological
inputs in combination with land use and geophysical information for the modelling domain to predict
gridded meteorological fields for the region.
On an annual basis, the most common winds are from the northeast, south and northwest. Very few winds
originate from the east quadrant. During summer and spring, winds from the northeast are predominant
and during autumn and winter, winds are predominantly from the south to northwest.

Job ID 20528B | AQU-NW-001-20528 16
20528 Air Quality Assessment Vopak Bitumen Storage Facility Final.docx
Figure 6.1: Annual and Seasonal Windroses for Port Botany, July 2014 – June 2015 (CALMET generated)

Job ID 20528B | AQU-NW-001-20528 17
20528 Air Quality Assessment Vopak Bitumen Storage Facility Final.docx
6.3 Atmospheric Stability
An important aspect of pollutant dispersion is the level of turbulence in the lowest 1 km of the
atmosphere, known as the planetary boundary layer (PBL). Turbulence controls how effectively a plume
is diffused into the surrounding air and hence diluted. It acts by increasing the cross-sectional area of the
plume due to random motions. With stronger turbulence, the rate of plume diffusion increases. Weak
turbulence limits diffusion and contributes to high plume concentrations downwind of a source.
Turbulence is generated by both thermal and mechanical effects to varying degrees. Thermally driven
turbulence occurs when the surface is being heated, in turn transferring heat to the air above by
convection. Mechanical turbulence is caused by the frictional effects of wind moving over the earth’s
surface, and depends on the roughness of the surface as well as the flow characteristics.
Turbulence in the boundary layer is influenced by the vertical temperature gradient, which is one of
several indicators of stability. Plume models use indicators of atmospheric stability in conjunction with
other meteorological data to estimate the dispersion conditions in the atmosphere.
Stability can be described across a spectrum ranging from highly unstable through neutral to highly
stable. A highly unstable boundary layer is characterised by strong surface heating and relatively light
winds, leading to intense convective turbulence and enhanced plume diffusion. At the other extreme,
very stable conditions are often associated with strong temperature inversions and light winds, which
commonly occur under clear skies at night and in the early morning. Under these conditions plumes can
remain relatively undiluted for considerable distances downwind. Neutral conditions are linked to windy
and/or cloudy weather, and short periods around sunset and sunrise, when surface rates of heating or
cooling are very low.
The stability of the atmosphere plays a large role in determining the dispersion of a plume and it is
important to have it correctly represented in dispersion models. Current air quality dispersion models
(such as AERMOD and CALPUFF) use the Monin-Obukhov Similarity Theory (MOST) to characterise
turbulence and other processes in the PBL. One of the measures of the PBL is the Monin-Obukhov length
(L), which approximates the height at which turbulence is generated equally by thermal and mechanical
effects (Seinfeld and Pandis, 2006). It is a measure of the relative importance of mechanical and thermal
forcing on atmospheric turbulence.
Because values of L diverge to + and - infinity as stability approaches neutral from the stable and unstable
sides, respectively, it is often more convenient to use the inverse of L (i.e., 1/L) when describing stability.

Job ID 20528B | AQU-NW-001-20528 18
20528 Air Quality Assessment Vopak Bitumen Storage Facility Final.docx
Figure 6.2 shows the hourly averaged 1/L for the bitumen site computed from all data in the CALMET
extract file. Based on Table 6.2 this plot indicates that, as to be expected, the PBL is stable overnight and
becomes unstable as radiation from the sun heats the surface layer of the atmosphere and drives
convection. The changes from positive to negative occur at the shifts between day and night. This
indicates that the diurnal patterns of stability are realistic.
Table 6.2: Inverse of the Monin-Obukhov length L with respect to Atmospheric Stability
1/L Atmospheric Stability
Negative Unstable
Zero Neutral
Positive Stable
Figure 6.2: Annual statistics of 1/L by hour of the day
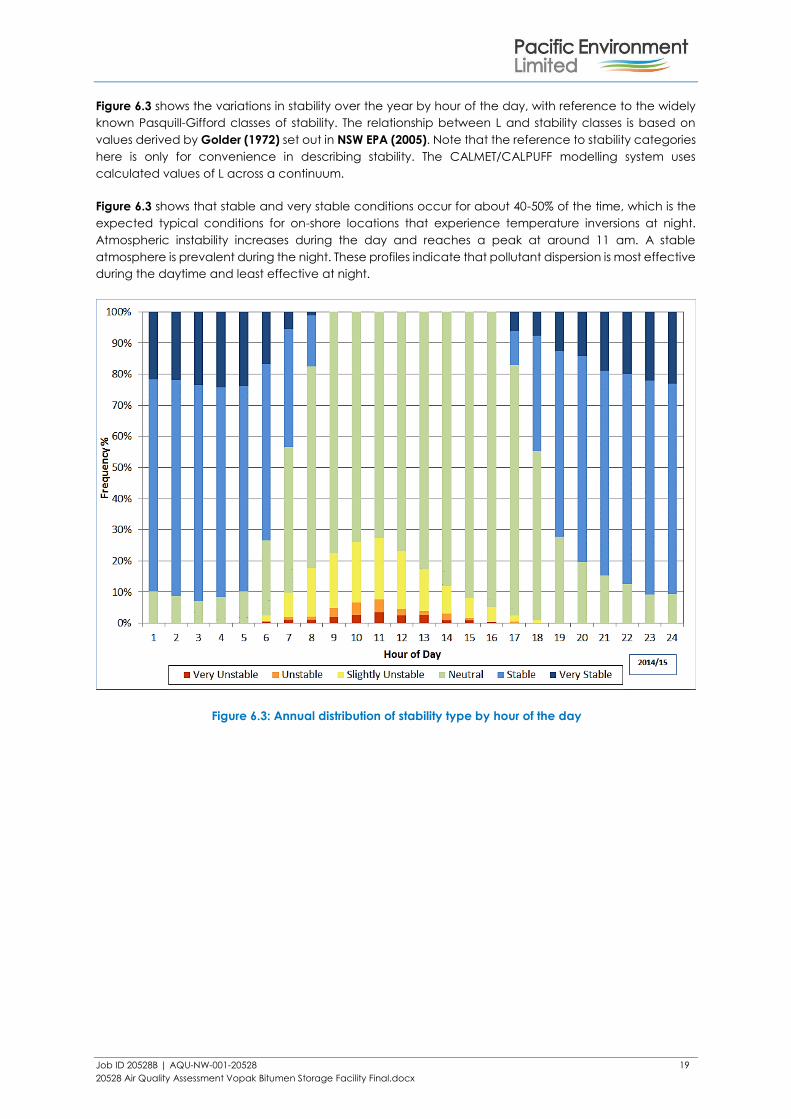
Job ID 20528B | AQU-NW-001-20528 19
20528 Air Quality Assessment Vopak Bitumen Storage Facility Final.docx
Figure 6.3 shows the variations in stability over the year by hour of the day, with reference to the widely
known Pasquill-Gifford classes of stability. The relationship between L and stability classes is based on
values derived by Golder (1972) set out in NSW EPA (2005). Note that the reference to stability categories
here is only for convenience in describing stability. The CALMET/CALPUFF modelling system uses
calculated values of L across a continuum.
Figure 6.3 shows that stable and very stable conditions occur for about 40-50% of the time, which is the
expected typical conditions for on-shore locations that experience temperature inversions at night.
Atmospheric instability increases during the day and reaches a peak at around 11 am. A stable
atmosphere is prevalent during the night. These profiles indicate that pollutant dispersion is most effective
during the daytime and least effective at night.
Figure 6.3: Annual distribution of stability type by hour of the day

Job ID 20528B | AQU-NW-001-20528 20
20528 Air Quality Assessment Vopak Bitumen Storage Facility Final.docx
7 EMISSIONS ESTIMATION
7.1 Assessment Approach
The assessment follows a conventional approach commonly used for air quality assessment in Australia
and in accordance with the NSW OEH Approved Methods.
An estimate of the existing background air quality has been made based on the Air Quality Assessment
for Terminals facility (GHD, 2011). This was assumed to include existing sources within the airshed.
The Air Quality Impact Assessment (AQIA) will fulfil the requirements of the Prevention Notice (No:
1531474) issued by the EPA to Vopak Terminals.
In addition to these requirements, a sensitivity analysis as to the likely proportion of fugitive emissions from
the RTL has been completed.
Further, the potential impacts of emissions diverted to the bypass stack as opposed to through the VCU
were modelled.
A detailed summary of all the emission scenarios modelled is provided in Section 7.3.
The results obtained for each new source are added to the existing background concentrations and
compared to the appropriate impact assessment criteria. The cumulative impacts are discussed in
Section 8.3.
7.2 Pollutant Dispersion Modelling
7.2.1 CALPUFF
CALPUFF is a multi-layer, multi-species non-steady state puff dispersion model that can simulate the
effects of time and space varying meteorological conditions on pollutant transport, transformation and
removal (Scire et al., 2000). The model contains algorithms for near-source effects such as building
downwash, partial plume penetration, sub-grid scale interactions as well as longer-range effects such as
pollutant removal, chemical transformation, vertical wind shear and coastal interaction effects. The
model employs dispersion equations based on a Gaussian distribution of pollutants across the puff and
takes into account the complex arrangement of emissions from point, area, volume, and line sources.
In March 2011 the NSW EPA published generic guidance and optional settings for the CALPUFF modelling
system for inclusion in the Approved Methods (TRC, 2011). The model set up for this study has been
completed in consideration of these guidelines.

Job ID 20528B | AQU-NW-001-20528 21
20528 Air Quality Assessment Vopak Bitumen Storage Facility Final.docx
7.3 Model Scenarios
Nine scenarios have been modelled as part of this air quality assessment. Scenarios 1, 2 and 3 are
detailed from the EPA Prevention Notice, with the remaining scenarios assessed to develop options for
future odour control within the Vopak bitumen facility. The scenarios evaluated are as follows:
■ Scenario 1: running the VCU continuously, with vapours from only one of the three product tanks
directed to the VCU at any one time;
■ Scenario 2: running the VCU continuously, with vapours from all three tanks directed to the VCU
at any time when transfers of bitumen from a ship to the premises are not taking place;
■ Scenario 3: running the VCU only during transfers of bitumen from a ship to the premises;
■ Scenario 4: Scenario 1 plus the emissions from 2 RTLs via the VCU and the fugitive emissions from
RTL;
■ Scenario 5: Scenario 2 plus the emissions from 2 RTL activities via the VCU and fugitive emissions
from the RTLs;
■ Scenario 6: Scenario 3 plus the emissions from 2 RTL activities via the VCU and fugitive emissions
from the RTLs;
■ Scenario 7: Scenario 1, but with discharge via the Bypass stack;
■ Scenario 8: Scenario 2, but with discharge via the Bypass stack;
■ Scenario 9: Scenario 3, but with discharge via the Bypass stack;
The primary odour producing sources at the Vopak bitumen facility include tank venting, the bypass
stack, the VCU and RTL. These emission sources are discussed further in Section 7.4.
Table 7.1 presents a summary of the emission source statuses for each of the modelled scenarios.
Table 7.1: Summary of Model Scenarios
Scenario VCU Status Bypass
Status Tank 1 Tank 2 Tank 3 Ship Status RTL Status
1 Active Inactive Tank
Breathing
Emissions to
VCU
Tank
Breathing Inactive Inactive
2 Active Inactive Emissions to
VCU
Emissions to
VCU
Emissions to
VCU Inactive Inactive
3 Active Inactive Tank
Breathing
Emissions to
VCU
Tank
Breathing Unloading Inactive
4 Active Inactive Tank
Breathing
Emissions to
VCU
Tank
Breathing Inactive Loading
5 Active Inactive Emissions to
VCU
Emissions to
VCU
Emissions to
VCU Inactive Loading
6 Active Inactive Tank
Breathing
Emissions to
VCU
Tank
Breathing Unloading Loading
7 Inactive Active Tank
Breathing
Emissions to
Bypass
Tank
Breathing Inactive Inactive
8 Inactive Active Emissions to
Bypass
Emissions to
Bypass
Emissions to
Bypass Inactive Inactive
9 Inactive Active Tank
Breathing
Emissions to
Bypass
Tank
Breathing Unloading Inactive

Job ID 20528B | AQU-NW-001-20528 22
20528 Air Quality Assessment Vopak Bitumen Storage Facility Final.docx
7.4 Model Inputs
7.4.1 Vapour Combustion Unit
Uncontrolled emissions from ship unloading were estimated based on the volumetric flow rate of
approximately 350 m3/hr. For modelling purposes, the emissions from ship unloading were calculated by
multiplying the maximum a measured pollutant concentrations (within the tank headspace) by the
volumetric flow rate of ship unloading.
The efficiency of the VCU was assumed to be 99%. This assumption as the efficiency of the VCU has been
confirmed as valid by the manufacturer (Pers. Comm., Gasco, 17 August 2015).
For modelling scenarios involving the VCU, emissions were assumed to occur 24 hours a day, 365 days
per year. In reality, the VCU is designed to capture emissions from tank vents during ship discharges and
RTL operations. There are anticipated to be 8-16 ship discharges per annum, dependent upon vessel size.
The modelled parameters for the VCU are presented in Table 7.2.
Table 7.2: Modelling Emission Parameters from Vapour Combustion Unit
Parameters VCU
Stack Diameter (m) 0.53
Stack Height (m) 12
Temperature (K) 1158
Velocity (m/s) 23
Odour / hydrocarbon destruction efficiency 99%
x coordinate (UTM) 335536
y coordinate (UTM) 6239293
z coordinate 4
7.4.2 Road Tanker Loadout
Potential emissions from RTL at the gantry were estimated using the same method described in
Section 7.4.1. The volumetric flow rate for one bay is up to 90 m3/hr, a conservative estimation of two
bays operating at the same time was assumed.
The percentage of fugitive emissions leaving the RTL gantry was determined using a sensitivity analysis
exercises. This involved varying the emissions to determine a reasonable (likely) partitioning between
emissions leaving the gantry as (near ground level) fugitive emissions and the emission collected and
reticulated to / treated by the VCU. This ratio was then used for scenarios 4, 5 and 6. The results of the
sensitivity analysis are presented in Section 8.
7.4.3 Bypass Stack
The bypass stack is used to disperse emissions at the bitumen facility. The emission rates from the ship
load-out and RTL are the same as stated above. Further (unlike the VCU), there is no emission control
applied to this source. That is, the emissions from tank venting, ship load-out and the gantry are emitted
as per the modelled parameters presented in Table 7.3.
a The maximum odour unit measurement recorded in the Stephensons Report (2015) was used in the
emission estimation of ship unloading and RTL load out.

Job ID 20528B | AQU-NW-001-20528 23
20528 Air Quality Assessment Vopak Bitumen Storage Facility Final.docx
Table 7.3: Modelling Emission Parameters from Bypass Stack
Parameters Bypass
Stack Diameter (m) 0.3
Stack Height (m) 25
Temperature (K) 338
Velocity (m/s) 11
Odour / hydrocarbon destruction efficiency N/A
x coordinate (UTM) 335529
y coordinate (UTM) 6239290
z coordinate 4
7.4.4 Tank Breathing
The three storage tanks on site have a ratio of bitumen product to headspace equivalent to 7.3:1. The
headspace in these tanks results in tank outbreathing loss emissions. For modelling purposes, it has been
assumed that these emissions occur 24 hours a day, 365 days per year.
A volumetric flowrate of 0.006 (m3/s) was used in the assessment. This value was referenced from the
report issued in 2011 by Pacific Environment for the Vopak site, “Air Quality Assessment – Port Botany
Bitumen Storage Facility”. The original flow rate was estimated through use of the US EPA program TANKS,
and it was concluded that the tank inputs used are comparable to the as built specifications.
The modelled parameters for tank venting are presented in Table 7.4.
Table 7.4: Modelling Emission Parameters from Tank Venting (Breathing Losses)
Parameters Tank Vent
Vent Diameter (m) 0.3
Vent Height (m) 23
Temperature (K) 313
Velocity (m/s) 0.1
Tank 1
x coordinate (UTM) 335540
y coordinate (UTM) 6239179
z coordinate 4.9
Tank 2
x coordinate (UTM) 335570
y coordinate (UTM) 6239191
z coordinate 4.9
Tank 3
x coordinate (UTM) 335559
y coordinate (UTM) 6239219
z coordinate 4.9
7.5 Source Locations
Emission sources were represented by a series of point sources and a ground-level volume source (fugitive
RTL emissions) situated according to the location of those activities. These locations were derived from
the site layout (Figure 2.1) and the proposed scenarios outlined in Section 7.3.

Job ID 20528B | AQU-NW-001-20528 24
20528 Air Quality Assessment Vopak Bitumen Storage Facility Final.docx
7.6 Peak-to-Mean Ratio
As discussed in Section 4, peak-to-mean ratios have been applied to the measured emission rates. The
peak-to-mean ratios are used to cover a range of atmospheric conditions. The emissions were modelled
for all stability classes and a range of wind speeds. For conditions where the odour sources are considered
as volume sources or point sources with building wake effect, a peak-to-mean ratio of 2.3 is applied for
both the near field and far field. Therefore, a peak-to-mean ratio of 2.3 was applied to odorous emissions.
7.7 Source Sampling
Sampling of the constituents of the tank headspace was completed by Stephenson (2015), at the Vopak
bitumen facility on 30 July 2015. The results obtained are detailed in Table 7.5, with the relevant extracts
from the Stephenson report presented in Appendix A.
Table 7.5: Sampling Results from Stephensons Report (2015)
Emission Source Odour Benzene Hydrogen Sulfide
(OU) (mg/m3) (ppm)
Tank 1 36,000 1.00 46
Tank 2 33,000 0.013 14
Tank 31 39,000
0.22 25 30,000
1 The average of the Odour Unit concentrations for Tank 3 was used in the dispersion modelling.
7.8 Building Wake Effects
Building wake effects were included in the modelling simulations and were incorporated into the
CALPUFF modelling using the PRIME downwash algorithm.
7.9 Modelled Emission Rates
The specific emission rates for point and volume sources were determined using the analysis results from
Stephenson (2015).
A listed summary of the emissions inventory adopted for each modelling scenario is provided in
Appendix B. Note that a peak-to-mean ratio of 2.3 was applied to all odour and hydrogen sulfide sources
within the dispersion modelling.

Job ID 20528B | AQU-NW-001-20528 25
20528 Air Quality Assessment Vopak Bitumen Storage Facility Final.docx
8 MODELLING RESULTS
8.1 Fugitive Emissions from RTL Gantry Sensitivity Analysis
The likely ratio of fugitive to VCU emissions leaving the RTL gantry during loadout activities was estimated
through a sensitivity analysis based on emission scenario 6, presented in Table 8.1. For example, if an
assumption of 50% fugitive odours and 50% of emissions to the VCU presented odour dispersion results
showing exceedances of odour criteria in the wider community on a regular basis, this is clearly too
conservative an assumption to adopt.
Scenario 6 was selected as it represents the highest odour emission inventory involving the RTL activities.
Table 8.1 shows the results of this sensitivity analysis, based on assumed partitioning of fugitive emission to
VCU emission.
Table 8.1: Odour Sensitivity Analysis: Scenario 6
Discrete Receptor ID
Odour (OU)
Fugitive Emissions : VCU Emissions
100 : 0 80 : 20 60 : 40 40 : 60 20 : 80 0: 100
1 0.03 0.02 0.02 0.01 0.01 0.00
2 0.03 0.02 0.02 0.01 0.01 0.01
3 0.02 0.02 0.02 0.01 0.01 0.01
4 0.02 0.02 0.01 0.01 0.01 0.00
5 0.02 0.01 0.01 0.01 0.01 0.00
6 0.10 0.08 0.07 0.05 0.04 0.02
7 0.2 0.1 0.1 0.09 0.06 0.04
8 0.06 0.05 0.04 0.03 0.02 0.01
9 0.06 0.05 0.04 0.03 0.02 0.01
10 0.08 0.07 0.06 0.04 0.03 0.01
11 0.06 0.05 0.04 0.03 0.02 0.01
12 3.8 3.1 2.4 1.7 0.9 0.3
The results in Table 8.1 indicate that under all of the potential fugitive release scenarios (including 100%
fugitive emissions, and no emission captured by the VCU) there was no predicted exceedance of the
2 OU odour goal from this source alone at any of the residential receptor locations.
Thus, for modelling purposes, a 40:60 split of fugitive to VCU emissions from the gantry was selected. This
partitioning is considered conservative since air extraction at the gantry exceeds the potential air
displaced during tanker filling. Air is extracted at the RTL gantry at a rate of 100 m3/hr/RTL. Conversely,
road tankers are loaded at a rate up to 90 m3/hr.
Further, under the 40:60 scenario, it was also deemed that odour predictions were not unrealistically high.
This ratio has been adopted in the modelling of scenarios 4, 5 and 6.
8.2 Assessment of Impacts
Modelling results for the maximum predicted odour, benzene and hydrogen sulfide concentrations at
each discrete receptor are presented in Table 8.2 and Table 8.3, referencing the relevant NSW EPA
criteria.

Job ID 20528B | AQU-NW-001-20528 26
20528 Air Quality Assessment Vopak Bitumen Storage Facility Final.docx
Table 8.2: Maximum Predicted Odour Concentrations (99th Percentile 1-second average) Scenarios 1-9
Discrete Receptor ID
Odour
(OU)
1-second average (nose response)
Assessment Criterion: 2 OU
Scenario
1 2 3 4 5 6 7 8 9
1 0.003 0.0004 0.004 0.01 0.01 0.01 0.03 0.08 0.02
2 0.003 0.001 0.005 0.01 0.01 0.01 0.03 0.09 0.02
3 0.004 0.0005 0.01 0.01 0.01 0.01 0.03 0.1 0.02
4 0.003 0.0004 0.005 0.01 0.01 0.01 0.03 0.08 0.02
5 0.002 0.0003 0.003 0.01 0.01 0.01 0.02 0.05 0.01
6 0.01 0.002 0.02 0.04 0.03 0.05 0.1 0.3 0.08
7 0.02 0.002 0.04 0.08 0.06 0.09 0.1 0.4 0.09
8 0.01 0.001 0.01 0.03 0.02 0.03 0.06 0.2 0.04
9 0.01 0.001 0.01 0.03 0.02 0.03 0.05 0.1 0.04
10 0.01 0.001 0.01 0.04 0.03 0.04 0.08 0.2 0.05
11 0.01 0.001 0.01 0.03 0.02 0.03 0.05 0.2 0.04
12 0.2 0.01 0.3 1.6 1.5 1.7 0.5 1.7 0.4

Job ID 20528B | AQU-NW-001-20528 27
20528 Air Quality Assessment Vopak Bitumen Storage Facility Final.docx
Table 8.2 indicates that the worst-case impact of odour from the facility at the nearest residential sensitive
receptor locations is predicted to be well below the odour performance goal of 2 OU.
The maximum odour concentration of 1.7 OU for scenarios 6 and 8 is predicted at the site entrance
(Receptor 12). At the closest residential receptor (Receptor 6) for the same scenarios, it is predicted that
in maximum odour concentrations would be well below the odour criterion.
Scenarios 4, 5, 6 and 8 produce the highest odour concentration predictions of those modelled. These
have been presented as contour plots shown in Figure 8.1 to Figure 8.4.
It is noted that it is not meaningful to describe odour impacts in less than whole numbers, however odour
units have been reported as fractions of odour units to show the reduction in predicted odour spatially
around the site.
Species:
Odour
Averaging Time:
1-second
Percentile:
99th
Scenario:
4
Location:
Vopak Terminals
Model Used:
CALPUFF v6.42
Units:
OU
Criterion:
2
Met Data:
July 2014 – June 2015
(CALMET)
Plot:
A Rouggos
Figure 8.1: Predicted 99th Percentile 1-second Odour Concentrations – Scenario 4

Job ID 20528B | AQU-NW-001-20528 28
20528 Air Quality Assessment Vopak Bitumen Storage Facility Final.docx
Species:
Odour
Averaging Time:
1-second
Percentile:
99th
Scenario:
5
Location:
Vopak Terminals
Model Used:
CALPUFF v6.42
Units:
OU
Criterion:
2
Met Data:
July 2014 – June 2015
(CALMET)
Plot:
A Rouggos
Figure 8.2: Predicted 99th Percentile 1-second Odour Concentrations – Scenario 5
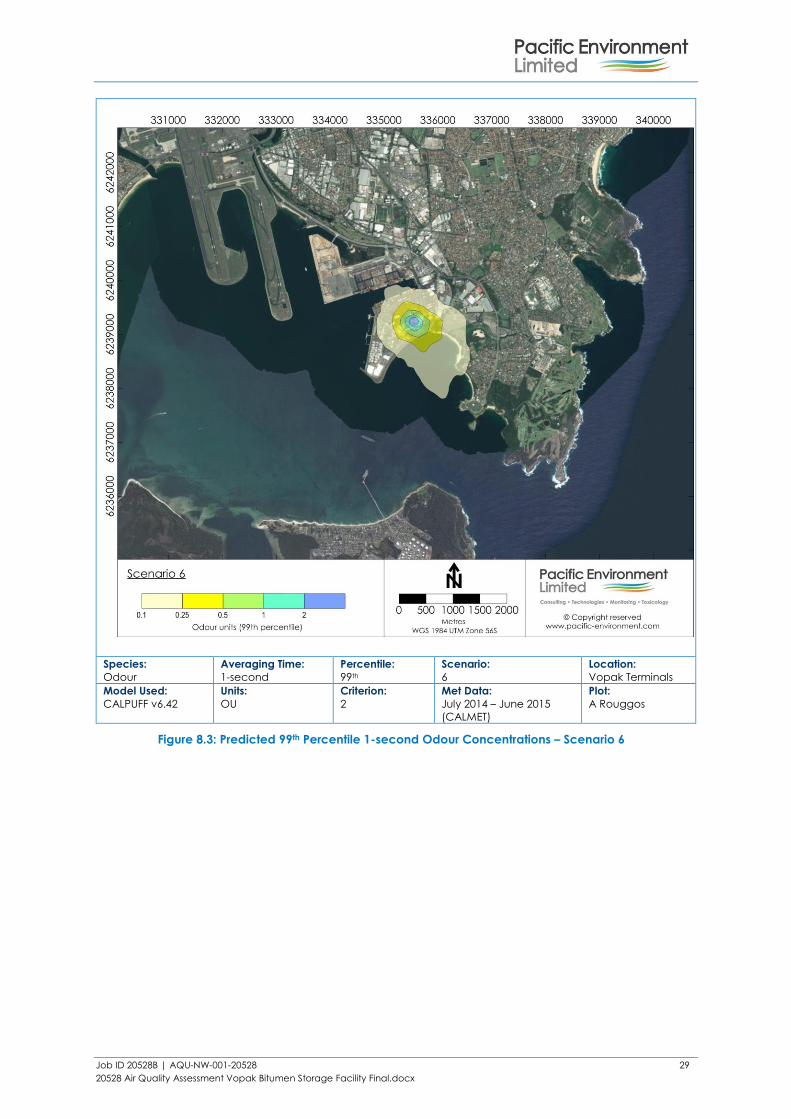
Job ID 20528B | AQU-NW-001-20528 29
20528 Air Quality Assessment Vopak Bitumen Storage Facility Final.docx
Species:
Odour
Averaging Time:
1-second
Percentile:
99th
Scenario:
6
Location:
Vopak Terminals
Model Used:
CALPUFF v6.42
Units:
OU
Criterion:
2
Met Data:
July 2014 – June 2015
(CALMET)
Plot:
A Rouggos
Figure 8.3: Predicted 99th Percentile 1-second Odour Concentrations – Scenario 6

Job ID 20528B | AQU-NW-001-20528 30
20528 Air Quality Assessment Vopak Bitumen Storage Facility Final.docx
Species:
Odour
Averaging Time:
1-second
Percentile:
99th
Scenario:
8
Location:
Vopak Terminals
Model Used:
CALPUFF v6.42
Units:
OU
Criterion:
2
Met Data:
July 2014 – June 2015
(CALMET)
Plot:
A Rouggos
Figure 8.4: Predicted 99th Percentile 1-second Odour Concentrations – Scenario 8
As seen above, of the scenarios modelled, scenario 8 produces the highest spatial distribution of odour
around the site. To account for product, and associated odour, variability, along with the potential for
additional odour due to higher temperature load-out, a further scenario was assessed.
This comprised of a conservative sensitivity analysis, whereby the odour emission rates for scenario 8 were
doubled (scenario 8 (b)).
Figure 8.5 presents the contour plot for scenario 8 (b), which represents a worst case scenario referencing
odour emission rates double those observed at the site.

Job ID 20528B | AQU-NW-001-20528 31
20528 Air Quality Assessment Vopak Bitumen Storage Facility Final.docx
Species:
Odour
Averaging Time:
1-second
Percentile:
99th
Scenario:
8 (b)
Location:
Vopak Terminals
Model Used:
CALPUFF v6.42
Units:
OU
Criterion:
2
Met Data:
July 2014 – June 2015
(CALMET)
Plot:
A Rouggos
Figure 8.5: Predicted 99th Percentile 1-second Odour Concentrations – Scenario 8 (b)
The results from Figure 8.5 indicate that, even under the worst-case assumptions adopted, the odour
concentrations for Scenario 8 (b) would be below the odour criterion at the sensitive receptors.

Job ID 20528B | AQU-NW-001-20528 32
20528 Air Quality Assessment Vopak Bitumen Storage Facility Final.docx
To provide a screening evaluation of benzene and hydrogen sulfide concentrations off-site, the emission
scenario 8 was also modelled for these parameters. Scenario 8 was selected as this represents the
maximum anticipated emission scenario from the site. The results in Table 8.3 indicate that the
concentration of benzene is predicted to be well below the EPA criterion under a worst case emission
scenario. There is anticipated to be a small exceedance of the hydrogen sulfide criterion at the boundary
of the site under the same scenario, however at all residential receptors, concentrations are predicted
to be well below the criterion.
Further, Scenario 8 does not represent an operational scenario at the site. This is supported by Vopak’s
Bitumen Odour Management Procedures (Section 9.2). Therefore, the maximum predicted
concentrations of benzene and hydrogen sulfide in the vicinity of the site are expected to be lower than
presented in Table 8.3 in reality.
Given the low predicted concentrations at a reasonable worst-case emission scenario, modelling of
lesser emission scenarios have not been completed for these air quality metrics.
Table 8.3: Scenario 8: Benzene and Hydrogen Sulfide
Discrete Receptor ID
Benzene
(mg/m3)
Hydrogen Sulfide
(µg/m3)
99.9th Percentile 1- hour 99th Percentile 1- second
Assessment Criteria
0.029 1.38
1 0.0016 0.09
2 0.0018 0.1
3 0.0018 0.1
4 0.0016 0.1
5 0.0012 0.06
6 0.004 0.4
7 0.004 0.4
8 0.002 0.2
9 0.002 0.2
10 0.002 0.3
11 0.004 0.2
12 0.02 2.0
The concentration predictions presented in Table 8.3 are shown spatially as contour plots in Figure 8.6
and Figure 8.7.

Job ID 20528B | AQU-NW-001-20528 33
20528 Air Quality Assessment Vopak Bitumen Storage Facility Final.docx
Species:
Benzene
Averaging Time:
1-hour
Percentile:
99.9th
Scenario:
8
Location:
Vopak Terminals
Model Used:
CALPUFF v6.42
Units:
mg/m3
Criterion:
0.029
Met Data:
July 2014 – June 2015
(CALMET)
Plot:
A Rouggos
Figure 8.6: Predicted 99.9th Percentile 1-hour Benzene Concentrations – Scenario 8

Job ID 20528B | AQU-NW-001-20528 34
20528 Air Quality Assessment Vopak Bitumen Storage Facility Final.docx
Species:
Hydrogen Sulfide
Averaging Time:
1-seond
Percentile:
99th
Scenario:
8
Location:
Vopak Terminals
Model Used:
CALPUFF v6.42
Units:
µg/m3
Criterion:
1.38
Met Data:
July 2014 – June 2015
(CALMET)
Plot:
A Rouggos
Figure 8.7: Predicted 99th Percentile 1-second Hydrogen Sulfide Concentrations – Scenario 8

Job ID 20528B | AQU-NW-001-20528 35
20528 Air Quality Assessment Vopak Bitumen Storage Facility Final.docx
8.3 Cumulative Impacts
To assess impacts against the relevant air quality standards and goals, it is necessary to have information
on the background concentrations to which the site is likely to contribute. The existing background
environment is described in Section 5.
The predicted maximum odour concentration at the closest sensitive receptor (excluding the entry/exit)
as a result of activities on site is 0.3 OU (scenario 8). When this is added to the predicted maximum odour
concentration of 0.1 OU in the Terminals Air Quality Assessment (GHD, 2011), the cumulative odour
concentration of 0.4 OU is still well below the odour criterion of 2 OU.
The predicted benzene concentration is an order of magnitude or more below its respective ground level
criterion. The predicted benzene concentration in the Terminals Air Quality Assessment (GHD, 2011) is also
well below the EPA criterion. Therefore, the cumulative emissions of benzene are expected to be in
compliance with the air quality goals.
Ambient concentrations of hydrogen sulfide, in the absence of the Vopak bitumen terminal activities,
are also anticipated to be negligible.

Job ID 20528B | AQU-NW-001-20528 36
20528 Air Quality Assessment Vopak Bitumen Storage Facility Final.docx
9 RECOMMENDATIONS
9.1 Odour Emission Control
The results of the dispersion modelling indicate that the air quality impact from current operations in the
vicinity of the Vopak bitumen facility are predicted to be minimal.
However, to attain a more thorough understanding of the operations and potential sources of odour
impact, a source apportionment exercise has been completed on scenarios 3, 6, and 9. This has been
completed to determine which potential odour emission sources may have the greatest off-site impact.
The outputs of this exercise are shown in Table 9.1 and Table 9.2. The receptors selected are
representative of the closest residential receptor and the entry/exit to the site respectively (receptors 6
and 12).
Table 9.1: Odour Emission Source Percentage Contribution: Receptor 6
Scenario
Source 3 6 9
Tank 1 33% 16% 4%
Tank 2 31% 15% 5%
Tank 3 35% 18% 6%
VCU 1% N/A N/A
Bypass N/A N/A 85%
Gantry Fugitive N/A 51% N/A
Total 100 100 100
Table 9.2: Emission Source Percentage Contribution: Receptor 12
Scenario
Source 3 6 9
Tank 1 6% 8% N/A
Tank 2 34% 9% 0%
Tank 3 60% 10% 3%
VCU N/A N/A N/A
Bypass N/A N/A 97%
Gantry Fugitive N/A 73% N/A
Total 100 100 100
Table 9.1 and Table 9.2 indicates that the emission from the bypass stack and tank venting have the
highest potential contribution to off-site odour impacts. Further, the bypass and gantry emissions have an
increased potential for contribution in the region closest to the site.
While the dispersion modelling scenarios presented above indicate that compliance with odour goals
should be easily achieved, in the event of differing emission scenarios (i.e. handling of off-spec / odorous
bitumen batches) that odour management should concentrate on the above sources (i.e. use of VCU
in favour of the bypass, extraction to VCU during tank breathing) in the first instance. By prioritising these
odour management activities, it is considered that the potential for off-site odour impacts can be
tangibly reduced.

Job ID 20528B | AQU-NW-001-20528 37
20528 Air Quality Assessment Vopak Bitumen Storage Facility Final.docx
9.2 Bitumen Odour Management Procedures
The existing bitumen odour management procedures (BOMP, 2014) for the Vopak bitumen facility have
been reviewed by Pacific Environment. The results of the dispersion modelling indicate that current
procedures followed by Vopak Terminals are appropriate to manage adverse off-site odour impacts.
Section 6.1 of the BOMP describes the recommended operation of the vapour combustion unit. As
identified in the dispersion modelling results, fugitive emissions from the RTL gantry have the potential to
significantly contribute to total site odour emissions without adequate capture and control.
To ensure that high levels of odour management are maintained, it is recommended that Vopak operate
the VCU as per the current conditions provided in their management procedures, namely;
1. On individual tank mode during tank ship receipt and wharfline blowing;
2. On road tanker filling mode during road tanker filling;
3. On individual tank mode to receiving tank during receipt from tank transfer or road tanker
unloading;
4. On individual tank mode during tank top maintenance;
5. On individual tank or multi-tank cycling modes when tank storage temperature is elevated
above 160°C;
6. On individual tank or multi-tank cycling modes when high odours are detected during
odour monitoring;
7. On individual tank or multi-tank cycling modes when an odour complaint is received as
long as conclusion of the internal investigation determines any link with the operation of
the bitumen tanks.
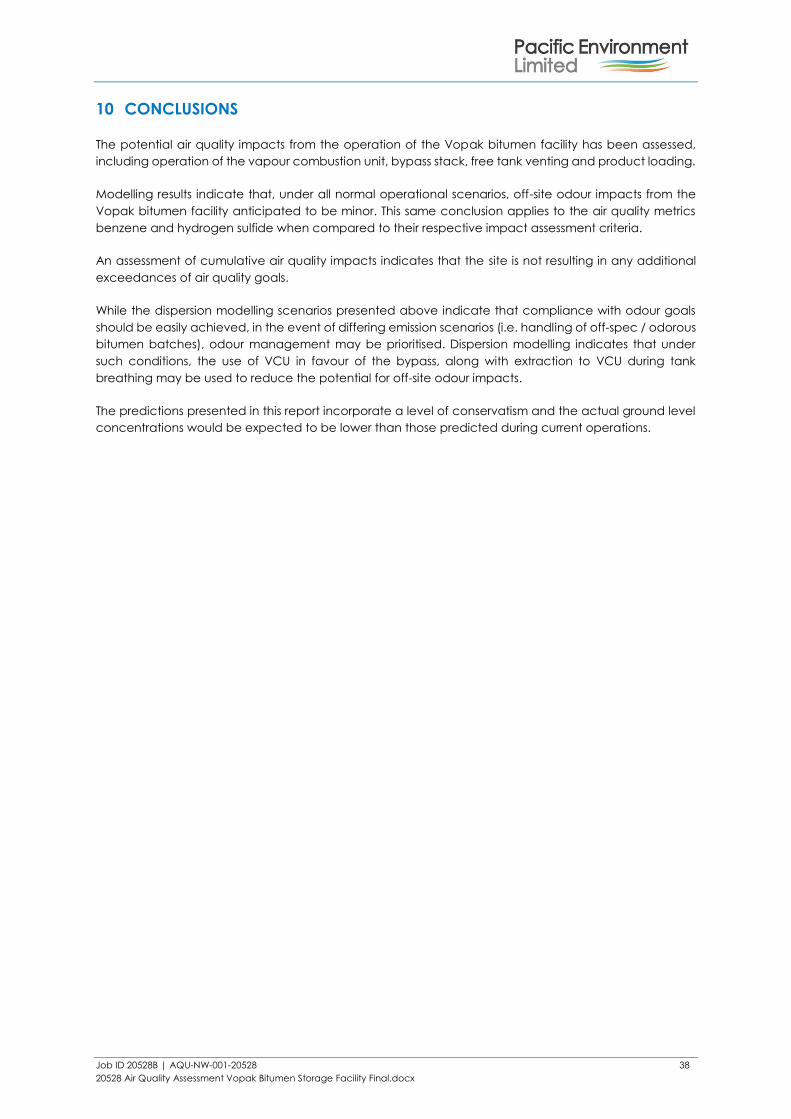
Job ID 20528B | AQU-NW-001-20528 38
20528 Air Quality Assessment Vopak Bitumen Storage Facility Final.docx
10 CONCLUSIONS
The potential air quality impacts from the operation of the Vopak bitumen facility has been assessed,
including operation of the vapour combustion unit, bypass stack, free tank venting and product loading.
Modelling results indicate that, under all normal operational scenarios, off-site odour impacts from the
Vopak bitumen facility anticipated to be minor. This same conclusion applies to the air quality metrics
benzene and hydrogen sulfide when compared to their respective impact assessment criteria.
An assessment of cumulative air quality impacts indicates that the site is not resulting in any additional
exceedances of air quality goals.
While the dispersion modelling scenarios presented above indicate that compliance with odour goals
should be easily achieved, in the event of differing emission scenarios (i.e. handling of off-spec / odorous
bitumen batches), odour management may be prioritised. Dispersion modelling indicates that under
such conditions, the use of VCU in favour of the bypass, along with extraction to VCU during tank
breathing may be used to reduce the potential for off-site odour impacts.
The predictions presented in this report incorporate a level of conservatism and the actual ground level
concentrations would be expected to be lower than those predicted during current operations.
Job Number 20528B | AQU-NW-001-20528 39
20528 Air Quality Assessment Vopak Bitumen Storage Facility Final.docx
11 REFERENCES
BOMP (2014). Vopak, Bitumen Odour Management Procedure, October 2014.
GHD (2011). Terminals Pty Ltd – Report for Bitumen Import and Dispatch Facility, Port Botany – Air
Assessment, April 2011.
Hibberd, M. F., Physick, W. L., and Park, G. (2003). Verification of several aspects of TAPM against multi-
year monitoring data at Collie. In: National Clean Air Conference: linking air pollution science, policy
and management: CASNO3, Newcastle City Hall. [Newcastle, NSW]: Clean Air Society of Australia and
New Zealand. p. 71 (printed abstract). 6 p.
Hurley, P. J. (2002a). The Air Pollution Model (TAPM) version 2: user manual. Aspendale: CSIRO
Atmospheric Research. (CSIRO Atmospheric Research internal paper; 25). 38 p.
Hurley, P. J. (2002b). The Air Pollution Model (TAPM) version 2. part 1: technical description. Aspendale:
CSIRO Atmospheric Research. (CSIRO Atmospheric Research technical paper; no.55). 49 p.
Katestone Scientific Pty Ltd (1995). "The evaluation of peak-to-mean ratios for odour assessments"
Volume 1 - Main Report, May 1995.
Katestone Scientific (1998). “Report from Katestone Scientific to Environment Protection Authority of
NSW, Peak to Mean Ratios for Odour Assessments”.
Luhar, A. K., and Hurley, P. J. (2003). Evaluation of TAPM, a prognostic meteorological and air pollution
model, using urban and rural point-source data. Atmospheric Environment, 37 (20): 2795-2810.
NSW EPA (2005). “Approved Methods for the Modelling and Assessment of Air Pollutants in New South
Wales”. NSW Department of Environment & Conservation. Sydney.
PAE Holmes (2011). Vopak Terminal Sydney Pty Ltd. Air Quality Assessment – Port Botany Bitumen
Storage Facility, November 2011.
Scire, J.S., D.G. Strimaitis and R.J. Yamartino (2000). A User’s Guide for the CALPUFF Dispersion Model
(Version 5), Earth Tech, Inc., Concord, MA.
Stephenson & Associates Pty Ltd (2015). “Bitumen Storage Tank Emissions Tests – Terminal B”, June 2015.
TRC (2011). “Generic Guidance and Optimum Model Settings for the CALPUFF Modelling System for
Inclusion into the “Approved Methods for Modelling and Assessment of Air Pollutants in NSW, Australia”,
prepared for NSW DECCW, Sydney Australia. March 2011.

Job Number 20528B | AQU-NW-001-20528 A-1
20528 Air Quality Assessment Vopak Bitumen Storage Facility Final.docx
Appendix A STEPHENSONS 2015 REPORT EXTRACT

Job Number 20528B | AQU-NW-001-20528 A-2
20528 Air Quality Assessment Vopak Bitumen Storage Facility Final.docx
Table A.1: Stephensons (2015) Report Table Extract 1

Job Number 20528B | AQU-NW-001-20528 A-3
20528 Air Quality Assessment Vopak Bitumen Storage Facility Final.docx
Table A.2: Stephensons (2015) Report Table Extract 2

Job Number 20528B | AQU-NW-001-20528 B-1
20528 Air Quality Assessment Vopak Bitumen Storage Facility Final.docx
Appendix B EMISSION ESTIMATES

Job Number 20528B | AQU-NW-001-20528 B-0
20528 Air Quality Assessment Vopak Bitumen Storage Facility Final.docx
Table B.1: Scenario 1
Emission Source Odour (OUV/s) Benzene (g/s) Hydrogen Sulfide (g/s)
Vapour Combustion Unit 127 2.17E-08 8.05E-05
Tank 1 585 7.07E-06 1.12E-03
Tank 3 561 2.91E-06 6.91E-04
Table B.2: Scenario 2
Emission Source Odour (OUV/s) Benzene (g/s) Hydrogen Sulfide (g/s)
Vapour Combustion Unit 414 2.06E-06 4.89E-04
Table B.3: Scenario 3
Emission Source Odour (OUV/s) Benzene (g/s) Hydrogen Sulfide (g/s)
Vapour Combustion Unit 81 4.00E-07 9.50E-05
Tank 1 585 7.07E-06 1.12E-03
Tank 2 537 9.19E-08 3.41E-04
Tank 3 561 2.91E-06 6.91E-04
Table B.4: Scenario 4
Emission Source Odour (OUV/s) Benzene (g/s) Hydrogen Sulfide (g/s)
Vapour Combustion Unit 2760 1.37E-05 3.26E-03
Tank 1 585 7.07E-06 1.12E-03
Tank 3 561 2.91E-06 6.91E-04
Gantry Fugitive 1840 9.13E-06 2.17E-03
Table B.5: Scenario 5
Emission Source Odour (OUV/s) Benzene (g/s) Hydrogen Sulfide (g/s)
Vapour Combustion Unit 2760 1.37E-05 3.26E-03
Gantry Fugitive 1840 9.13E-06 2.17E-03
Table B.6: Scenario 6
Emission Source Odour (OUV/s) Benzene (g/s) Hydrogen Sulfide (g/s)
Vapour Combustion Unit 2760 1.37E-05 3.26E-03
Tank 1 585 7.07E-06 1.12E-03
Tank 2 537 9.19E-08 3.41E-04
Tank 3 561 2.91E-06 6.91E-04
Gantry Fugitive 1840 9.13E-06 2.17E-03
Table B.7: Scenario 7
Emission Source Odour (OUV/s) Benzene (g/s) Hydrogen Sulfide (g/s)
Bypass Stack 1260 2.17E-06 8.05E-03
Tank 1 585 7.07E-06 1.12E-03
Tank 3 561 2.91E-06 6.91E-04

Job Number 20528B | AQU-NW-001-20528 B-1
20528 Air Quality Assessment Vopak Bitumen Storage Facility Final.docx
Table B.8: Scenario 8
Emission Source Odour (OUV/s) Benzene (g/s) Hydrogen Sulfide (g/s)
Bypass Stack 41400 2.06E-04 4.89E-02
Table B.9: Scenario 9
Emission Source Odour (OUV/s) Benzene (g/s) Hydrogen Sulfide (g/s)
Bypass Stack 8050 4.00E-05 9.50E-03
Tank 1 585 7.07E-06 1.12E-03
Tank 2 537 9.19E-08 3.41E-04
Tank 3 561 2.91E-06 6.91E-04

This document is confidential and is prepared for the exclusive use of Vopak Terminals Australia
and those granted permission by Vopak Terminals Australia.
Report Number R000484-1
Vapour Recovery Unit
Hydrocarbon Recovery Assessment
Vopak Terminals Australia, Sydney Terminal Site B

Ektimo 17 March 2015
Report R000484 prepared for Vopak Terminals Australia, Port Botany
Page 2 of 11
Document Information
Client Name: Vopak Terminals Australia
Report Number: R000484-1
Report Title: Vapour Recovery Unit – Hydrocabon Recovery Assessment
Date of Issue: 17 March 2015
Attention: Keyhan Nouriafshar
Address: Gate B47, 20 Friendship Rd
Port Botany NSW 2036
Sampling Information
Sampling Date: 18 February 2015
Sampling Team: SC/SW
Testing Laboratory: Ektimo (ETC) ABN 74 474 273 172
Report Status
Format Document Number Report Date Prepared By Reviewed By (1) Reviewed By (2)
Preliminary Report - - - - -
Draft Report R000484-1 [DRAFT] 27 February 2015 SC AD -
Draft Report R000484-1 [DRAFT2] 6 March 2015 SC - -
Final Report R000484-1 17 March 2015 SC - -
Amend Report - - - - -
Amendment Record
Document Number Initiator Report Date Section Reason
Nil - - - -
Report Authorisation
Steven Cooper Client Manager
NATA Accredited Laboratory
No. 14601
This document is issued in accordance with NATA’s accreditation requirements. Accredited for compliance with ISO/IEC 17025. This document shall not be reproduced except in full.

Ektimo 17 March 2015
Report R000484 prepared for Vopak Terminals Australia, Port Botany
Page 3 of 11
Table of Contents
1 Executive Summary ..................................................................................................................... 4
2 Testing Summary......................................................................................................................... 4
3 Results – VRU Outlet Sampling plane & Gas parameters ........................................................... 5
4 Results – VRU INlet Sampling plane & Gas parameters .............................................................. 6
5 Test instrumentation & calibration ............................................................................................. 7
6 Method Calculations ................................................................................................................... 8
8 Plant Operating Conditions ......................................................................................................... 9
9 Test Methods .............................................................................................................................. 9
10 Quality Assurance/ Quality Control Information ...................................................................... 10
11 Definitions ................................................................................................................................. 11
List of Tables
Test Summary Table .............................................................................................................................. 4 Calibration Summary ............................................................................................................................. 7 Test Method Table ................................................................................................................................ 9
Appendices
Appendix 1 - Tank Truck Loading Data
Appendix 2 - Chart Recording of Measured VRU TOC Emissions

Ektimo 17 March 2015
Report R000484 prepared for Vopak Terminals Australia, Port Botany
Page 4 of 11
1 EXECUTIVE SUMMARY
Ektimo was engaged by Vopak Terminals Australia to perform simultaneous sampling at the inlet and outlet of
the Vapour Recovery Unit (VRU) at their Sydney terminal site B. This testing enables the efficiency of the VRU
as well as the amount of petroleum product recovered to be calculated. This testing was conducted on 18
February 2015.
This testing was performed in compliance with a directive by the Australian Taxation Office (ATO) to use a formulae derived method to determine the total amount of liquid hydrocarbon recovered from vapours by the VRU. This calculation will be used to determine the duty paid on the petroleum products loaded at the site B terminal.
The testing methods and formulae approach are described in the technical paper, written by Professor D L Trimm, entitled Vapour Recovery in the Petroleum Industry, July 1998. This report will henceforth by referred to as The Trimm Report.
Two Flame Ionization Detectors (FID’s) were calibrated and verified on-site at the start and end of the sample duration. Zero and span drift were observed to be less than 2% for both analysers. The inlet gas stream was diluted by a factor of 10 to ensure all envisaged concentrations could be captured by the instrument.
Plant operating conditions have been noted in the report. Tanker loading data is contained in Appendix 1. A
total of 683,079 litres (corrected to 15 degrees celcius and 1 atmosphere) were loaded during the four hours
of sampling.
2 TESTING SUMMARY
Test Summary Table
Parameter Value
Terminal DescriptionVopak Terminals Australia Pty Ltd Sydney
Terminal Site B
Vapour Control Unit, type John Zink
Test Date 18th February 2015
Test Period 11:30 - 15:30
Average Ambient Temperature 24 oC
Average Barometric Pressure 1018 hPa
Average Outlet Concentration (Yout) 0.8459%
Average Inlet Concentration (Yin) 11.7105%
Total Petroleum Products Loaded (Vgin test corrected) 683079 L
Total Motor Spirit Loaded Vmotor spirit (corrected) 413139 L
Total Distillate Loaded Vdistillate (corrected) 269940 L
Distillate / Motor Spirit Ratio 39.52% / 60.48%
Unit Efficiency E 93.57 %
Vapour Volume Recovered Vads test 74846 L
Vapour Recovered (% of Total Throughput) 10.96%
Liquid Volume Recovered V liq test 345.8 L
Liquid Recovered (% of Total Throughput) 0.051%
Liquid Recovered (% of Motor Spirit Throughput) 0.084%

Ektimo 17 March 2015
Report R000484 prepared for Vopak Terminals Australia, Port Botany
Page 5 of 11
3 RESULTS – VRU OUTLET SAMPLING PLANE & GAS PARAMETERS

Ektimo 17 March 2015
Report R000484 prepared for Vopak Terminals Australia, Port Botany
Page 6 of 11
4 RESULTS – VRU INLET SAMPLING PLANE & GAS PARAMETERS
Date Client Vopak Terminals Australia Pty Ltd
Report Stack ID VRU Inlet
Licence No. Location Sydney Terminal site B State NSW
EML Staff SC/ SW
Process Conditions Please refer to appended records.
Reason for testing: To determine VRU efficiency
space space space space space space space space
Sampling Plane Deta ils
Sampling plane dimensions (mm) & area 220 0.038 m²
Sampling port size, number & depth 1" BSP (x1)
Access & height of ports Ground level 1.5 m
Duct orientation & shape Vertical Circular
Downstream disturbance Junction 1 D
Upstream disturbance Bend > 10 D
No. traverses & points sampled 1 4
Traverse method & compliance AS4323.1 Non-compliant
space space space space space space space space
Comments
Non-compliant sampling plane; the testing precision will be reduced
The gas velocity at some or all sampling points is less than 3 m/ s
The stack or duct does not have the required number of access holes (ports)
The sampling plane is too near to the downstream disturbance but is greater than or equal to 1D
The number of traverses sampled is less than the requirement
The number of points sampled is less than the requirement
All results reported on a dry basis at NTP
space space space space space space space space
Stack Parameters
Moisture content, %v/ v 2.1
Gas molecular weight, g/ g mole 28.7 (wet) 28.9 (dry)
Gas density at NTP, kg/ m³ 1.28 (wet) 1.29 (dry)
space space space space space space space space
space space space Test 1 space
Gas Flow Parameters Isokinetic
Temperature, °C 30
Velocity at sampling plane, m/ s 2.4
Volumetric flow rate, discharge, m³/ s 0.09
Volumetric flow rate (wet NTP), m³/ s 0.082
Volumetric flow rate (dry NTP), m³/ s 0.08
Mass flow rate (wet basis), kg/ hour 380
Velocity difference, % -3
18/ 02/ 2015
R000484
6007

Ektimo 17 March 2015
Report R000484 prepared for Vopak Terminals Australia, Port Botany
Page 7 of 11
5 TEST INSTRUMENTATION & CALIBRATION
Two JUM Total organic compound (FID) analysers was used to measure hydrocarbon concentrations with data
logged every 10 seconds for the entire 4 hour sampling duration.
Due to an increasing inability to source the gas mix as recommended in the Trimm report the decision was
taken, in consultation with the Australian Taxation Office, to substitute propane as a calibration gas. A
mathematical conversion factor has been applied to the average final result to produce equivalency with the
calibration gas as described in the Trimm report.
The conversion factor has been calculated by averaging the molecular weight of the Trimm mix and propane
of the same concentration and calculating the multiplication factor required to achieve equivalency. The
calculated conversion factor (CF), as outlined below, has been determined to be 1.37 which has been applied
to the averages measured.
Conversion Factor Calculation
The inlet analyser was calibrated on site, at the start and end of the sampling period using medical air for zero
calibration and a 30.9% Propane in Nitrogen mix for span adjustment. This analyser has a range of 0 – 10%
(100,000 ppm) so the calibration gas and subsequently the sample gas was passed through a dilution system
to achieve a dilution factor of 10. This analyser was thus calibrated to a 3.09% (30900ppm).
The outlet analyser was calibrated on site, at the start and end of the sampling period using medical air for
zero calibration and a 9019ppm Propane in Nitrogen mix for span adjustment.
Calibration Summary
Compound MW (g/mol)
Propane 44.11 0.03 x 44.11 = 1.32 0.309 x 44.11 13.63
Butane 58.12 0.15 x 58.12 = 8.72
Pentane 72.15 0.12 x 72.15 = 8.66
Total 18.70
Conversion Factor (CF) 18.70/13.63 = 1.37
MW in 30% Trimm mixture MW in proposed Cal Gas
% ppm
Inlet Zero Drift 1.3 1300
Inlet Span Drift 1.9 1900
Outlet Zero Drift 1.3 130
Outlet Span Drift -1.6 -160

Ektimo 17 March 2015
Report R000484 prepared for Vopak Terminals Australia, Port Botany
Page 8 of 11
6 METHOD CALCULATIONS

Ektimo 17 March 2015
Report R000484 prepared for Vopak Terminals Australia, Port Botany
Page 9 of 11
8 PLANT OPERATING CONDITIONS
Unless otherwise stated, the plant operating conditions were normal at the time of testing.
Motor spirit (gasoline) and Distillate (Diesel) volumes loaded during the test period are recorded and appended
to this report. This information was supplied by Vopak Terminals Australia’s terminal inventory control system.
The volume of motor spirit loaded over the sample duration was 269,940L (adjusted to 15 oC and 1 atm).
The volume of distillate loaded over the sample duration was 413,139L (adjusted to 15 oC and 1 atm).
9 TEST METHODS
All sampling and analysis was performed by Ektimo unless otherwise specified. Specific details of the methods
are available upon request
Test Method Table
* Uncertainty values cited in this table are calculated at the 95% confidence level (coverage factor = 2)
Sampling Analysis
Velocity NSW TM-2 2ms-1 7% NA
Moisture content NSW TM-22 0.40% 19%
Sample plane criteria NSW TM-1 NA - NA
Temperature NSW TM-2 0°C 2% NA
Flow rate NSW TM-2 Location
specific
8% NA
Carbon dioxide NSW TM-24 0.10% 13%
Oxygen NSW TM-25 0.10% 13%
Determination of total amount of liquid
hydrocarbon recovered from vapour
recovery units
Vapour Recovery in
the Petroleum
Industry, July 1998
3.9 mg/m³ 2% X X
Parameter Test Method Method
Detection Limit
Uncertainty* NATA Accredited

Ektimo 17 March 2015
Report R000484 prepared for Vopak Terminals Australia, Port Botany
Page 10 of 11
10 QUALITY ASSURANCE/ QUALITY CONTROL INFORMATION
Ektimo is accredited by the National Association of Testing Authorities (NATA) for the sampling and analysis of
air pollutants from industrial sources. Unless otherwise stated test methods used are accredited with the
National Association of Testing Authorities. For full details, search for Ektimo at NATA’s website
www.nata.asn.au.
Ektimo is accredited by NATA (National Association of Testing Authorities) to Australian Standard 17025 –
General Requirements for the Competence of Testing and Calibration Laboratories. Australian Standard 17025
requires that a laboratory have a quality system similar to ISO 9002. More importantly it also requires that a
laboratory have adequate equipment to perform the testing, as well as laboratory personnel with the
competence to perform the testing. This quality assurance system is administered and maintained by the
Compliance Manager.
NATA is a member of APLAC (Asia Pacific Laboratory Accreditation Co-operation) and of ILAC (International
Laboratory Accreditation Co-operation). Through the mutual recognition arrangements with both of these
organisations, NATA accreditation is recognised world –wide.
A formal Quality Control program is in place at Ektimo to monitor analyses performed in the laboratory and
sampling conducted in the field. The program is designed to check where appropriate; the sampling
reproducibility, analytical method, accuracy, precision and the performance of the analyst. The Laboratory
Manager is responsible for the administration and maintenance of this program.

Ektimo 17 March 2015
Report R000484 prepared for Vopak Terminals Australia, Port Botany
Page 11 of 11
11 DEFINITIONS
The following symbols and abbreviations may be used in this test report:
NTP Normal temperature and pressure. Gas volumes and concentrations are expressed on a dry basis at 0°C, at discharge oxygen concentration and an absolute pressure of 101.325 kPa, unless otherwise specified.
Disturbance A flow obstruction or instability in the direction of the flow which may impede accurate flow determination. This includes centrifugal fans, axial fans, partially closed or closed dampers, louvres, bends, connections, junctions, direction changes or changes in pipe diameter.
TOC The sum of all compounds of carbon which contain at least one carbon to carbon bond, plus methane and its derivatives.
BSP British standard pipe NA Not applicable D Duct diameter or equivalent duct diameter for rectangular ducts < Less than > Greater than ≥ Greater than or equal to ~ Approximately EPA Environment Protection Authority NATA National Association of Testing Authorities AS Australian Standard USEPA United States Environmental Protection Agency TM Test Method OM Other approved method CTM Conditional test method

APPENDIX 1
Tank Truck Loading Data

77812 18/02/2015 11:34:02 9881 Diesel 29,966 30.5 844.6 29,577
77814 18/02/2015 12:19:26 2000 Gasoline 16,299 27.5 741.8 16,049
77814 18/02/2015 12:19:26 3000 Gasoline 35,185 27.9 746.9 34,636
77815 18/02/2015 12:08:46 1050 Diesel 21,508 30.2 837.8 21,229
77815 18/02/2015 12:08:46 2500 Gasoline 14,621 26.7 742.3 14,412
77815 18/02/2015 12:08:46 3000 Gasoline 7,261 25.1 747.1 7,175
77816 18/02/2015 12:04:03 9862 Gasoline 8,238 25.4 746.8 8,135
77816 18/02/2015 12:04:03 9885 Gasoline 21,612 27.4 741.8 21,281
77816 18/02/2015 12:04:03 9886 Gasoline 8,280 26.3 741.8 8,165
77819 18/02/2015 14:25:26 97 Gasoline 5,001 28.0 741.8 4,922
77819 18/02/2015 14:25:26 152 Gasoline 14,200 27.9 741.8 13,977
77819 18/02/2015 14:25:26 262 Diesel 16,992 27.3 835.4 16,813
77821 18/02/2015 14:38:29 97 Gasoline 1,799 28.1 741.8 1,770
77821 18/02/2015 14:38:29 262 Diesel 1,795 27.0 835.4 1,776
77822 18/02/2015 15:15:48 1050 Diesel 22,579 30.3 837.8 22,285
77822 18/02/2015 15:15:48 2500 Gasoline 13,992 27.2 742.3 13,784
77822 18/02/2015 15:15:48 3000 Gasoline 11,192 25.5 747.1 11,052
830871 18/02/2015 14:52:05 1050 Diesel 7,190 29.7 837.8 7,101
830871 18/02/2015 14:52:05 2500 Gasoline 4,991 27.9 742.3 4,913
830871 18/02/2015 14:52:05 3000 Gasoline 7,194 25.8 747.1 7,102
830871 18/02/2015 14:52:05 4018 Gasoline 7,180 29.0 739.8 7,056
830871 18/02/2015 14:52:05 4850 Gasoline 11,919 161.5 786.6 11,775
538327 18/02/2015 13:13:18 1000 Diesel 3,995 29.6 835.4 3,945
538327 18/02/2015 13:13:18 2000 Gasoline 19,998 27.8 741.8 19,685
538327 18/02/2015 13:13:18 4018 Gasoline 4,001 28.2 739.8 3,936
130281 18/02/2015 11:44:42 7256 Gasoline 13,334 27.2 741.8 13,134
130281 18/02/2015 11:44:42 7257 Gasoline 8,327 25.3 746.8 8,226
130281 18/02/2015 11:44:42 7259 Gasoline 8,388 27.4 756.1 8,264
130281 18/02/2015 11:44:42 7261 Diesel 18,117 29.9 837.6 17,886
870859 18/02/2015 11:43:53 97 Gasoline 8,805 26.0 741.8 8,685
870859 18/02/2015 11:43:53 210 Gasoline 7,299 27.5 756.1 7,191
870859 18/02/2015 11:43:53 254 Gasoline 14,191 25.1 746.9 14,020
870859 18/02/2015 11:43:53 264 Diesel 7,299 30.7 835.4 7,201
870870 18/02/2015 12:51:41 210 Gasoline 20,003 28.2 756.1 19,689
870870 18/02/2015 12:51:41 262 Diesel 15,795 30.5 835.4 15,587
538347 18/02/2015 12:03:29 1000 Diesel 31,996 30.3 835.4 31,578
870873 18/02/2015 13:36:44 210 Gasoline 8,800 28.2 756.1 8,664
339555 18/02/2015 12:11:34 210 Gasoline 14,992 27.7 756.1 14,766
870891 18/02/2015 13:16:53 152 Gasoline 16,243 27.5 741.8 15,994
870891 18/02/2015 13:16:53 262 Diesel 19,793 30.4 835.4 19,531
870892 18/02/2015 12:16:49 269 Diesel 50,546 30.4 837.8 49,885
870894 18/02/2015 11:39:13 210 Gasoline 30,025 27.5 756.1 29,577
870894 18/02/2015 11:39:13 264 Diesel 6,760 30.4 835.4 6,670
870898 18/02/2015 13:23:05 210 Gasoline 20,999 28.0 756.1 20,673
870898 18/02/2015 13:23:05 264 Diesel 16,190 27.7 835.4 16,014
870909 18/02/2015 13:10:36 210 Gasoline 9,792 28.1 756.1 9,639
870909 18/02/2015 13:10:36 254 Gasoline 6,096 28.2 746.9 6,000
870909 18/02/2015 13:10:36 264 Diesel 2,899 29.8 835.4 2,862
870910 18/02/2015 15:05:33 97 Gasoline 2,499 27.9 741.8 2,460
870910 18/02/2015 15:05:33 210 Gasoline 10,791 28.6 756.1 10,616
870910 18/02/2015 15:05:33 254 Gasoline 5,801 27.2 746.9 5,716
Tem
p
Dens
Net
@ 1
5 d
egre
es
Ord
er
Num
ber
Load D
ate
Load T
ime
Pro
duct
Code
Pro
duct
Nam
e
Gro
ss

APPENDIX 2
Chart Recording of Measured VRU TOC Emissions


AECOM Vopak Terminal B4Air Quality Impact Assessment
27-May-2016Prepared for – Vopak Terminals Pty Ltd – ABN: 67 004 754 750
E
eAppendix E
Predicted ConcentrationIsopleths

AECOM Vopak Terminal B4Air Quality Impact Assessment
27-May-2016Prepared for – Vopak Terminals Pty Ltd – ABN: 67 004 754 750
e-1
Appendix E Predicted Concentration Isopleths

CALPUFF View - Lakes Environmental Software
SCALE:
0 1 km
1:30,000
PROJECT TITLE:
Predicted Cumulative Benzene Concentrations (µg/m³)
COMMENTS:
Criteria29 µg/m³
CLIENT:
Vopak Terminals Pty Ltd
MODELER:
DC
DATE:
25/05/2016
PROJECT NO.:
60344169

CALPUFF View - Lakes Environmental Software
SCALE:
0 1 km
1:30,000
PROJECT TITLE:
Predicted Cumulative Cumene Concentrations (µg/m³)
COMMENTS:
Criteria21 µg/m³
CLIENT:
Vopak Terminals Pty Ltd
MODELER:
DC
DATE:
25/05/2016
PROJECT NO.:
60344169

CALPUFF View - Lakes Environmental Software
SCALE:
0 1 km
1:30,000
PROJECT TITLE:
Predicted Cumulative Cyclohexane Concentrations (µg/m³)
COMMENTS:
Criteria19,000 µg/m³
CLIENT:
Vopak Terminals Pty Ltd
MODELER:
DC
DATE:
25/05/2016
PROJECT NO.:
60344169

CALPUFF View - Lakes Environmental Software
SCALE:
0 1 km
1:30,000
PROJECT TITLE:
Predicted Cumulative Toluene Concentrations (µg/m³)
COMMENTS:
Criteria360 µg/m³
CLIENT:
Vopak Terminals Pty Ltd
MODELER:
DC
DATE:
25/05/2016
PROJECT NO.:
60344169

CALPUFF View - Lakes Environmental Software
SCALE:
0 1 km
1:30,000
PROJECT TITLE:
Predicted Cumulative n-Hexane Concentrations (µg/m³)
COMMENTS:
Criteria3,200 µg/m³
CLIENT:
Vopak Terminals Pty Ltd
MODELER:
DC
DATE:
25/05/2016
PROJECT NO.:
60344169

CALPUFF View - Lakes Environmental Software
SCALE:
0 1 km
1:30,000
PROJECT TITLE:
Predicted Cumulative Ethylbenzene Concentrations (µg/m³)
COMMENTS:
Criteria8,000 µg/m³
CLIENT:
Vopak Terminals Pty Ltd
MODELER:
DC
DATE:
25/05/2016
PROJECT NO.:
60344169

CALPUFF View - Lakes Environmental Software
SCALE:
0 1 km
1:30,000
PROJECT TITLE:
Predicted Cumulative Xylenes Concentrations (µg/m³)
COMMENTS:
Criteria190 µg/m³
CLIENT:
Vopak Terminals Pty Ltd
MODELER:
DC
DATE:
25/05/2016
PROJECT NO.:
60344169

AECOM Vopak Terminal B4Air Quality Impact Assessment
27-May-2016Prepared for – Vopak Terminals Pty Ltd – ABN: 67 004 754 750
e-1AECOM Australia Pty LtdABN 20 093 846 925