Embed Size (px)
Citation preview

C E N T E R O F M U LT I D I S C I P L I N A R Y I N T E G R A T E D
T E C H N O L O G I E S F O R F I E L D M O N I T O R I N G
U N I V E R S I T Y O F E N G I N E E R I N G A N D T E C H N O L O G Y, V I E T N A M
N A T I O N A L U N I V E R S I T Y H A N O I
Air Pollution Management System in Vietnam
International Workshop on Land Use/Cover Changes and Air Pollution in Asia
Bogor, Indonesia - August 4th – 7 th, 2015
1
N G U Y E N T H I N H A T T H A N H , B U I Q U A N G H U N G , L E T H A N H H A , N G U Y E N N A M H O A N G , N G U Y E N H A I C H A U , N G U Y E N T H A N H
T H U Y , P H A M V A N H A , L U U V I E T H U N G , M A N D U C C H U C , P H A M N G O C H A I , P H A M H U U B A N G , L E X U A N T H A N H
P H A N V A N T H A N H , D O X U A N T U

Outline
Introduction
Objectives and Approaches
PM Concentration Mapping
Air Pollution Management System
Conclusion
2

Outline
Introduction
Objectives and Approaches
PM Concentration Mapping
Air Pollution Management System
Conclusion
3
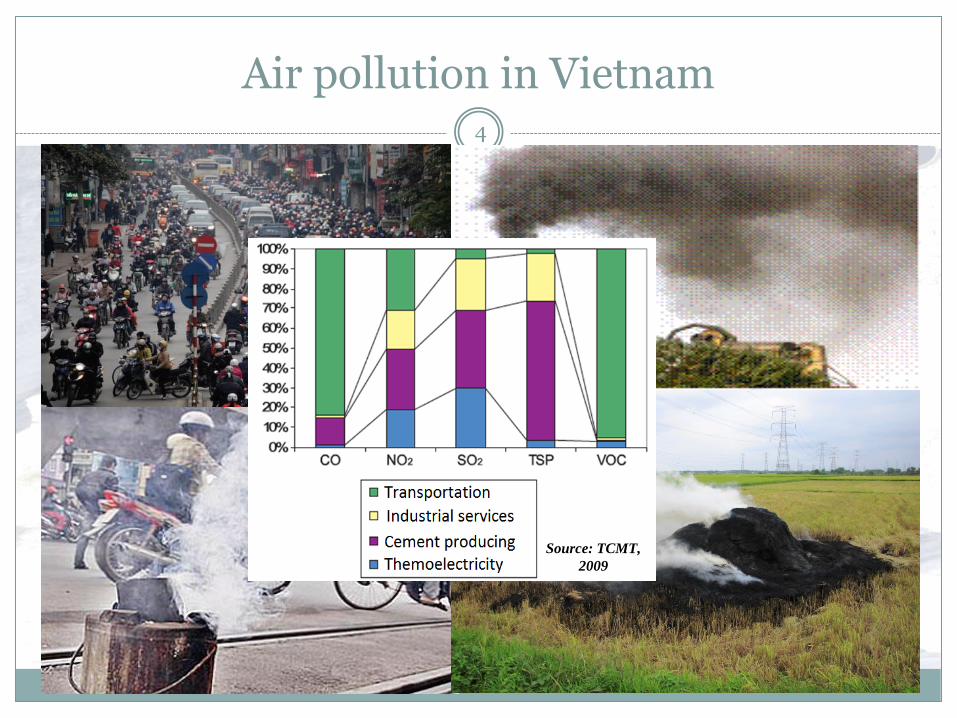
Air pollution in Vietnam 4
Source: TCMT,
2009
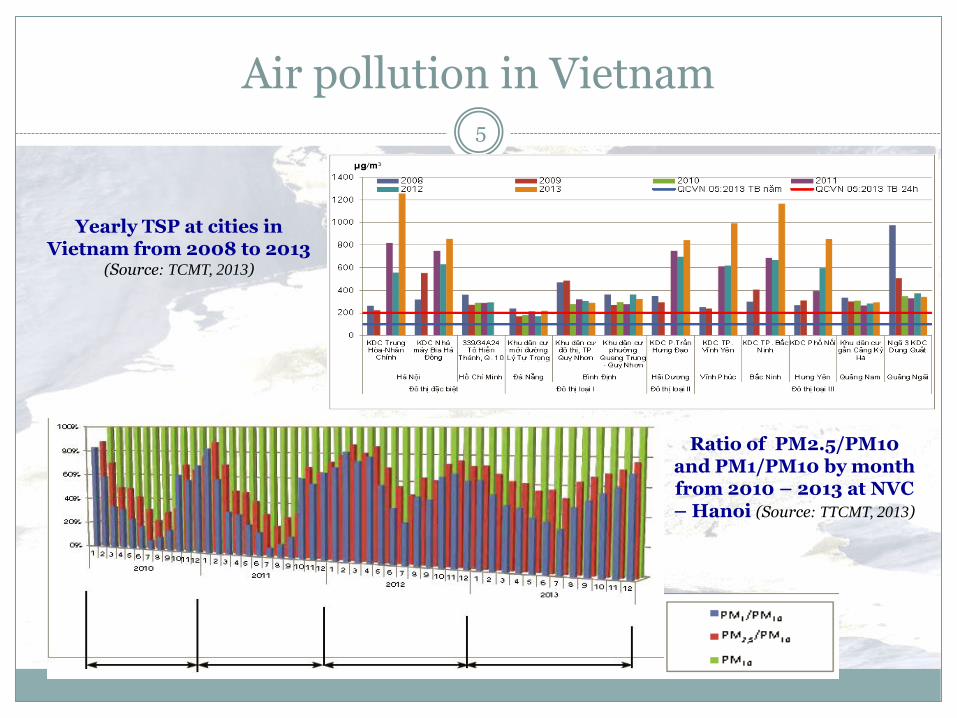
Air pollution in Vietnam 5
Ratio of PM2.5/PM10 and PM1/PM10 by month from 2010 – 2013 at NVC – Hanoi (Source: TTCMT, 2013)
Yearly TSP at cities in Vietnam from 2008 to 2013
(Source: TCMT, 2013)
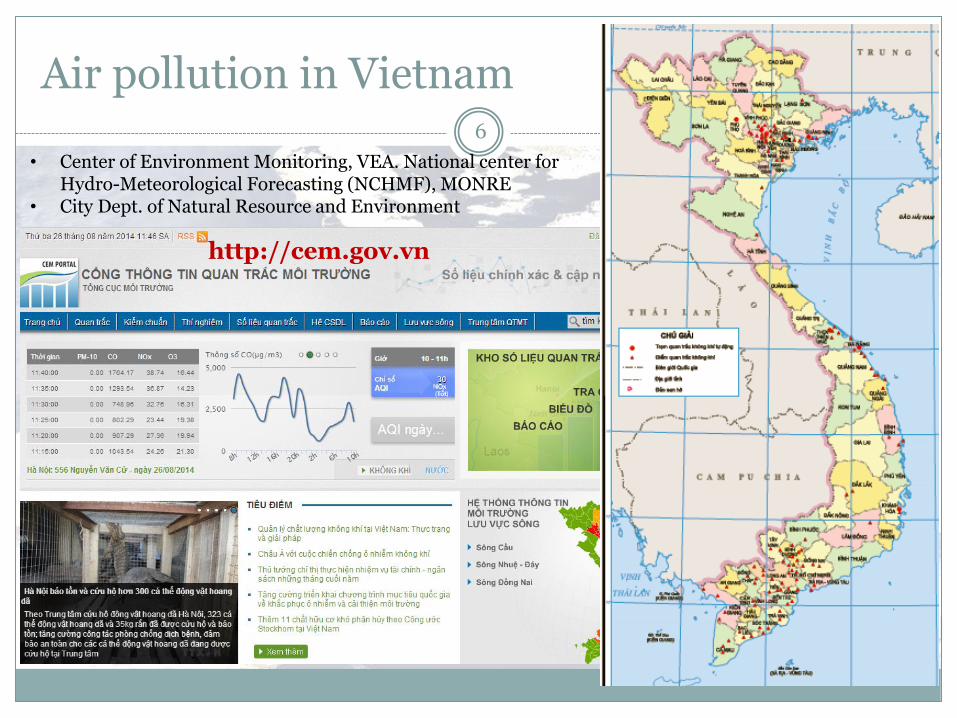
Air pollution in Vietnam 6
http://cem.gov.vn
CEM
• Center of Environment Monitoring, VEA. National center for Hydro-Meteorological Forecasting (NCHMF), MONRE
• City Dept. of Natural Resource and Environment
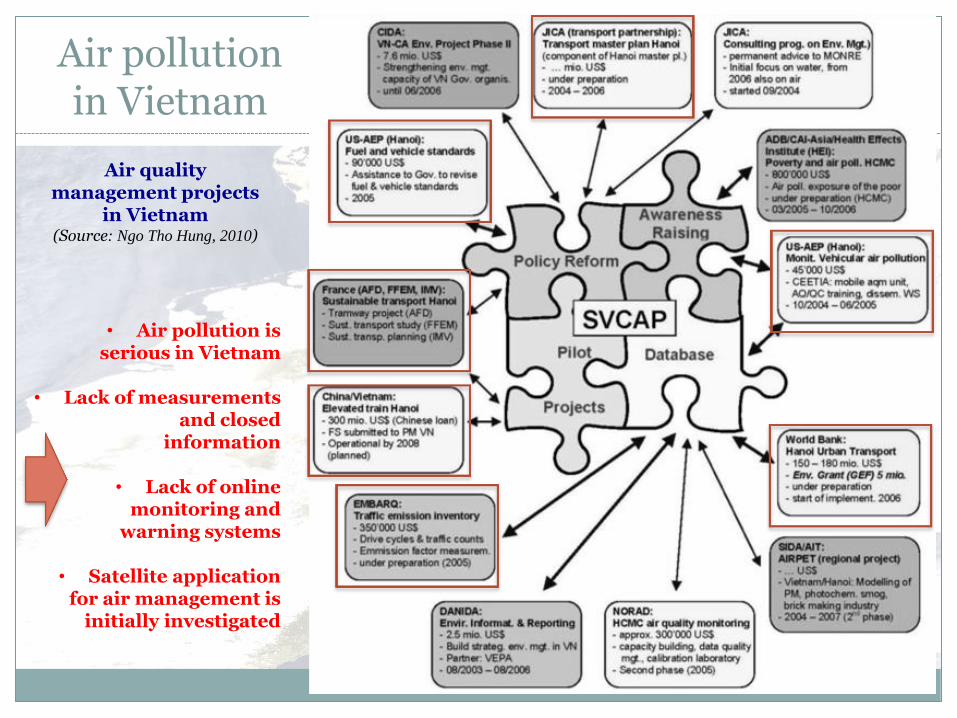
Air pollution in Vietnam
7
Air quality management projects
in Vietnam (Source: Ngo Tho Hung, 2010)
• Air pollution is serious in Vietnam
• Lack of measurements
and closed information
• Lack of online
monitoring and warning systems
• Satellite application
for air management is initially investigated

Outline
Introduction
Objectives and Approaches
PM Concentration Mapping
Air Pollution Management System
Conclusion
8

PM2.5 Estimation from MODIS in Jan 24th, 2014
PM10 estimated from SPOT4 at May 4, 2012
Research Objective and Approach 9
Monitor PM based on satellite images
Provide products at different spatial and temporal scales
MODIS AOT vs. PM Correlation at PhuTho, Hanoi, Hue, DaNang, 2010-2014
0
0.1
0.2
0.3
0.4
0.5
0.6
0.7
MOD04 MYD04
Co
rre
lati
on
Co
eff
icie
nt
Aerosol Factors
PM1 PM2.5 PM10
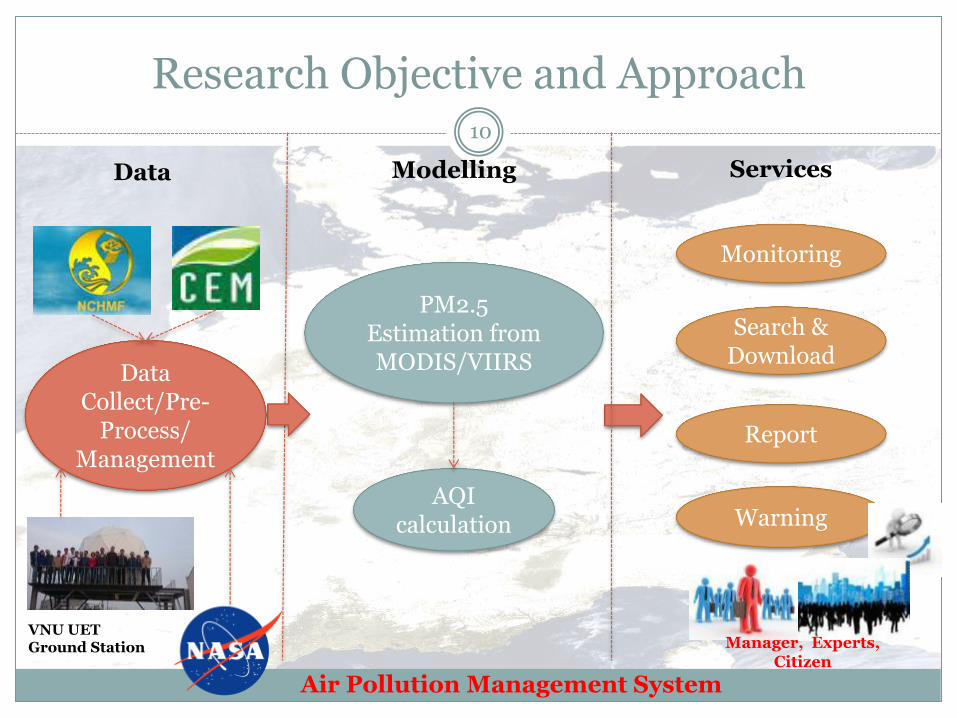
Research Objective and Approach 10
Data Collect/Pre-
Process/ Management
PM2.5 Estimation from MODIS/VIIRS
AQI calculation
Monitoring
Search & Download
Report
Warning
VNU UET Ground Station
Data Modelling Services
Air Pollution Management System
Manager, Experts, Citizen
Outline
Introduction
Objectives and Approaches
PM Concentration Mapping
Air Pollution Management System
Conclusion
11
M O D I S P M 2 . 5 1 0 X 1 0 K M *
N P P P M 2 . 5 6 X 6 K M
12
Vietnam
* Nguyen et al., “Particulate Matter Concentration Mapping from MODIS Satellite Data: A Vietnamese Case Study”, 2015, ERL, In Press.

Study Area 13
• Vietnam is nearly 332,210 𝑘𝑚2 and extends from (8oN, 102oE) to (23oN, 120oE) with the population of 90.5 million as of 2014.
• 7 climatology regions (NW, NE, RRD, NCC, SCC, CH and SE)
Spatial distribution of CEM and AERONET stations, NCHMF
meteorology stations
Temperature
Relative Humidity
Principitation

Datasets 14
Types Data Description Start End Purpose of use
Sat.
MOD04
Terra, Aerosol, 10x10
km 01/2009 09/2014
MODELING, INPUT FOR
EACH PM MAP
MYD04
Aqua, Aerosol, 10x10
km 01/2009 09/2014
MODELING, INPUT FOR
EACH PM MAP
MOD07
Terra, Meteorology,
5x5km 01/2009 09/2014
MODELING, INPUT FOR
EACH PM MAP
MYD07
Terra, Meteorology,
5x5km 01/2009 09/2014
MODELING, INPUT FOR
EACH PM MAP
Insitu
PM2.5
CEM – VEA
PT, HL - NW
HN – RRD
H – NCC,
DN, KH – SCC 12/2010 12/2014
MODELING (PT, HN, H,
DN)
Ind. VALIDATION (HL,
KH)
Temp, RH,
RF NCHMF, 98 stations 1/2004 2/2014 MODELING
AOT AERONET, 7 stations 3/2013 6/2013 VALIDATION

Methodology 15
Re-sampling Pre-processing Spatial/Temporal
Data Integration
Multiple Linear Regression
PM2.5 Estimation
(Regression)
PM2.5 Interpolation
(Universal Kriging)
Resampled
MOD04/MYD04
Re-sampled
images
Samples
Multiple Linear
Regression model
PM2.5
Grd. Met.
PM2.5 map
Validation
Grd. PM2.5
Sat. PM2.5 PM2.5 images over
Vietnam
Satellite Images
MOD04/MYD04
Ground PM2.5
Grd. Met. (Temp.)

Model Evaluation 16
MOD MYD
#Sample r2 RMSE (μg/m3) RE (%) #Sample r2 RMSE (μg/m3) RE (%)
274 0.602 8.527 33.348 385 0.577 8.777 53.353
𝑃𝑀2.5𝑡−𝑀𝑂𝐷 = f(𝐴𝑂𝑇𝑡−𝑀𝑂𝐷, 𝑇𝑒𝑚𝑝𝑚𝑟) 𝑃𝑀2.5𝑡−𝑀𝑌𝐷 = f(𝐴𝑂𝑇𝑡−𝑀𝑌𝐷, 𝑇𝑒𝑚𝑝𝑚𝑟)

Validation 17
Overall validation of satellite-derived PM2.5 maps over Phu Tho, Ha Noi, Hue and Da Nang in NE, RRD, NCC and
SCC regions, respectively. Results are separated by MOD and MYD datasets and accumulated in total.
1. Overall assessment (Boylan and Russell 2006) - Mean Fractional Bias (MFB ≤± 30% goal: ≤± 60% - criteria) - Mean Fractional Error (MFE ≤± 50% goal: ≤± 75% - criteria)
#Images #Samples r2 RMSE (μg/m3) RE (%) MFB (%) MFE (%)
MOD 85 189 0.427 21.709 39.957 0.491 34.954
MYD 43 96 0.337 17.188 39.458 3.639 34.799
Total 128 285 0.411 20.299 39.789 1.552 34.902
Boxplots shows the variation of satellite derived PM2.5 (_Sat) and ground based PM2.5 (_Grd) from
2010 – 2014 at Phu Tho, Ha Noi, Hue and Da Nang stations. The means values are shown as the
thick solid line in the plots.

Validation 18
Independent validation of satellite-derived PM2.5 and ground-based PM2.5 at Ha Long and Khanh Hoa stations.
2. Independent validation
Station #Samples r2 RMSE (μg/m3) RE (%) MFB (%) MFE (%)
Ha Long 40 0.455 21.512 45.236 -2.975 38.695
Khanh Hoa 45 0.444 8.551 46.446 25.988 33.960
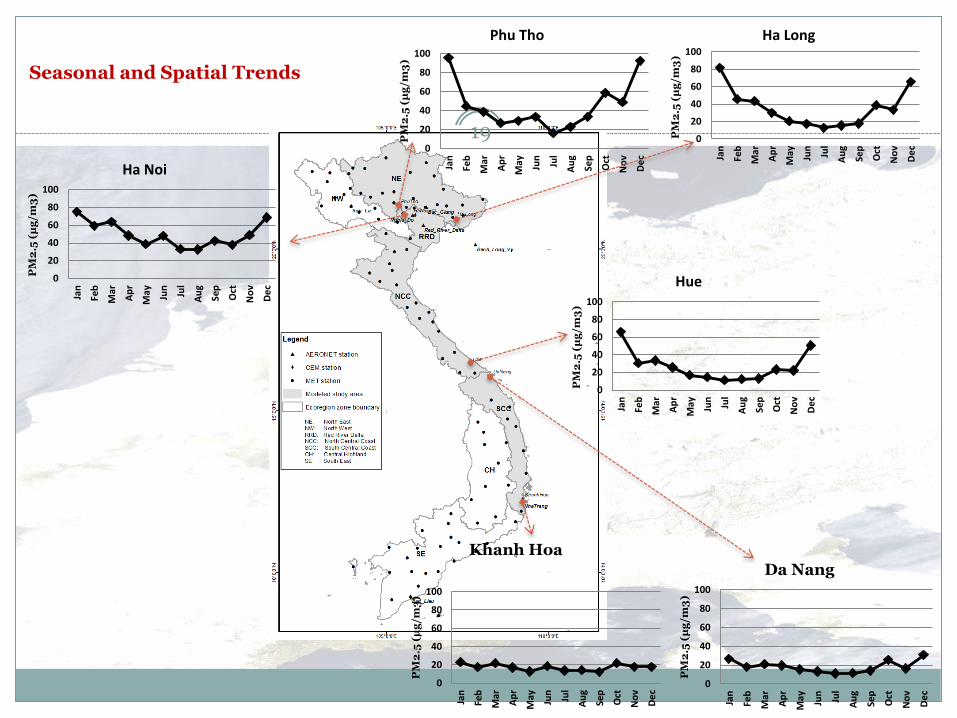
19 0
20
40
60
80
100
Jan
Feb
Mar
Ap
r
May Jun
Jul
Au
g
Sep
Oct
No
v
De
c
PM
2.5
(µ
g/m
3)
Phu Tho
0
20
40
60
80
100
Jan
Feb
Mar
Ap
r
May Jun
Jul
Au
g
Sep
Oct
No
v
De
c
PM
2.5
(µ
g/m
3)
Ha Long
0
20
40
60
80
100
Jan
Feb
Mar
Ap
r
May Jun
Jul
Au
g
Sep
Oct
No
v
De
c
PM
2.5
(µ
g/m
3)
Ha Noi
0
20
40
60
80
100
Jan
Feb
Mar
Ap
r
May Jun
Jul
Au
g
Sep
Oct
No
v
De
c
PM
2.5
(µ
g/m
3)
Hue
0
20
40
60
80
100
Jan
Feb
Mar
Ap
r
May Jun
Jul
Au
g
Sep
Oct
No
v
De
c
PM
2.5
(µ
g/m
3)
Da Nang
0
20
40
60
80
100
Jan
Feb
Mar
Ap
r
May Jun
Jul
Au
g
Sep
Oct
No
v
De
c
PM
2.5
(µ
g/m
3)
Khanh Hoa
Seasonal and Spatial Trends


Outline
Introduction
Objectives and Approaches
PM Concentration Mapping
Air Pollution Management System
Conclusion
21
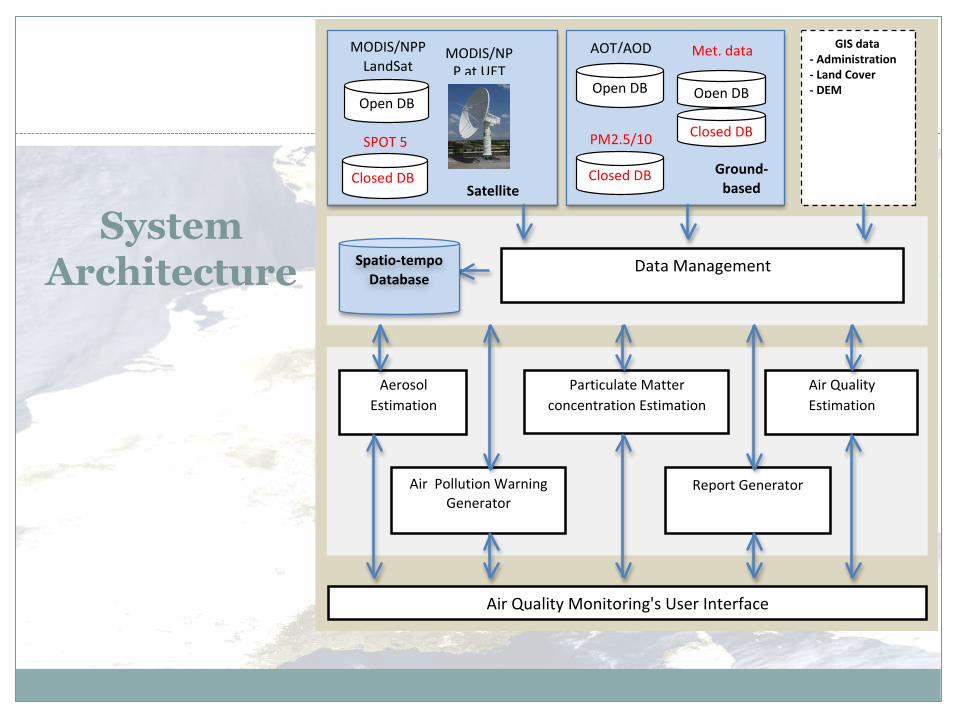
System Architecture
22
GISdata
-Administration-LandCover-DEM
DataManagement
Aerosol
Estimation
AirPollutionWarningGenerator
ReportGenerator
Ground-
basedData
ClosedDB
PM2.5/10
OpenDB
AOT/AOD
OpenDB
Met.data
ClosedDB
MODIS/NPP
LandSat
OpenDB
MODIS/NPPatUET
SPOT5
ClosedDBSatellite
Data
AirQualityMonitoring'sUserInterface
ParticulateMatter
concentrationEstimation
AirQuality
Estimation
Spatio-tempo
Database
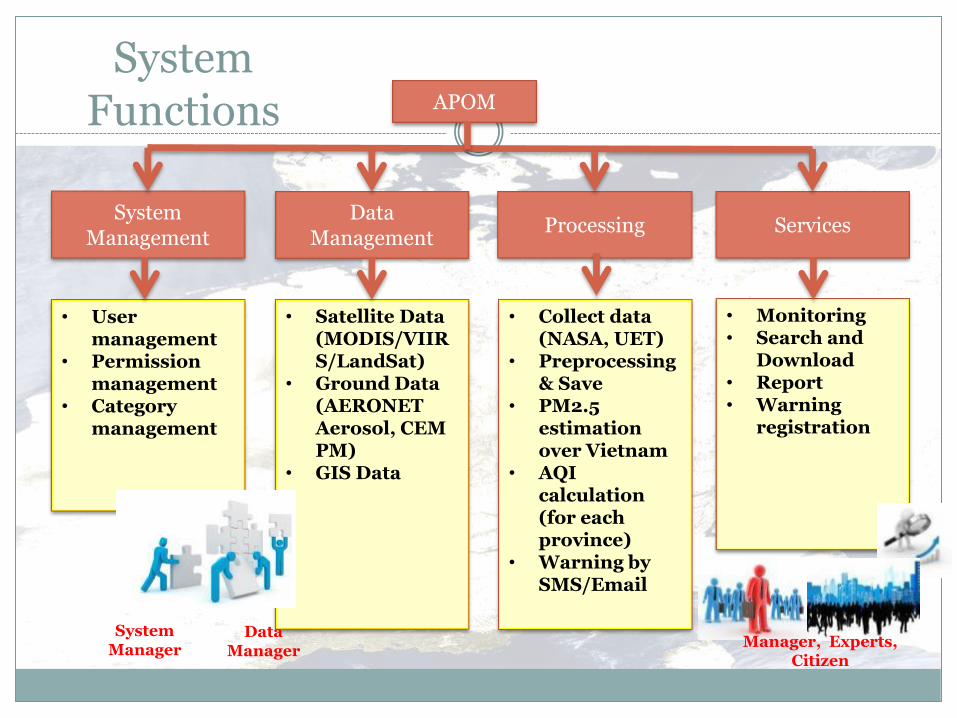
APOM
System Management
Data Management
Processing Services
• User management
• Permission management
• Category management
• Satellite Data (MODIS/VIIRS/LandSat)
• Ground Data (AERONET Aerosol, CEM PM)
• GIS Data
• Collect data (NASA, UET)
• Preprocessing & Save
• PM2.5 estimation over Vietnam
• AQI calculation (for each province)
• Warning by SMS/Email
• Monitoring • Search and
Download • Report • Warning
registration
System Functions
System Manager
Manager, Experts, Citizen
Data Manager
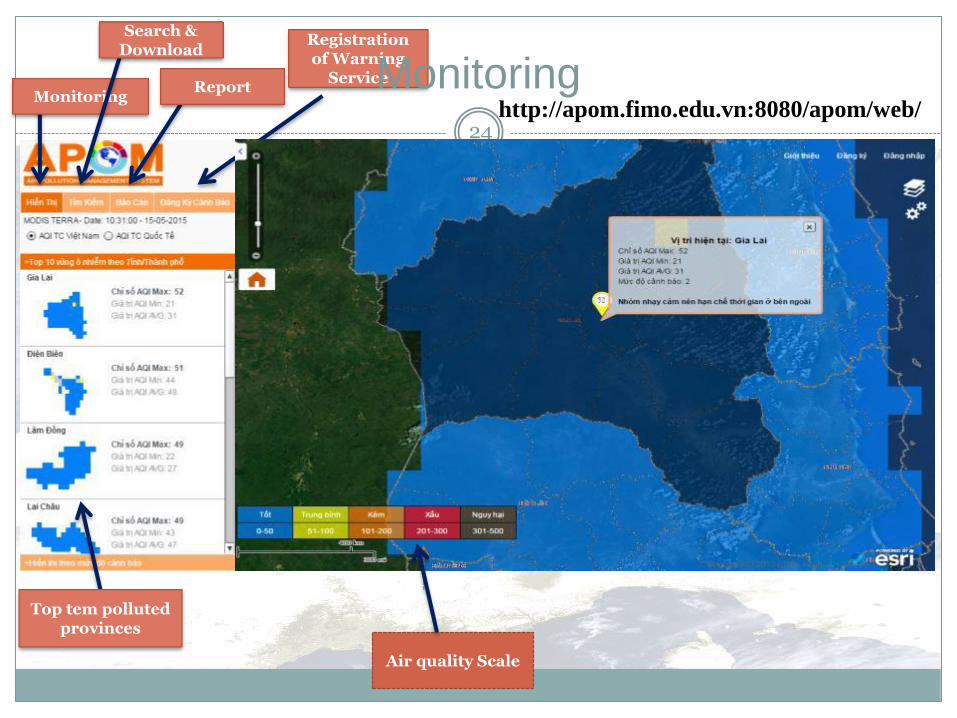
24
Monitoring
Search & Download
Report
Registration of Warning
Service
Top tem polluted provinces
Air quality Scale
http://apom.fimo.edu.vn:8080/apom/web/
Monitoring
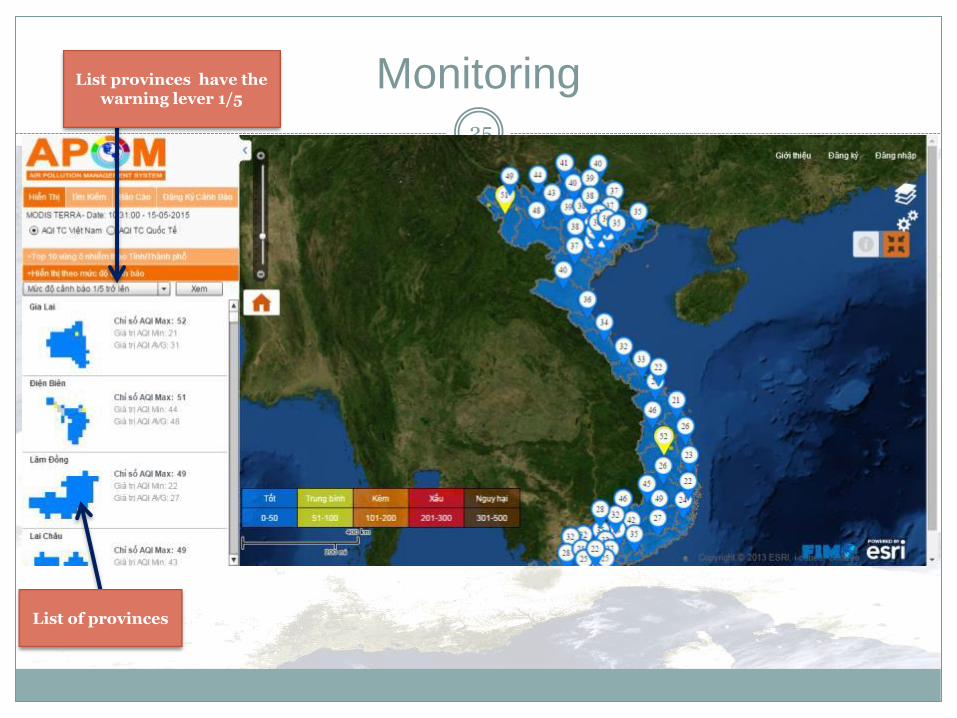
Monitoring 25
List of provinces
List provinces have the warning lever 1/5
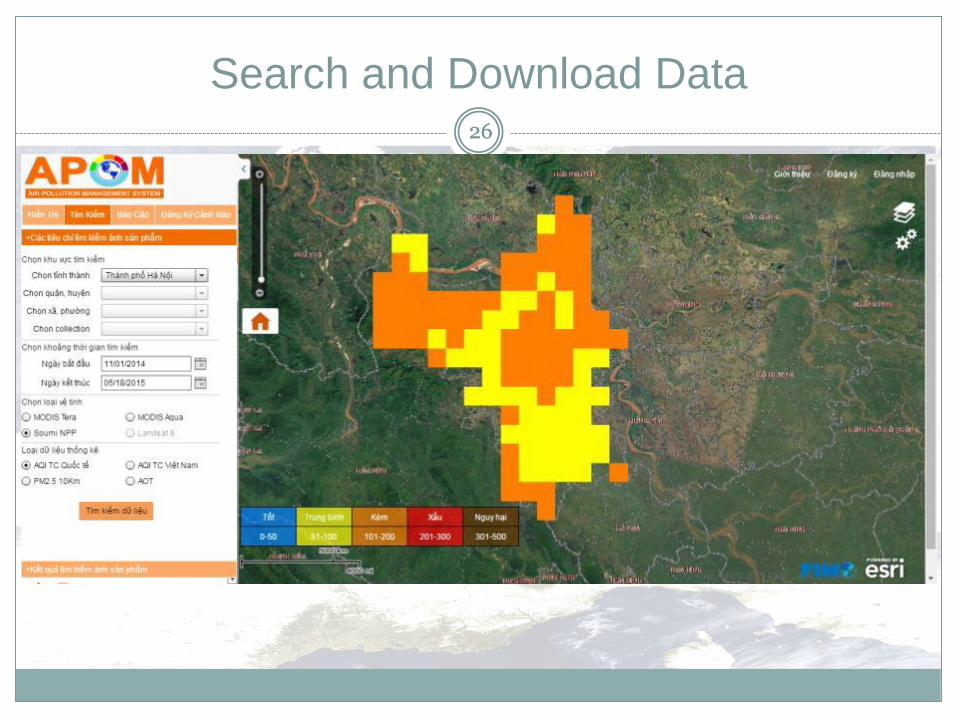
Search and Download Data 26
26
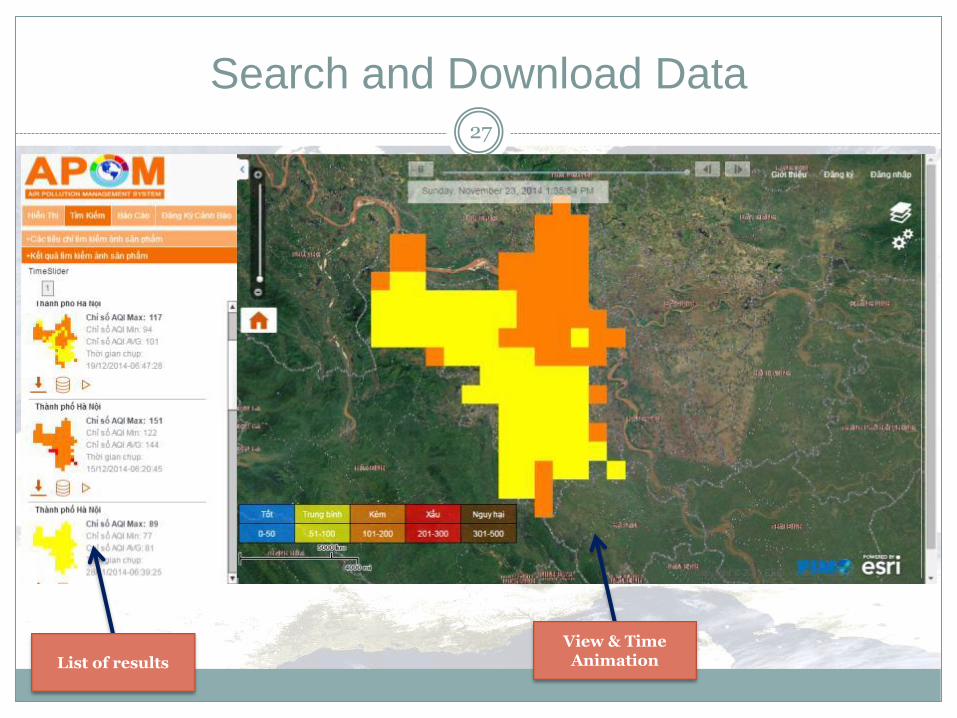
Search and Download Data 27
List of results
View & Time Animation
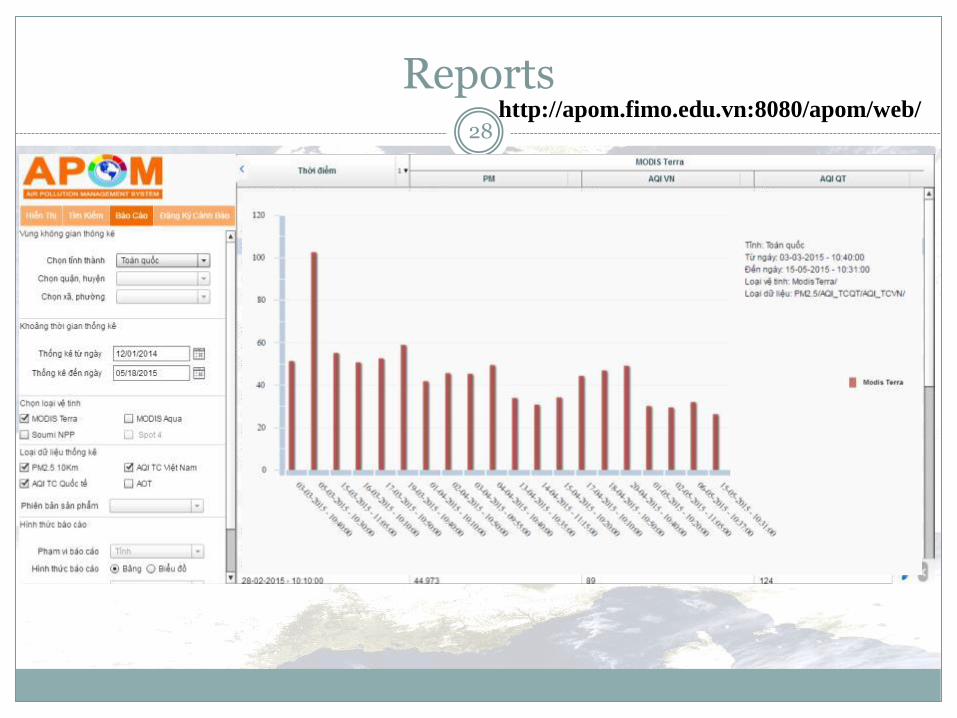
Reports 28
http://apom.fimo.edu.vn:8080/apom/web/

Outline
Introduction
Objectives and Approaches
PM Concentration Mapping
Air Pollution Management System
Conclusion
29
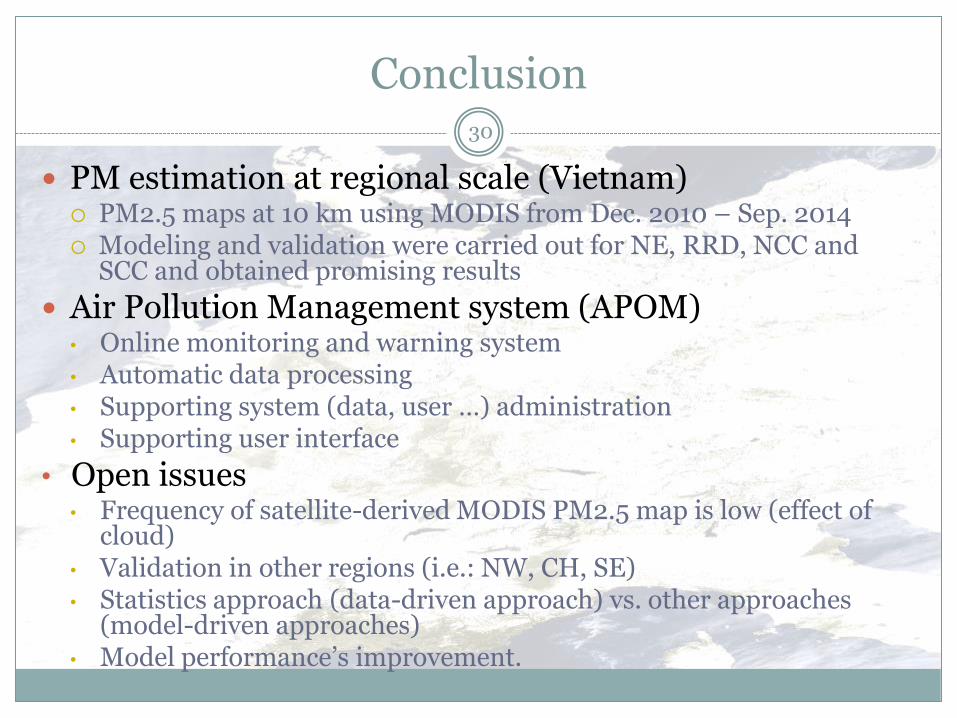
Conclusion 30
PM estimation at regional scale (Vietnam) PM2.5 maps at 10 km using MODIS from Dec. 2010 – Sep. 2014 Modeling and validation were carried out for NE, RRD, NCC and
SCC and obtained promising results
Air Pollution Management system (APOM) • Online monitoring and warning system • Automatic data processing • Supporting system (data, user …) administration • Supporting user interface
• Open issues • Frequency of satellite-derived MODIS PM2.5 map is low (effect of
cloud) • Validation in other regions (i.e.: NW, CH, SE) • Statistics approach (data-driven approach) vs. other approaches
(model-driven approaches) • Model performance’s improvement.

Acknowledgement 31
This research was possible due to the funds received from project “Air pollution monitoring and warning system”, QGTD.13.27 from Vietnam National University, Hanoi.

Q & A
T H A N K Y O U F O R Y O U R A T T E N T I O N
32