Embed Size (px)
Citation preview
Air Pollution and COVID-19: A Dangerous Combination
A Report from Physicians for Social ResponsibilityEdward Ketyer, MD
Lisa McKenzie, PhD, MPH
January 2021
PSR PHYSICIANSFOR SOCIAL RESPONSIBILITY
Editing: Barbara Gottlieb
Graphic Design: twocatsgraphics.com
Photos (pp. 3, 4, 8, 13) Courtesty of WildEarth Guardians
Executive Summary
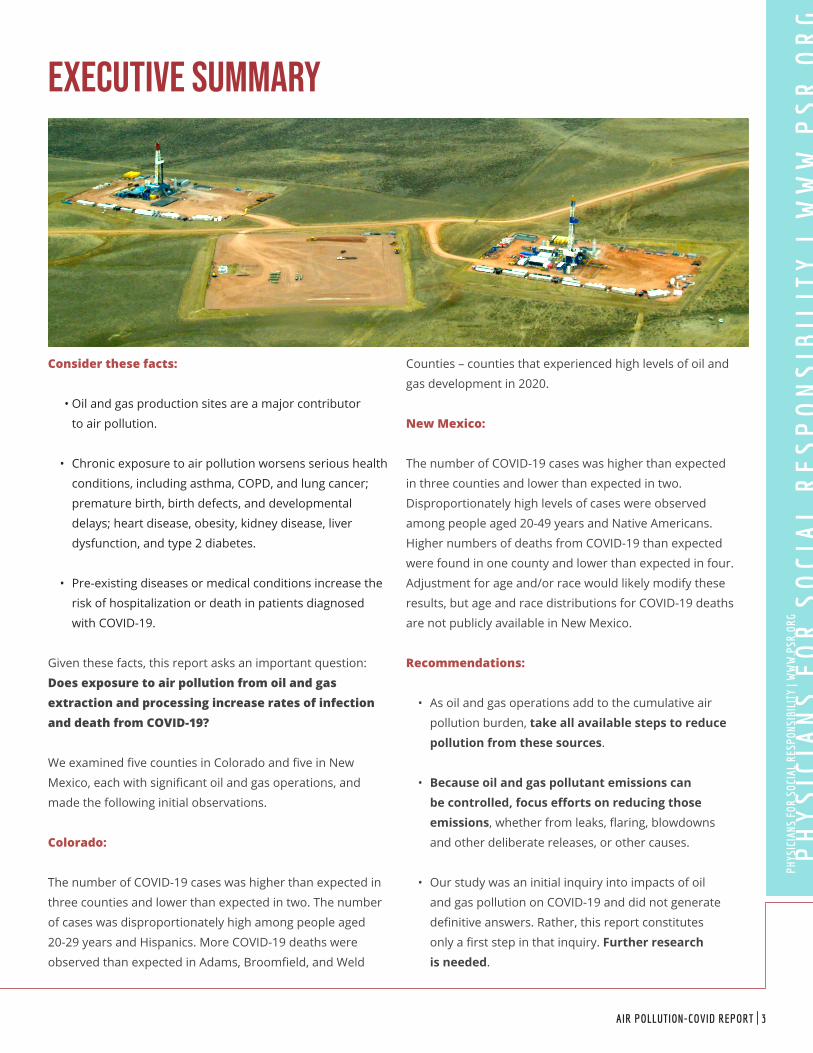
Consider these facts:
•• Oil and gas production sites are a major contributor
to air pollution.
• Chronic exposure to air pollution worsens serious health
conditions, including asthma, COPD, and lung cancer;
premature birth, birth defects, and developmental
delays; heart disease, obesity, kidney disease, liver
dysfunction, and type 2 diabetes.
• Pre-existing diseases or medical conditions increase the
risk of hospitalization or death in patients diagnosed
with COVID-19.
Given these facts, this report asks an important question:
Does exposure to air pollution from oil and gas extraction and processing increase rates of infection and death from COVID-19?
We examined five counties in Colorado and five in New
Mexico, each with significant oil and gas operations, and
made the following initial observations.
Colorado:
The number of COVID-19 cases was higher than expected in
three counties and lower than expected in two. The number
of cases was disproportionately high among people aged
20-29 years and Hispanics. More COVID-19 deaths were
observed than expected in Adams, Broomfield, and Weld
Counties – counties that experienced high levels of oil and
gas development in 2020.
New Mexico:
The number of COVID-19 cases was higher than expected
in three counties and lower than expected in two.
Disproportionately high levels of cases were observed
among people aged 20-49 years and Native Americans.
Higher numbers of deaths from COVID-19 than expected
were found in one county and lower than expected in four.
Adjustment for age and/or race would likely modify these
results, but age and race distributions for COVID-19 deaths
are not publicly available in New Mexico.
Recommendations:
• As oil and gas operations add to the cumulative air
pollution burden, take all available steps to reduce pollution from these sources.
• Because oil and gas pollutant emissions can be controlled, focus efforts on reducing those emissions, whether from leaks, flaring, blowdowns
and other deliberate releases, or other causes.
• Our study was an initial inquiry into impacts of oil
and gas pollution on COVID-19 and did not generate
definitive answers. Rather, this report constitutes
only a first step in that inquiry. Further research is needed.
PH
YS
ICIA
NS
FO
R S
OC
IAL
RE
SP
ON
SIB
ILIT
Y |
WW
W.P
SR
.OR
GPH
YSIC
IANS
FOR
SOC
IAL
RESP
ONSI
BILI
TY |
WW
W.P
SR.O
RG
AIR POLLUTION-COVID REPORT | 3
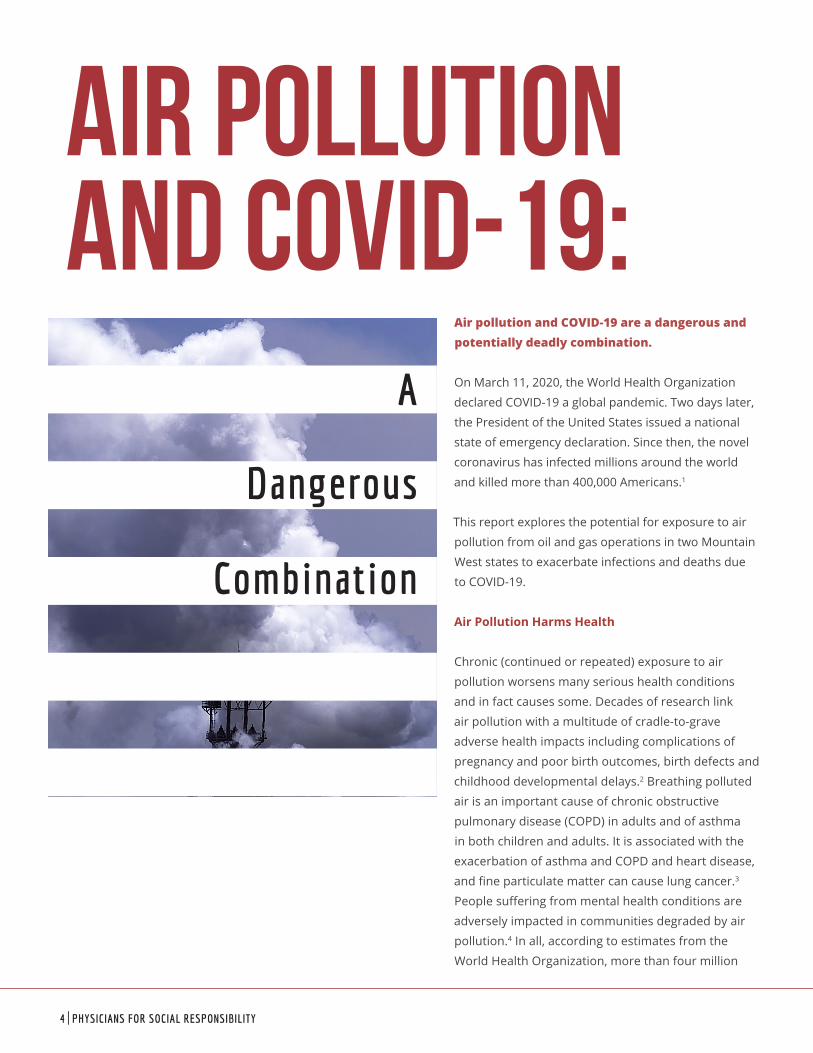
Air pollution and COVID-19 are a dangerous and potentially deadly combination.
On March 11, 2020, the World Health Organization
declared COVID-19 a global pandemic. Two days later,
the President of the United States issued a national
state of emergency declaration. Since then, the novel
coronavirus has infected millions around the world
and killed more than 400,000 Americans.1
This report explores the potential for exposure to air
pollution from oil and gas operations in two Mountain
West states to exacerbate infections and deaths due
to COVID-19.
Air Pollution Harms Health
Chronic (continued or repeated) exposure to air
pollution worsens many serious health conditions
and in fact causes some. Decades of research link
air pollution with a multitude of cradle-to-grave
adverse health impacts including complications of
pregnancy and poor birth outcomes, birth defects and
childhood developmental delays.2 Breathing polluted
air is an important cause of chronic obstructive
pulmonary disease (COPD) in adults and of asthma
in both children and adults. It is associated with the
exacerbation of asthma and COPD and heart disease,
and fine particulate matter can cause lung cancer.3
People suffering from mental health conditions are
adversely impacted in communities degraded by air
pollution.4 In all, according to estimates from the
World Health Organization, more than four million
4 | PHYSICIANS FOR SOCIAL RESPONSIBILITY
Air Pollution and COVID-19:
A
Dangerous
Combination

people worldwide die prematurely as a result of exposure to
ambient (outdoor) air pollution.5
Air pollutants harm the body via several mechanisms. Fine
particulate matter and other air toxics are known to injure the
hair-like cilia that line the respiratory tract and act as first-line
defenders to remove harmful microorganisms. Inflammation
and cellular damage from pollution hamper the immune
system charged with protecting the body from invading
organisms like coronavirus. When these natural defenses are
impaired, infections from respiratory viruses like coronavirus
are more likely to occur. Likewise, severe complications and
higher death rates from respiratory infections are expected.6
Long-term exposure to air
pollution is also associated
with the development of
obesity and its related health
complications of hypertension,
kidney disease, liver dysfunction,
and type 2 diabetes. These
so-called “comorbidities,” or
simultaneously existing diseases
or medical conditions, are
known to increase the risk of
poor outcomes in patients
diagnosed with COVID-19.7
Air Pollution Exacerbates COVID-19
Coronavirus is a respiratory
virus that initially gains access
into cells lining the airway.
The virus replicates inside the
cell before injuring or killing
it, and then moves on to other cells, causing more damage.
Symptomatic individuals with COVID-19 typically complain
of respiratory symptoms: nasal congestion, cough, and
shortness of breath. In addition, fever or chills, headache,
fatigue and muscle aches are commonly reported.8
Neurological symptoms, including loss of smell and taste, and
problems with cognition (“COVID-19 Fog”), are not unusual.9
Severe damage to the respiratory tract in patients with
COVID-19, in combination with lungs already damaged from
breathing polluted air, creates an increased risk factor for
poor health outcomes. Early in the pandemic, researchers
studying the regional impact of COVID-19 in Northern Italy’s
Po Valley noted that “the highest number of COVID-19 cases
were recorded in the most polluted regions with patients
presenting with more severe forms of the disease requiring
ICU admission.” Mortality was two times higher compared to
other regions in Italy.10 In China, a study examined short-
term exposure to air pollution and found “a significant
relationship between air pollution and COVID-19 infection,”
with positive associations seen with large and small particle
pollution (PM10 and PM2.5), nitrogen dioxide, and ground-
level ozone.11
In the United States, recent
research from the Harvard T.H.
Chan School of Public Health
indicates that exposure to
even small increases in long-
term fine particle pollution
(PM 2.5) is associated with an
increase in the death rate from
COVID-19. The researchers
underscored the importance of
enforcing existing regulations
that limit air pollution in order
to protect public health during
(and after) the pandemic.12
Another study from the Georgia
State University Andrew Young
School of Policy Studies also
found a relationship between
PM 2.5 exposure and disease
and death from COVID-19.13
Chronic exposure to air
pollution and high rates of COVID-19 disproportionally affect
Black people, Native Americans, and Latinx people.14 In
large measure this reflects discriminatory housing patterns:
Poor people and minorities are more likely to live in heavily
polluted communities. People living near fixed sources of air
pollution (factories and power plants) and mobile sources
(highways, shipping lanes, airports) experience greater
health impacts from pollution. We now know that this same
population is experiencing higher numbers of COVID-19
infections, clinical complications, and deaths.15 These
In the United States, new research
from the Harvard T.H. Chan School of
Public Health indicates that exposure
to even small increases in long-term
fine particle pollution (PM 2.5) is
associated with an increase in the
death rate from COVID-19.
PH
YS
ICIA
NS
FO
R S
OC
IAL
RE
SP
ON
SIB
ILIT
Y |
WW
W.P
SR
.OR
GPH
YSIC
IANS
FOR
SOC
IAL
RESP
ONSI
BILI
TY |
WW
W.P
SR.O
RG
AIR POLLUTION-COVID REPORT | 5
facts should concern all Americans, not just those living in
environmental justice communities bearing the burden of
industrial and fossil fuel pollution in their neighborhoods.
These preliminary findings shouldn’t be surprising. As the
COVID-19 public health crisis continues to unfold across the
United States and around the world, the association of air
pollution and poor clinical outcomes from novel coronavirus
infections is becoming increasingly apparent.
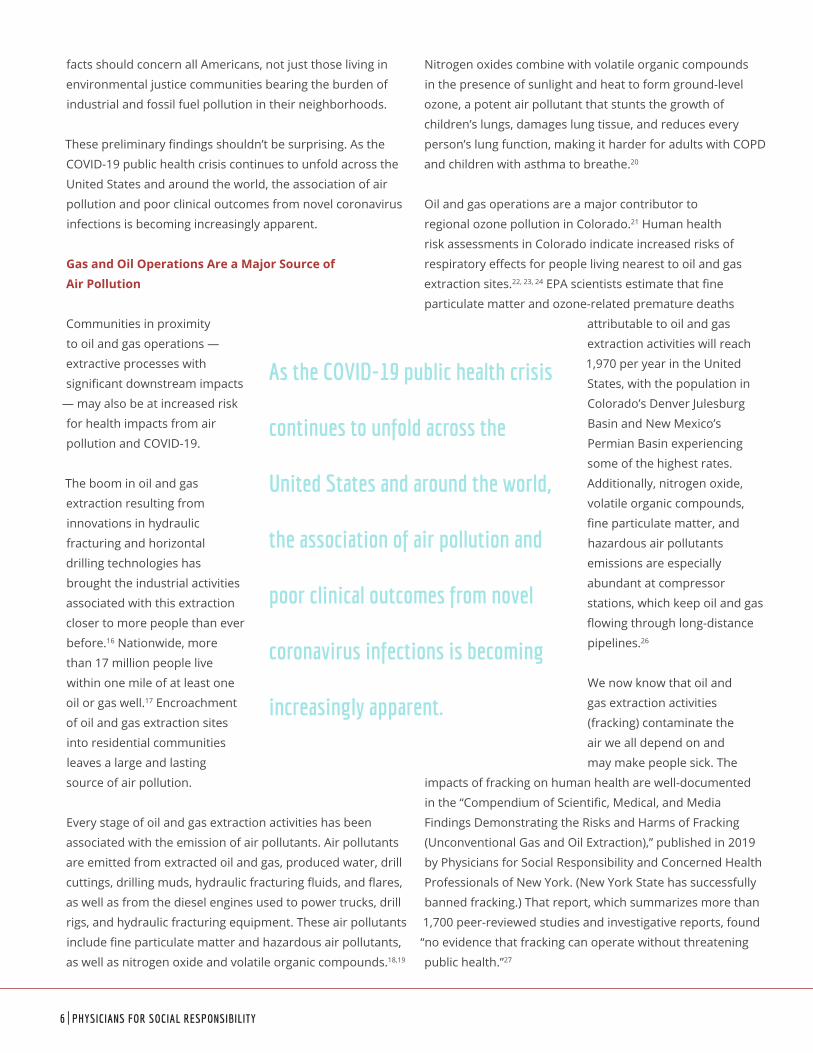
Gas and Oil Operations Are a Major Source of Air Pollution
Communities in proximity
to oil and gas operations —
extractive processes with
significant downstream impacts
— may also be at increased risk
for health impacts from air
pollution and COVID-19.
The boom in oil and gas
extraction resulting from
innovations in hydraulic
fracturing and horizontal
drilling technologies has
brought the industrial activities
associated with this extraction
closer to more people than ever
before.16 Nationwide, more
than 17 million people live
within one mile of at least one
oil or gas well.17 Encroachment
of oil and gas extraction sites
into residential communities
leaves a large and lasting
source of air pollution.
Every stage of oil and gas extraction activities has been
associated with the emission of air pollutants. Air pollutants
are emitted from extracted oil and gas, produced water, drill
cuttings, drilling muds, hydraulic fracturing fluids, and flares,
as well as from the diesel engines used to power trucks, drill
rigs, and hydraulic fracturing equipment. These air pollutants
include fine particulate matter and hazardous air pollutants,
as well as nitrogen oxide and volatile organic compounds.18,19
Nitrogen oxides combine with volatile organic compounds
in the presence of sunlight and heat to form ground-level
ozone, a potent air pollutant that stunts the growth of
children’s lungs, damages lung tissue, and reduces every
person’s lung function, making it harder for adults with COPD
and children with asthma to breathe.20
Oil and gas operations are a major contributor to
regional ozone pollution in Colorado.21 Human health
risk assessments in Colorado indicate increased risks of
respiratory effects for people living nearest to oil and gas
extraction sites.22, 23, 24 EPA scientists estimate that fine
particulate matter and ozone-related premature deaths
attributable to oil and gas
extraction activities will reach
1,970 per year in the United
States, with the population in
Colorado’s Denver Julesburg
Basin and New Mexico’s
Permian Basin experiencing
some of the highest rates.
Additionally, nitrogen oxide,
volatile organic compounds,
fine particulate matter, and
hazardous air pollutants
emissions are especially
abundant at compressor
stations, which keep oil and gas
flowing through long-distance
pipelines.26
We now know that oil and
gas extraction activities
(fracking) contaminate the
air we all depend on and
may make people sick. The
impacts of fracking on human health are well-documented
in the “Compendium of Scientific, Medical, and Media
Findings Demonstrating the Risks and Harms of Fracking
(Unconventional Gas and Oil Extraction),” published in 2019
by Physicians for Social Responsibility and Concerned Health
Professionals of New York. (New York State has successfully
banned fracking.) That report, which summarizes more than
1,700 peer-reviewed studies and investigative reports, found
“no evidence that fracking can operate without threatening
public health.”27
As the COVID-19 public health crisis
continues to unfold across the
United States and around the world,
the association of air pollution and
poor clinical outcomes from novel
coronavirus infections is becoming
increasingly apparent.
6 | PHYSICIANS FOR SOCIAL RESPONSIBILITY
Air Pollution and Coronavirus: A Dangerous Combination
It is clear that all around the United States, Americans suffer
chronic disease and early death from breathing air pollution.
Equally clear is that those living in proximity and inhaling the
chemical pollution produced at every point of oil and gas
operations are also at higher risk of experiencing adverse
health impacts. The impairment of respiratory tract defenses
and reduced lung function arising from long-term exposure
to air pollution increase the risk of contracting coronavirus
and developing complications from it, especially in people
suffering from chronic medical conditions.
This report examines the possibility
that the invisible particles and
vapors coming from oil and gas
production sites, by increasing the
pollution burden on the respiratory
system of local residents, increases
their vulnerability to the novel
coronavirus. If this is the case,
they are a dangerous and deadly
combination.
Methodology
Our goal in reviewing the currently available evidence on
COVID-19 is to determine if Colorado and New Mexico
populations living in areas with active oil and gas production
sites may be at a higher risk for COVID-19 transmission,
morbidity (disease) and mortality (death). One element of
our review was to determine if Colorado and New Mexico
counties with active oil and gas production sites were
experiencing more COVID-19 cases and deaths than would
be expected, based on state-level rates. The results of this
initial ecological analysis could then generate hypotheses for
future studies.
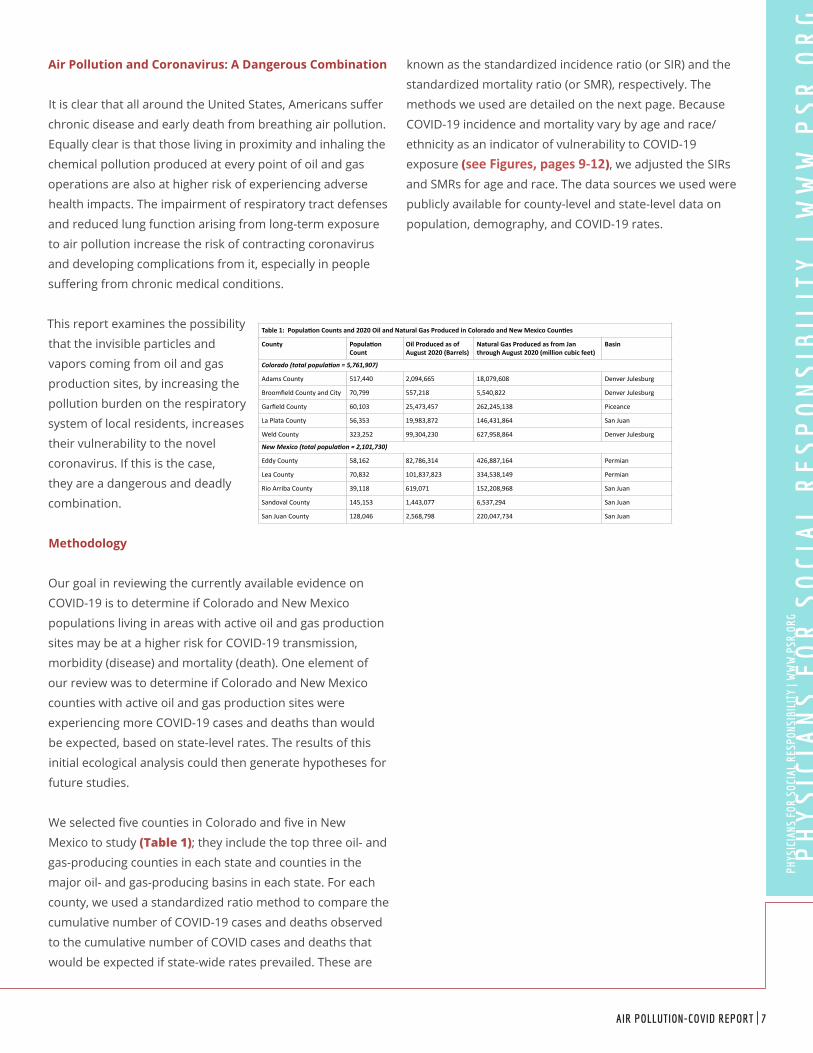
We selected five counties in Colorado and five in New
Mexico to study (Table 1); they include the top three oil- and
gas-producing counties in each state and counties in the
major oil- and gas-producing basins in each state. For each
county, we used a standardized ratio method to compare the
cumulative number of COVID-19 cases and deaths observed
to the cumulative number of COVID cases and deaths that
would be expected if state-wide rates prevailed. These are
known as the standardized incidence ratio (or SIR) and the
standardized mortality ratio (or SMR), respectively. The
methods we used are detailed on the next page. Because
COVID-19 incidence and mortality vary by age and race/
ethnicity as an indicator of vulnerability to COVID-19
exposure (see Figures, pages 9-12), we adjusted the SIRs
and SMRs for age and race. The data sources we used were
publicly available for county-level and state-level data on
population, demography, and COVID-19 rates.
Table1:Popula-onCountsand2020OilandNaturalGasProducedinColoradoandNewMexicoCoun-es
County Popula-onCount
OilProducedasofAugust2020(Barrels)
NaturalGasProducedasfromJanthroughAugust2020(millioncubicfeet)
Basin
Colorado (total popula,on = 5,761,907)
AdamsCounty 517,440 2,094,665 18,079,608 DenverJulesburg
BroomfieldCountyandCity 70,799 557,218 5,540,822 DenverJulesburg
GarfieldCounty 60,103 25,473,457 262,245,138 Piceance
LaPlataCounty 56,353 19,983,872 146,431,864 SanJuan
WeldCounty 323,252 99,304,230 627,958,864 DenverJulesburg
New Mexico (total popula,on = 2,101,730)
EddyCounty 58,162 82,786,314 426,887,164 Permian
LeaCounty 70,832 101,837,823 334,538,149 Permian
RioArribaCounty 39,118 619,071 152,208,968 SanJuan
SandovalCounty 145,153 1,443,077 6,537,294 SanJuan
SanJuanCounty 128,046 2,568,798 220,047,734 SanJuan
PH
YS
ICIA
NS
FO
R S
OC
IAL
RE
SP
ON
SIB
ILIT
Y |
WW
W.P
SR
.OR
GPH
YSIC
IANS
FOR
SOC
IAL
RESP
ONSI
BILI
TY |
WW
W.P
SR.O
RG
AIR POLLUTION-COVID REPORT | 7
Description of MethodologyWe obtained data on observed cumulative COVID-19 cases and deaths in the selected counties, as well as in Colorado and New Mexico statewide, as of October 12, 2020 from USAFacts (https://usafacts.org/visualizations/coronavirus-covid-19-spread-map/). Using 2019 Colorado state and county population estimates from the Colorado Health Information Dataset (https://cohealthviz.dphe.state.co.us/t/HealthInformaticsPublic/views/CoHIDLandingPage/LandingPage?iframeSizedToWindow=true&:embed=y&:showAppBanner=false&:display_count=no&:showVizHome=no) and 2018 New Mexico state and county population estimates from New Mexico’s Indicator-Based Information System (https://ibis.health.state.nm.us/), we then calculated the expected number of COVID cases and deaths in each county using these equations:
Expected Cases in County = (County population x Observed
Number of COVID cases in state) divided by State population
Expected Deaths in County = (County population x Observed
Number of COVID-19 deaths in state) divided by State
population
Next, we calculated standardized incidence ratios (SIR) and
standardized mortality ratios (SMR) by dividing the observed
number of cases and deaths in each county, respectively, by
the expected number of cases and deaths.
SIR = observed number of COVID-19 cases divided by
expected number of COVID-19 cases.
SMR = observed number of COVID-19 death divided by
expected number of COVID-19 deaths.
If the SIR or SMR is greater than one, that indicates that more
COVID-19 cases or deaths, respectively, were observed in the
county than would be expected based on state-wide rates.
If the SIR or SMR is less than one, fewer COVID-19 cases or
deaths, respectively, were observed in the county than would
be expected based on state-wide rates.
We separately adjusted the SIRs and SMRs for age and race
using the age and race distribution of COVID-19 reported
by each state (https://covid19.colorado.gov/data, https://
cvprovider.nmhealth.org/public-dashboard.html). These
distributions were not publicly available for COVID-19 deaths
in New Mexico. We calculated 95% confidence intervals
(CI) for the SCR and SMR. Death counts of less than 10 are
suppressed in figures and tables.
8 | PHYSICIANS FOR SOCIAL RESPONSIBILITY

Colorado Results
Cases of COVID-19: In the five Colorado counties with
active oil and gas production sites, the number of observed
cumulative cases was higher than expected in three of the
counties and lower than expected
in two (Figure 1). People aged
20-29 years and Hispanics in
Colorado were experiencing a
disproportionately greater incidence
of COVID-19. Because Colorado
county populations differ in age
and ethnicity distribution (Figures 2 and 3), we adjusted the results
to account for the proportion
of COVID-19 vulnerable groups.
Although impacts were minor,
adjusting these results for race impacted the estimated
number of expected cases more than adjusting for age.
As shown in Table 2, race-adjusted SIRs in Adams, Garfield,
and Weld counties exceeded one,
indicating higher-than-expected
numbers of cumulative COVID-19
cases; those are 1.35 (95% CI 1.33,
1.38), 1.25 (95% CI 1.18, 1.33), and
1.13 (95%CI 1.09, 1.16). In LaPlata
and Broomfield counties, race-
adjusted SIRs are 0.45 (95% CI
0.40, 0.50) and 0.92 (0.85, 0.98).
These rates, which fell at less than
one, indicate that the observed
number of cumulative COVID cases
in these two counties was below
the expected numbers based on
statewide rates. >>
Figure2
Figure3
CI=confidenceinterval,SIR=StandardizedIncidenceRa5o
1ComparedtoColoradopopula5on
Table2:StandardizedCOVID-19IncidenceRa:osforColoradoCoun:eswithAc:veOilandGasProduc:on1
County SIR(95%CI) SIR(95%CI)AdjustedforAge
SIR(95%CI)AdjustedforRace
Adams 1.52(1.49,1.56) 1.54(1.51,1.56) 1.35(1.33,1.38)
Broomfield 0.77(0.71,0.82) 0.76(0.71,0.82) 0.92(0.85,0.98)
Garfield 1.23(1.16,1.31) 1.26(1.18,1.34) 1.25(1.18,1.33)
LaPlata 0.39(0.35,0.43) 0.40(0.35,0.44) 0.45(0.40,0.50)
Weld 1.17(1.13,1.19) 1.42(1.38,1.45) 1.13(1.09,1.16)
Figure1
PH
YS
ICIA
NS
FO
R S
OC
IAL
RE
SP
ON
SIB
ILIT
Y |
WW
W.P
SR
.OR
GPH
YSIC
IANS
FOR
SOC
IAL
RESP
ONSI
BILI
TY |
WW
W.P
SR.O
RG
AIR POLLUTION-COVID REPORT | 9

Colorado Results [continued]
CI=ConfidenceIntervalSMR=StandardizedMortalityRa6o
1ComparedtoColoradopopula6on
Table3:StandardizedCOVID-19MortalityRa<osforColoradoCoun<eswithAc<veOilandGasProduc<on1
County SMR(95%CI) SMR(95%CI)AdjustedforAge
SMR(95%CI)AdjustedforRace
Weld 1.29(1.09,1.49) 1.48(1.25,1.72) 1.30(1.09,1.50)
Garfield 0.23(0.03,0.43) 0.26(0.03,0.48) 0.23(0.03,0.43)
Broomfield 1.42(0.97,1.88) 1.31(0.89,1.74) 1.47(1.00,1.95)
LaPlata 0.10(0,0.23) 0.09(0,0.21) 0.10(0,0.24)
Adams 1.27(1.11,1.43) 1.69(1.48,1.91) 1.25(1.09,1.41)
< <
Figure4
Deaths from COVID-19: Interestingly, the number of
observed cumulative deaths was higher than expected in
the three Colorado counties – Adams, Broomfield, and Weld
– located in the Denver Julesburg basin, in the northeastern
quadrant of the state, and lower than
expected in the counties in the Piceance
and San Juan Basins (Figure 4). In
Colorado, people 70 years and older
were experiencing a disproportionately
greater COVID-19 mortality rate.
Adjustment for age impacted the
estimated number of expected deaths
more than adjustment for race. As
shown in Table 3, age-adjusted SMRs
for Adams, Broomfield, and Weld counties exceeded one,
indicating that the cumulative number of deaths from
COVID-19 was higher than expected. Those SMRs are 1.69
(95%CI 1.48, 1.91), 1.31 (0.89, 1.74), and
1.48 (95% CI 1.25, 1.72). In LaPlata and
Garfield counties, age-adjusted SMRs
are 0.09 (0,0.21) and 0.26 (0.03, 0.48);
those rates, which are less than one,
indicate that there were fewer deaths
from COVID-19 than expected.
10 | PHYSICIANS FOR SOCIAL RESPONSIBILITY
New Mexico Results
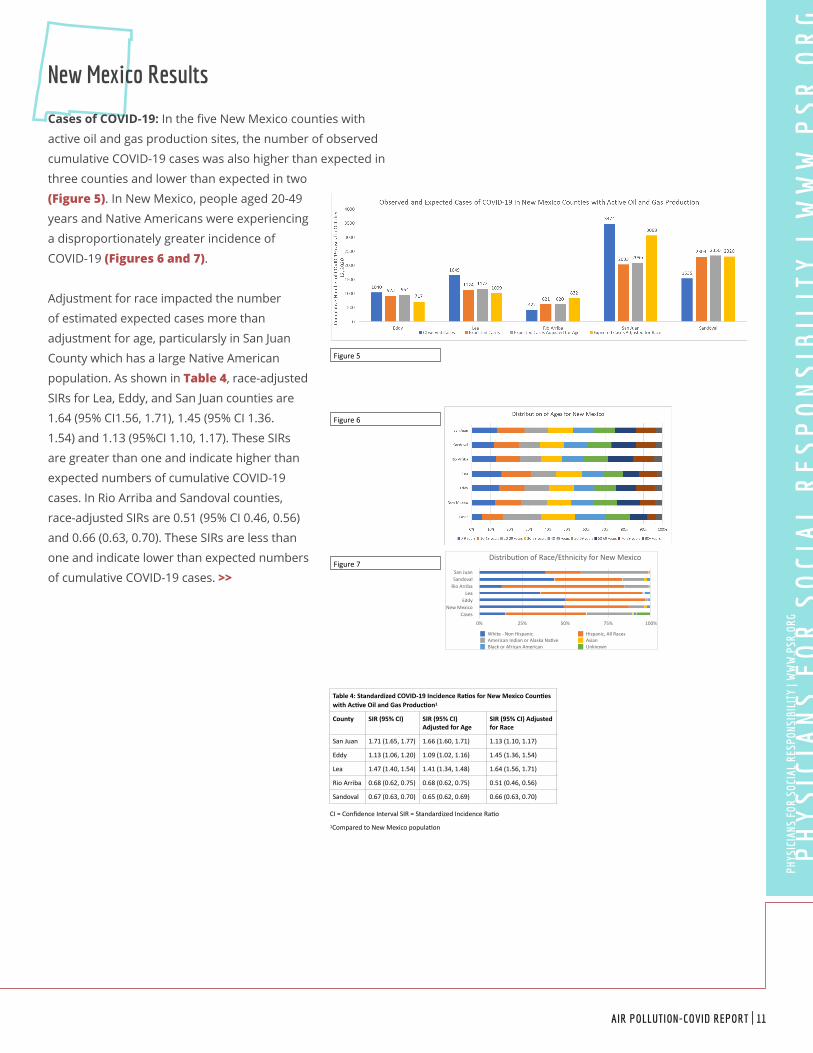
Cases of COVID-19: In the five New Mexico counties with
active oil and gas production sites, the number of observed
cumulative COVID-19 cases was also higher than expected in
three counties and lower than expected in two
(Figure 5). In New Mexico, people aged 20-49
years and Native Americans were experiencing
a disproportionately greater incidence of
COVID-19 (Figures 6 and 7).
Adjustment for race impacted the number
of estimated expected cases more than
adjustment for age, particularsly in San Juan
County which has a large Native American
population. As shown in Table 4, race-adjusted
SIRs for Lea, Eddy, and San Juan counties are
1.64 (95% CI1.56, 1.71), 1.45 (95% CI 1.36.
1.54) and 1.13 (95%CI 1.10, 1.17). These SIRs
are greater than one and indicate higher than
expected numbers of cumulative COVID-19
cases. In Rio Arriba and Sandoval counties,
race-adjusted SIRs are 0.51 (95% CI 0.46, 0.56)
and 0.66 (0.63, 0.70). These SIRs are less than
one and indicate lower than expected numbers
of cumulative COVID-19 cases. >>
CI=ConfidenceIntervalSIR=StandardizedIncidenceRa4o
1ComparedtoNewMexicopopula4on
Table4:StandardizedCOVID-19IncidenceRa:osforNewMexicoCoun:eswithAc:veOilandGasProduc:on1
County SIR(95%CI) SIR(95%CI)AdjustedforAge
SIR(95%CI)AdjustedforRace
SanJuan 1.71(1.65,1.77) 1.66(1.60,1.71) 1.13(1.10,1.17)
Eddy 1.13(1.06,1.20) 1.09(1.02,1.16) 1.45(1.36,1.54)
Lea 1.47(1.40,1.54) 1.41(1.34,1.48) 1.64(1.56,1.71)
RioArriba 0.68(0.62,0.75) 0.68(0.62,0.75) 0.51(0.46,0.56)
Sandoval 0.67(0.63,0.70) 0.65(0.62,0.69) 0.66(0.63,0.70)
Figure5
Distribu)onofRace/EthnicityforNewMexico
SanJuanSandovalRioArriba
LeaEddy
NewMexicoCases
0% 25% 50% 75% 100%
White-NonHispanic Hispanic,AllRacesAmericanIndianorAlaskaNa)ve AsianBlackorAfricanAmerican Unknown
Figure6
Figure7
CI=ConfidenceIntervalSIR=StandardizedIncidenceRa4o
1ComparedtoNewMexicopopula4on
Table4:StandardizedCOVID-19IncidenceRa:osforNewMexicoCoun:eswithAc:veOilandGasProduc:on1
County SIR(95%CI) SIR(95%CI)AdjustedforAge
SIR(95%CI)AdjustedforRace
SanJuan 1.71(1.65,1.77) 1.66(1.60,1.71) 1.13(1.10,1.17)
Eddy 1.13(1.06,1.20) 1.09(1.02,1.16) 1.45(1.36,1.54)
Lea 1.47(1.40,1.54) 1.41(1.34,1.48) 1.64(1.56,1.71)
RioArriba 0.68(0.62,0.75) 0.68(0.62,0.75) 0.51(0.46,0.56)
Sandoval 0.67(0.63,0.70) 0.65(0.62,0.69) 0.66(0.63,0.70)
Figure5
PH
YS
ICIA
NS
FO
R S
OC
IAL
RE
SP
ON
SIB
ILIT
Y |
WW
W.P
SR
.OR
GPH
YSIC
IANS
FOR
SOC
IAL
RESP
ONSI
BILI
TY |
WW
W.P
SR.O
RG
AIR POLLUTION-COVID REPORT | 11
New Mexico Results [continued]
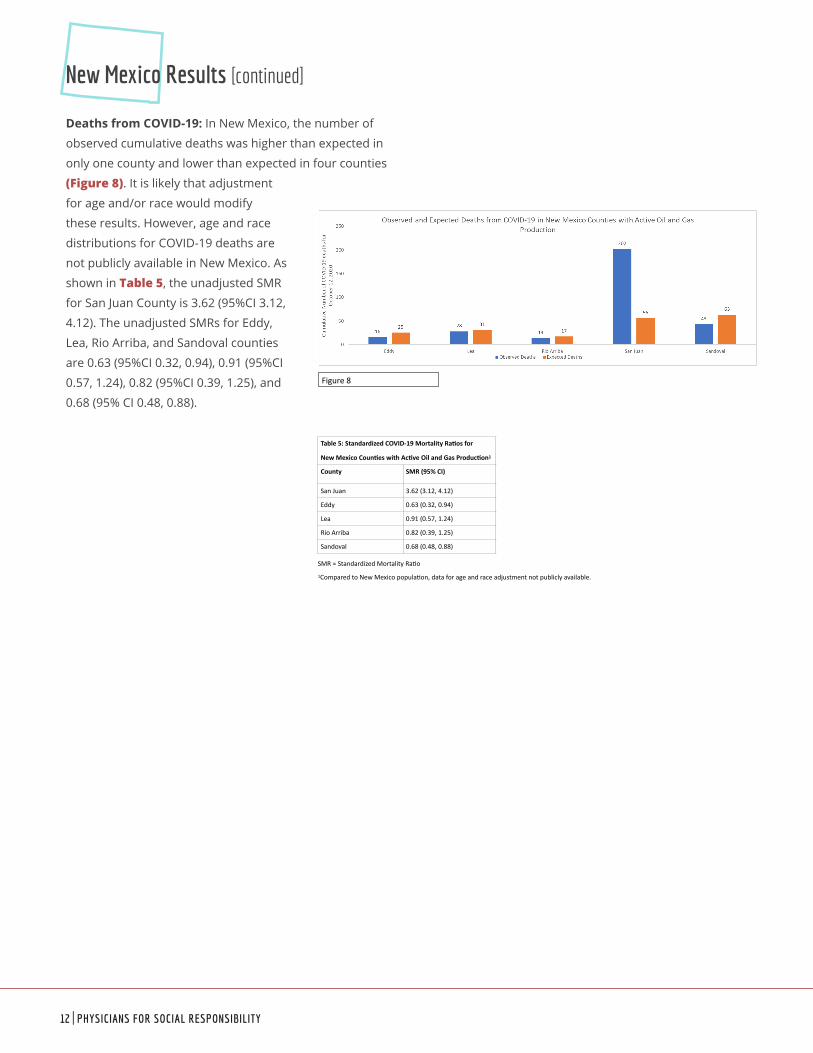
Deaths from COVID-19: In New Mexico, the number of
observed cumulative deaths was higher than expected in
only one county and lower than expected in four counties
(Figure 8). It is likely that adjustment
for age and/or race would modify
these results. However, age and race
distributions for COVID-19 deaths are
not publicly available in New Mexico. As
shown in Table 5, the unadjusted SMR
for San Juan County is 3.62 (95%CI 3.12,
4.12). The unadjusted SMRs for Eddy,
Lea, Rio Arriba, and Sandoval counties
are 0.63 (95%CI 0.32, 0.94), 0.91 (95%CI
0.57, 1.24), 0.82 (95%CI 0.39, 1.25), and
0.68 (95% CI 0.48, 0.88).
Figure8
SMR=StandardizedMortalityRa1o
1ComparedtoNewMexicopopula1on,dataforageandraceadjustmentnotpubliclyavailable.
Table5:StandardizedCOVID-19MortalityRa<osfor
NewMexicoCoun<eswithAc<veOilandGasProduc<on1
County SMR(95%CI)
SanJuan 3.62(3.12,4.12)
Eddy 0.63(0.32,0.94)
Lea 0.91(0.57,1.24)
RioArriba 0.82(0.39,1.25)
Sandoval 0.68(0.48,0.88)
12 | PHYSICIANS FOR SOCIAL RESPONSIBILITY
Discussion of Findings
These results indicate that the cumulative number of
COVID-19 cases and deaths are higher than would be
expected in some counties with active oil and gas production
sites, but not in others. While these results are inconclusive,
the observation that more COVID-19 deaths were observed
than expected in the three Colorado counties located
in the Denver Julesburg Basin could support hypothesis
generation for further study. Those three counties – Adams,
Broomfield, and Weld – experienced the bulk of the oil and
gas development that occurred in Colorado in 2020. The
potential for exposure to air pollutants associated with
oil and gas development is highest while the well site is
being developed and extraction is taking place (e.g. drilling,
hydraulic fracturing, and flowback).29.30
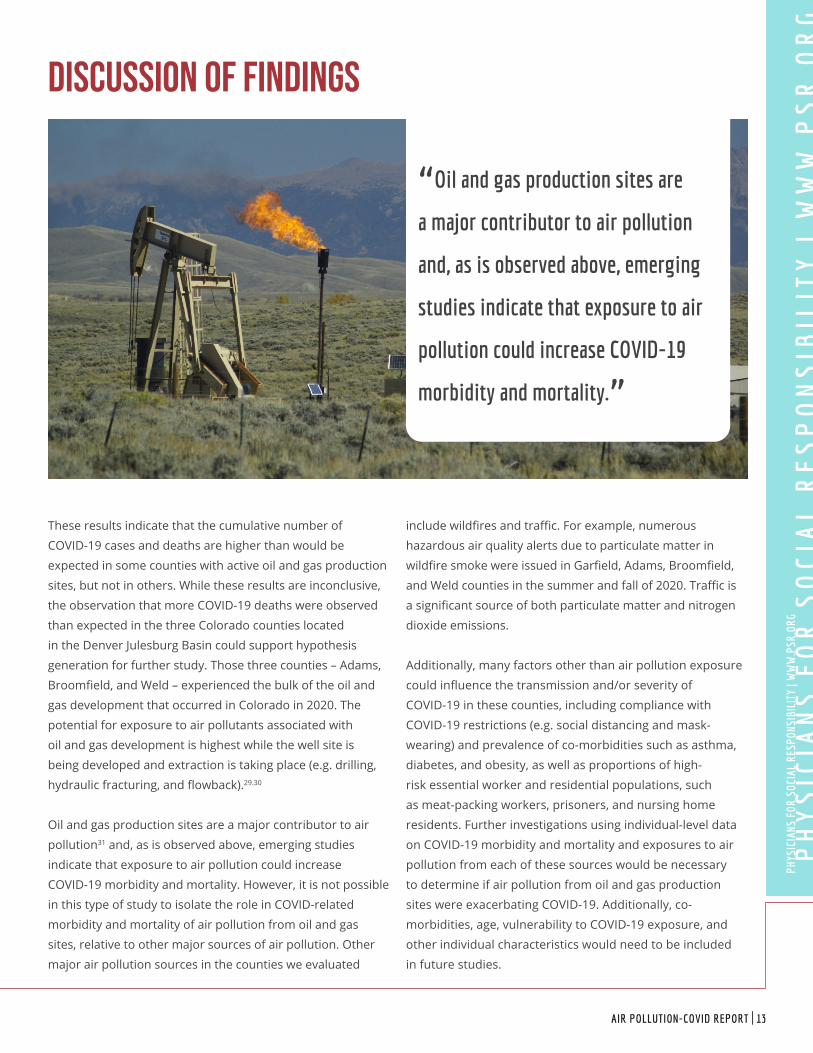
Oil and gas production sites are a major contributor to air
pollution31 and, as is observed above, emerging studies
indicate that exposure to air pollution could increase
COVID-19 morbidity and mortality. However, it is not possible
in this type of study to isolate the role in COVID-related
morbidity and mortality of air pollution from oil and gas
sites, relative to other major sources of air pollution. Other
major air pollution sources in the counties we evaluated
include wildfires and traffic. For example, numerous
hazardous air quality alerts due to particulate matter in
wildfire smoke were issued in Garfield, Adams, Broomfield,
and Weld counties in the summer and fall of 2020. Traffic is
a significant source of both particulate matter and nitrogen
dioxide emissions.
Additionally, many factors other than air pollution exposure
could influence the transmission and/or severity of
COVID-19 in these counties, including compliance with
COVID-19 restrictions (e.g. social distancing and mask-
wearing) and prevalence of co-morbidities such as asthma,
diabetes, and obesity, as well as proportions of high-
risk essential worker and residential populations, such
as meat-packing workers, prisoners, and nursing home
residents. Further investigations using individual-level data
on COVID-19 morbidity and mortality and exposures to air
pollution from each of these sources would be necessary
to determine if air pollution from oil and gas production
sites were exacerbating COVID-19. Additionally, co-
morbidities, age, vulnerability to COVID-19 exposure, and
other individual characteristics would need to be included
in future studies.
“Oil and gas production sites are
a major contributor to air pollution
and, as is observed above, emerging
studies indicate that exposure to air
pollution could increase COVID-19
morbidity and mortality.”
PH
YS
ICIA
NS
FO
R S
OC
IAL
RE
SP
ON
SIB
ILIT
Y |
WW
W.P
SR
.OR
GPH
YSIC
IANS
FOR
SOC
IAL
RESP
ONSI
BILI
TY |
WW
W.P
SR.O
RG
AIR POLLUTION-COVID REPORT | 13
Conclusions and Recommendations
This study asks whether living in an area with active oil and
gas extraction operations increases a person’s risk of getting,
or dying from, COVID-19. The question is an important
one, yet this study does not pretend to generate definitive
answers. Rather, it constitutes only a first step in that inquiry,
one that generates hypotheses that we hope will be pursued
in future research.
Based on the data that we reviewed, it is unclear whether
oil and gas operations are affecting COVID-19 transmission,
morbidity, and mortality in Colorado and New Mexico. That
being said, evidence is emerging that air pollution increases
the risk of getting a respiratory virus like COVID-19 and of
experiencing a bad outcome, such as hospitalization or
death. For that reason, reducing all sources of air pollution is
a good strategy in protecting people from COVID-19. To that
end we offer the following recommendations:
• As oil and gas operations add to the cumulative air
pollution burden in an airshed, all available steps
should be taken to reduce pollution from those sources.
• Unlike some other air pollution sources, like wildfires,
oil and gas pollutant emissions are something that can
be controlled in the relatively short term. This makes
it appropriate to focus efforts on reducing those emissions, whether they derive from leaks, flaring, blowdowns and other deliberate releases, or other causes related to oil and gas operations.
• Further research should be pursued to isolate and
quantify the role played by oil and gas operations
in contributing to nearby residents’ vulnerability to
disease and deaths associated with COVID-19. We
suggest that individual-level data on COVID-19 exposure,
morbidity and mortality as well as co-morbidities, age,
and other individual characteristics be among the
questions to be explored.
14 | PHYSICIANS FOR SOCIAL RESPONSIBILITY
1Johns Hopkins Coronavirus Resource Center. https://coronavirus.jhu.edu
2Schwartz, J. “Air Pollution and Children’s Health.” Pediatrics. April 2004, 113 (Supplement 3) 1037-1043) https://pediatrics.aappublications.org/content/113/Supplement_3/1037
3World Health Organization. “Ambient air pollution: Health impacts.” https://www.who.int/airpollution/ambient/health-impacts/en/
4Shin, J., et al. “Long-term exposure to ambient air pollutants and mental health status: A nationwide population-based cross-sectional study.” PLoS One. 2018; 13(4): e0195607. https://doi.org/10.1371/journal.pone.0195607
5World Health Organization. “Ambient (outdoor) air pollution.” https://www.who.int/health-topics/air-pollution#tab=tab_1
6Southwest Pennsylvania Environmental Health Project. “Air Pollution and Respiratory Infections: Reviewing the Science.” 2020. https://www.environmentalhealthproject.org/sites/default/files/assets/resources/air-pollution-and-respiratory-infections-reviewing-the-science_0.pdf
7Centers for Disease Control and Prevention. Coronavirus Disease 2019 (COVID-19). “People with Certain Medical Conditions.” Updated November 2, 2020. https://www.cdc.gov/coronavirus/2019-ncov/need-extra-precautions/people-with-medical-conditions.html
8Centers for Disease Control, “Symptoms of Coronavirus.” https://www.cdc.gov/coronavirus/2019-ncov/symptoms-testing/symptoms.html
9Columbia University Irving Medical Center, “Even Mild Cases Can Cause “COVID-19 Fog.” September 21, 2020. https://www.cuimc.columbia.edu/news/even-mild-cases-can-cause-covid-19-fog.
10Frontera, A. et al. “Severe air pollution links to higher mortality in COVID-19 patients: The “double hit” hypothesis.” Journal of Infection. Volume 81, Issue 2, August 2020, Pages 255-259. https://doi.org/10.1016/j.jinf.2020.05.031
11Zhu, Y., et al. “Association between short-term exposure to air pollution and COVID-19 infection: Evidence from China.” Science of The Total Environment. Volume 727, July 20, 2020, 138704. https://doi.org/10.1016/j.scitotenv.2020.138704
12Wu, X., et al. “Exposure to air pollution and COVID-19 mortality in the United States: A nationwide cross-sectional study.” Harvard T.H. Chan School of Public Health. April 27, 2020. https://doi.org/10.1101/2020.04.05.20054502
13Austin, W., et al. “COVID-19 Mortality and Contemporaneous Air Pollution.” Georgia State University Andrew Young School of Policy Studies, International Center for Public Policy Working Paper 20-16 October 2020. https://icepp.gsu.edu/files/2020/10/paper2016.pdf
14Golden, S. “Coronavirus in African Americans and Other People of Color.” Johns Hopkins Medicine. https://www.hopkinsmedicine.org/health/conditions-and-diseases/coronavirus/covid19-racial-disparities
15Grinshpun, M. “COVID-19 Teaches Us Lessons About Air Pollution, Environmental Justice, and Climate Change.” Boston University Institute for Sustainable Energy. http://www.bu.edu/ise/2020/05/19/covid-19-teaches-us-lessons-about-air-pollution-environmental-justice-and-climate-change/
16McKenzie LM, Allshouse WB, Burke T, Blair BD, Adgate JL. “Population Size, Growth, and Environmental Justice Near Oil and Gas Wells in Colorado.” Environmental Science & Technology. 2016;50(21):11471-11480. PMID 27689723. https://pubs.acs.org/doi/10.1021/acs.est.6b04391
17Czolowski ED, Santoro RL, Srebotnjak T, Shonkoff SB. Toward Consistent Methodology to Quantify Populations in Proximity to Oil and Gas Development: A National Spatial Analysis and Review. Environ Health Perspect. 2017;125(8):086004. PMID 28858829 https://doi.org/10.1289/EHP1535
18Allshouse, W.B., et al, “Community Noise and Air Pollution Exposure During the Development of a Multi-Well Oil and Gas Pad.” Environ Sci Technol 2019 Jun 18;53(12):7126-7135. https://pubs.acs.org/doi/10.1021/acs.est.9b00052
19Helmig, D., 2020. Air quality impacts from oil and natural gas development in Colorado. Elem Sci Anth, 8(1), p.4. DOI: http://doi.org/10.1525/elementa.398
20United States Environmental Protection Agency. “Health Effects of Ozone Pollution.” https://www.epa.gov/ground-level-ozone-pollution/health-effects-ozone-pollution
21Helmig, D., 2020. “Air quality impacts from oil and natural gas development in Colorado.” Elem Sci Anth, 8(1), p.4. DOI: http://doi.org/10.1525/elementa.398
22McKenzie LM, et al, “Human health risk assessment of air emissions from development of unconventional natural gas resources,” Sci Total Environ (2012), https://doi.org/10.1016/j.scitotenv.2012.02.018
23McKenzie, LM, et al. “Ambient Nonmethane Hydrocarbon Levels Along Colorado’s Northern Front Range: Acute and Chronic Health Risks.” Environ Sci Technol. 2018 Apr 17;52(8):4514-4525. doi: 10.1021/acs.est.7b05983. Epub 2018 Apr 9.
Footnotes
PH
YS
ICIA
NS
FO
R S
OC
IAL
RE
SP
ON
SIB
ILIT
Y |
WW
W.P
SR
.OR
GPH
YSIC
IANS
FOR
SOC
IAL
RESP
ONSI
BILI
TY |
WW
W.P
SR.O
RG
AIR POLLUTION-COVID REPORT | 15
24Chris Holder, John Hader, Raga Avanasi, Tao Hong, Ed Carr, Bill Mendez, Jessica Wignall, Graham Glen, Belle Guelden & Yihua Wei (2019) “Evaluating potential human health risks from modeled inhalation exposures to volatile organic compounds emitted from oil and gas operations,” Journal of the Air & Waste Management Association, 69:12, 1503-1524, DOI: https://doi.org/10.1080/10962247.2019.1680459
25Fann N, Baker KR, Chan EAW, et al. “Assessing Human Health PM2.5 and Ozone Impacts from U.S. Oil and Natural Gas Sector Emissions in 2025.” Environmental Science & Technology. 2018;52(15):8095-8103. PMID 30004688 https://doi.org/10.1021/acs.est.8b02050
26Russo, P.N. & Carpenter, D.O., Institute for Health and the Environment, University at Albany. “Health Effects Associated with Stack Chemical Emissions from NYS Natural Gas Compressor Stations: 2008-2014.” October 12, 2017. https://www.albany.edu/about/assets/Complete_report.pdf
27Physicians for Social Responsibility and Concerned Health Professionals of New York. “Compendium of Scientific, Medical, and Media Findings Demonstrating the Risks and Harms of Fracking (Unconventional Gas and Oil Extraction) — Sixth Edition.” June 2019. https://www.psr.org/wp-content/uploads/2019/06/compendium-6.pdf
28Colorado Oil and Gas Dashboard. https://cogcc.state.co.us/DAD.html Accessed October 30, 2020
29Chris Holder, John Hader, Raga Avanasi, Tao Hong, Ed Carr, Bill Mendez, Jessica Wignall, Graham Glen, Belle Guelden & Yihua Wei (2019) “Evaluating potential human health risks from modeled inhalation exposures to volatile organic compounds emitted from oil and gas operations,” Journal of the Air & Waste Management Association, 69:12, 1503-1524, DOI: 10.1080/10962247.2019.1680459
30Allshouse, W.B., et al, “Community Noise and Air Pollution Exposure During the Development of a Multi-Well Oil and Gas Pad.” Environ Sci Technol 2019 Jun 18;53(12):7126-7135. https://pubs.acs.org/doi/10.1021/acs.est.9b00052
31Helmig, D., 2020. Air quality impacts from oil and natural gas development in Colorado. Elem Sci Anth, 8(1), p.4. DOI: http://doi.org/10.1525/elementa.398
Footnotes
16 | PHYSICIANS FOR SOCIAL RESPONSIBILITY
1111 14th Street NW, #700Washington, DC 20005202 667 [email protected]
@PSRenvironment and @PSRnuclear
/psrnational
Graphic Design: twocatsgraphics.com
PSR PHYSICIANSFOR SOCIAL RESPONSIBILITY