Embed Size (px)
Citation preview
Air Navigation Services Operational Safety Reporting and Performance Long-term Trends Version 1 26 July 2019
ANS Operational Safety Reporting and Performance – Long-term Trends
3 Version 1: 26 July 2019
Change summary Version Date Change description
1 26 July 2019 First version for public release
Table of contents 1 Executive Summary .................................................................................................. 4
2 Australian Administered Airspace .......................................................................... 6
3 Purpose ...................................................................................................................... 6
4 Safety Reporting Mechanisms ................................................................................ 6
5 Reporting Approach ................................................................................................. 7
6 Governance Oversight ............................................................................................. 7
7 Safety Reporting Trends .......................................................................................... 9
8 Other Reporting Trends ......................................................................................... 13 8.1 Fatigue Reporting ..................................................................................................... 13 8.2 Audit Findings ........................................................................................................... 14 8.3 Confidential Word ..................................................................................................... 14 8.4 REPCON ................................................................................................................... 15 8.5 Safety Climate Survey .............................................................................................. 15
9 Safety Performance Trends ................................................................................... 16
10 Cross Validation of Performance .......................................................................... 18
11 International Safety Benchmarking ...................................................................... 18
Appendix 1 - Airservices Just Culture Approach ....................................................................... 19
Appendix 2 - Examples of Air Navigation Services Reporting Rates ....................................... 20
ANS Operational Safety Reporting and Performance – Long-term Trends
4 Version 1: 26 July 2019
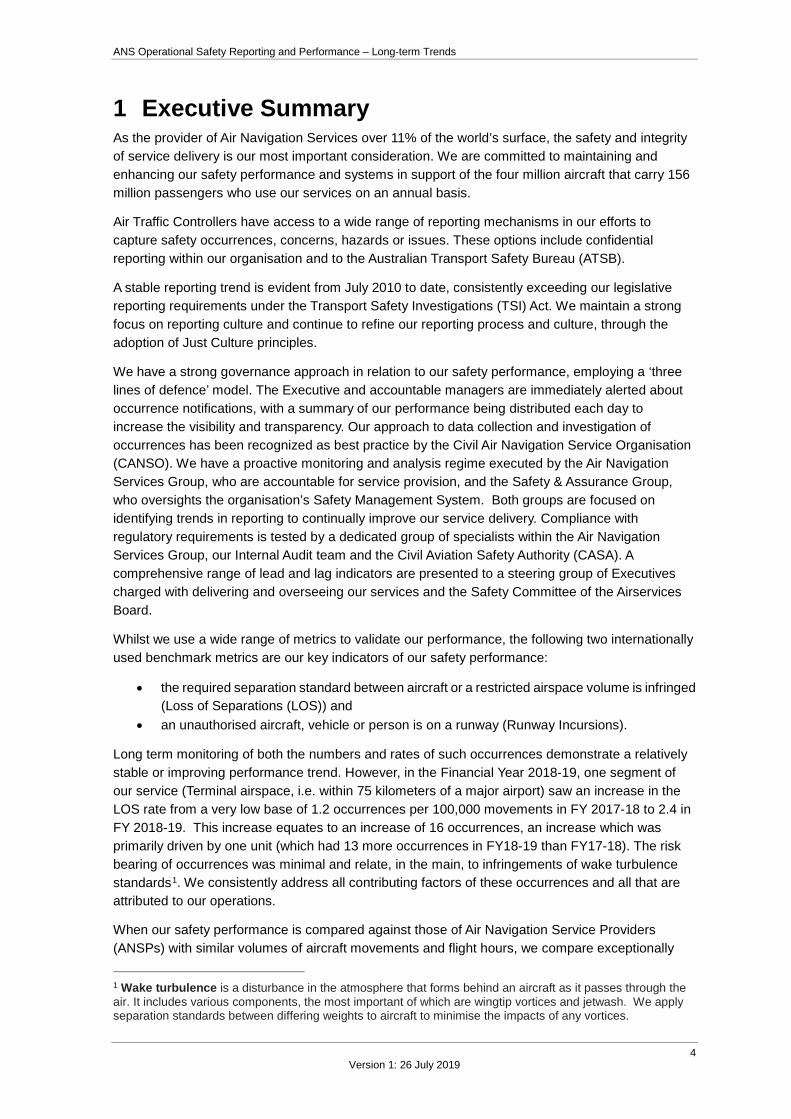
1 Executive Summary As the provider of Air Navigation Services over 11% of the world’s surface, the safety and integrity of service delivery is our most important consideration. We are committed to maintaining and enhancing our safety performance and systems in support of the four million aircraft that carry 156 million passengers who use our services on an annual basis.
Air Traffic Controllers have access to a wide range of reporting mechanisms in our efforts to capture safety occurrences, concerns, hazards or issues. These options include confidential reporting within our organisation and to the Australian Transport Safety Bureau (ATSB).
A stable reporting trend is evident from July 2010 to date, consistently exceeding our legislative reporting requirements under the Transport Safety Investigations (TSI) Act. We maintain a strong focus on reporting culture and continue to refine our reporting process and culture, through the adoption of Just Culture principles.
We have a strong governance approach in relation to our safety performance, employing a ‘three lines of defence’ model. The Executive and accountable managers are immediately alerted about occurrence notifications, with a summary of our performance being distributed each day to increase the visibility and transparency. Our approach to data collection and investigation of occurrences has been recognized as best practice by the Civil Air Navigation Service Organisation (CANSO). We have a proactive monitoring and analysis regime executed by the Air Navigation Services Group, who are accountable for service provision, and the Safety & Assurance Group, who oversights the organisation’s Safety Management System. Both groups are focused on identifying trends in reporting to continually improve our service delivery. Compliance with regulatory requirements is tested by a dedicated group of specialists within the Air Navigation Services Group, our Internal Audit team and the Civil Aviation Safety Authority (CASA). A comprehensive range of lead and lag indicators are presented to a steering group of Executives charged with delivering and overseeing our services and the Safety Committee of the Airservices Board.
Whilst we use a wide range of metrics to validate our performance, the following two internationally used benchmark metrics are our key indicators of our safety performance:
• the required separation standard between aircraft or a restricted airspace volume is infringed (Loss of Separations (LOS)) and
• an unauthorised aircraft, vehicle or person is on a runway (Runway Incursions).
Long term monitoring of both the numbers and rates of such occurrences demonstrate a relatively stable or improving performance trend. However, in the Financial Year 2018-19, one segment of our service (Terminal airspace, i.e. within 75 kilometers of a major airport) saw an increase in the LOS rate from a very low base of 1.2 occurrences per 100,000 movements in FY 2017-18 to 2.4 in FY 2018-19. This increase equates to an increase of 16 occurrences, an increase which was primarily driven by one unit (which had 13 more occurrences in FY18-19 than FY17-18). The risk bearing of occurrences was minimal and relate, in the main, to infringements of wake turbulence standards1. We consistently address all contributing factors of these occurrences and all that are attributed to our operations.
When our safety performance is compared against those of Air Navigation Service Providers (ANSPs) with similar volumes of aircraft movements and flight hours, we compare exceptionally 1 Wake turbulence is a disturbance in the atmosphere that forms behind an aircraft as it passes through the air. It includes various components, the most important of which are wingtip vortices and jetwash. We apply separation standards between differing weights to aircraft to minimise the impacts of any vortices.
ANS Operational Safety Reporting and Performance – Long-term Trends
5 Version 1: 26 July 2019
well from both an occurrence rate and risk perspective. Our air traffic controllers also report a very high proportion of occurrences in which there was only a marginal infringement of the required separation standards between aircraft. Again reflecting a positive reporting culture.
We remain committed to ensuring the services that we provide in Australian administered airspace is of the highest safety standard, and will continue to invest in technological and people capability to meet this objective.
ANS Operational Safety Reporting and Performance – Long-term Trends
6 Version 1: 26 July 2019
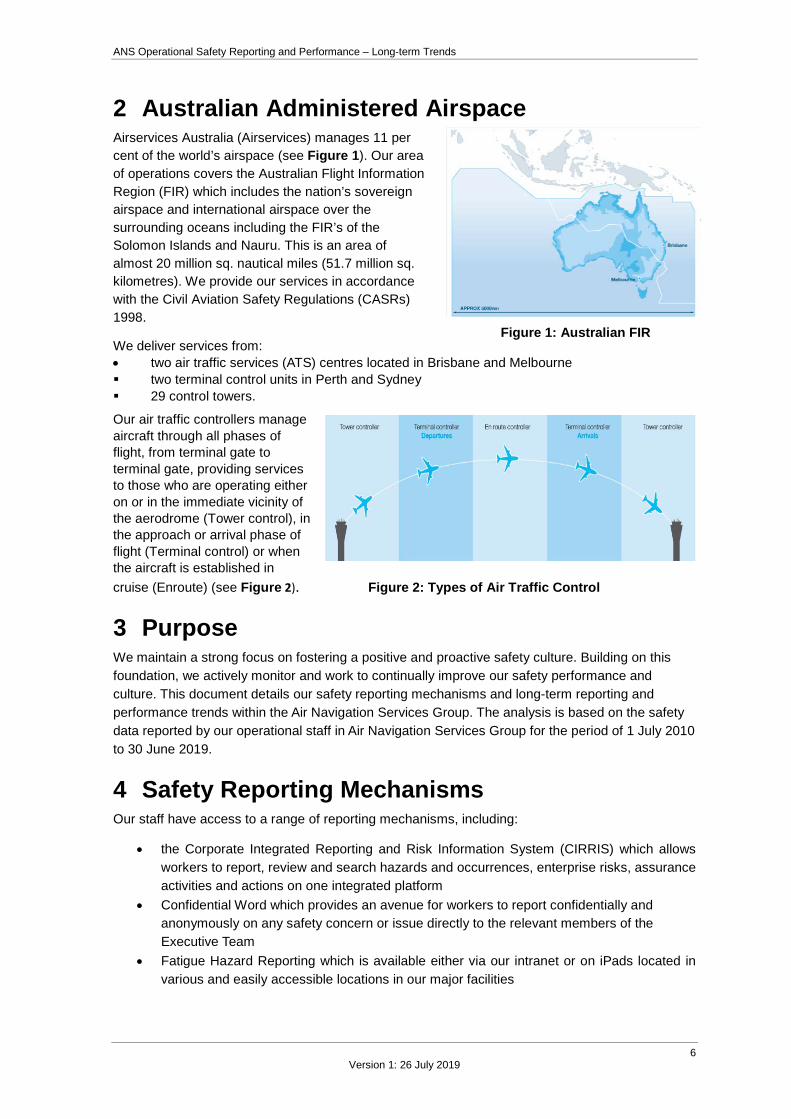
2 Australian Administered Airspace Airservices Australia (Airservices) manages 11 per cent of the world’s airspace (see Figure 1). Our area of operations covers the Australian Flight Information Region (FIR) which includes the nation’s sovereign airspace and international airspace over the surrounding oceans including the FIR’s of the Solomon Islands and Nauru. This is an area of almost 20 million sq. nautical miles (51.7 million sq. kilometres). We provide our services in accordance with the Civil Aviation Safety Regulations (CASRs) 1998.
We deliver services from: • two air traffic services (ATS) centres located in Brisbane and Melbourne two terminal control units in Perth and Sydney 29 control towers.
Our air traffic controllers manage aircraft through all phases of flight, from terminal gate to terminal gate, providing services to those who are operating either on or in the immediate vicinity of the aerodrome (Tower control), in the approach or arrival phase of flight (Terminal control) or when the aircraft is established in cruise (Enroute) (see Figure 2). Figure 2: Types of Air Traffic Control
3 Purpose We maintain a strong focus on fostering a positive and proactive safety culture. Building on this foundation, we actively monitor and work to continually improve our safety performance and culture. This document details our safety reporting mechanisms and long-term reporting and performance trends within the Air Navigation Services Group. The analysis is based on the safety data reported by our operational staff in Air Navigation Services Group for the period of 1 July 2010 to 30 June 2019.
4 Safety Reporting Mechanisms Our staff have access to a range of reporting mechanisms, including:
• the Corporate Integrated Reporting and Risk Information System (CIRRIS) which allows workers to report, review and search hazards and occurrences, enterprise risks, assurance activities and actions on one integrated platform
• Confidential Word which provides an avenue for workers to report confidentially and anonymously on any safety concern or issue directly to the relevant members of the Executive Team
• Fatigue Hazard Reporting which is available either via our intranet or on iPads located in various and easily accessible locations in our major facilities
Figure 1: Australian FIR
ANS Operational Safety Reporting and Performance – Long-term Trends
7 Version 1: 26 July 2019
• Workload reporting which allows our air traffic controllers to report everyday workload levels as well as periods of high workload or situations where workload was excessively low
• regular Employee Opinion Surveys and Safety Climate Surveys by which staff can anonymously provide opinions on our commitment and approach to safety.
Staff can also use REPCON, a voluntary and confidential reporting scheme managed by the Australian Transport Safety Bureau (ATSB).
The Safety & Assurance Group provides oversight of all internal reporting mechanisms to ensure their integrity and effectiveness.
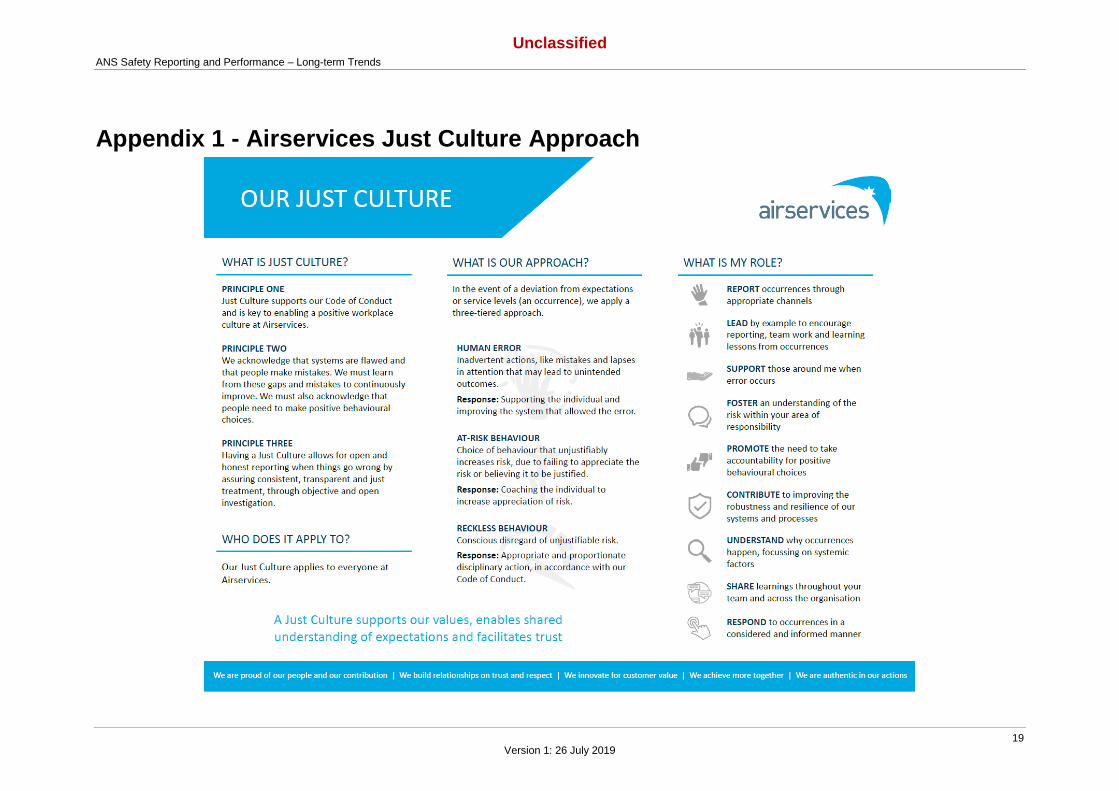
5 Reporting Approach We embrace a Just Culture approach in our efforts to enhance reporting across all facets of our organisation as shown in Appendix 1. Our staff are introduced to the approach during their induction to the organisation.
Regular programs are implemented to refresh staff understanding of the Just Culture principles and how they support continual improvement. In February 2019, we rolled out a leader-led program to promote team conversations and individual actions to embed Just Culture principles within the context and function of teams and individual roles. An Executive Team led communication campaign is currently underway to further promote our commitment to Just Culture to our entire organisation.
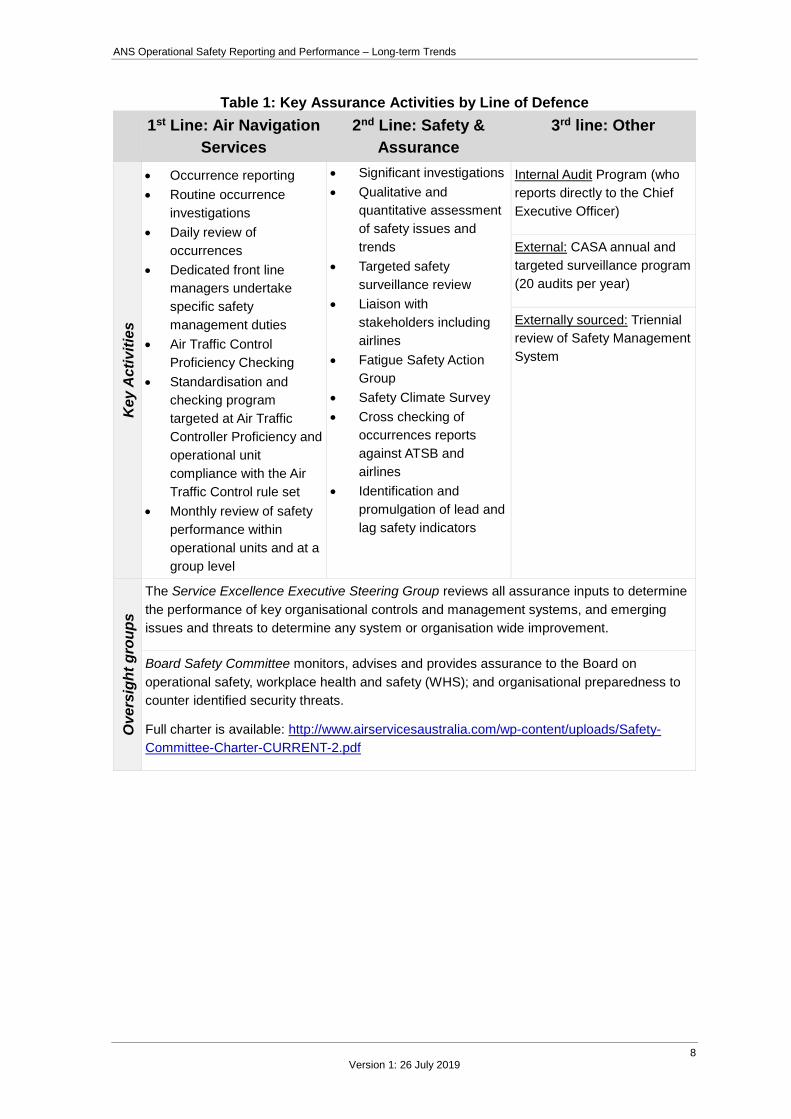
6 Governance Oversight Our Board and Executive rely on internal functions to deliver risk management, performance monitoring and assurance functions to acquit their obligations to ensure that the risks to service delivery are effectively managed. The regulatory surveillance program undertaken by the Civil Aviation Safety Authority (CASA) supplements our internal assurance. We have adopted the 'three lines of defence' model as a means of ensuring the integrity of our assurance function (see Table 1) given the criticality of the risks we are managing:
• the first line of defence – functions that own and manage risk, i.e. the Air Navigation Group. Within the Air Navigation Services Group, an area independent of the service delivery units provides internal assurance and compliance functions.
• the second line of defence – functions that oversee or specialise in risk management and compliance and are independent of the service delivery group, i.e. the Safety & Assurance Group
• the third line of defence – functions that provide independent assurance, including internal audit and CASA surveillance.
Within the three lines of defence model, visibility and transparency of performance is delivered through mechanisms including:
• immediately alert the Executive and accountable managers to occurrences, with a summary of our performance being distributed each day to increase the visibility and transparency
• daily occurrence reviews conducted by experts from the ANS Group and Safety & Assurance Group
• internal surveillance outputs being shared between teams in efforts to immediately identify adverse trends
• two key oversight committees, which are detailed in Table 1.
ANS Operational Safety Reporting and Performance – Long-term Trends
8 Version 1: 26 July 2019
Table 1: Key Assurance Activities by Line of Defence 1st Line: Air Navigation
Services 2nd Line: Safety &
Assurance 3rd line: Other
Key
Act
iviti
es
• Occurrence reporting • Routine occurrence
investigations • Daily review of
occurrences • Dedicated front line
managers undertake specific safety management duties
• Air Traffic Control Proficiency Checking
• Standardisation and checking program targeted at Air Traffic Controller Proficiency and operational unit compliance with the Air Traffic Control rule set
• Monthly review of safety performance within operational units and at a group level
• Significant investigations • Qualitative and
quantitative assessment of safety issues and trends
• Targeted safety surveillance review
• Liaison with stakeholders including airlines
• Fatigue Safety Action Group
• Safety Climate Survey • Cross checking of
occurrences reports against ATSB and airlines
• Identification and promulgation of lead and lag safety indicators
Internal Audit Program (who reports directly to the Chief Executive Officer)
External: CASA annual and targeted surveillance program (20 audits per year)
Externally sourced: Triennial review of Safety Management System
Ove
rsig
ht g
roup
s
The Service Excellence Executive Steering Group reviews all assurance inputs to determine the performance of key organisational controls and management systems, and emerging issues and threats to determine any system or organisation wide improvement.
Board Safety Committee monitors, advises and provides assurance to the Board on operational safety, workplace health and safety (WHS); and organisational preparedness to counter identified security threats.
Full charter is available: http://www.airservicesaustralia.com/wp-content/uploads/Safety-Committee-Charter-CURRENT-2.pdf
ANS Operational Safety Reporting and Performance – Long-term Trends
9 Version 1: 26 July 2019
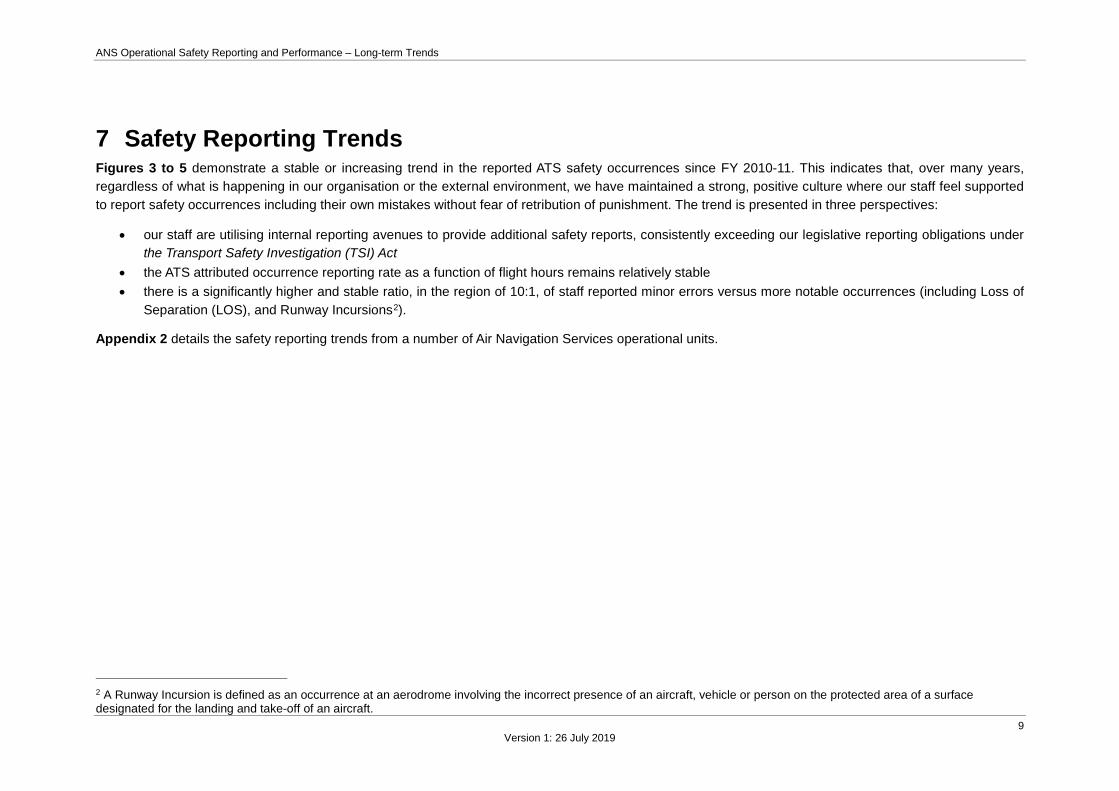
7 Safety Reporting Trends Figures 3 to 5 demonstrate a stable or increasing trend in the reported ATS safety occurrences since FY 2010-11. This indicates that, over many years, regardless of what is happening in our organisation or the external environment, we have maintained a strong, positive culture where our staff feel supported to report safety occurrences including their own mistakes without fear of retribution of punishment. The trend is presented in three perspectives:
• our staff are utilising internal reporting avenues to provide additional safety reports, consistently exceeding our legislative reporting obligations under the Transport Safety Investigation (TSI) Act
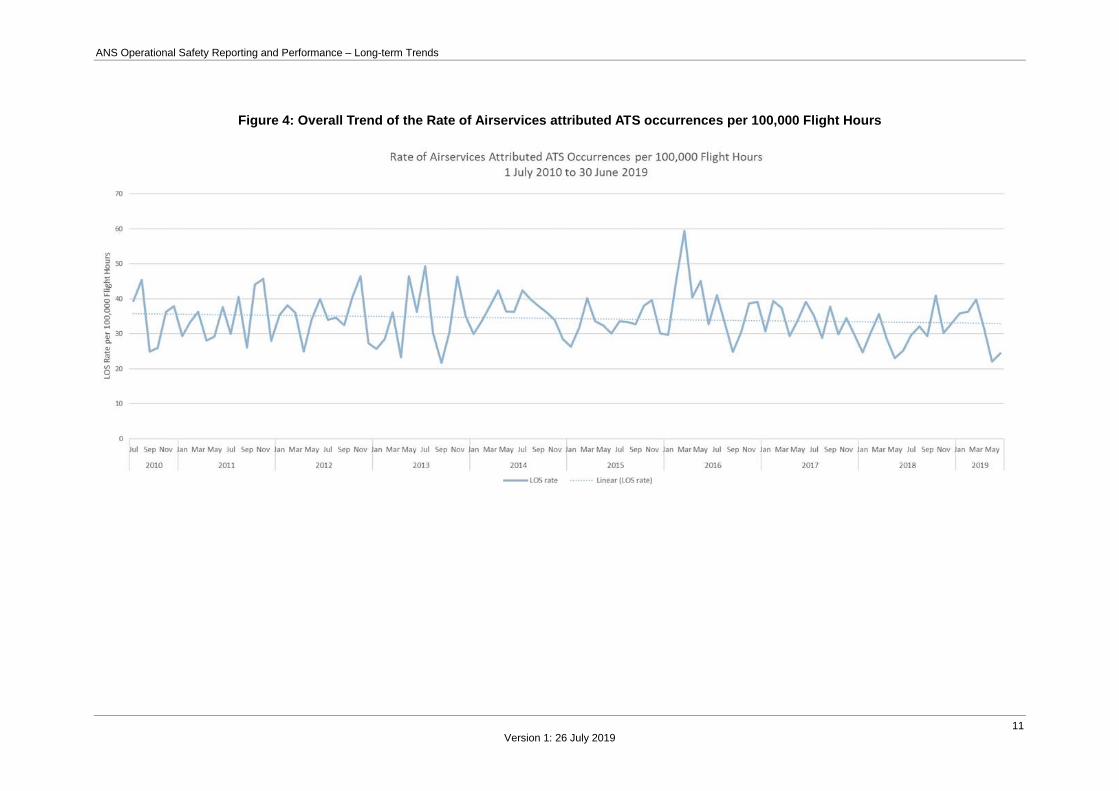
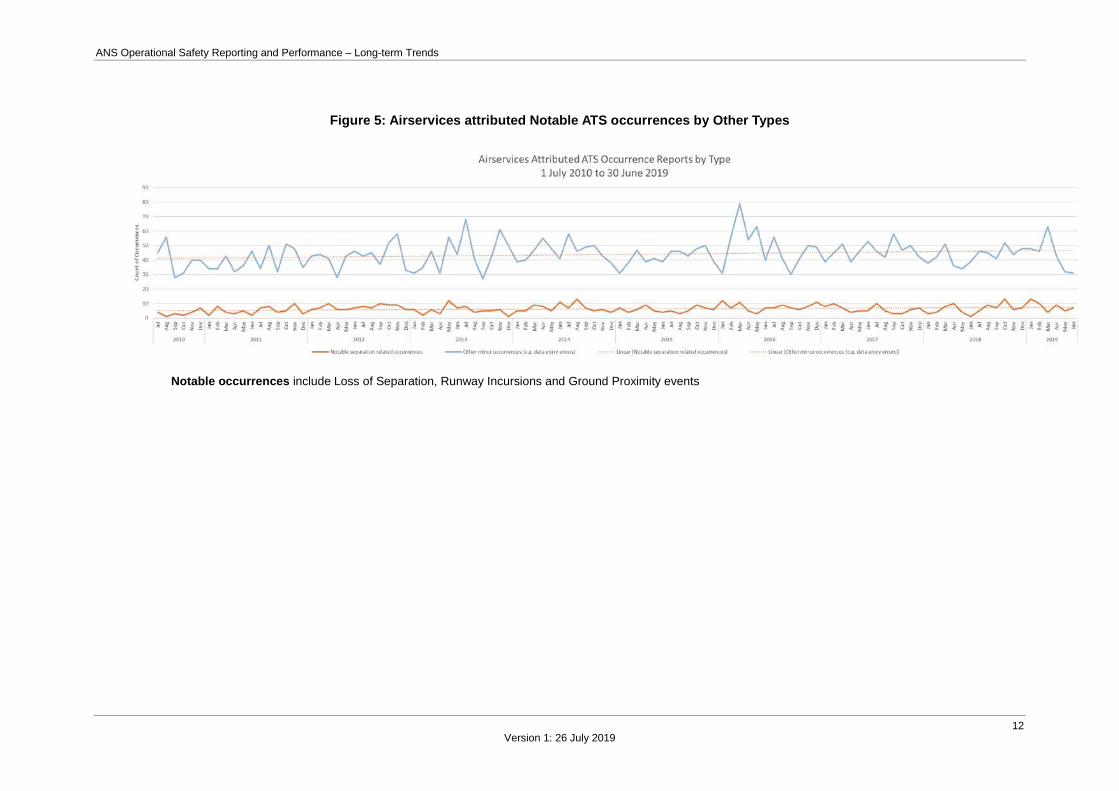
• the ATS attributed occurrence reporting rate as a function of flight hours remains relatively stable • there is a significantly higher and stable ratio, in the region of 10:1, of staff reported minor errors versus more notable occurrences (including Loss of
Separation (LOS), and Runway Incursions2).
Appendix 2 details the safety reporting trends from a number of Air Navigation Services operational units.
2 A Runway Incursion is defined as an occurrence at an aerodrome involving the incorrect presence of an aircraft, vehicle or person on the protected area of a surface designated for the landing and take-off of an aircraft.
ANS Operational Safety Reporting and Performance – Long-term Trends
10 Version 1: 26 July 2019
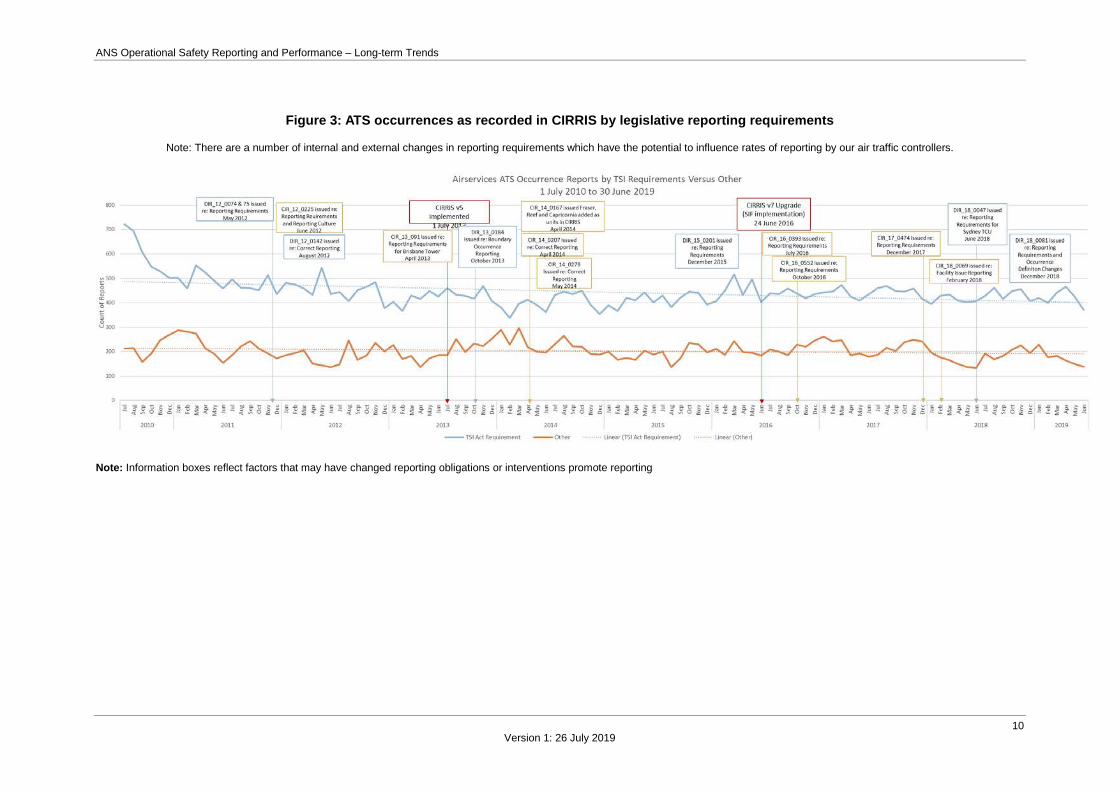
Figure 3: ATS occurrences as recorded in CIRRIS by legislative reporting requirements
Note: There are a number of internal and external changes in reporting requirements which have the potential to influence rates of reporting by our air traffic controllers.
Note: Information boxes reflect factors that may have changed reporting obligations or interventions promote reporting
ANS Operational Safety Reporting and Performance – Long-term Trends
11 Version 1: 26 July 2019
Figure 4: Overall Trend of the Rate of Airservices attributed ATS occurrences per 100,000 Flight Hours
ANS Operational Safety Reporting and Performance – Long-term Trends
12 Version 1: 26 July 2019
Figure 5: Airservices attributed Notable ATS occurrences by Other Types
Notable occurrences include Loss of Separation, Runway Incursions and Ground Proximity events
ANS Operational Safety Reporting and Performance – Long-term Trends
13 Version 1: 26 July 2019
8 Other Reporting Trends
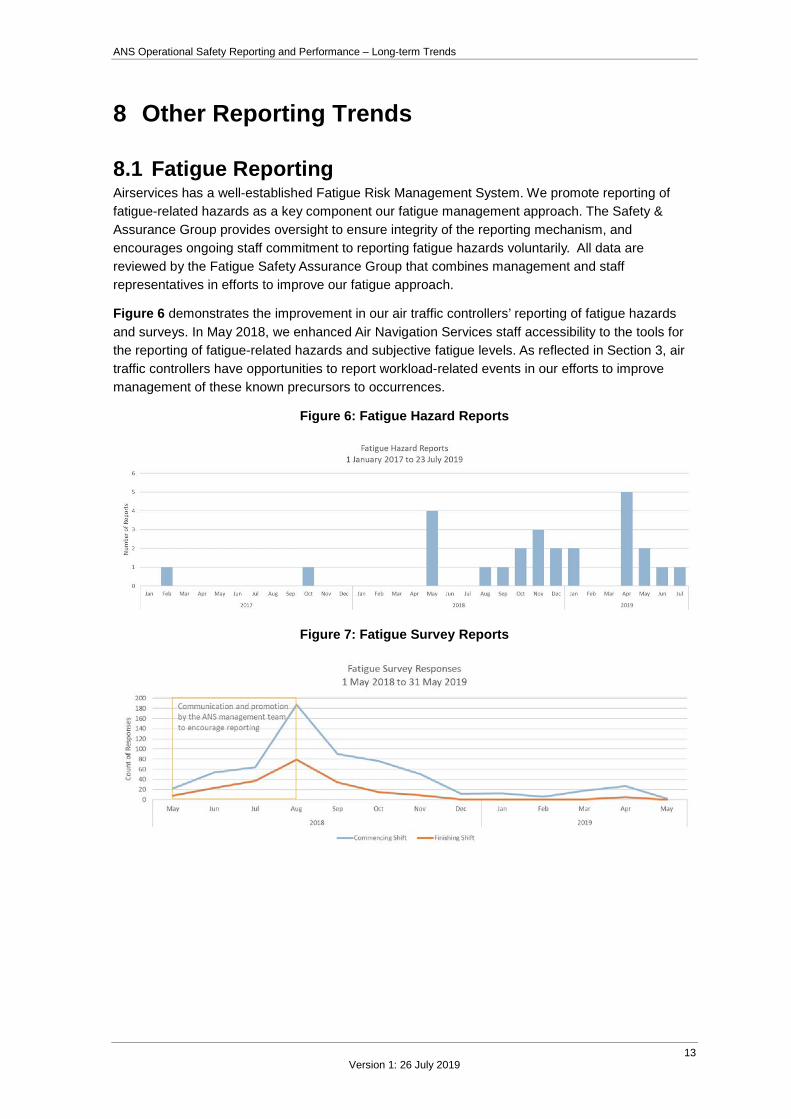
8.1 Fatigue Reporting Airservices has a well-established Fatigue Risk Management System. We promote reporting of fatigue-related hazards as a key component our fatigue management approach. The Safety & Assurance Group provides oversight to ensure integrity of the reporting mechanism, and encourages ongoing staff commitment to reporting fatigue hazards voluntarily. All data are reviewed by the Fatigue Safety Assurance Group that combines management and staff representatives in efforts to improve our fatigue approach.
Figure 6 demonstrates the improvement in our air traffic controllers’ reporting of fatigue hazards and surveys. In May 2018, we enhanced Air Navigation Services staff accessibility to the tools for the reporting of fatigue-related hazards and subjective fatigue levels. As reflected in Section 3, air traffic controllers have opportunities to report workload-related events in our efforts to improve management of these known precursors to occurrences.
Figure 6: Fatigue Hazard Reports
Figure 7: Fatigue Survey Reports
ANS Operational Safety Reporting and Performance – Long-term Trends
14 Version 1: 26 July 2019
8.2 Audit Findings We have a robust and independent internal audit function, which typically conducts on average 15 audits per annum on our Air Navigation Services functions. CASA also maintains an active surveillance program across our operations. Internal and external audits for the period of 1 July 2010 to 30 June 2019 did not raise any findings in relation to the reporting of ATS occurrences, or more broadly our safety or organisational culture. In January 2013, CASA finalised a review as part of its re-certification of our CASR Part 172 - Air Traffic Services certificate. Part 172 of CASR 1998 specifies the regulatory framework for the approval of air traffic services providers. It includes standards for air traffic facilities, safety management and the provision of ATS. The review made a series of recommendations to address areas for improvement in Airservices’ safety and service performance. These recommendations were addressed via a comprehensive Action Plan which was successfully implemented between 2013 and 2014. On the basis of the review and Airservices’ Action Plan, CASA re-issued Airservices Provider Certificate in May 2013.
Since that time, our CASR Part 172 Provider Certificate has been reissued without conditions in 2016 and again in 2019, confirming CASA’s confidence in our provision of ATS, our safety culture and management.
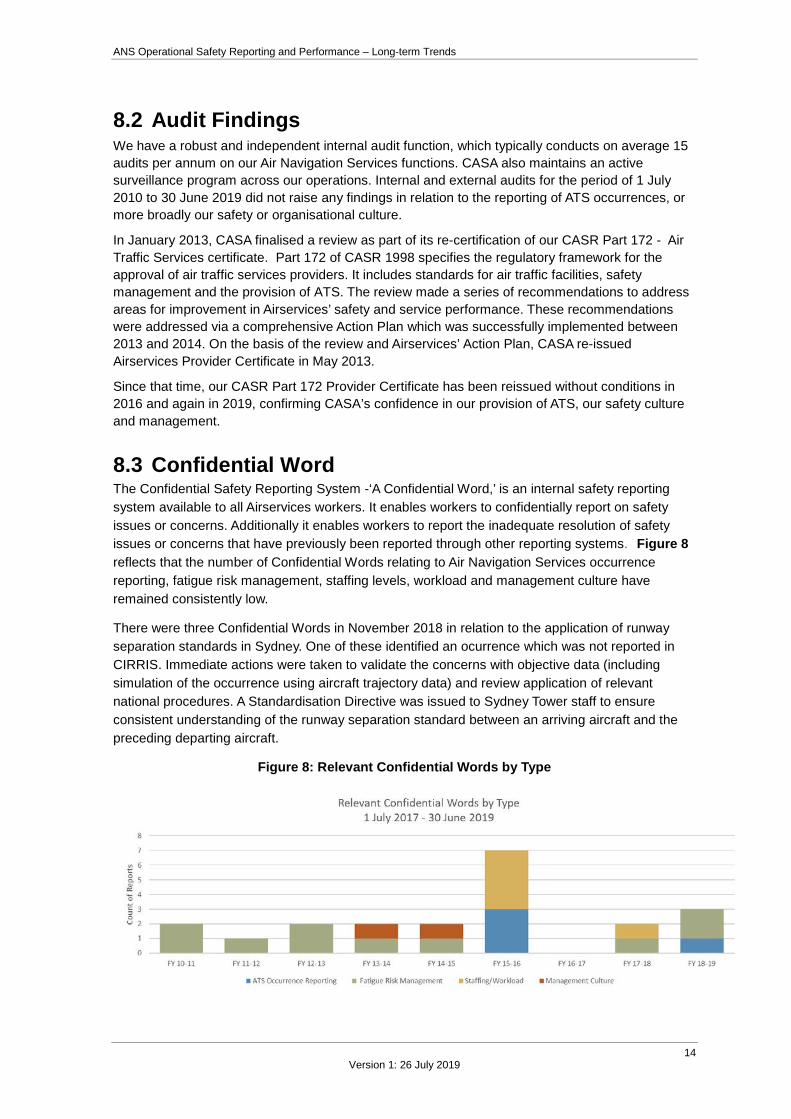
8.3 Confidential Word The Confidential Safety Reporting System -‘A Confidential Word,’ is an internal safety reporting system available to all Airservices workers. It enables workers to confidentially report on safety issues or concerns. Additionally it enables workers to report the inadequate resolution of safety issues or concerns that have previously been reported through other reporting systems. Figure 8 reflects that the number of Confidential Words relating to Air Navigation Services occurrence reporting, fatigue risk management, staffing levels, workload and management culture have remained consistently low.
There were three Confidential Words in November 2018 in relation to the application of runway separation standards in Sydney. One of these identified an ocurrence which was not reported in CIRRIS. Immediate actions were taken to validate the concerns with objective data (including simulation of the occurrence using aircraft trajectory data) and review application of relevant national procedures. A Standardisation Directive was issued to Sydney Tower staff to ensure consistent understanding of the runway separation standard between an arriving aircraft and the preceding departing aircraft.
Figure 8: Relevant Confidential Words by Type
ANS Operational Safety Reporting and Performance – Long-term Trends
15 Version 1: 26 July 2019
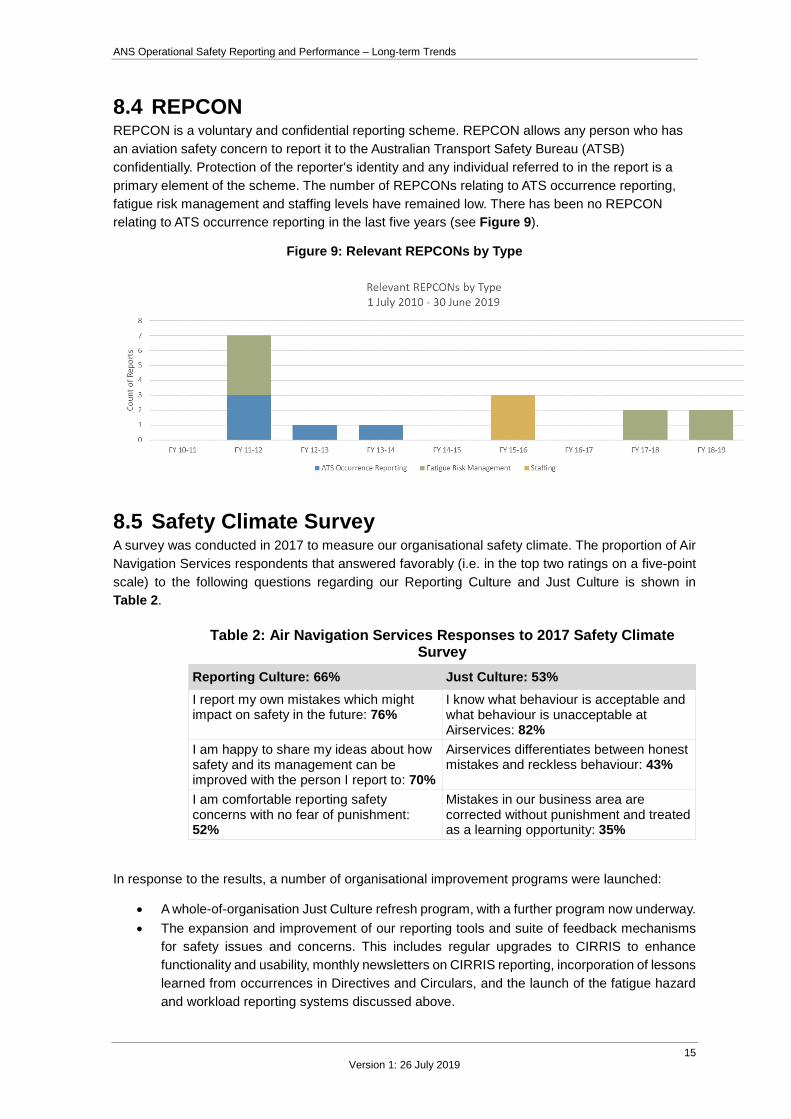
8.4 REPCON REPCON is a voluntary and confidential reporting scheme. REPCON allows any person who has an aviation safety concern to report it to the Australian Transport Safety Bureau (ATSB) confidentially. Protection of the reporter's identity and any individual referred to in the report is a primary element of the scheme. The number of REPCONs relating to ATS occurrence reporting, fatigue risk management and staffing levels have remained low. There has been no REPCON relating to ATS occurrence reporting in the last five years (see Figure 9).
Figure 9: Relevant REPCONs by Type
8.5 Safety Climate Survey A survey was conducted in 2017 to measure our organisational safety climate. The proportion of Air Navigation Services respondents that answered favorably (i.e. in the top two ratings on a five-point scale) to the following questions regarding our Reporting Culture and Just Culture is shown in Table 2.
Table 2: Air Navigation Services Responses to 2017 Safety Climate Survey
Reporting Culture: 66% Just Culture: 53% I report my own mistakes which might impact on safety in the future: 76%
I know what behaviour is acceptable and what behaviour is unacceptable at Airservices: 82%
I am happy to share my ideas about how safety and its management can be improved with the person I report to: 70%
Airservices differentiates between honest mistakes and reckless behaviour: 43%
I am comfortable reporting safety concerns with no fear of punishment: 52%
Mistakes in our business area are corrected without punishment and treated as a learning opportunity: 35%
In response to the results, a number of organisational improvement programs were launched:
• A whole-of-organisation Just Culture refresh program, with a further program now underway. • The expansion and improvement of our reporting tools and suite of feedback mechanisms
for safety issues and concerns. This includes regular upgrades to CIRRIS to enhance functionality and usability, monthly newsletters on CIRRIS reporting, incorporation of lessons learned from occurrences in Directives and Circulars, and the launch of the fatigue hazard and workload reporting systems discussed above.
ANS Operational Safety Reporting and Performance – Long-term Trends
16 Version 1: 26 July 2019
Planning for the completion of our next Safety Climate Survey in early 2020 is currently in progress. Results from the survey will allow us to gauge the effectiveness of these programs and others, and develop further improvement initiatives where required.
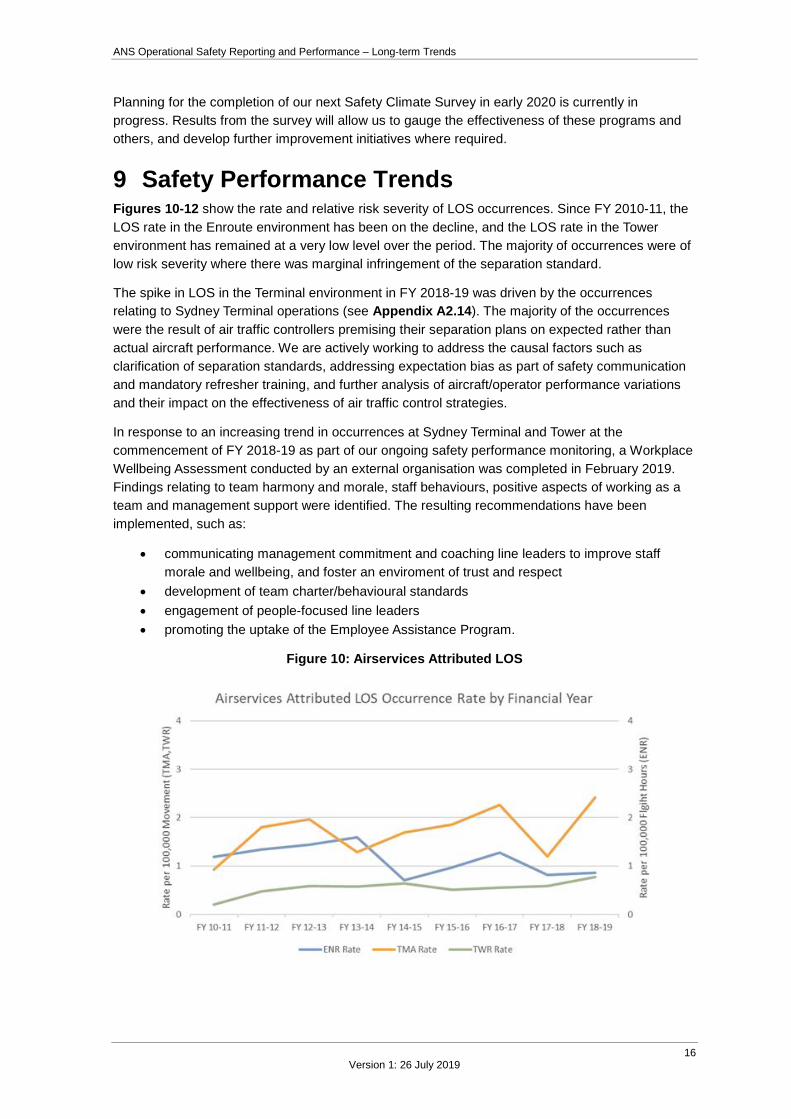
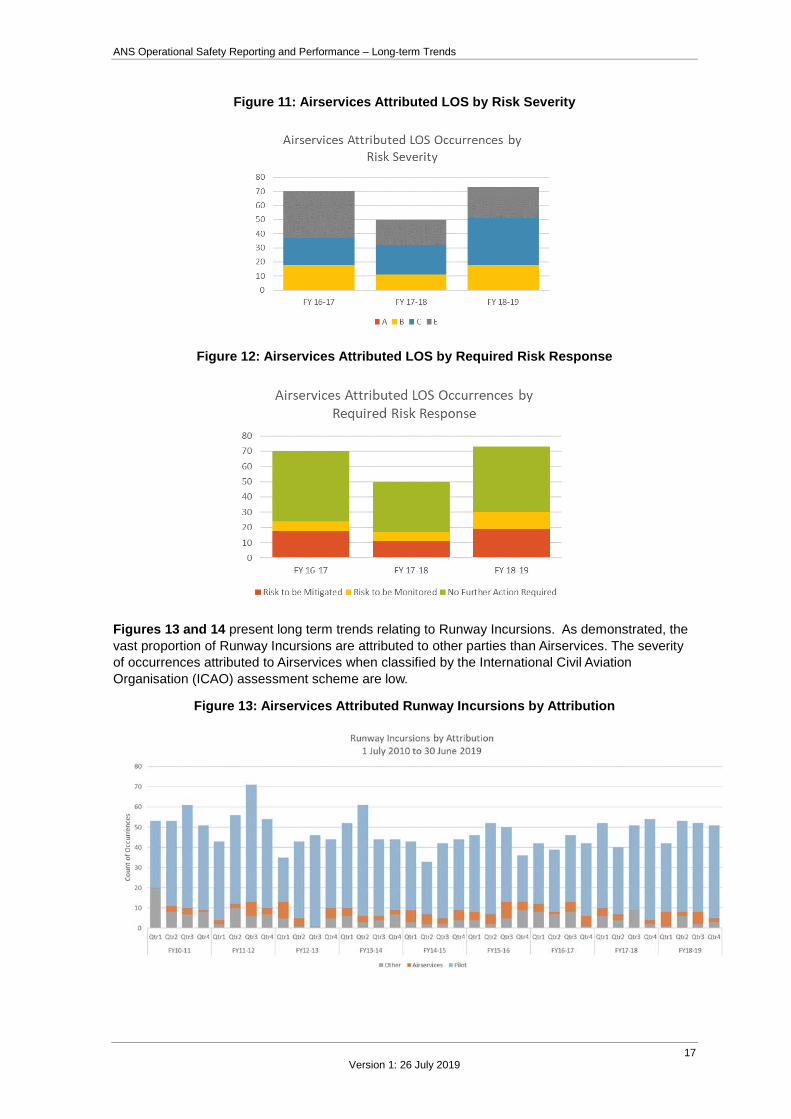
9 Safety Performance Trends Figures 10-12 show the rate and relative risk severity of LOS occurrences. Since FY 2010-11, the LOS rate in the Enroute environment has been on the decline, and the LOS rate in the Tower environment has remained at a very low level over the period. The majority of occurrences were of low risk severity where there was marginal infringement of the separation standard.
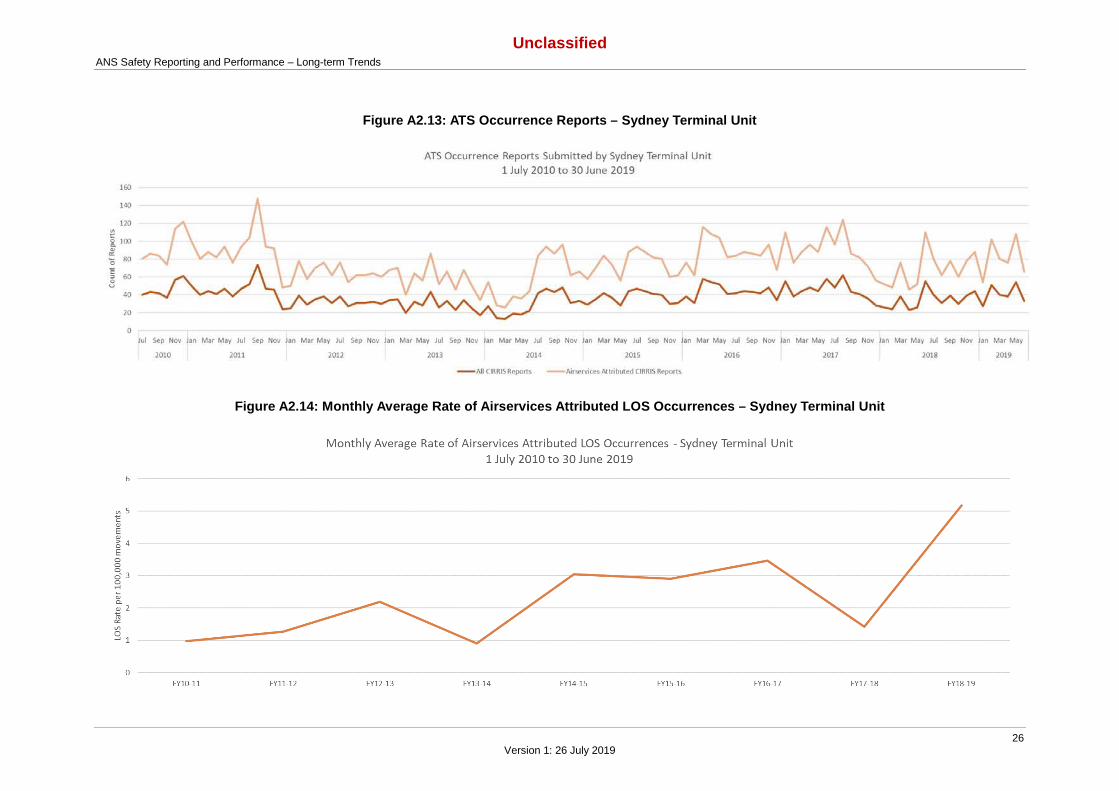
The spike in LOS in the Terminal environment in FY 2018-19 was driven by the occurrences relating to Sydney Terminal operations (see Appendix A2.14). The majority of the occurrences were the result of air traffic controllers premising their separation plans on expected rather than actual aircraft performance. We are actively working to address the causal factors such as clarification of separation standards, addressing expectation bias as part of safety communication and mandatory refresher training, and further analysis of aircraft/operator performance variations and their impact on the effectiveness of air traffic control strategies.
In response to an increasing trend in occurrences at Sydney Terminal and Tower at the commencement of FY 2018-19 as part of our ongoing safety performance monitoring, a Workplace Wellbeing Assessment conducted by an external organisation was completed in February 2019. Findings relating to team harmony and morale, staff behaviours, positive aspects of working as a team and management support were identified. The resulting recommendations have been implemented, such as:
• communicating management commitment and coaching line leaders to improve staff morale and wellbeing, and foster an enviroment of trust and respect
• development of team charter/behavioural standards • engagement of people-focused line leaders • promoting the uptake of the Employee Assistance Program.
Figure 10: Airservices Attributed LOS
ANS Operational Safety Reporting and Performance – Long-term Trends
17 Version 1: 26 July 2019
Figure 11: Airservices Attributed LOS by Risk Severity
Figure 12: Airservices Attributed LOS by Required Risk Response
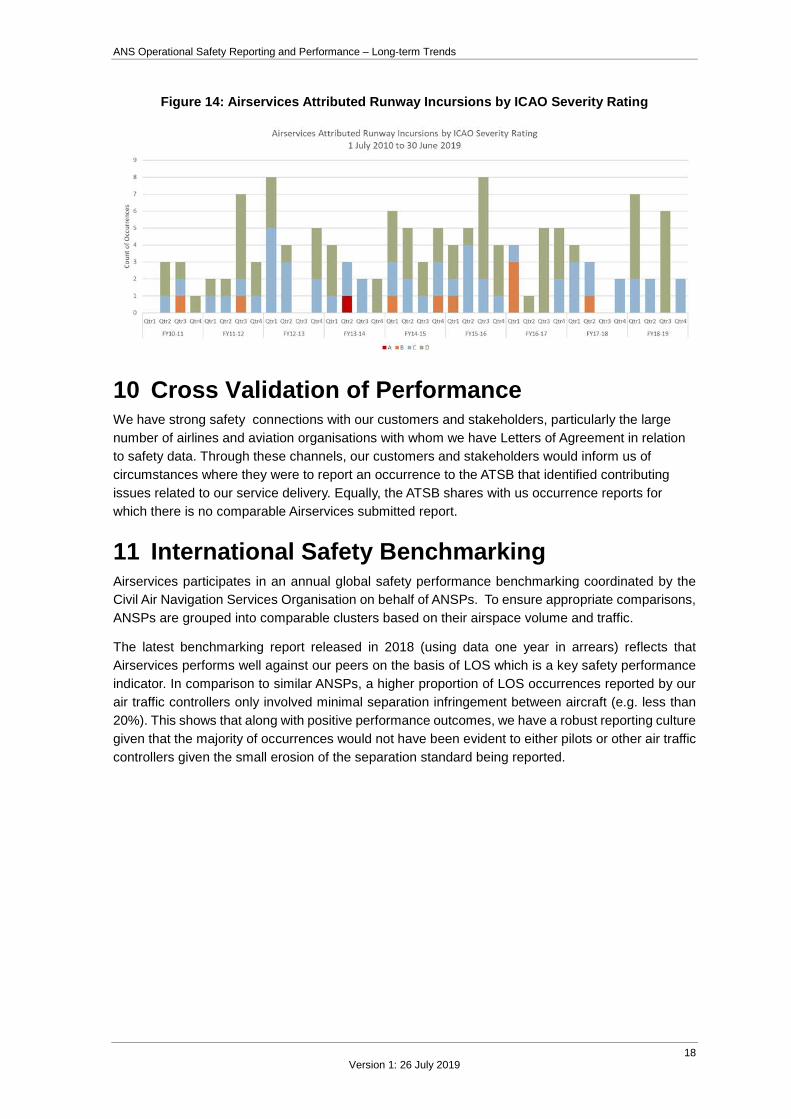
Figures 13 and 14 present long term trends relating to Runway Incursions. As demonstrated, the vast proportion of Runway Incursions are attributed to other parties than Airservices. The severity of occurrences attributed to Airservices when classified by the International Civil Aviation Organisation (ICAO) assessment scheme are low.
Figure 13: Airservices Attributed Runway Incursions by Attribution
ANS Operational Safety Reporting and Performance – Long-term Trends
18 Version 1: 26 July 2019
Figure 14: Airservices Attributed Runway Incursions by ICAO Severity Rating
10 Cross Validation of Performance We have strong safety connections with our customers and stakeholders, particularly the large number of airlines and aviation organisations with whom we have Letters of Agreement in relation to safety data. Through these channels, our customers and stakeholders would inform us of circumstances where they were to report an occurrence to the ATSB that identified contributing issues related to our service delivery. Equally, the ATSB shares with us occurrence reports for which there is no comparable Airservices submitted report.
11 International Safety Benchmarking Airservices participates in an annual global safety performance benchmarking coordinated by the Civil Air Navigation Services Organisation on behalf of ANSPs. To ensure appropriate comparisons, ANSPs are grouped into comparable clusters based on their airspace volume and traffic.
The latest benchmarking report released in 2018 (using data one year in arrears) reflects that Airservices performs well against our peers on the basis of LOS which is a key safety performance indicator. In comparison to similar ANSPs, a higher proportion of LOS occurrences reported by our air traffic controllers only involved minimal separation infringement between aircraft (e.g. less than 20%). This shows that along with positive performance outcomes, we have a robust reporting culture given that the majority of occurrences would not have been evident to either pilots or other air traffic controllers given the small erosion of the separation standard being reported.
Unclassified ANS Safety Reporting and Performance – Long-term Trends
19 Version 1: 26 July 2019
Appendix 1 - Airservices Just Culture Approach
Unclassified ANS Safety Reporting and Performance – Long-term Trends
20 Version 1: 26 July 2019
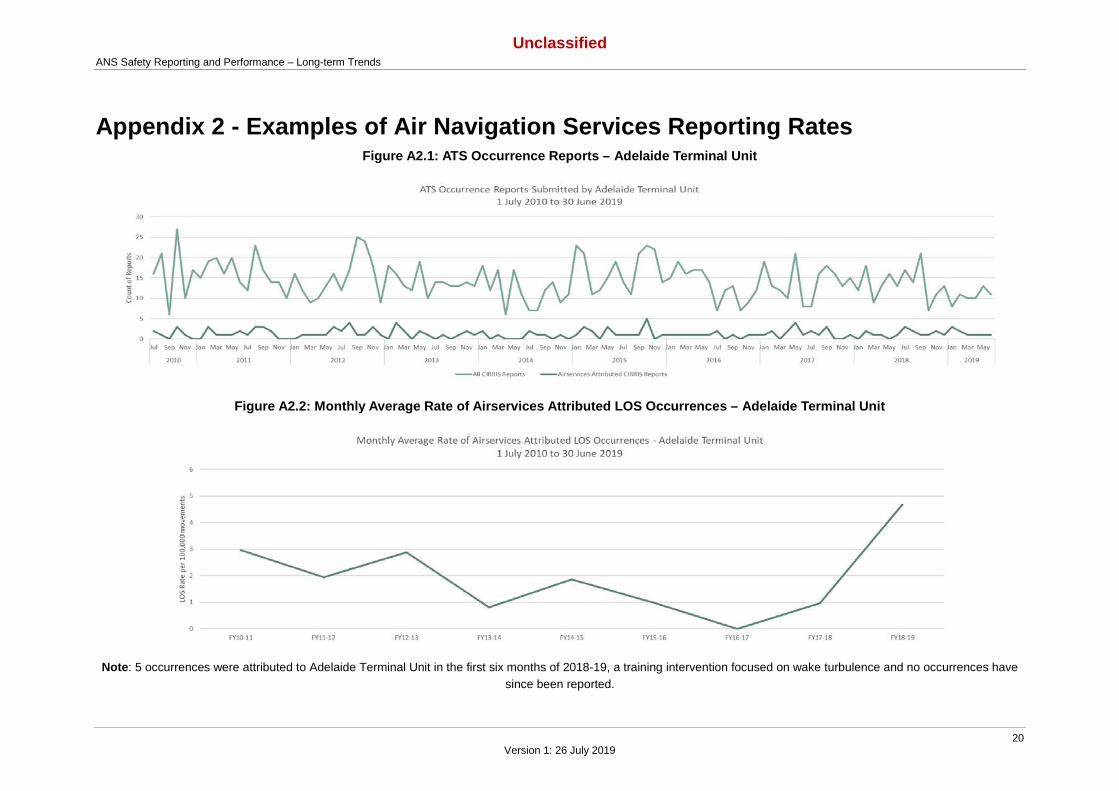
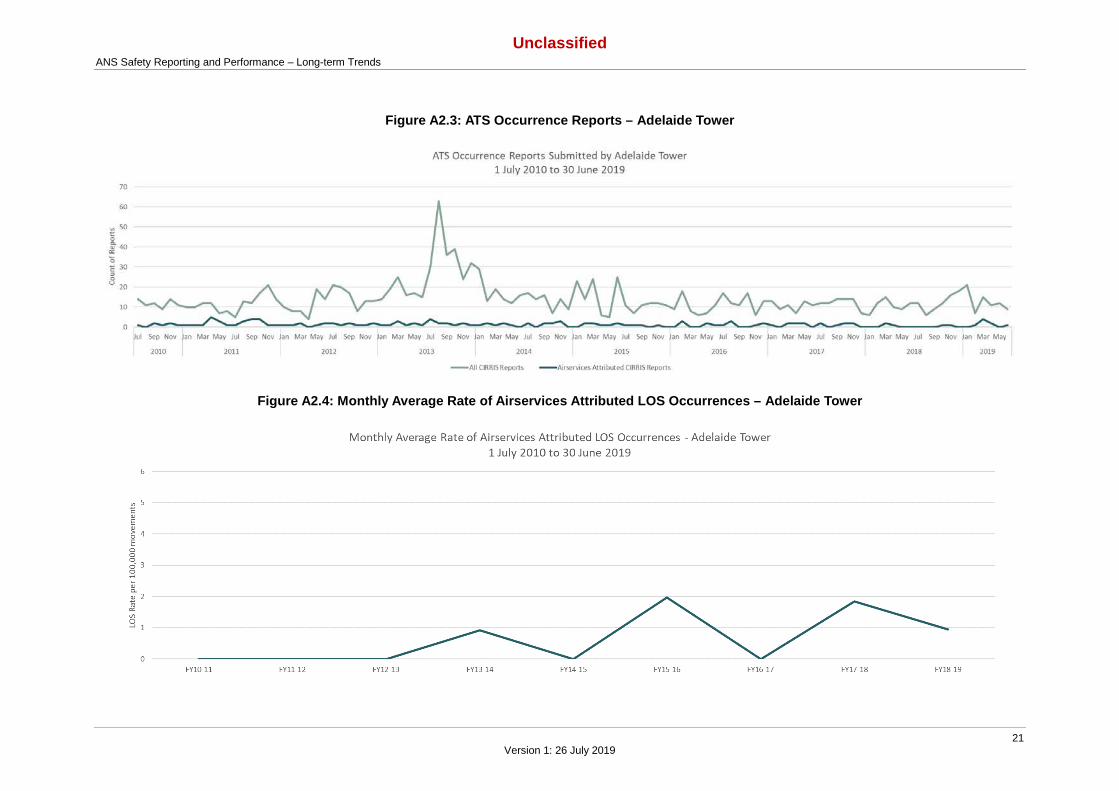
Appendix 2 - Examples of Air Navigation Services Reporting Rates Figure A2.1: ATS Occurrence Reports – Adelaide Terminal Unit
Figure A2.2: Monthly Average Rate of Airservices Attributed LOS Occurrences – Adelaide Terminal Unit
Note: 5 occurrences were attributed to Adelaide Terminal Unit in the first six months of 2018-19, a training intervention focused on wake turbulence and no occurrences have since been reported.
Unclassified ANS Safety Reporting and Performance – Long-term Trends
21 Version 1: 26 July 2019
Figure A2.3: ATS Occurrence Reports – Adelaide Tower
Figure A2.4: Monthly Average Rate of Airservices Attributed LOS Occurrences – Adelaide Tower
Unclassified ANS Safety Reporting and Performance – Long-term Trends
22 Version 1: 26 July 2019
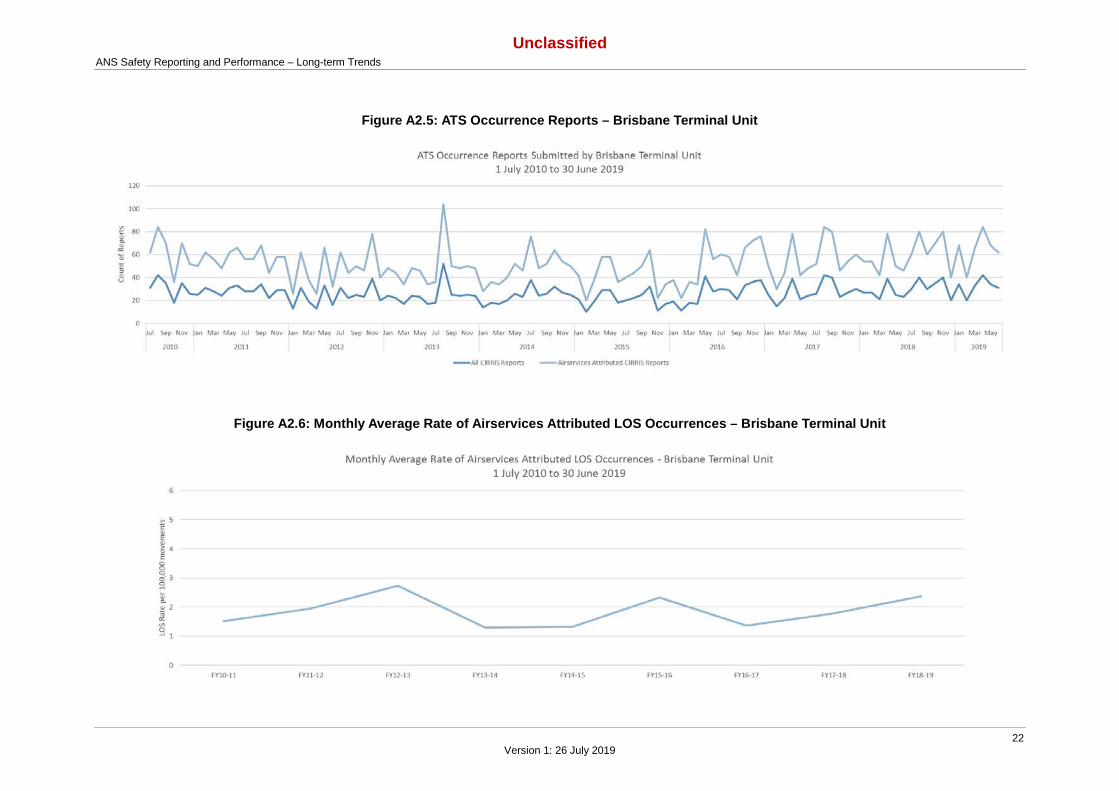
Figure A2.5: ATS Occurrence Reports – Brisbane Terminal Unit
Figure A2.6: Monthly Average Rate of Airservices Attributed LOS Occurrences – Brisbane Terminal Unit
Unclassified ANS Safety Reporting and Performance – Long-term Trends
23 Version 1: 26 July 2019
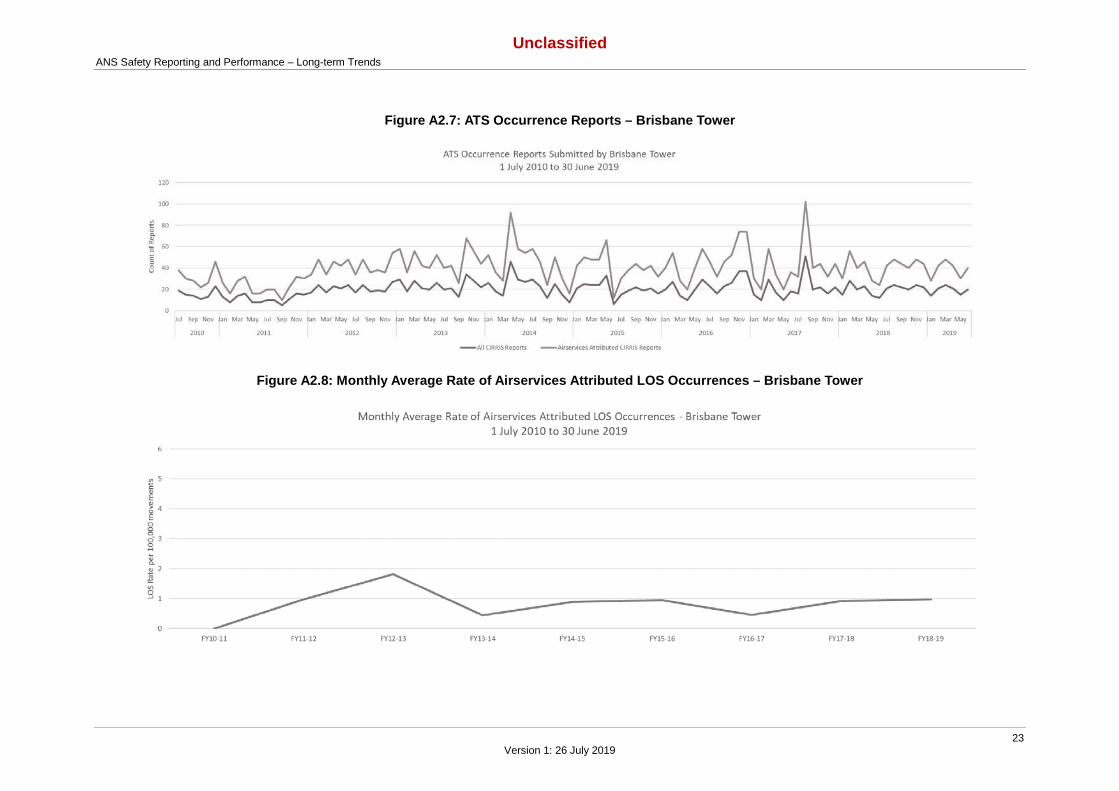
Figure A2.7: ATS Occurrence Reports – Brisbane Tower
Figure A2.8: Monthly Average Rate of Airservices Attributed LOS Occurrences – Brisbane Tower
Unclassified ANS Safety Reporting and Performance – Long-term Trends
24 Version 1: 26 July 2019
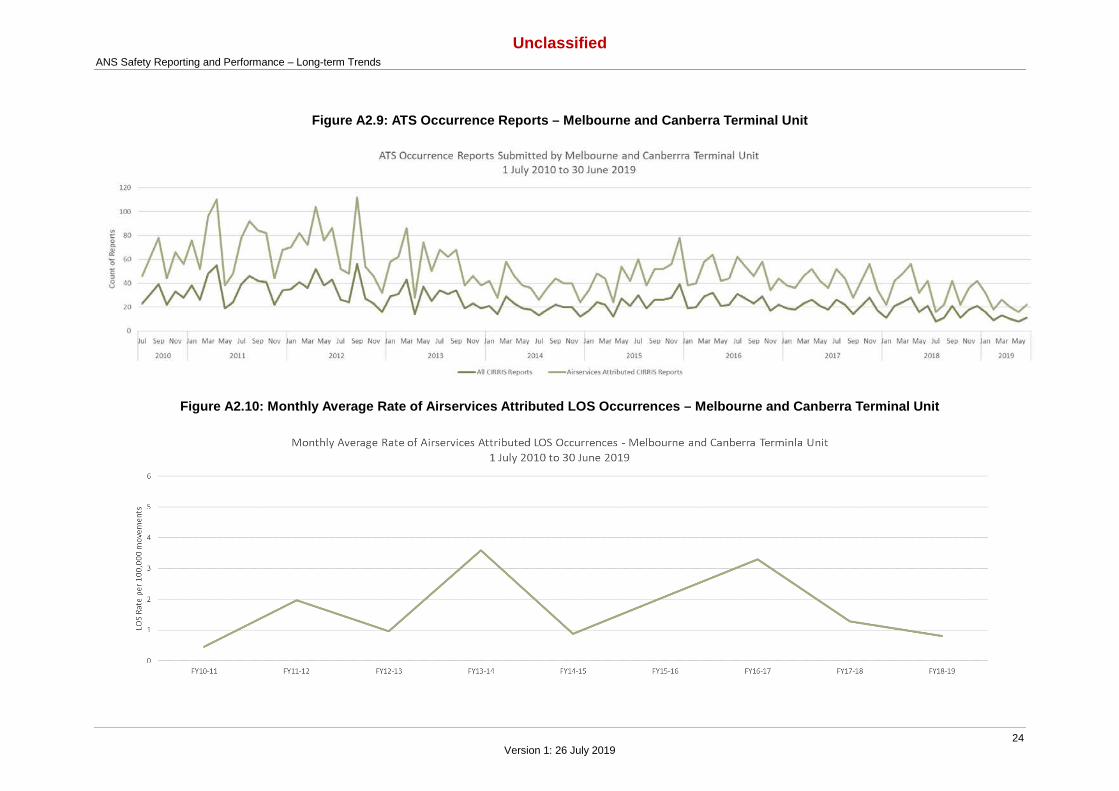
Figure A2.9: ATS Occurrence Reports – Melbourne and Canberra Terminal Unit
Figure A2.10: Monthly Average Rate of Airservices Attributed LOS Occurrences – Melbourne and Canberra Terminal Unit
Unclassified ANS Safety Reporting and Performance – Long-term Trends
25 Version 1: 26 July 2019
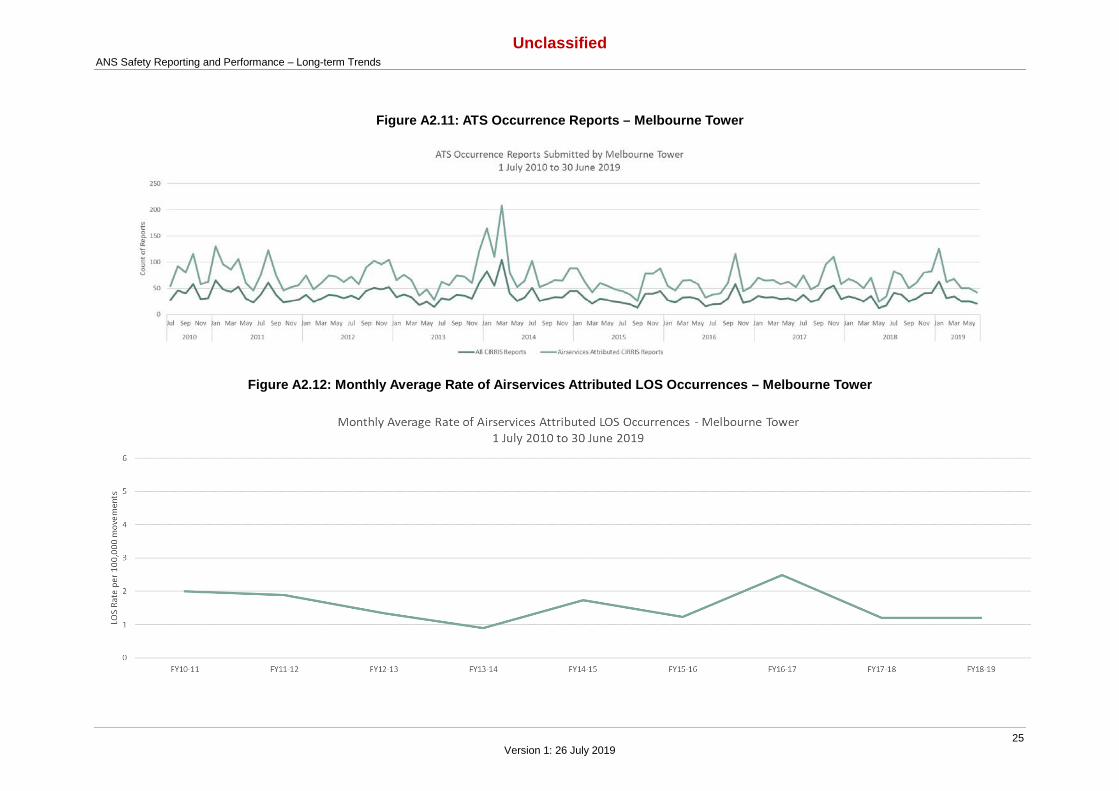
Figure A2.11: ATS Occurrence Reports – Melbourne Tower
Figure A2.12: Monthly Average Rate of Airservices Attributed LOS Occurrences – Melbourne Tower
Unclassified ANS Safety Reporting and Performance – Long-term Trends
26 Version 1: 26 July 2019
Figure A2.13: ATS Occurrence Reports – Sydney Terminal Unit
Figure A2.14: Monthly Average Rate of Airservices Attributed LOS Occurrences – Sydney Terminal Unit
Unclassified ANS Safety Reporting and Performance – Long-term Trends
27 Version 1: 26 July 2019
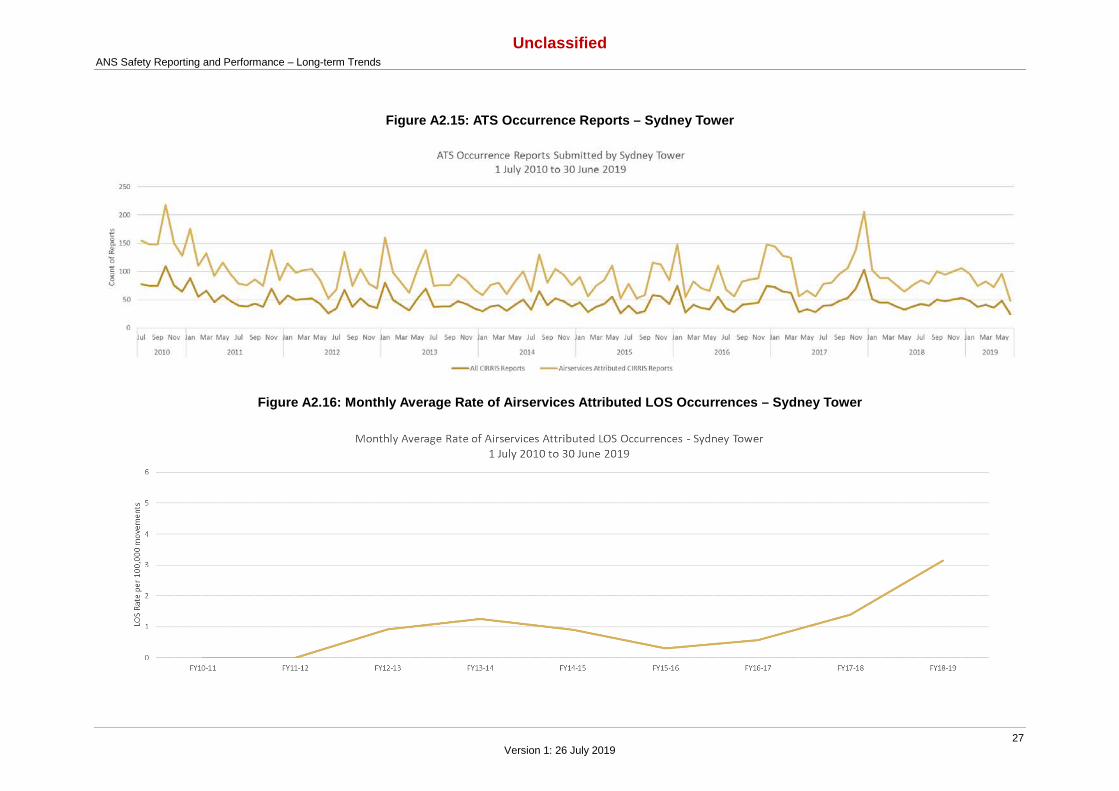
Figure A2.15: ATS Occurrence Reports – Sydney Tower
Figure A2.16: Monthly Average Rate of Airservices Attributed LOS Occurrences – Sydney Tower
Unclassified ANS Safety Reporting and Performance – Long-term Trends
28 Version 1: 26 July 2019
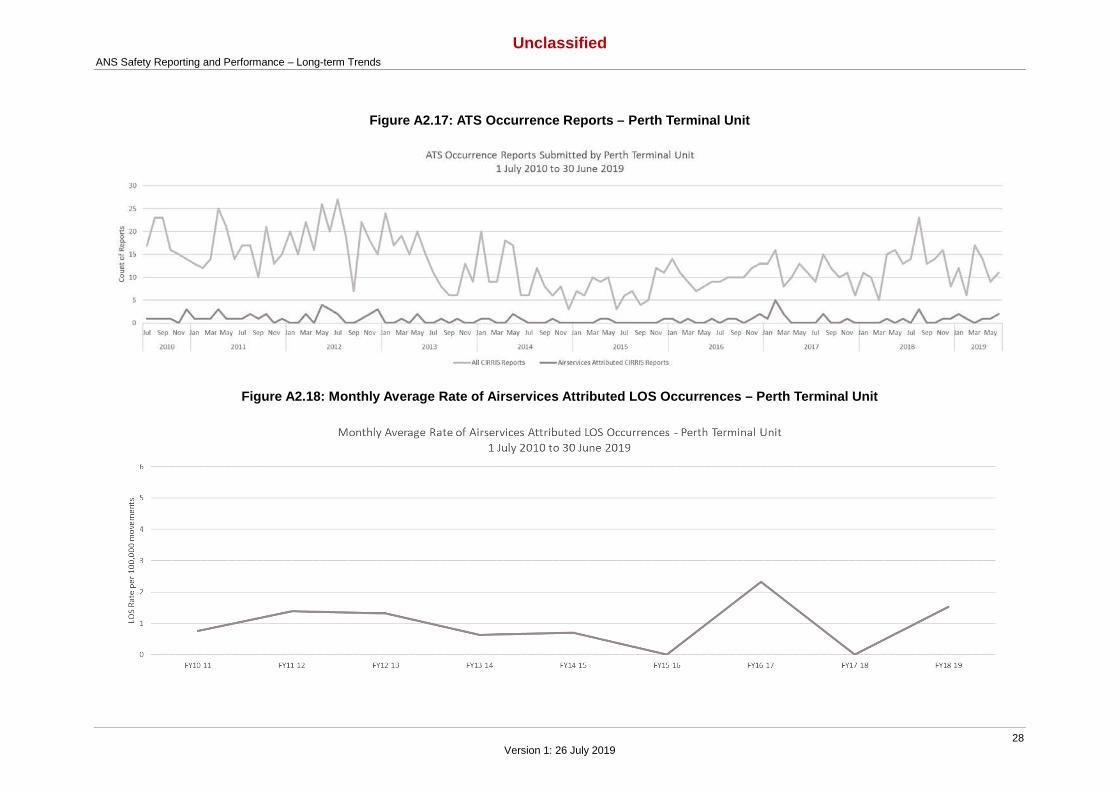
Figure A2.17: ATS Occurrence Reports – Perth Terminal Unit
Figure A2.18: Monthly Average Rate of Airservices Attributed LOS Occurrences – Perth Terminal Unit
Unclassified ANS Safety Reporting and Performance – Long-term Trends
29 Version 1: 26 July 2019
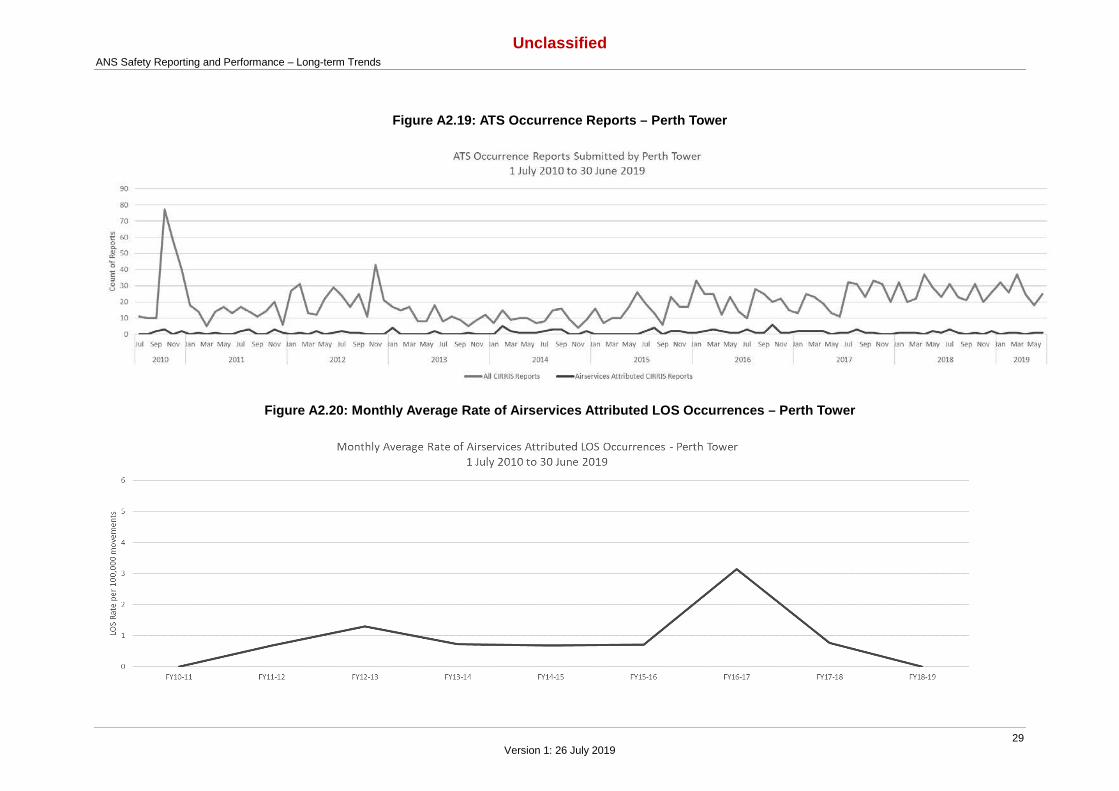
Figure A2.19: ATS Occurrence Reports – Perth Tower
Figure A2.20: Monthly Average Rate of Airservices Attributed LOS Occurrences – Perth Tower