Embed Size (px)
Citation preview

Air emission accounts and the link to energy accounts
17-20 December, Almaty Kazakhstan
Niels Schoenaker, Statistics Netherlands
Content
• Why compile air emission accounts ?
• What are the air emission accounts ?
• What is the scope of these accounts ?
• How to compile air emission accounts? (e.g. energy-approach)
• What data sources do you need ?
• What can you do with the air emission accounts ?
• Air emission accounts in the Netherlands
• Exercise
3
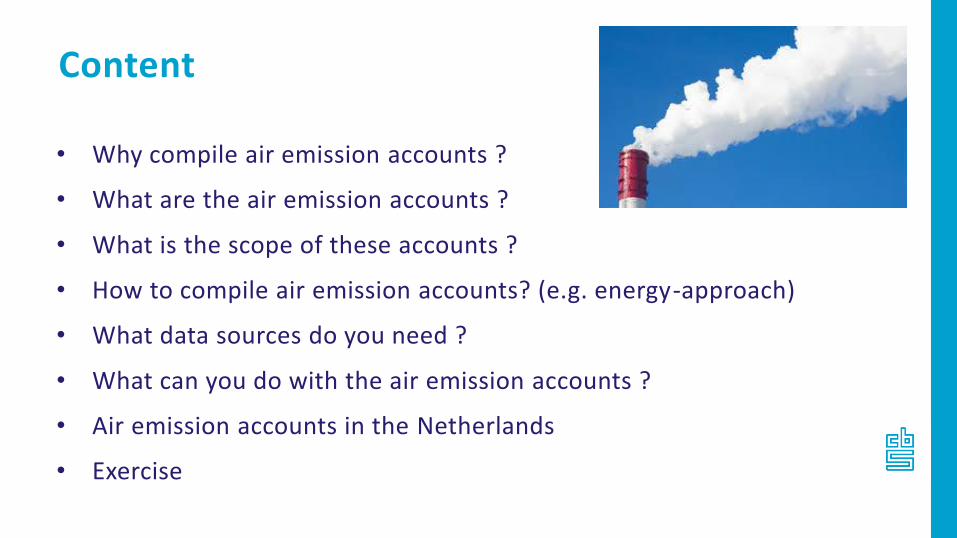
In the news

Concentrations of pollutants in the air
Emissions (flows) of pollutants to the air
Air quality versus emissions to air
Statistics on air quality
Air emissionstatistics and
accounts

Contribute to to global warmingCarbon dioxide (CO2), Methane (CH4)
Dinitrogen Oxide (or Nitrous Oxide) (N2O)
Sulphur hexaflouride (SF6)
Negative effects on ecosystems and human healthSulphur Dioxide (SO2)
Nitrogen Oxides (NOx)
Particulate Matter (PM10 and PM2.5)
Ammonia (NH3)
Policies to manage air emissions need reliable data on amounts produced and who releases them (and where).
Why are air emissions important?
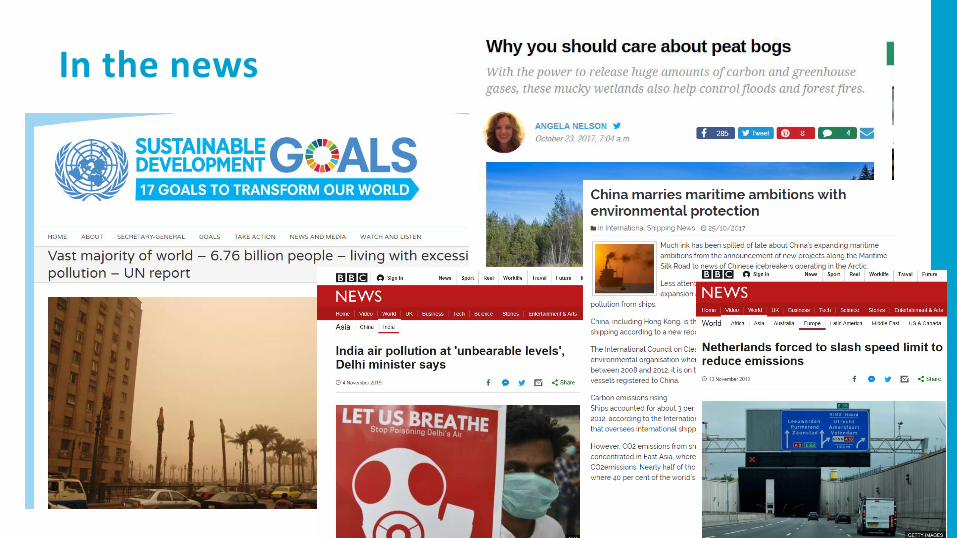
Air emissions and SDGs
• A statistical framework to organise data on air emissions
• Provides information on emissions released to the atmosphere by establishments and households as a result of production, consumption and accumulation processes
• Part of the SEEA Central Framework
• Allows monitoring of emissions and can be used as input for all kind of environmental-economic policies
• Implemented wordwide (in Europe: legal base)
What are the air emission accounts ?

Air emission accountWho releases them? Where do they go?Which pollutants?

• Record all anthropogenic emissions
• Emissions from economic activities (production, consumption) → consistent with data of the nationalaccounts
• Production activities classified by ISIC
• (For greenhouse gases) different from IPCC emissions
Air emission accounts – key characteristics

Economic boundary with respect to air emissions
Some air emissions will occur when economic units undertake
activity in other countries.
Consistent with the general definition of the economic
boundary using the concept of residence, air emissions
accounts for a nation will exclude emissions released within a
national territory by non-residents (such as tourists and foreign
transportation operations), whereas the emissions abroad of
resident economic units will be included.

Territory vs residence principle
Residents Non-residents
National territory
Emissions on territory by resident units
Emissions on territory by non-residents
(foreign, tourists, transport companies, embassies)
Rest of the world
Emissions by residents operating abroad (tourists, transport,
companies etc.)
Emissions statistics (IPCC)
SEEA air emissions accounts

• All emissions from combustion
• All emissions from waste incineration
• All emissions from conversion processes
• Emissions from lifestock, manure
• Emissions from landfills
What is included ?

13
What is excluded ?
Flows of air emissions within the environment are not in the scope for the accounts:• Transboundary flows of air emissions
• Capture of gases by the environment, for example, carbon captured in forests and soil
• Emissions such as unintended forest and grassland fires and human metabolic processes which are not the direct result of economic production
• Secondary emissions (when substances combine to create new substances in the environment)
IPCC versus air emission accounts
The IPCC (Intergovernmental Panel on Climate Change) has drawn up specific
guidelines to estimate and report on national inventories of anthropogenic
greenhouse gas emissions and removals
Differences between air emission accounts and IPCC totals
• Adjustment for the residence principle: air emission accounts follow the residence
principle whereas national emission inventories follow a territory principle.
• National totals are defined differently in national emission inventories regarding
international transport, e.g. emissions from international air transport are excluded
in UNFCCC inventory totals whereas they are partly included in national inventory
totals.
• Short cyclic CO2 is excluded from the IPCC totals

Bridge table
Compilation of the air emission accounts

Compilation
Two approaches:
1. Energy-first-Approach:
→ Compile Energy Accounts using energy balance / energy statistics
→ Compile net energy use accounts for air emissions
→ Calculate emissions: Emission = Fuel use * emission factor (by fuel type)
2. Inventory first approach:
→ Use data from national inventory plus auxiliary data
Or use and combine both and confront …

Emission types1. Emissions from combustion
Combustion of fossil fuels for final demand
Combustion of fossil fuels for production of electricity or heat
Combustion of biomass (short cyclic)
2. Emissions from conversion processes (non-combustion)
Conversion from fossil fuels (e.g. chemical processing)
Conversion from non-fossil fuels (e.g. biofuels)
3. Other emissions
E.g. methane emissions from livestock and landfills,
or emissions of particulate matter caused by braking of cars
Can be derived from the energy accounts
Two main compilation issues
1. Correcting for the residence principle
→ Adjustments for international transport
2. Assigning emissions to industry (NACE/ISIC)
→ Assigning emissions to industry and households

Data sources
• Existing energy accounts, energy balances and statistics
• Existing emissions inventories (e.g. IPCC reporting)
→ If none, create an energy account, first!
• Auxiliary statistics
• Economic statistics, waste statistics, traffic statistics, etc.
• Surveys
• Only if necessary (e.g. to fill in gaps on household use of fuelwood)
• Exploit financial and administrative data first!
• Administrative data
• Expenditures on fuel (by type), consumption of fuel
• Conversion factors (by type of fuel)
• Use “best” national factors or international data
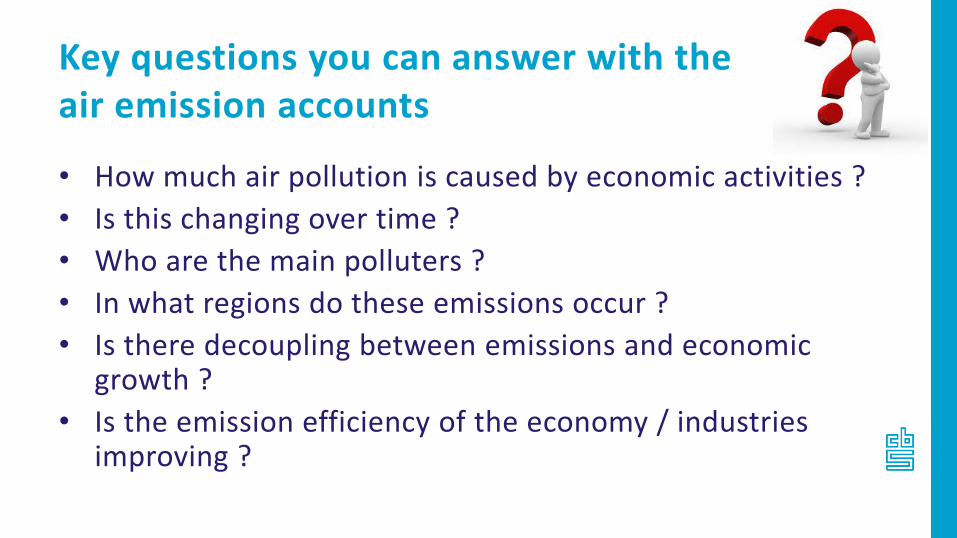
• How much air pollution is caused by economic activities ?
• Is this changing over time ?
• Who are the main polluters ?
• In what regions do these emissions occur ?
• Is there decoupling between emissions and economic growth ?
• Is the emission efficiency of the economy / industries improving ?
Key questions you can answer with theair emission accounts

Air emissions in the Netherlands

• Compiled annually by Statistics Netherlands
• Data reported to Eurostat (legal base)
• Time series 1990-2018
• 64 industries plus households
• Also data on quarterly basis
• Used a.o. for decomposition and footprint analysis
Example: air emission accounts in theNetherlands

Organisational setting
EnvironmentalStatistics
SEEA System of Environmental-
Economic Accounting
Emission Register (70 experts from 10 institutes, including
Statistics Netherlands)
Statistics Netherlands (CBS)
Dissemination
➢ Official statistics
at www.cbs.nl
➢ Emission data
at www.prtr.nl
➢ Policy indicators at Environmental Data Compendium, e.g., www.compendiumvoordeleefomgeving.nl/indicatoren/en0165-Greenhouse-gas-emissions.html?i=41-205

Compilation of air emission accounts in the Netherlands
Emissioninventory Air emission
accounts
Emission activities
AgricultureIndustryConstruction…Households
Other data (transport, SNA etc.)
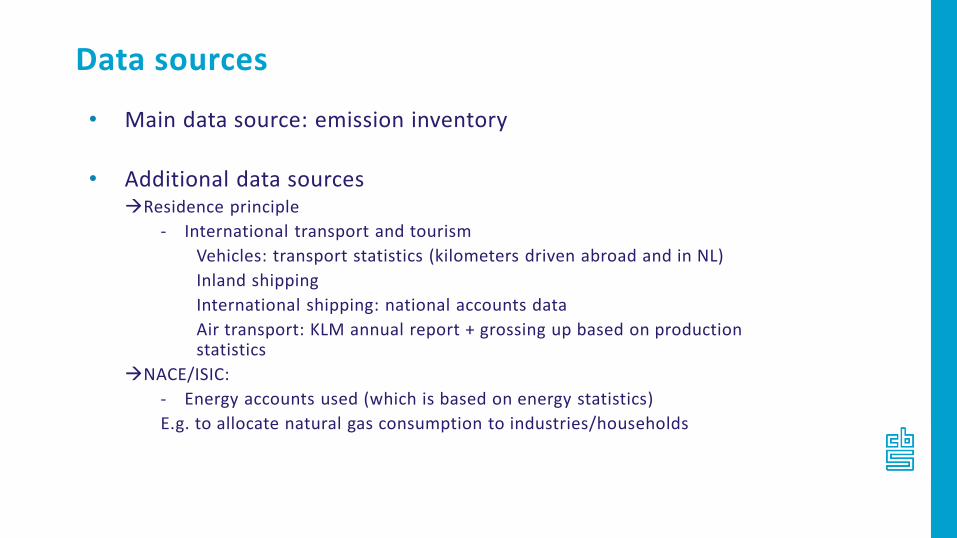
Data sources
• Main data source: emission inventory
• Additional data sources→Residence principle
- International transport and tourism
Vehicles: transport statistics (kilometers driven abroad and in NL)
Inland shipping
International shipping: national accounts data
Air transport: KLM annual report + grossing up based on productionstatistics
→NACE/ISIC:
- Energy accounts used (which is based on energy statistics)
E.g. to allocate natural gas consumption to industries/households

Dutch air emission account (2018)
http://opendata.cbs.nl/statline/#/CBS/en/dataset/83300ENG/table?ts=1574322437892

Decoupling air emissions and GDP
0
20
40
60
80
100
120
140
160
180
19
95
19
96
19
97
19
98
19
99
20
00
20
01
20
02
20
03
20
04
20
05
20
06
20
07
20
08
20
09
20
10
20
11
20
12
20
13
20
14
20
15
20
16
20
17
20
18
*
CO2 CH4 Greenhouse gases NOx PM10 GDP

Air emissions by sector
0%
10%
20%
30%
40%
50%
60%
70%
80%
90%
100%
CO2 Greenhouse gases NOx NH3 PM10 value added
Agriculture, fishing Mining and manufactering energy supply, waste services
Construction Transport other services
Households
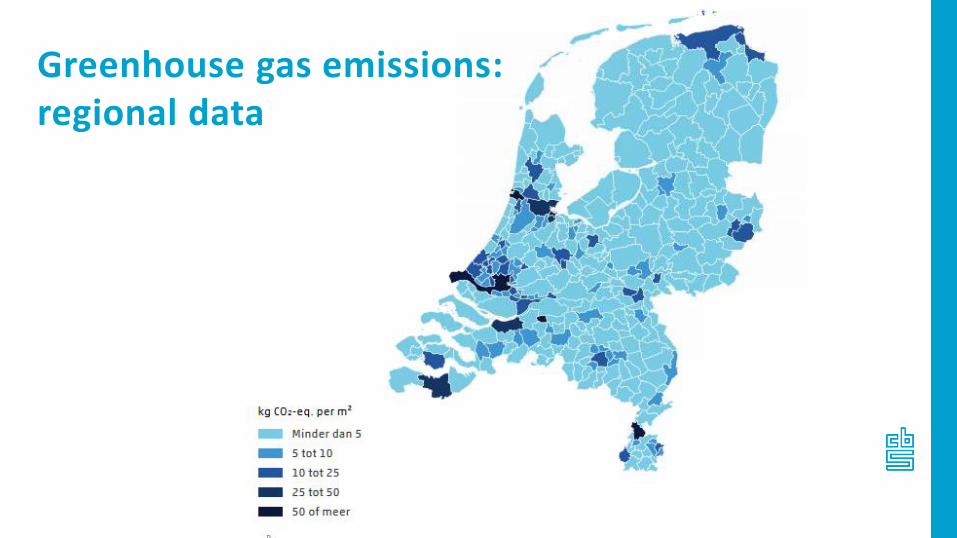
Greenhouse gas emissions: regional data
31
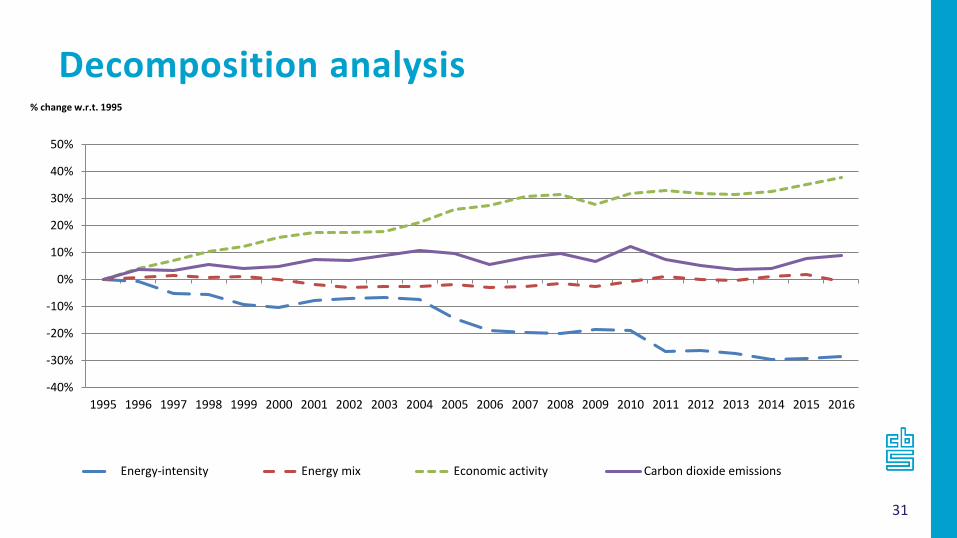
Decomposition analysis
-40%
-30%
-20%
-10%
0%
10%
20%
30%
40%
50%
1995 1996 1997 1998 1999 2000 2001 2002 2003 2004 2005 2006 2007 2008 2009 2010 2011 2012 2013 2014 2015 2016
% change w.r.t. 1995
Energy-intensity Energy mix Economic activity Carbon dioxide emissions

Detailed guidance
EuroStat Manual for Air Emissions Accounts uses SEEA principles
4. Level 2

33
Thank you. Any questions?