Embed Size (px)
Citation preview

Air Dispersion Modelling Report
Issue date: 03 May 2018
Grange BackUp Power Ltd Grange Castle Power Plant IE0311313-22-RP-0005, Issue: B
For
insp
ectio
n pur
pose
s only
.
Conse
nt of
copy
right
owne
r req
uired
for a
ny ot
her u
se.
EPA Export 04-07-2018:03:41:54

Formal Issue
Document Sign Off
Air Dispersion Modelling Report
Grange BackUp Power Ltd Grange Castle Power Plant IE0311313-22-RP-0005, Issue B
File No: IE0311313.22.160
CURRENT ISSUE
Issue No: B Date: 03/05/18 Reason for issue: For EPA Submission
Sign Off Originator Checker Reviewer Approver Customer Approval (if required)
Print Name Darragh O’Brien Paul O’Sullivan
Paul O’Sullivan
Signature Authorised Electronically
Date 03/05/2018 03/05/2018 03/05/2018
PREVIOUS ISSUES
Issue No
Date Originator Checker Reviewer Approver Customer Reason for issue
A 19/02/18 Paul O’Sullivan
Orla Duggan Paul O’Sullivan
For EPA Submission
For
insp
ectio
n pur
pose
s only
.
Conse
nt of
copy
right
owne
r req
uired
for a
ny ot
her u
se.
EPA Export 04-07-2018:03:41:54
Grange BackUp Power Ltd Grange Castle Power Plant
IE0311313-22-RP-0005, Issue B 03/05/2018
IE0311313-22-RP-0005_B_01.DOCX Page 3 of 22 Formal Issue
Contents
Executive Summary 4
1 Introduction 5
2 Air Quality Standards 6
3 Existing Environment 7
3.1 Air Quality Zones 7
3.2 Ambient Air Quality 7
4 Air Dispersion Modelling 8
4.1 Dispersion Model 8
4.2 Meteorological Data 8
4.3 Building Downwash 8
4.4 Receptors 8
4.5 Terrain Data 9
4.6 Model Input Data 11
5 Modelling Results and Discussion 13
5.1 Modelling Results 13
5.2 Discussion of Modelling Results 13
Appendix A 16
Air Dispersion Modelling Contour Plots 16
For
insp
ectio
n pur
pose
s only
.
Conse
nt of
copy
right
owne
r req
uired
for a
ny ot
her u
se.
EPA Export 04-07-2018:03:41:54

Grange BackUp Power Ltd Grange Castle Power Plant
IE0311313-22-RP-0005, Issue B 03/05/2018
IE0311313-22-RP-0005_B_01.DOCX Page 4 of 22 Formal Issue
Executive Summary
PM Group has carried out an air dispersion modelling exercise to determine the potential cumulative air quality impacts associated with the operation of the proposed Grange Backup Power Ltd. facility, with the operation of the existing Takeda Ireland Ltd. and Pfizer sites, all located in Grange Castle Business Park, Clondalkin, Dublin 22, following a Request for Information issued by the Environmental Protection Agency to an application by Grange Backup Power Ltd. to review its Industrial Emissions Licence (Reg. Ref. P1033-02). This report has been updated at the request of the EPA to incorporate licensed emission limits from the TIL and Pfizer sites instead of actual emission data taken from both facilities’ Annual Environmental Reports (AERs) which was modelled previously and reported on in Issue A of this report. Sulphur oxides are now included in the model as they are a licensed emission from the Pfizer facility
During the operational phase of the proposed power plant, the emission points within the Grange Backup Power Ltd. site will consist of 6 no. stacks from the 6 no. Wärtsilä 18V50DF
1 engines
included in the facility. The 6 no. stacks will be combined into 2 no. pseudo stacks located to the north of the main building on site – both with 3 no. stacks each.
Emissions to the atmosphere from the proposed power plant include Nitrogen Oxides, Sulphur Oxides, Particulate Matter and Carbon Monoxide. A review of the most recent Pollutant Release and Transfer Registers for Takeda Ireland Ltd. and Pfizer was carried out to determine which of the above pollutants are also emitted from these facilities. This review concluded that both facilities emit oxides of nitrogen and particulate matter to atmosphere and Pfizer also emits oxides of sulphur; therefore the cumulative impact assessment has been carried out on these pollutants only.
Information on the emissions from the Takeda Ireland Ltd. and Pfizer facilities was taken from publicly available information submitted to the Environmental Protection Agency and to South Dublin County Council as well as information contained in their licenses, also available on the Environmental Protection Agency website.
The aim of the modelling was to determine whether or not the emissions from the gas engines on-site will result in a contravention of the applicable Irish Air Quality Standards and Environmental Assessment Levels. The assessment was carried out using the air dispersion modelling software AERMOD Version 8.0 and the modelling has been carried out in accordance with the Environmental Protection Agency guidance document Air Dispersion Modelling from Industrial Installations Guidance Note (AG4) (2010). All calculations are based on 5 years of meteorological data (2008 to 2012), which was collected at the Casement Aerodrome Meteorological Station. This is the nearest meteorological station, and is considered to be representative of the meteorological conditions experienced at the site.
Predicted environmental concentrations were calculated for Nitrogen Oxides, Sulphur Oxides and Particulate Matter by adding existing Environmental Protection Agency ambient background concentration data to the maximum predicted ground level concentrations from the model. This methodology ensures that both the modelled emissions and the existing background concentrations are taken into account when assessing the overall impact on ambient air quality. The calculated predicted environmental concentrations have then been compared against the relevant Air Quality Standards for Nitrogen Oxides, Sulphur Oxides and Particulate Matter.
The modelling results indicate that the predicted environmental concentrations of the modelled pollutants will not result in a contravention of the applicable Air Quality Standards and therefore will not result in any significant impact to the environment or human health.
1 The air, noise and water emissions associated with the Wärtsilä engine has been used for the licence review
application to the EPA but ultimately the decision on the final gas engine supplier will be subject to commercial agreement. This will comply with all conditions and emission limit values set out in the Industrial Emissions Licence.
For
insp
ectio
n pur
pose
s only
.
Conse
nt of
copy
right
owne
r req
uired
for a
ny ot
her u
se.
EPA Export 04-07-2018:03:41:54

Grange BackUp Power Ltd Grange Castle Power Plant
IE0311313-22-RP-0005, Issue B 03/05/2018
IE0311313-22-RP-0005_B_01.DOCX Page 5 of 22 Formal Issue
1 Introduction
This report has been prepared for the purpose of assessing the potential cumulative air quality impacts associated with the operation of the proposed Grange Backup Power Ltd. (GBPL) facility, with the operation of the existing Takeda Ireland Ltd. (TIL) and Pfizer sites, all located in Grange Castle Business Park, Clondalkin, Dublin 22, following a Request for Information (RFI) issued by the Environmental Protection Agency (EPA) to an application by GBPL to review its Industrial Emissions Licence (Reg. Ref. P1033-02). This report has been updated at the request of the EPA to incorporate licensed emission limits from the TIL and Pfizer sites instead of actual emission data taken from both facilities’ Annual Environmental Reports (AERs) which was modelled previously and reported on in Issue A of this report. Sulphur oxides are now included in the model as they are a licensed emission from the Pfizer facility
The purpose of the modelling is to determine whether or not the emissions from GBPL facility result in a contravention of the applicable Irish Air Quality Standards (AQSs) when considered cumulatively with the TIL and Pfizer facilities. The applicable AQSs are outlined in Section 2 of this report. The assessment was carried out using the air dispersion modelling software AERMOD Version 8.0 and the modelling has been carried out in accordance with the EPA guidance document Air Dispersion Modelling from Industrial Installations Guidance Note (AG4) (2010).
Emissions to the atmosphere from the proposed GBPL facility include oxides of nitrogen (NOx), oxides of sulphur (SOx), particulate matter (PM) and carbon monoxide (CO) which are addressed in the relevant air quality legislation (see Section 2). A review of the most recent Pollutant Release and Transfer Registers (PRTRs) for TIL and Pfizer was carried out to determine which of the above pollutants are also emitted from these facilities. This review concluded that both facilities emit NOx and PM to atmosphere and Pfizer also emits SOx, therefore the cumulative impact assessment has been carried out on these pollutants only. Carbon Monoxide is not emitted by either of the facilities and is thus excluded from the model. All calculations are based on 5 years of meteorological data (2008 to 2012), which was collected at the Casement Aerodrome Meteorological Station. This is the nearest meteorological station, and is considered to be representative of the meteorological conditions experienced at the site.
For in
spec
tion p
urpo
ses o
nly.
Conse
nt of
copy
right
owne
r req
uired
for a
ny ot
her u
se.
EPA Export 04-07-2018:03:41:54

Grange BackUp Power Ltd Grange Castle Power Plant
IE0311313-22-RP-0005, Issue B 03/05/2018
IE0311313-22-RP-0005_B_01.DOCX Page 6 of 22 Formal Issue
2 Air Quality Standards
Air Quality Standards (AQSs) for the protection of human health and the environment have been developed at European level and incorporated into Irish legislation. AQSs set limit values for Ground Level Concentrations (GLCs) of certain emissions for both short-term (e.g. hourly, daily) and long-term (e.g. annual) averages. Limit values are often expressed as percentiles e.g. 98 percentiles of mean hourly values which means that only 2% of the results obtained during the monitoring period can exceed the stated limit value.
The following relevant Air Quality Legislation applies in Ireland:
- Air Quality Standards Regulations 2011 (S.I. No. 180/2011) which implement EU Directive 2008/50/EC on ambient air quality and cleaner air for Europe. This Directive merges most of the existing directives (Directives 96/62/EC, 1999/30/EC, 2000/69/EC and 2002/3/EC) into a single directive. The regulations set ambient air quality limit values for sulphur dioxide, nitrogen dioxide and oxides of nitrogen, benzene, lead, ozone, and particulate matter (PM10/ PM2.5).
The relevant air quality standards for this air quality assessment are detailed in Table 2.1.
Table 2.1: Air Quality Standard (AQS) Limit Values
Pollutant AQS (µg/m3) Source of AQS Value
Oxides of Nitrogen (NO2/NOx)
NO2 99.8th
Percentile hourly 200 EU Directive 2008/50/EC / S.I. 180 of 2011
NO2 Annual (Protection of Human Health)
40 EU Directive 2008/50/EC / S.I. 180 of 2011
NOx Annual (Protection of Vegetation)
Note 1
30 EU Directive 2008/50/EC / S.I. 180 of 2011
Particulate Matter less than 10 µm (PM10)
PM10 90.4th Percentile Daily 50 EU Directive 2008/50/EC / S.I. 180 of 2011
PM10 Annual 40 EU Directive 2008/50/EC / S.I. 180 of 2011
Particulate Matter less than 2.5 µm (PM2.5)
PM2.5 Annual 25 EU Directive 2008/50/EC / S.I. 180 of 2011
Oxides of Sulphur (SO2/SOx)
SO2 99.7th
Percentile Hourly 350 EU Directive 2008/50/EC / S.I. 180 of 2011
SO2 99.2th
Percentile Daily 125 EU Directive 2008/50/EC / S.I. 180 of 2011
SO2 Annual (Protection of Vegetation)
Note 1
20 EU Directive 2008/50/EC / S.I. 180 of 2011
Note 1: The Regulations and Directive state that a sampling point targeted at the protection of vegetation and natural ecosystems shall be sited more than 20km from agglomerations or more than 5km away from other built-up areas, industrial installations or motorways or major roads with traffic counts of more than 50,000 vehicles per day, which means that a sampling point must be sited in such a way that air sampled is representative of air quality in a surrounding area of at least 1000 km
2. Therefore the annual NOx and SOx limits for the protection of vegetation would not directly apply to the area in
which the proposed development is located.
For
insp
ectio
n pur
pose
s only
.
Conse
nt of
copy
right
owne
r req
uired
for a
ny ot
her u
se.
EPA Export 04-07-2018:03:41:54

Grange BackUp Power Ltd Grange Castle Power Plant
IE0311313-22-RP-0005, Issue B 03/05/2018
IE0311313-22-RP-0005_B_01.DOCX Page 7 of 22 Formal Issue
3 Existing Environment
The existing environment has been described with reference to the most recently published EPA air quality monitoring data for Ireland
2.
3.1 Air Quality Zones
The EPA manages the national ambient air quality monitoring network.
The Air Framework Directive deals with each EU member state in terms of "Zones". The Air Quality Standards Regulations 2011 state “The Agency shall establish zones and agglomerations throughout the territory of the State for the purpose of air quality assessment and air quality management”. The zones and agglomerations are defined as follows:
- Agglomeration A: Dublin Conurbation
- Agglomeration B: Cork Conurbation
- Agglomeration C: Other large cities and towns comprising Galway, Limerick, Waterford, Clonmel, Kilkenny, Sligo, Drogheda, Wexford, Athlone, Ennis, Bray, Naas, Carlow, Tralee, Dundalk, Navan, Letterkenny, Celbridge, Newbridge, Mullingar, Balbriggan
- Agglomeration D: Rural Ireland, i.e. the remainder of the State excluding Agglomerations A, B and C.
3.2 Ambient Air Quality
The EPA monitors ambient air quality at a number of locations throughout Dublin (Agglomeration A). Annual mean ambient air quality data for 2016 for all the monitoring stations in Dublin is summarised in Table 3.1 for the pollutants of interest in the assessment.
Table 3.1: Annual Mean Ambient Air Quality Data for Monitoring Stations in Dublin (Agglomeration A) for 2016
Pollutant Parameter
2016 Range of Annual Mean Concentrations Reported at
Different Monitoring Stations (µg/m
3)
2016 Average Concentration for all Monitoring Stations
(µg/m3)
Hourly Nitrogen Dioxide (NO2) 16-37 23.7
Daily Particulate Matter (PM10) 11-18 13.5
Daily Particulate Matter (PM2.5) 7-10 8.6
Hourly Sulphur Dioxide (SO2) 0.2-2.4 1.2
2 EPA (2017). Air Quality in Ireland 2016 Key Indicators of Ambient Air Quality
For
insp
ectio
n pur
pose
s only
.
Conse
nt of
copy
right
owne
r req
uired
for a
ny ot
her u
se.
EPA Export 04-07-2018:03:41:54
Grange BackUp Power Ltd Grange Castle Power Plant
IE0311313-22-RP-0005, Issue B 03/05/2018
IE0311313-22-RP-0005_B_01.DOCX Page 8 of 22 Formal Issue
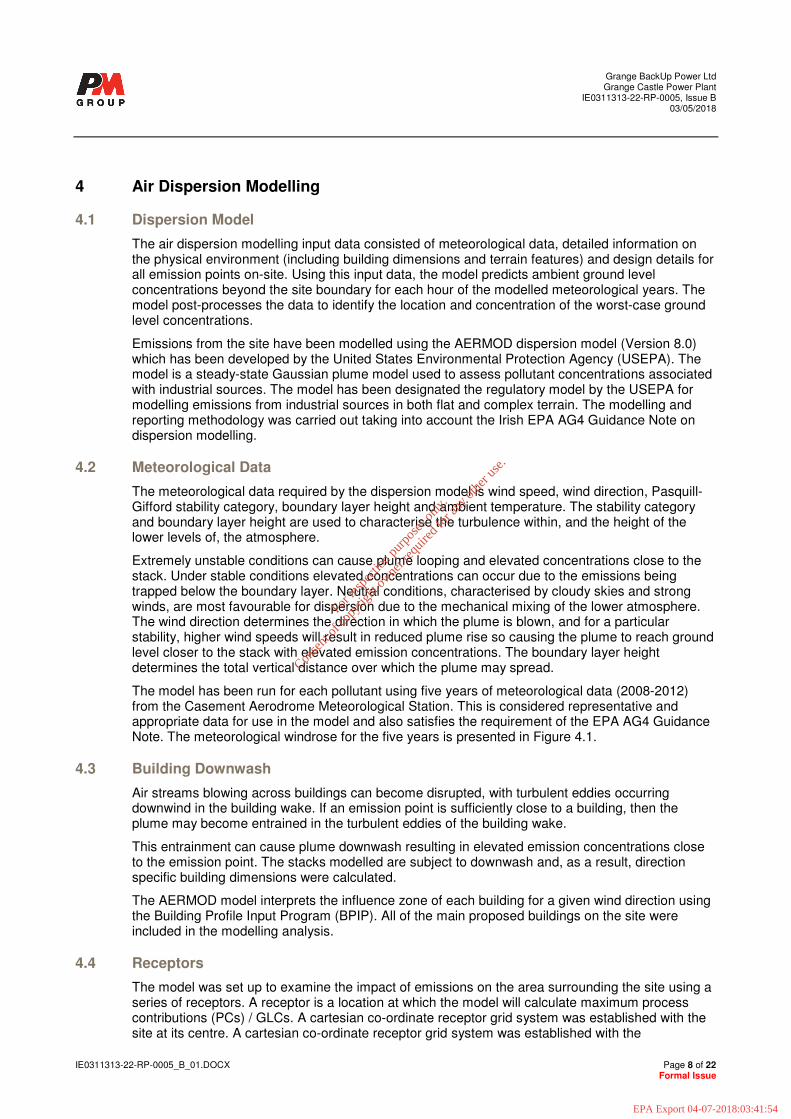
4 Air Dispersion Modelling
4.1 Dispersion Model
The air dispersion modelling input data consisted of meteorological data, detailed information on the physical environment (including building dimensions and terrain features) and design details for all emission points on-site. Using this input data, the model predicts ambient ground level concentrations beyond the site boundary for each hour of the modelled meteorological years. The model post-processes the data to identify the location and concentration of the worst-case ground level concentrations.
Emissions from the site have been modelled using the AERMOD dispersion model (Version 8.0) which has been developed by the United States Environmental Protection Agency (USEPA). The model is a steady-state Gaussian plume model used to assess pollutant concentrations associated with industrial sources. The model has been designated the regulatory model by the USEPA for modelling emissions from industrial sources in both flat and complex terrain. The modelling and reporting methodology was carried out taking into account the Irish EPA AG4 Guidance Note on dispersion modelling.
4.2 Meteorological Data
The meteorological data required by the dispersion model is wind speed, wind direction, Pasquill-Gifford stability category, boundary layer height and ambient temperature. The stability category and boundary layer height are used to characterise the turbulence within, and the height of the lower levels of, the atmosphere.
Extremely unstable conditions can cause plume looping and elevated concentrations close to the stack. Under stable conditions elevated concentrations can occur due to the emissions being trapped below the boundary layer. Neutral conditions, characterised by cloudy skies and strong winds, are most favourable for dispersion due to the mechanical mixing of the lower atmosphere. The wind direction determines the direction in which the plume is blown, and for a particular stability, higher wind speeds will result in reduced plume rise so causing the plume to reach ground level closer to the stack with elevated emission concentrations. The boundary layer height determines the total vertical distance over which the plume may spread.
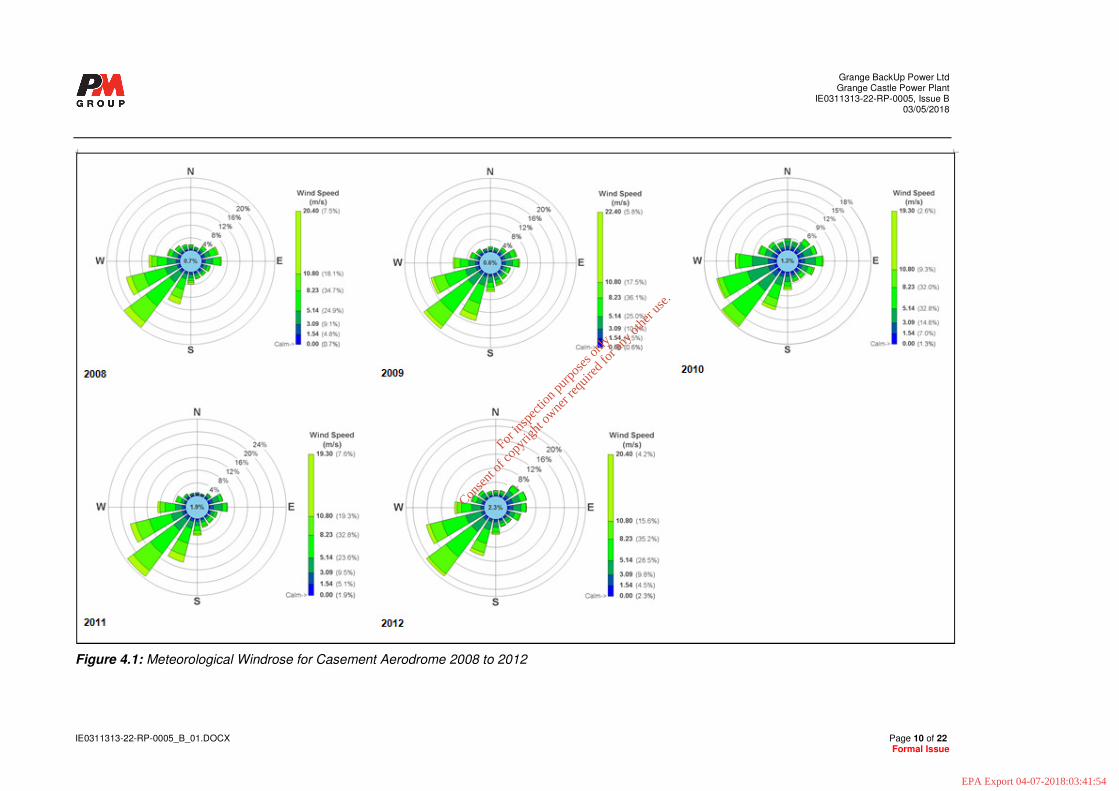
The model has been run for each pollutant using five years of meteorological data (2008-2012) from the Casement Aerodrome Meteorological Station. This is considered representative and appropriate data for use in the model and also satisfies the requirement of the EPA AG4 Guidance Note. The meteorological windrose for the five years is presented in Figure 4.1.
4.3 Building Downwash
Air streams blowing across buildings can become disrupted, with turbulent eddies occurring downwind in the building wake. If an emission point is sufficiently close to a building, then the plume may become entrained in the turbulent eddies of the building wake.
This entrainment can cause plume downwash resulting in elevated emission concentrations close to the emission point. The stacks modelled are subject to downwash and, as a result, direction specific building dimensions were calculated.
The AERMOD model interprets the influence zone of each building for a given wind direction using the Building Profile Input Program (BPIP). All of the main proposed buildings on the site were included in the modelling analysis.
4.4 Receptors
The model was set up to examine the impact of emissions on the area surrounding the site using a series of receptors. A receptor is a location at which the model will calculate maximum process contributions (PCs) / GLCs. A cartesian co-ordinate receptor grid system was established with the site at its centre. A cartesian co-ordinate receptor grid system was established with the
For
insp
ectio
n pur
pose
s only
.
Conse
nt of
copy
right
owne
r req
uired
for a
ny ot
her u
se.
EPA Export 04-07-2018:03:41:54

Grange BackUp Power Ltd Grange Castle Power Plant
IE0311313-22-RP-0005, Issue B 03/05/2018
IE0311313-22-RP-0005_B_01.DOCX Page 9 of 22 Formal Issue
development site at its centre. A nested grid with 3 receptor grids of varying resolution was established.
A 4km x 4km grid with receptors at 100m spacings was created with the development site at its centre. Around this, a coarser 10km x 10km grid with 500m receptor spacings was created. A third 20km x 20km grid with 1km receptor spacings was created around this.
4.5 Terrain Data
A terrain height for each of the receptors on the grid was input to the model in order to accurately represent the changing elevations of the surrounding landscape. Digitised terrain data was incorporated into the model using a Digital Elevation Model (DEM) file and the AERMAP function of the AERMOD software.
For
insp
ectio
n pur
pose
s only
.
Conse
nt of
copy
right
owne
r req
uired
for a
ny ot
her u
se.
EPA Export 04-07-2018:03:41:54
Grange BackUp Power Ltd Grange Castle Power Plant
IE0311313-22-RP-0005, Issue B 03/05/2018
IE0311313-22-RP-0005_B_01.DOCX Page 10 of 22 Formal Issue
Figure 4.1: Meteorological Windrose for Casement Aerodrome 2008 to 2012
For
insp
ectio
n pur
pose
s only
.
Conse
nt of
copy
right
owne
r req
uired
for a
ny ot
her u
se.
EPA Export 04-07-2018:03:41:54

Grange BackUp Power Ltd Grange Castle Power Plant
IE0311313-22-RP-0005, Issue B 03/05/2018
IE0311313-22-RP-0005_B_01.DOCX Page 11 of 22 Formal Issue
4.6 Model Input Data
Tables 4.1, 4.2 and 4.3 contain stack and emissions data for the GBPL facility, the TIL facility and the Pfizer facility, respectively.
4.6.1 GBPL Facility
During the operational phase of the proposed power plant, the emission points within the site will consist of 6 no. stacks from the 6 no. Wärtsilä
3 18V50DF engines included in the facility. The 6 no.
stacks will be combined into 2 no. pseudo stacks located to the north of the main building on site – both with 3 no. stacks each. It is noted that the assessment that was carried out for the Environmental Impact Statement (EIS) that accompanied the planning application submitted to South Dublin County Council (SDCC) (Planning Ref: SD16A/0398) (PM Group Report No. IE0311313-22-RP-0002, November 2016) assumed that there will be 7 no. engines in operation as a conservative approach. For this assessment, it has been confirmed that there will be 6 no. engines running.
The data received from the vendor Wärtsilä, included emission data for one single exhaust. In multi-stack configurations where stacks are closely spaced together the hot plumes will affect each other resulting in better plume rise. The Ministry for the Environment, New Zealand suggests a procedure for this
4. To include the increased plume rise in the ambient air models, a stack cluster
can practically be considered as one stack construction in the model calculation, i.e. as one pseudo stack that has an equivalent diameter, equivalent volume flow and emission rate as the stack cluster. Therefore, for the purposes of this assessment, the model includes 2 no. pseudo stacks, both with the equivalent emissions of 3 no. individual stacks.
For the purposes of this assessment the model has assumed that the plant will be operational for 24 hours a day.
As discussed previously the engines will emit NOx, SOx, CO and PM10/2.5; however out of these pollutants only NOX and PM10/2.5 are emitted from the nearby TIL and Pfizer facilities and SOx is also emitted from the Pfizer facility only. The GBPL emission data used in the assessment is detailed in Table 4.1.
The engines also have the capability of running on low sulphur distillate fuel (maximum 0.1% sulphur by mass). However, this will only occur in an emergency situation when there is an interruption to the incoming gas supply. Due to the low likelihood of an interruption to the incoming gas supply and therefore a low likelihood of the engines being run on distillate fuel, this scenario has not been assessed in the air dispersion model.
An external fire hydrant main and sprinkler system will be provided for the site. This will be fed from the raw water storage tanks on site and associated pump-house located to the north of the site. The pumphouse will contain a diesel-fired firewater pump which will supply fire-fighting water from the storage tanks to the hydrant main and sprinkler system. Low sulphur distillate fuel (maximum 0.1% sulphur by mass) will be used as a fuel for the firewater pump. The firewater pump will not be run during normal operation other than for testing purposes. Therefore, the firewater pump was not included in the model due to its small size and infrequent operation.
4.6.2 TIL and Pfizer Facilities
The sources for the model input data for the TIL and Pfizer sites included:
- Emission Limits Values from Pfizer EPA Licence (Reg No. P0652-01)
- TIL Annual Environmental Report (AER) and PRTR (Available on EPA website)
3 The air, noise and water emissions associated with the Wärtsilä engine has been used for the licence review
application to the EPA but ultimately the decision on the final gas engine supplier will be subject to commercial agreement. This will comply to all conditions and emission limit values set out in the Industrial Emissions Licence.
4 Ministry for the Environment (2004) Good Practice Guide for Atmospheric Dispersion Modelling
For
insp
ectio
n pur
pose
s only
.
Conse
nt of
copy
right
owne
r req
uired
for a
ny ot
her u
se.
EPA Export 04-07-2018:03:41:54

Grange BackUp Power Ltd Grange Castle Power Plant
IE0311313-22-RP-0005, Issue B 03/05/2018
IE0311313-22-RP-0005_B_01.DOCX Page 12 of 22 Formal Issue
- Response to an EPA RFI for TIL licence review application (Reg. No. P0693-02), November 2017 (Available on EPA website)
- Pfizer AER and PRTR (Available on EPA website)
- EIS prepared for Pfizer planning application reference SD16A/0236 (Available on SDCC website)
The TIL and Pfizer emission data used in the assessment is detailed in Tables 4.2 and 4.3, respectively.
Table 4.1: Stack and Emission Data for Proposed GBPL Facility
Emission Point Pseudo Stack 1 Pseudo Stack 2
Stack Height (m) 25 25
Equivalent Stack Internal Diameter (m) 2.77 2.77
Exhaust Temperature (K) 663.15 663.15
Discharge Flow Rate – at Discharge Conditions (m3/s) 165.3 165.3
NOx Mass Emission Rate (g/s) 6.72 6.72
PM Mass Emission Rate (g/s) 0.9 0.9
SOx Mass Emission Rate (g/s) 1.35 1.35
Table 4.2: Stack and Emission Data for TIL Facility
Emission Point EP-UT-01
Stack Height (m) Note 1
15
Stack Internal Diameter (m) Note 1
0.56
Exhaust Temperature (K) Note 1
290
Discharge Flow Rate – at Discharge Conditions (m3/s)
Note 1 2.88
NOx Mass Emission Rate (g/s) Note 2
0.4444
PM Mass Emission Rate (g/s) Note 3
0.0002
Note 1: Data taken from response to TIL licence review application RFI, November 2017 Note 2: Proposed licence limits taken from response to TIL licence review application RFI, November 2017 Note 3: Mass emission rates calculated by taking an average from the total annual NOx/PM emitted as reported in TIL’s 2017 PRTR. TIL do not have any licensed limits for PM.
Table 4.3: Stack and Emission Data for Pfizer Facility
Emission Point A1-1 A1-2 A1-3 A2-2
Stack Height (m) Note 1
45 45 45 45
Stack Internal Diameter (m) Note 1
0.85 0.85 0.85 2
Exhaust Temperature (K) Note 1
441.15 441.15 441.15 403.15
Discharge Flow Rate – at Discharge Conditions (m
3/s)
Note 2
6.17 6.17 6.17 26.27
NOx Mass Emission Rate (g/s) Note 3
0.2866 0.2866 0.2866 1.3347
PM Mass Emission Rate (g/s) Note 3
0.0191 0.0191 0.0191 0.0356
SOx Mass Emission Rate (g/s) Note 3
0.1337 0.1337 0.1337 0.2136
Note 1: Data taken from EIS submitted to SDCC as part of planning application reference SD16A/0236, July 2016 Note 2: Volumetric flow rate taken as Pfizer’s EPA License limit Note 3: Mass emission rates calculated from Pfizer’s EPA License limits
For
insp
ectio
n pur
pose
s only
.
Conse
nt of
copy
right
owne
r req
uired
for a
ny ot
her u
se.
EPA Export 04-07-2018:03:41:54

Grange BackUp Power Ltd Grange Castle Power Plant
IE0311313-22-RP-0005, Issue B 03/05/2018
IE0311313-22-RP-0005_B_01.DOCX Page 13 of 22 Formal Issue
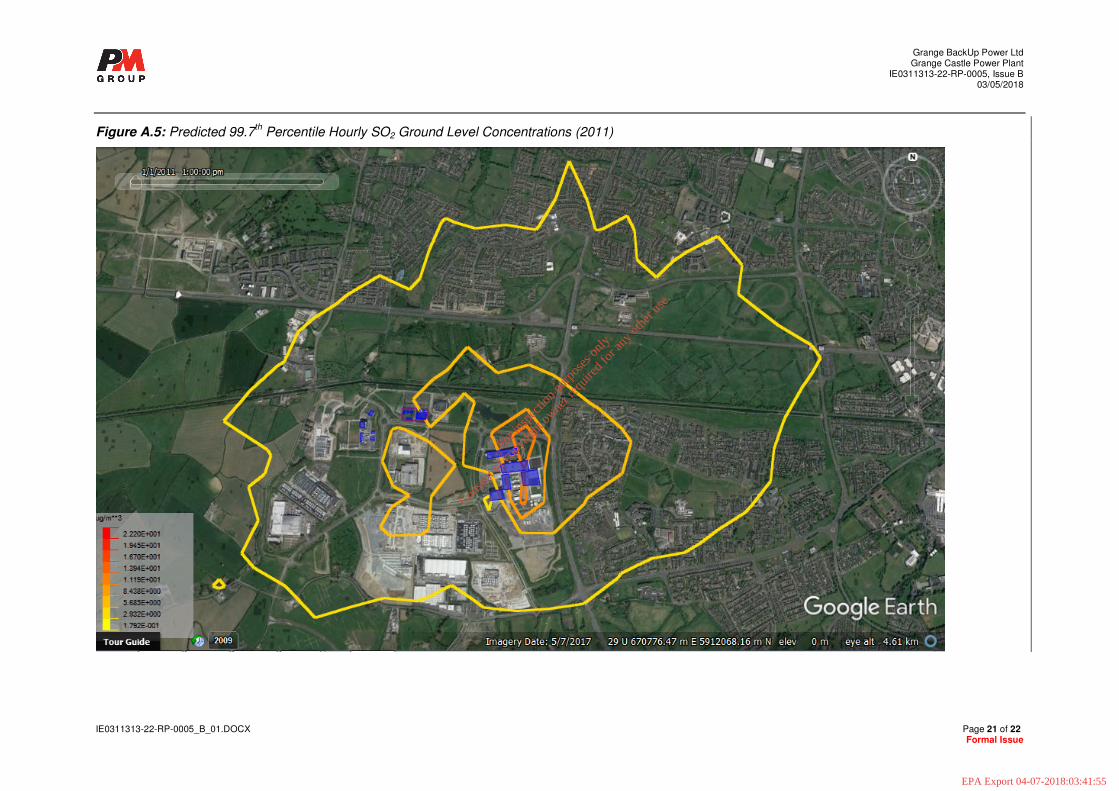
5 Modelling Results and Discussion
5.1 Modelling Results
Table 5.1 outlines the results of the cumulative modelling exercise. Contour plots have also been produced using the AERMOD 3D Analyst software tool and Google Earth Pro for each scenario and are included in Appendix A.
The EPA reported ambient background concentrations as detailed in Table 3.1 of this report are based on annual mean results. Appendix E of the EPA AG4 Guidance Note gives guidance on adding short-term peak concentrations to ambient concentrations for NO2, SO2 and PM10. Based on this guidance short-term (hourly, daily) predicted concentrations of NO2, SO2 and PM10 were added to annual mean ambient concentrations to calculate the overall predicted environmental concentration (PEC) based on the following methodology:
- For the 99.8th Percentile Hourly NO2 PEC, the maximum predicted GLC from the model was
added to twice the annual mean background NO2 concentration.
- For the 90.4th Percentile Daily PM10 PEC, the maximum predicted GLC from the model was
added to the annual mean background PM10 concentration.
- For the 99.7th Percentile Hourly SO2 PEC, the maximum predicted GLC from the model was
added to twice the annual mean background SO2 concentration
- For the 99.2th Percentile Hourly SO2 PEC, the maximum predicted GLC from the model was
added to twice the annual mean background SO2 concentration
5.2 Discussion of Modelling Results
As can been seen from Table 5.1, the maximum PECs of all pollutants considered in this assessment, both short and long term are below their relevant limit values.
The maximum 99.8%ile hourly PEC of NO2 is predicted to be 74% of its relevant limit value, and the maximum annual average PEC of NO2 is predicted to be 84% of its relevant limit value.
In relation to PM, the maximum 90.4%ile daily PEC of PM10 is predicted to be 29% of its relevant limit value, the maximum annual average PEC of PM10 is predicted to be 35% of its relevant limit value, and the annual average PEC of PM2.5 is predicted to be 36% of its relevant limit value.
The maximum 99.7%ile hourly PEC of SO2 is predicted to be 7% of its relevant limit value, and the maximum 99.2%ile daily PEC of SO2 is predicted to be 10% of its relevant limit value
This assessment is considered to be conservative for the following reasons:
- The volumetric flow rate used for the TIL boilers in the air dispersion model has been taken to be the design flow figures.
- The GLC calculated by the air dispersion model comprises the proposed licensed NOx limits and PRTR data for PM for the TIL site as well as NOx and PM emissions from the GBPL facility.
- The GLC calculated by the air dispersion model comprises the licensed limits of NOx, SOx and PM emissions from the Pfizer site as well as NOx, SOx and PM emissions from the GBPL facility
- The existing emissions from the TIL and Pfizer facilities are considered to be included in the annual average EPA background ambient data that has been added to the GLC to calculate the annual average PEC. Therefore the existing emissions from these facilities have been considered twice on this assessment.
- With respect to nitrogen dioxide (NO2), the predicted ground level concentrations are based on the assumption of 100% conversion of NOx emitted to NO2 in the atmosphere. Emissions of NOx oxidise to NO2 over time in the atmosphere and will generally not have all oxidised to NO2 by the time they reach ground level.
For
insp
ectio
n pur
pose
s only
.
Conse
nt of
copy
right
owne
r req
uired
for a
ny ot
her u
se.
EPA Export 04-07-2018:03:41:55

Grange BackUp Power Ltd Grange Castle Power Plant
IE0311313-22-RP-0005, Issue B 03/05/2018
IE0311313-22-RP-0005_B_01.DOCX Page 14 of 22 Formal Issue
- All particulate emissions modelled were assumed to be in the form of either PM10 or PM2.5 when only a fraction of the total particulates will be emitted will be in this form.
- The results presented in Table 5.1 are based on the worst-case results for 5 years of met data.
The worst case GLCs of NOx predicted by the model were within the boundary of Grange Castle Business Park which is zoned to provide for enterprise and employment related uses, it is also noted that these GLCs are reduced at the nearest residential area.
Taking into account the results of the air dispersion modelling discussed above, it is concluded that the proposed GBPL facility in Grange Castle Business Park when considered cumulatively with the nearby TIL and Pfizer facilities will not lead to a contravention of the applicable air quality standards.
For
insp
ectio
n pur
pose
s only
.
Conse
nt of
copy
right
owne
r req
uired
for a
ny ot
her u
se.
EPA Export 04-07-2018:03:41:55

Grange BackUp Power Ltd Grange Castle Power Plant
IE0311313-22-RP-0005, Issue B 03/05/2018
IE0311313-22-RP-0005_B_01.DOCX Page 15 of 22 Formal Issue
Table 5.1: Cumulative Air Dispersion Modelling Results
Pollutant Description
Predicted Maximum
GLC (µg/m
3)
Predicted Maximum GLC
Occurred at Location (UTM Co-ordinates)
Predicted Maximum Occurred in Year
Existing Annual Mean Background
Concentration (µg/m
3)
Predicted Environmental Concentration
(PEC) (Background +
Predicted) (µg/m
3)
Air Quality
Standard Limit Value
(µg/m3)
PEC as Percentage
of Limit Value
(Including GBPL, TIL and Pfizer)
Nitrogen Oxides (NOx)
99.8th
Percentile Hourly NO2
Note 1
100.8 669616.4E, 5911727N
2010 47.4 Note 2
148.2 200 74%
Annual NO2 Note 1
9.7 670916.4E, 5911626.3N
2011 23.7 33.4 40 84%
Particulate Matter less than 10 µm (PM10)
Note 3
90.4th
Percentile Daily
1.1 670316.4E, 5912127N
2011 13.5 Note 2
14.6 50 29%
Annual 0.4 670916.4E, 5911626.3N
2011 13.5 13.9 40 35%
Particulate Matter less than 2.5 µm (PM
2.5)Note 3
Annual 0.4 670316E, 5912126N 2011 8.6 9 25 36%
Sulphur Oxides (SOx)
99.7th
Percentile Hourly SO2
Note 4 22.2 670716.4E, 5911727N
2011 2.4 Note 2
24.6 350 7%
99.2th
Percentile Daily SO2
Note 4
10.2 670816.4E, 5911727N
2009 2.4 Note 2
12.6 125 10%
Note 1: It is assumed that all NOx is converted to NO2 Note 2: Methodology for calculating short-term background concentration described in Section 5.1 of this report Note 3: All particulate emissions assumed in the form of PM10 or PM2.5 for comparison to AQS limit value. This is a conservative assessment as only a fraction of particulates emitted will be in the form of either PM10 or PM2.5
Note 4: It is assumed that all SOx is converted to SO2
For
insp
ectio
n pur
pose
s only
.
Conse
nt of
copy
right
owne
r req
uired
for a
ny ot
her u
se.
EPA Export 04-07-2018:03:41:55

Grange BackUp Power Ltd Grange Castle Power Plant
IE0311313-22-RP-0005, Issue B 03/05/2018
IE0311313-22-RP-0005_B_01.DOCX Page 16 of 22 Formal Issue
Appendix A Air Dispersion Modelling Contour Plots
For
insp
ectio
n pur
pose
s only
.
Conse
nt of
copy
right
owne
r req
uired
for a
ny ot
her u
se.
EPA Export 04-07-2018:03:41:55

Grange BackUp Power Ltd Grange Castle Power Plant
IE0311313-22-RP-0005, Issue B 03/05/2018
IE0311313-22-RP-0005_B_01.DOCX Page 17 of 22 Formal Issue
Figure A.1: Predicted 99.8th Percentile Hourly NO2 Ground Level Concentrations (2010)
For
insp
ectio
n pur
pose
s only
.
Conse
nt of
copy
right
owne
r req
uired
for a
ny ot
her u
se.
EPA Export 04-07-2018:03:41:55

Grange BackUp Power Ltd Grange Castle Power Plant
IE0311313-22-RP-0005, Issue B 03/05/2018
IE0311313-22-RP-0005_B_01.DOCX Page 18 of 22 Formal Issue
Figure A.2: Predicted Annual NO2 Ground Level Concentrations (2011)
For in
spec
tion p
urpo
ses o
nly.
Conse
nt of
copy
right
owne
r req
uired
for a
ny ot
her u
se.
EPA Export 04-07-2018:03:41:55

Grange BackUp Power Ltd Grange Castle Power Plant
IE0311313-22-RP-0005, Issue B 03/05/2018
IE0311313-22-RP-0005_B_01.DOCX Page 19 of 22 Formal Issue
Figure A.3: Predicted 90.4th Percentile Daily PM10 Ground Level Concentrations (2011)
For in
spec
tion p
urpo
ses o
nly.
Conse
nt of
copy
right
owne
r req
uired
for a
ny ot
her u
se.
EPA Export 04-07-2018:03:41:55

Grange BackUp Power Ltd Grange Castle Power Plant
IE0311313-22-RP-0005, Issue B 03/05/2018
IE0311313-22-RP-0005_B_01.DOCX Page 20 of 22 Formal Issue
Figure A.4: Predicted Annual PM10 / PM2.5 Ground Level Concentrations (2011)
For in
spec
tion p
urpo
ses o
nly.
Conse
nt of
copy
right
owne
r req
uired
for a
ny ot
her u
se.
EPA Export 04-07-2018:03:41:55
Grange BackUp Power Ltd Grange Castle Power Plant
IE0311313-22-RP-0005, Issue B 03/05/2018
IE0311313-22-RP-0005_B_01.DOCX Page 21 of 22 Formal Issue
Figure A.5: Predicted 99.7th Percentile Hourly SO2 Ground Level Concentrations (2011)
For in
spec
tion p
urpo
ses o
nly.
Conse
nt of
copy
right
owne
r req
uired
for a
ny ot
her u
se.
EPA Export 04-07-2018:03:41:55

Grange BackUp Power Ltd Grange Castle Power Plant
IE0311313-22-RP-0005, Issue B 03/05/2018
IE0311313-22-RP-0005_B_01.DOCX Page 22 of 22 Formal Issue
Figure A.6: Predicted 99.2nd
Percentile Daily SO2 Ground Level Concentrations (2009)
For in
spec
tion p
urpo
ses o
nly.
Conse
nt of
copy
right
owne
r req
uired
for a
ny ot
her u
se.
EPA Export 04-07-2018:03:41:55