Embed Size (px)
DESCRIPTION
AGROBANCO, RURAL DEVELOPMENT BANK. Contents. - Strategic Planning - Participation and Portfolio Growth - Term of Placements - Growth of our Clients - Portfolio Quality - Potential Demand - National Coverage - Financial Products - Major Crops Financed - Financial Results - ANNEXES - PowerPoint PPT Presentation
Citation preview

AGROBANCO, RURAL DEVELOPMENT BANK

Contents
- Strategic Planning- Participation and Portfolio Growth- Term of Placements- Growth of our Clients- Portfolio Quality- Potential Demand- National Coverage- Financial Products- Major Crops Financed- Financial Results- ANNEXES - Human Resources and Business Managers - Other Services - Other Variables

Section OneStrategic Planning
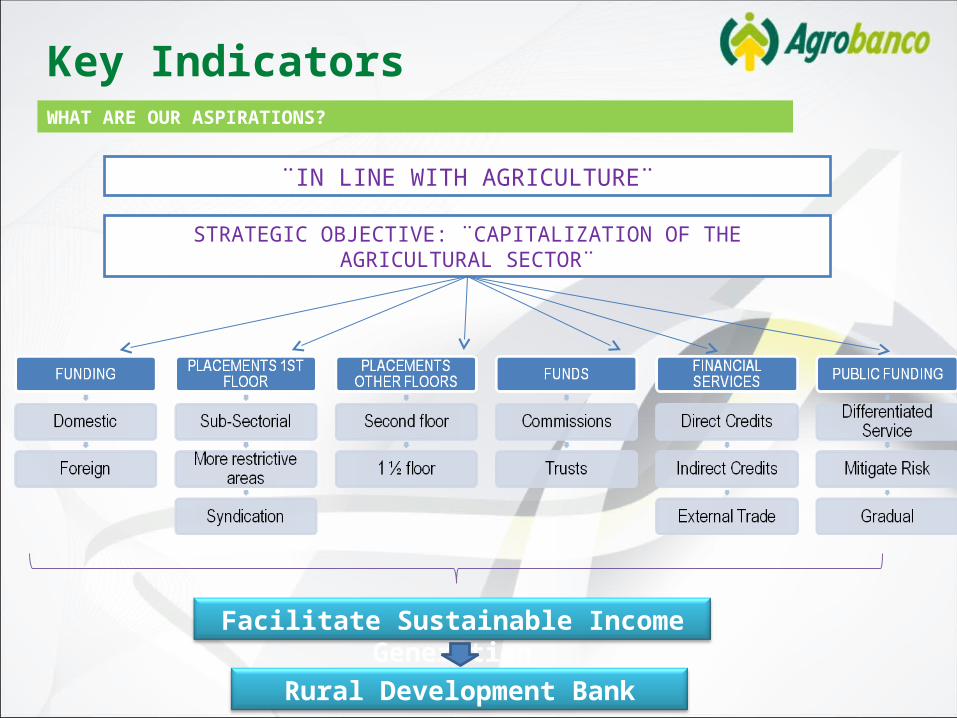
WHAT ARE OUR ASPIRATIONS?
Key Indicators
¨IN LINE WITH AGRICULTURE¨
Facilitate Sustainable Income Generation
STRATEGIC OBJECTIVE: ¨CAPITALIZATION OF THE AGRICULTURAL SECTOR¨
Rural Development Bank
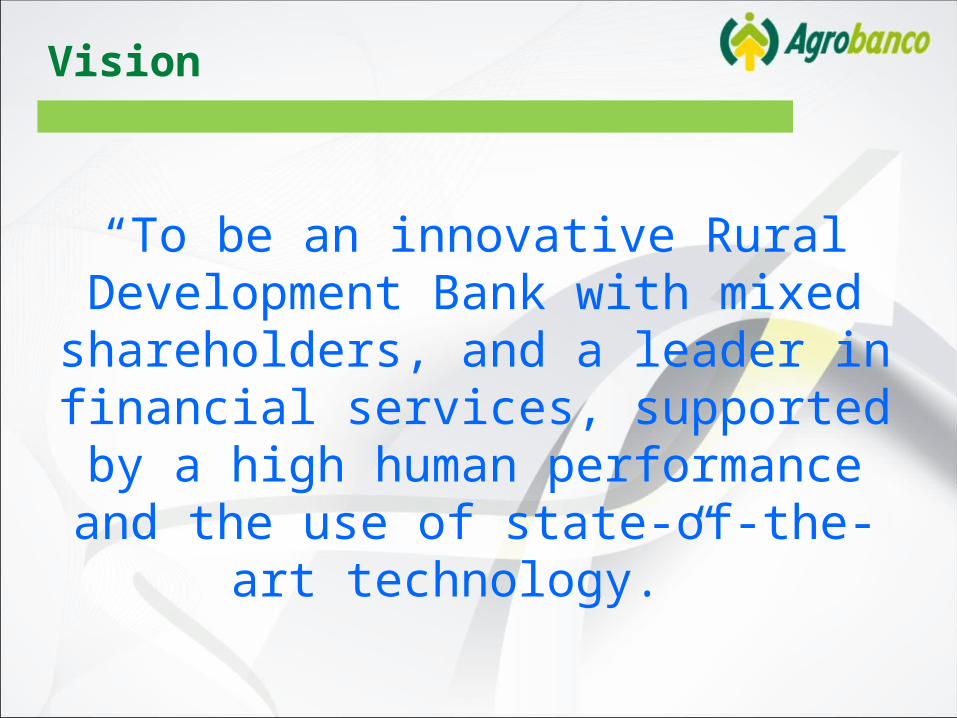
Vision
“To be an innovative Rural Development Bank with mixed shareholders, and a leader in financial
services, supported by a high human performance and the use of state-of-the-art
technology.”

Mission
“To provide financial products and services in promotion of rural savings and accompany the
development of production, agricultural businesses and complementary activities in the rural areas, focused on the financial inclusion of
people in poverty and/or other limitations.”

Section TwoParticipation and Portfolio Growth
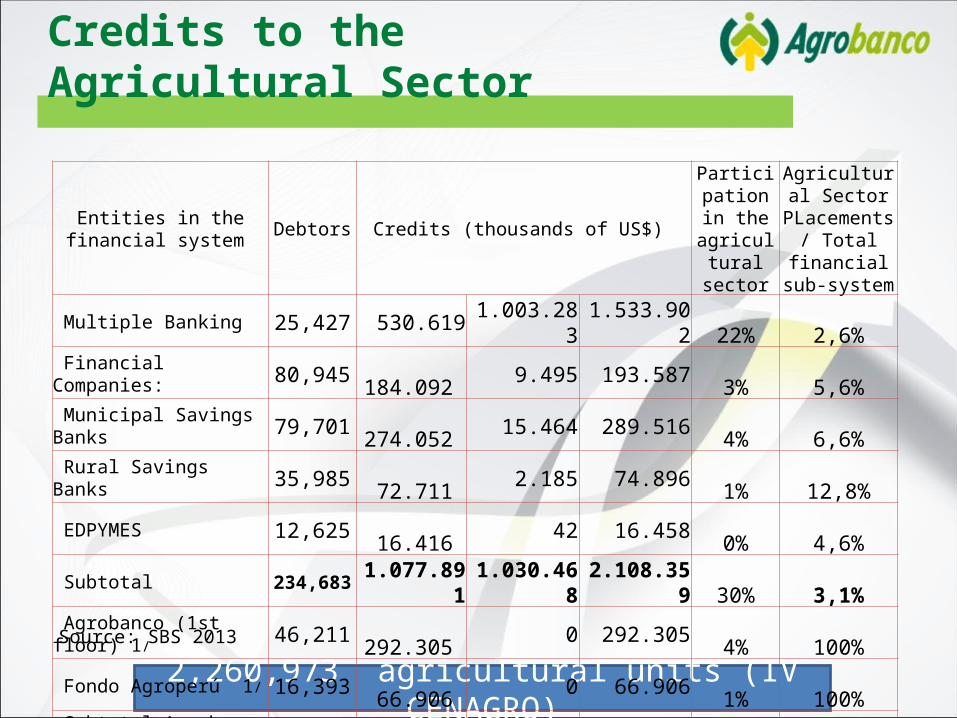
2,260,973 agricultural units (IV CENAGRO)
Credits to the Agricultural Sector
Entities in the financial system Debtors Credits (thousands of US$)
Participation in the
agricultural sector
Agricultural Sector
PLacements / Total financial
sub-system Multiple Banking 25,427 530.619 1.003.283 1.533.902 22% 2,6% Financial Companies: 80,945 184.092 9.495 193.587 3% 5,6% Municipal Savings Banks 79,701 274.052 15.464 289.516 4% 6,6% Rural Savings Banks 35,985 72.711 2.185 74.896 1% 12,8% EDPYMES 12,625 16.416 42 16.458 0% 4,6% Subtotal 234,683 1.077.891 1.030.468 2.108.359 30% 3,1% Agrobanco (1st floor) 1/ 46,211 292.305 0 292.305 4% 100% Fondo Agroperú 1/ 16,393 66.906 0 66.906 1% 100% Subtotal Agrobanco 62,604 359.211 0 359.211 5% 100% Total 297,287 1.437.102 1.030.468 2.467.570 35% 3,6% Agrobanco (2nd floor) 1/ 7,966 9.043 0 9.043 0% Total AGROBANCO 70,570 368.254 0 368.254 5% 1/ Placements December 2013
Source: SBS 2013
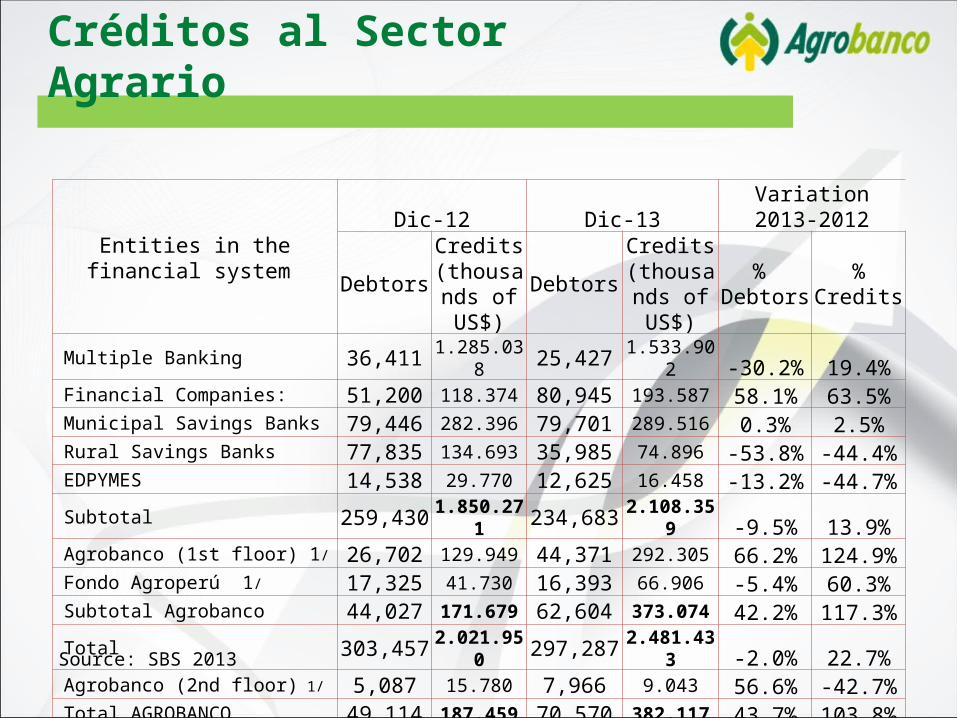
Créditos al Sector Agrario
Entities in the financial system
Dic-12 Dic-13 Variation 2013-2012
DebtorsCredits
(thousands of US$)
DebtorsCredits
(thousands of US$)
% Debtors
%Credits
Multiple Banking 36,411 1.285.038 25,427 1.533.902 -30.2% 19.4% Financial Companies: 51,200 118.374 80,945 193.587 58.1% 63.5% Municipal Savings Banks 79,446 282.396 79,701 289.516 0.3% 2.5% Rural Savings Banks 77,835 134.693 35,985 74.896 -53.8% -44.4% EDPYMES 14,538 29.770 12,625 16.458 -13.2% -44.7% Subtotal 259,430 1.850.271 234,683 2.108.359 -9.5% 13.9% Agrobanco (1st floor) 1/ 26,702 129.949 44,371 292.305 66.2% 124.9% Fondo Agroperú 1/ 17,325 41.730 16,393 66.906 -5.4% 60.3% Subtotal Agrobanco 44,027 171.679 62,604 373.074 42.2% 117.3% Total 303,457 2.021.950 297,287 2.481.433 -2.0% 22.7% Agrobanco (2nd floor) 1/ 5,087 15.780 7,966 9.043 56.6% -42.7% Total AGROBANCO 49,114 187.459 70,570 382.117 43.7% 103.8%
Source: SBS 2013
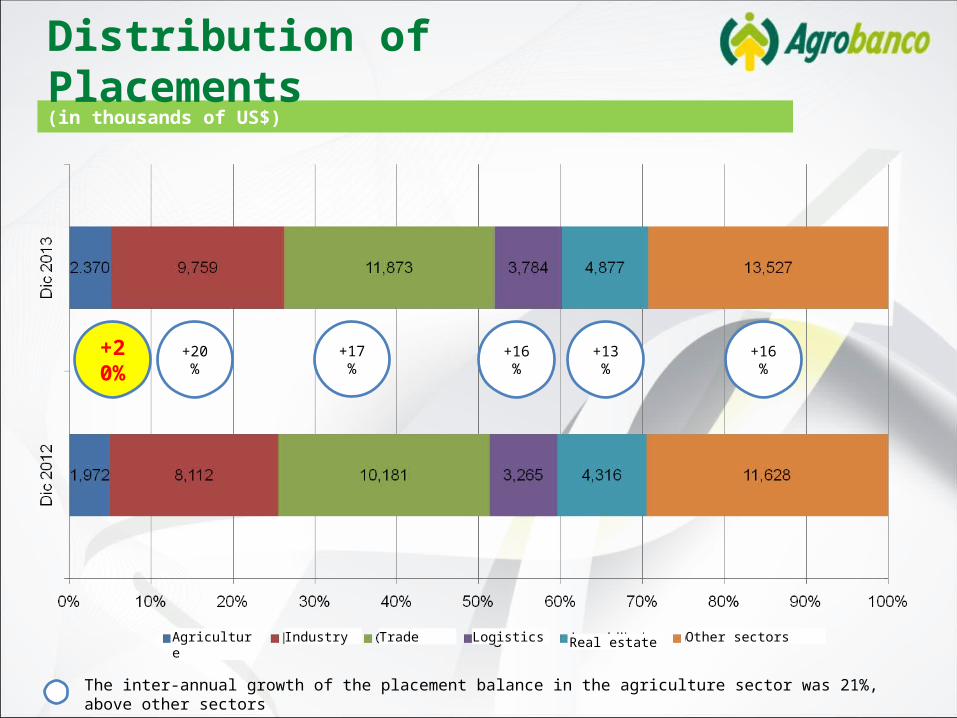
(in thousands of US$)
Distribution of Placements
+20%
+20% +17% +16% +13% +16%
The inter-annual growth of the placement balance in the agriculture sector was 21%, above other sectors
Agriculture Industry Trade Logistics Real estate Other sectors
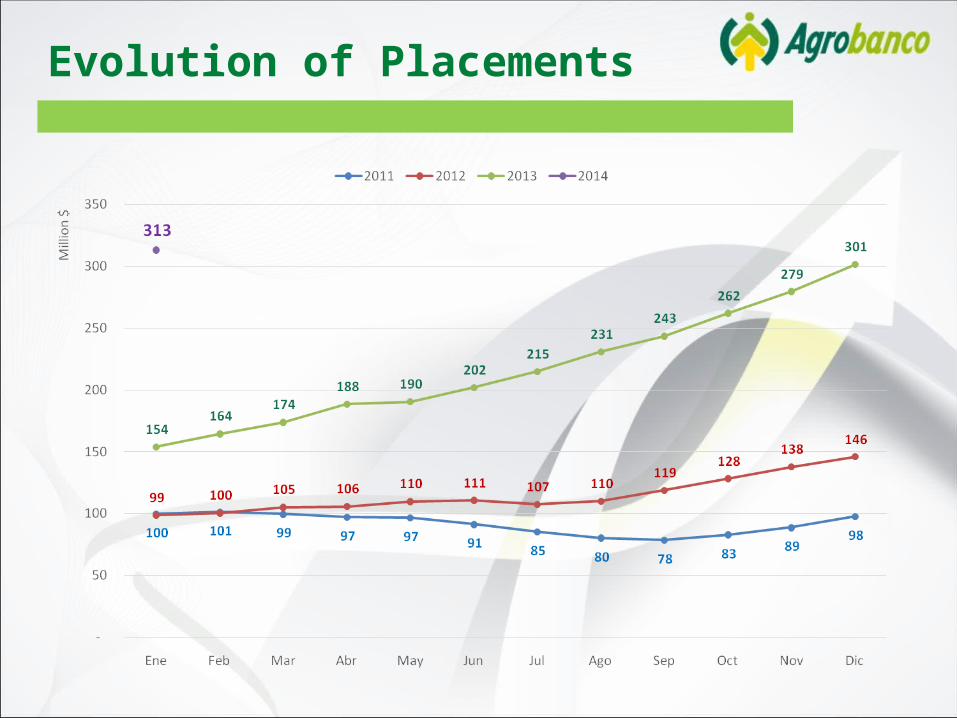
Evolution of Placements
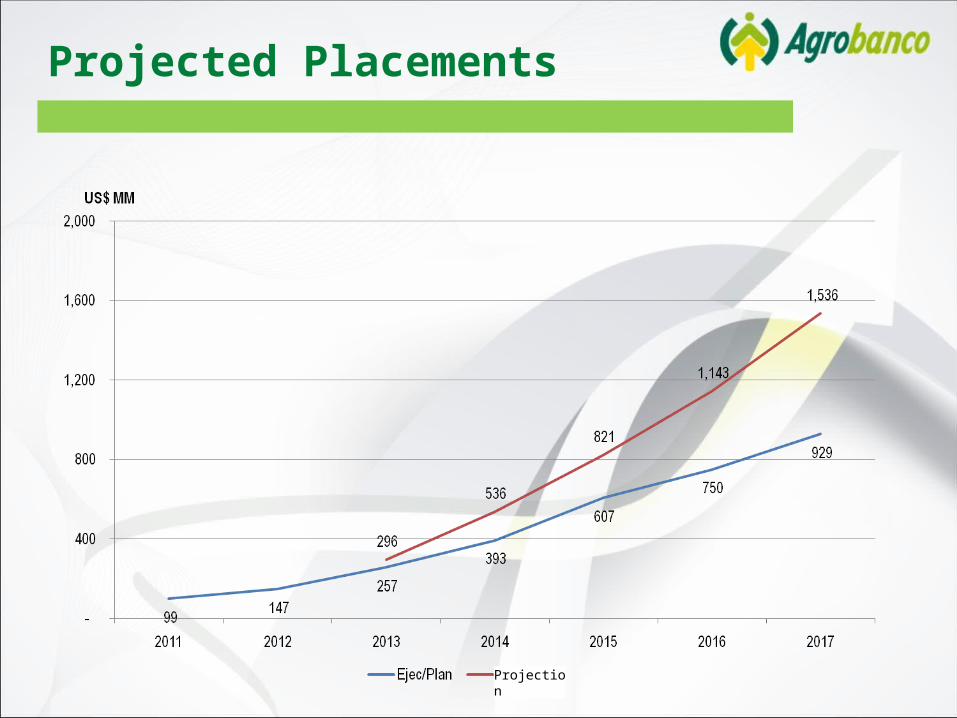
Projected Placements
Projection
+ 94%
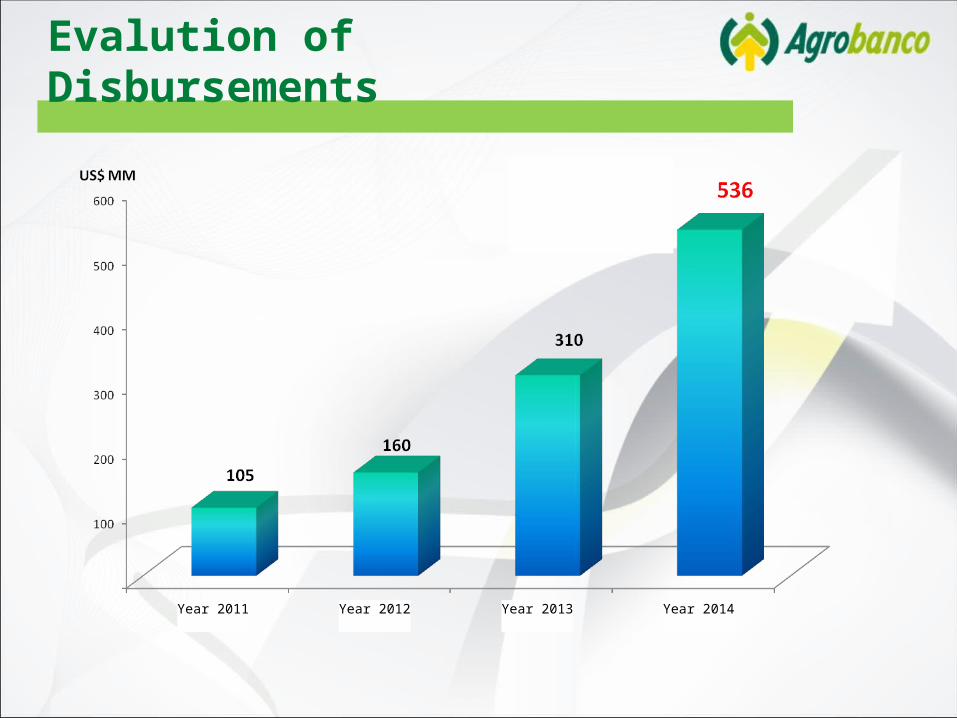
Evalution of Disbursements
Year 2011 Year 2012 Year 2013 Year 2014

Section ThreeTerm of Placements
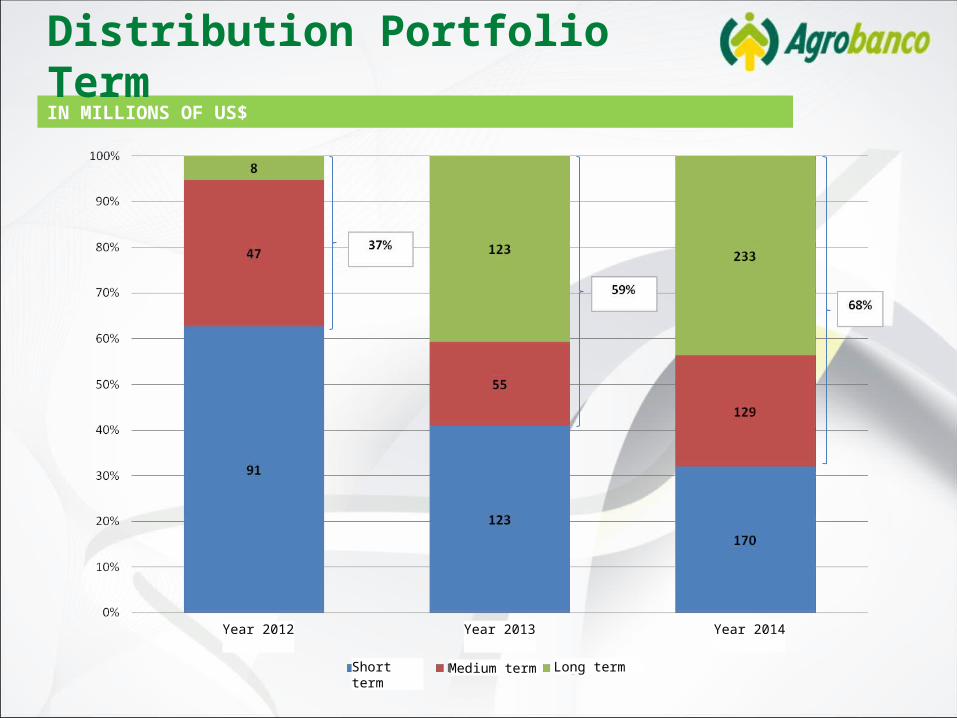
IN MILLIONS OF US$
Distribution Portfolio Term
Year 2012 Year 2013 Year 2014
Short term Medium term Long term

Section FourGrowth of our Clients
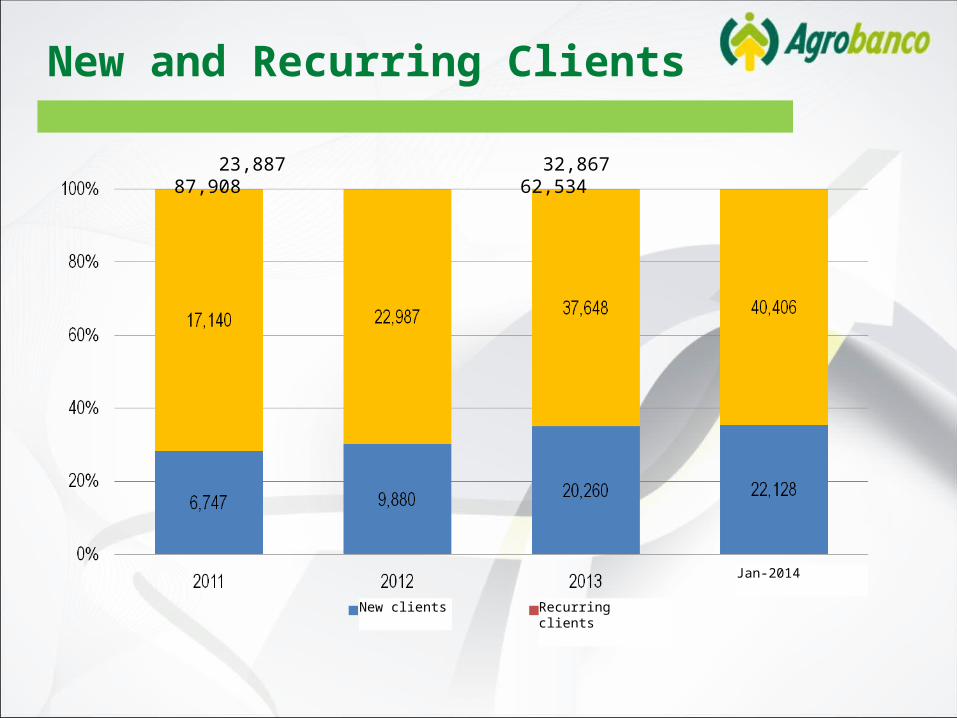
New and Recurring Clients
23,887 32,867 87,908 62,534
New clients Recurring clients
Jan-2014

Section Five Portfolio Quality
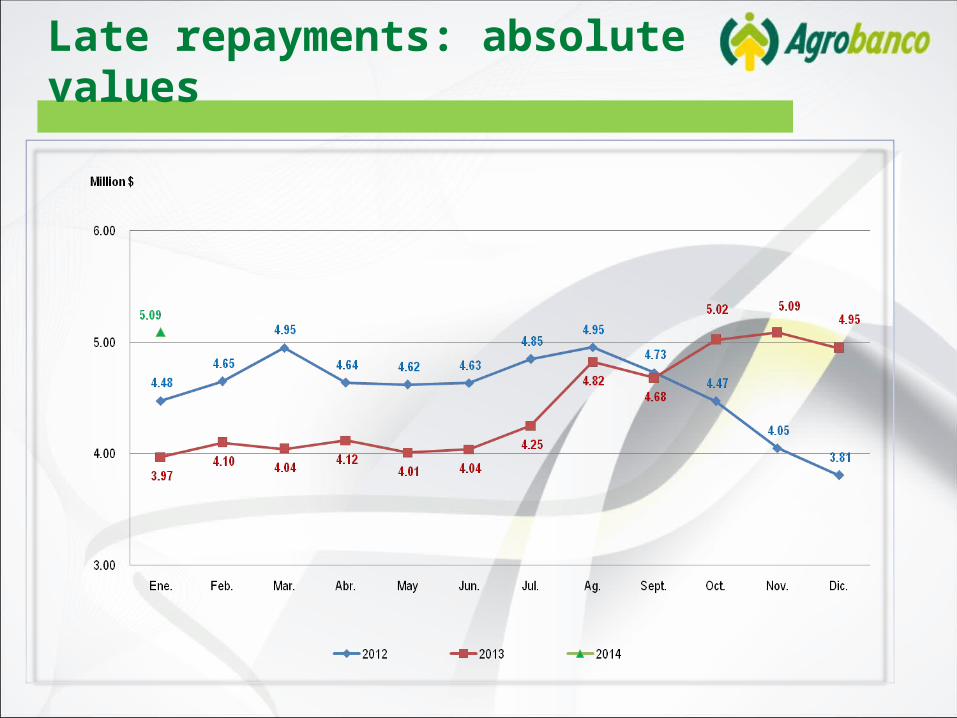
Late repayments: absolute values
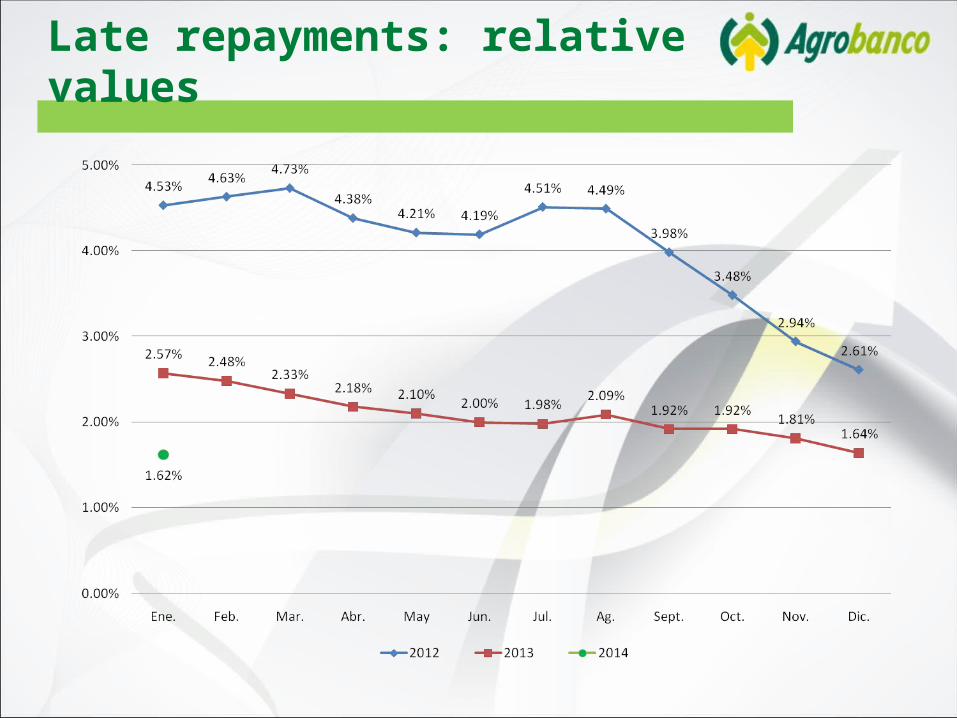
Late repayments: relative values
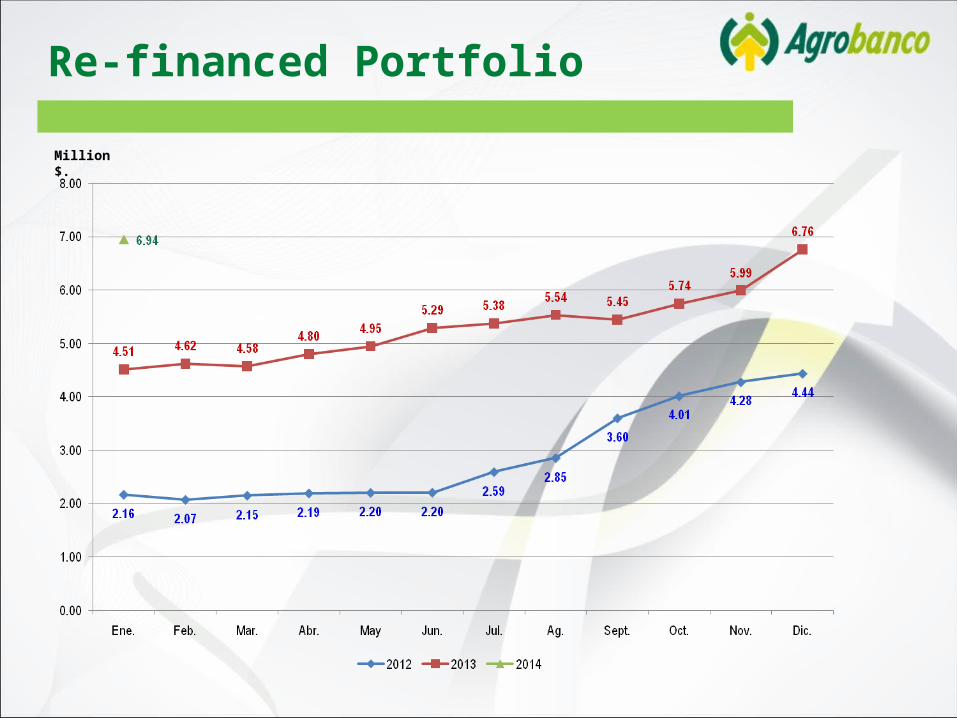
Re-financed Portfolio
Million $.

High-risk Portfolio
Million $.
Million $
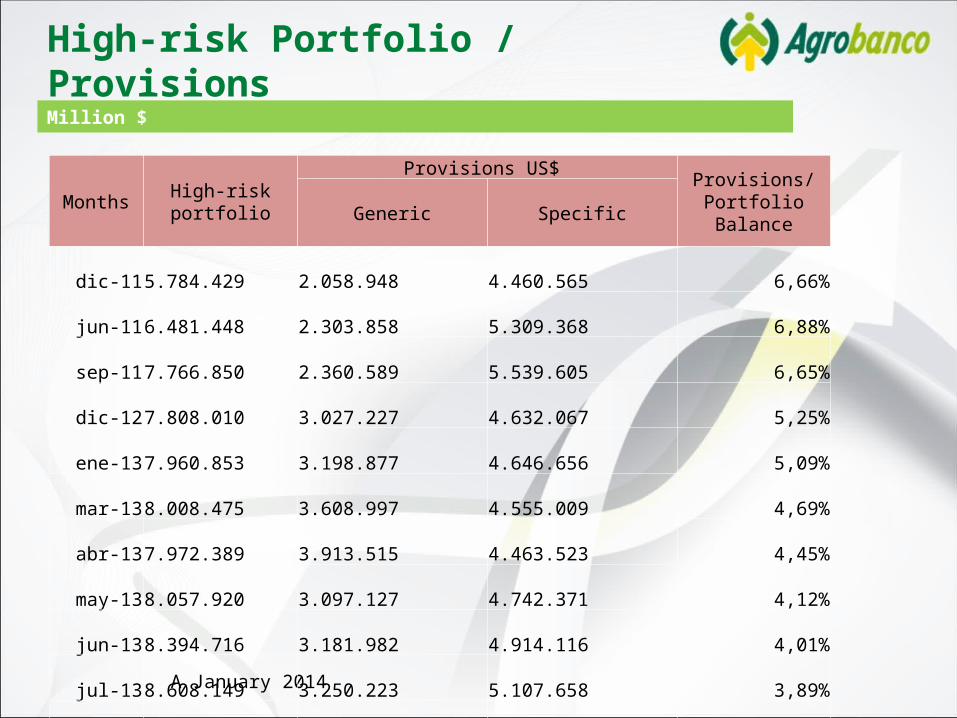
High-risk Portfolio / Provisions
A January 2014
Months High-risk portfolioProvisions US$
Provisions/Portfolio BalanceGeneric Specific
dic-11 5.784.429 2.058.948 4.460.565 6,66%jun-11 6.481.448 2.303.858 5.309.368 6,88%sep-11 7.766.850 2.360.589 5.539.605 6,65%dic-12 7.808.010 3.027.227 4.632.067 5,25%
ene-13 7.960.853 3.198.877 4.646.656 5,09%mar-13 8.008.475 3.608.997 4.555.009 4,69%abr-13 7.972.389 3.913.515 4.463.523 4,45%
may-13 8.057.920 3.097.127 4.742.371 4,12%jun-13 8.394.716 3.181.982 4.914.116 4,01%jul-13 8.608.149 3.250.223 5.107.658 3,89%
ago-13 9.036.674 3.484.977 5.265.334 3,79%sep-13 8.857.597 3.469.146 5.048.104 3,50%oct-13 9.283.495 3.740.113 5.049.874 3,36%nov-13 9.691.040 3.964.911 5.422.109 3,34%dic-13 10.400.234 4.292.820 5.590.890 3,28%
ene-14 9.201.281 4.466.594 5.806.671 3,28%

Economic losses: penalties
Year 2011 2012 2013 Jan-14
Amount Capital Penalty US$ 2.298.337 1.026.534 1.377.254 0
Equity US$ 99.298.883 124.485.024 150.111.682 150.896.033
Disbursements US$ 104.745.938 158.744.572 312.009.553 40.832.074
Economic Loss % 2.3% 0.8% 0.9% 0.0%

Section SixPotential Demand
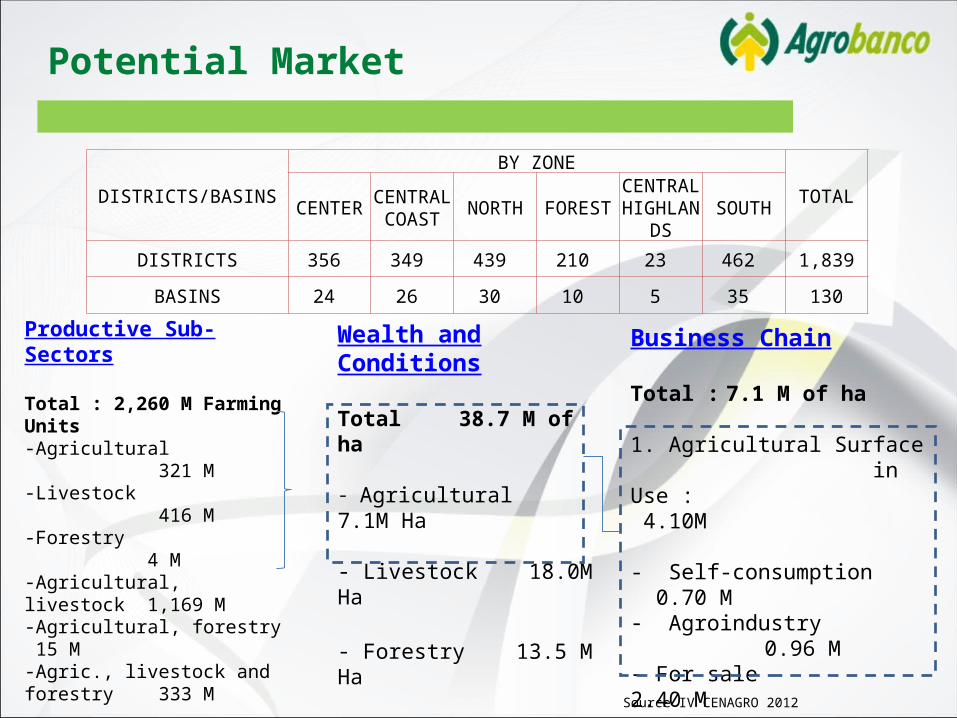
Productive Sub-Sectors
Total : 2,260 M Farming Units-Agricultural 321 M-Livestock 416 M -Forestry 4 M -Agricultural, livestock 1,169 M-Agricultural, forestry 15 M -Agric., livestock and forestry 333 M
Property and conditionIrrigation and basinsEnergy supplyAltitudinal tiers
Wealth and Conditions
Total 38.7 M of ha
- Agricultural 7.1M Ha - Livestock 18.0M Ha
- Forestry 13.5 M Ha
Business Chain
Total : 7.1 M of ha
1. Agricultural Surface in Use : 4.10M
- Self-consumption 0.70 M- Agroindustry 0.96 M- For sale 2.40 M
2. Agricultural Surface in Development: 3.00 M
DISTRICTS/BASINS
BY ZONE
TOTALCENTER CENTRAL
COAST NORTH FORESTCENTRAL HIGHLAN
DSSOUTH
DISTRICTS 356 349 439 210 23 462 1,839
BASINS 24 26 30 10 5 35 130
Source IV CENAGRO 2012
Potential Market

Potential Market
North AreaPotential debtors 189,371Agrobanco debtors 7,142Agricultural sector debtors 92,269
Agrobanco participation 8%
Central Coast AreaPotential debtors 30,213Agrobanco debtors 3,576Agricultural sector debtors 52,496
Agrobanco participation 7%
Rainforest AreaPotential debtors 41,304Agrobanco debtors 5,716Agricultural sector debtors 34,546
Agrobanco participation 17%
Central AreaPotential debtors 29,685Agrobanco debtors 5,908Agricultural sector debtors 42,093
Agrobanco participation 14%
South AreaPotential debtors 34,916Agrobanco debtors 8,725Agricultural sector debtors 80,762
Agrobanco participation 11%
15
18
10
10
17
DomesticPotential debtors 325,489Agrobanco debtors 31,067Agricultural sector debtors 302,166
Agrobanco participation 10%
Number of points of sale (Dec. 13)AGROBANCO
458
507 385
113
111
Number of points of sale (Dec. 13)Financial System
Source: National Agricultural Sector 2012 – INEI; SBS (2012)

Section SevenNational Coverage
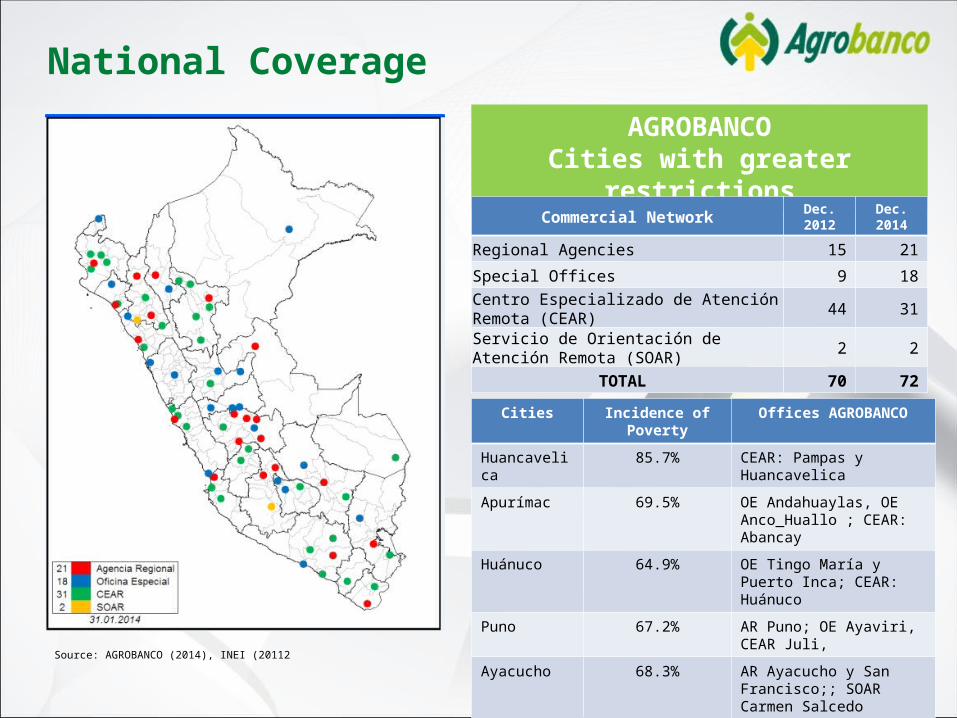
National Coverage
AGROBANCOCities with greater restrictions
Source: AGROBANCO (2014), INEI (20112
Cities Incidence of Poverty Offices AGROBANCO
Huancavelica 85.7% CEAR: Pampas y Huancavelica
Apurímac 69.5% OE Andahuaylas, OE Anco_Huallo ; CEAR: Abancay
Huánuco 64.9% OE Tingo María y Puerto Inca; CEAR: Huánuco
Puno 67.2% AR Puno; OE Ayaviri, CEAR Juli,
Ayacucho 68.3% AR Ayacucho y San Francisco;; SOAR Carmen Salcedo
TOTAL
03 Agencia Regional05 Oficina Especial
05 CEARs01 SOAR
Commercial Network Dec. 2012 Dec. 2014
Regional Agencies 15 21
Special Offices 9 18Centro Especializado de Atención Remota (CEAR) 44 31
Servicio de Orientación de Atención Remota (SOAR) 2 2
TOTAL 70 72

Section EightFinancial Products
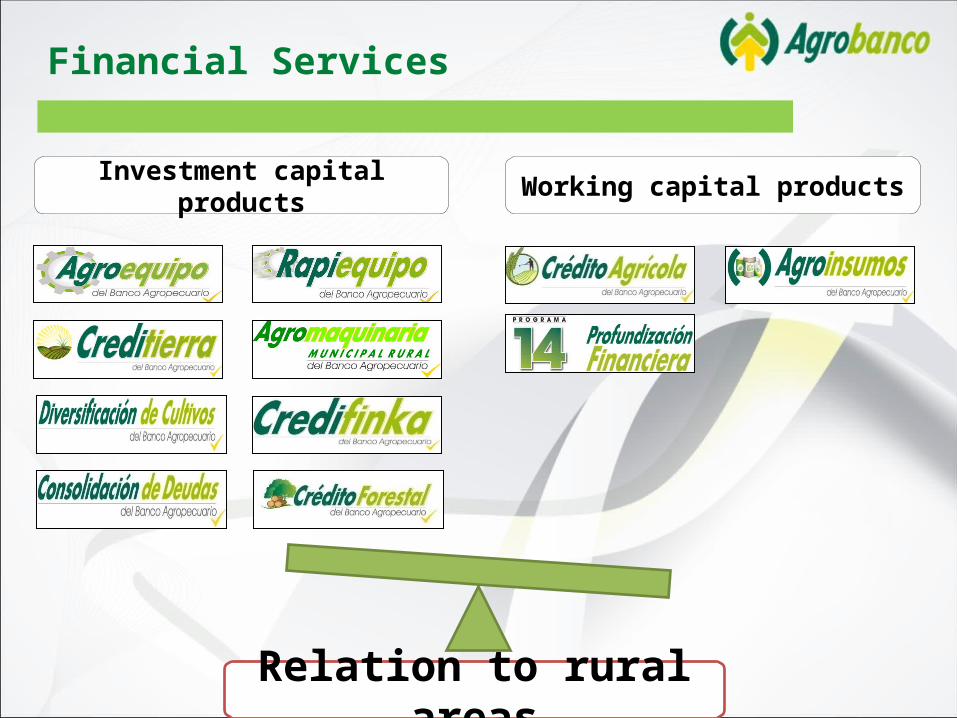
Investment capital products Working capital products
Relation to rural areas
Financial Services
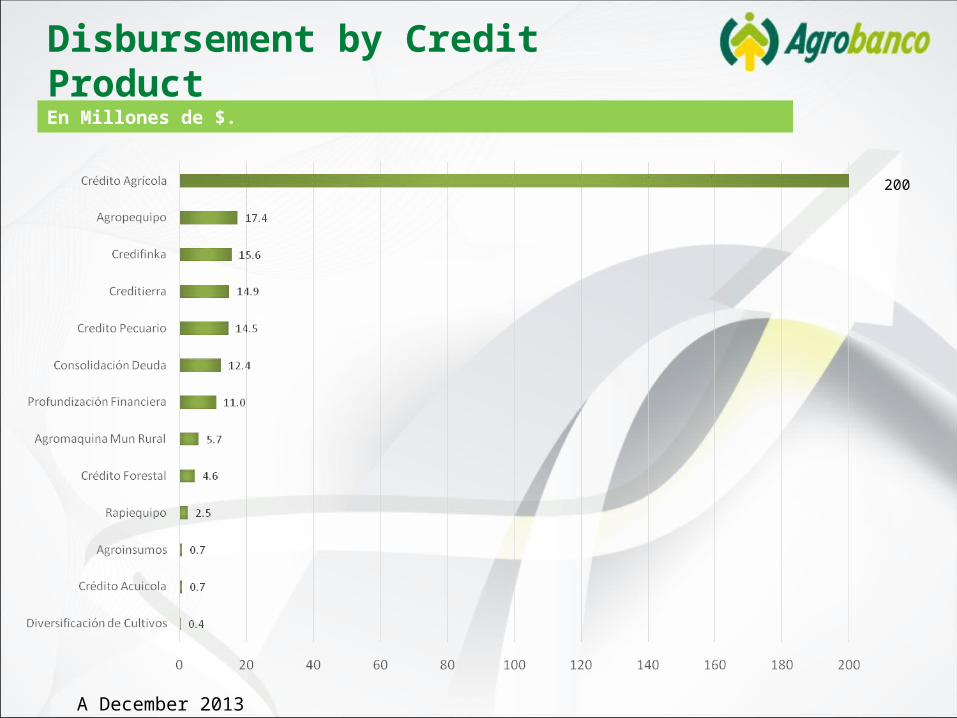
En Millones de $.
Disbursement by Credit Product
A December 2013
200

Section NineMajor Crops Financed
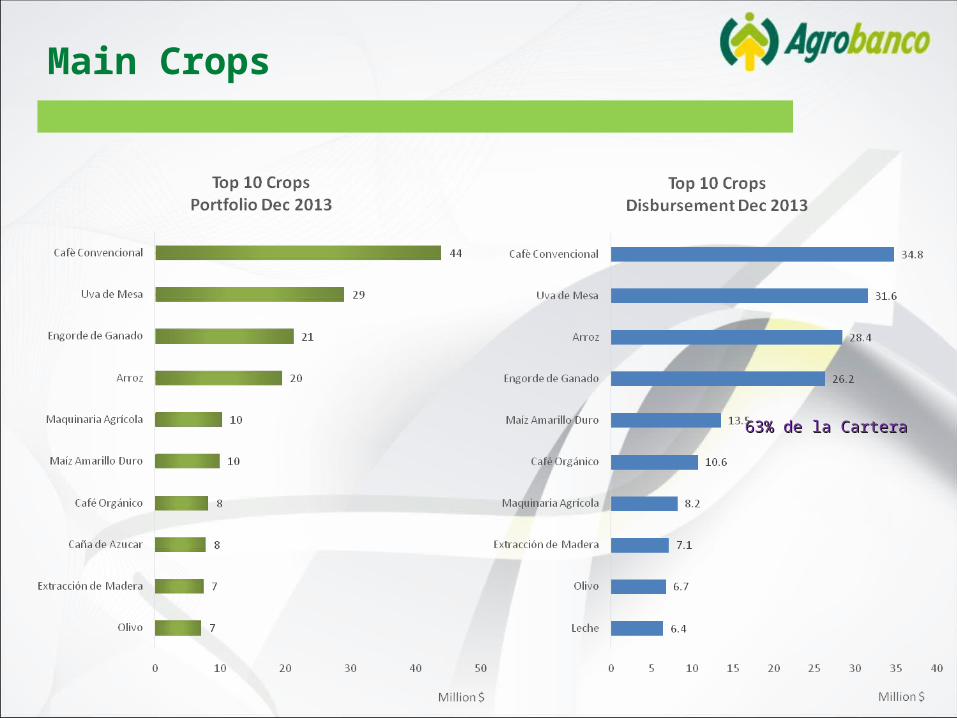
63% de la Cartera63% de la Cartera
Main Crops
MAIN CROPS
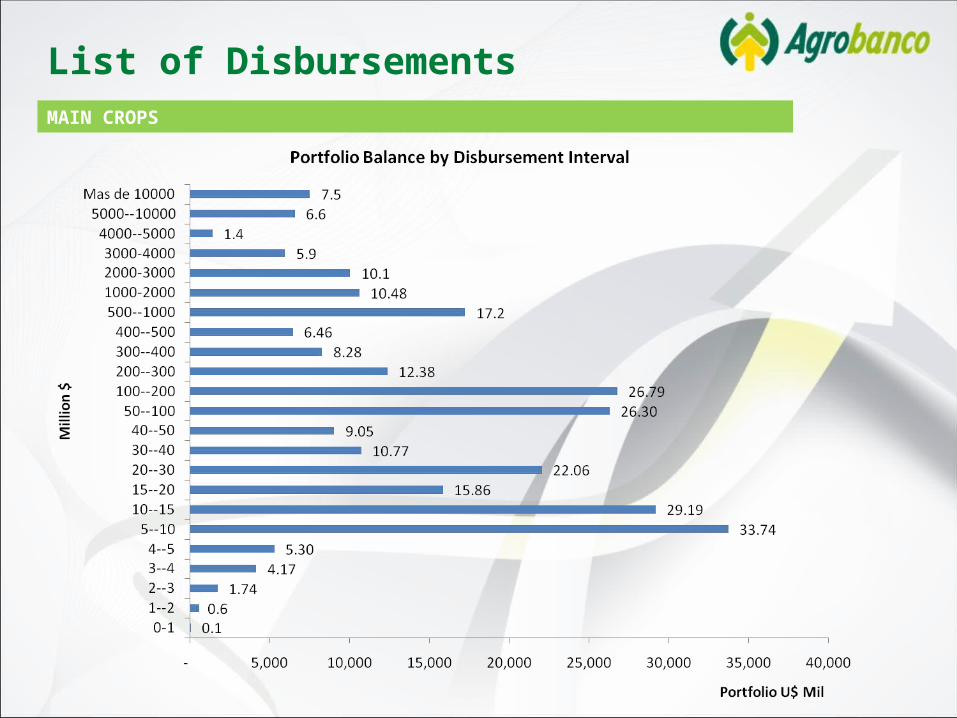
List of Disbursements

Section TenFinancial Results
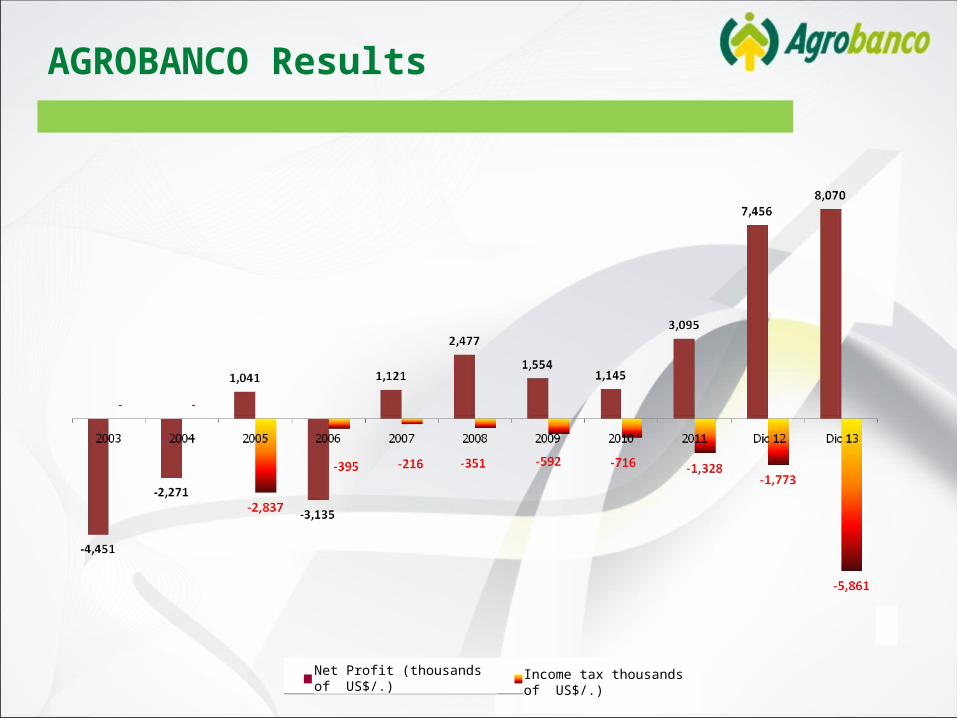
AGROBANCO Results
Net Profit (thousands of US$/.) Income tax thousands of US$/.)
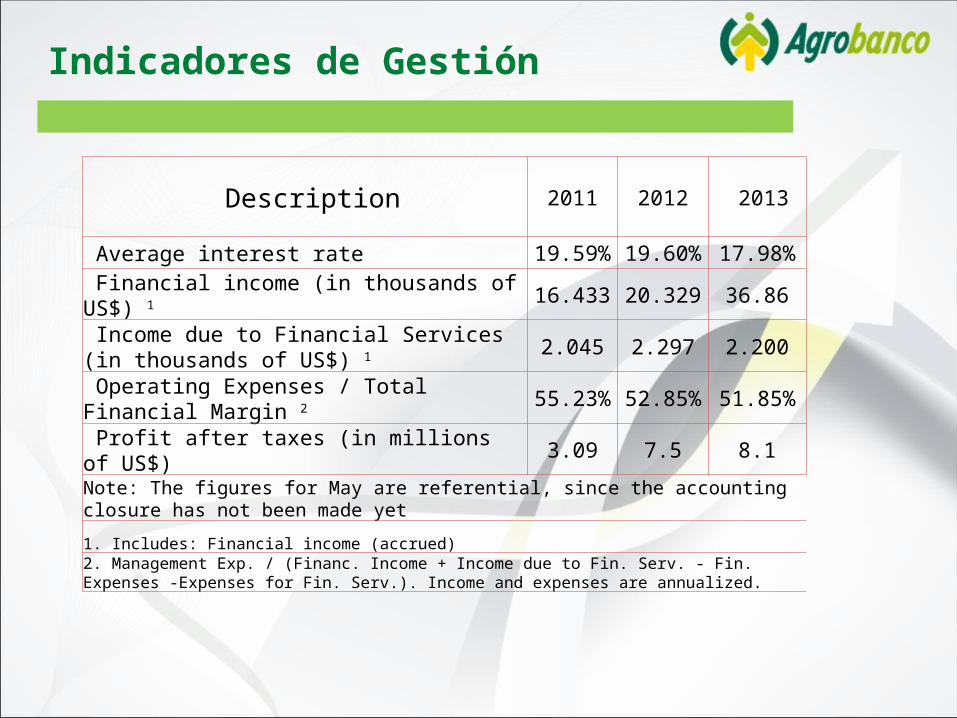
Indicadores de Gestión
Description 2011 2012 2013
Average interest rate 19.59% 19.60% 17.98%
Financial income (in thousands of US$) 1 16.433 20.329 36.86 Income due to Financial Services (in thousands of US$) 1
2.045 2.297 2.200
Operating Expenses / Total Financial Margin 2 55.23% 52.85% 51.85%
Profit after taxes (in millions of US$) 3.09 7.5 8.1Note: The figures for May are referential, since the accounting closure has not been made yet
1. Includes: Financial income (accrued)2. Management Exp. / (Financ. Income + Income due to Fin. Serv. - Fin. Expenses -Expenses for Fin. Serv.). Income and expenses are annualized.
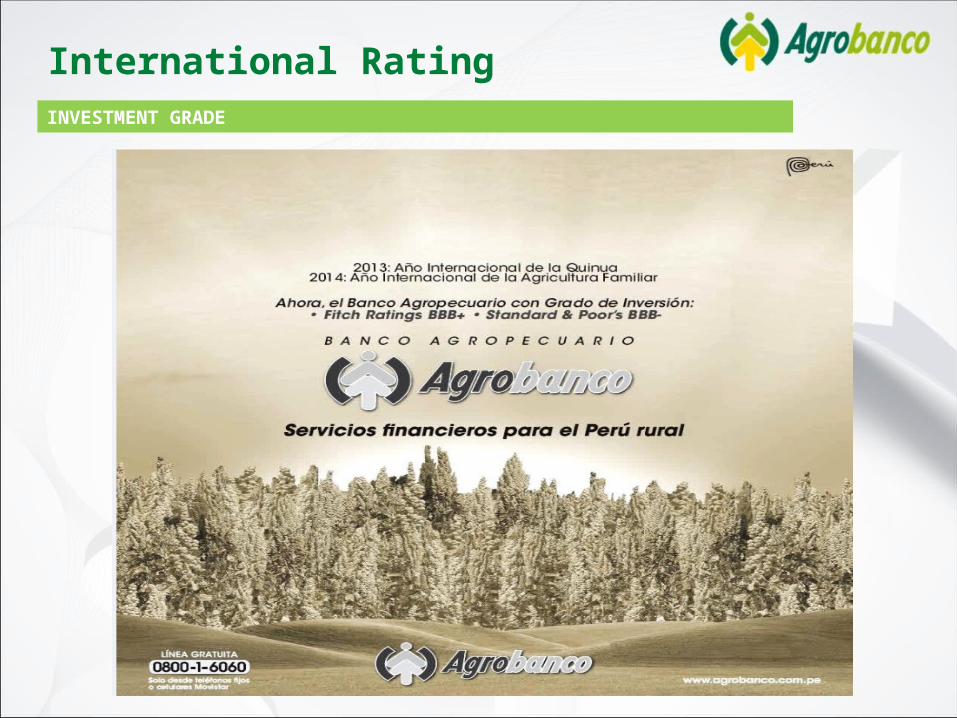
INVESTMENT GRADE
International Rating
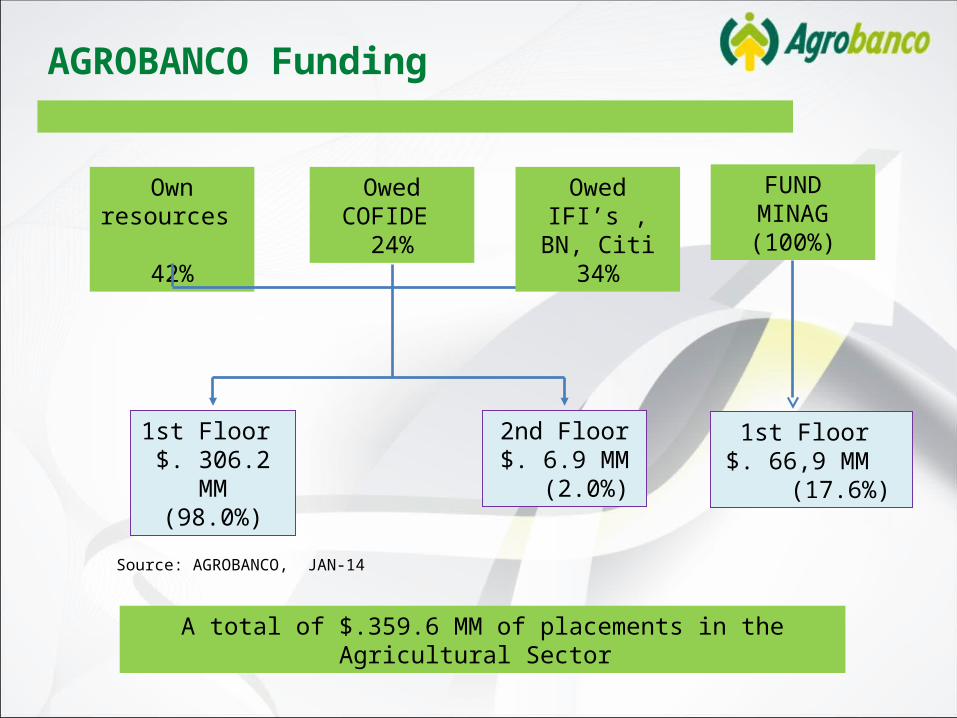
Own resources
42%
OwedCOFIDE
24%
A total of $.359.6 MM of placements in the Agricultural Sector
Source: AGROBANCO, JAN-14
1st Floor $. 306.2 MM
(98.0%)
2nd Floor$. 6.9 MM (2.0%)
OwedIFI’s , BN, Citi
34%
FUNDMINAG(100%)
1st Floor $. 66,9 MM
(17.6%)
AGROBANCO Funding
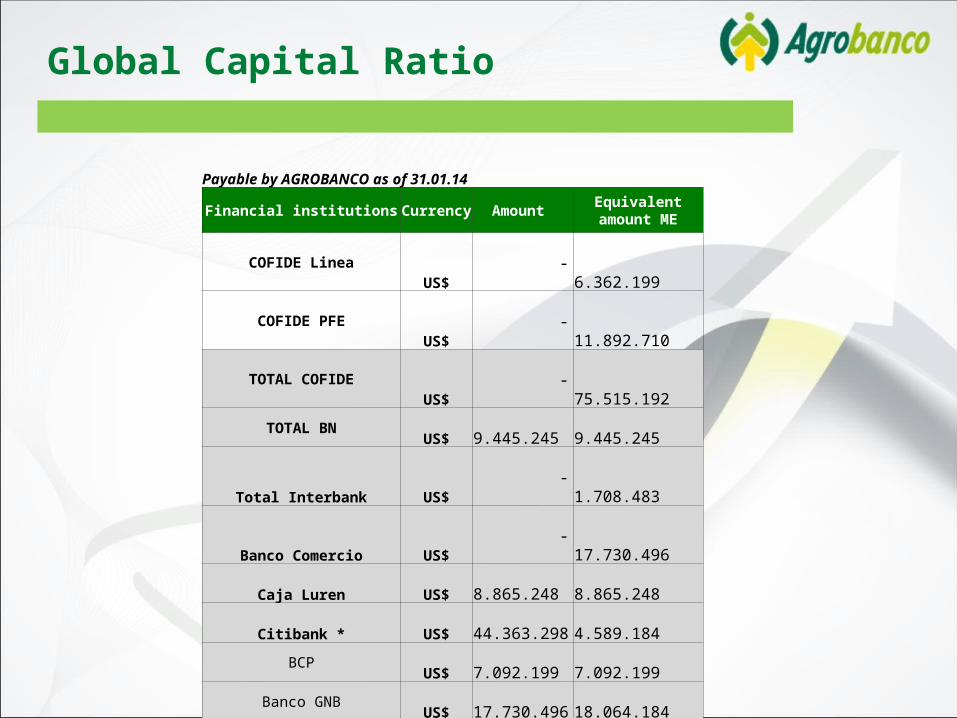
Global Capital Ratio
Payable by AGROBANCO as of 31.01.14
Financial institutions Currency Amount Equivalent amount ME
COFIDE Linea US$ - 6.362.199 COFIDE PFE US$ - 11.892.710
TOTAL COFIDEUS$ - 75.515.192
TOTAL BN US$ 9.445.245 9.445.245 Total Interbank US$ - 1.708.483
Banco Comercio US$ - 17.730.496
Caja Luren US$ 8.865.248 8.865.248 Citibank * US$ 44.363.298 4.589.184
BCP US$ 7.092.199 7.092.199 Banco GNB US$ 17.730.496 18.064.184
TOTAL - 182.450.658
COFIDE 75.515.192
Loans from third parties 106.935.466
Funding 182.450.658

Section ElevenANNEXES

Section ElevenHuman Resources and Business Managers
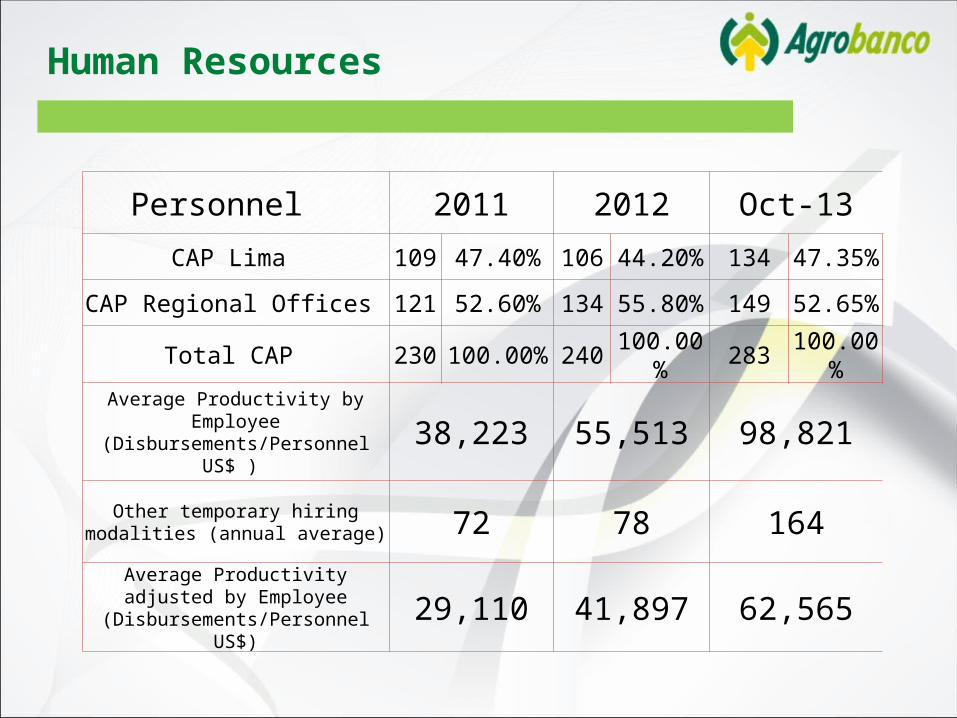
Human Resources
Personnel 2011 2012 Oct-13
CAP Lima 109 47.40% 106 44.20% 134 47.35%
CAP Regional Offices 121 52.60% 134 55.80% 149 52.65%
Total CAP 230 100.00% 240 100.00% 283 100.00%
Average Productivity by Employee (Disbursements/Personnel US$ ) 38,223 55,513 98,821
Other temporary hiring modalities (annual average) 72 78 164
Average Productivity adjusted by Employee (Disbursements/Personnel
US$)29,110 41,897 62,565
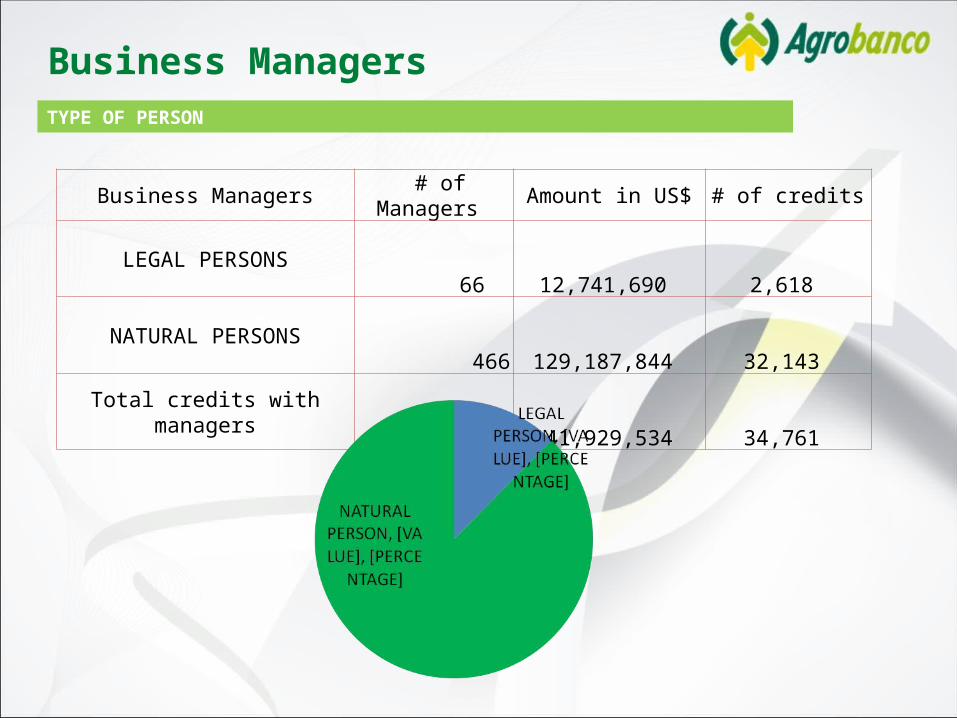
Business Managers # of Managers Amount in US$ # of credits
LEGAL PERSONS 66 12,741,690
2,618
NATURAL PERSONS 466 129,187,844
32,143
Total credits with managers 532 141,929,534
34,761
TYPE OF PERSON
Business Managers
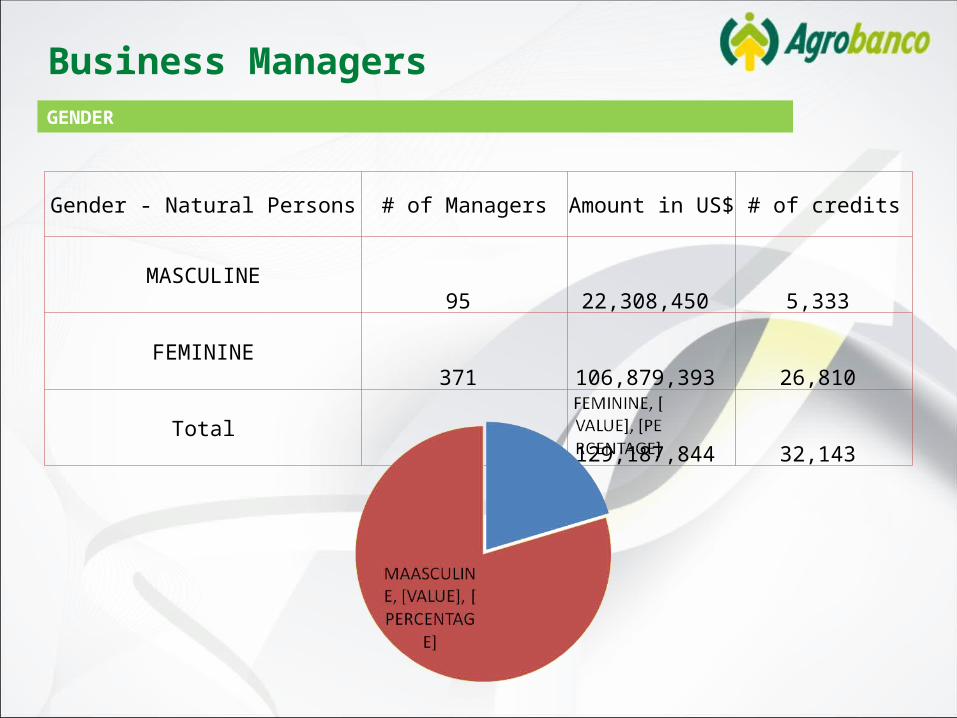
Gender - Natural Persons # of Managers Amount in US$ # of credits
MASCULINE 95 22,308,450 5,333
FEMININE 371 106,879,393 26,810
Total466 129,187,844 32,143
GENDER
Business Managers

Section ElevenOther Services
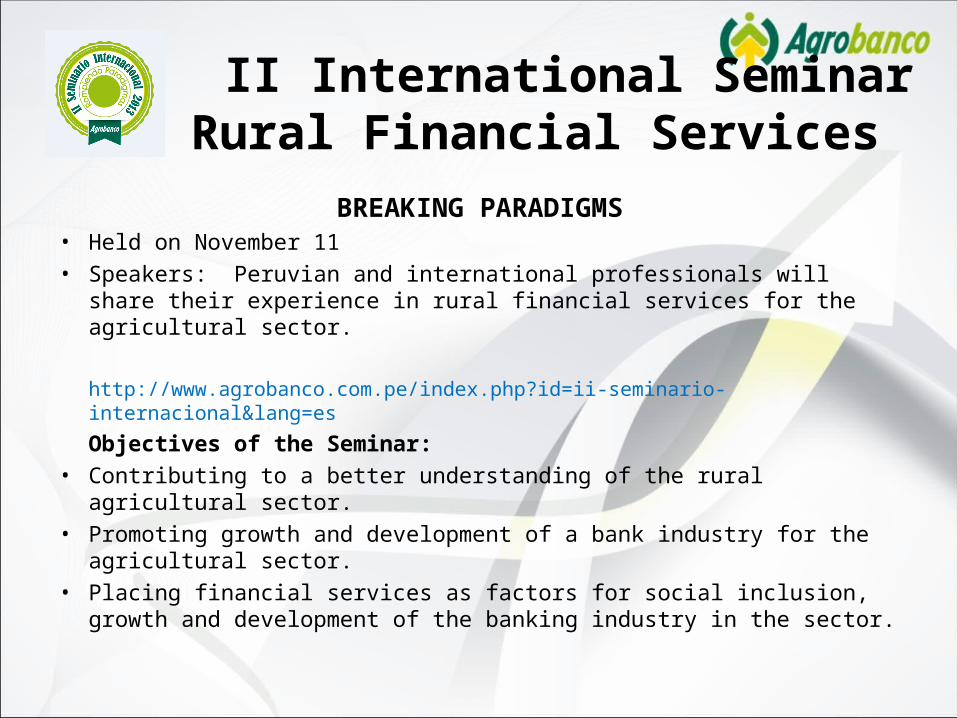
II International Seminar on Rural Financial ServicesBREAKING PARADIGMS
• Held on November 11• Speakers: Peruvian and international professionals will share their
experience in rural financial services for the agricultural sector.
http://www.agrobanco.com.pe/index.php?id=ii-seminario-internacional&lang=es
Objectives of the Seminar:• Contributing to a better understanding of the rural agricultural sector. • Promoting growth and development of a bank industry for the agricultural
sector. • Placing financial services as factors for social inclusion, growth and
development of the banking industry in the sector.

Statistical Maps

Non-Financial Serv. Platform
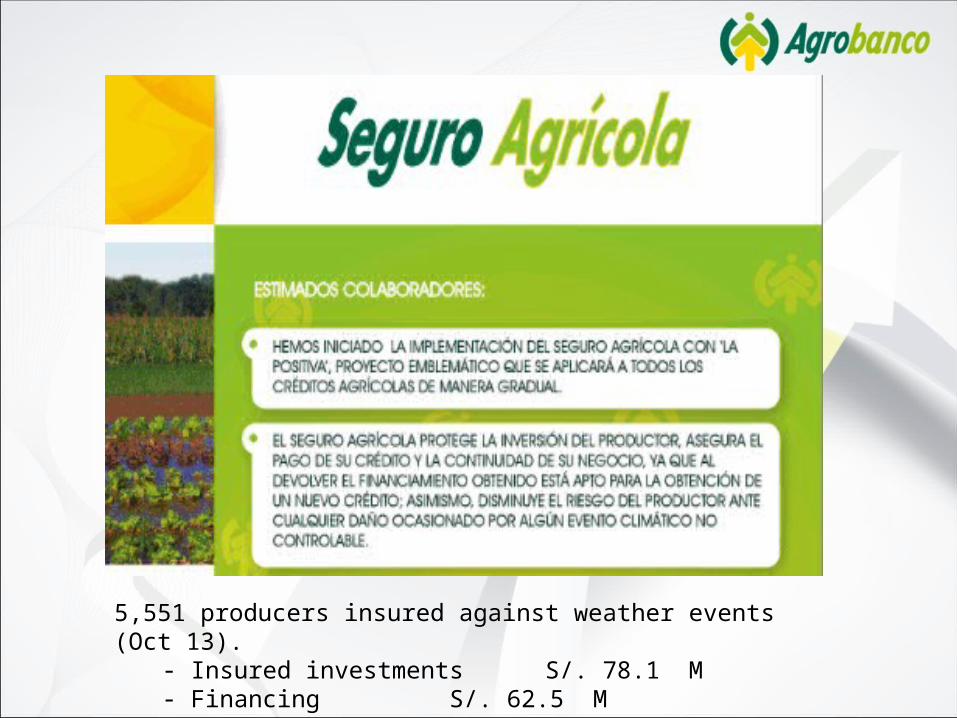
5,551 producers insured against weather events (Oct 13).- Insured investments S/. 78.1 M- Financing S/. 62.5 M
Section ElevenOther Variables
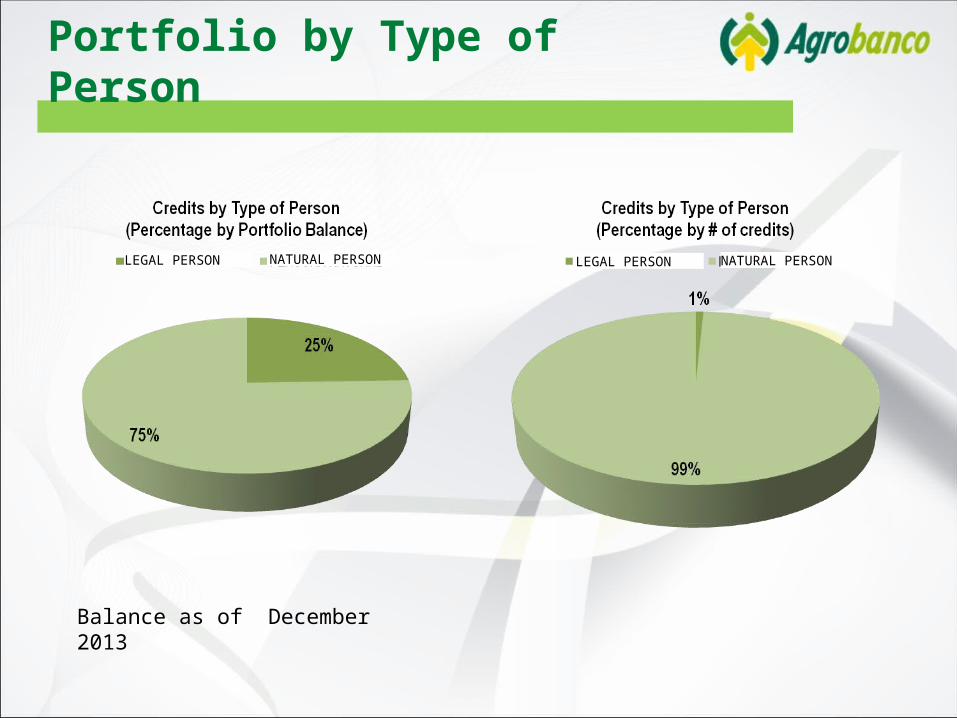
Portfolio by Type of Person
Balance as of December 2013
LEGAL PERSON NATURAL PERSON LEGAL PERSON NATURAL PERSON
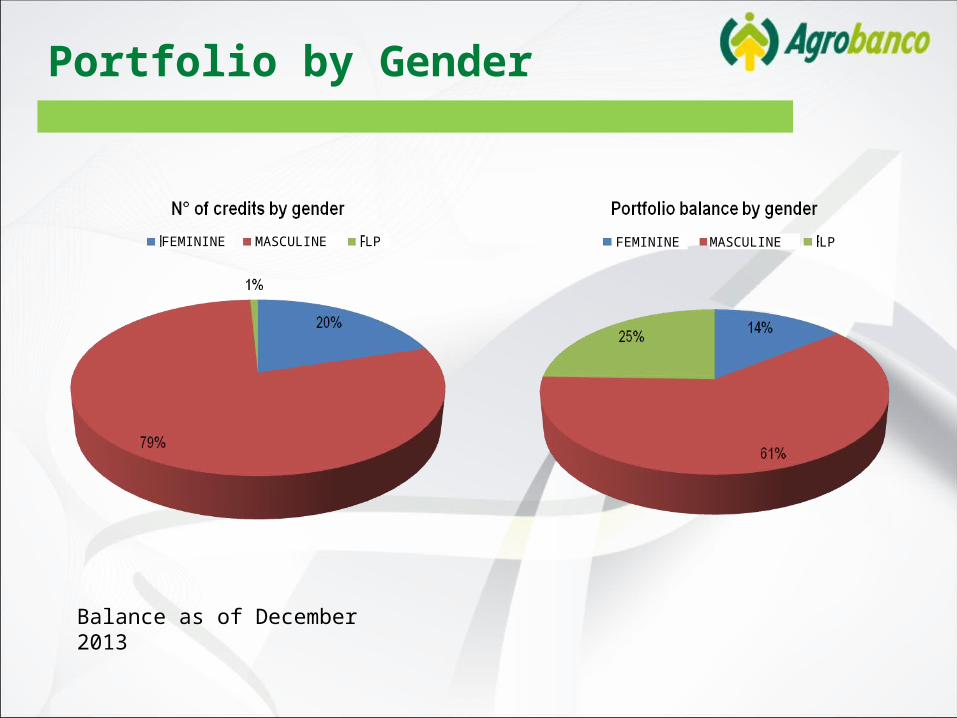
Portfolio by Gender
Balance as of December 2013
FEMININE MASCULINE LP FEMININE MASCULINE LP
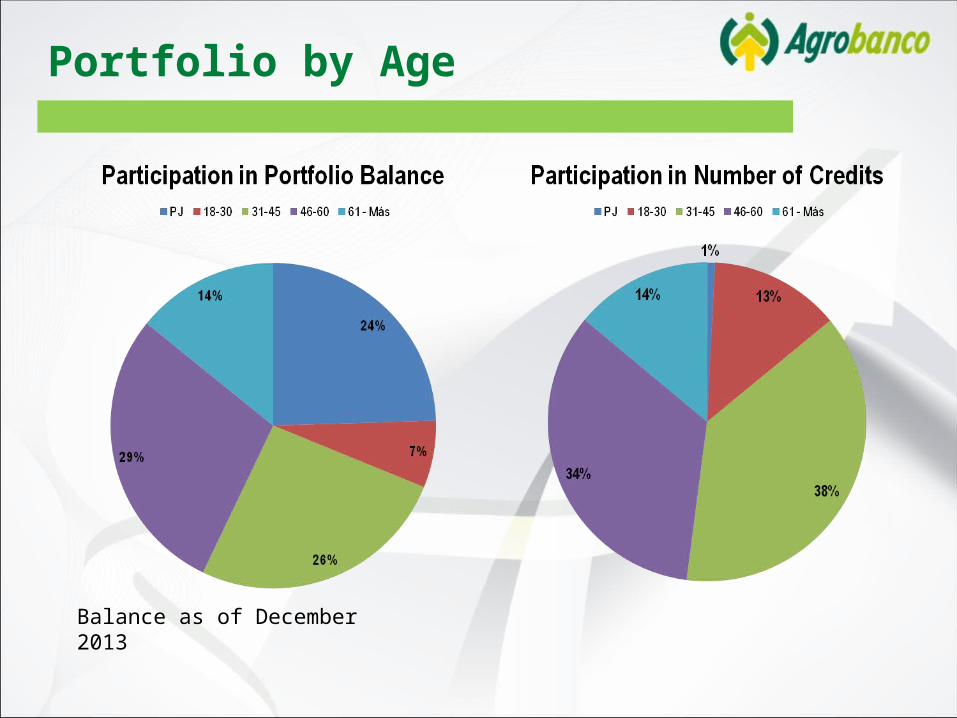
Portfolio by Age
Balance as of December 2013