Embed Size (px)
DESCRIPTION
Agriculture Fruit Farm Business Plan
Citation preview
Thanks for downloading a sample plan from Bplans.com
A sample plan is a great way to get started, but you can’t just print this plan out and turn it into the bank. You’re still going to have to put in all your own information and do all of your own financial forecasts.
With LivePlan, you can easily use this sample as inspiration and create your own plan, complete with financial tables and graphs. You’ll also be able to:
• Save time with linked financial tables (the formulas are built in, so you don’t have to do the calculations!)• Benefit from tons of help, advice, and resources.• Present your plan with confidence, with automatic charts and graphs corresponding to your financial data.• Work on your plan anywhere, on any computer.
“For 20 dollars I ended up getting a quarter of a million dollars of funding. That’s worth it!” – Todd C. Tablegate
Click here to save 50% off the first month of LivePlan!
Cover Page
This sample business plan has been made available to users of Business Plan Pro®, business planning software published by Palo Alto Software, Inc. Names, locations and numbers may have been changed, and substantial portions of the original plan text may have been omitted to preserve confidentiality and proprietary information.
You are welcome to use this plan as a starting point to create your own, but you do not have permission to resell, reproduce, publish, distribute or even copy this plan as it exists here.
Requests for reprints, academic use, and other dissemination of this sample plan should be emailed to the marketing department of Palo Alto Software at [email protected]. For product information visit our website: www.paloalto.com or call: 1-800-229-7526.
Copyright © Palo Alto Software, Inc., 1995-2009 All rights reserved.
Legal Page
Confidentiality Agreement
The undersigned reader acknowledges that the information provided by _______________ in this business plan is confidential; therefore, reader agrees not to disclose it without the express written permission of _______________.
It is acknowledged by reader that information to be furnished in this business plan is in all respects confidential in nature, other than information which is in the public domain through other means and that any disclosure or use of same by reader, may cause serious harm or damage to _______________.
Upon request, this document is to be immediately returned to _______________.
___________________ Signature
___________________Name (typed or printed)
___________________Date
This is a business plan. It does not imply an offering of securities.
Table of Contents
1.0 Executive Summary......................................................................................................................11.1 Mission...........................................................................................................................................2
2.0 Company Summary......................................................................................................................22.1 Start-up Summary.....................................................................................................................2
Table: Start-up...............................................................................................................................3Chart: Start-up...............................................................................................................................3
2.2 Company Locations and Facilities.......................................................................................43.0 Products............................................................................................................................................4
3.1 Product Description..................................................................................................................53.2 Technology...................................................................................................................................53.3 Future Products..........................................................................................................................5
4.0 Market Analysis Summary.........................................................................................................64.1 Market Segmentation..............................................................................................................74.2 Industry Analysis........................................................................................................................74.3 Target Market Segment Strategy........................................................................................7
Table: Market Analysis................................................................................................................8Chart: Market Analysis (Pie)......................................................................................................8
5.0 Strategy and Implementation Summary..............................................................................95.1 Competitive Edge......................................................................................................................95.2 Marketing Strategy...................................................................................................................9
5.2.1 Pricing Strategy..................................................................................................................95.3 Sales Strategy...........................................................................................................................105.4 Strategic Alliances...................................................................................................................10
6.0 Sales Forecast...............................................................................................................................10Table: Sales Forecast.................................................................................................................10Chart: Sales Monthly..................................................................................................................11Chart: Sales by Year...................................................................................................................11
7.0 Management Summary.............................................................................................................127.1 Personnel Plan..........................................................................................................................12
Table: Personnel..........................................................................................................................128.0 Financial Plan Summary............................................................................................................138.0 Financial Plan Summary............................................................................................................13
8.1 Start-up Funding......................................................................................................................13Table: Start-up Funding............................................................................................................14
8.2 Important Assumptions.........................................................................................................158.2 Important Assumptions.........................................................................................................15
Table: General Assumptions...................................................................................................158.3 Break-even Analysis...............................................................................................................168.3 Break-even Analysis...............................................................................................................16
Chart: Break-even Analysis.....................................................................................................16Table: Break-even Analysis.....................................................................................................16
8.4 Projected Profit and Loss......................................................................................................178.4 Projected Profit and Loss......................................................................................................17
Table: Profit and Loss................................................................................................................17Chart: Profit Monthly..................................................................................................................18Chart: Profit Yearly.....................................................................................................................18
Page 1
Table of Contents
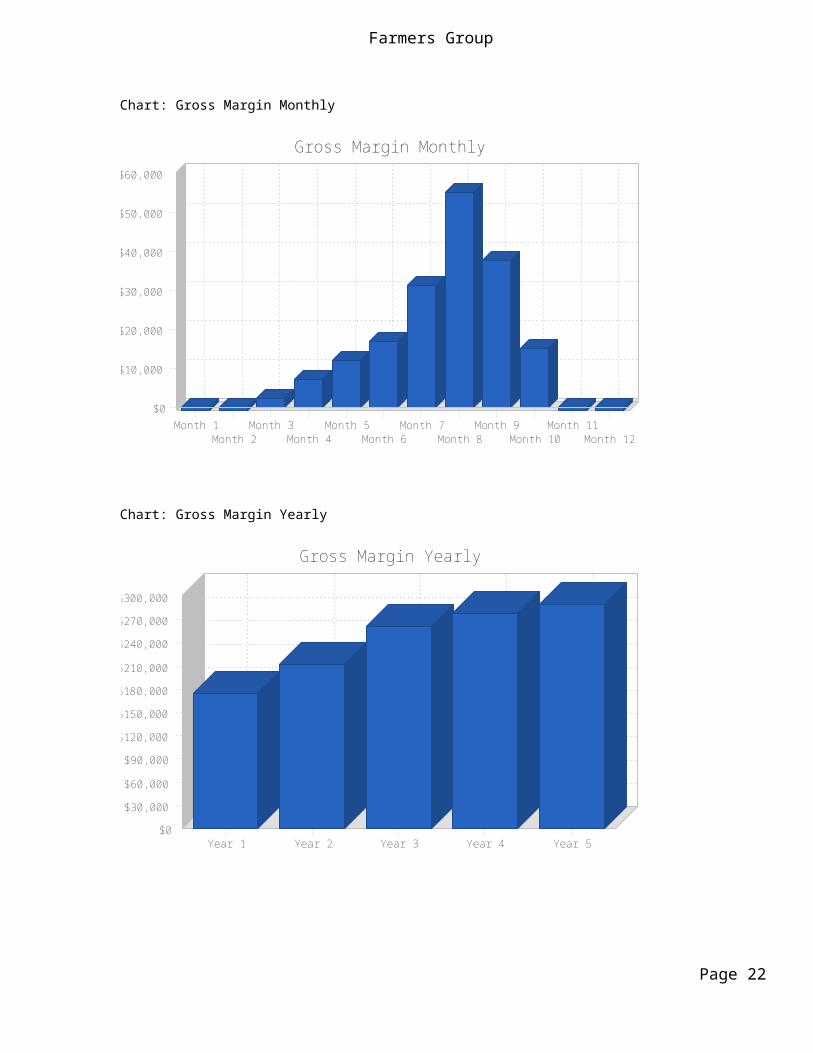
Chart: Gross Margin Monthly..................................................................................................19Chart: Gross Margin Yearly......................................................................................................19
8.5 Projected Cash Flow...............................................................................................................20Chart: Cash....................................................................................................................................20Table: Cash Flow.........................................................................................................................21
8.6 Projected Balance Sheet.......................................................................................................228.6 Projected Balance Sheet.......................................................................................................22
Table: Balance Sheet.................................................................................................................228.7 Business Ratios........................................................................................................................238.7 Business Ratios........................................................................................................................23
Table: Ratios.................................................................................................................................23Table: Sales Forecast...........................................................................................................................1Table: General Assumptions.............................................................................................................2Table: General Assumptions.............................................................................................................2Table: Cash Flow...................................................................................................................................3Table: Cash Flow...................................................................................................................................3Table: Balance Sheet...........................................................................................................................5Table: Balance Sheet...........................................................................................................................5Table: Profit and Loss..........................................................................................................................6Table: Profit and Loss..........................................................................................................................6Table: Personnel....................................................................................................................................7Table: Personnel....................................................................................................................................7
Page 2
Farmers Group
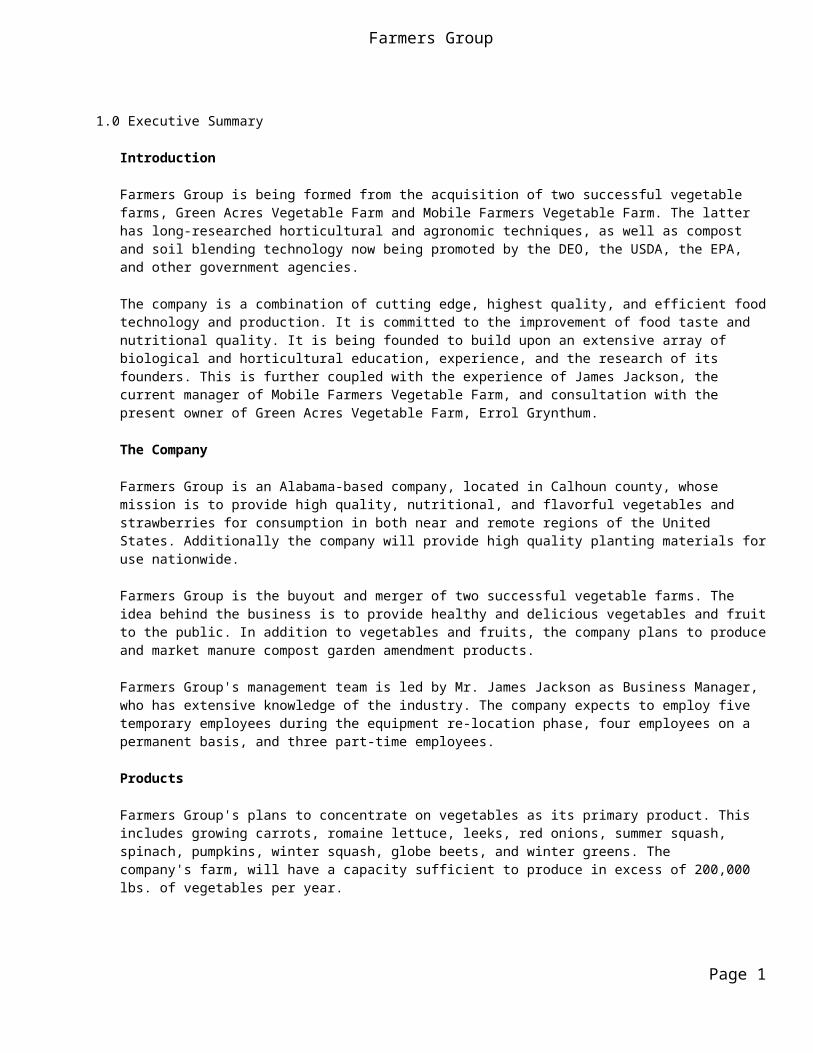
1.0 Executive Summary
Introduction
Farmers Group is being formed from the acquisition of two successful vegetable farms, Green Acres Vegetable Farm and Mobile Farmers Vegetable Farm. The latter has long-researched horticultural and agronomic techniques, as well as compost and soil blending technology now being promoted by the DEO, the USDA, the EPA, and other government agencies.
The company is a combination of cutting edge, highest quality, and efficient food technology and production. It is committed to the improvement of food taste and nutritional quality. It is being founded to build upon an extensive array of biological and horticultural education, experience, and the research of its founders. This is further coupled with the experience of James Jackson, the current manager of Mobile Farmers Vegetable Farm, and consultation with the present owner of Green Acres Vegetable Farm, Errol Grynthum.
The Company
Farmers Group is an Alabama-based company, located in Calhoun county, whose mission is to provide high quality, nutritional, and flavorful vegetables and strawberries for consumption in both near and remote regions of the United States. Additionally the company will provide high quality planting materials for use nationwide.
Farmers Group is the buyout and merger of two successful vegetable farms. The idea behind the business is to provide healthy and delicious vegetables and fruit to the public. In addition to vegetables and fruits, the company plans to produce and market manure compost garden amendment products.
Farmers Group's management team is led by Mr. James Jackson as Business Manager, who has extensive knowledge of the industry. The company expects to employ five temporary employees during the equipment re-location phase, four employees on a permanent basis, and three part-time employees.
Products
Farmers Group's plans to concentrate on vegetables as its primary product. This includes growing carrots, romaine lettuce, leeks, red onions, summer squash, spinach, pumpkins, winter squash, globe beets, and winter greens. The company's farm, will have a capacity sufficient to produce in excess of 200,000 lbs. of vegetables per year.
The company plans to utilize traditional and more advanced plant technologies to produce new cultivars of strawberries and lima beans with locally-adapted superior characteristics for the Gulf-South growing area.
This strategy will allow Farmers Group to produce crops during most of the year and will allow double cultivation of the greenhouses with almost no additional heating necessary in the winter months.
The Market
Over the past decade the market for organic food has grown by 15% to 20% and every year 40% of U.S. consumers occasionally reach for something labeled organic. Sales for organic
Page 1
Farmers Group
foods are expected to top $11 billion this year. Sales by farmers' markets have increased by 79% since 1994, to 3,137 markets in all 50 states, and the number of farmers who sell at them has more than tripled to 67,000. About three million Americans a week now get their fresh food directly from the farmers who grew it. This makes for an excellent environment for a industry participant such as Farmers Group that is willing to compete in a niche market and be first to the market with new products.
Financial Considerations
The company is seeking $830,000 in both short-term and long-term loans to finance the purchase of Farmers Group's new farm, upgrade the facilities, and cover start-up expenses and first year losses. It is estimated that the company will begin to make a profit in Year 2 of operations. The company does not expect to have any cash flow problems during the first four years of operations.
1.1 Mission
Farmers Group is an Alabama-based company, whose mission is to provide high quality, nutritional, and flavorful vegetables and strawberries for consumption in both near and remote regions of the United States. Additionally the company will provide high quality planting materials for use nationwide.
2.0 Company Summary
Farmers Group is the buyout and merger of two successful vegetable farms. The idea behind the business is to provide healthy and delicious vegetables and fruit to the public. In addition to vegetables and fruits, the company plans to produce and market manure compost garden amendment products.
2.1 Start-up Summary
Projected revenues for Year 1 to Year 5 are $-40,000, $8,500, $50,000, $70,800 and $82,500 respectively. Additionally the company estimates that once fully operational, income per product, per annum would be as follows; vegetable ($50,000) manure ($20,000) and horticulture ($10,000).
Page 2
Farmers Group
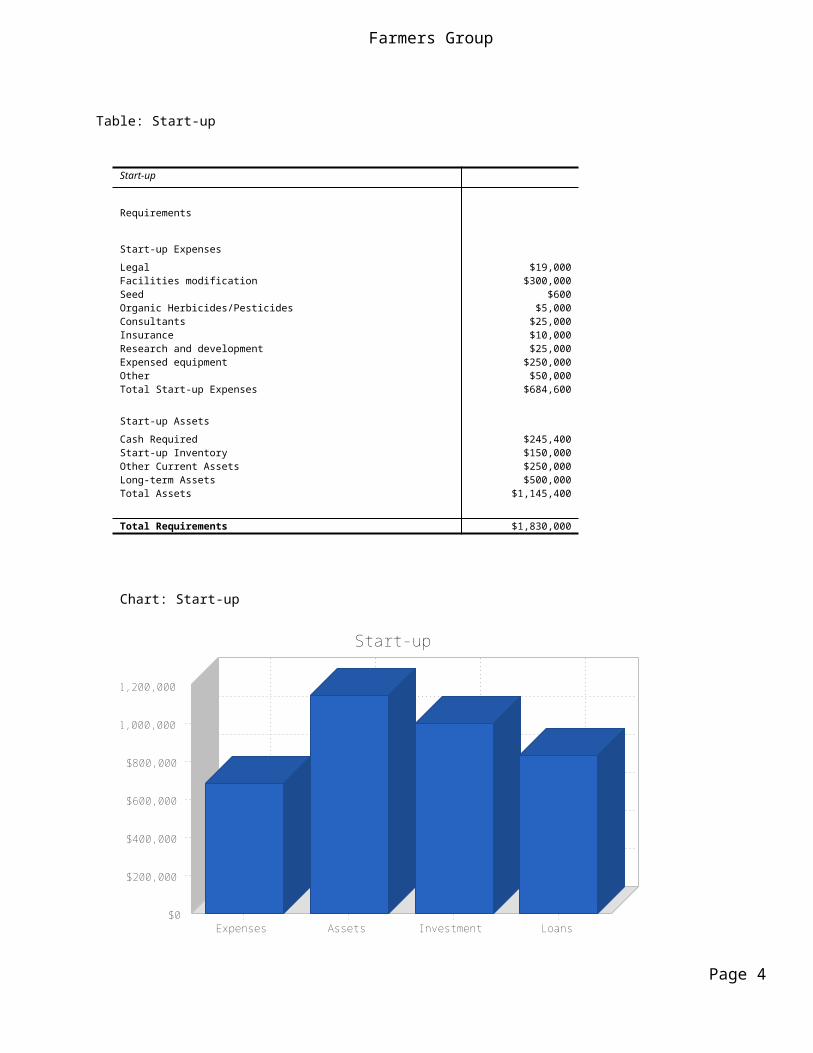
Table: Start-up
Start-up
Requirements
Start-up Expenses
Legal $19,000 Facilities modification $300,000 Seed $600 Organic Herbicides/Pesticides $5,000 Consultants $25,000 Insurance $10,000 Research and development $25,000 Expensed equipment $250,000 Other $50,000 Total Start-up Expenses $684,600
Start-up Assets
Cash Required $245,400 Start-up Inventory $150,000 Other Current Assets $250,000 Long-term Assets $500,000 Total Assets $1,145,400
Total Requirements $1,830,000
Chart: Start-up
$0
$200,000
$400,000
$600,000
$800,000
$1,000,000
$1,200,000
Expenses Assets Investment Loans
Start-up
Page 3
Farmers Group
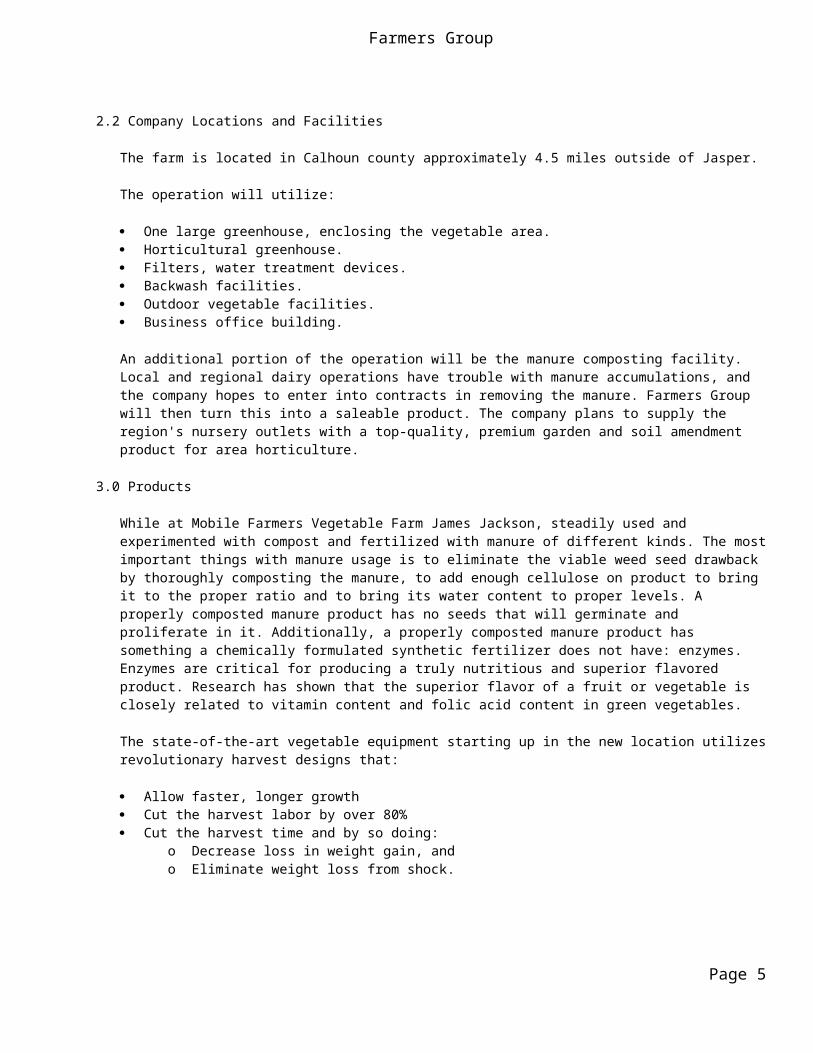
2.2 Company Locations and Facilities
The farm is located in Calhoun county approximately 4.5 miles outside of Jasper.
The operation will utilize:
One large greenhouse, enclosing the vegetable area. Horticultural greenhouse. Filters, water treatment devices. Backwash facilities. Outdoor vegetable facilities. Business office building.
An additional portion of the operation will be the manure composting facility. Local and regional dairy operations have trouble with manure accumulations, and the company hopes to enter into contracts in removing the manure. Farmers Group will then turn this into a saleable product. The company plans to supply the region's nursery outlets with a top-quality, premium garden and soil amendment product for area horticulture.
3.0 Products
While at Mobile Farmers Vegetable Farm James Jackson, steadily used and experimented with compost and fertilized with manure of different kinds. The most important things with manure usage is to eliminate the viable weed seed drawback by thoroughly composting the manure, to add enough cellulose on product to bring it to the proper ratio and to bring its water content to proper levels. A properly composted manure product has no seeds that will germinate and proliferate in it. Additionally, a properly composted manure product has something a chemically formulated synthetic fertilizer does not have: enzymes. Enzymes are critical for producing a truly nutritious and superior flavored product. Research has shown that the superior flavor of a fruit or vegetable is closely related to vitamin content and folic acid content in green vegetables.
The state-of-the-art vegetable equipment starting up in the new location utilizes revolutionary harvest designs that:
Allow faster, longer growth Cut the harvest labor by over 80% Cut the harvest time and by so doing:
o Decrease loss in weight gain, and o Eliminate weight loss from shock.
Page 4
Farmers Group
3.1 Product Description
Vegetables
Farmers Group's first line of production will be the green vegetable and red vegetable. During the summer months Farmers Group will be growing carrots, romaine lettuce, leeks, red onions, summer squash, and spinach. In the fall, production will center on pumpkins, winter squash, globe beets and winter greens. With the growth of the popular organic food niche, and the federal government's new organic labeling policy, Farmers Group will focus its produce on the intermediate organic label. This means that approximately 70% of the food production process will be organic and all foods produced by Farmers Group will be eligible for the "contains organic ingredients" label. The company's farm will have a capacity sufficient to produce in excess of 200,000 lbs. of vegetables per year.
Strawberries
The company's more technical horticultural aspects include efforts to utilize traditional and more advanced plant technologies to produce new cultivars of crops such as strawberries and lima beans with locally-adapted superior characteristics for the Gulf-South growing area. Flavor, disease resistance, adaptability to green-house culture, fall and winter season production are factors being combined in greens cultivation to tap into the $2.99 pint berry market of the fall and winter.
Farmers Group's strategy is a combination of the two technologies during the cool winter months which will allow the utilization of normally wasted space in the greenhouses for the high price winter greens production. This will allow double cultivation of the greenhouses with almost no additional heating necessary in this climate.
3.2 Technology
The company is currently seeking contact with Alabama universities in order to learn about and acquire new hybrids of strawberries and vegetables that are hardier and grow faster in our local microclimates. These and other available species and systems will be constantly tracked.
In addition to the above, the company is seeking contacts at Universities in Italy and Germany that are involved in greens, and will continue the quest for the best flavored, large, and firm fall and winter strawberries.
Currently, Farmers Group is conducting research to test certain clay-sand-manure mixture levels to obtain better, cheaper bedding and agronomic soil mixtures that are more effective than the standard used in the industry in Alabama (Pine bark mulch-composted).
3.3 Future Products
In the meantime, the company would like to explore the possibilities of crayfish production. Farmers Group believes this to be a high revenue venture with retail prices running in excess of $15.00 per pound in most places. The company also believes that if crayfish production is successful then it could become the number one endeavor of Farmers Group.
Currently there is a defunct fish farming production facility with all the necessary capital equipment approximately two miles from the current farm. Purchase of this facility would allow Farmers Group to begin production and to capitalize on this higher margin product. What makes
Page 5
Farmers Group
this most attractive is the two ventures have significant joint cost potential, allowing for a reduction in marginal costs for all products and creation of real economies of scale that would provide Farmers Group with a competitive advantage.
4.0 Market Analysis Summary
At a time when eating has become a political statement, the government is paying up to $19 billion a year to subsidize commodity crops in a glutted global market. Federal officials say that nearly 40% of all farm income now comes directly from government subsidies, and the farm bill signed by President Bush this year will pay $190 billion over 10 years, which includes $83 billion in new spending. However, there are two market niches that are growing at an amazing rate, the organic market and the simple farmers' market.
The organic market provides less than 2% of the nation's food supply and takes up less than 1% of its cropland. But organic farms are flourishing as never before. Over the past decade the market for organic food has grown by 15 to 20% and every year 40% of U.S. consumers occasionally reach for something labeled organic. Sales for organic foods are expected to top $11 billion this year. Conglomerates as big as Heinz and General Mills are now launching or buying organic lines and selling them in mainstream supermarkets.*
With no subsidies and no middle men, farmers' markets have increased by 79% since 1994, to 3,137 markets in all 50 states, and the number of farmers who sell at them has more than tripled to 67,000, the Agriculture Department has reported. About three million Americans a week now get their fresh food directly from the farmers who grew it. "Right now, green markets are growing faster than anything in agriculture," said Dr. Steven Blank, a farm economist at the University of California at Davis and the author of three books on the subject.
These numbers, of course, represent a very thin slice of the big pie of national food. Farmers' markets reported about $1 billion in sales last year, compared with more than $200 billion in overall farm revenue. Barely 3% of the nation's two million farmers sell some of what they grow directly to consumers.
But in an era of big-box food stores, when 10 major grocery chains control the purchase of 50% of fresh food, the proliferation of open-air markets has come out of nowhere, giving more consumers an option and allowing many small farmers to stay in business.**
With these trends in mind, Farmers Groups will concentrate on:
Wholesale live vegetable markets nationwide that sell organic produce. Fresh farmers' markets. Fall and winter greens market. Nursery outlets selling composted manure.
*Source: Certified Organic Geoffrey Cowley NEWSWEEK September 30, 2000.
**Source: Farmers Markets Booming Across US Timothy Egan New York Times, September 29, 2000.
Page 6
Farmers Group
4.1 Market Segmentation
The target customers include oriental vegetable markets demanding organic and semi-organic green vegetables, vegetable processors, and private individual buyers through direct selling and farmers markets. The company will continue to service the existing customers of the purchased vegetable farms. In its greens production the company will target virtually all main food outlets. The company plans to use the Internet as one of its marketing channels in the future.
The company's target customers will be as follows:
Vegetables:
Oriental vegetable markets demanding organic and semi-organic vegetables. Vegetable processors. Alabama National Guard. People approaching the farm. Roadside stands and farmers' markets.
Product-Bagged Manure:
Nursery and Garden Centers. Private customers approaching facility. Bulk customers.
The company will also take over customers from the previous owner of the vegetable facility. Farmers Group has an established list of present customers of Errol Grynthum's vegetable farm, which is a major asset to the sales of the company.
4.2 Industry Analysis
Alabama is one of the premier farming areas of the eastern United States. This creates an intensely competitive environment with a large number of industry participants. Since almost all of the produce is considered to be commodities, and large scale buyers are more consolidated than the farmers themselves, overall margins are small and rivalries for wholesaler contracts are strong. Competitive threats come from three main segments:
Imported vegetables of lower quality.> Mississippi pound raised vegetables. Alabama vegetable producers.
Direct competition in the individual buyers market segment comes from three farms in the immediate area including the Anniston farm, Organics-To-You farm, and the Terrance Livingston vegetable farm. Each of these competitors has produce stands as well as selling to local farmers' markets. However, with the exception of Organics-To-You Farm, none of the others focus on a niche market and depend heavily on federal subsidies.
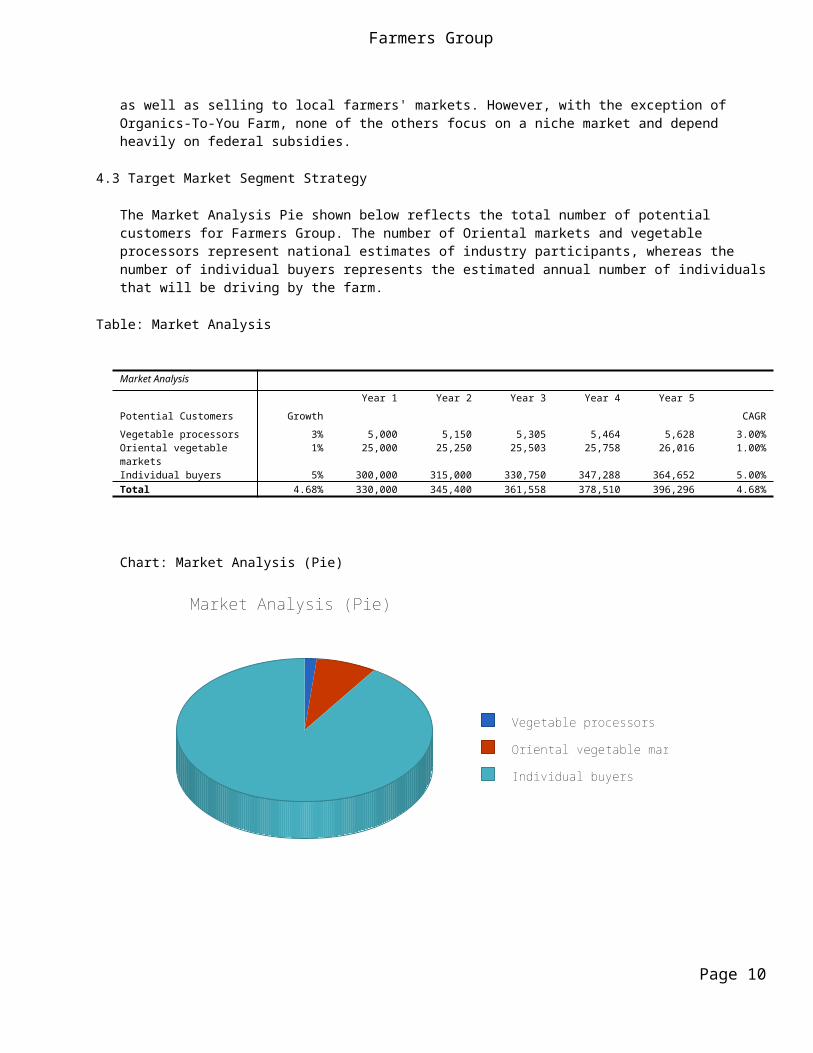
4.3 Target Market Segment Strategy
The Market Analysis Pie shown below reflects the total number of potential customers for Farmers Group. The number of Oriental markets and vegetable processors represent national estimates of industry participants, whereas the number of individual buyers represents the estimated annual number of individuals that will be driving by the farm.
Page 7
Farmers Group
Table: Market Analysis
Market Analysis
Year 1 Year 2 Year 3 Year 4 Year 5
Potential Customers Growth CAGR
Vegetable processors 3% 5,000 5,150 5,305 5,464 5,628 3.00% Oriental vegetable markets 1% 25,000 25,250 25,503 25,758 26,016 1.00% Individual buyers 5% 300,000 315,000 330,750 347,288 364,652 5.00% Total 4.68% 330,000 345,400 361,558 378,510 396,296 4.68%
Chart: Market Analysis (Pie)
Vegetable processors
Oriental vegetable markets
Individual buyers
Market Analysis (Pie)
Page 8
Farmers Group
5.0 Strategy and Implementation Summary
The Farmers Group strategy is to profitably and efficiently utilize present and future agricultural technology in the production of vegetables. The company, by acquiring an existing profitable vegetable farm with all the necessary custom-innovated equipment, will gain a significant industry advantage. Additional application and utilization of horticultural technology in the production of strawberries will allow double utilization of the climate controled portion of the overhead. Farmers Group hopes to consolidate considerable goodwill already created by exercising the option of not adding another high-production facility to the present supply-demand scenario.
The company's goals in the first year are to:
Prepare the future site. Relocate and expand Green Acres vegetable system and get it operational. Integrate greens culture into the system. Have the composting system in full production by early spring of the second year.
The company's long-term plan is to phase out whichever products are least lucrative and replace them with products that are practical and cost efficient.
5.1 Competitive Edge
Farmers Group's main competitive advantages are:
Efficient production utilizing greenhouses. Reduced overhead by fully realizing crop output potential and economies of scale through
joint costs. Knowledge due to research since 1988.
5.2 Marketing Strategy
Farmers Group will initially market and supply its products to target customers. The company is further exploring marketing opportunities on the Internet. To this extent, the company would like to set up a website to market its products.
The company will utilize aggressive advertising strategies to further market its products. These strategies include the promotion of products through the sponsoring of spots on cooking shows and exhibitions, and also engaging prominent chefs to help promote this fledgling industry.
5.2.1 Pricing Strategy
The company sets its pricing based on market rates as far as vegetable products are concerned.
Farmers Group's pricing for strawberries will exceed the average market price for the following reasons:
Taste sampling at outlets will be encouraged. Unparalleled flavor superiority will addict greens tasters. Promotion of pesticide-free, fumigant-free cultural techniques of soil, environment, ozone,
and health-friendly production techniques.
Page 9
Farmers Group
5.3 Sales Strategy
At Farmers Group, the sales process is primarily the same for vegetables as it is for composting products, in that both products will be mainly sold through wholesale marketing. As in the past, live shipments will be delivered by contract carriers in special oxygenated tanks carrying 8,000 vegetables or more, and will be continued as demanded. Farmers Group's bagged manure products will be delivered and unloaded in sizable wholesale quantities by the pallet.
Smaller, more local orders will significantly increase the overall sales when the 300-450 live vegetables carrying tank system is put into service late in 2000 or early in 2001.
The company's average sales cycle from first contact to closing of the sale is approximately 3 to 12 days for vegetable products. Farmers Group plans to shorten this cycle. Furthermore, the company estimates that from first contact to sale conclusion, the cycle for fresh strawberries will run 3 days or less. Composted products sale cycle should run from 3 to 12 days.
Direct sales contacts of vegetable markets by delivery personnel, as well as cold calling by telephone of potential market outlets, will also be employed.
5.4 Strategic Alliances
The company has strategic alliances with:
Alabama State University Horticulture Department Southeastern Alabama State University Biology Department Dr. Michael Smith - Vegetable Specialist James Edwards - Horticultural Inspection Charles Newton - Wildlife Alabama Wildlife Mobile Nursery Center
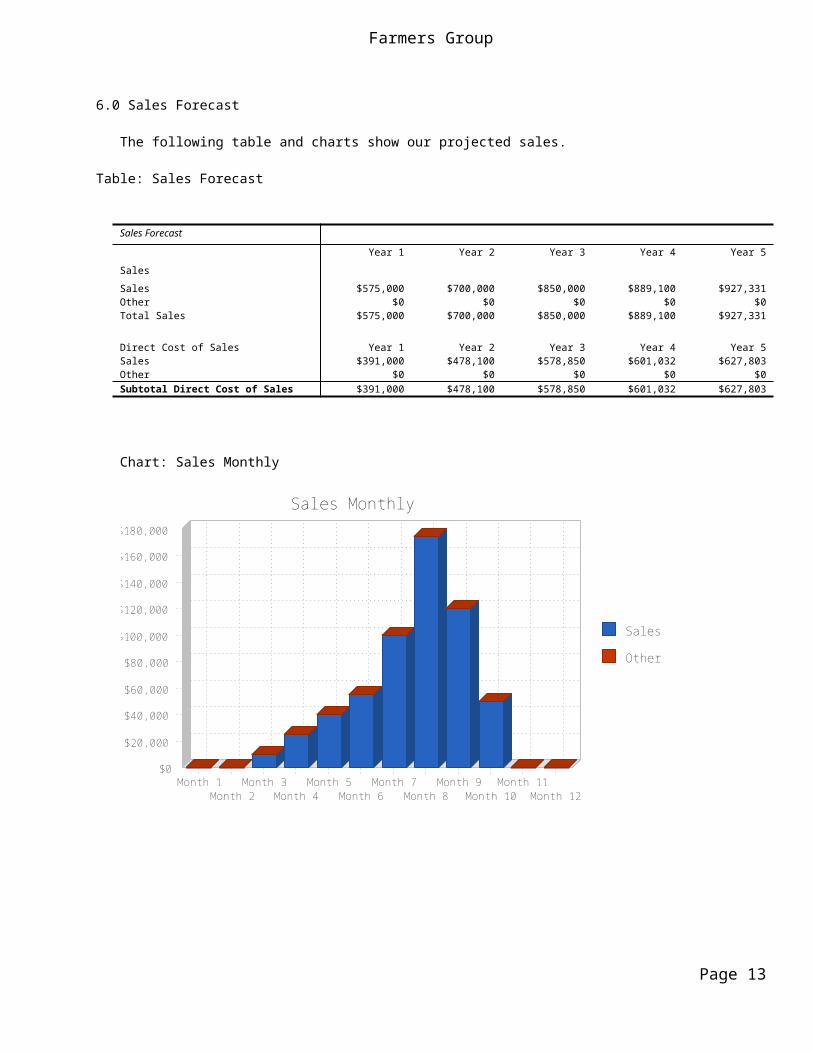
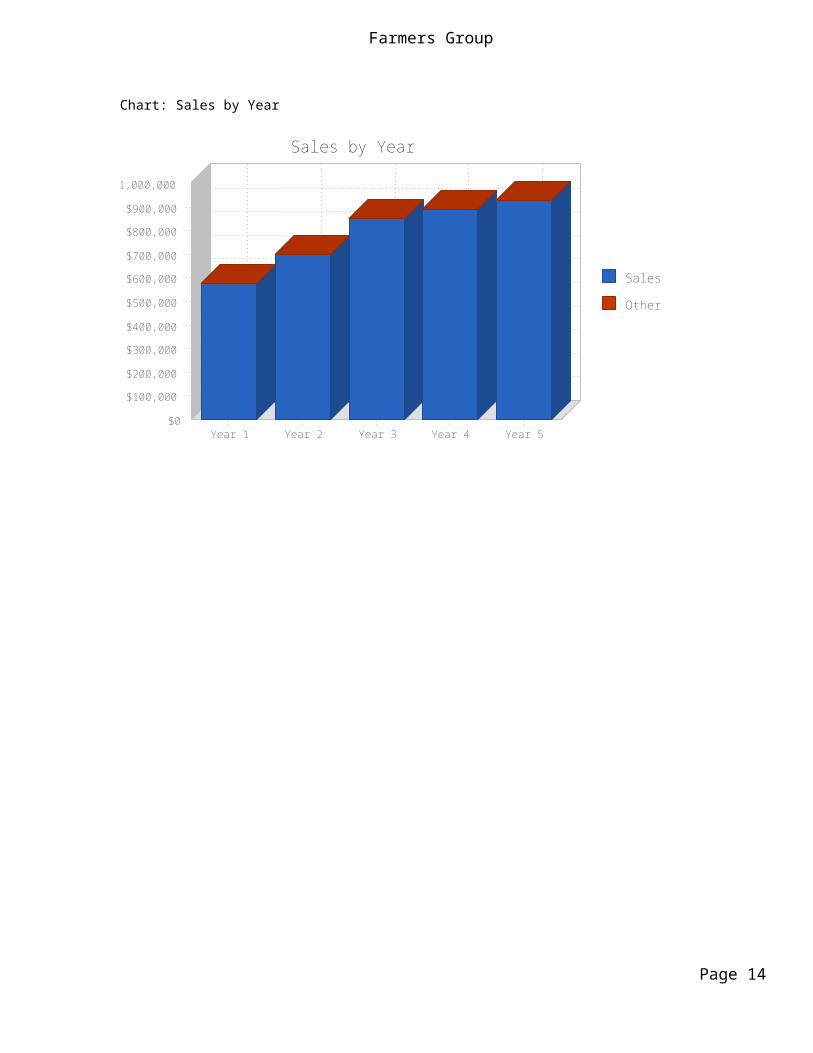
6.0 Sales Forecast
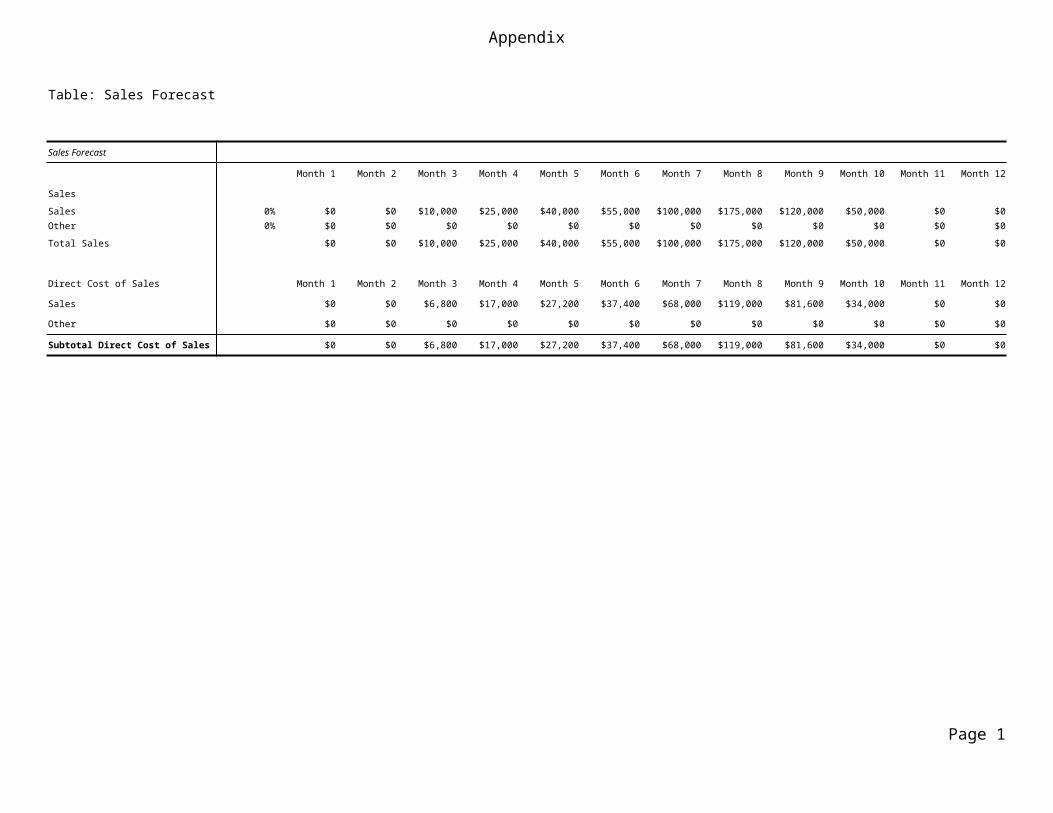
The following table and charts show our projected sales.
Table: Sales Forecast
Sales Forecast
Year 1 Year 2 Year 3 Year 4 Year 5
Sales
Sales $575,000 $700,000 $850,000 $889,100 $927,331 Other $0 $0 $0 $0 $0 Total Sales $575,000 $700,000 $850,000 $889,100 $927,331
Direct Cost of Sales Year 1 Year 2 Year 3 Year 4 Year 5Sales $391,000 $478,100 $578,850 $601,032 $627,803 Other $0 $0 $0 $0 $0 Subtotal Direct Cost of Sales $391,000 $478,100 $578,850 $601,032 $627,803
Page 10
Farmers Group
Chart: Sales Monthly
Sales
Other
$0
$20,000
$40,000
$60,000
$80,000
$100,000
$120,000
$140,000
$160,000
$180,000
Month 1 Month 2
Month 3 Month 4
Month 5 Month 6
Month 7 Month 8
Month 9 Month 10
Month 11 Month 12
Sales Monthly
Chart: Sales by Year
Sales
Other
$0
$100,000
$200,000
$300,000
$400,000
$500,000
$600,000
$700,000
$800,000
$900,000
$1,000,000
Year 1 Year 2 Year 3 Year 4 Year 5
Sales by Year
Page 11
Farmers Group
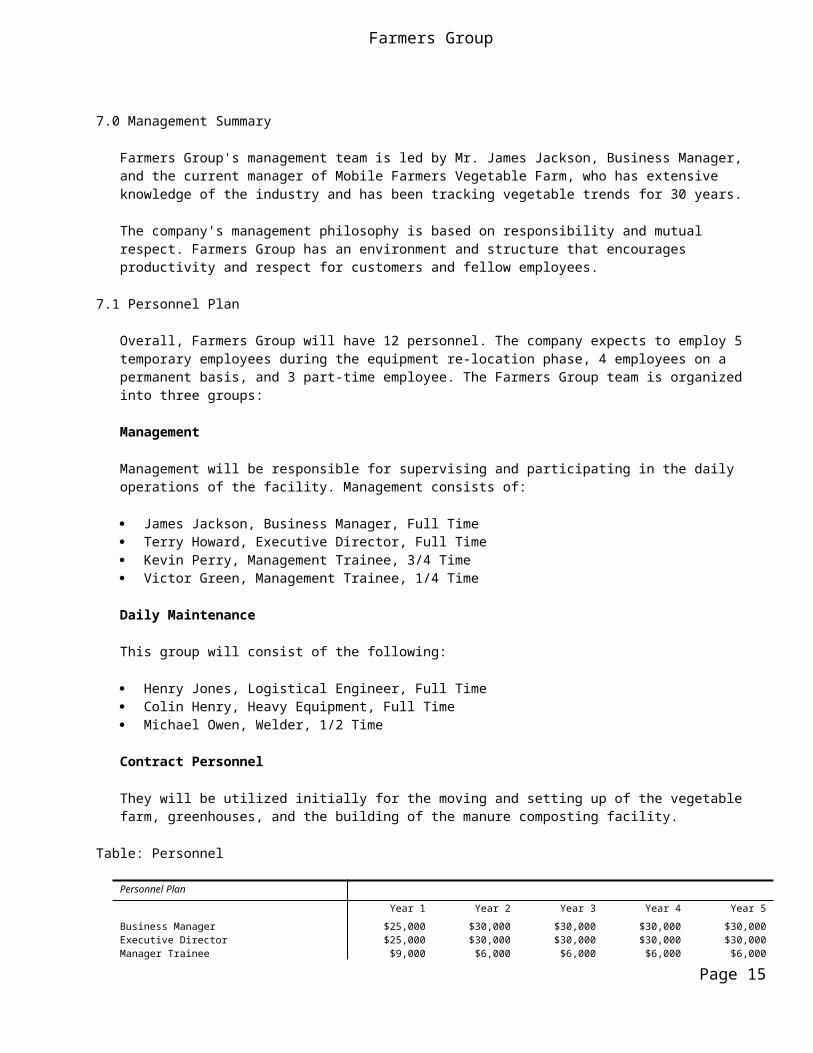
7.0 Management Summary
Farmers Group's management team is led by Mr. James Jackson, Business Manager, and the current manager of Mobile Farmers Vegetable Farm, who has extensive knowledge of the industry and has been tracking vegetable trends for 30 years.
The company's management philosophy is based on responsibility and mutual respect. Farmers Group has an environment and structure that encourages productivity and respect for customers and fellow employees.
7.1 Personnel Plan
Overall, Farmers Group will have 12 personnel. The company expects to employ 5 temporary employees during the equipment re-location phase, 4 employees on a permanent basis, and 3 part-time employee. The Farmers Group team is organized into three groups:
Management
Management will be responsible for supervising and participating in the daily operations of the facility. Management consists of:
James Jackson, Business Manager, Full Time Terry Howard, Executive Director, Full Time Kevin Perry, Management Trainee, 3/4 Time Victor Green, Management Trainee, 1/4 Time
Daily Maintenance
This group will consist of the following:
Henry Jones, Logistical Engineer, Full Time Colin Henry, Heavy Equipment, Full Time Michael Owen, Welder, 1/2 Time
Contract Personnel
They will be utilized initially for the moving and setting up of the vegetable farm, greenhouses, and the building of the manure composting facility.
Table: Personnel
Personnel Plan
Year 1 Year 2 Year 3 Year 4 Year 5
Business Manager $25,000 $30,000 $30,000 $30,000 $30,000 Executive Director $25,000 $30,000 $30,000 $30,000 $30,000 Manager Trainee $9,000 $6,000 $6,000 $6,000 $6,000 Manager Trainee $4,000 $6,000 $6,000 $6,000 $6,000 Logistic engineer $18,000 $18,000 $18,000 $18,000 $18,000 Heavy equipment $18,000 $18,000 $18,000 $18,000 $18,000 Welder $3,500 $3,000 $3,000 $3,000 $3,000 Contract workers $15,000 $0 $0 $0 $0 Total People 7 7 7 7 7
Total Payroll $117,500 $111,000 $111,000 $111,000 $111,000
Page 12
Farmers Group
8.0 Financial Plan Summary
The following topics and tables outline our financial plan.
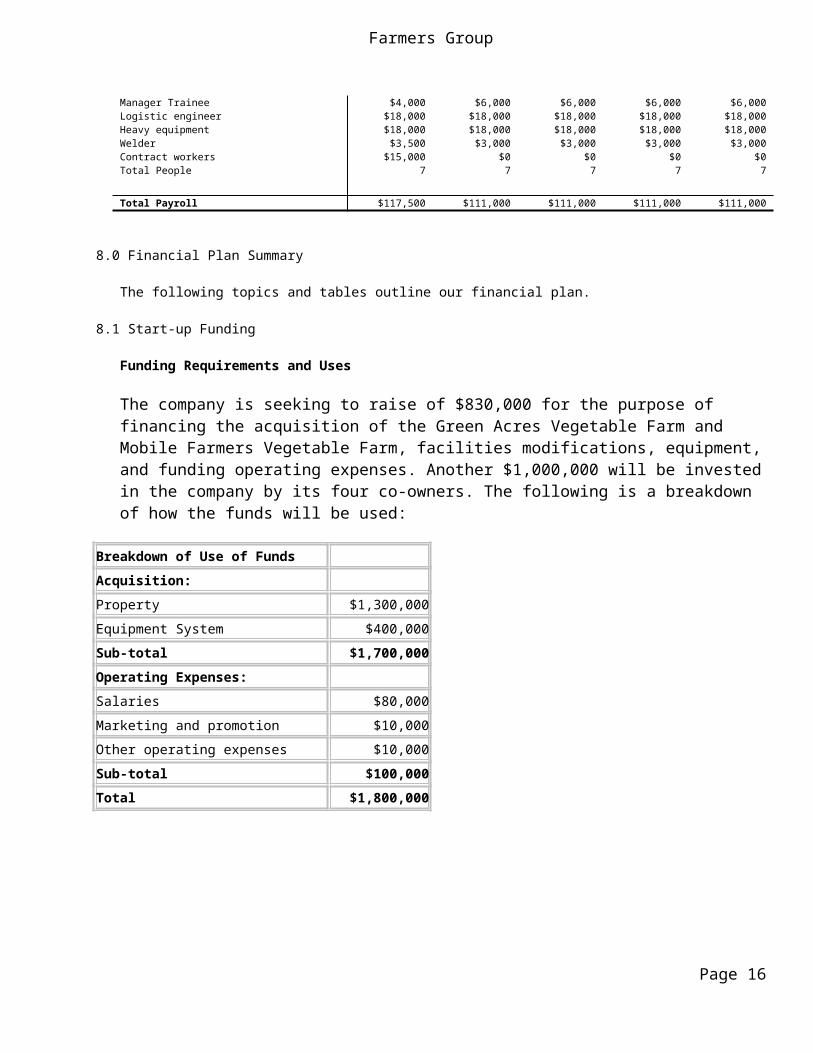
8.1 Start-up Funding
Funding Requirements and Uses
The company is seeking to raise of $830,000 for the purpose of financing the acquisition of the Green Acres Vegetable Farm and Mobile Farmers Vegetable Farm, facilities modifications, equipment, and funding operating expenses. Another $1,000,000 will be invested in the company by its four co-owners. The following is a breakdown of how the funds will be used:
Breakdown of Use of Funds
Acquisition:
Property $1,300,000
Equipment System $400,000
Sub-total $1,700,000
Operating Expenses:
Salaries $80,000
Marketing and promotion $10,000
Other operating expenses $10,000
Sub-total $100,000
Total $1,800,000
Page 13
Farmers Group
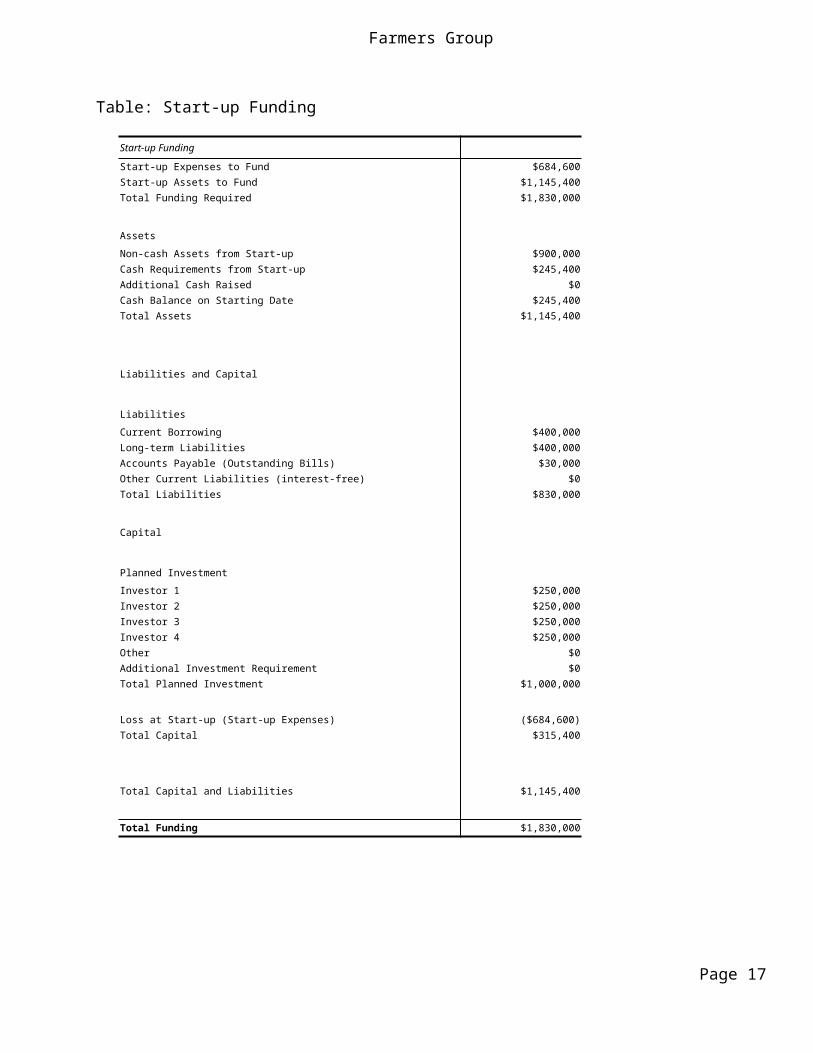
Table: Start-up Funding
Start-up Funding
Start-up Expenses to Fund $684,600 Start-up Assets to Fund $1,145,400 Total Funding Required $1,830,000
Assets
Non-cash Assets from Start-up $900,000 Cash Requirements from Start-up $245,400 Additional Cash Raised $0 Cash Balance on Starting Date $245,400 Total Assets $1,145,400
Liabilities and Capital
Liabilities
Current Borrowing $400,000 Long-term Liabilities $400,000 Accounts Payable (Outstanding Bills) $30,000 Other Current Liabilities (interest-free) $0 Total Liabilities $830,000
Capital
Planned Investment
Investor 1 $250,000 Investor 2 $250,000 Investor 3 $250,000 Investor 4 $250,000 Other $0 Additional Investment Requirement $0 Total Planned Investment $1,000,000
Loss at Start-up (Start-up Expenses) ($684,600)Total Capital $315,400
Total Capital and Liabilities $1,145,400
Total Funding $1,830,000
Page 14
Farmers Group
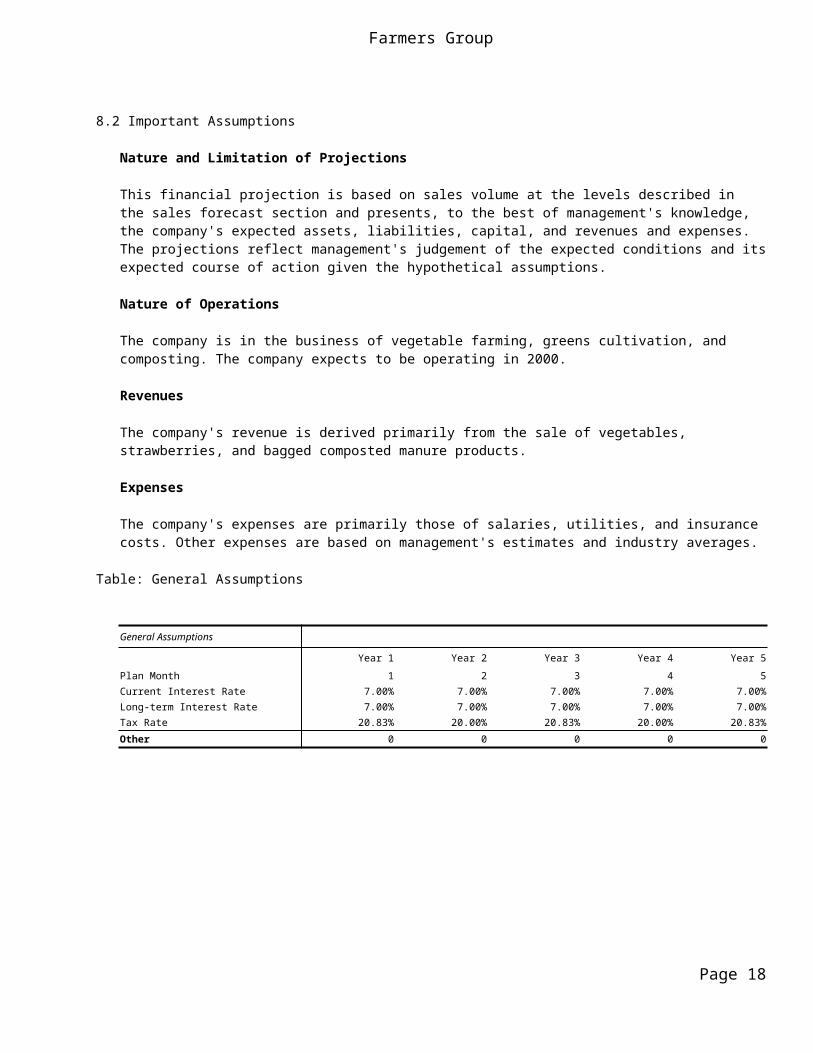
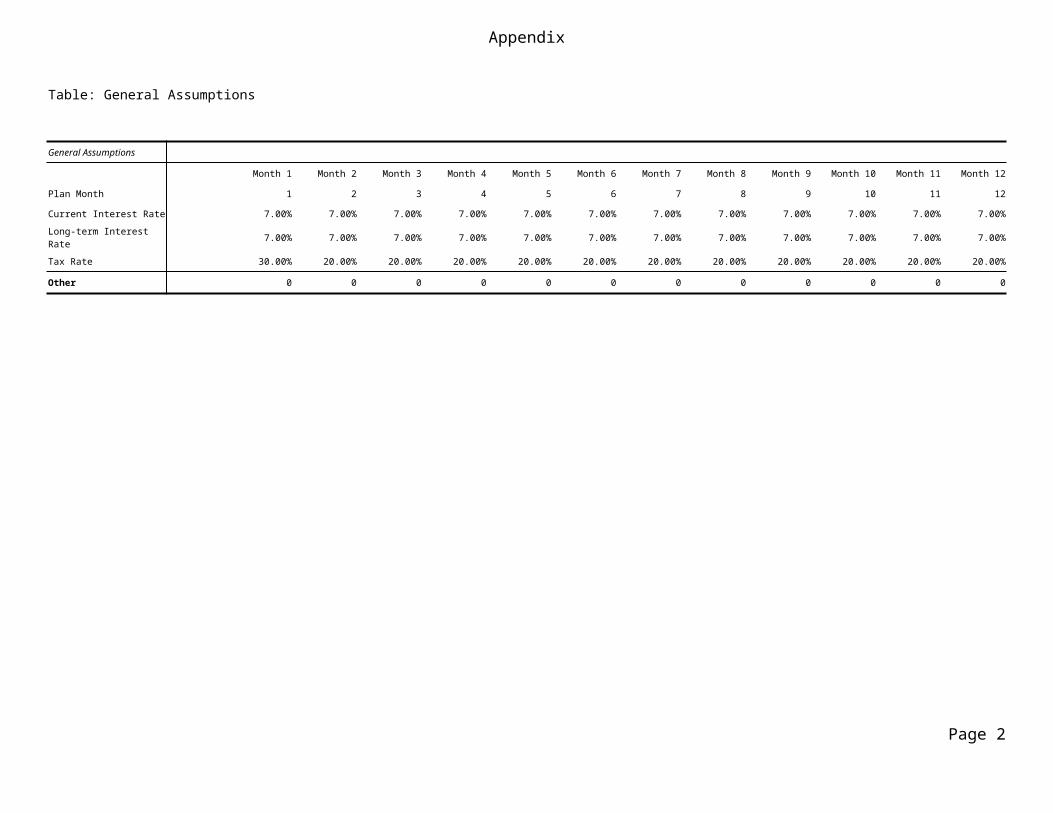
8.2 Important Assumptions
Nature and Limitation of Projections
This financial projection is based on sales volume at the levels described in the sales forecast section and presents, to the best of management's knowledge, the company's expected assets, liabilities, capital, and revenues and expenses. The projections reflect management's judgement of the expected conditions and its expected course of action given the hypothetical assumptions.
Nature of Operations
The company is in the business of vegetable farming, greens cultivation, and composting. The company expects to be operating in 2000.
Revenues
The company's revenue is derived primarily from the sale of vegetables, strawberries, and bagged composted manure products.
Expenses
The company's expenses are primarily those of salaries, utilities, and insurance costs. Other expenses are based on management's estimates and industry averages.
Table: General Assumptions
General Assumptions
Year 1 Year 2 Year 3 Year 4 Year 5
Plan Month 1 2 3 4 5Current Interest Rate 7.00% 7.00% 7.00% 7.00% 7.00% Long-term Interest Rate 7.00% 7.00% 7.00% 7.00% 7.00% Tax Rate 20.83% 20.00% 20.83% 20.00% 20.83%
Other 0 0 0 0 0
Page 15
Farmers Group
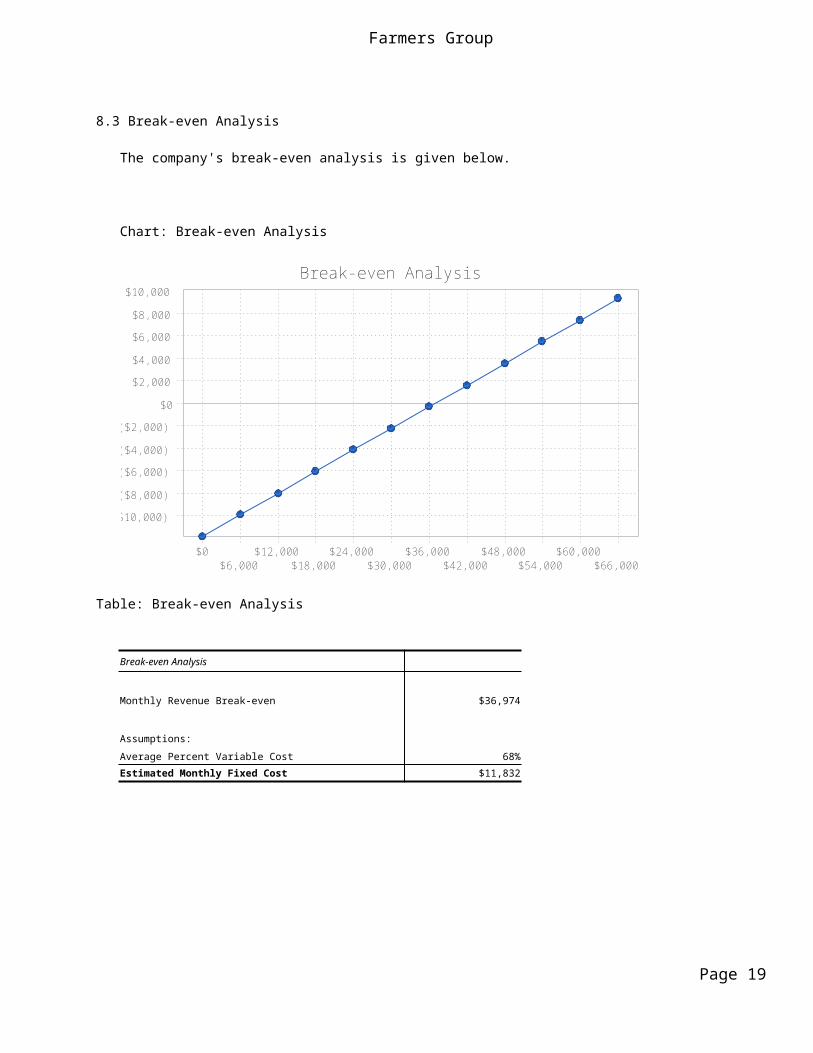
8.3 Break-even Analysis
The company's break-even analysis is given below.
Chart: Break-even Analysis
$0
$2,000
$4,000
$6,000
$8,000
$10,000
($2,000)
($4,000)
($6,000)
($8,000)
($10,000)
$0$6,000
$12,000$18,000
$24,000$30,000
$36,000$42,000
$48,000$54,000
$60,000$66,000
Break-even Analysis
Table: Break-even Analysis
Break-even Analysis
Monthly Revenue Break-even $36,974
Assumptions:
Average Percent Variable Cost 68%
Estimated Monthly Fixed Cost $11,832
Page 16
Farmers Group
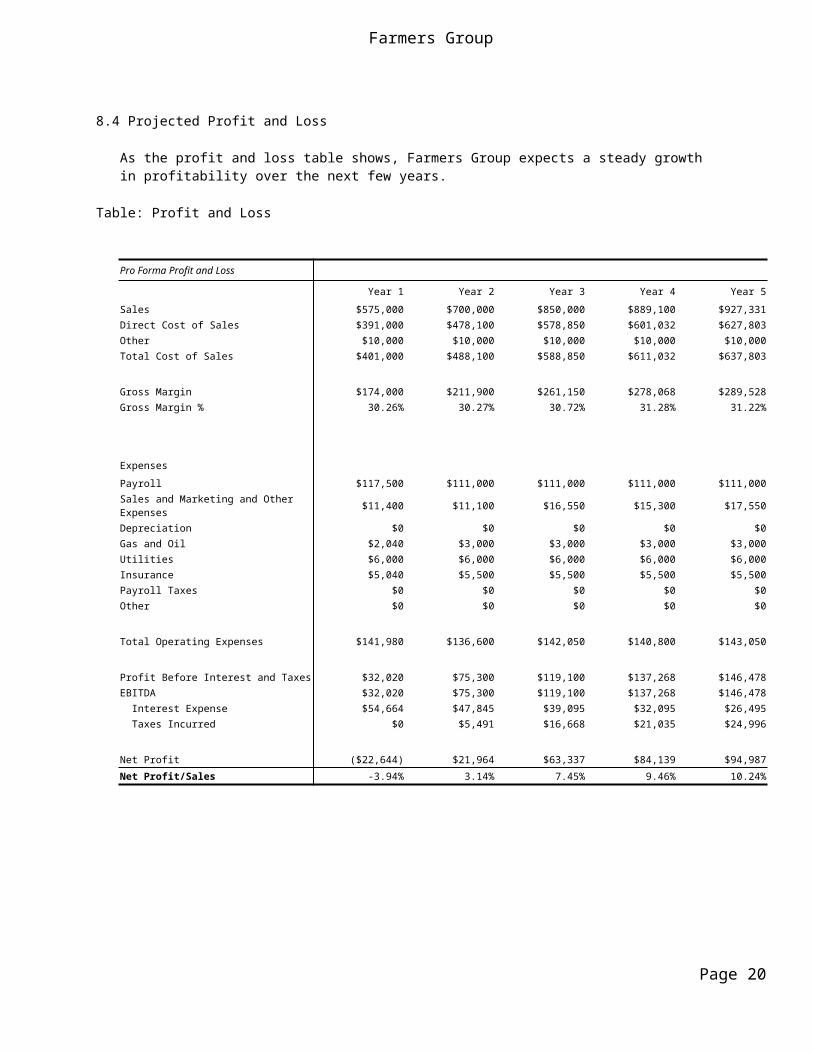
8.4 Projected Profit and Loss
As the profit and loss table shows, Farmers Group expects a steady growth in profitability over the next few years.
Table: Profit and Loss
Pro Forma Profit and Loss
Year 1 Year 2 Year 3 Year 4 Year 5
Sales $575,000 $700,000 $850,000 $889,100 $927,331 Direct Cost of Sales $391,000 $478,100 $578,850 $601,032 $627,803 Other $10,000 $10,000 $10,000 $10,000 $10,000 Total Cost of Sales $401,000 $488,100 $588,850 $611,032 $637,803
Gross Margin $174,000 $211,900 $261,150 $278,068 $289,528 Gross Margin % 30.26% 30.27% 30.72% 31.28% 31.22%
Expenses
Payroll $117,500 $111,000 $111,000 $111,000 $111,000 Sales and Marketing and Other Expenses $11,400 $11,100 $16,550 $15,300 $17,550 Depreciation $0 $0 $0 $0 $0 Gas and Oil $2,040 $3,000 $3,000 $3,000 $3,000 Utilities $6,000 $6,000 $6,000 $6,000 $6,000 Insurance $5,040 $5,500 $5,500 $5,500 $5,500 Payroll Taxes $0 $0 $0 $0 $0 Other $0 $0 $0 $0 $0
Total Operating Expenses $141,980 $136,600 $142,050 $140,800 $143,050
Profit Before Interest and Taxes $32,020 $75,300 $119,100 $137,268 $146,478 EBITDA $32,020 $75,300 $119,100 $137,268 $146,478 Interest Expense $54,664 $47,845 $39,095 $32,095 $26,495 Taxes Incurred $0 $5,491 $16,668 $21,035 $24,996
Net Profit ($22,644) $21,964 $63,337 $84,139 $94,987
Net Profit/Sales -3.94% 3.14% 7.45% 9.46% 10.24%
Page 17
Farmers Group
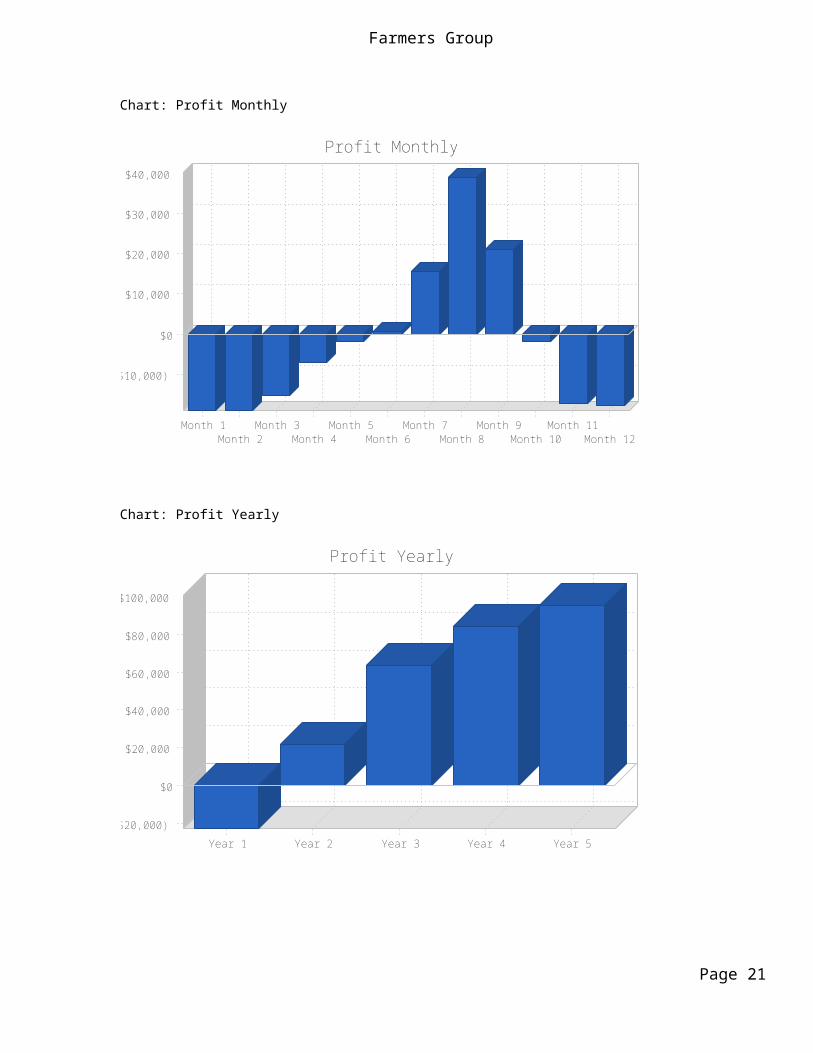
Chart: Profit Monthly
$0
$10,000
$20,000
$30,000
$40,000
($10,000)
Month 1 Month 2
Month 3 Month 4
Month 5 Month 6
Month 7 Month 8
Month 9 Month 10
Month 11 Month 12
Profit Monthly
Chart: Profit Yearly
$0
$20,000
$40,000
$60,000
$80,000
$100,000
($20,000)
Year 1 Year 2 Year 3 Year 4 Year 5
Profit Yearly
Page 18
Farmers Group
Chart: Gross Margin Monthly
$0
$10,000
$20,000
$30,000
$40,000
$50,000
$60,000
Month 1 Month 2
Month 3 Month 4
Month 5 Month 6
Month 7 Month 8
Month 9 Month 10
Month 11 Month 12
Gross Margin Monthly
Chart: Gross Margin Yearly
$0
$30,000
$60,000
$90,000
$120,000
$150,000
$180,000
$210,000
$240,000
$270,000
$300,000
Year 1 Year 2 Year 3 Year 4 Year 5
Gross Margin Yearly
Page 19
Farmers Group
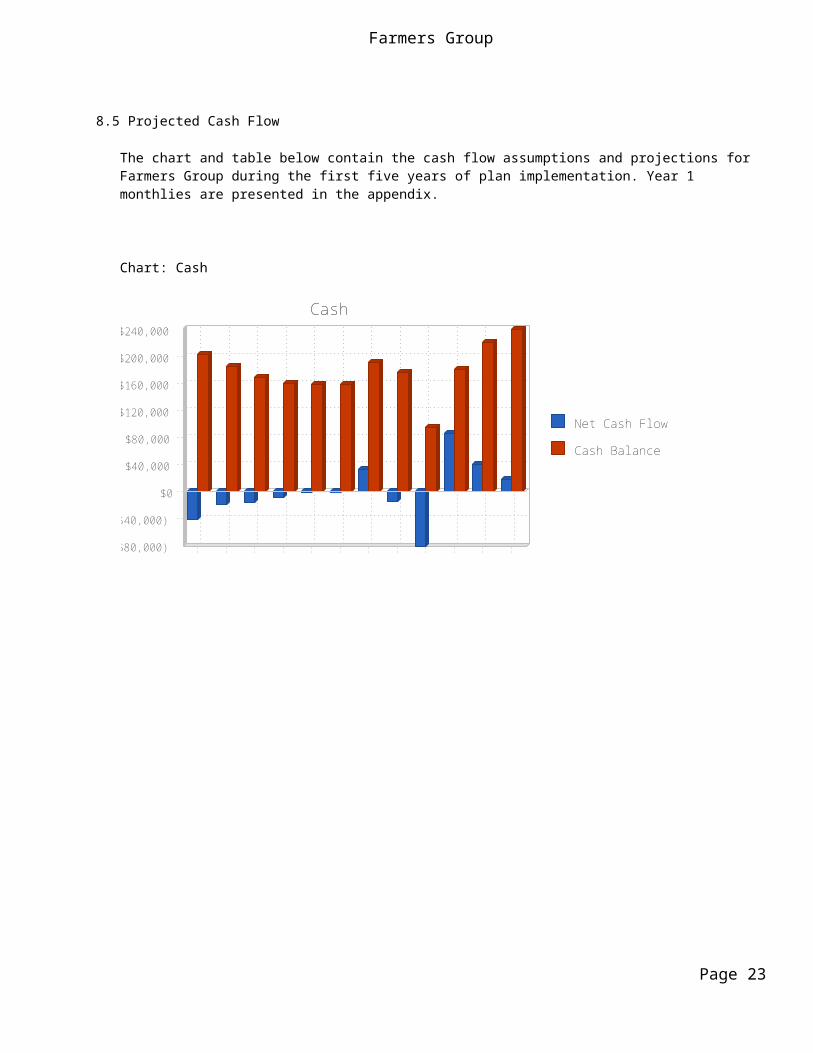
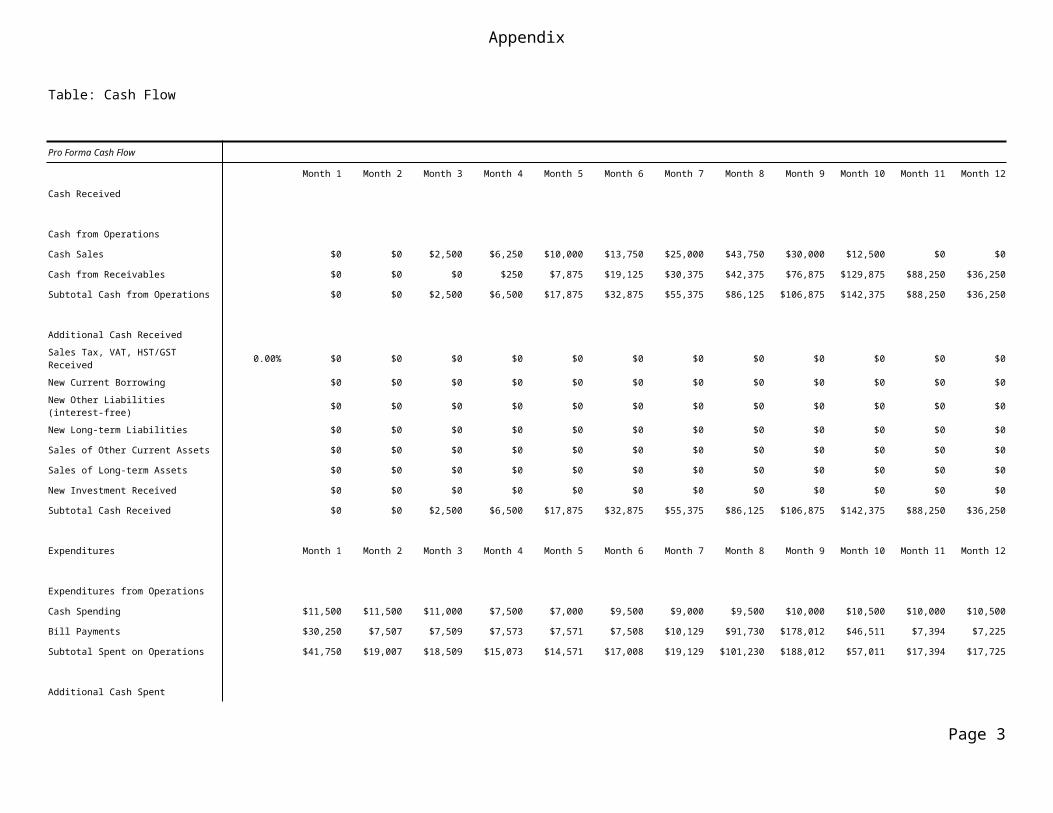
8.5 Projected Cash Flow
The chart and table below contain the cash flow assumptions and projections for Farmers Group during the first five years of plan implementation. Year 1 monthlies are presented in the appendix.
Chart: Cash
Net Cash Flow
Cash Balance
$0
$40,000
$80,000
$120,000
$160,000
$200,000
$240,000
($40,000)
($80,000)
Mon
th 1 M
onth
2 Mon
th 3 M
onth
4 Mon
th 5 M
onth
6 Mon
th 7 M
onth
8 Mon
th 9
Mon
th 1
0 M
onth
11
Mon
th 1
2
Cash
Page 20
Farmers Group
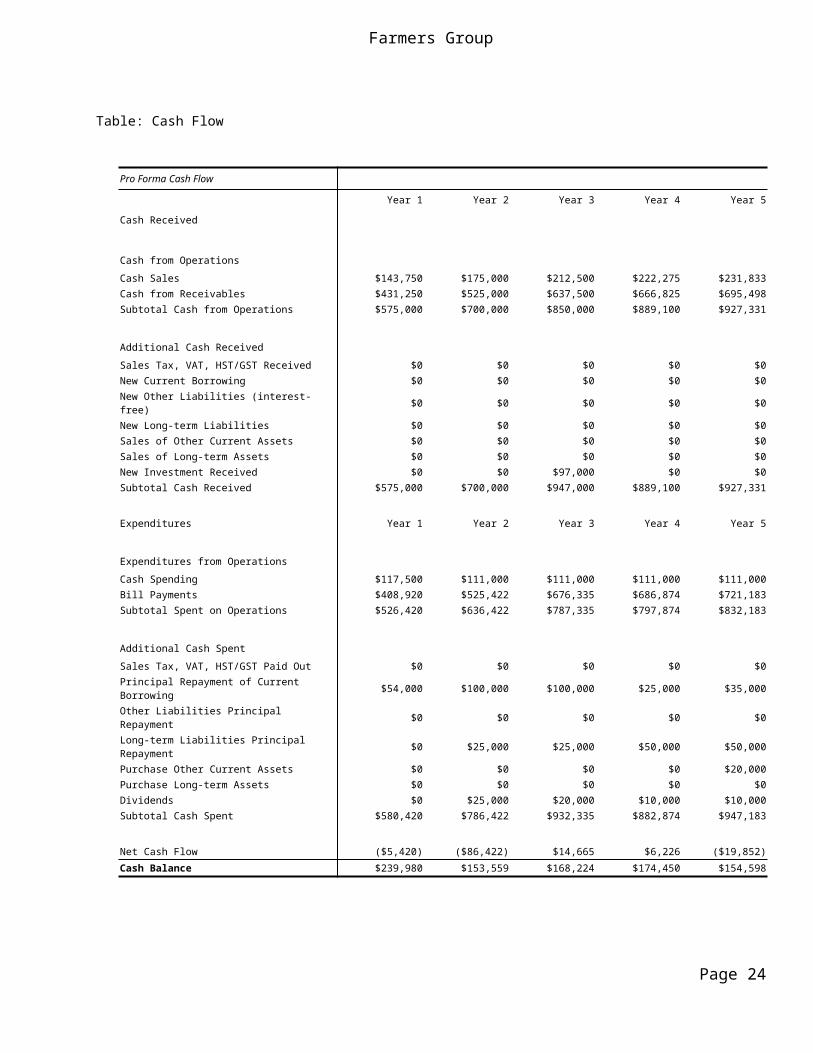
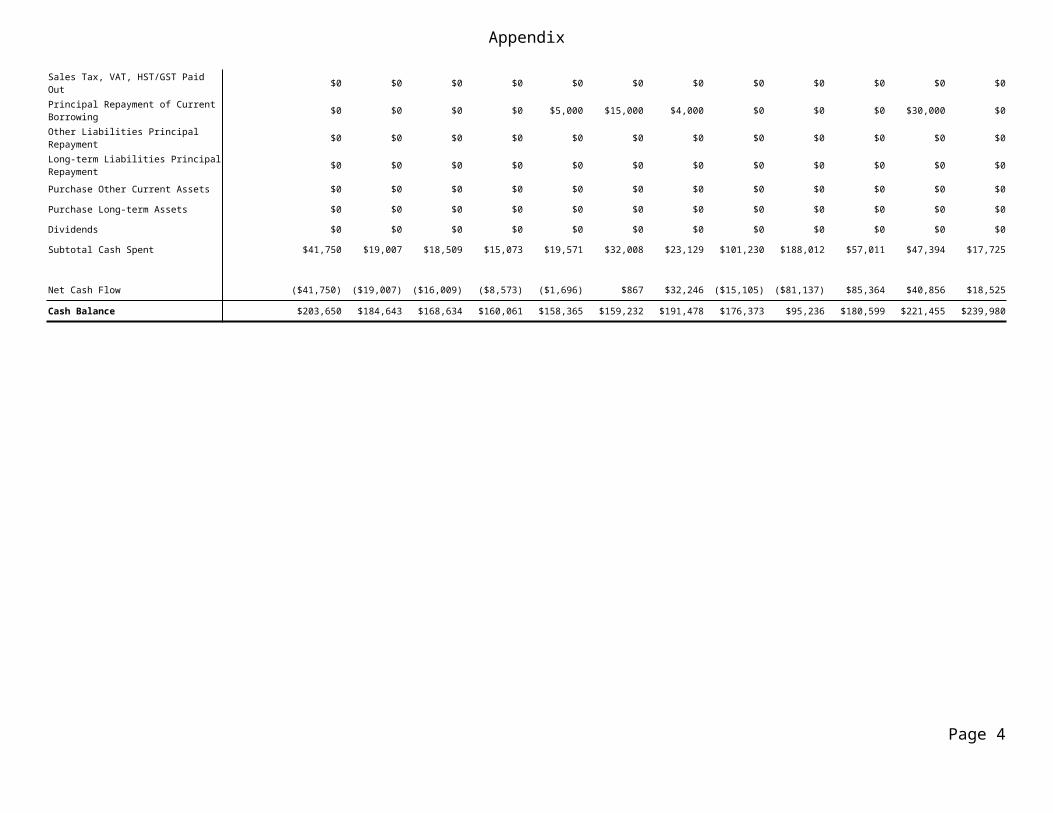
Table: Cash Flow
Pro Forma Cash Flow
Year 1 Year 2 Year 3 Year 4 Year 5
Cash Received
Cash from Operations
Cash Sales $143,750 $175,000 $212,500 $222,275 $231,833 Cash from Receivables $431,250 $525,000 $637,500 $666,825 $695,498 Subtotal Cash from Operations $575,000 $700,000 $850,000 $889,100 $927,331
Additional Cash Received
Sales Tax, VAT, HST/GST Received $0 $0 $0 $0 $0 New Current Borrowing $0 $0 $0 $0 $0 New Other Liabilities (interest-free) $0 $0 $0 $0 $0 New Long-term Liabilities $0 $0 $0 $0 $0 Sales of Other Current Assets $0 $0 $0 $0 $0 Sales of Long-term Assets $0 $0 $0 $0 $0 New Investment Received $0 $0 $97,000 $0 $0 Subtotal Cash Received $575,000 $700,000 $947,000 $889,100 $927,331
Expenditures Year 1 Year 2 Year 3 Year 4 Year 5
Expenditures from Operations
Cash Spending $117,500 $111,000 $111,000 $111,000 $111,000 Bill Payments $408,920 $525,422 $676,335 $686,874 $721,183 Subtotal Spent on Operations $526,420 $636,422 $787,335 $797,874 $832,183
Additional Cash Spent
Sales Tax, VAT, HST/GST Paid Out $0 $0 $0 $0 $0 Principal Repayment of Current Borrowing $54,000 $100,000 $100,000 $25,000 $35,000 Other Liabilities Principal Repayment $0 $0 $0 $0 $0 Long-term Liabilities Principal Repayment $0 $25,000 $25,000 $50,000 $50,000 Purchase Other Current Assets $0 $0 $0 $0 $20,000 Purchase Long-term Assets $0 $0 $0 $0 $0 Dividends $0 $25,000 $20,000 $10,000 $10,000 Subtotal Cash Spent $580,420 $786,422 $932,335 $882,874 $947,183
Net Cash Flow ($5,420) ($86,422) $14,665 $6,226 ($19,852)
Cash Balance $239,980 $153,559 $168,224 $174,450 $154,598
Page 21
Farmers Group
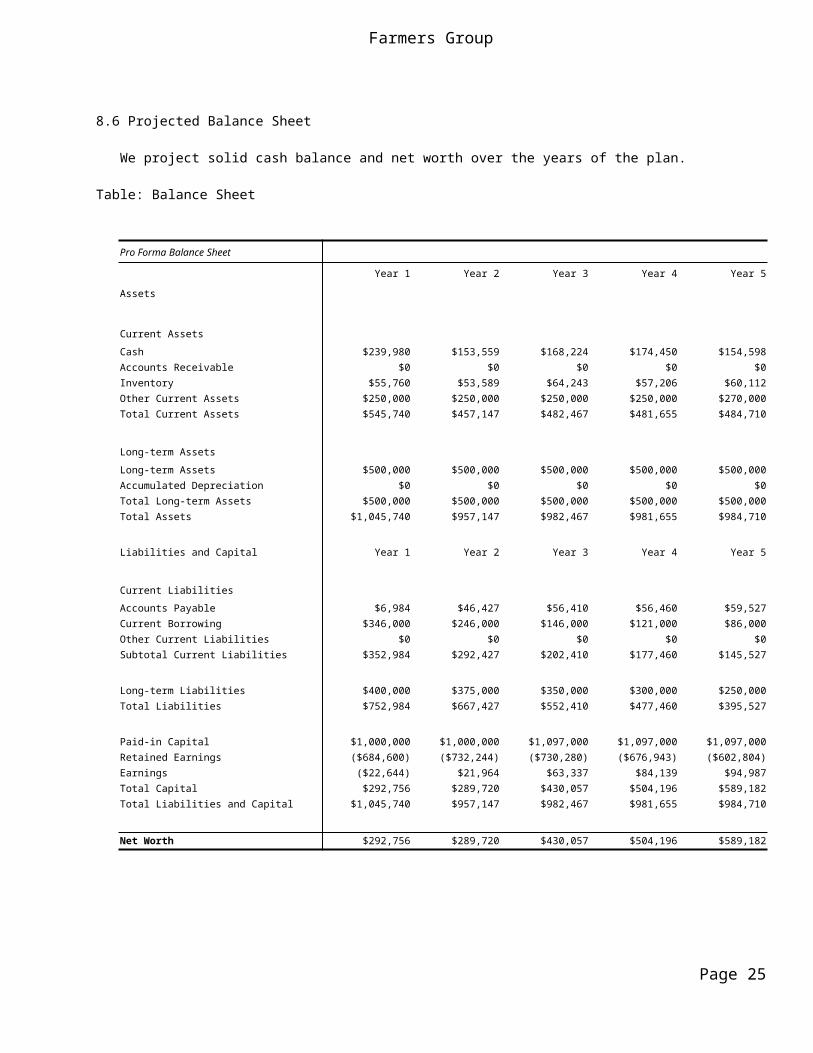
8.6 Projected Balance Sheet
We project solid cash balance and net worth over the years of the plan.
Table: Balance Sheet
Pro Forma Balance Sheet
Year 1 Year 2 Year 3 Year 4 Year 5
Assets
Current Assets
Cash $239,980 $153,559 $168,224 $174,450 $154,598 Accounts Receivable $0 $0 $0 $0 $0 Inventory $55,760 $53,589 $64,243 $57,206 $60,112 Other Current Assets $250,000 $250,000 $250,000 $250,000 $270,000 Total Current Assets $545,740 $457,147 $482,467 $481,655 $484,710
Long-term Assets
Long-term Assets $500,000 $500,000 $500,000 $500,000 $500,000 Accumulated Depreciation $0 $0 $0 $0 $0 Total Long-term Assets $500,000 $500,000 $500,000 $500,000 $500,000 Total Assets $1,045,740 $957,147 $982,467 $981,655 $984,710
Liabilities and Capital Year 1 Year 2 Year 3 Year 4 Year 5
Current Liabilities
Accounts Payable $6,984 $46,427 $56,410 $56,460 $59,527 Current Borrowing $346,000 $246,000 $146,000 $121,000 $86,000 Other Current Liabilities $0 $0 $0 $0 $0 Subtotal Current Liabilities $352,984 $292,427 $202,410 $177,460 $145,527
Long-term Liabilities $400,000 $375,000 $350,000 $300,000 $250,000 Total Liabilities $752,984 $667,427 $552,410 $477,460 $395,527
Paid-in Capital $1,000,000 $1,000,000 $1,097,000 $1,097,000 $1,097,000 Retained Earnings ($684,600) ($732,244) ($730,280) ($676,943) ($602,804)Earnings ($22,644) $21,964 $63,337 $84,139 $94,987 Total Capital $292,756 $289,720 $430,057 $504,196 $589,182 Total Liabilities and Capital $1,045,740 $957,147 $982,467 $981,655 $984,710
Net Worth $292,756 $289,720 $430,057 $504,196 $589,182
Page 22
Farmers Group
8.7 Business Ratios
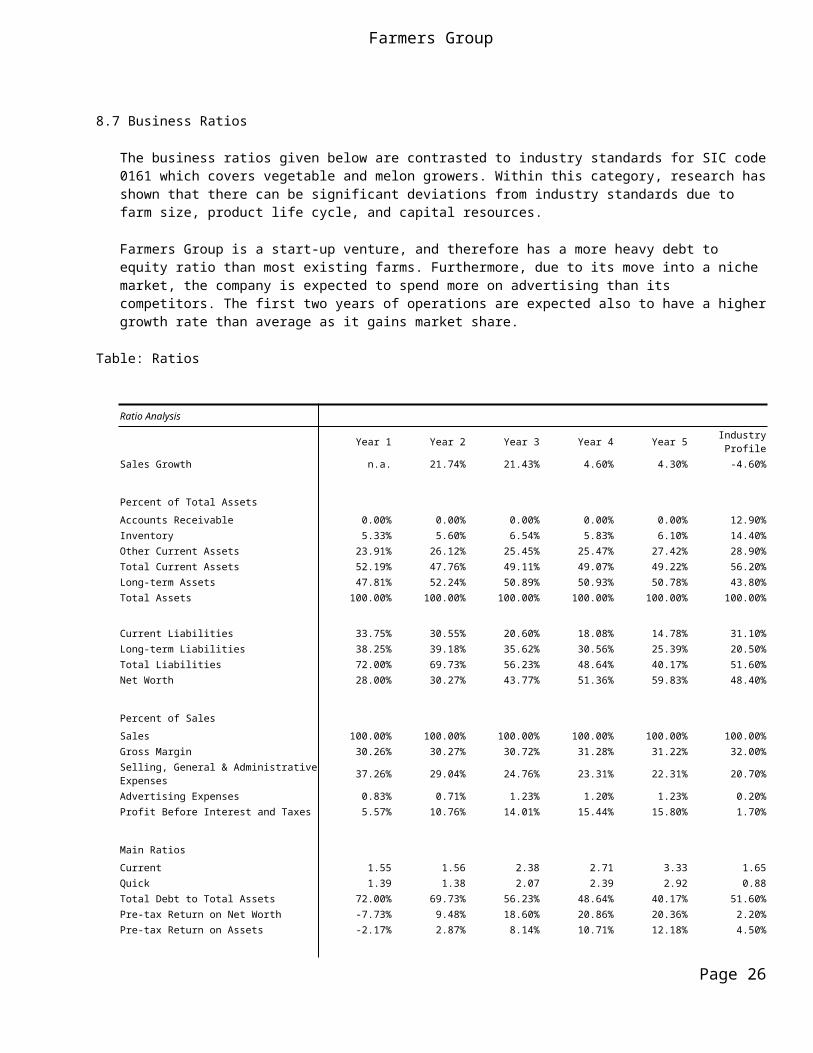
The business ratios given below are contrasted to industry standards for SIC code 0161 which covers vegetable and melon growers. Within this category, research has shown that there can be significant deviations from industry standards due to farm size, product life cycle, and capital resources.
Farmers Group is a start-up venture, and therefore has a more heavy debt to equity ratio than most existing farms. Furthermore, due to its move into a niche market, the company is expected to spend more on advertising than its competitors. The first two years of operations are expected also to have a higher growth rate than average as it gains market share.
Table: Ratios
Ratio Analysis
Year 1 Year 2 Year 3 Year 4 Year 5 Industry Profile
Sales Growth n.a. 21.74% 21.43% 4.60% 4.30% -4.60%
Percent of Total Assets
Accounts Receivable 0.00% 0.00% 0.00% 0.00% 0.00% 12.90% Inventory 5.33% 5.60% 6.54% 5.83% 6.10% 14.40% Other Current Assets 23.91% 26.12% 25.45% 25.47% 27.42% 28.90% Total Current Assets 52.19% 47.76% 49.11% 49.07% 49.22% 56.20% Long-term Assets 47.81% 52.24% 50.89% 50.93% 50.78% 43.80% Total Assets 100.00% 100.00% 100.00% 100.00% 100.00% 100.00%
Current Liabilities 33.75% 30.55% 20.60% 18.08% 14.78% 31.10% Long-term Liabilities 38.25% 39.18% 35.62% 30.56% 25.39% 20.50% Total Liabilities 72.00% 69.73% 56.23% 48.64% 40.17% 51.60% Net Worth 28.00% 30.27% 43.77% 51.36% 59.83% 48.40%
Percent of Sales
Sales 100.00% 100.00% 100.00% 100.00% 100.00% 100.00% Gross Margin 30.26% 30.27% 30.72% 31.28% 31.22% 32.00% Selling, General & Administrative Expenses 37.26% 29.04% 24.76% 23.31% 22.31% 20.70% Advertising Expenses 0.83% 0.71% 1.23% 1.20% 1.23% 0.20% Profit Before Interest and Taxes 5.57% 10.76% 14.01% 15.44% 15.80% 1.70%
Main Ratios
Current 1.55 1.56 2.38 2.71 3.33 1.65 Quick 1.39 1.38 2.07 2.39 2.92 0.88 Total Debt to Total Assets 72.00% 69.73% 56.23% 48.64% 40.17% 51.60% Pre-tax Return on Net Worth -7.73% 9.48% 18.60% 20.86% 20.36% 2.20% Pre-tax Return on Assets -2.17% 2.87% 8.14% 10.71% 12.18% 4.50%
Additional Ratios Year 1 Year 2 Year 3 Year 4 Year 5
Net Profit Margin -3.94% 3.14% 7.45% 9.46% 10.24% n.aReturn on Equity -7.73% 7.58% 14.73% 16.69% 16.12% n.a
Activity Ratios
Accounts Receivable Turnover 0.00 0.00 0.00 0.00 0.00 n.aCollection Days 60 0 0 0 0 n.aInventory Turnover 3.93 8.74 9.83 9.90 10.70 n.aAccounts Payable Turnover 55.25 12.17 12.17 12.17 12.17 n.aPayment Days 29 17 27 30 29 n.a
Page 23
Farmers Group
Total Asset Turnover 0.55 0.73 0.87 0.91 0.94 n.a
Debt Ratios
Debt to Net Worth 2.57 2.30 1.28 0.95 0.67 n.aCurrent Liab. to Liab. 0.47 0.44 0.37 0.37 0.37 n.a
Liquidity Ratios
Net Working Capital $192,756 $164,720 $280,057 $304,196 $339,182 n.aInterest Coverage 0.59 1.57 3.05 4.28 5.53 n.a
Additional Ratios
Assets to Sales 1.82 1.37 1.16 1.10 1.06 n.aCurrent Debt/Total Assets 34% 31% 21% 18% 15% n.aAcid Test 1.39 1.38 2.07 2.39 2.92 n.aSales/Net Worth 1.96 2.42 1.98 1.76 1.57 n.a
Dividend Payout 0.00 1.14 0.32 0.12 0.11 n.a
Page 24
Appendix
Table: Sales Forecast
Sales Forecast
Month 1 Month 2 Month 3 Month 4 Month 5 Month 6 Month 7 Month 8 Month 9 Month 10 Month 11 Month 12
Sales
Sales 0% $0 $0 $10,000 $25,000 $40,000 $55,000 $100,000 $175,000 $120,000 $50,000 $0 $0 Other 0% $0 $0 $0 $0 $0 $0 $0 $0 $0 $0 $0 $0
Total Sales $0 $0 $10,000 $25,000 $40,000 $55,000 $100,000 $175,000 $120,000 $50,000 $0 $0
Direct Cost of Sales Month 1 Month 2 Month 3 Month 4 Month 5 Month 6 Month 7 Month 8 Month 9 Month 10 Month 11 Month 12
Sales $0 $0 $6,800 $17,000 $27,200 $37,400 $68,000 $119,000 $81,600 $34,000 $0 $0
Other $0 $0 $0 $0 $0 $0 $0 $0 $0 $0 $0 $0
Subtotal Direct Cost of Sales $0 $0 $6,800 $17,000 $27,200 $37,400 $68,000 $119,000 $81,600 $34,000 $0 $0
Page 1
Appendix
Table: General Assumptions
General Assumptions
Month 1 Month 2 Month 3 Month 4 Month 5 Month 6 Month 7 Month 8 Month 9 Month 10 Month 11 Month 12
Plan Month 1 2 3 4 5 6 7 8 9 10 11 12
Current Interest Rate 7.00% 7.00% 7.00% 7.00% 7.00% 7.00% 7.00% 7.00% 7.00% 7.00% 7.00% 7.00%
Long-term Interest Rate 7.00% 7.00% 7.00% 7.00% 7.00% 7.00% 7.00% 7.00% 7.00% 7.00% 7.00% 7.00%
Tax Rate 30.00% 20.00% 20.00% 20.00% 20.00% 20.00% 20.00% 20.00% 20.00% 20.00% 20.00% 20.00%
Other 0 0 0 0 0 0 0 0 0 0 0 0
Page 2
Appendix
Table: Cash Flow
Pro Forma Cash Flow
Month 1 Month 2 Month 3 Month 4 Month 5 Month 6 Month 7 Month 8 Month 9 Month 10 Month 11 Month 12
Cash Received
Cash from Operations
Cash Sales $0 $0 $2,500 $6,250 $10,000 $13,750 $25,000 $43,750 $30,000 $12,500 $0 $0
Cash from Receivables $0 $0 $0 $250 $7,875 $19,125 $30,375 $42,375 $76,875 $129,875 $88,250 $36,250
Subtotal Cash from Operations $0 $0 $2,500 $6,500 $17,875 $32,875 $55,375 $86,125 $106,875 $142,375 $88,250 $36,250
Additional Cash Received
Sales Tax, VAT, HST/GST Received 0.00% $0 $0 $0 $0 $0 $0 $0 $0 $0 $0 $0 $0
New Current Borrowing $0 $0 $0 $0 $0 $0 $0 $0 $0 $0 $0 $0
New Other Liabilities (interest-free) $0 $0 $0 $0 $0 $0 $0 $0 $0 $0 $0 $0
New Long-term Liabilities $0 $0 $0 $0 $0 $0 $0 $0 $0 $0 $0 $0
Sales of Other Current Assets $0 $0 $0 $0 $0 $0 $0 $0 $0 $0 $0 $0
Sales of Long-term Assets $0 $0 $0 $0 $0 $0 $0 $0 $0 $0 $0 $0
New Investment Received $0 $0 $0 $0 $0 $0 $0 $0 $0 $0 $0 $0
Subtotal Cash Received $0 $0 $2,500 $6,500 $17,875 $32,875 $55,375 $86,125 $106,875 $142,375 $88,250 $36,250
Expenditures Month 1 Month 2 Month 3 Month 4 Month 5 Month 6 Month 7 Month 8 Month 9 Month 10 Month 11 Month 12
Expenditures from Operations
Cash Spending $11,500 $11,500 $11,000 $7,500 $7,000 $9,500 $9,000 $9,500 $10,000 $10,500 $10,000 $10,500
Bill Payments $30,250 $7,507 $7,509 $7,573 $7,571 $7,508 $10,129 $91,730 $178,012 $46,511 $7,394 $7,225
Subtotal Spent on Operations $41,750 $19,007 $18,509 $15,073 $14,571 $17,008 $19,129 $101,230 $188,012 $57,011 $17,394 $17,725
Additional Cash Spent
Sales Tax, VAT, HST/GST Paid Out $0 $0 $0 $0 $0 $0 $0 $0 $0 $0 $0 $0
Principal Repayment of Current Borrowing $0 $0 $0 $0 $5,000 $15,000 $4,000 $0 $0 $0 $30,000 $0
Other Liabilities Principal Repayment $0 $0 $0 $0 $0 $0 $0 $0 $0 $0 $0 $0
Long-term Liabilities Principal Repayment $0 $0 $0 $0 $0 $0 $0 $0 $0 $0 $0 $0
Purchase Other Current Assets $0 $0 $0 $0 $0 $0 $0 $0 $0 $0 $0 $0
Purchase Long-term Assets $0 $0 $0 $0 $0 $0 $0 $0 $0 $0 $0 $0
Dividends $0 $0 $0 $0 $0 $0 $0 $0 $0 $0 $0 $0
Page 3
Appendix
Subtotal Cash Spent $41,750 $19,007 $18,509 $15,073 $19,571 $32,008 $23,129 $101,230 $188,012 $57,011 $47,394 $17,725
Net Cash Flow ($41,750) ($19,007) ($16,009) ($8,573) ($1,696) $867 $32,246 ($15,105) ($81,137) $85,364 $40,856 $18,525
Cash Balance $203,650 $184,643 $168,634 $160,061 $158,365 $159,232 $191,478 $176,373 $95,236 $180,599 $221,455 $239,980
Page 4
Appendix
Table: Balance Sheet
Pro Forma Balance Sheet
Month 1 Month 2 Month 3 Month 4 Month 5 Month 6 Month 7 Month 8 Month 9 Month 10 Month 11 Month 12
Assets Starting Balances
Current Assets
Cash $245,400 $203,650 $184,643 $168,634 $160,061 $158,365 $159,232 $191,478 $176,373 $95,236 $180,599 $221,455 $239,980 Accounts Receivable $0 $0 $0 $7,500 $26,000 $48,125 $70,250 $114,875 $203,750 $216,875 $124,500 $36,250 $0 Inventory $150,000 $150,000 $150,000 $143,200 $126,200 $99,000 $61,600 $74,800 $130,900 $89,760 $55,760 $55,760 $55,760 Other Current Assets $250,000 $250,000 $250,000 $250,000 $250,000 $250,000 $250,000 $250,000 $250,000 $250,000 $250,000 $250,000 $250,000 Total Current Assets $645,400 $603,650 $584,643 $569,334 $562,261 $555,490 $541,082 $631,153 $761,023 $651,871 $610,859 $563,465 $545,740
Long-term Assets
Long-term Assets $500,000 $500,000 $500,000 $500,000 $500,000 $500,000 $500,000 $500,000 $500,000 $500,000 $500,000 $500,000 $500,000 Accumulated Depreciation $0 $0 $0 $0 $0 $0 $0 $0 $0 $0 $0 $0 $0 Total Long-term Assets $500,000 $500,000 $500,000 $500,000 $500,000 $500,000 $500,000 $500,000 $500,000 $500,000 $500,000 $500,000 $500,000 Total Assets $1,145,400 $1,103,650 $1,084,643 $1,069,334 $1,062,261 $1,055,490 $1,041,082 $1,131,153 $1,261,023 $1,151,871 $1,110,859 $1,063,465 $1,045,740
Liabilities and Capital Month 1 Month 2 Month 3 Month 4 Month 5 Month 6 Month 7 Month 8 Month 9 Month 10 Month 11 Month 12
Current Liabilities
Accounts Payable $30,000 $7,256 $7,256 $7,321 $7,321 $7,260 $7,176 $85,647 $176,417 $46,265 $7,153 $6,984 $6,984 Current Borrowing $400,000 $400,000 $400,000 $400,000 $400,000 $395,000 $380,000 $376,000 $376,000 $376,000 $376,000 $346,000 $346,000 Other Current Liabilities $0 $0 $0 $0 $0 $0 $0 $0 $0 $0 $0 $0 $0 Subtotal Current Liabilities $430,000 $407,256 $407,256 $407,321 $407,321 $402,260 $387,176 $461,647 $552,417 $422,265 $383,153 $352,984 $352,984
Long-term Liabilities $400,000 $400,000 $400,000 $400,000 $400,000 $400,000 $400,000 $400,000 $400,000 $400,000 $400,000 $400,000 $400,000 Total Liabilities $830,000 $807,256 $807,256 $807,321 $807,321 $802,260 $787,176 $861,647 $952,417 $822,265 $783,153 $752,984 $752,984
Paid-in Capital $1,000,000 $1,000,000 $1,000,000 $1,000,000 $1,000,000 $1,000,000 $1,000,000 $1,000,000 $1,000,000 $1,000,000 $1,000,000 $1,000,000 $1,000,000 Retained Earnings ($684,600) ($684,600) ($684,600) ($684,600) ($684,600) ($684,600) ($684,600) ($684,600) ($684,600) ($684,600) ($684,600) ($684,600) ($684,600)Earnings $0 ($19,007) ($38,013) ($53,387) ($60,460) ($62,171) ($61,494) ($45,894) ($6,794) $14,206 $12,306 ($4,919) ($22,644)Total Capital $315,400 $296,393 $277,387 $262,013 $254,940 $253,229 $253,906 $269,506 $308,606 $329,606 $327,706 $310,481 $292,756 Total Liabilities and Capital $1,145,400 $1,103,650 $1,084,643 $1,069,334 $1,062,261 $1,055,490 $1,041,082 $1,131,153 $1,261,023 $1,151,871 $1,110,859 $1,063,465 $1,045,740
Net Worth $315,400 $296,393 $277,387 $262,013 $254,940 $253,229 $253,906 $269,506 $308,606 $329,606 $327,706 $310,481 $292,756
Page 5
Appendix
Table: Profit and Loss
Pro Forma Profit and Loss
Month 1 Month 2 Month 3 Month 4 Month 5 Month 6 Month 7 Month 8 Month 9 Month 10 Month 11 Month 12
Sales $0 $0 $10,000 $25,000 $40,000 $55,000 $100,000 $175,000 $120,000 $50,000 $0 $0
Direct Cost of Sales $0 $0 $6,800 $17,000 $27,200 $37,400 $68,000 $119,000 $81,600 $34,000 $0 $0
Other $800 $800 $867 $867 $833 $833 $833 $833 $833 $833 $833 $833
Total Cost of Sales $800 $800 $7,667 $17,867 $28,033 $38,233 $68,833 $119,833 $82,433 $34,833 $833 $833
Gross Margin ($800) ($800) $2,333 $7,133 $11,967 $16,767 $31,167 $55,167 $37,567 $15,167 ($833) ($833)
Gross Margin % 0.00% 0.00% 23.33% 28.53% 29.92% 30.48% 31.17% 31.52% 31.31% 30.33% 0.00% 0.00%
Expenses
Payroll $11,500 $11,500 $11,000 $7,500 $7,000 $9,500 $9,000 $9,500 $10,000 $10,500 $10,000 $10,500
Sales and Marketing and Other Expenses $950 $950 $950 $950 $950 $950 $950 $950 $950 $950 $950 $950
Depreciation $0 $0 $0 $0 $0 $0 $0 $0 $0 $0 $0 $0
Gas and Oil $170 $170 $170 $170 $170 $170 $170 $170 $170 $170 $170 $170
Utilities $500 $500 $500 $500 $500 $500 $500 $500 $500 $500 $500 $500
Insurance $420 $420 $420 $420 $420 $420 $420 $420 $420 $420 $420 $420
Payroll Taxes 15% $0 $0 $0 $0 $0 $0 $0 $0 $0 $0 $0 $0
Other $0 $0 $0 $0 $0 $0 $0 $0 $0 $0 $0 $0
Total Operating Expenses $13,540 $13,540 $13,040 $9,540 $9,040 $11,540 $11,040 $11,540 $12,040 $12,540 $12,040 $12,540
Profit Before Interest and Taxes ($14,340) ($14,340) ($10,707) ($2,407) $2,927 $5,227 $20,127 $43,627 $25,527 $2,627 ($12,873) ($13,373)
EBITDA ($14,340) ($14,340) ($10,707) ($2,407) $2,927 $5,227 $20,127 $43,627 $25,527 $2,627 ($12,873) ($13,373)
Interest Expense $4,667 $4,667 $4,667 $4,667 $4,638 $4,550 $4,527 $4,527 $4,527 $4,527 $4,352 $4,352
Taxes Incurred $0 $0 $0 $0 $0 $0 $0 $0 $0 $0 $0 $0
Net Profit ($19,007) ($19,007) ($15,373) ($7,073) ($1,711) $677 $15,600 $39,100 $21,000 ($1,900) ($17,225) ($17,725)
Net Profit/Sales 0.00% 0.00% -153.73% -28.29% -4.28% 1.23% 15.60% 22.34% 17.50% -3.80% 0.00% 0.00%
Page 6
Appendix
Table: Personnel
Personnel Plan
Month 1 Month 2 Month 3 Month 4 Month 5 Month 6 Month 7 Month 8 Month 9 Month 10 Month 11 Month 12
Business Manager 0% $1,500 $1,500 $1,500 $1,500 $1,500 $2,500 $2,500 $2,500 $2,500 $2,500 $2,500 $2,500 Executive Director 0% $1,500 $1,500 $1,500 $1,500 $1,500 $2,500 $2,500 $2,500 $2,500 $2,500 $2,500 $2,500 Manager Trainee 0% $0 $0 $0 $1,000 $1,000 $1,000 $1,000 $1,000 $1,000 $1,000 $1,000 $1,000 Manager Trainee 0% $0 $0 $0 $0 $0 $0 $0 $0 $1,000 $1,000 $1,000 $1,000 Logistic engineer 0% $1,500 $1,500 $1,500 $1,500 $1,500 $1,500 $1,500 $1,500 $1,500 $1,500 $1,500 $1,500 Heavy equipment 0% $1,500 $1,500 $1,500 $1,500 $1,500 $1,500 $1,500 $1,500 $1,500 $1,500 $1,500 $1,500 Welder 0% $500 $500 $0 $500 $0 $500 $0 $500 $0 $500 $0 $500 Contract workers 0% $5,000 $5,000 $5,000 $0 $0 $0 $0 $0 $0 $0 $0 $0
Total People 12 12 12 7 7 7 7 7 7 7 7 7
Total Payroll $11,500 $11,500 $11,000 $7,500 $7,000 $9,500 $9,000 $9,500 $10,000 $10,500 $10,000 $10,500
Page 7