Embed Size (px)
Citation preview
Agricultural, Water, and Health-Related Satellite
Products from NESDIS-STAR
Felix Kogan
NOAA/NESDIS
Center for Satellite Applications and Research
October 2010
2
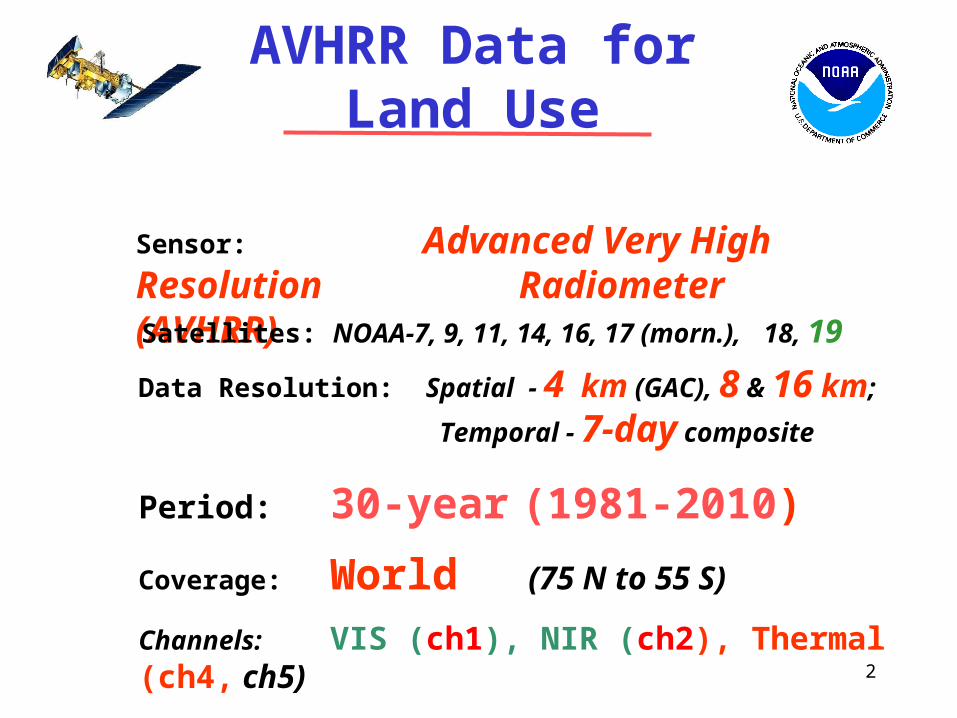
AVHRR Data for Land Use
Sensor: Advanced Very High Resolution Radiometer (AVHRR)
Satellites: NOAA-7, 9, 11, 14, 16, 17 (morn.), 18, 19
Data Resolution: Spatial - 4 km (GAC), 8 & 16 km;
Temporal - 7-day composite
Period: 30-year (1981-2010)
Coverage: World (75 N to 55 S)
Channels: VIS (ch1), NIR (ch2), Thermal (ch4, ch5)
3
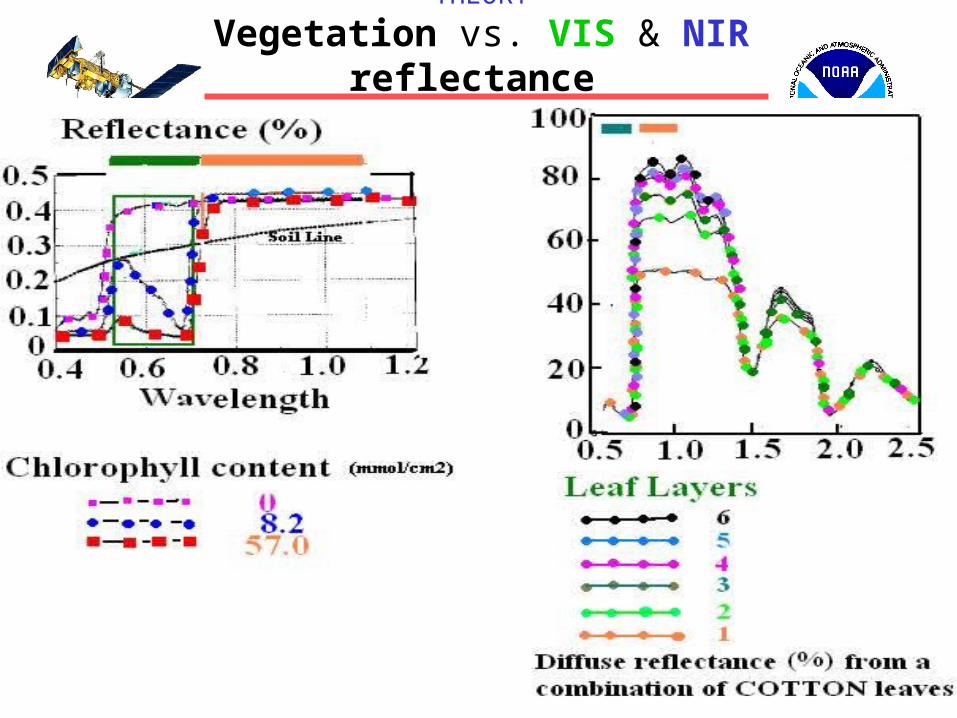
THEORY
Vegetation vs. VIS & NIR reflectance
4
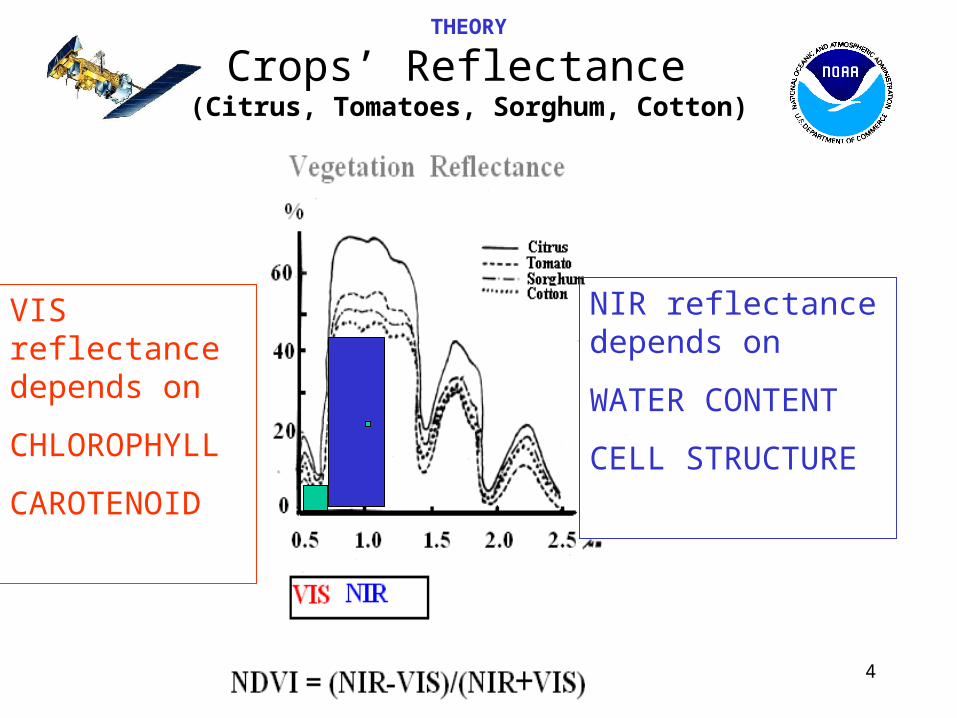
THEORY
Crops’ Reflectance (Citrus, Tomatoes, Sorghum, Cotton)
VIS reflectance depends on
CHLOROPHYLL
CAROTENOID
NIR reflectance depends on
WATER CONTENT
CELL STRUCTURE
5
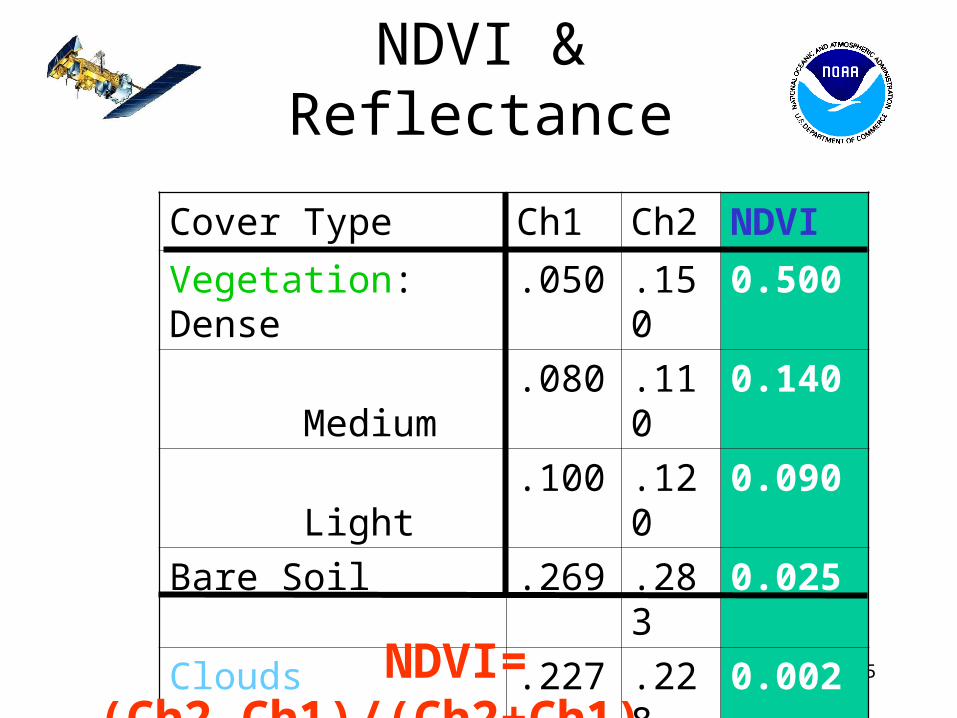
NDVI & Reflectance
Cover Type Ch1 Ch2 NDVI
Vegetation: Dense .050 .150 0.500
Medium .080 .110 0.140
Light .100 .120 0.090
Bare Soil .269 .283 0.025
Clouds .227 .228 0.002
Water .022 .013 -0.26
NDVI= (Ch2-Ch1)/(Ch2+Ch1)
6
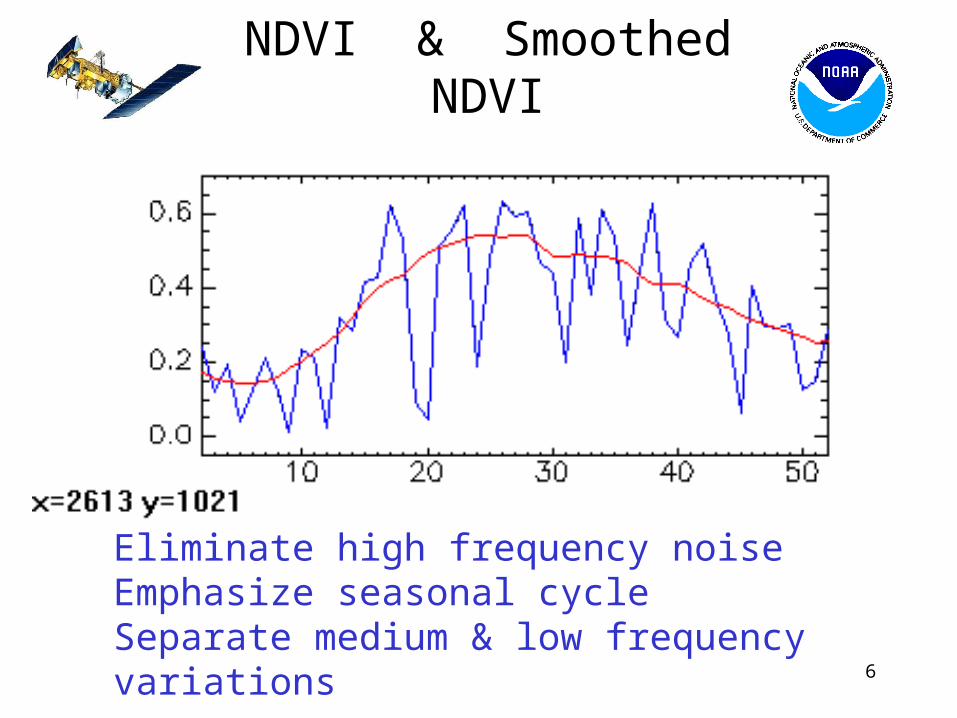
NDVI & Smoothed NDVI
Eliminate high frequency noiseEmphasize seasonal cycleSeparate medium & low frequency variations
7
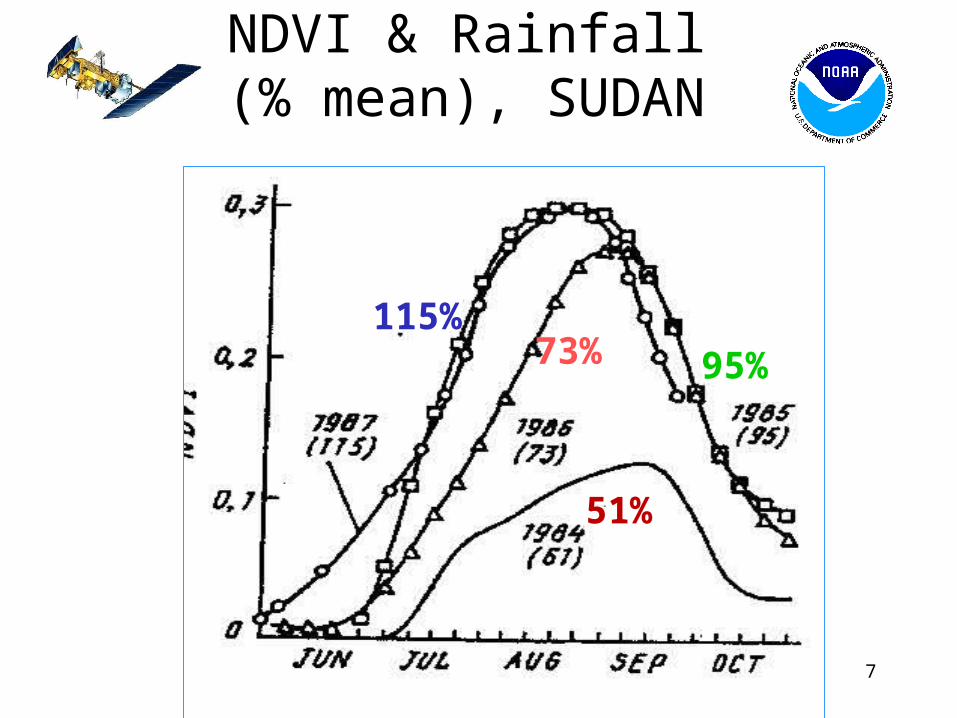
NDVI & Rainfall (% mean), SUDAN
95%115%
73%
51%
8
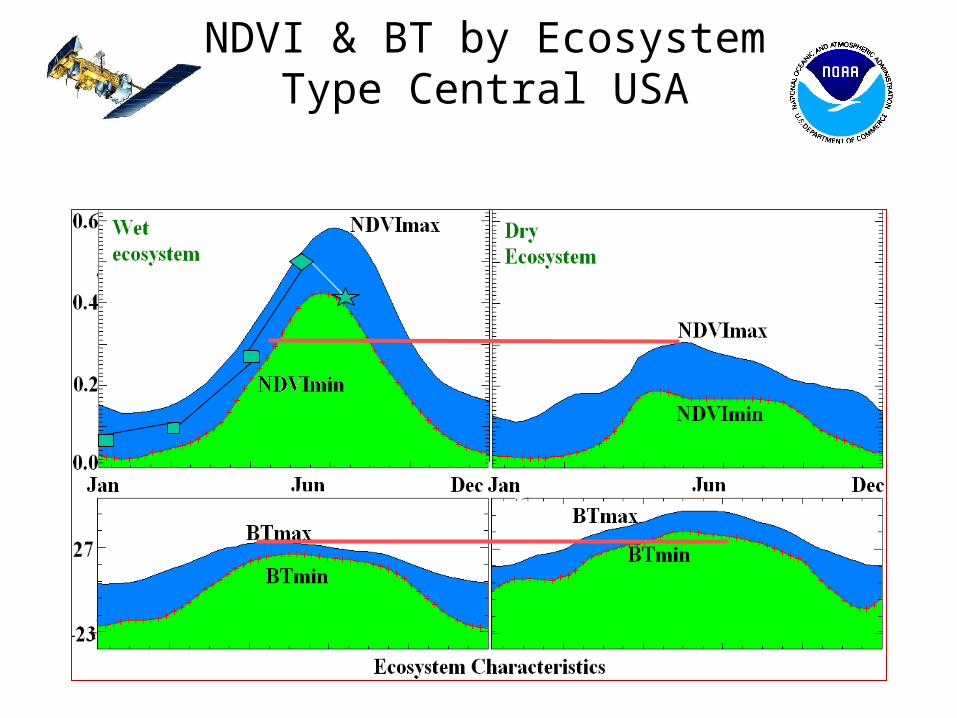
NDVI & BT by Ecosystem Type Central USA
9
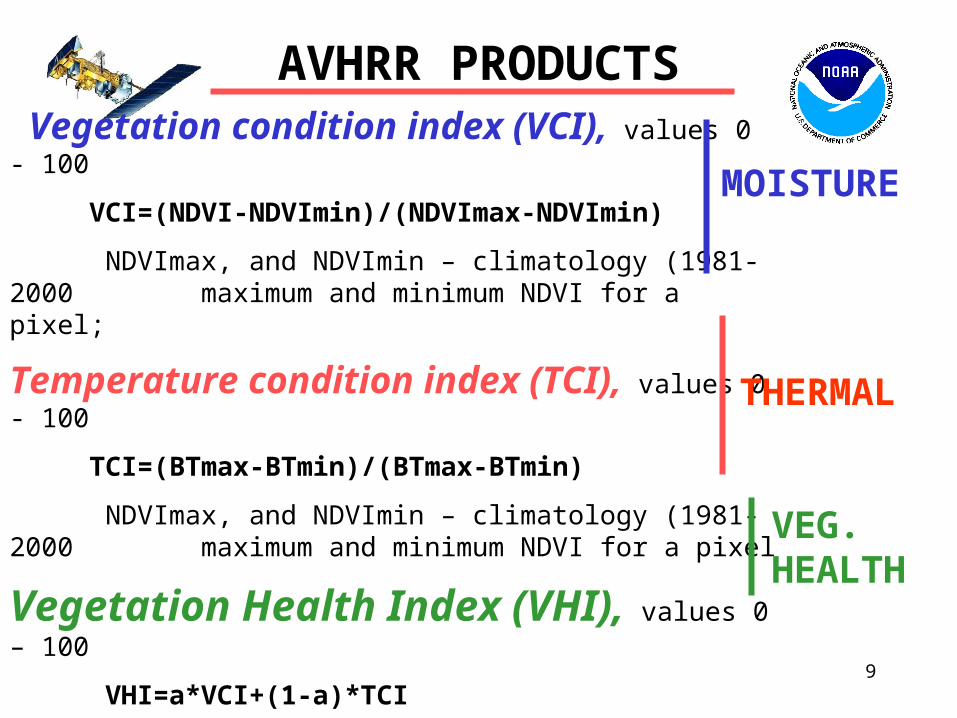
AVHRR PRODUCTS Vegetation condition index (VCI), values 0 - 100
VCI=(NDVI-NDVImin)/(NDVImax-NDVImin)
NDVImax, and NDVImin – climatology (1981-2000 maximum and minimum NDVI for a pixel;
Temperature condition index (TCI), values 0 - 100
TCI=(BTmax-BTmin)/(BTmax-BTmin)
NDVImax, and NDVImin – climatology (1981-2000 maximum and minimum NDVI for a pixel
Vegetation Health Index (VHI), values 0 – 100
VHI=a*VCI+(1-a)*TCI
0 – indicates extreme stress
100 – indicates favorable conditions
MOISTURE
THERMAL
VEG. HEALTH
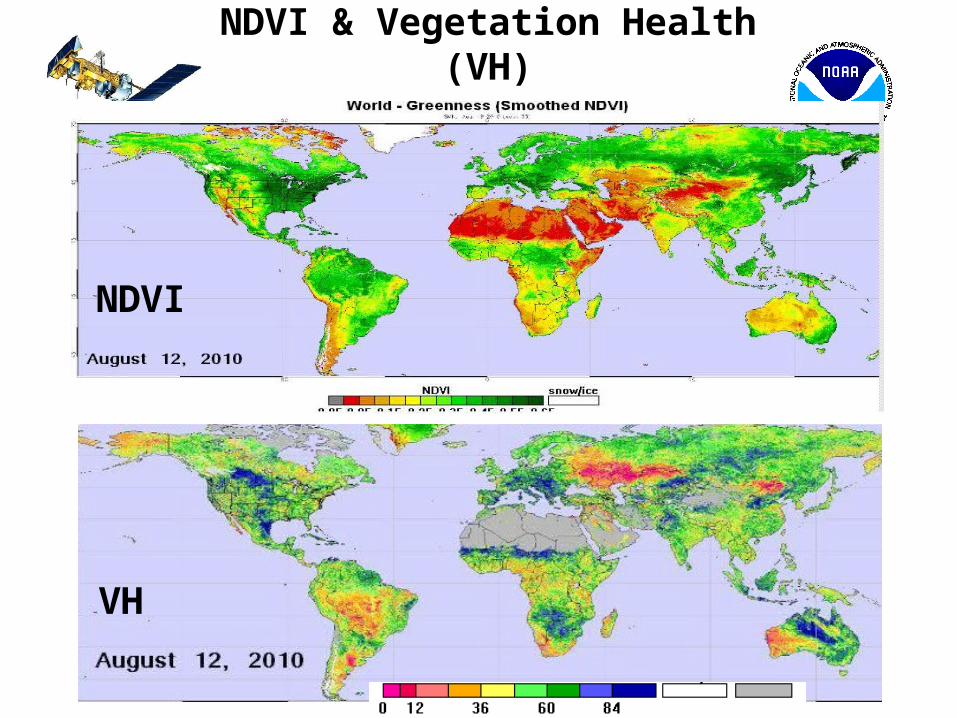
NDVI & Vegetation Health (VH)
10
NDVI
VH
11
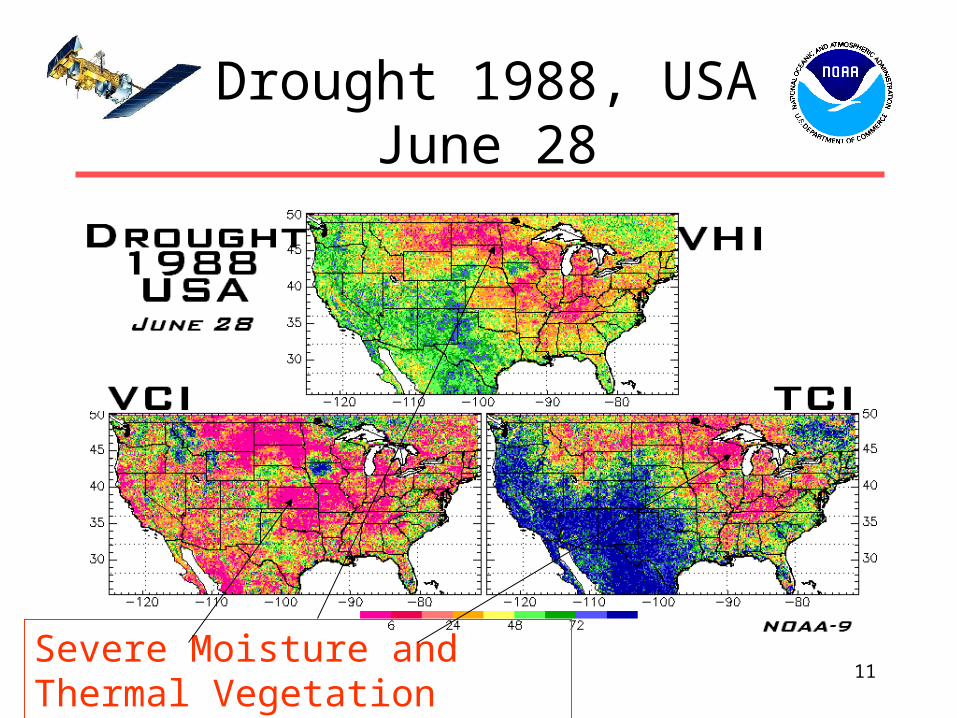
Drought 1988, USAJune 28
Severe Moisture and Thermal Vegetation Stress
12
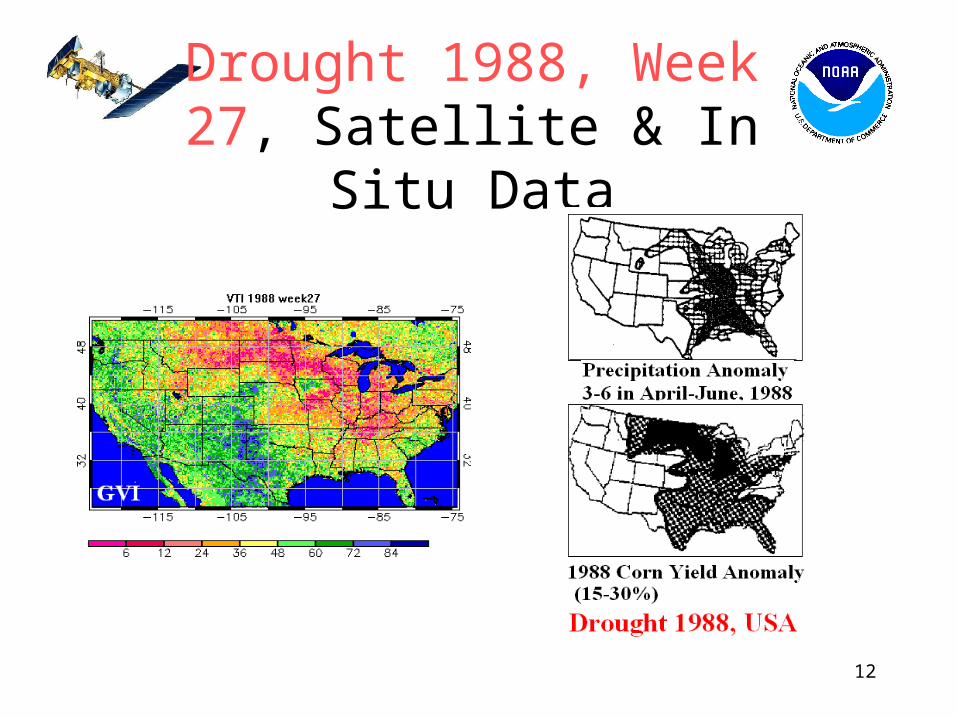
Drought 1988, Week 27, Satellite & In Situ Data
13
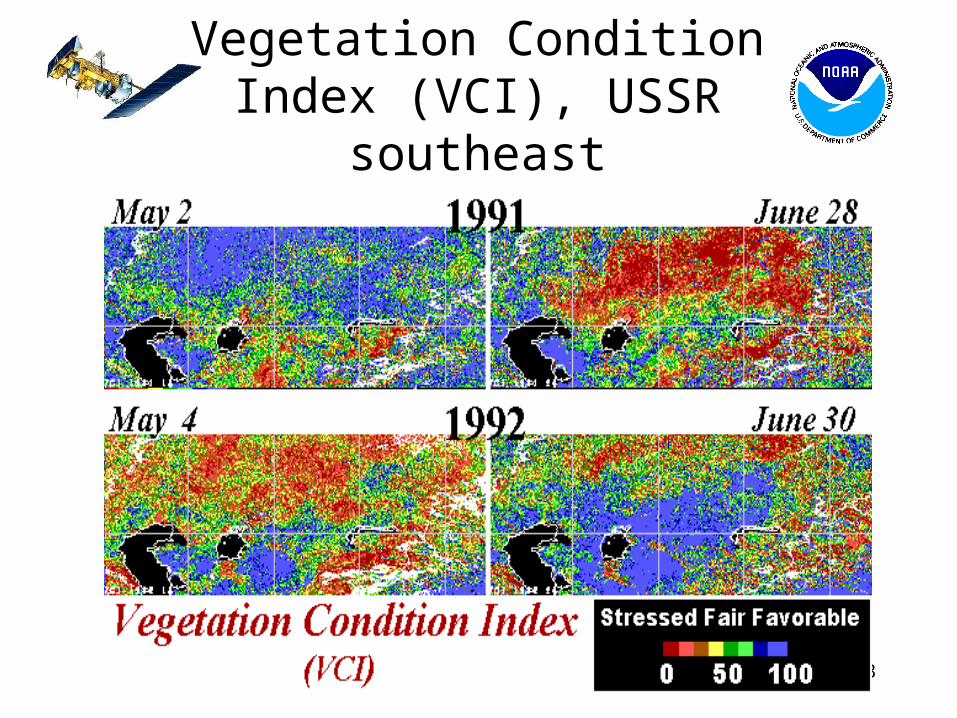
Vegetation Condition Index (VCI), USSR southeast
14
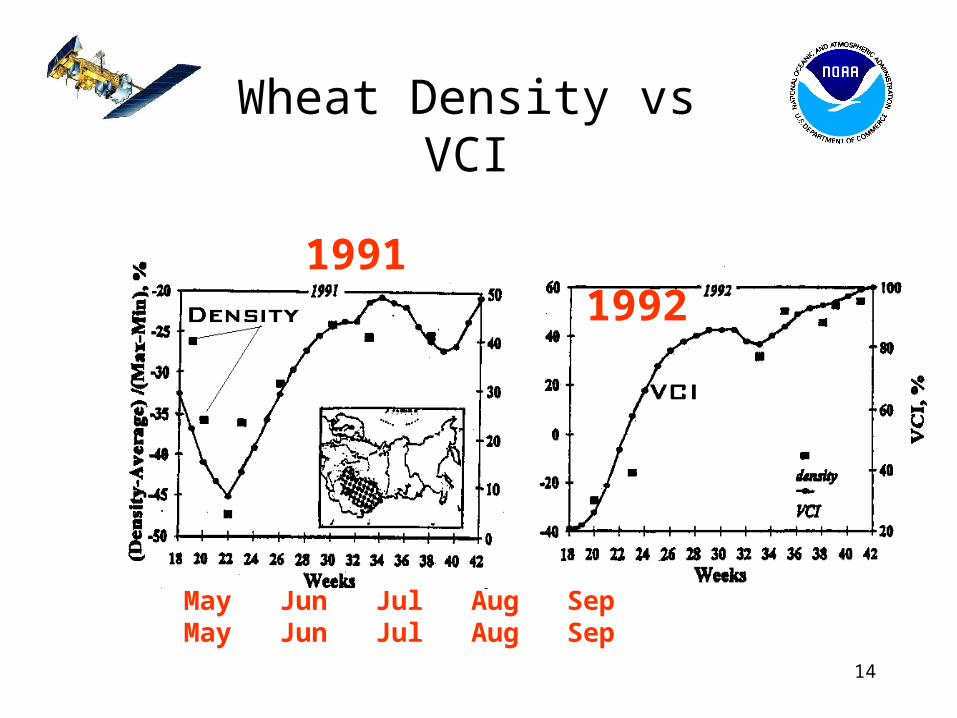
Wheat Density vs VCI
1991 1992
May Jun Jul Aug Sep May Jun Jul Aug Sep
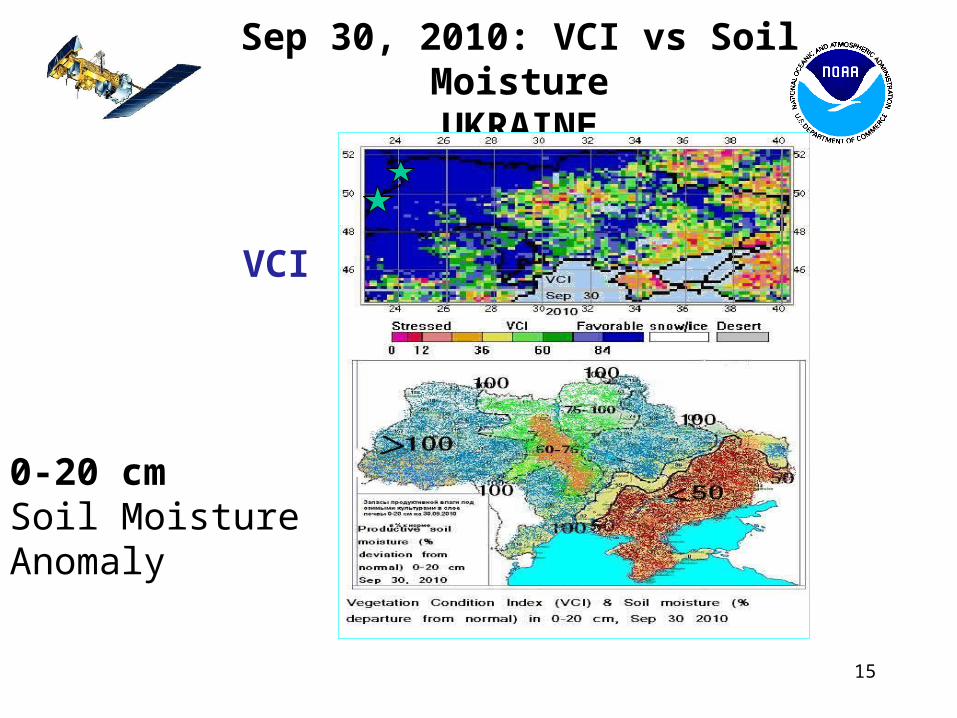
Sep 30, 2010: VCI vs Soil MoistureUKRAINE
15
VCI
0-20 cmSoil Moisture Anomaly
16
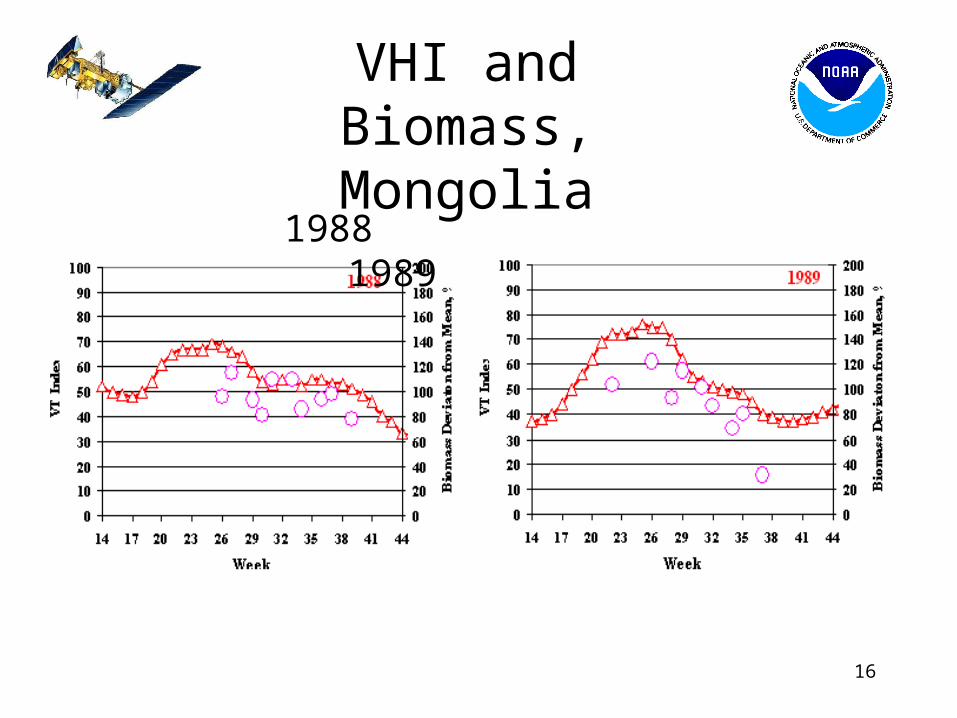
VHI and Biomass,Mongolia
1988 1989
17
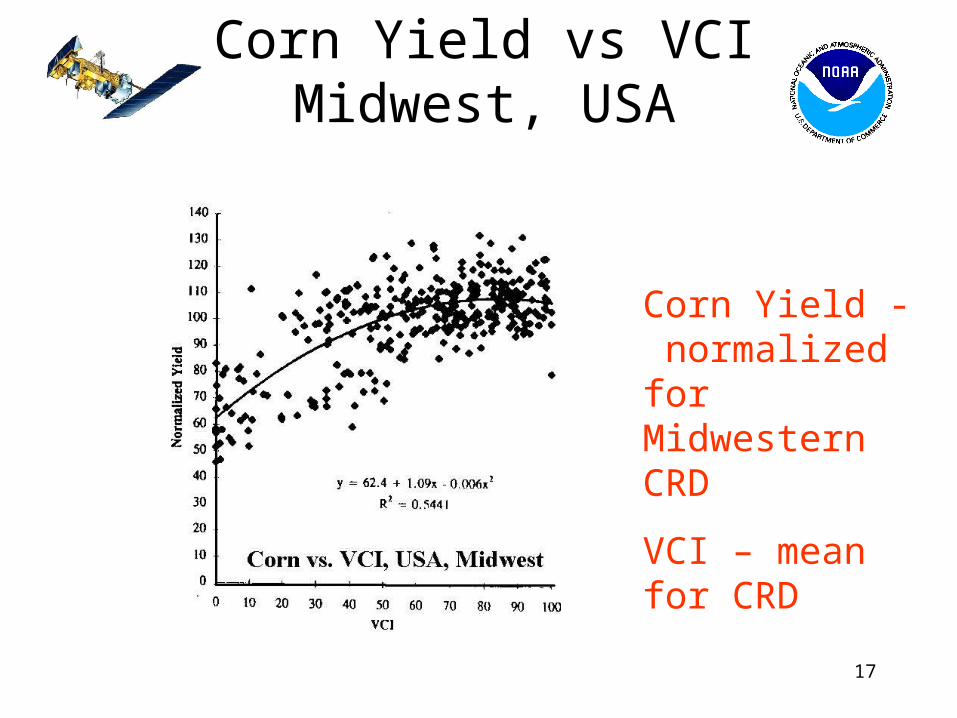
Corn Yield vs VCIMidwest, USA
Corn Yield - normalized for Midwestern CRD
VCI – mean for CRD
18
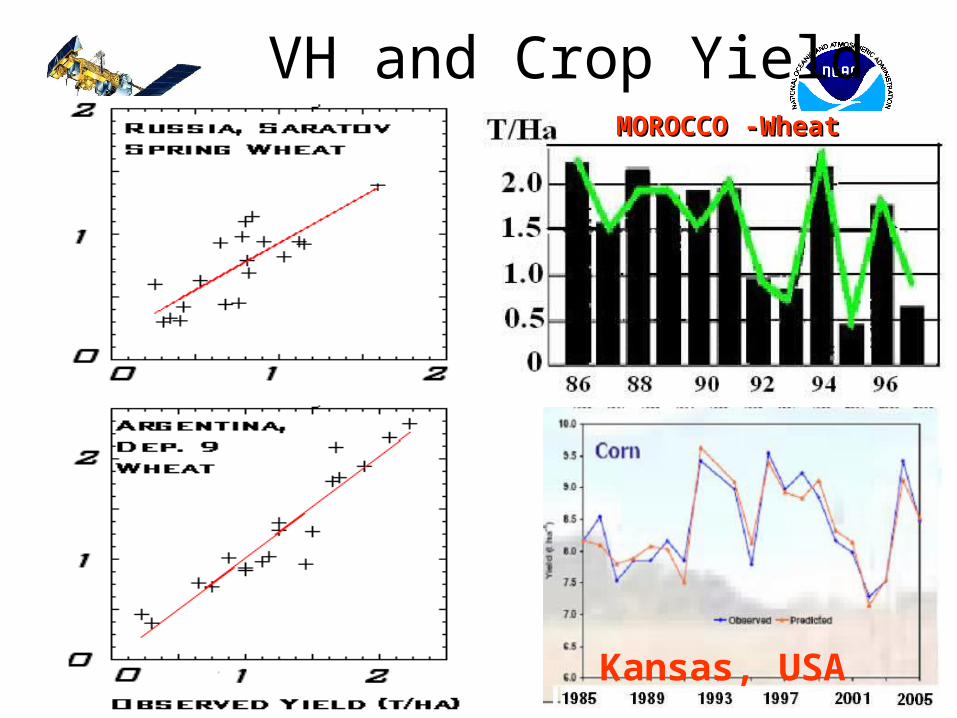
VH and Crop YieldMOROCCO -WheatMOROCCO -Wheat
MONGOLIA - PastureMONGOLIA - Pasture
RUSSIA
ARGENTINA
Kansas, USA
19
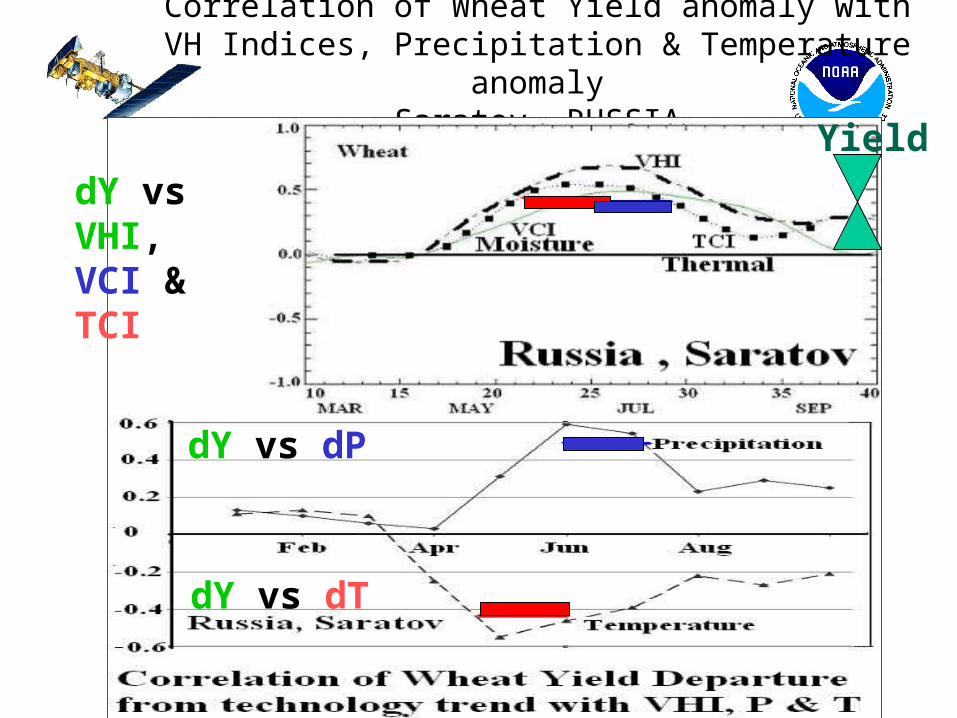
Correlation of Wheat Yield anomaly with VH Indices, Precipitation & Temperature anomaly
Saratov, RUSSIA
dY vs VHI, VCI & TCI
dY vs dP
dY vs dT
Yield
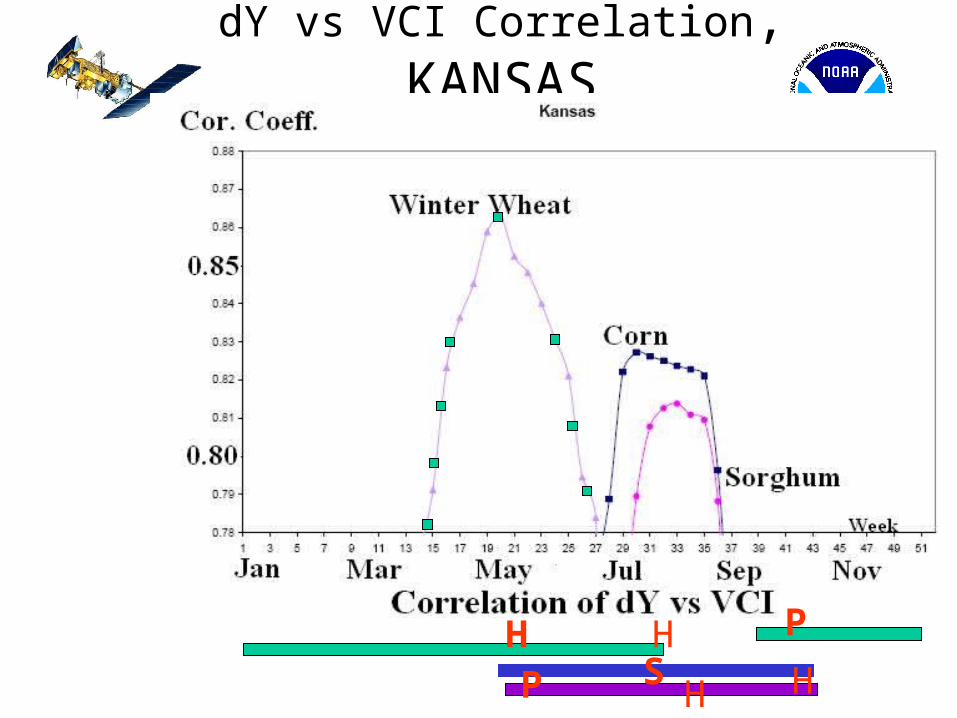
dY vs VCI Correlation, KANSAS
P SH H
PH H
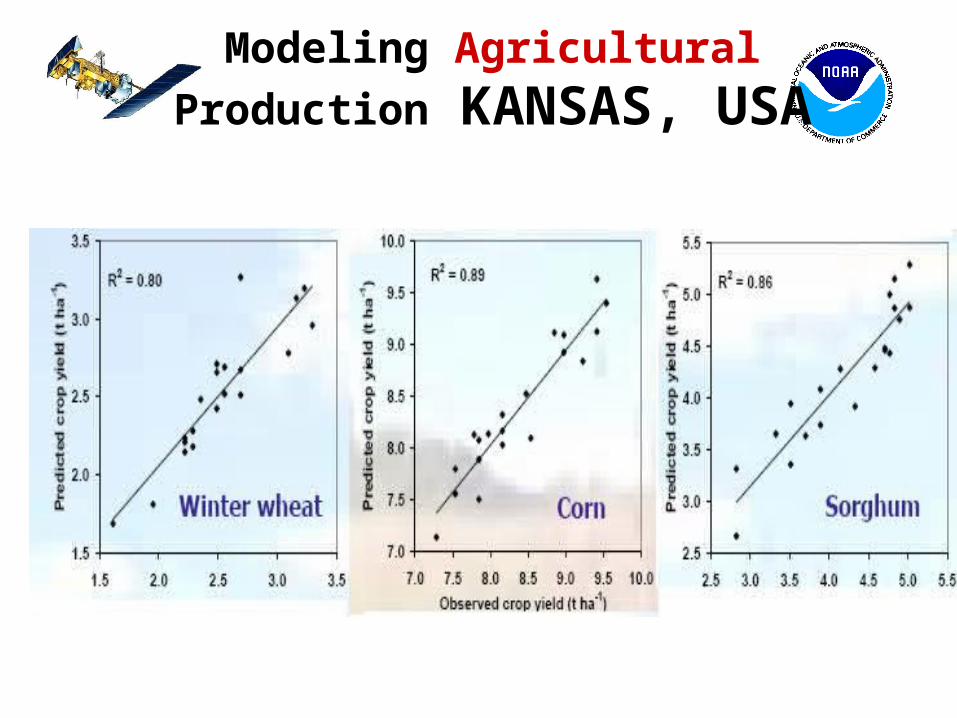
Modeling Agricultural Production KANSAS, USA
22
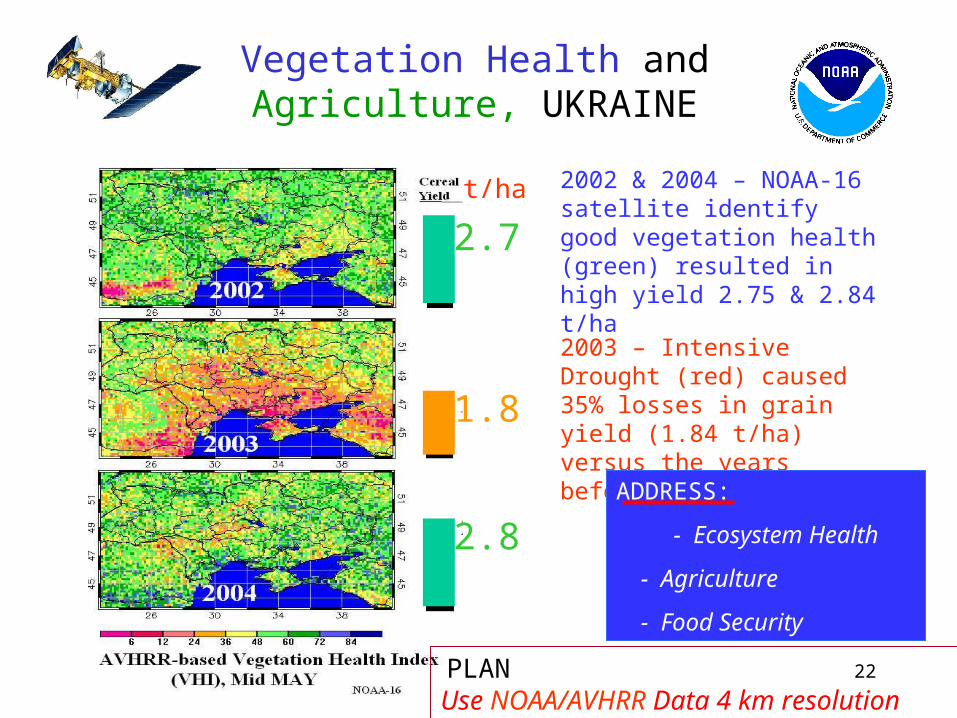
Vegetation Health and Agriculture, UKRAINE
2003 – Intensive Drought (red) caused 35% losses in grain yield (1.84 t/ha) versus the years before and after
2002 & 2004 – NOAA-16 satellite identify good vegetation health (green) resulted in high yield 2.75 & 2.84 t/ha
ADDRESS:
- Ecosystem Health
- Agriculture
- Food Security
PLANUse NOAA/AVHRR Data 4 km resolution
2.7
1.8
2.8
t/ha
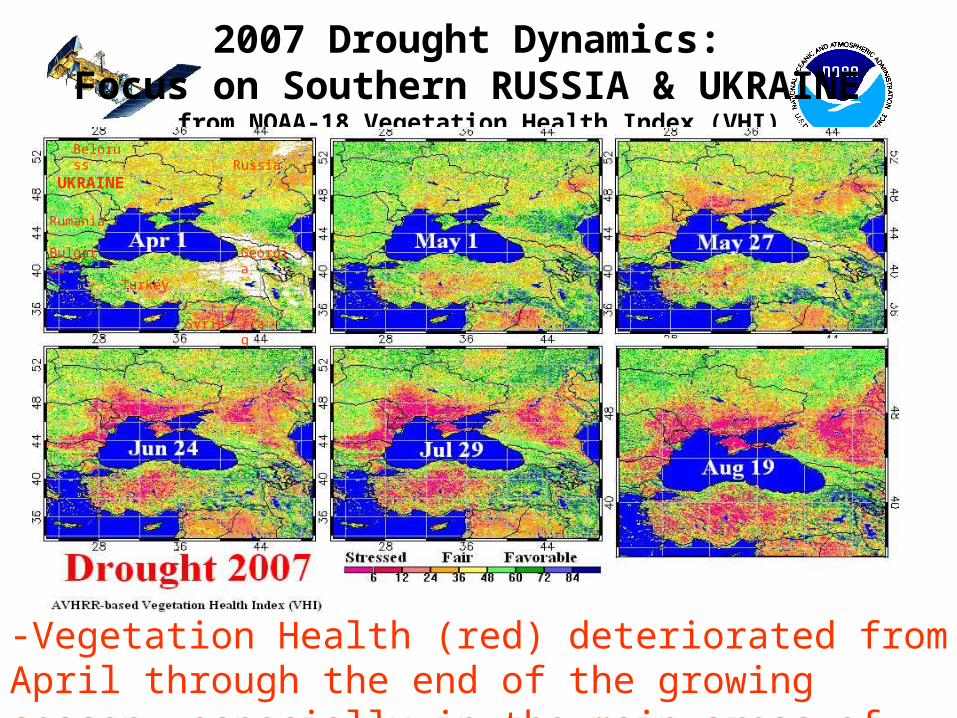
2007 Drought Dynamics: Focus on Southern RUSSIA & UKRAINE
from NOAA-18 Vegetation Health Index (VHI)
-Vegetation Health (red) deteriorated from April through the end of the growing season, especially in the main areas of winter wheat-VHI is derived from NOAA/AVHRR data and estimates greenness, vigor and thermal conditions of vegetation
UKRAINERussia
Turkey
Rumania
Beloruss
Bulgaria Georgia
Syria Iraq
www.rsindexbasedcropinsurance2010.com
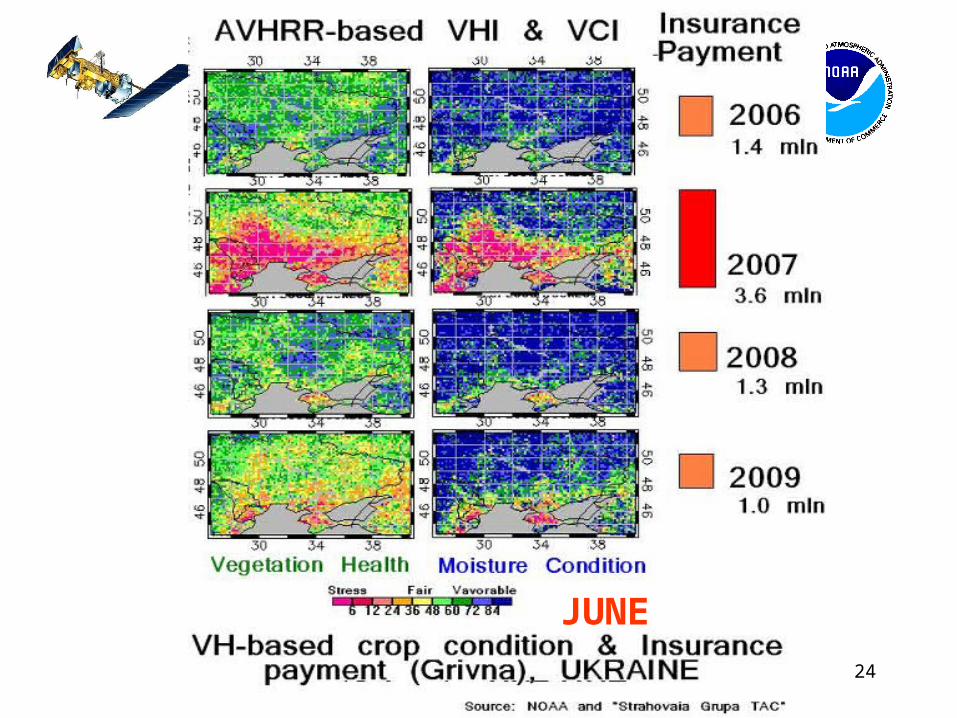
24
JUNE
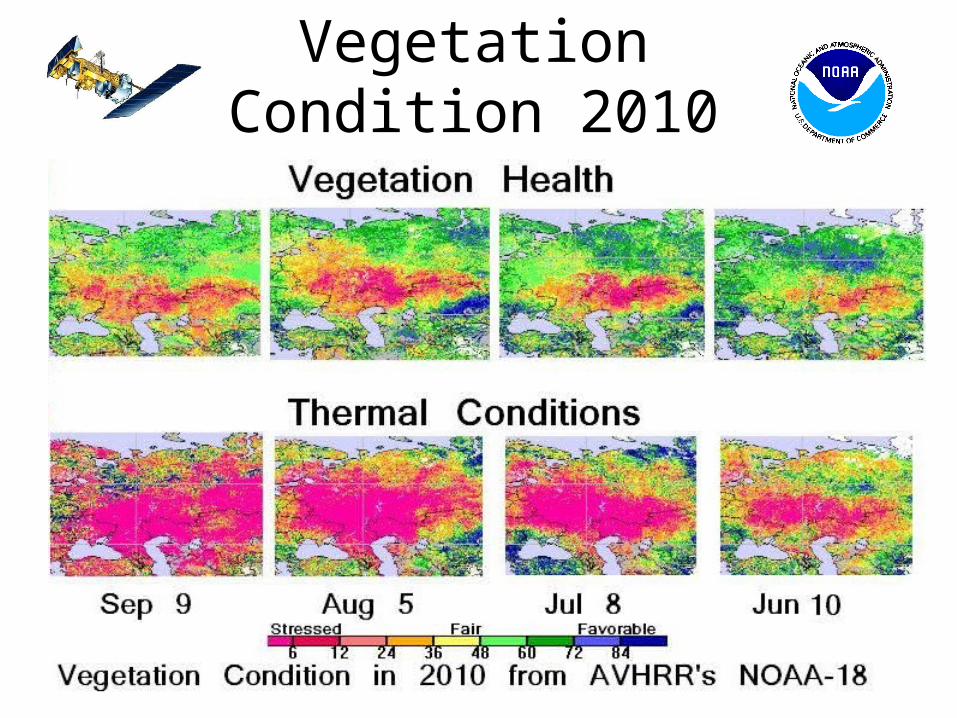
Vegetation Condition 2010
25
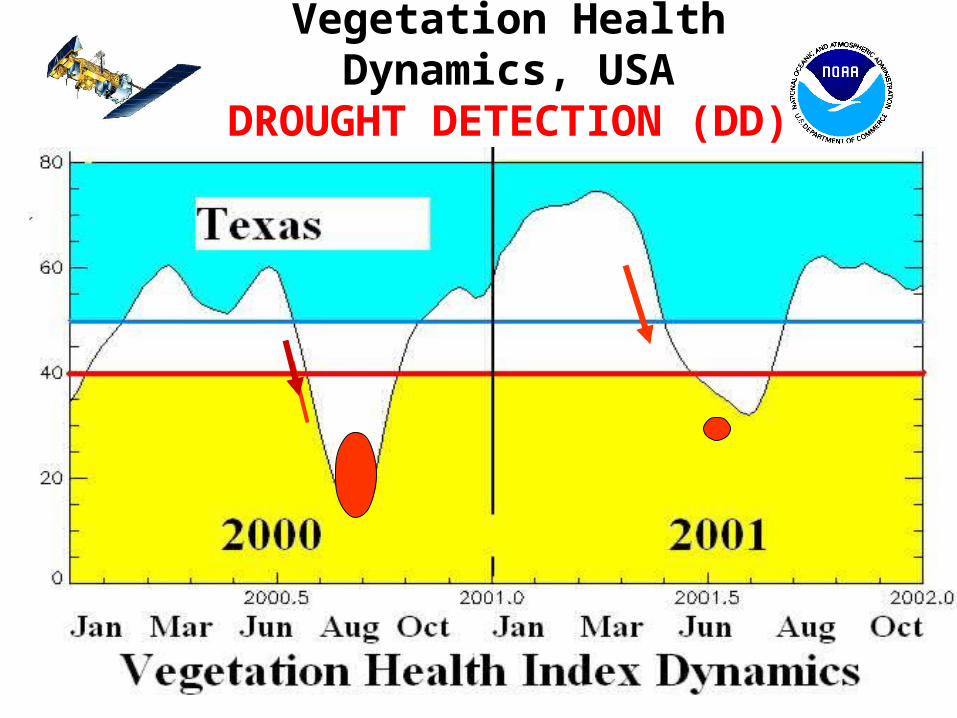
Vegetation Health Dynamics, USADROUGHT DETECTION (DD)
27
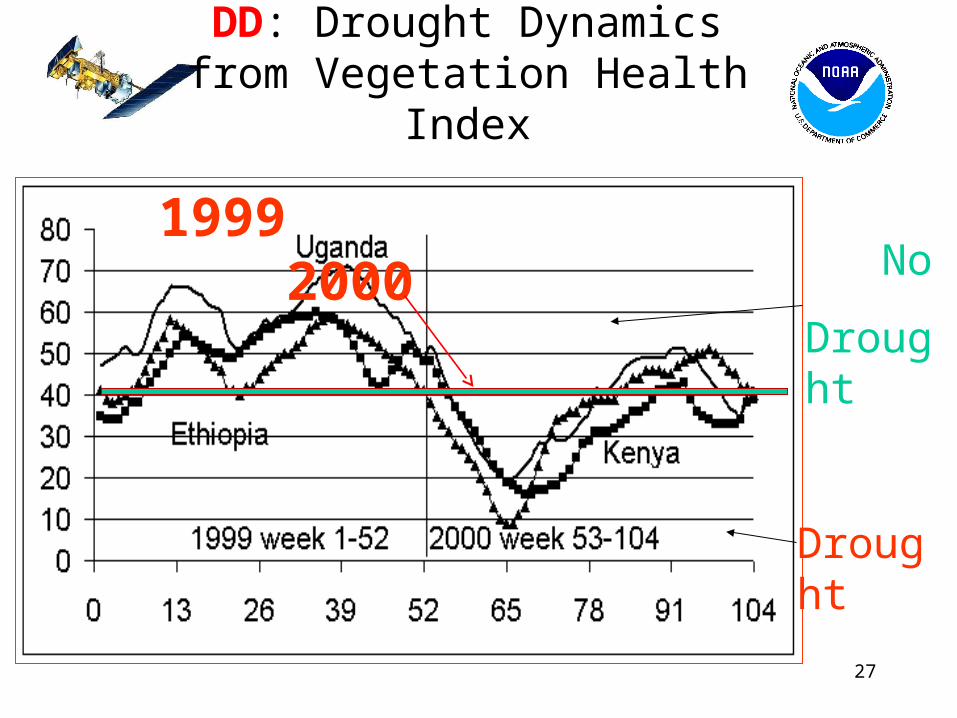
DD: Drought Dynamicsfrom Vegetation Health Index
Drought
No
Drought
1999 2000
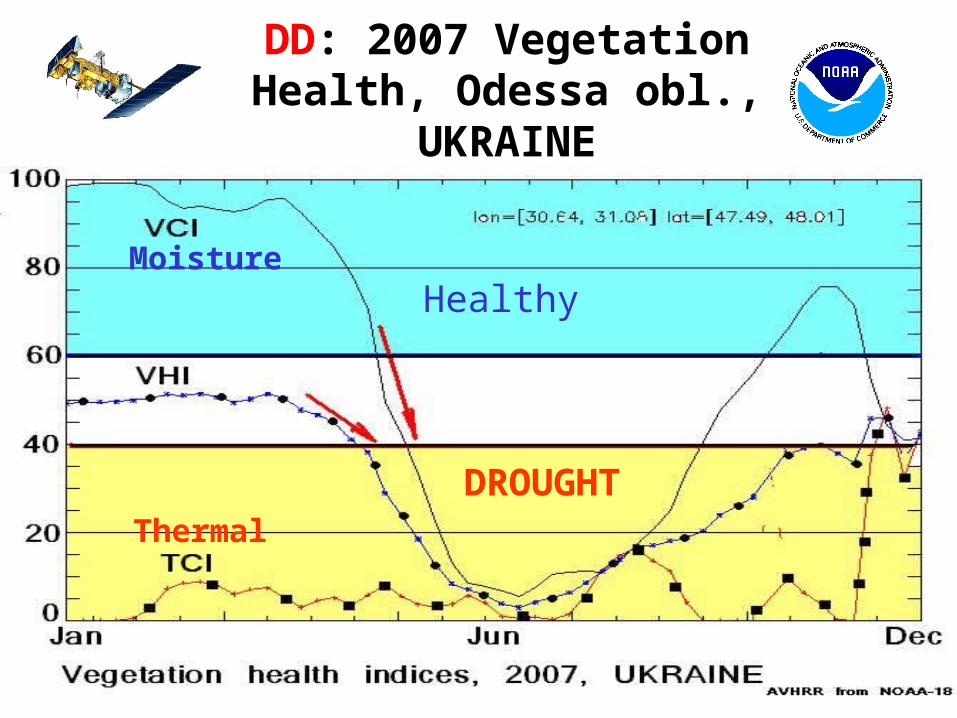
DD: 2007 Vegetation Health, Odessa obl., UKRAINE
28
DROUGHT
Healthy Moisture
Thermal
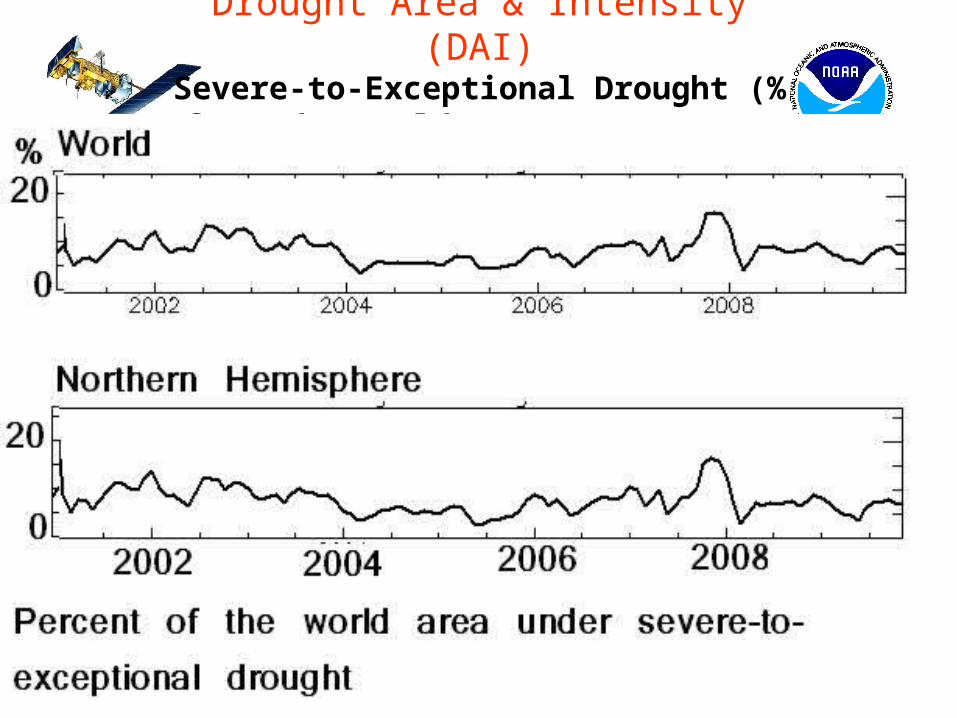
Drought Area & Intensity (DAI)Severe-to-Exceptional Drought (% from the
World area), 2000-2010
29
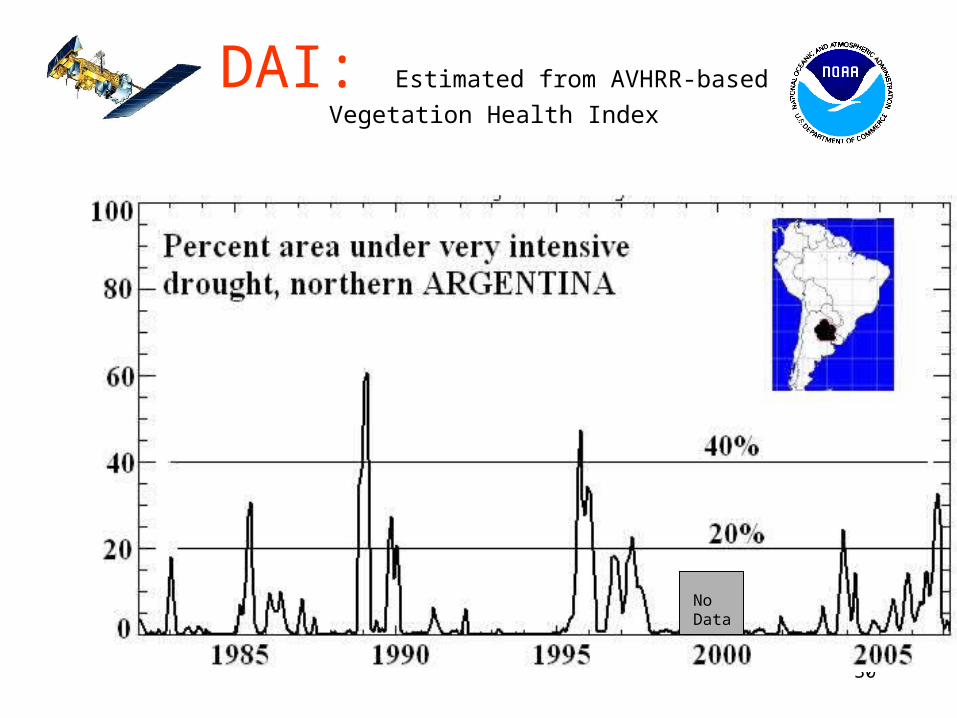
30
DAI: Estimated from AVHRR-based Vegetation
Health Index
No Data
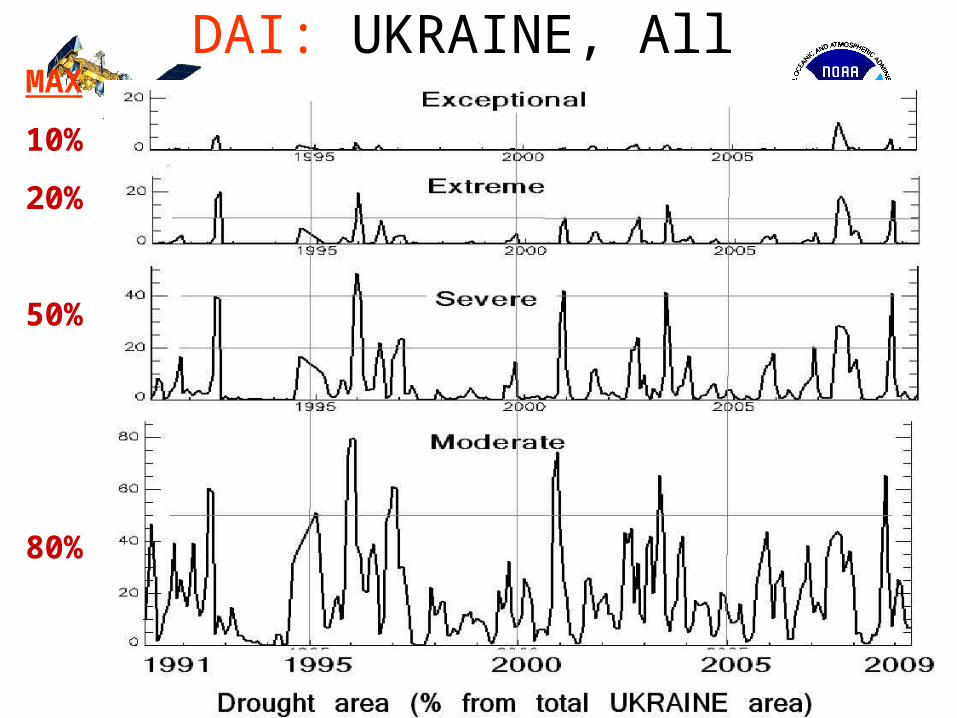
DAI: UKRAINE, All MAX
10%
20%
50%
80%
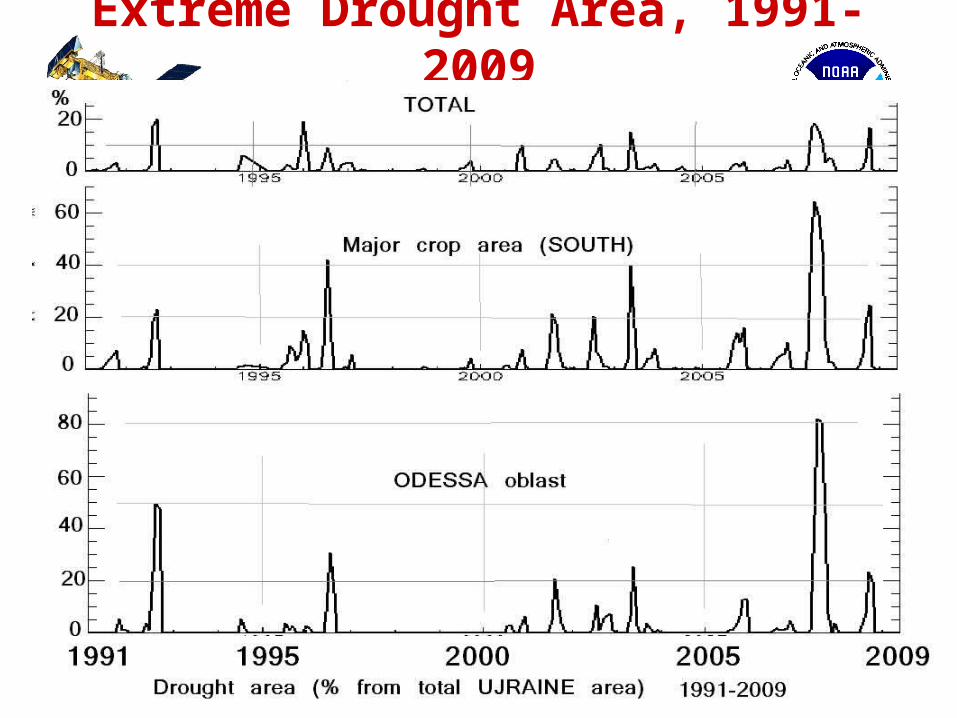
Extreme Drought Area, 1991-2009
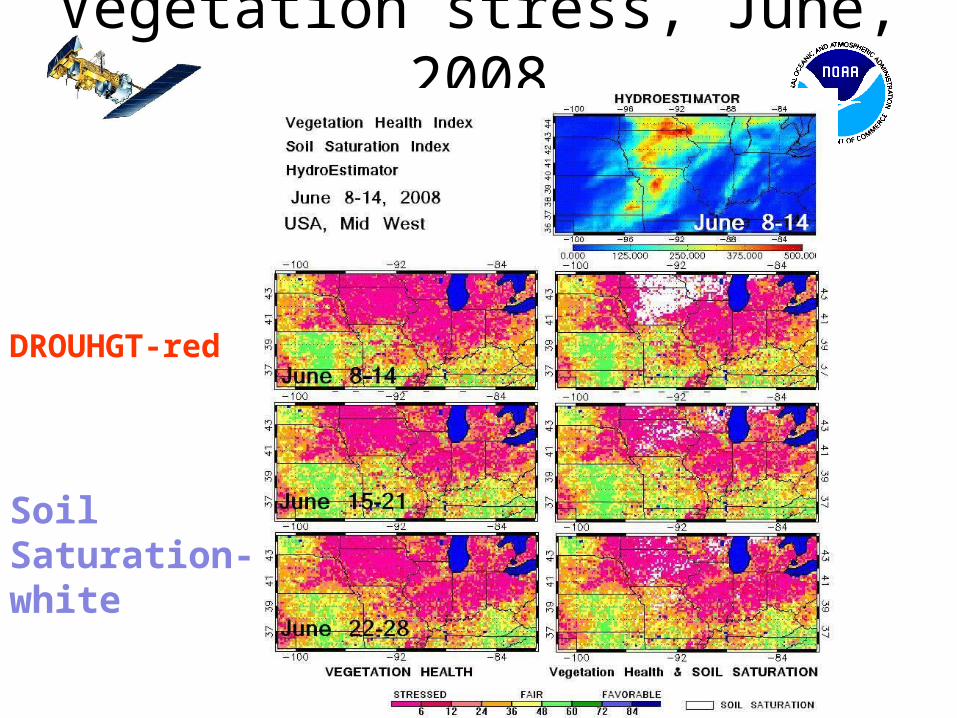
Vegetation stress, June, 2008
DROUHGT-red
Soil Saturation- white
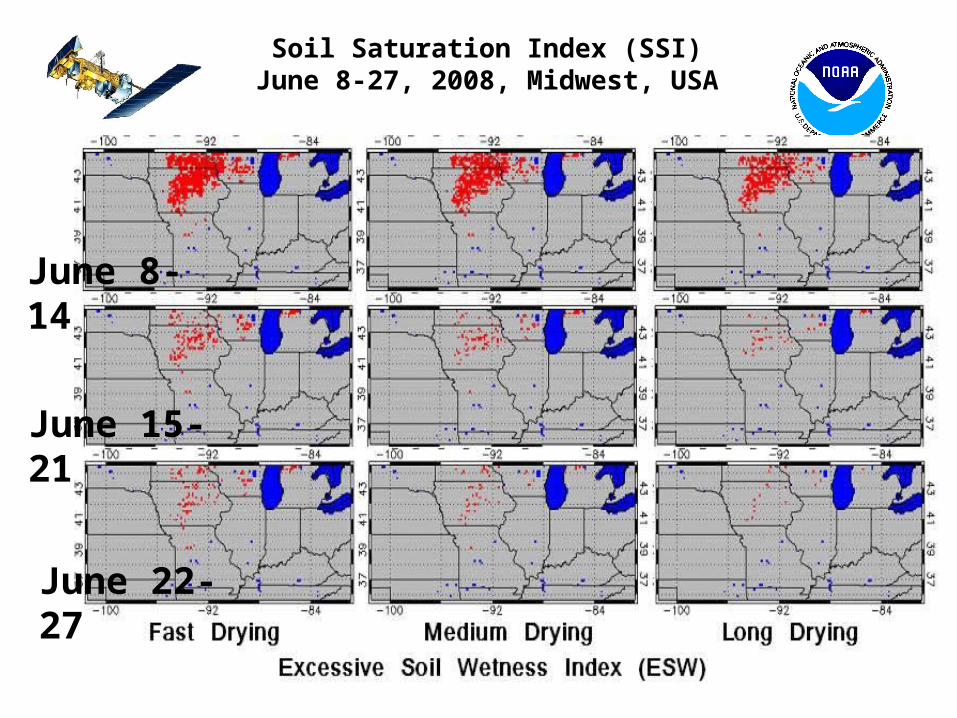
Soil Saturation Index (SSI)June 8-27, 2008, Midwest, USA
June 8-14
June 15-21
June 22-27
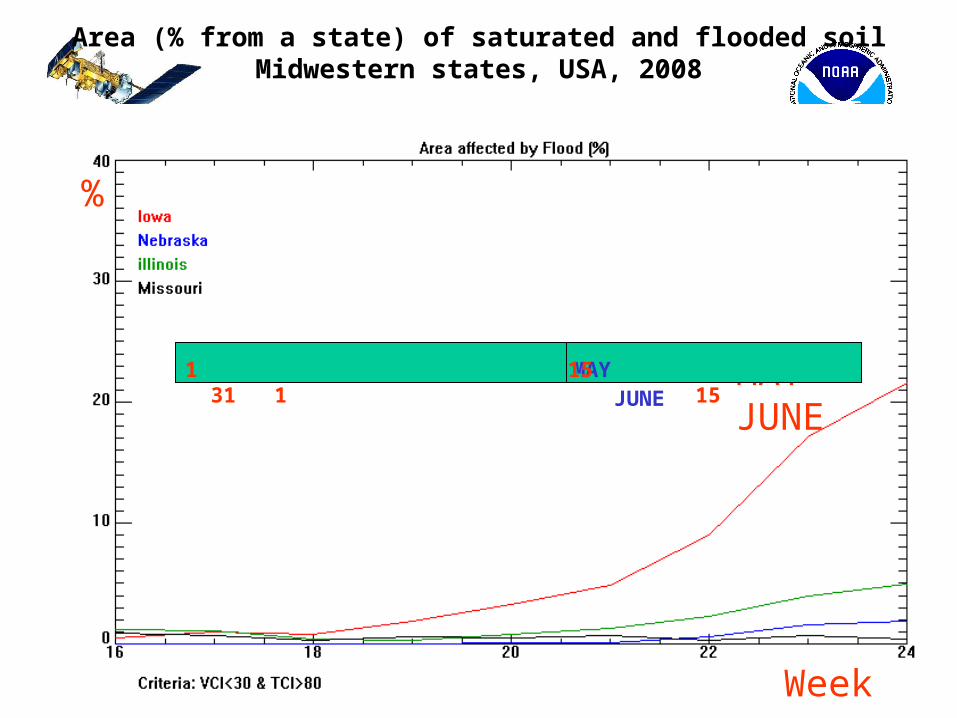
Area (% from a state) of saturated and flooded soilMidwestern states, USA, 2008
Week
MAY JUNE MAY JUNE
%
1 15 31 1 15
36
Web
http://www.orbit.nesdis.noaa.gov/smcd/emb/vci

Vegetation Health October 21, 2010
37
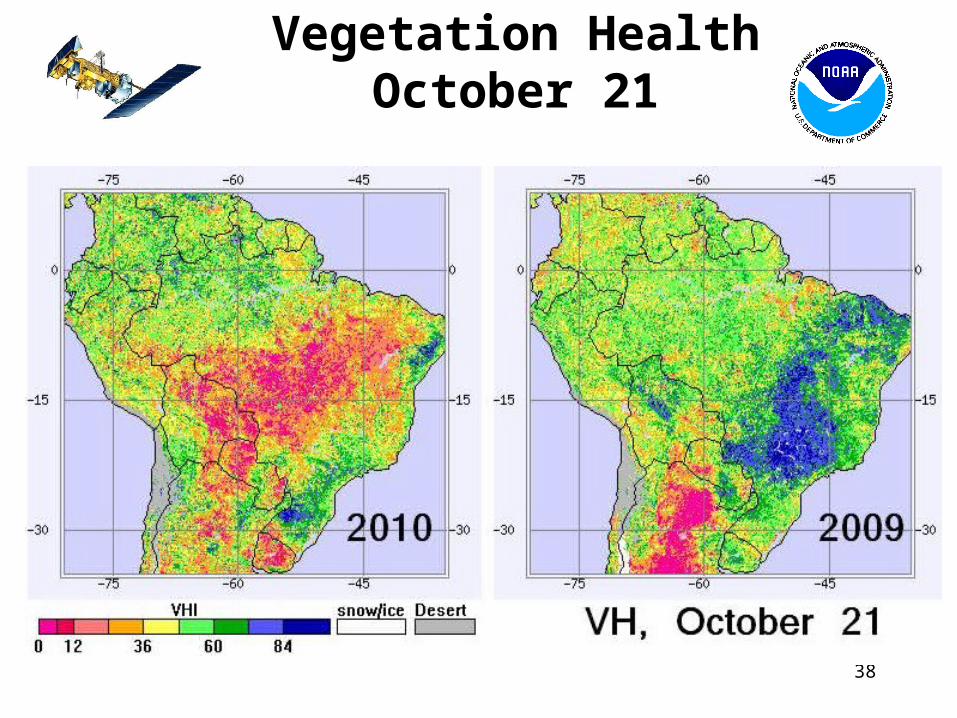
Vegetation HealthOctober 21
38
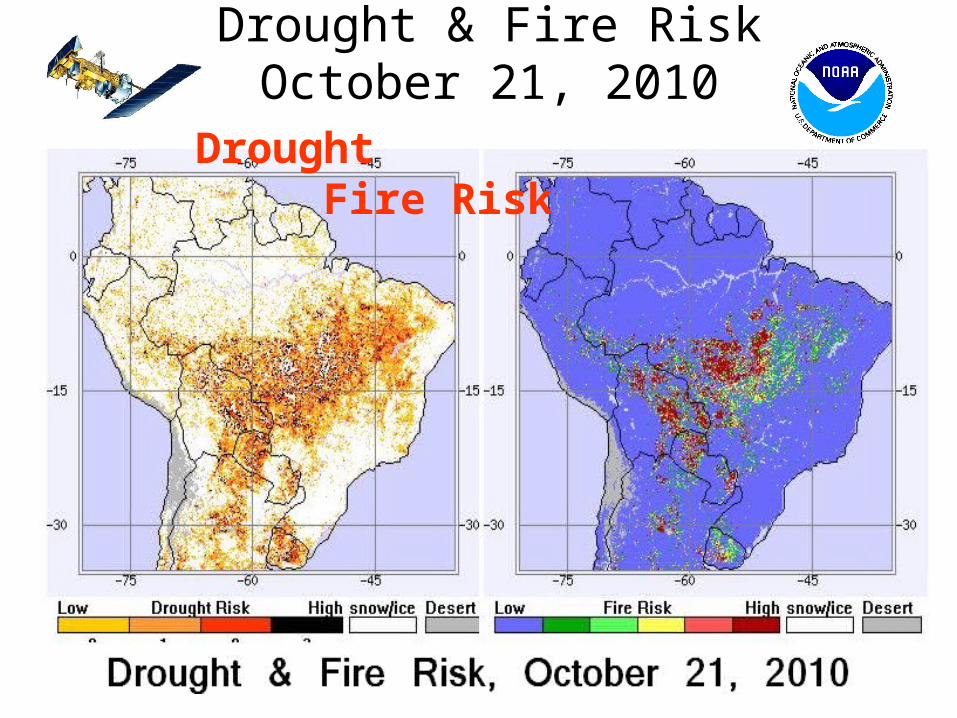
Drought & Fire RiskOctober 21, 2010
39
Drought Fire Risk
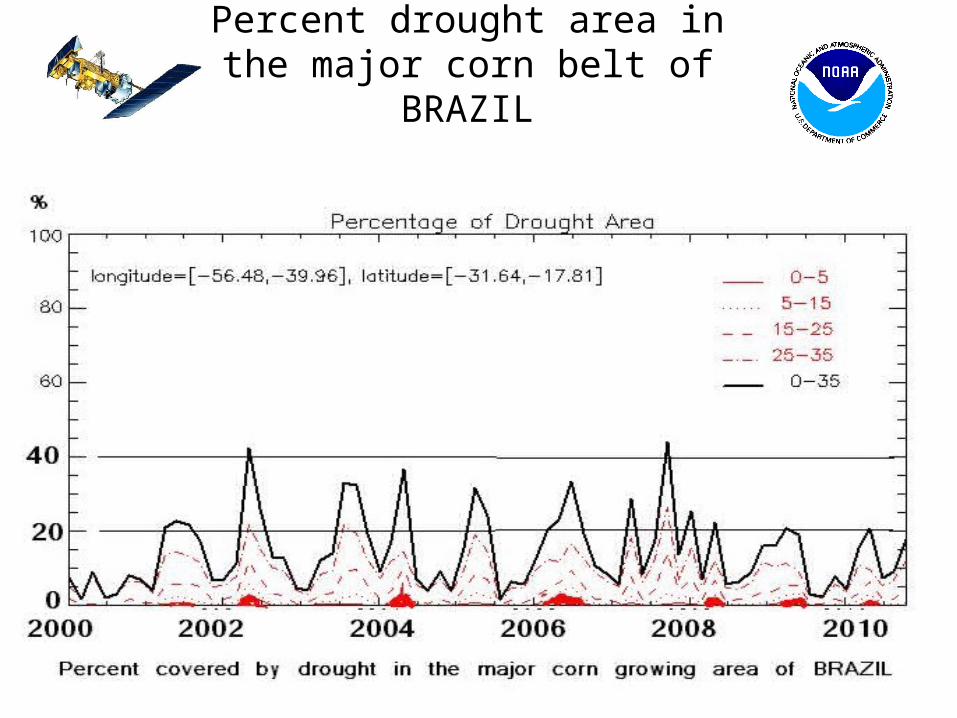
Percent drought area in the major corn belt of BRAZIL
40
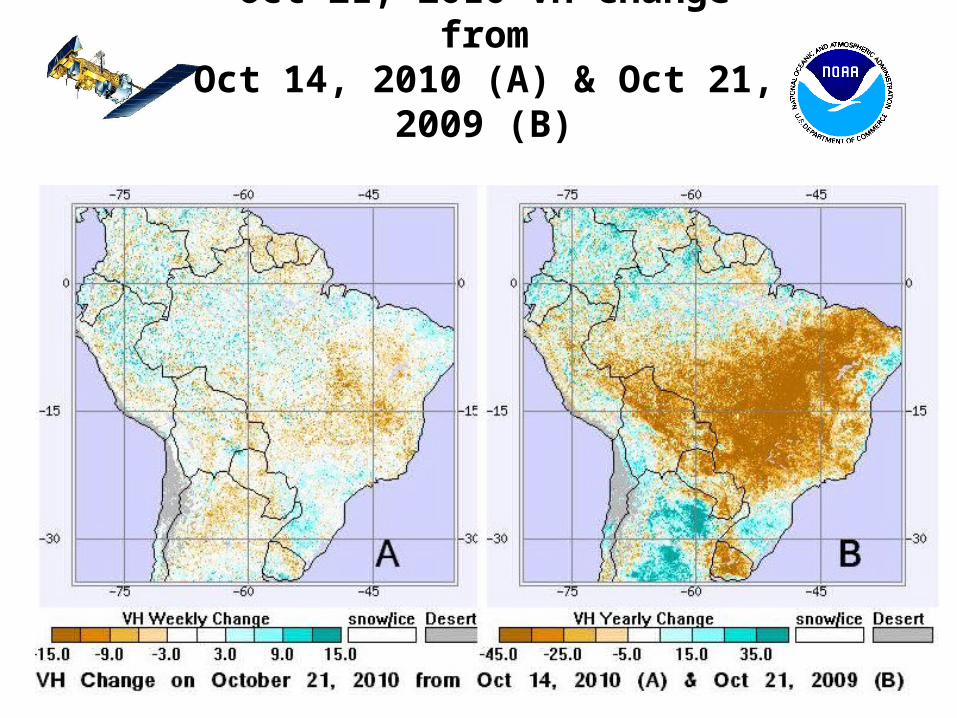
Oct 21, 2010 VH Change fromOct 14, 2010 (A) & Oct 21, 2009 (B)
41
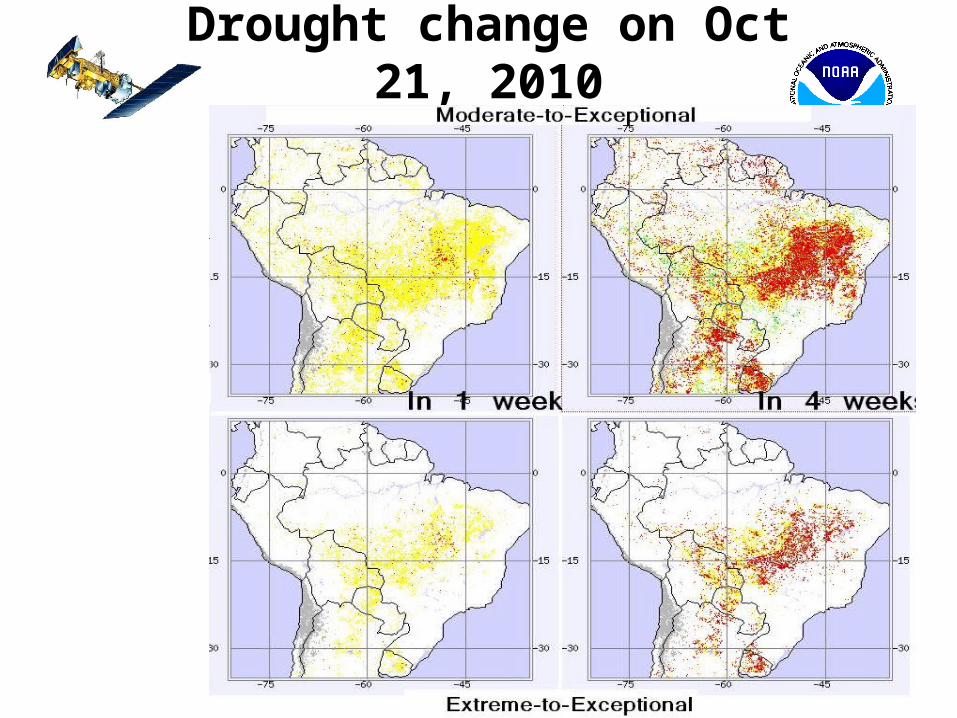
Drought change on Oct 21, 2010
42
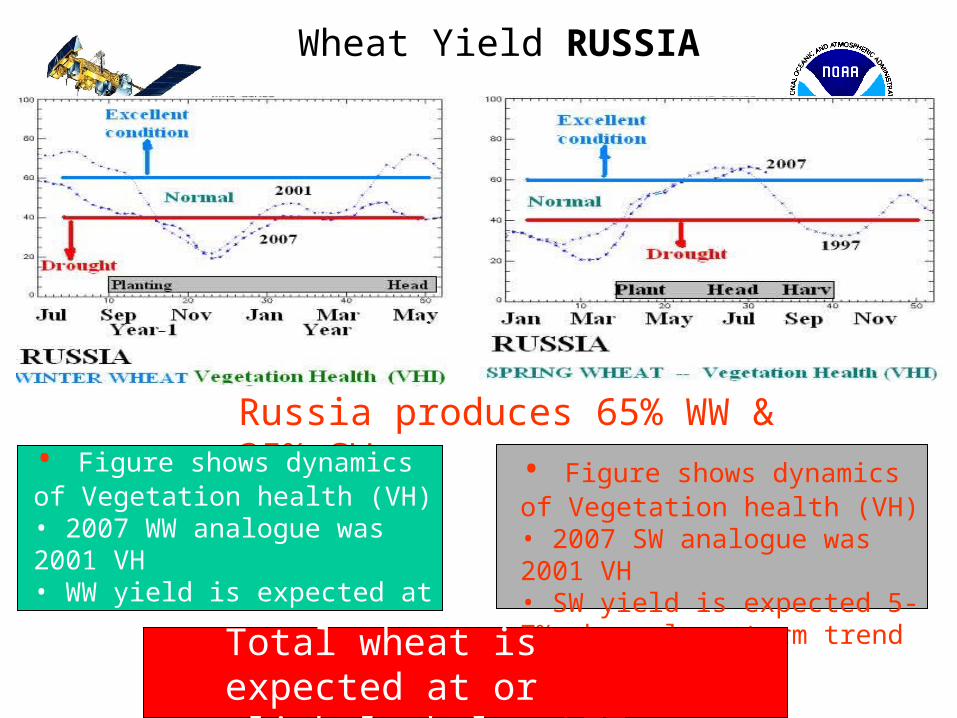
Wheat Yield RUSSIA
Russia produces 65% WW & 35% SW• Figure shows dynamics of Vegetation health (VH)• 2007 WW analogue was 2001 VH• WW yield is expected at or 1-3% below LTT or 1.9 t/ha
• Figure shows dynamics of Vegetation health (VH)• 2007 SW analogue was 2001 VH• SW yield is expected 5-7% above long-term trend (LTT)
Total wheat is expected at or slightly below LTT (1.96 t/ha)
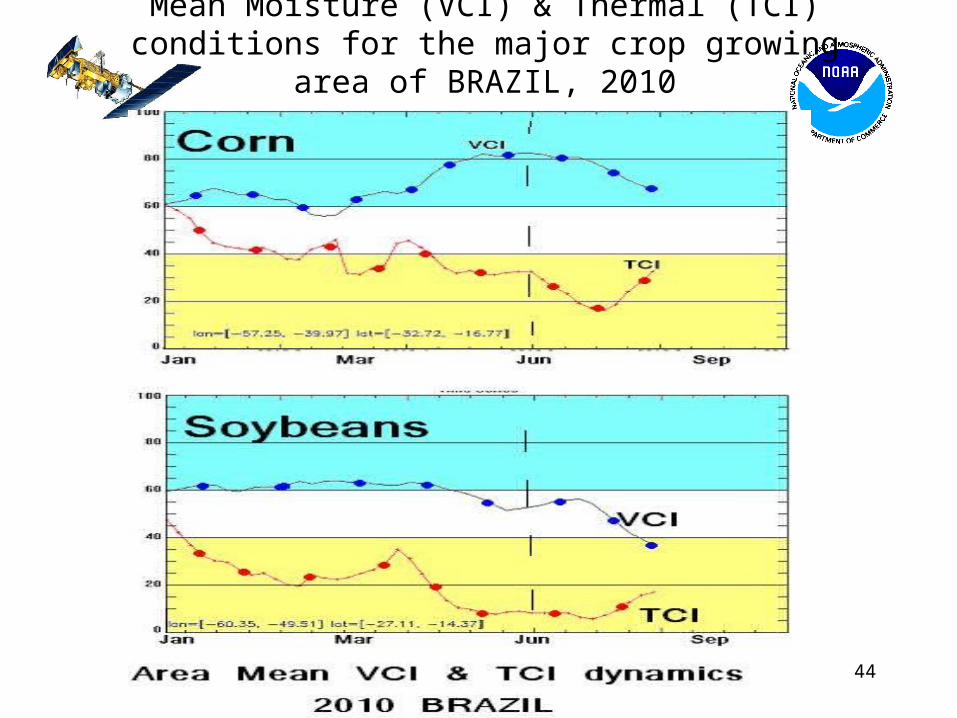
Mean Moisture (VCI) & Thermal (TCI) conditions for the major crop growing area of BRAZIL, 2010
44
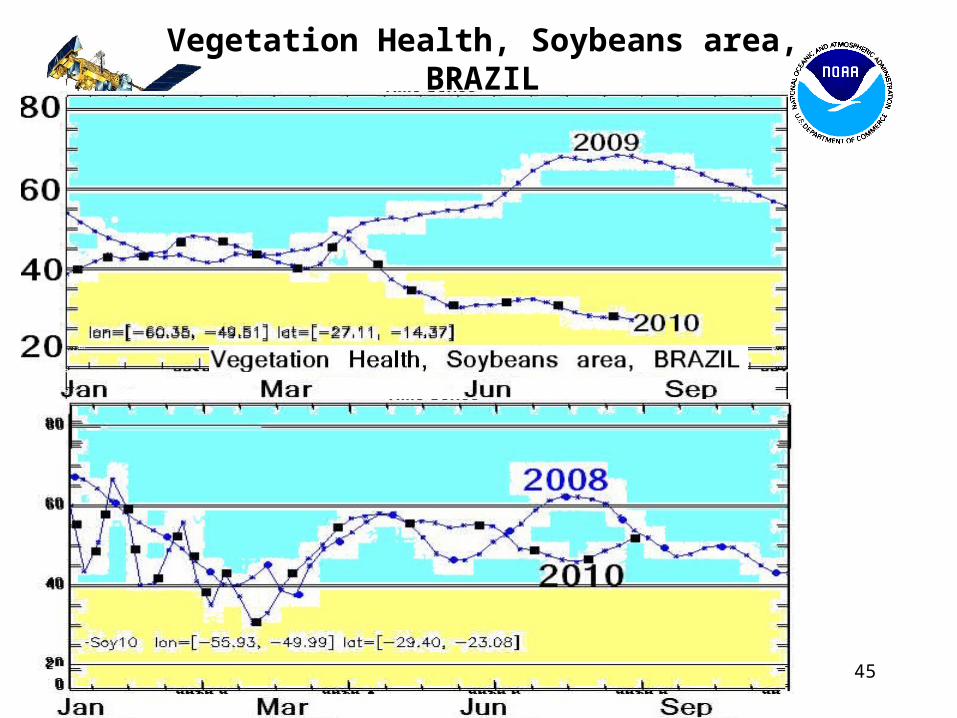
Vegetation Health, Soybeans area, BRAZIL
45
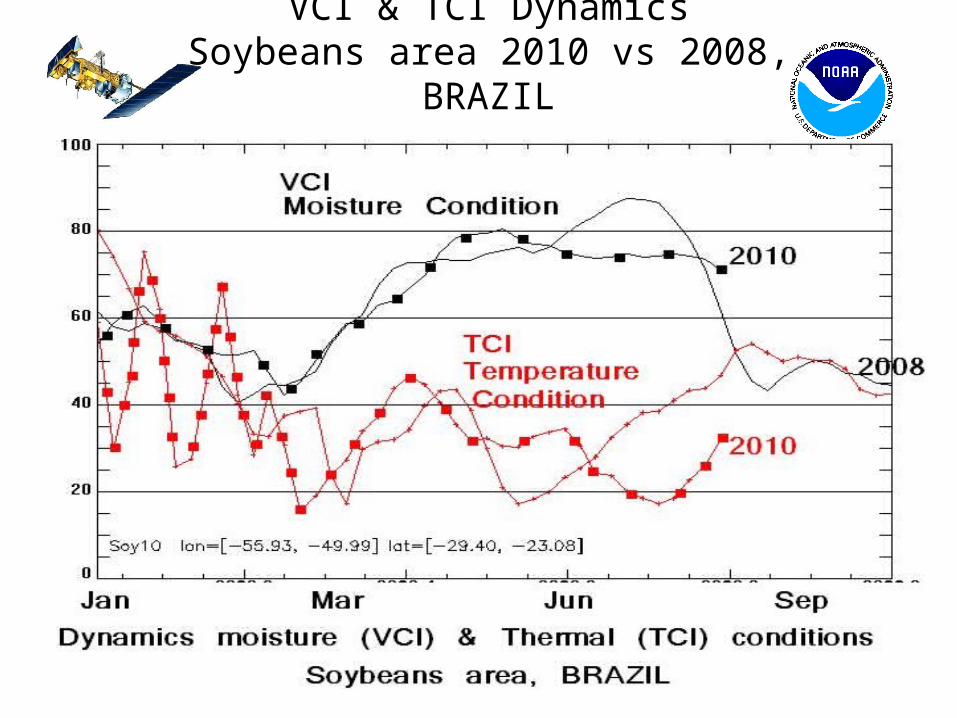
VCI & TCI DynamicsSoybeans area 2010 vs 2008, BRAZIL
46
PROBLEMS?
47
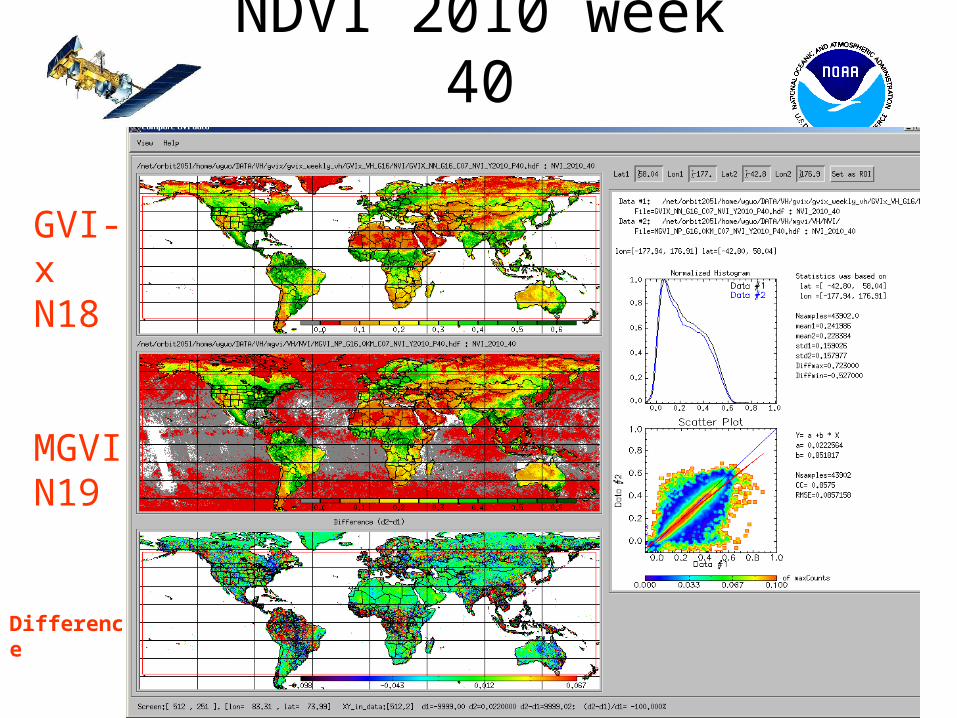
NDVI 2010 week 40
GVI-xN18
MGVIN19
Difference
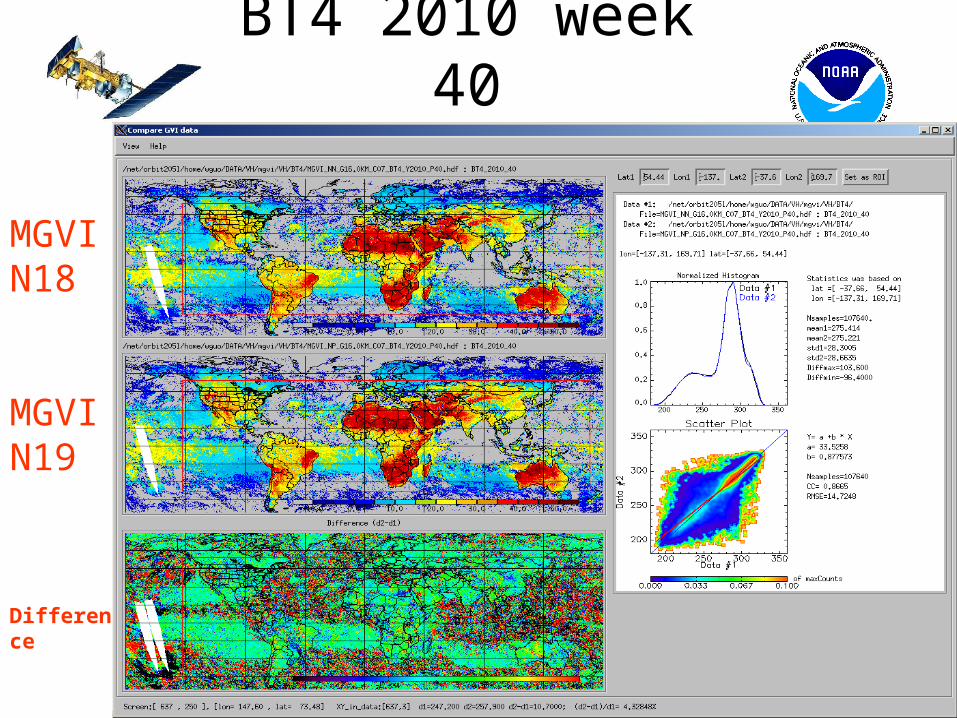
BT4 2010 week 40
MGVIN18
MGVIN19
Difference