Embed Size (px)
Citation preview
AGRICULTURAL PROFILE OF HARYANA
Revised and updated by
AGRICULTURAL ECONOMICS RESEARCH CENTRE
AGRICULTURAL PROFILE OF HARYANA
Revised and updated by
NARINDER SINGH
Earlier prepared by
D.S. Bhupal
AGRICULTURAL ECONOMICS RESEARCH CENTRE
University of Delhi,
MARCH, 2015
AGRICULTURAL PROFILE OF HARYANA
AGRICULTURAL ECONOMICS RESEARCH CENTRE
I
PREFACE
The Agricultural Economics Research Centre, University of Delhi prepared
Agriculture Profile of Haryana at the instance of the Ministry of Agriculture,
Government of India during 2012. It was initially prepared by Dr. D.S. Bhupal,
Senior Fellow. The document provides an overview of important aspects of
agriculture in the state. In view of its immense utility for all stake holders, the
document is updated and revised by Mr. Narinder Singh, Technical Assistant.
I hope it would be useful for researchers, students and planners. The
contribution of all staff members during the course of preparation of this
document is gratefully acknowledged.
March, 2015 (Usha Tuteja) Director (Actg.)
II
Contents
Administrative Setup
Agriculture
Manufacturing
Service sector
Roads, aviation and infrastructure
Rural Electrification
Population
Workers
GSDP of Haryana
Land Use Pattern
Area, Production and Yield of important crops
Operational Holdings
Status of Irrigated Area
Status of Livestock
Consumption of Fertilizer
Consumption of Pesticides
Fixed Capital Formation
Marketing and storage
Credit
Land Ceiling in Haryana
Soil fertility
Seed
Conclusion
III
Table Page No.
Table 1: Rural and Urban Population by Sex in Haryana, 2011 5
Table 2: Number and Percentage Distribution of Workers (Main + Marginal) by Broad Categories in Haryana, 2011
7
Table 3: Net State Domestic Product at Factor Cost at Current and Constant Prices (2004-05) in Haryana
9
Table 4: Gross State Domestic Product of Haryana ( Rs. Crore at current Prices) 10
Table 5: Gross State Domestic Product of Haryana (Rs. Crore) at constant Prices (2004-05)
11
Table 6: Land use Pattern in Haryana, ( ’000 ha) 13
Table 7a: Area under Important Crops in Haryana (‘000 Ha) 15-16
Table 7b: Production of Important Crops in Haryana (‘000Tonnes) 17-18
Table 7c: Yield per hectare of Important Crops in Haryana 19-20
Table 8: Number and Area of Operational Holdings in Haryana, 2010-11 22
Table 9: Net Area Irrigated by source in Haryana (000 ha) 23
Table 10: Animal Husbandary and Dairying in Haryana, 2012-13 24
Table 11: Animal Driven Implements and Equipments in Haryana, Census 2007 25
Table 12: Fertilizer Consumption in Haryana (Tonnes) 26
Table 13: Consumption of Pesticides in Haryana (Technical Grade) 26
Table 14 : Estimates of Gross Fixed Capital Formation in Haryana at Current Prices 27
Table 15 : Estimates of Gross Fixed Capital Formation in Haryana at Constant Prices 28
Table 16: Number of Markets in Haryana 30
Table 17: Storage Capacity and its Utilization in Haryana 31
Table 18: Godowns and their Capacity in Haryana since 2005 to 2013-14 31
Table 19 : Ground Level Credit for Agriculture and Allied activities in Haryana 32
Table 20: Credit for Agriculture and Allied activities, Haryana (1-4-2011 to 31-3-2012) 32
Table 21a : Requirement and Availability of Certified Seeds during RABI In Haryana (Qtls.)
36
Table 21b : Requirement and Availability of Certified Seeds during Kharif In Haryana (Qtls.)
37
IV
Figure Page No.
Fig. 1: Map of Haryana 2
Fig. 2: District-wise Rural Population, Haryana, 2011 6
Fig. 3: District-wise Urban Population, Haryana, 2011 6
Fig. 4: Male, Female distribution of Cultivators +Agri.Labourers in Haryana, 2001 7
Fig. 5: Male, Female distribution of Cultivators +Agri.Labourers in Haryana, 2011 7
Fig. 6: Percentage Distribution of Total Workers (Main + Marginal), by broad Industrial Categories in Haryana, 2011
7
Fig. 7: Percentage Distribution of Male Workers (Main + Marginal), by broad Industrial Categories in Haryana, 2011
8
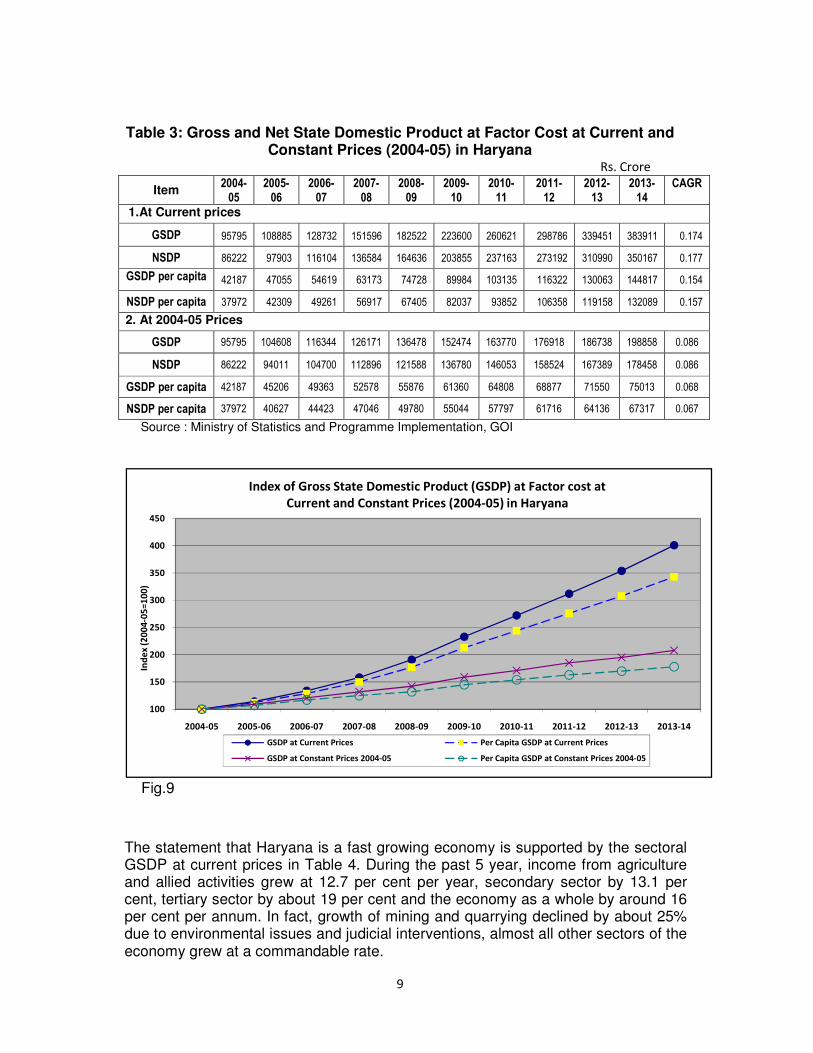
Fig. 8: Percentage Distribution of Female Workers (Main + Marginal), by broad Industrial Categories in Haryana, 2011
8
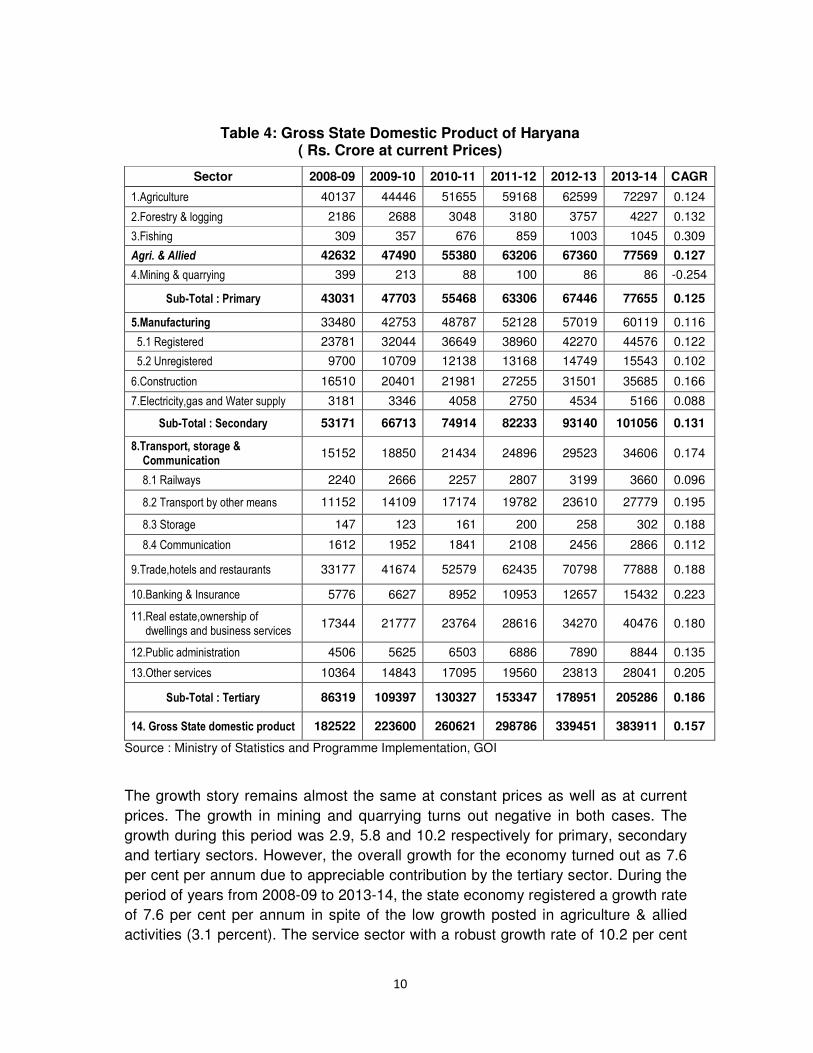
Fig. 9: Index of Gross State Domestic Product (GSDP) at Factor cost at Current and Constant (2004-05) Prices in Haryana
9
Fig.10: Gross State Domestic Product of Haryana (Rs. Crore at current Prices) 12
Fig. 11: Gross State Domestic Product of Haryana (Rs. Crore) at Constant 2004-05 Prices
12
Fig. 12: Cropped Area in Haryana 21
Fig. 13: Agricultural Production in Haryana 21
Fig. 14: Cropwise Yield in Haryana 21
Fig. 15: Number of Holdings by Ownership in Haryana, 2010-11 22
Fig. 16: Area of Operational Holdings in Haryana, 2010-11 22
Fig. 17: Size-wise Number of Operational Holdings in Haryana, 2010-11 22
Fig. 18: Size-wise Area of Holdings in Haryana, 2010-11 22
Fig. 19: Avg. Size and No.of Operational Holdings in Haryana, 2010-11 23
Fig. 20: Estimates of Gross Fixed Capital Formation at Current Prices in Haryana 29
Fig. 21: Estimates of Gross Fixed Capital Formation at Constant Prices in Haryana 29
Fig. 22 to Fig. 31: District-wise Level of Soil Fertility in Haryana 33-34
1
AGRICULTURAL PROFILE OF HARYANA
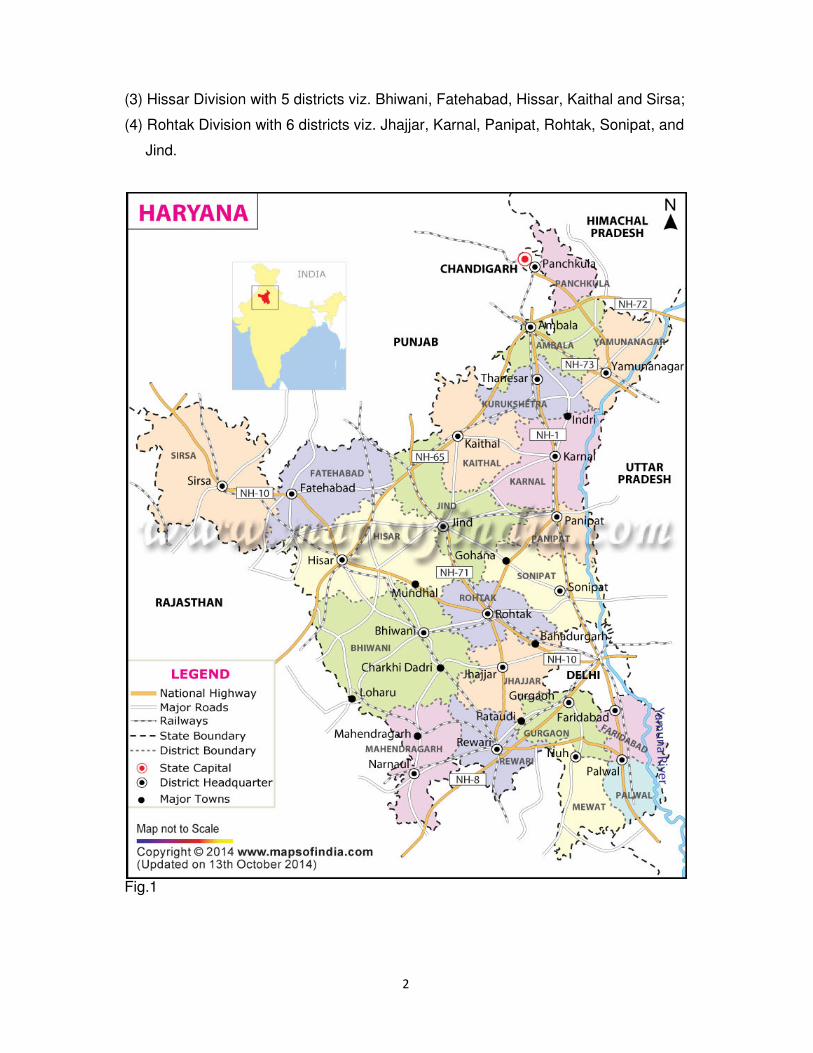
Haryana is an Indian state in north India with its capital at Panchkula. Earlier, it was a part of state of Punjab. The state came into existence on 1 November 1966 as a newly created 17th state of the Indian Union carved out of Punjab. It is bordered by Punjab and Himachal Pradesh to the north and by Rajasthan to the west and south. The river Yamuna defines its eastern border with Uttarakhand. Haryana is also surrounded by Delhi, the capital of the country on three sides, forming the northern, western and southern borders of Delhi. Consequently, a large area of south Haryana falls in the National Capital Region for the purpose of planning for development. Fig. 1 indicates the location of the state of Haryana in India.
Haryana is a landlocked state in northern India. It is located between 27°39' to 30°35' N latitude and between 74°28' and 77°36' E longitude. The altitude of Haryana varies between 700 to 3600 ft (200 metres to 1200 metres) above sea level. Haryana has four main geographical features.
• The Yamuna-Ghaggar plain forming the largest part of the state • The Shivalik Hills to the northeast • Semi-desert sandy plain to the southwest • Aravalli Range in the south
Administrative Setup
At present, Haryana has 4 administrative divisions constituting 21 districts –
(1) Ambala Division with 4 districts viz. Ambala, Kurukshetra, Panch Kula and
Yamuna Nagar;
(2) Gurgaon Division with 6 districts viz. Faridabad, Palwal, Gurgaon,
Mahendragarh, Mewat and Rewari;
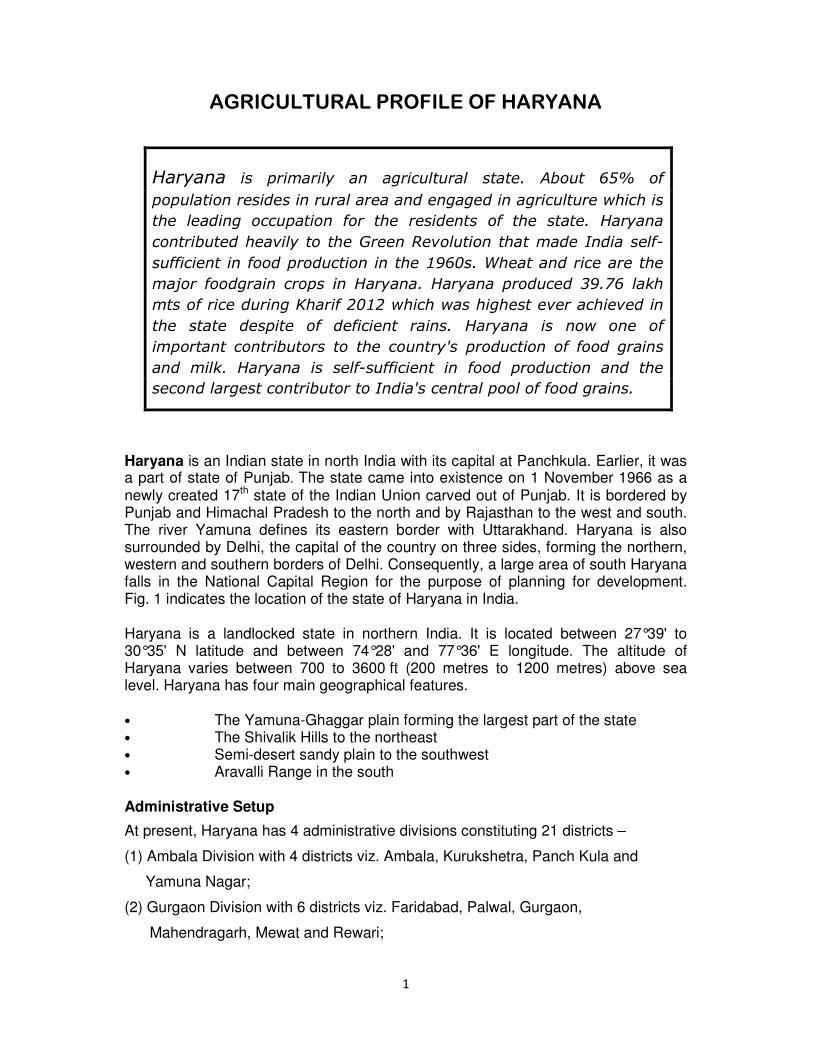
Haryana is primarily an agricultural state. About 65% of
population resides in rural area and engaged in agriculture which is
the leading occupation for the residents of the state. Haryana
contributed heavily to the Green Revolution that made India self-
sufficient in food production in the 1960s. Wheat and rice are the
major foodgrain crops in Haryana. Haryana produced 39.76 lakh
mts of rice during Kharif 2012 which was highest ever achieved in
the state despite of deficient rains. Haryana is now one of
important contributors to the country's production of food grains
and milk. Haryana is self-sufficient in food production and the
second largest contributor to India's central pool of food grains.
2
(3) Hissar Division with 5 districts viz. Bhiwani, Fatehabad, Hissar, Kaithal and Sirsa;
(4) Rohtak Division with 6 districts viz. Jhajjar, Karnal, Panipat, Rohtak, Sonipat, and
Jind.
Fig.1
Haryana is also one of the progressivecapita income in the country at year 2013–14. Haryana is one of the and its agriculture and manufacturing industry has experienced sustained growth since the 1970s. The economy of Haryana relies on manufacturing and agriculture
Agriculture
Haryana is primarily an agricultural state. workforce of the state. The submersible pumpsthe major sources of IrrigationRevolution that made India selfrice are the major crops. Haryana is now a leading contributor to the country's production of food grains and milk. kharif 2012 which was highestHaryana is self-sufficient in food production and the India's central pool of food grains.production of the country due to availability of irrigationtechnology.
Manufacturing
Haryana is India's largest manufacturer of passenger cars, twotractors. The state has emerged as the largest recipient of investment per capita in India. The district of Gurgaontechnology and automobile industries. Gurgaon is home to largest automobile manufacturer, and manufacturer of two-wheelers. Panipat, Yamuna Nagar and being the second largest refinery in South Asia. There are also long established steel, plywood, paper and textile industries in the st
Service sector
Faridabad and Gurgaon, the two leading financial and industrial emerged as an important destination for years. A large number of international companies such as Solutions, Abacus Softech, General Electric, Tata Consultancy Servicesand contact centres in Faridabad and Gurgaon.
Roads, Aviation and Infrastructure
Haryana and the Delhi governmentconnects Delhi and Faridabad. It has been built as per international standards. It is first of its kind in North India. DelhiFaridabad is under construction. There are 29 1,461 kms and many state highwaysareas of the state are linked with
3
progressive states of India and had the third in the country at 119,158 in the year 2012–13 and 132,089 in the
14. Haryana is one of the agriculturally developed regions in South Asia and manufacturing industry has experienced sustained growth The economy of Haryana relies on tertiary followed by
and agriculture sectors.
Haryana is primarily an agricultural state. Agriculture is the leading occupation submersible pumps and an extensive canal
the major sources of Irrigation. Haryana contributed significantly to the that made India self-sufficient in food production in the 1960s.
Haryana is now a leading contributor to the country's production of food grains and milk. Haryana produced 39.76 lakh mts. of
highest ever achieved in the state despite deficient rains. sufficient in food production and the second largest contributor to
India's central pool of food grains. Haryana contributed significantly to production of the country due to availability of irrigation and adaption of improved
Haryana is India's largest manufacturer of passenger cars, two-wheelers, and he state has emerged as the largest recipient of investment per capita in
Gurgaon has emerged as a major hub for the and automobile industries. Gurgaon is home to Maruti Suzuki
largest automobile manufacturer, and Hero MotoCorp, the world's largest wheelers. Faridabad, Panchkula, Dharuhera, Bawal
and Rewari are also industrial hubs, with Panipat Refinerybeing the second largest refinery in South Asia. There are also long established steel, plywood, paper and textile industries in the state.
Faridabad and Gurgaon, the two leading financial and industrial districts important destination for information technology industry in recent
years. A large number of international companies such as SamsungSolutions, Abacus Softech, Nokia Networks, Mitsubishi Electric, IBM
Tata Consultancy Services and Amdocs have their branch officand contact centres in Faridabad and Gurgaon.
nfrastructure
Delhi governments constructed DF Skyway (4.5 kmnd Faridabad. It has been built as per international standards. It is
kind in North India. Delhi-Agra Expressway (NH-2) passFaridabad is under construction. There are 29 national highways with total length of
state highways with total length of 2,494 kms. The remote of the state are linked with metaled roads. Its modern bus fleet of 3,864 buses
highest per 132,089 in the
developed regions in South Asia and manufacturing industry has experienced sustained growth
tertiary followed by
Agriculture is the leading occupation of the canal system are
to the Green sufficient in food production in the 1960s. Wheat and
Haryana is now a leading contributor to the country's of rice during
tate despite deficient rains. contributor to
Haryana contributed significantly to foodgrains and adaption of improved
wheelers, and he state has emerged as the largest recipient of investment per capita in
has emerged as a major hub for the information Maruti Suzuki, India's
, the world's largest Bawal, Sonipat,
Panipat Refinery being the second largest refinery in South Asia. There are also long established
of Haryana, information technology industry in recent
Samsung, Damco IBM, Huawei,
have their branch offices
kms) which nd Faridabad. It has been built as per international standards. It is
2) passing through with total length of
. The remote metaled roads. Its modern bus fleet of 3,864 buses
4
covers a long distance per day. It was the first state in the country to introduce luxury video coaches. The Grand Trunk Road, commonly abbreviated as GT road, is one of oldest and longest roads passing through the districts of Sonipat, Panipat, Karnal, Kurukshetra and Ambala in north Haryana where it enters Delhi and subsequently, the industrial town of Faridabad. The state government has proposed to construct Express highways and freeways for speedier vehicular traffic. The 135.6-kms long Kundli-Manesar-Palwal Expressway(KMP) will provide a high-speed link to northern Haryana with its southern districts such as Sonipat, Gurgaon, Jhajjar and Faridabad. International and domestic airports, diplomatic and commercial complexes are located in close proximity to the state.
Rural Electrification
Haryana state has always given high priority to the expansion of electricity as infrastructure, since it is one of the most important inputs for the development of any state. Haryana was the first state in the country to achieve 100% rural electrification in 1970, first in the country to link all villages with all-weather roads and first in the country to provide safe drinking water facilities throughout the state. Haryana is well connected with the railway network. There are proposals to revive the Hisar Airport and Karnal Airport, and a new Greenfield Cargo Airport to serve the city of Rohtak.
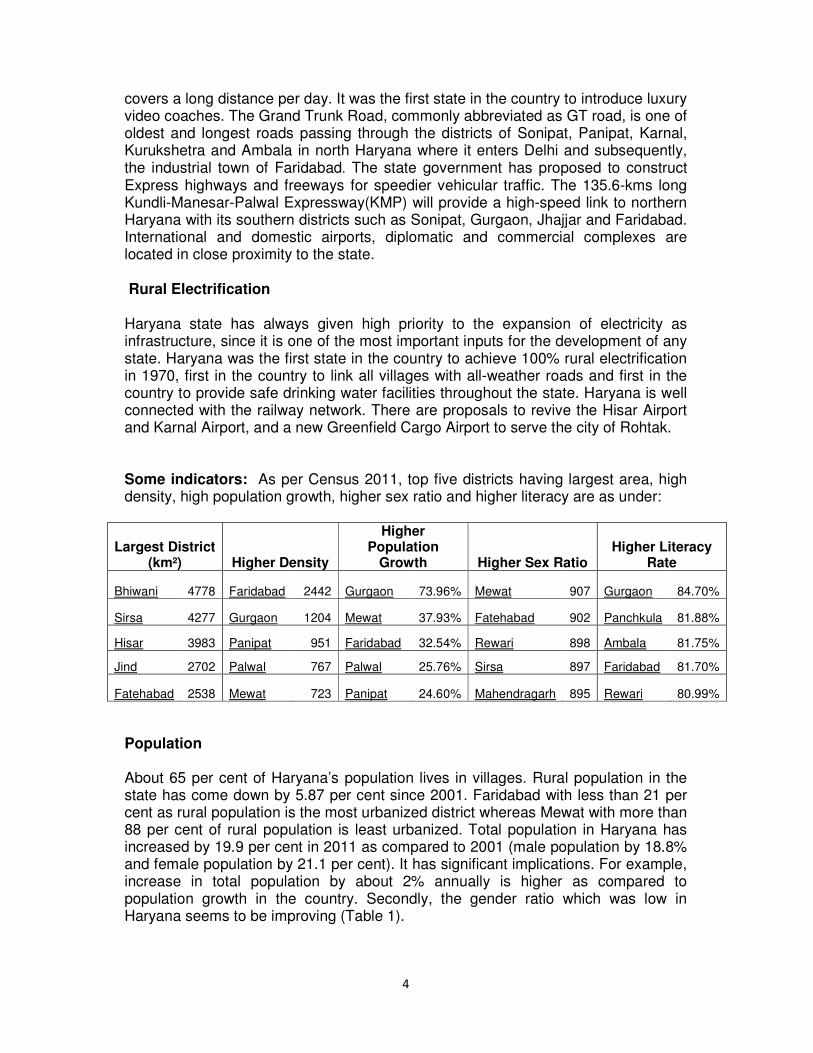
Some indicators: As per Census 2011, top five districts having largest area, high density, high population growth, higher sex ratio and higher literacy are as under:
Largest District (km²) Higher Density
Higher Population
Growth Higher Sex Ratio Higher Literacy
Rate
Bhiwani 4778 Faridabad 2442 Gurgaon 73.96% Mewat 907 Gurgaon 84.70%
Sirsa 4277 Gurgaon 1204 Mewat 37.93% Fatehabad 902 Panchkula 81.88%
Hisar 3983 Panipat 951 Faridabad 32.54% Rewari 898 Ambala 81.75%
Jind 2702 Palwal 767 Palwal 25.76% Sirsa 897 Faridabad 81.70%
Fatehabad 2538 Mewat 723 Panipat 24.60% Mahendragarh 895 Rewari 80.99%
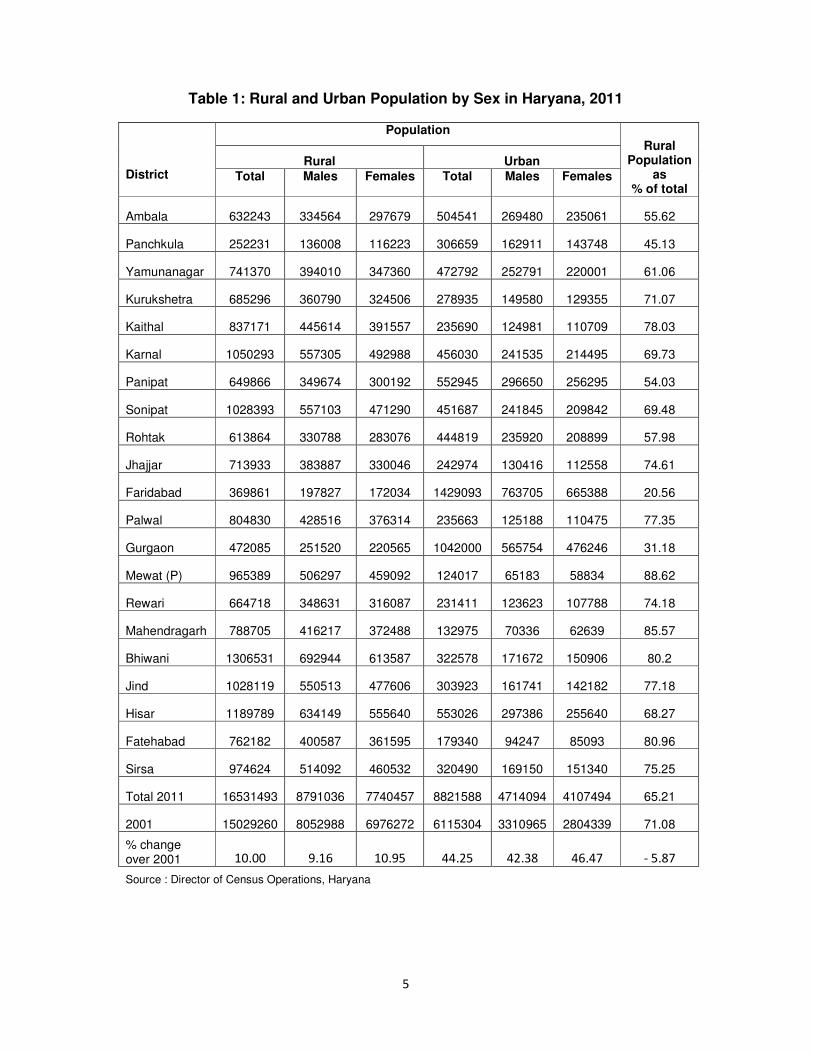
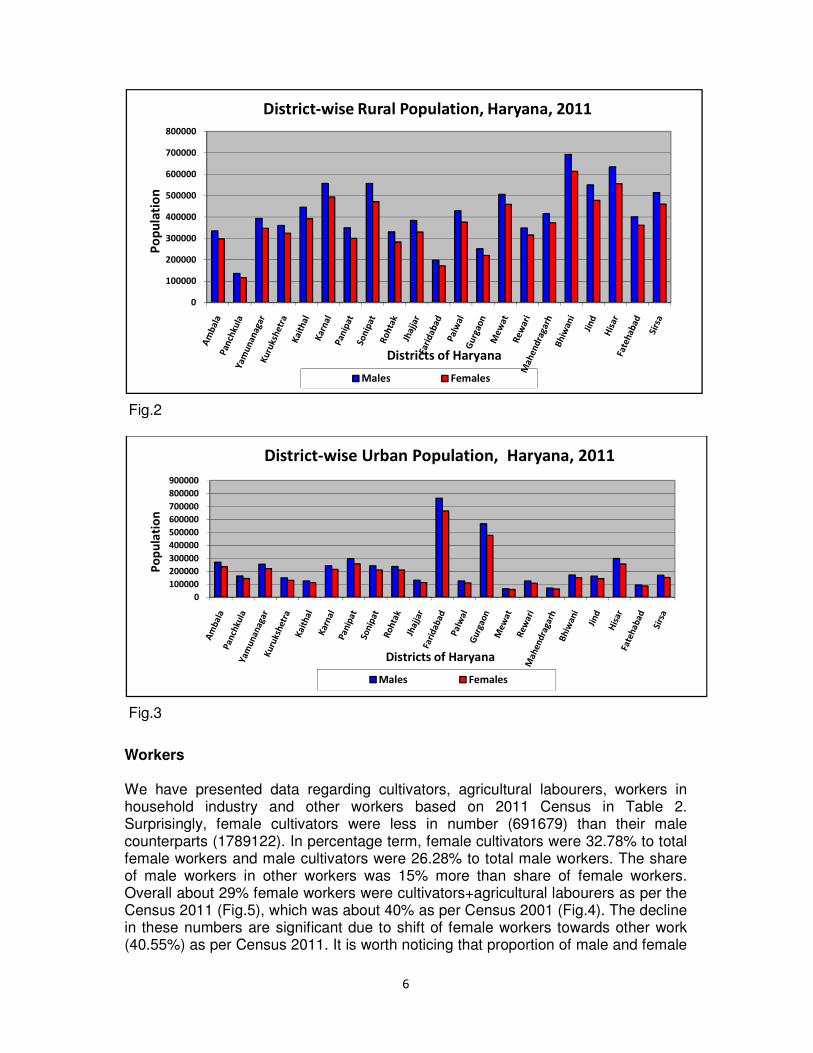
Population About 65 per cent of Haryana’s population lives in villages. Rural population in the state has come down by 5.87 per cent since 2001. Faridabad with less than 21 per cent as rural population is the most urbanized district whereas Mewat with more than 88 per cent of rural population is least urbanized. Total population in Haryana has increased by 19.9 per cent in 2011 as compared to 2001 (male population by 18.8% and female population by 21.1 per cent). It has significant implications. For example, increase in total population by about 2% annually is higher as compared to population growth in the country. Secondly, the gender ratio which was low in Haryana seems to be improving (Table 1).
5
Table 1: Rural and Urban Population by Sex in Haryana, 2011
District
Population Rural
Population as
% of total
Rural Urban Total
Males
Females
Total
Males
Females
Ambala 632243 334564 297679 504541 269480 235061 55.62
Panchkula 252231 136008 116223 306659 162911 143748 45.13
Yamunanagar 741370 394010 347360 472792 252791 220001 61.06
Kurukshetra 685296 360790 324506 278935 149580 129355 71.07
Kaithal 837171 445614 391557 235690 124981 110709 78.03
Karnal 1050293 557305 492988 456030 241535 214495 69.73
Panipat 649866 349674 300192 552945 296650 256295 54.03
Sonipat 1028393 557103 471290 451687 241845 209842 69.48
Rohtak 613864 330788 283076 444819 235920 208899 57.98
Jhajjar 713933 383887 330046 242974 130416 112558 74.61
Faridabad 369861 197827 172034 1429093 763705 665388 20.56
Palwal 804830 428516 376314 235663 125188 110475 77.35
Gurgaon 472085 251520 220565 1042000 565754 476246 31.18
Mewat (P) 965389 506297 459092 124017 65183 58834 88.62
Rewari 664718 348631 316087 231411 123623 107788 74.18
Mahendragarh 788705 416217 372488 132975 70336 62639 85.57
Bhiwani 1306531 692944 613587 322578 171672 150906 80.2
Jind 1028119 550513 477606 303923 161741 142182 77.18
Hisar 1189789 634149 555640 553026 297386 255640 68.27
Fatehabad 762182 400587 361595 179340 94247 85093 80.96
Sirsa 974624 514092 460532 320490 169150 151340 75.25
Total 2011 16531493 8791036 7740457 8821588 4714094 4107494 65.21
2001 15029260 8052988 6976272 6115304 3310965 2804339 71.08
% change over 2001 10.00 9.16 10.95 44.25 42.38 46.47 - 5.87
Source : Director of Census Operations, Haryana
6
Fig.2
Fig.3
Workers We have presented data regarding cultivators, agricultural labourers, workers in household industry and other workers based on 2011 Census in Table 2. Surprisingly, female cultivators were less in number (691679) than their male counterparts (1789122). In percentage term, female cultivators were 32.78% to total female workers and male cultivators were 26.28% to total male workers. The share of male workers in other workers was 15% more than share of female workers. Overall about 29% female workers were cultivators+agricultural labourers as per the Census 2011 (Fig.5), which was about 40% as per Census 2001 (Fig.4). The decline in these numbers are significant due to shift of female workers towards other work (40.55%) as per Census 2011. It is worth noticing that proportion of male and female
0
100000
200000
300000
400000
500000
600000
700000
800000
Po
pu
lati
on
Districts of Haryana
District-wise Rural Population, Haryana, 2011
Males Females
0
100000
200000
300000
400000
500000
600000
700000
800000
900000
Po
pu
lati
on
Districts of Haryana
District-wise Urban Population, Haryana, 2011
Males Females
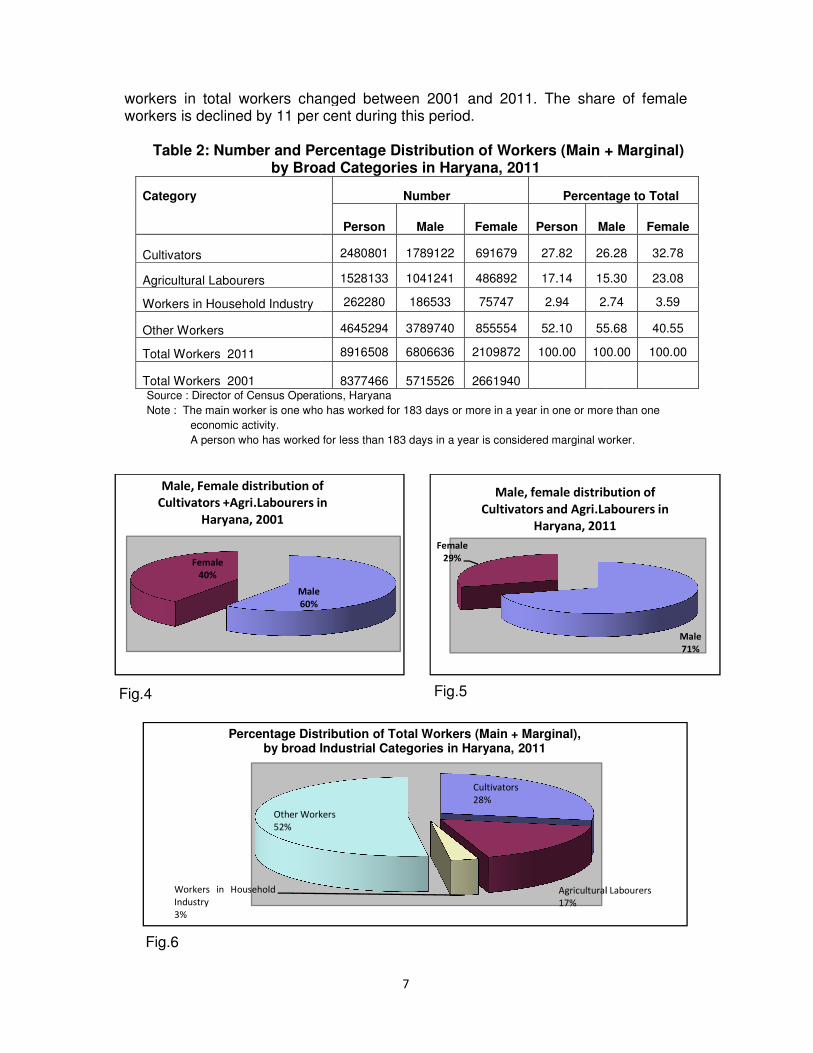
workers in total workers changed between 2001 and 2011. The share of female workers is declined by 11 per cent during this period.
Table 2: Number and Percentage Distribution of Workers by Broad Categories
Category
Cultivators
Agricultural Labourers
Workers in Household Industry
Other Workers
Total Workers 2011
Total Workers 2001 Source : Director of Census Operations, Haryana
Note : The main worker is one who has worked for 183 days or more in a year in one or more than one
economic activity.
A person who has worked for less than
Fig.4
Fig.6
Male
60%
Female
40%
Male, Female distribution of
Cultivators +Agri.Labourers in
Haryana, 2001
Workers in Household
Industry
3%
Other Workers
52%
Percentage Distribution of Total Workers (Main + Marginal), by broad Industrial Categories in Haryana, 2011
7
workers in total workers changed between 2001 and 2011. The share of female declined by 11 per cent during this period.
Table 2: Number and Percentage Distribution of Workers (Main + Marginal)
by Broad Categories in Haryana, 2011
Number Percentage to Total
Person Male Female Person Male
2480801 1789122 691679 27.82 26.28
1528133 1041241 486892 17.14 15.30
262280 186533 75747 2.94 2.74
4645294 3789740 855554 52.10 55.68
8916508 6806636 2109872 100.00 100.00
8377466 5715526 2661940 Source : Director of Census Operations, Haryana
Note : The main worker is one who has worked for 183 days or more in a year in one or more than one
A person who has worked for less than 183 days in a year is considered marginal worker.
Fig.5
Male, Female distribution of
Cultivators +Agri.Labourers in
Female
29%
Male, female distribution of
Cultivators and Agri.Labourers in
Haryana, 2011
Cultivators
28%
Agricultural
17%
Workers
Percentage Distribution of Total Workers (Main + Marginal), by broad Industrial Categories in Haryana, 2011
workers in total workers changed between 2001 and 2011. The share of female
(Main + Marginal)
Percentage to Total
Male Female
26.28 32.78
15.30 23.08
2.74 3.59
55.68 40.55
100.00 100.00
Note : The main worker is one who has worked for 183 days or more in a year in one or more than one
a year is considered marginal worker.
Male
71%
Male, female distribution of
Cultivators and Agri.Labourers in
Haryana, 2011
Agricultural Labourers
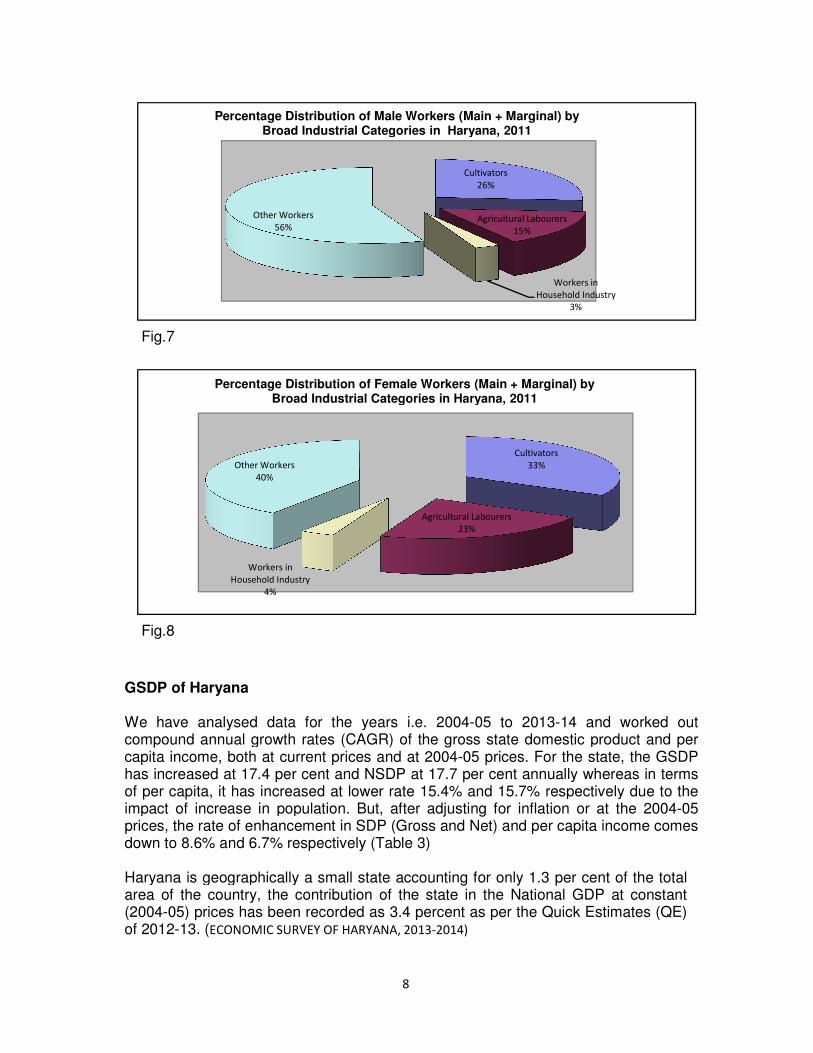
Fig.7
Fig.8
GSDP of Haryana We have analysed data for the years compound annual growth rates capita income, both at current prices and has increased at 17.4 per centof per capita, it has increased at lower rate 15.4% and 15.7% impact of increase in population. Butprices, the rate of enhancemendown to 8.6% and 6.7% respectively
Haryana is geographically a small area of the country, the contribution of the (2004-05) prices has been recorded as 3.4 percent as per the Quick Estimates (QE) of 2012-13. (ECONOMIC SURVEY OF HARYANA
Other Workers
56%
Percentage Distribution of Male Workers (Main + Marginal) by Broad Industrial Categories in Haryana, 2011
Workers in
Household Industry
4%
Other Workers
40%
Percentage Distribution of Female Workers (Main + Marginal) by Broad Industrial Categories in Haryana, 2011
8
ata for the years i.e. 2004-05 to 2013-14 and workedgrowth rates (CAGR) of the gross state domestic product
both at current prices and at 2004-05 prices. For the stateper cent and NSDP at 17.7 per cent annually whereas in terms
increased at lower rate 15.4% and 15.7% respectively impact of increase in population. But, after adjusting for inflation or at the 2004prices, the rate of enhancement in SDP (Gross and Net) and per capita income
respectively (Table 3)
Haryana is geographically a small state accounting for only 1.3 per cent of the total area of the country, the contribution of the state in the National GDP
05) prices has been recorded as 3.4 percent as per the Quick Estimates (QE) ECONOMIC SURVEY OF HARYANA, 2013-2014)
Cultivators
26%
Agricultural Labourers
15%
Workers in
Household Industry
3%
Percentage Distribution of Male Workers (Main + Marginal) by Broad Industrial Categories in Haryana, 2011
Cultivators
33%
Agricultural Labourers
23%
Percentage Distribution of Female Workers (Main + Marginal) by Broad Industrial Categories in Haryana, 2011
and worked out domestic product and per
05 prices. For the state, the GSDP annually whereas in terms
respectively due to the inflation or at the 2004-05
and per capita income comes
cent of the total tate in the National GDP at constant
05) prices has been recorded as 3.4 percent as per the Quick Estimates (QE)
Household Industry
9
Table 3: Gross and Net State Domestic Product at Factor Cost at Current and
Constant Prices (2004-05) in Haryana Rs. Crore
Item 2004-
05 2005-
06 2006-
07 2007-
08 2008-
09 2009-
10 2010-
11 2011-
12 2012-
13 2013-
14 CAGR
1.At Current prices
GSDP 95795 108885 128732 151596 182522 223600 260621 298786 339451 383911 0.174
NSDP 86222 97903 116104 136584 164636 203855 237163 273192 310990 350167 0.177
GSDP per capita
42187 47055 54619 63173 74728 89984 103135 116322 130063 144817 0.154
NSDP per capita 37972 42309 49261 56917 67405 82037 93852 106358 119158 132089 0.157
2. At 2004-05 Prices
GSDP 95795 104608 116344 126171 136478 152474 163770 176918 186738 198858 0.086
NSDP 86222 94011 104700 112896 121588 136780 146053 158524 167389 178458 0.086
GSDP per capita 42187 45206 49363 52578 55876 61360 64808 68877 71550 75013 0.068
NSDP per capita 37972 40627 44423 47046 49780 55044 57797 61716 64136 67317 0.067
Source : Ministry of Statistics and Programme Implementation, GOI
Fig.9
The statement that Haryana is a fast growing economy is supported by the sectoral GSDP at current prices in Table 4. During the past 5 year, income from agriculture and allied activities grew at 12.7 per cent per year, secondary sector by 13.1 per cent, tertiary sector by about 19 per cent and the economy as a whole by around 16 per cent per annum. In fact, growth of mining and quarrying declined by about 25% due to environmental issues and judicial interventions, almost all other sectors of the economy grew at a commandable rate.
100
150
200
250
300
350
400
450
2004-05 2005-06 2006-07 2007-08 2008-09 2009-10 2010-11 2011-12 2012-13 2013-14
Ind
ex
(2
00
4-0
5=
10
0)
Index of Gross State Domestic Product (GSDP) at Factor cost at
Current and Constant Prices (2004-05) in Haryana
GSDP at Current Prices Per Capita GSDP at Current Prices
GSDP at Constant Prices 2004-05 Per Capita GSDP at Constant Prices 2004-05
10
Table 4: Gross State Domestic Product of Haryana ( Rs. Crore at current Prices)
Sector 2008-09 2009-10 2010-11 2011-12 2012-13 2013-14 CAGR
1.Agriculture 40137 44446 51655 59168 62599 72297 0.124
2.Forestry & logging 2186 2688 3048 3180 3757 4227 0.132
3.Fishing 309 357 676 859 1003 1045 0.309
Agri. & Allied 42632 47490 55380 63206 67360 77569 0.127
4.Mining & quarrying 399 213 88 100 86 86 -0.254
Sub-Total : Primary 43031 47703 55468 63306 67446 77655 0.125
5.Manufacturing 33480 42753 48787 52128 57019 60119 0.116
5.1 Registered 23781 32044 36649 38960 42270 44576 0.122
5.2 Unregistered 9700 10709 12138 13168 14749 15543 0.102
6.Construction 16510 20401 21981 27255 31501 35685 0.166
7.Electricity,gas and Water supply 3181 3346 4058 2750 4534 5166 0.088
Sub-Total : Secondary 53171 66713 74914 82233 93140 101056 0.131
8.Transport, storage & Communication
15152 18850 21434 24896 29523 34606 0.174
8.1 Railways 2240 2666 2257 2807 3199 3660 0.096
8.2 Transport by other means 11152 14109 17174 19782 23610 27779 0.195
8.3 Storage 147 123 161 200 258 302 0.188
8.4 Communication 1612 1952 1841 2108 2456 2866 0.112
9.Trade,hotels and restaurants 33177 41674 52579 62435 70798 77888 0.188
10.Banking & Insurance 5776 6627 8952 10953 12657 15432 0.223
11.Real estate,ownership of dwellings and business services
17344 21777 23764 28616 34270 40476 0.180
12.Public administration 4506 5625 6503 6886 7890 8844 0.135
13.Other services 10364 14843 17095 19560 23813 28041 0.205
Sub-Total : Tertiary 86319 109397 130327 153347 178951 205286 0.186
14. Gross State domestic product 182522 223600 260621 298786 339451 383911 0.157
Source : Ministry of Statistics and Programme Implementation, GOI
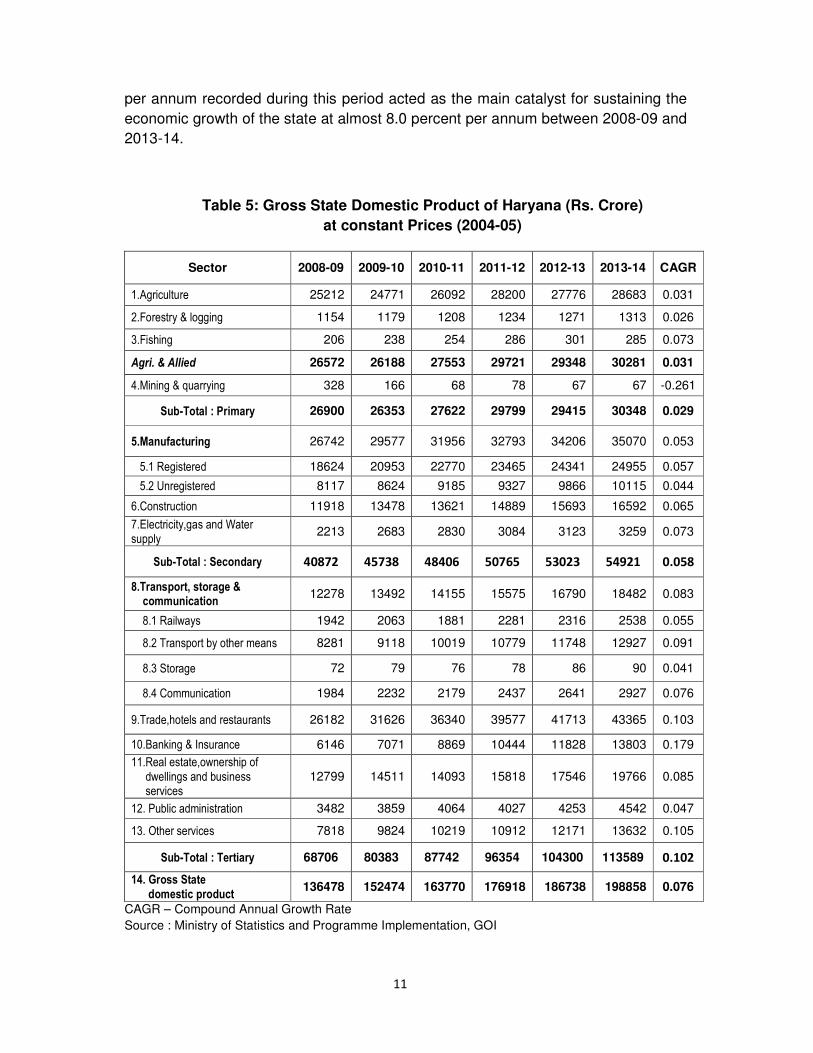
The growth story remains almost the same at constant prices as well as at current
prices. The growth in mining and quarrying turns out negative in both cases. The
growth during this period was 2.9, 5.8 and 10.2 respectively for primary, secondary
and tertiary sectors. However, the overall growth for the economy turned out as 7.6
per cent per annum due to appreciable contribution by the tertiary sector. During the
period of years from 2008-09 to 2013-14, the state economy registered a growth rate
of 7.6 per cent per annum in spite of the low growth posted in agriculture & allied
activities (3.1 percent). The service sector with a robust growth rate of 10.2 per cent
11
per annum recorded during this period acted as the main catalyst for sustaining the
economic growth of the state at almost 8.0 percent per annum between 2008-09 and
2013-14.
Table 5: Gross State Domestic Product of Haryana (Rs. Crore)
at constant Prices (2004-05)
Sector 2008-09 2009-10 2010-11 2011-12 2012-13 2013-14 CAGR
1.Agriculture 25212 24771 26092 28200 27776 28683 0.031
2.Forestry & logging 1154 1179 1208 1234 1271 1313 0.026
3.Fishing 206 238 254 286 301 285 0.073
Agri. & Allied 26572 26188 27553 29721 29348 30281 0.031
4.Mining & quarrying 328 166 68 78 67 67 -0.261
Sub-Total : Primary 26900 26353 27622 29799 29415 30348 0.029
5.Manufacturing 26742 29577 31956 32793 34206 35070 0.053
5.1 Registered 18624 20953 22770 23465 24341 24955 0.057
5.2 Unregistered 8117 8624 9185 9327 9866 10115 0.044
6.Construction 11918 13478 13621 14889 15693 16592 0.065
7.Electricity,gas and Water supply
2213 2683 2830 3084 3123 3259 0.073
Sub-Total : Secondary 40872 45738 48406 50765 53023 54921 0.058
8.Transport, storage & communication
12278 13492 14155 15575 16790 18482 0.083
8.1 Railways 1942 2063 1881 2281 2316 2538 0.055
8.2 Transport by other means 8281 9118 10019 10779 11748 12927 0.091
8.3 Storage 72 79 76 78 86 90 0.041
8.4 Communication 1984 2232 2179 2437 2641 2927 0.076
9.Trade,hotels and restaurants 26182 31626 36340 39577 41713 43365 0.103
10.Banking & Insurance 6146 7071 8869 10444 11828 13803 0.179
11.Real estate,ownership of dwellings and business services
12799 14511 14093 15818 17546 19766 0.085
12. Public administration 3482 3859 4064 4027 4253 4542 0.047
13. Other services 7818 9824 10219 10912 12171 13632 0.105
Sub-Total : Tertiary 68706 80383 87742 96354 104300 113589 0.102
14. Gross State domestic product
136478 152474 163770 176918 186738 198858 0.076
CAGR – Compound Annual Growth Rate
Source : Ministry of Statistics and Programme Implementation, GOI
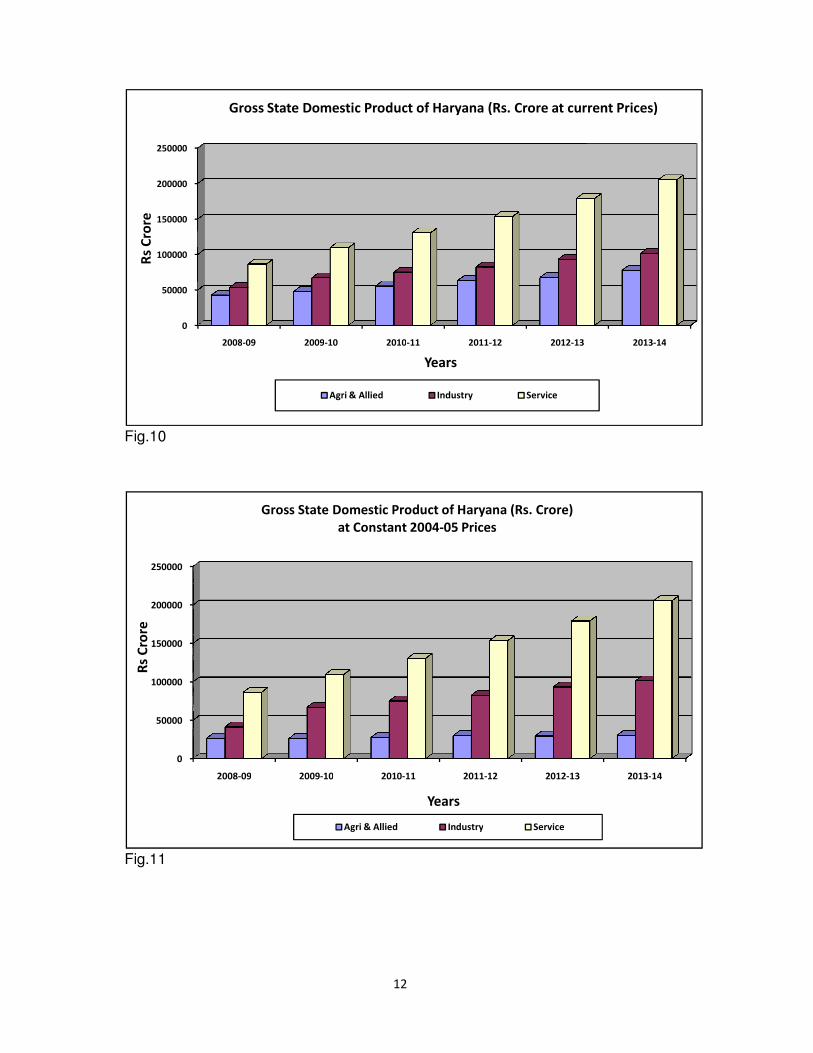
Fig.10
Fig.11
0
50000
100000
150000
200000
250000
2008-09 2009
Rs
Cro
re
Gross State Domestic Product of Haryana (Rs. Crore at current Prices)
0
50000
100000
150000
200000
250000
2008-09 2009-
Rs
Cro
re
Gross State Domestic Product of Haryana (Rs. Crore)
12
2009-10 2010-11 2011-12 2012-13
Years
Gross State Domestic Product of Haryana (Rs. Crore at current Prices)
Agri & Allied Industry Service
-10 2010-11 2011-12 2012-13
Years
Gross State Domestic Product of Haryana (Rs. Crore)
at Constant 2004-05 Prices
Agri & Allied Industry Service
2013-14
Gross State Domestic Product of Haryana (Rs. Crore at current Prices)
2013-14
13
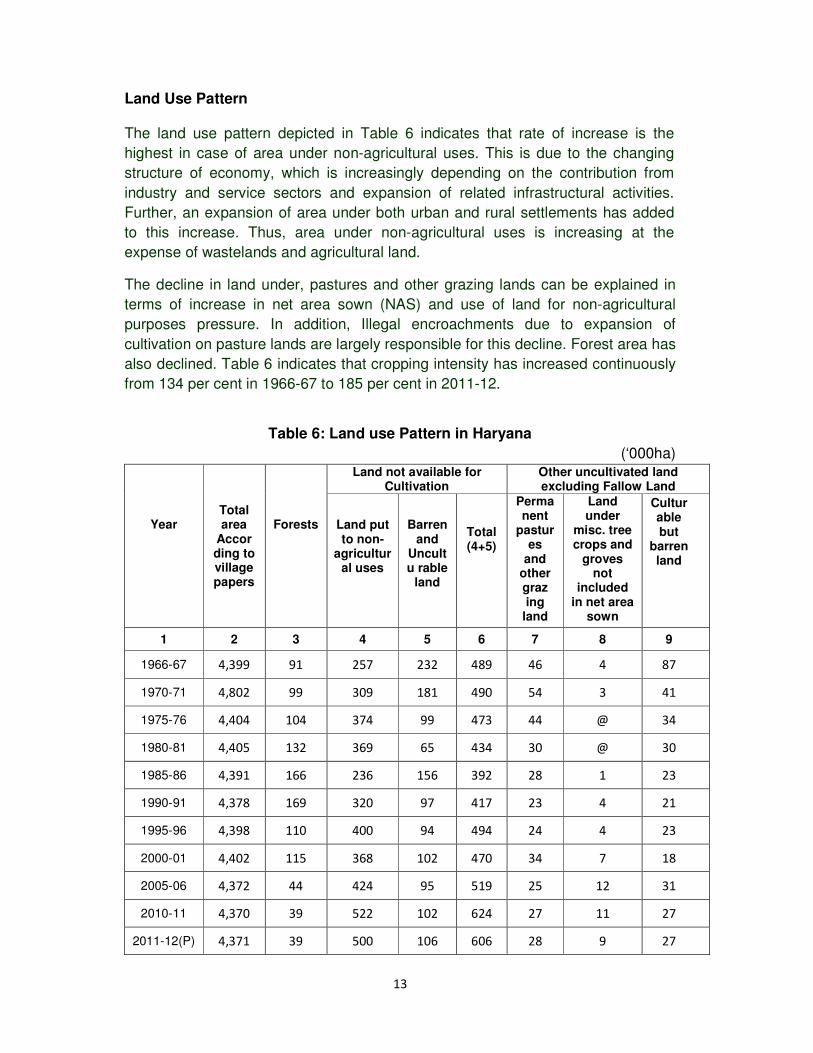
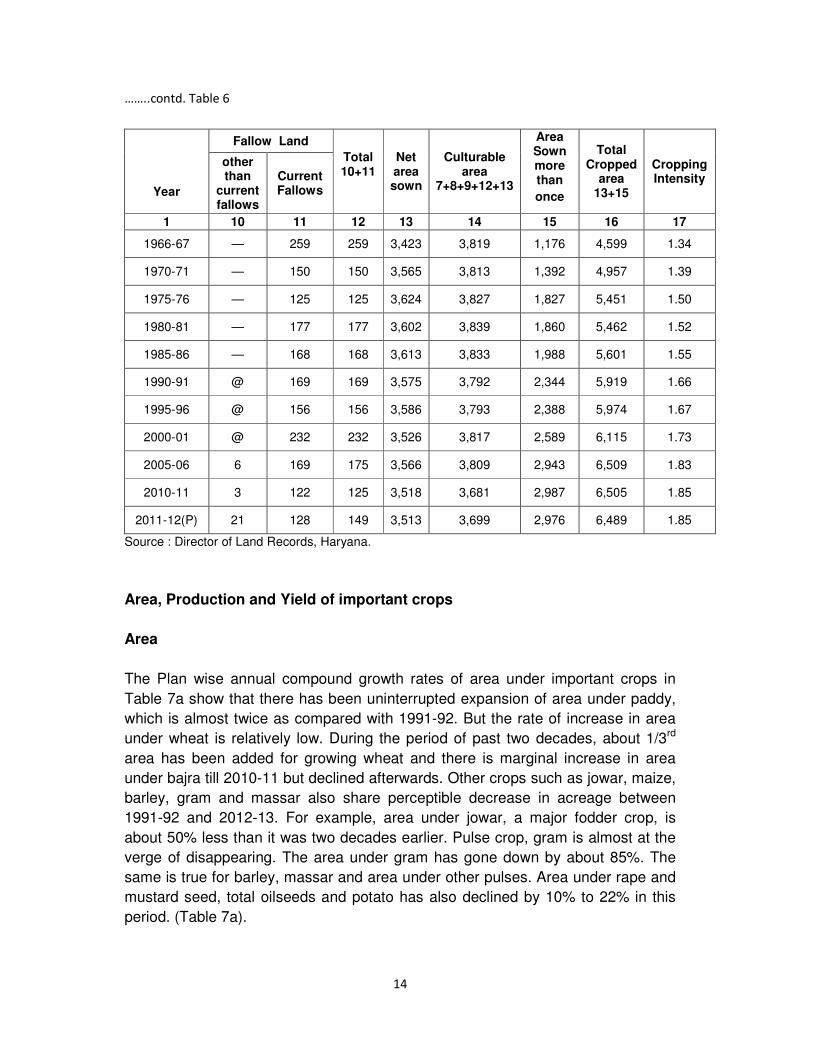
Land Use Pattern The land use pattern depicted in Table 6 indicates that rate of increase is the
highest in case of area under non-agricultural uses. This is due to the changing
structure of economy, which is increasingly depending on the contribution from
industry and service sectors and expansion of related infrastructural activities.
Further, an expansion of area under both urban and rural settlements has added
to this increase. Thus, area under non-agricultural uses is increasing at the
expense of wastelands and agricultural land.
The decline in land under, pastures and other grazing lands can be explained in
terms of increase in net area sown (NAS) and use of land for non-agricultural
purposes pressure. In addition, Illegal encroachments due to expansion of
cultivation on pasture lands are largely responsible for this decline. Forest area has
also declined. Table 6 indicates that cropping intensity has increased continuously
from 134 per cent in 1966-67 to 185 per cent in 2011-12.
Table 6: Land use Pattern in Haryana
(‘000ha)
Year
Total area
Accor ding to village papers
Forests
Land not available for Cultivation
Other uncultivated land excluding Fallow Land
Land put to non-
agricultural uses
Barren and
Uncultu rable
land
Total (4+5)
Permanent
pastures
and other graz ing
land
Land under
misc. tree crops and
groves not
included in net area
sown
Cultur able but
barren land
1 2 3 4 5 6 7 8 9
1966-67 4,399 91 257 232 489 46 4 87
1970-71 4,802 99 309 181 490 54 3 41
1975-76 4,404 104 374 99 473 44 @ 34
1980-81 4,405 132 369 65 434 30 @ 30
1985-86 4,391 166 236 156 392 28 1 23
1990-91 4,378 169 320 97 417 23 4 21
1995-96 4,398 110 400 94 494 24 4 23
2000-01 4,402 115 368 102 470 34 7 18
2005-06 4,372 44 424 95 519 25 12 31
2010-11 4,370 39 522 102 624 27 11 27
2011-12(P) 4,371 39 500 106 606 28 9 27
14
……..contd. Table 6
Year
Fallow Land
Total 10+11
Net area sown
Culturable area
7+8+9+12+13
Area Sown more than
once
Total Cropped
area 13+15
Cropping Intensity
other than
current fallows
Current Fallows
1 10 11 12 13 14 15 16 17
1966-67 — 259 259 3,423 3,819 1,176 4,599 1.34
1970-71 — 150 150 3,565 3,813 1,392 4,957 1.39
1975-76 — 125 125 3,624 3,827 1,827 5,451 1.50
1980-81 — 177 177 3,602 3,839 1,860 5,462 1.52
1985-86 — 168 168 3,613 3,833 1,988 5,601 1.55
1990-91 @ 169 169 3,575 3,792 2,344 5,919 1.66
1995-96 @ 156 156 3,586 3,793 2,388 5,974 1.67
2000-01 @ 232 232 3,526 3,817 2,589 6,115 1.73
2005-06 6 169 175 3,566 3,809 2,943 6,509 1.83
2010-11 3 122 125 3,518 3,681 2,987 6,505 1.85
2011-12(P) 21 128 149 3,513 3,699 2,976 6,489 1.85
Source : Director of Land Records, Haryana.
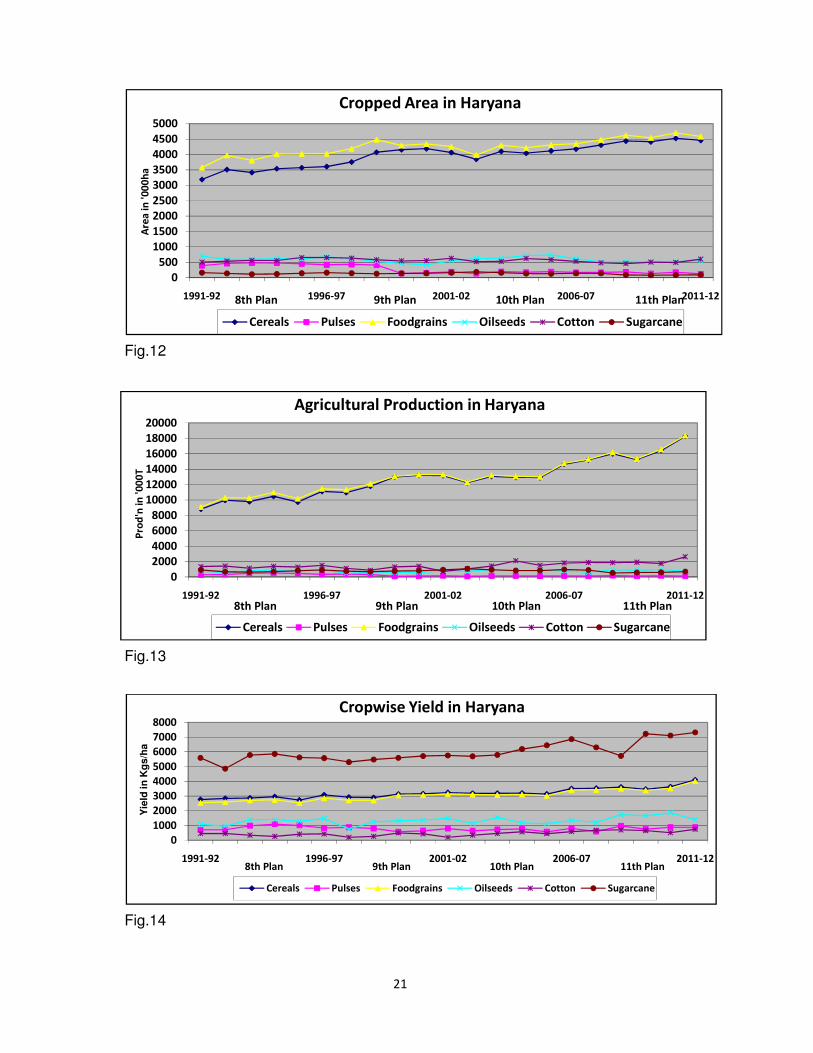
Area, Production and Yield of important crops
Area
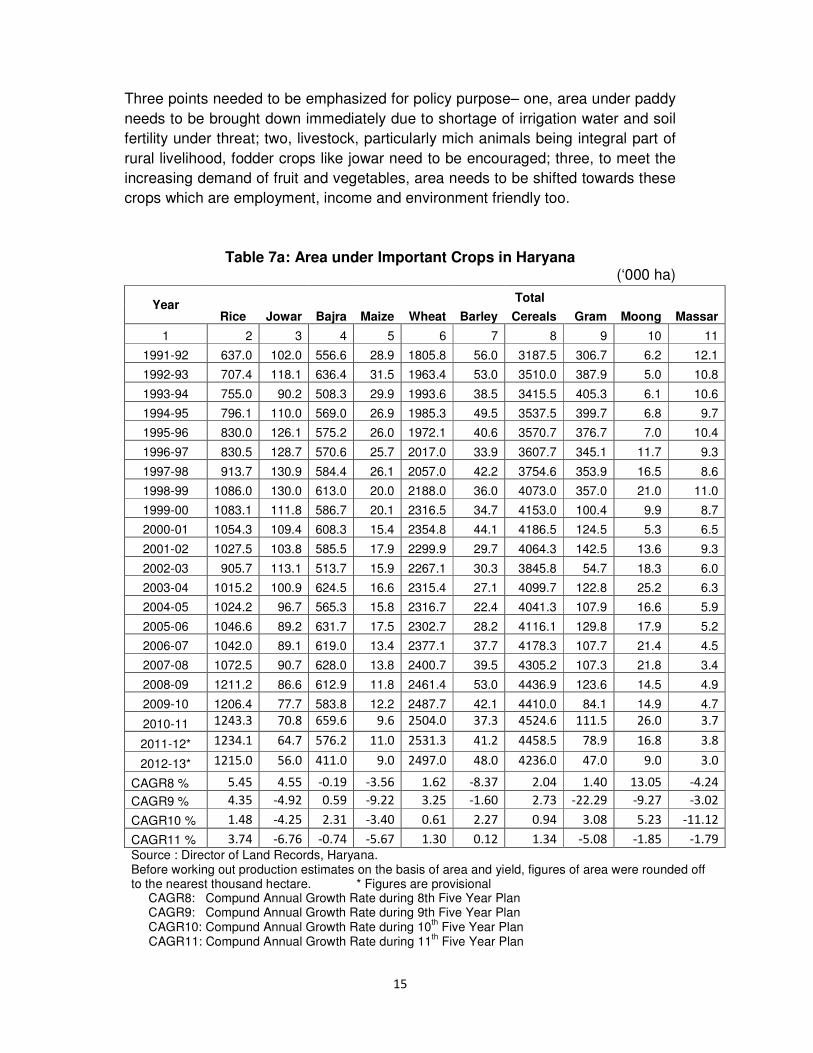
The Plan wise annual compound growth rates of area under important crops in
Table 7a show that there has been uninterrupted expansion of area under paddy,
which is almost twice as compared with 1991-92. But the rate of increase in area
under wheat is relatively low. During the period of past two decades, about 1/3rd
area has been added for growing wheat and there is marginal increase in area
under bajra till 2010-11 but declined afterwards. Other crops such as jowar, maize,
barley, gram and massar also share perceptible decrease in acreage between
1991-92 and 2012-13. For example, area under jowar, a major fodder crop, is
about 50% less than it was two decades earlier. Pulse crop, gram is almost at the
verge of disappearing. The area under gram has gone down by about 85%. The
same is true for barley, massar and area under other pulses. Area under rape and
mustard seed, total oilseeds and potato has also declined by 10% to 22% in this
period. (Table 7a).
15
Three points needed to be emphasized for policy purpose– one, area under paddy
needs to be brought down immediately due to shortage of irrigation water and soil
fertility under threat; two, livestock, particularly mich animals being integral part of
rural livelihood, fodder crops like jowar need to be encouraged; three, to meet the
increasing demand of fruit and vegetables, area needs to be shifted towards these
crops which are employment, income and environment friendly too.
Table 7a: Area under Important Crops in Haryana (‘000 ha)
Year
Total
Rice Jowar Bajra Maize Wheat Barley Cereals Gram Moong Massar
1 2 3 4 5 6 7 8 9 10 11
1991-92 637.0 102.0 556.6 28.9 1805.8 56.0 3187.5 306.7 6.2 12.1
1992-93 707.4 118.1 636.4 31.5 1963.4 53.0 3510.0 387.9 5.0 10.8
1993-94 755.0 90.2 508.3 29.9 1993.6 38.5 3415.5 405.3 6.1 10.6
1994-95 796.1 110.0 569.0 26.9 1985.3 49.5 3537.5 399.7 6.8 9.7
1995-96 830.0 126.1 575.2 26.0 1972.1 40.6 3570.7 376.7 7.0 10.4
1996-97 830.5 128.7 570.6 25.7 2017.0 33.9 3607.7 345.1 11.7 9.3
1997-98 913.7 130.9 584.4 26.1 2057.0 42.2 3754.6 353.9 16.5 8.6
1998-99 1086.0 130.0 613.0 20.0 2188.0 36.0 4073.0 357.0 21.0 11.0
1999-00 1083.1 111.8 586.7 20.1 2316.5 34.7 4153.0 100.4 9.9 8.7
2000-01 1054.3 109.4 608.3 15.4 2354.8 44.1 4186.5 124.5 5.3 6.5
2001-02 1027.5 103.8 585.5 17.9 2299.9 29.7 4064.3 142.5 13.6 9.3
2002-03 905.7 113.1 513.7 15.9 2267.1 30.3 3845.8 54.7 18.3 6.0
2003-04 1015.2 100.9 624.5 16.6 2315.4 27.1 4099.7 122.8 25.2 6.3
2004-05 1024.2 96.7 565.3 15.8 2316.7 22.4 4041.3 107.9 16.6 5.9
2005-06 1046.6 89.2 631.7 17.5 2302.7 28.2 4116.1 129.8 17.9 5.2
2006-07 1042.0 89.1 619.0 13.4 2377.1 37.7 4178.3 107.7 21.4 4.5
2007-08 1072.5 90.7 628.0 13.8 2400.7 39.5 4305.2 107.3 21.8 3.4
2008-09 1211.2 86.6 612.9 11.8 2461.4 53.0 4436.9 123.6 14.5 4.9
2009-10 1206.4 77.7 583.8 12.2 2487.7 42.1 4410.0 84.1 14.9 4.7
2010-11 1243.3 70.8 659.6 9.6 2504.0 37.3 4524.6 111.5 26.0 3.7
2011-12* 1234.1 64.7 576.2 11.0 2531.3 41.2 4458.5 78.9 16.8 3.8
2012-13* 1215.0 56.0 411.0 9.0 2497.0 48.0 4236.0 47.0 9.0 3.0
CAGR8 % 5.45 4.55 -0.19 -3.56 1.62 -8.37 2.04 1.40 13.05 -4.24
CAGR9 % 4.35 -4.92 0.59 -9.22 3.25 -1.60 2.73 -22.29 -9.27 -3.02
CAGR10 % 1.48 -4.25 2.31 -3.40 0.61 2.27 0.94 3.08 5.23 -11.12
CAGR11 % 3.74 -6.76 -0.74 -5.67 1.30 0.12 1.34 -5.08 -1.85 -1.79
Source : Director of Land Records, Haryana. Before working out production estimates on the basis of area and yield, figures of area were rounded off to the nearest thousand hectare. * Figures are provisional CAGR8: Compund Annual Growth Rate during 8th Five Year Plan CAGR9: Compund Annual Growth Rate during 9th Five Year Plan CAGR10: Compund Annual Growth Rate during 10
th Five Year Plan
CAGR11: Compund Annual Growth Rate during 11th Five Year Plan
16
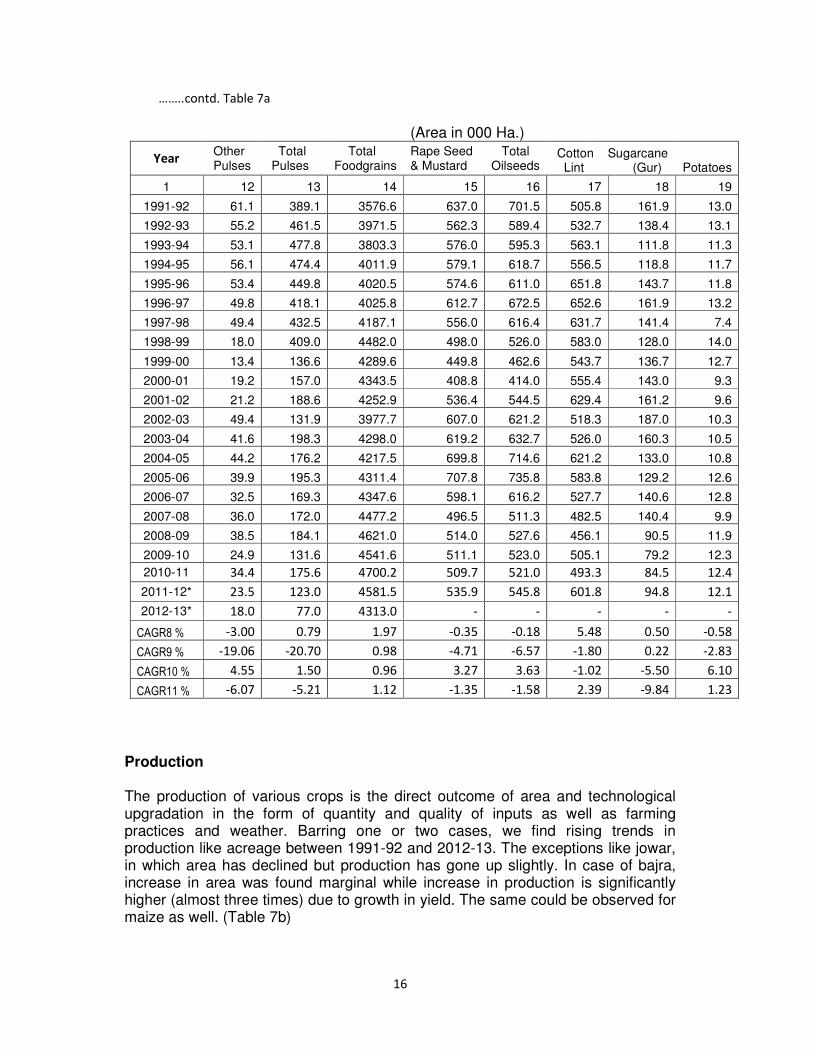
……..contd. Table 7a
(Area in 000 Ha.)
Year Other Pulses
Total Pulses
Total Foodgrains
Rape Seed & Mustard
Total Oilseeds
Cotton Sugarcane Lint (Gur) Potatoes
1 12 13 14 15 16 17 18 19
1991-92 61.1 389.1 3576.6 637.0 701.5 505.8 161.9 13.0
1992-93 55.2 461.5 3971.5 562.3 589.4 532.7 138.4 13.1
1993-94 53.1 477.8 3803.3 576.0 595.3 563.1 111.8 11.3
1994-95 56.1 474.4 4011.9 579.1 618.7 556.5 118.8 11.7
1995-96 53.4 449.8 4020.5 574.6 611.0 651.8 143.7 11.8
1996-97 49.8 418.1 4025.8 612.7 672.5 652.6 161.9 13.2
1997-98 49.4 432.5 4187.1 556.0 616.4 631.7 141.4 7.4
1998-99 18.0 409.0 4482.0 498.0 526.0 583.0 128.0 14.0
1999-00 13.4 136.6 4289.6 449.8 462.6 543.7 136.7 12.7
2000-01 19.2 157.0 4343.5 408.8 414.0 555.4 143.0 9.3
2001-02 21.2 188.6 4252.9 536.4 544.5 629.4 161.2 9.6
2002-03 49.4 131.9 3977.7 607.0 621.2 518.3 187.0 10.3
2003-04 41.6 198.3 4298.0 619.2 632.7 526.0 160.3 10.5
2004-05 44.2 176.2 4217.5 699.8 714.6 621.2 133.0 10.8
2005-06 39.9 195.3 4311.4 707.8 735.8 583.8 129.2 12.6
2006-07 32.5 169.3 4347.6 598.1 616.2 527.7 140.6 12.8
2007-08 36.0 172.0 4477.2 496.5 511.3 482.5 140.4 9.9
2008-09 38.5 184.1 4621.0 514.0 527.6 456.1 90.5 11.9
2009-10 24.9 131.6 4541.6 511.1 523.0 505.1 79.2 12.3
2010-11 34.4 175.6 4700.2 509.7 521.0 493.3 84.5 12.4
2011-12* 23.5 123.0 4581.5 535.9 545.8 601.8 94.8 12.1
2012-13* 18.0 77.0 4313.0 - - - - -
CAGR8 % -3.00 0.79 1.97 -0.35 -0.18 5.48 0.50 -0.58
CAGR9 % -19.06 -20.70 0.98 -4.71 -6.57 -1.80 0.22 -2.83
CAGR10 % 4.55 1.50 0.96 3.27 3.63 -1.02 -5.50 6.10
CAGR11 % -6.07 -5.21 1.12 -1.35 -1.58 2.39 -9.84 1.23
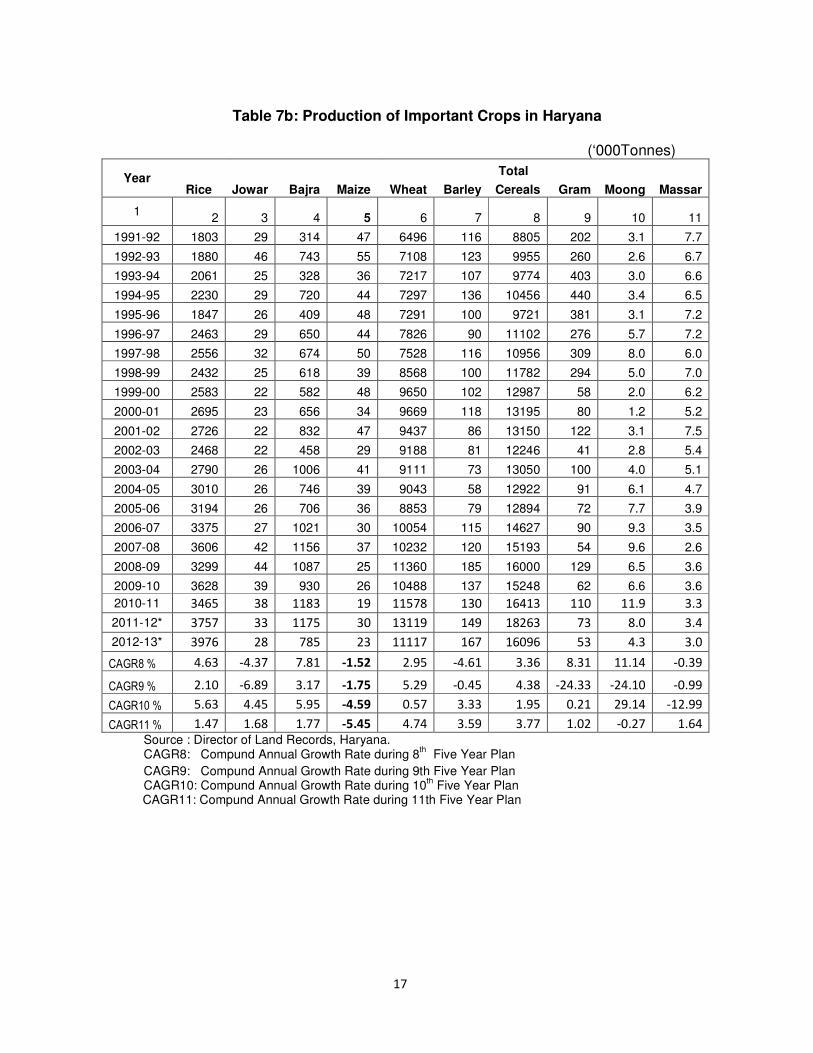
Production The production of various crops is the direct outcome of area and technological upgradation in the form of quantity and quality of inputs as well as farming practices and weather. Barring one or two cases, we find rising trends in production like acreage between 1991-92 and 2012-13. The exceptions like jowar, in which area has declined but production has gone up slightly. In case of bajra, increase in area was found marginal while increase in production is significantly higher (almost three times) due to growth in yield. The same could be observed for maize as well. (Table 7b)
17
Table 7b: Production of Important Crops in Haryana
(‘000Tonnes)
Year
Total
Rice Jowar Bajra Maize Wheat Barley Cereals Gram Moong Massar
1 2 3 4 5 6 7 8 9 10 11
1991-92 1803 29 314 47 6496 116 8805 202 3.1 7.7
1992-93 1880 46 743 55 7108 123 9955 260 2.6 6.7
1993-94 2061 25 328 36 7217 107 9774 403 3.0 6.6
1994-95 2230 29 720 44 7297 136 10456 440 3.4 6.5
1995-96 1847 26 409 48 7291 100 9721 381 3.1 7.2
1996-97 2463 29 650 44 7826 90 11102 276 5.7 7.2
1997-98 2556 32 674 50 7528 116 10956 309 8.0 6.0
1998-99 2432 25 618 39 8568 100 11782 294 5.0 7.0
1999-00 2583 22 582 48 9650 102 12987 58 2.0 6.2
2000-01 2695 23 656 34 9669 118 13195 80 1.2 5.2
2001-02 2726 22 832 47 9437 86 13150 122 3.1 7.5
2002-03 2468 22 458 29 9188 81 12246 41 2.8 5.4
2003-04 2790 26 1006 41 9111 73 13050 100 4.0 5.1
2004-05 3010 26 746 39 9043 58 12922 91 6.1 4.7
2005-06 3194 26 706 36 8853 79 12894 72 7.7 3.9
2006-07 3375 27 1021 30 10054 115 14627 90 9.3 3.5
2007-08 3606 42 1156 37 10232 120 15193 54 9.6 2.6
2008-09 3299 44 1087 25 11360 185 16000 129 6.5 3.6
2009-10 3628 39 930 26 10488 137 15248 62 6.6 3.6
2010-11 3465 38 1183 19 11578 130 16413 110 11.9 3.3
2011-12* 3757 33 1175 30 13119 149 18263 73 8.0 3.4
2012-13* 3976 28 785 23 11117 167 16096 53 4.3 3.0
CAGR8 % 4.63 -4.37 7.81 -1.52 2.95 -4.61 3.36 8.31 11.14 -0.39
CAGR9 % 2.10 -6.89 3.17 -1.75 5.29 -0.45 4.38 -24.33 -24.10 -0.99
CAGR10 % 5.63 4.45 5.95 -4.59 0.57 3.33 1.95 0.21 29.14 -12.99
CAGR11 % 1.47 1.68 1.77 -5.45 4.74 3.59 3.77 1.02 -0.27 1.64
Source : Director of Land Records, Haryana. CAGR8: Compund Annual Growth Rate during 8
th Five Year Plan
CAGR9: Compund Annual Growth Rate during 9th Five Year Plan CAGR10: Compund Annual Growth Rate during 10
th Five Year Plan
CAGR11: Compund Annual Growth Rate during 11th Five Year Plan
18
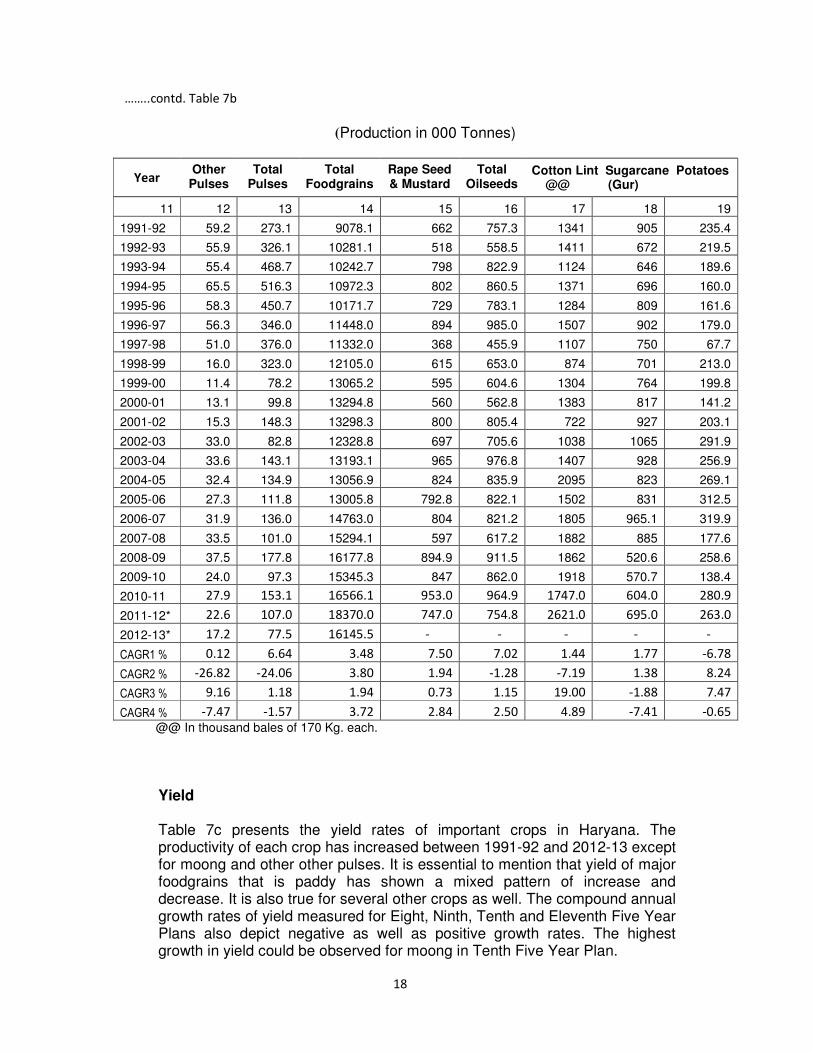
……..contd. Table 7b
(Production in 000 Tonnes)
Year Other
Pulses Total
Pulses Total
Foodgrains Rape Seed & Mustard
Total Oilseeds
Cotton Lint Sugarcane Potatoes @@ (Gur)
11 12 13 14 15 16 17 18 19
1991-92 59.2 273.1 9078.1 662 757.3 1341 905 235.4
1992-93 55.9 326.1 10281.1 518 558.5 1411 672 219.5
1993-94 55.4 468.7 10242.7 798 822.9 1124 646 189.6
1994-95 65.5 516.3 10972.3 802 860.5 1371 696 160.0
1995-96 58.3 450.7 10171.7 729 783.1 1284 809 161.6
1996-97 56.3 346.0 11448.0 894 985.0 1507 902 179.0
1997-98 51.0 376.0 11332.0 368 455.9 1107 750 67.7
1998-99 16.0 323.0 12105.0 615 653.0 874 701 213.0
1999-00 11.4 78.2 13065.2 595 604.6 1304 764 199.8
2000-01 13.1 99.8 13294.8 560 562.8 1383 817 141.2
2001-02 15.3 148.3 13298.3 800 805.4 722 927 203.1
2002-03 33.0 82.8 12328.8 697 705.6 1038 1065 291.9
2003-04 33.6 143.1 13193.1 965 976.8 1407 928 256.9
2004-05 32.4 134.9 13056.9 824 835.9 2095 823 269.1
2005-06 27.3 111.8 13005.8 792.8 822.1 1502 831 312.5
2006-07 31.9 136.0 14763.0 804 821.2 1805 965.1 319.9
2007-08 33.5 101.0 15294.1 597 617.2 1882 885 177.6
2008-09 37.5 177.8 16177.8 894.9 911.5 1862 520.6 258.6
2009-10 24.0 97.3 15345.3 847 862.0 1918 570.7 138.4
2010-11 27.9 153.1 16566.1 953.0 964.9 1747.0 604.0 280.9
2011-12* 22.6 107.0 18370.0 747.0 754.8 2621.0 695.0 263.0
2012-13* 17.2 77.5 16145.5 - - - - -
CAGR1 % 0.12 6.64 3.48 7.50 7.02 1.44 1.77 -6.78
CAGR2 % -26.82 -24.06 3.80 1.94 -1.28 -7.19 1.38 8.24
CAGR3 % 9.16 1.18 1.94 0.73 1.15 19.00 -1.88 7.47
CAGR4 % -7.47 -1.57 3.72 2.84 2.50 4.89 -7.41 -0.65
@@ In thousand bales of 170 Kg. each.
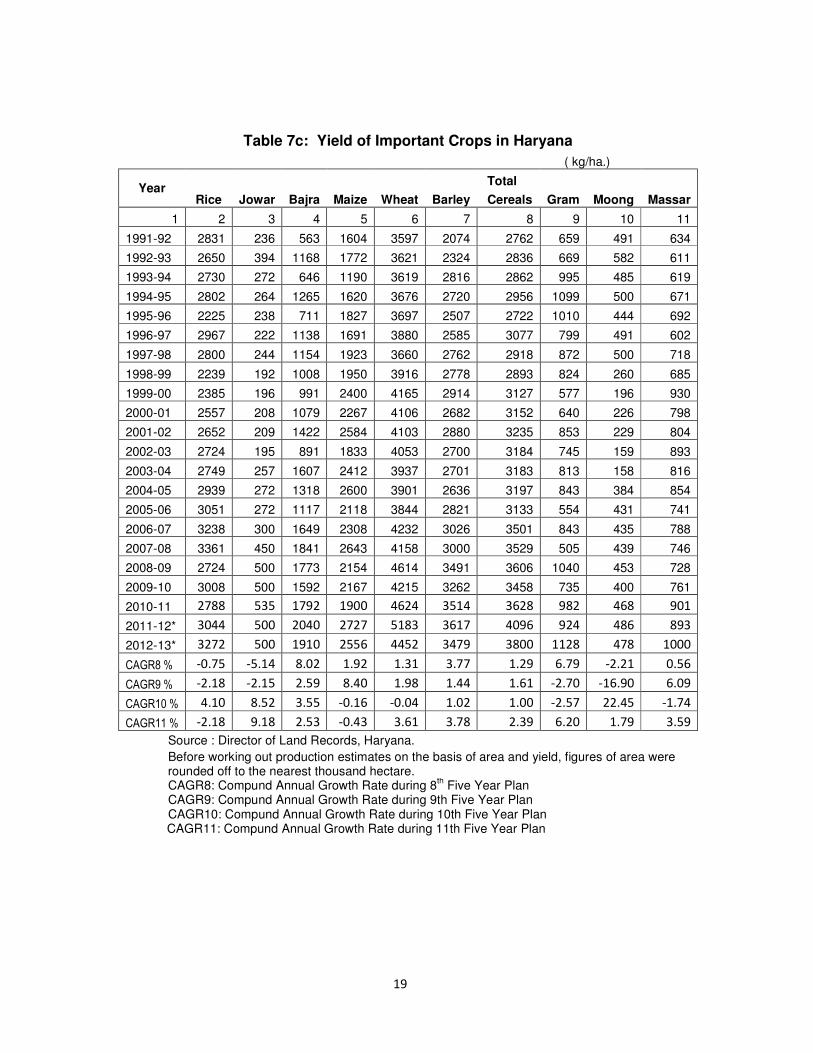
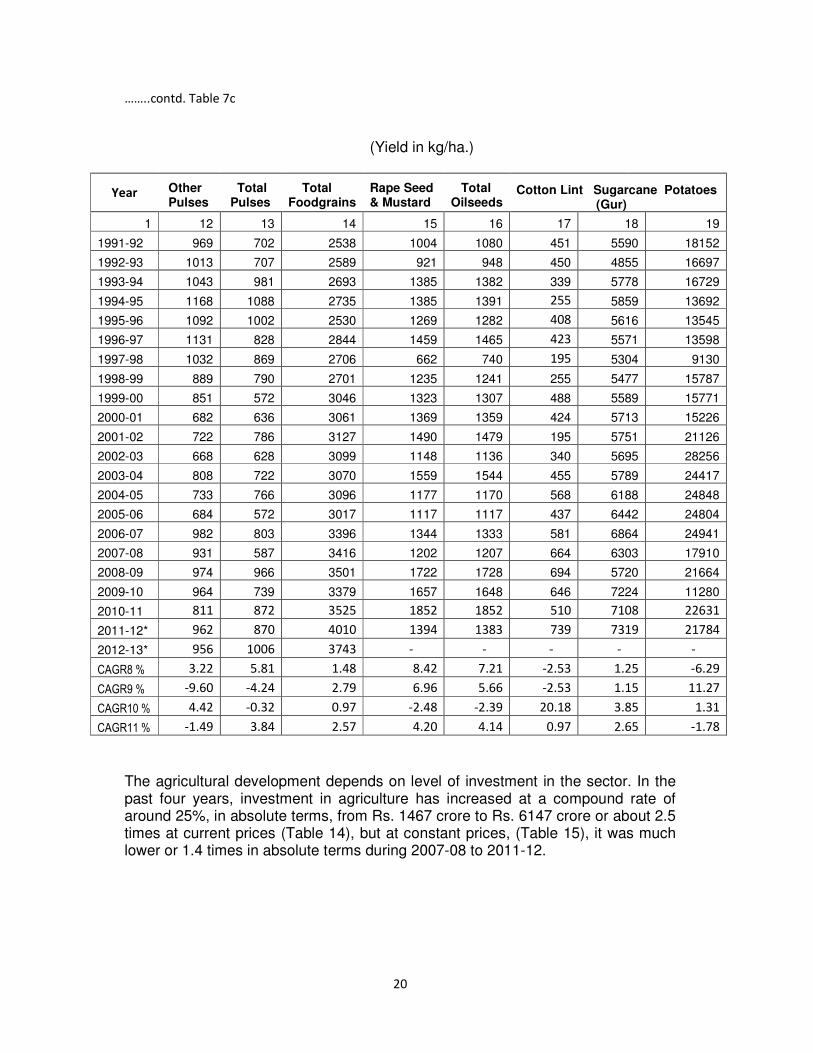
Yield Table 7c presents the yield rates of important crops in Haryana. The productivity of each crop has increased between 1991-92 and 2012-13 except for moong and other other pulses. It is essential to mention that yield of major foodgrains that is paddy has shown a mixed pattern of increase and decrease. It is also true for several other crops as well. The compound annual growth rates of yield measured for Eight, Ninth, Tenth and Eleventh Five Year Plans also depict negative as well as positive growth rates. The highest growth in yield could be observed for moong in Tenth Five Year Plan.
19
Table 7c: Yield of Important Crops in Haryana
( kg/ha.)
Year
Total
Rice Jowar Bajra Maize Wheat Barley Cereals Gram Moong Massar
1 2 3 4 5 6 7 8 9 10 11
1991-92 2831 236 563 1604 3597 2074 2762 659 491 634
1992-93 2650 394 1168 1772 3621 2324 2836 669 582 611
1993-94 2730 272 646 1190 3619 2816 2862 995 485 619
1994-95 2802 264 1265 1620 3676 2720 2956 1099 500 671
1995-96 2225 238 711 1827 3697 2507 2722 1010 444 692
1996-97 2967 222 1138 1691 3880 2585 3077 799 491 602
1997-98 2800 244 1154 1923 3660 2762 2918 872 500 718
1998-99 2239 192 1008 1950 3916 2778 2893 824 260 685
1999-00 2385 196 991 2400 4165 2914 3127 577 196 930
2000-01 2557 208 1079 2267 4106 2682 3152 640 226 798
2001-02 2652 209 1422 2584 4103 2880 3235 853 229 804
2002-03 2724 195 891 1833 4053 2700 3184 745 159 893
2003-04 2749 257 1607 2412 3937 2701 3183 813 158 816
2004-05 2939 272 1318 2600 3901 2636 3197 843 384 854
2005-06 3051 272 1117 2118 3844 2821 3133 554 431 741
2006-07 3238 300 1649 2308 4232 3026 3501 843 435 788
2007-08 3361 450 1841 2643 4158 3000 3529 505 439 746
2008-09 2724 500 1773 2154 4614 3491 3606 1040 453 728
2009-10 3008 500 1592 2167 4215 3262 3458 735 400 761
2010-11 2788 535 1792 1900 4624 3514 3628 982 468 901
2011-12* 3044 500 2040 2727 5183 3617 4096 924 486 893
2012-13* 3272 500 1910 2556 4452 3479 3800 1128 478 1000
CAGR8 % -0.75 -5.14 8.02 1.92 1.31 3.77 1.29 6.79 -2.21 0.56
CAGR9 % -2.18 -2.15 2.59 8.40 1.98 1.44 1.61 -2.70 -16.90 6.09
CAGR10 % 4.10 8.52 3.55 -0.16 -0.04 1.02 1.00 -2.57 22.45 -1.74
CAGR11 % -2.18 9.18 2.53 -0.43 3.61 3.78 2.39 6.20 1.79 3.59
Source : Director of Land Records, Haryana.
Before working out production estimates on the basis of area and yield, figures of area were rounded off to the nearest thousand hectare. CAGR8: Compund Annual Growth Rate during 8
th Five Year Plan
CAGR9: Compund Annual Growth Rate during 9th Five Year Plan CAGR10: Compund Annual Growth Rate during 10th Five Year Plan CAGR11: Compund Annual Growth Rate during 11th Five Year Plan
20
……..contd. Table 7c
(Yield in kg/ha.)
Year Other
Pulses Total Pulses
Total Foodgrains
Rape Seed & Mustard
Total Oilseeds
Cotton Lint Sugarcane Potatoes (Gur)
1 12 13 14 15 16 17 18 19
1991-92 969 702 2538 1004 1080 451 5590 18152
1992-93 1013 707 2589 921 948 450 4855 16697
1993-94 1043 981 2693 1385 1382 339 5778 16729
1994-95 1168 1088 2735 1385 1391 255 5859 13692
1995-96 1092 1002 2530 1269 1282 408 5616 13545
1996-97 1131 828 2844 1459 1465 423 5571 13598
1997-98 1032 869 2706 662 740 195 5304 9130
1998-99 889 790 2701 1235 1241 255 5477 15787
1999-00 851 572 3046 1323 1307 488 5589 15771
2000-01 682 636 3061 1369 1359 424 5713 15226
2001-02 722 786 3127 1490 1479 195 5751 21126
2002-03 668 628 3099 1148 1136 340 5695 28256
2003-04 808 722 3070 1559 1544 455 5789 24417
2004-05 733 766 3096 1177 1170 568 6188 24848
2005-06 684 572 3017 1117 1117 437 6442 24804
2006-07 982 803 3396 1344 1333 581 6864 24941
2007-08 931 587 3416 1202 1207 664 6303 17910
2008-09 974 966 3501 1722 1728 694 5720 21664
2009-10 964 739 3379 1657 1648 646 7224 11280
2010-11 811 872 3525 1852 1852 510 7108 22631
2011-12* 962 870 4010 1394 1383 739 7319 21784
2012-13* 956 1006 3743 - - - - -
CAGR8 % 3.22 5.81 1.48 8.42 7.21 -2.53 1.25 -6.29
CAGR9 % -9.60 -4.24 2.79 6.96 5.66 -2.53 1.15 11.27
CAGR10 % 4.42 -0.32 0.97 -2.48 -2.39 20.18 3.85 1.31
CAGR11 % -1.49 3.84 2.57 4.20 4.14 0.97 2.65 -1.78
The agricultural development depends on level of investment in the sector. In the past four years, investment in agriculture has increased at a compound rate of around 25%, in absolute terms, from Rs. 1467 crore to Rs. 6147 crore or about 2.5 times at current prices (Table 14), but at constant prices, (Table 15), it was much lower or 1.4 times in absolute terms during 2007-08 to 2011-12.
21
Fig.12
Fig.13
Fig.14
0
500
1000
1500
2000
2500
3000
3500
4000
4500
5000
1991-92 1996-97 2001-02 2006-07 2011-12
Are
a i
n '
00
0h
a
8th Plan 9th Plan 10th Plan 11th Plan
Cropped Area in Haryana
Cereals Pulses Foodgrains Oilseeds Cotton Sugarcane
0
2000
4000
6000
8000
10000
12000
14000
16000
18000
20000
1991-92 1996-97 2001-02 2006-07 2011-12
Pro
d'n
in
'0
00
T
8th Plan 9th Plan 10th Plan 11th Plan
Agricultural Production in Haryana
Cereals Pulses Foodgrains Oilseeds Cotton Sugarcane
0
1000
2000
3000
4000
5000
6000
7000
8000
1991-92 1996-97 2001-02 2006-07 2011-12
Yie
ld in
Kg
s/h
a
8th Plan 9th Plan 10th Plan 11th Plan
Cropwise Yield in Haryana
Cereals Pulses Foodgrains Oilseeds Cotton Sugarcane
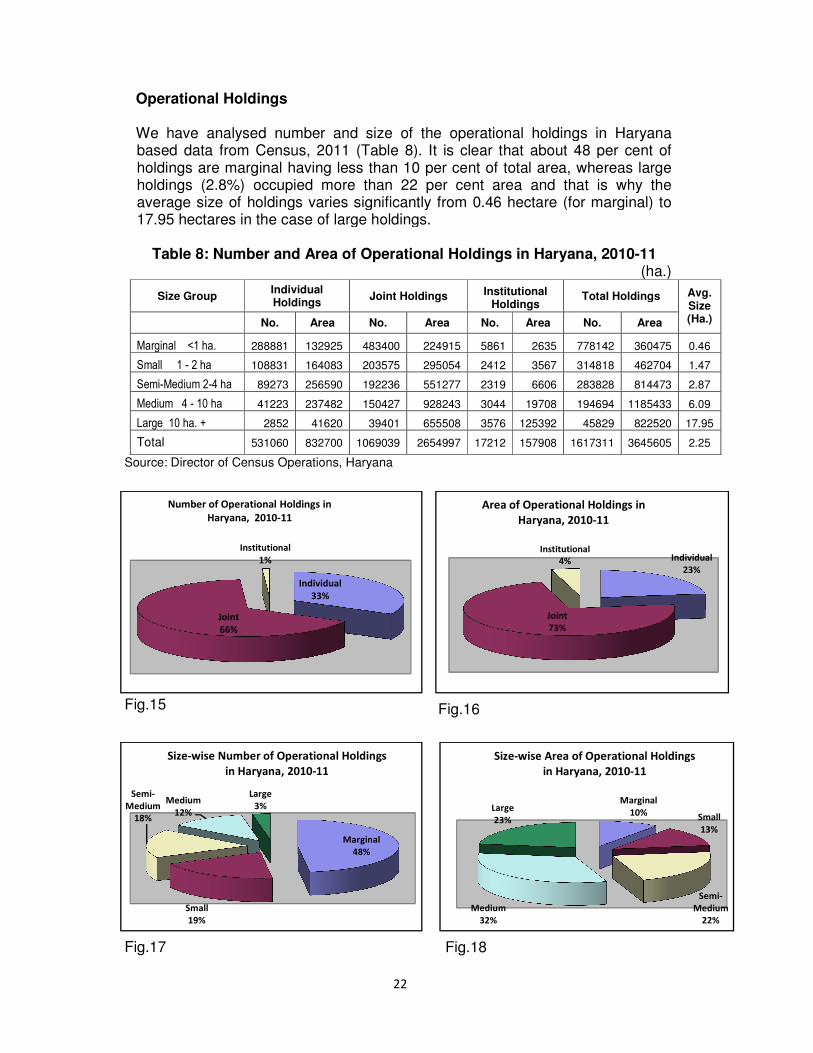
Operational Holdings We have analysed number and size of based data from Census, 20holdings are marginal having less than holdings (2.8%) occupied average size of holdings varies significantly 17.95 hectares in the case of large holdings.
Table 8: Number and Area of
Size Group Individual Holdings
No. Area
Marginal <1 ha. 288881 132925
Small 1 - 2 ha 108831 164083
Semi-Medium 2-4 ha 89273 256590
Medium 4 - 10 ha 41223 237482
Large 10 ha. + 2852 41620
Total 531060 832700
Source: Director of Census Operations, Haryana
Fig.15
Fig.17
Individual
33%
Joint
66%
Institutional
1%
Number of Operational Holdings in
Haryana, 2010-11
Small
19%
Semi-
Medium
18%
Medium
12%
Large
3%
Size-wise Number of Operational Holdings
in Haryana, 2010-11
22
umber and size of the operational holdings in 2011 (Table 8). It is clear that about 48 per cent
holdings are marginal having less than 10 per cent of total area, whereas large more than 22 per cent area and that is why the
of holdings varies significantly from 0.46 hectare (for marginal)case of large holdings.
: Number and Area of Operational Holdings in Haryana, 2010
Individual Holdings
Joint Holdings Institutional Holdings
Total Holdings
Area No. Area No. Area No.
132925 483400 224915 5861 2635 778142
164083 203575 295054 2412 3567 314818
256590 192236 551277 2319 6606 283828
237482 150427 928243 3044 19708 194694
41620 39401 655508 3576 125392 45829
832700 1069039 2654997 17212 157908 1617311
Director of Census Operations, Haryana
Fig.16
Fig.18
Individual
33%
Number of Operational Holdings in
Joint
73%
Institutional
4%
Area of Operational Holdings in
Haryana, 2010-11
Marginal
48%
wise Number of Operational Holdings
11
Medium
32%
Large
23%
Size-wise Area of Operational Holdings
in Haryana, 2010
holdings in Haryana per cent of
of total area, whereas large area and that is why the
(for marginal) to
2010-11 (ha.)
Total Holdings Avg. Size (Ha.) Area
778142 360475 0.46
314818 462704 1.47
283828 814473 2.87
194694 1185433 6.09
45829 822520 17.95
1617311 3645605 2.25
Individual
23%
Area of Operational Holdings in
11
Marginal
10% Small
13%
Semi-
Medium
22%
wise Area of Operational Holdings
in Haryana, 2010-11
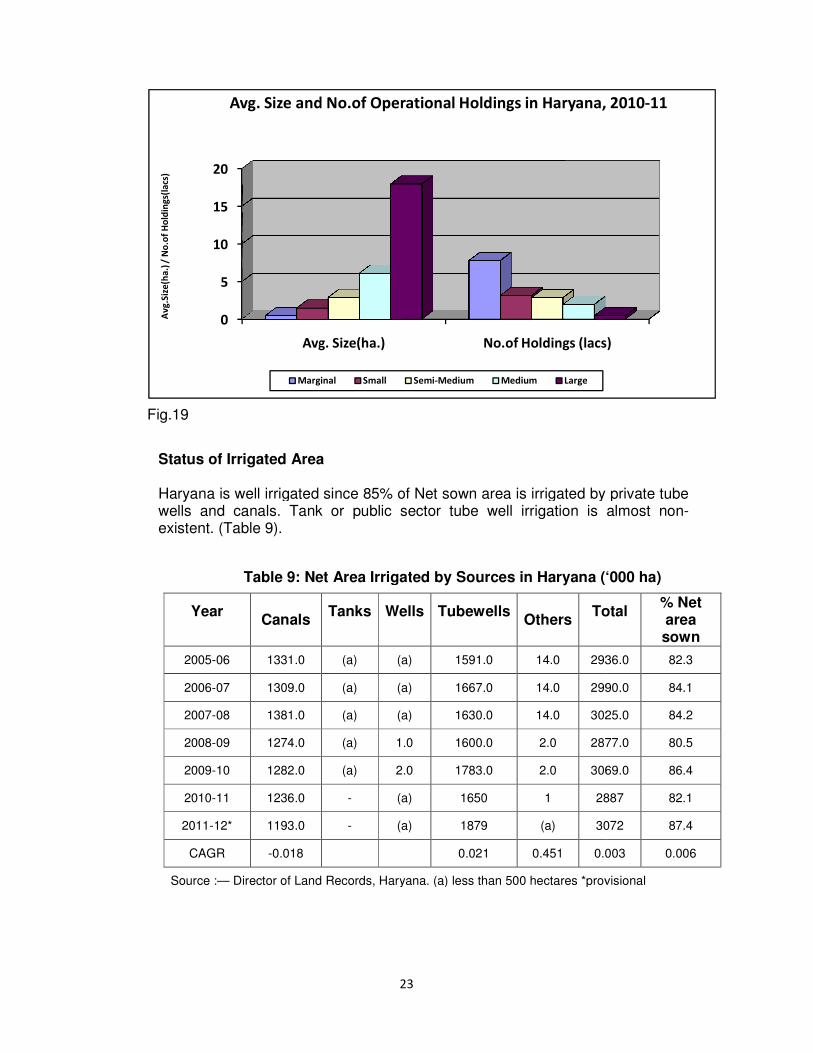
Fig.19
Status of Irrigated Area Haryana is well irrigated wells and canals. Tank or public sector tube well irrigatiexistent. (Table 9).
Table 9: Net Area Irrigat
Year
Canals
2005-06 1331.0
2006-07 1309.0
2007-08 1381.0
2008-09 1274.0
2009-10 1282.0
2010-11 1236.0
2011-12* 1193.0
CAGR -0.018
Source :— Director of Land Records, Haryana. (a) less than 500 hectares
0
5
10
15
20
Avg. Size(ha.)
Av
g.S
ize
(ha
.) /
No
.of
Ho
ldin
gs(
lacs
)
Avg. Size and No.of Operational Holdings in Haryana, 2010
Marginal
23
ed Area
irrigated since 85% of Net sown area is irrigated by private tube wells and canals. Tank or public sector tube well irrigation is almost non
: Net Area Irrigated by Sources in Haryana (‘
Tanks
Wells
Tubewells
Others Total
(a) (a) 1591.0 14.0 2936.0
(a) (a) 1667.0 14.0 2990.0
(a) (a) 1630.0 14.0 3025.0
(a) 1.0 1600.0 2.0 2877.0
(a) 2.0 1783.0 2.0 3069.0
- (a) 1650 1 2887
- (a) 1879 (a) 3072
0.021 0.451 0.003
Director of Land Records, Haryana. (a) less than 500 hectares *provisional
Avg. Size(ha.) No.of Holdings (lacs)
Avg. Size and No.of Operational Holdings in Haryana, 2010
Marginal Small Semi-Medium Medium Large
85% of Net sown area is irrigated by private tube on is almost non-
‘000 ha)
Total
% Net area sown
2936.0 82.3
2990.0 84.1
3025.0 84.2
2877.0 80.5
3069.0 86.4
2887 82.1
3072 87.4
0.003 0.006
*provisional
No.of Holdings (lacs)
Avg. Size and No.of Operational Holdings in Haryana, 2010-11
24
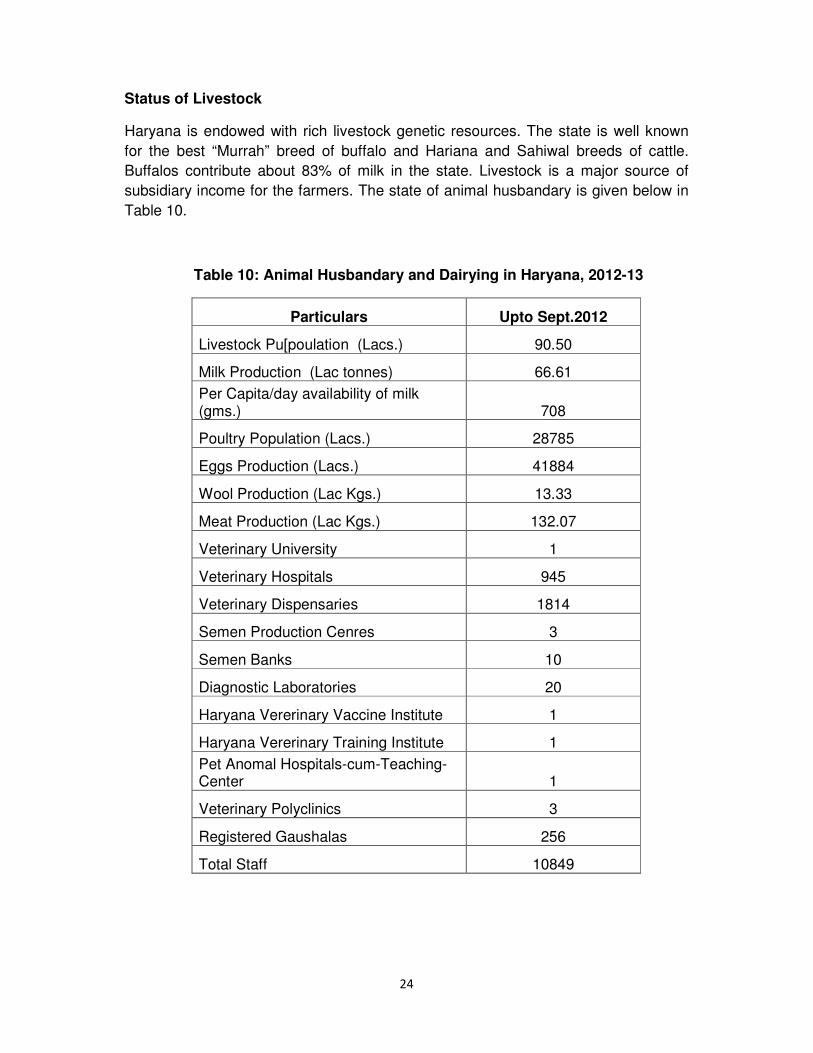
Status of Livestock
Haryana is endowed with rich livestock genetic resources. The state is well known
for the best “Murrah” breed of buffalo and Hariana and Sahiwal breeds of cattle.
Buffalos contribute about 83% of milk in the state. Livestock is a major source of
subsidiary income for the farmers. The state of animal husbandary is given below in
Table 10.
Table 10: Animal Husbandary and Dairying in Haryana, 2012-13
Particulars Upto Sept.2012
Livestock Pu[poulation (Lacs.) 90.50
Milk Production (Lac tonnes) 66.61
Per Capita/day availability of milk (gms.) 708
Poultry Population (Lacs.) 28785
Eggs Production (Lacs.) 41884
Wool Production (Lac Kgs.) 13.33
Meat Production (Lac Kgs.) 132.07
Veterinary University 1
Veterinary Hospitals 945
Veterinary Dispensaries 1814
Semen Production Cenres 3
Semen Banks 10
Diagnostic Laboratories 20
Haryana Vererinary Vaccine Institute 1
Haryana Vererinary Training Institute 1
Pet Anomal Hospitals-cum-Teaching-Center 1
Veterinary Polyclinics 3
Registered Gaushalas 256
Total Staff 10849
25
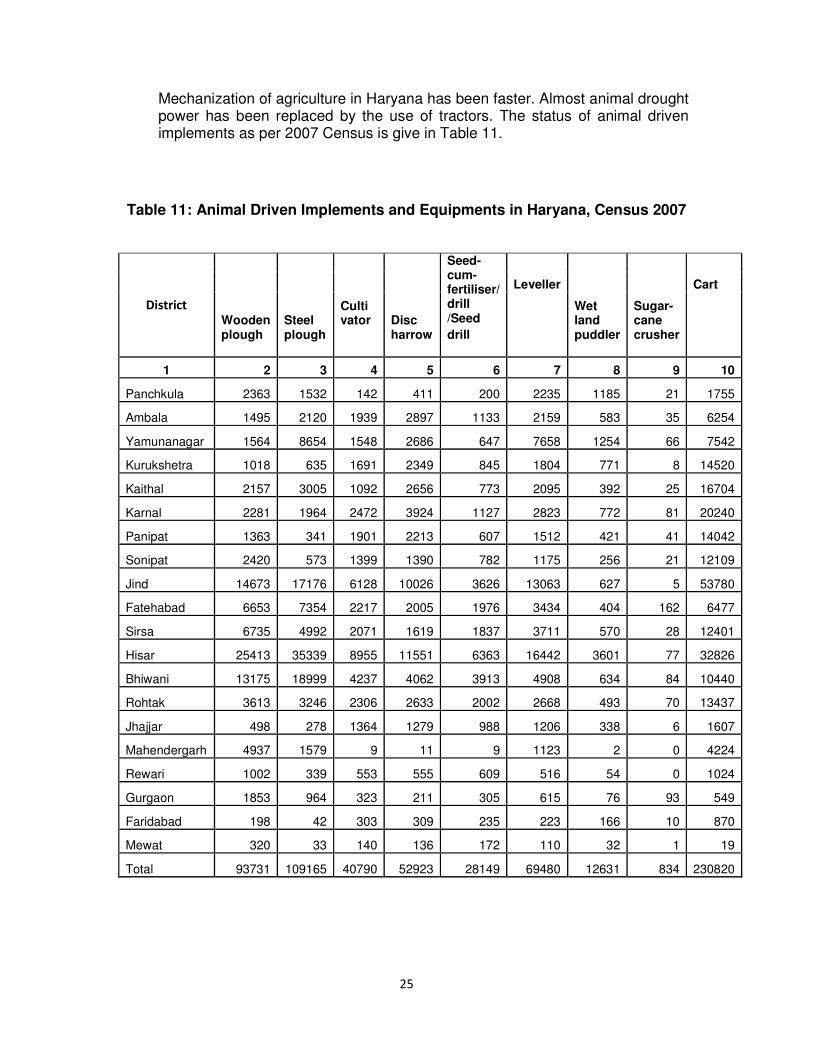
Mechanization of agriculture in Haryana has been faster. Almost animal drought power has been replaced by the use of tractors. The status of animal driven implements as per 2007 Census is give in Table 11.
Table 11: Animal Driven Implements and Equipments in Haryana, Census 2007
District
Steel plough
Seed-cum- fertiliser/ drill /Seed
drill
Wet land puddler
Sugar-cane crusher
Wooden plough
Culti vator
Disc harrow
Leveller Cart
1 2 3 4 5 6 7 8 9 10
Panchkula 2363 1532 142 411 200 2235 1185 21 1755
Ambala 1495 2120 1939 2897 1133 2159 583 35 6254
Yamunanagar 1564 8654 1548 2686 647 7658 1254 66 7542
Kurukshetra 1018 635 1691 2349 845 1804 771 8 14520
Kaithal 2157 3005 1092 2656 773 2095 392 25 16704
Karnal 2281 1964 2472 3924 1127 2823 772 81 20240
Panipat 1363 341 1901 2213 607 1512 421 41 14042
Sonipat 2420 573 1399 1390 782 1175 256 21 12109
Jind 14673 17176 6128 10026 3626 13063 627 5 53780
Fatehabad 6653 7354 2217 2005 1976 3434 404 162 6477
Sirsa 6735 4992 2071 1619 1837 3711 570 28 12401
Hisar 25413 35339 8955 11551 6363 16442 3601 77 32826
Bhiwani 13175 18999 4237 4062 3913 4908 634 84 10440
Rohtak 3613 3246 2306 2633 2002 2668 493 70 13437
Jhajjar 498 278 1364 1279 988 1206 338 6 1607
Mahendergarh 4937 1579 9 11 9 1123 2 0 4224
Rewari 1002 339 553 555 609 516 54 0 1024
Gurgaon 1853 964 323 211 305 615 76 93 549
Faridabad 198 42 303 309 235 223 166 10 870
Mewat 320 33 140 136 172 110 32 1 19
Total 93731 109165 40790 52923 28149 69480 12631 834 230820
26
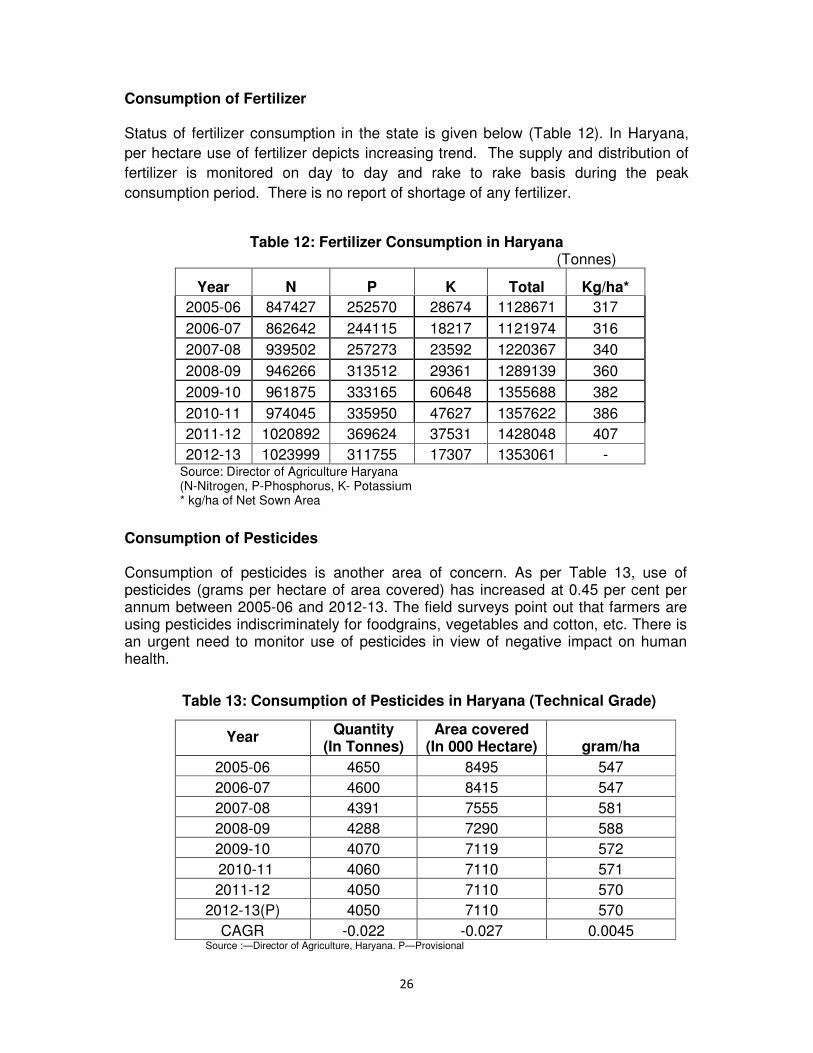
Consumption of Fertilizer
Status of fertilizer consumption in the state is given below (Table 12). In Haryana,
per hectare use of fertilizer depicts increasing trend. The supply and distribution of
fertilizer is monitored on day to day and rake to rake basis during the peak
consumption period. There is no report of shortage of any fertilizer.
Table 12: Fertilizer Consumption in Haryana (Tonnes)
Year N P K Total Kg/ha*
2005-06 847427 252570 28674 1128671 317
2006-07 862642 244115 18217 1121974 316
2007-08 939502 257273 23592 1220367 340
2008-09 946266 313512 29361 1289139 360
2009-10 961875 333165 60648 1355688 382
2010-11 974045 335950 47627 1357622 386
2011-12 1020892 369624 37531 1428048 407
2012-13 1023999 311755 17307 1353061 - Source: Director of Agriculture Haryana (N-Nitrogen, P-Phosphorus, K- Potassium * kg/ha of Net Sown Area
Consumption of Pesticides Consumption of pesticides is another area of concern. As per Table 13, use of pesticides (grams per hectare of area covered) has increased at 0.45 per cent per annum between 2005-06 and 2012-13. The field surveys point out that farmers are using pesticides indiscriminately for foodgrains, vegetables and cotton, etc. There is an urgent need to monitor use of pesticides in view of negative impact on human health.
Table 13: Consumption of Pesticides in Haryana (Technical Grade)
Year Quantity
(In Tonnes) Area covered
(In 000 Hectare)
gram/ha
2005-06 4650 8495 547
2006-07 4600 8415 547
2007-08 4391 7555 581
2008-09 4288 7290 588
2009-10 4070 7119 572
2010-11 4060 7110 571
2011-12 4050 7110 570
2012-13(P) 4050 7110 570
CAGR -0.022 -0.027 0.0045 Source :—Director of Agriculture, Haryana. P—Provisional
27
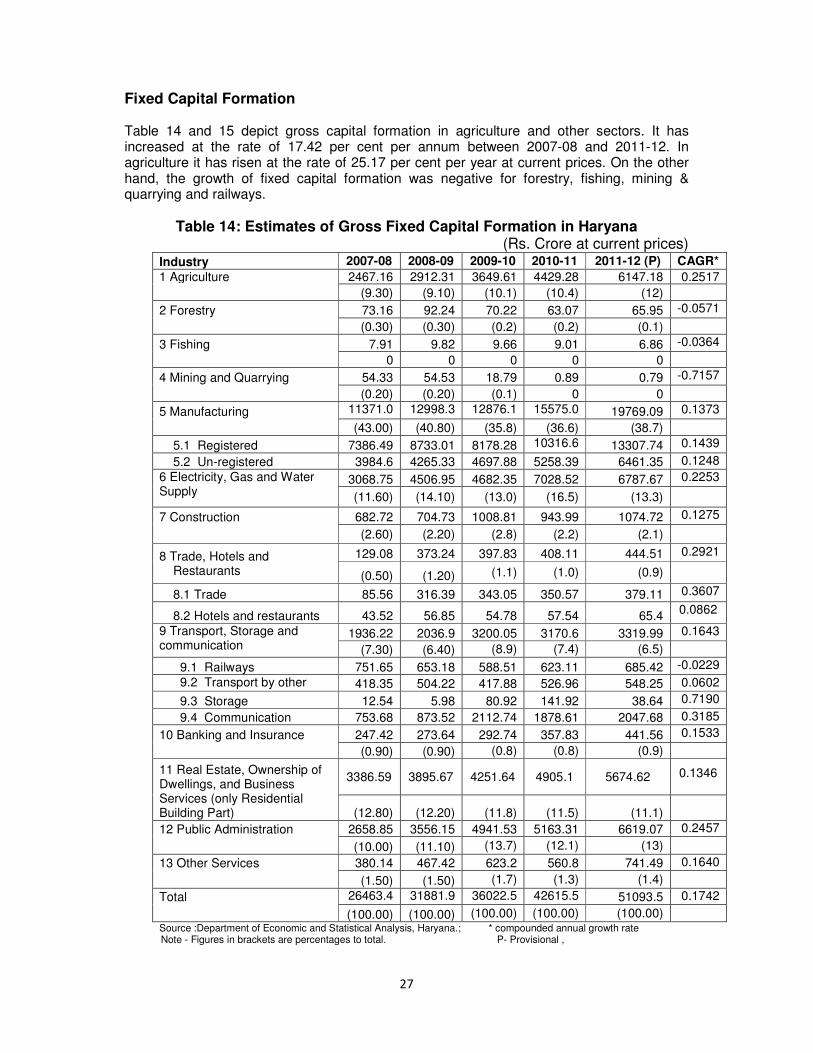
Fixed Capital Formation Table 14 and 15 depict gross capital formation in agriculture and other sectors. It has increased at the rate of 17.42 per cent per annum between 2007-08 and 2011-12. In agriculture it has risen at the rate of 25.17 per cent per year at current prices. On the other hand, the growth of fixed capital formation was negative for forestry, fishing, mining & quarrying and railways.
Table 14: Estimates of Gross Fixed Capital Formation in Haryana (Rs. Crore at current prices)
Industry 2007-08 2008-09 2009-10 2010-11 2011-12 (P) CAGR*
1 Agriculture 2467.16 2912.31 3649.61 4429.28 6147.18 0.2517
(9.30) (9.10) (10.1) (10.4) (12)
2 Forestry 73.16 92.24 70.22 63.07 65.95 -0.0571
(0.30) (0.30) (0.2) (0.2) (0.1)
3 Fishing 7.91 9.82 9.66 9.01 6.86 -0.0364
0 0 0 0 0
4 Mining and Quarrying 54.33 54.53 18.79 0.89 0.79 -0.7157
(0.20) (0.20) (0.1) 0 0
5 Manufacturing 11371.09
12998.34
12876.16
15575.08
19769.09 0.1373
(43.00) (40.80) (35.8) (36.6) (38.7)
5.1 Registered 7386.49 8733.01 8178.28 10316.69
13307.74 0.1439
5.2 Un-registered 3984.6 4265.33 4697.88 5258.39 6461.35 0.1248
6 Electricity, Gas and Water Supply
3068.75 4506.95 4682.35 7028.52 6787.67 0.2253
(11.60) (14.10) (13.0) (16.5) (13.3)
7 Construction 682.72 704.73 1008.81 943.99 1074.72 0.1275
(2.60) (2.20) (2.8) (2.2) (2.1)
8 Trade, Hotels and Restaurants
129.08 373.24 397.83 408.11 444.51 0.2921
(0.50) (1.20) (1.1) (1.0) (0.9)
8.1 Trade 85.56 316.39 343.05 350.57 379.11 0.3607
8.2 Hotels and restaurants 43.52 56.85 54.78 57.54 65.4 0.0862
9 Transport, Storage and communication
1936.22 2036.9 3200.05 3170.6 3319.99 0.1643
(7.30) (6.40) (8.9) (7.4) (6.5)
9.1 Railways 751.65 653.18 588.51 623.11 685.42 -0.0229
9.2 Transport by other means
418.35 504.22 417.88 526.96 548.25 0.0602
9.3 Storage 12.54 5.98 80.92 141.92 38.64 0.7190
9.4 Communication 753.68 873.52 2112.74 1878.61 2047.68 0.3185
10 Banking and Insurance 247.42 273.64 292.74 357.83 441.56 0.1533
(0.90) (0.90) (0.8) (0.8) (0.9)
11 Real Estate, Ownership of Dwellings, and Business Services (only Residential Building Part)
3386.59 3895.67 4251.64 4905.1 5674.62 0.1346
(12.80) (12.20) (11.8) (11.5) (11.1)
12 Public Administration 2658.85 3556.15 4941.53 5163.31 6619.07 0.2457
(10.00) (11.10) (13.7) (12.1) (13)
13 Other Services 380.14 467.42 623.2 560.8 741.49 0.1640
(1.50) (1.50) (1.7) (1.3) (1.4)
Total 26463.42
31881.94
36022.59
42615.59
51093.5 0.1742
(100.00) (100.00) (100.00) (100.00) (100.00) Source :Department of Economic and Statistical Analysis, Haryana.; * compounded annual growth rate
Note - Figures in brackets are percentages to total. P- Provisional ,
28
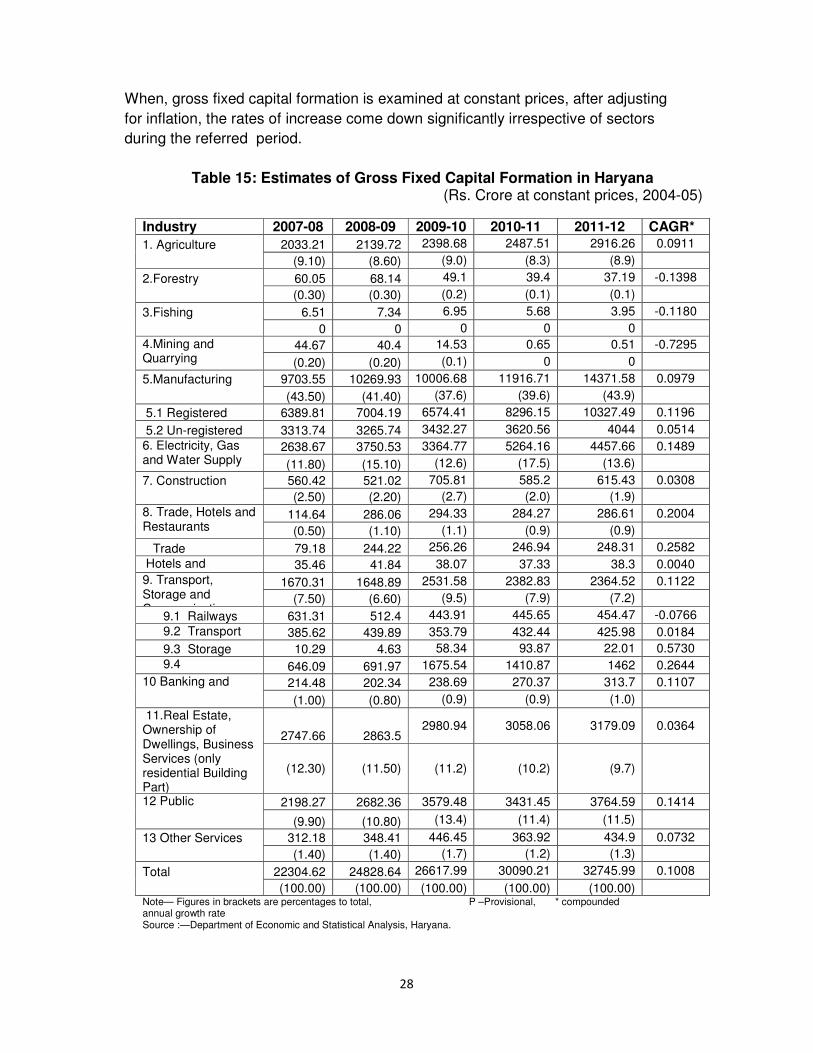
When, gross fixed capital formation is examined at constant prices, after adjusting
for inflation, the rates of increase come down significantly irrespective of sectors
during the referred period.
Table 15: Estimates of Gross Fixed Capital Formation in Haryana (Rs. Crore at constant prices, 2004-05)
Industry 2007-08 2008-09 2009-10 2010-11 2011-12 CAGR*
1. Agriculture 2033.21 2139.72 2398.68 2487.51 2916.26 0.0911
(9.10) (8.60) (9.0) (8.3) (8.9)
2.Forestry 60.05 68.14 49.1 39.4 37.19 -0.1398
(0.30) (0.30) (0.2) (0.1) (0.1)
3.Fishing 6.51 7.34 6.95 5.68 3.95 -0.1180
0 0 0 0 0
4.Mining and Quarrying
44.67 40.4 14.53 0.65 0.51 -0.7295
(0.20) (0.20) (0.1) 0 0
5.Manufacturing 9703.55 10269.93 10006.68 11916.71 14371.58 0.0979
(43.50) (41.40) (37.6) (39.6) (43.9)
5.1 Registered 6389.81 7004.19 6574.41 8296.15 10327.49 0.1196
5.2 Un-registered 3313.74 3265.74 3432.27 3620.56 4044 0.0514
6. Electricity, Gas and Water Supply
2638.67 3750.53 3364.77 5264.16 4457.66 0.1489
(11.80) (15.10) (12.6) (17.5) (13.6)
7. Construction 560.42 521.02 705.81 585.2 615.43 0.0308
(2.50) (2.20) (2.7) (2.0) (1.9)
8. Trade, Hotels and Restaurants
114.64 286.06 294.33 284.27 286.61 0.2004
(0.50) (1.10) (1.1) (0.9) (0.9)
Trade 79.18 244.22 256.26 246.94 248.31 0.2582
Hotels and Restaurants
35.46 41.84 38.07 37.33 38.3 0.0040
9. Transport, Storage and Communication
1670.31 1648.89 2531.58 2382.83 2364.52 0.1122
(7.50) (6.60) (9.5) (7.9) (7.2)
9.1 Railways 631.31 512.4 443.91 445.65 454.47 -0.0766
9.2 Transport by other means
385.62 439.89 353.79 432.44 425.98 0.0184
9.3 Storage 10.29 4.63 58.34 93.87 22.01 0.5730
9.4 Communication
646.09 691.97 1675.54 1410.87 1462 0.2644
10 Banking and Insurance
214.48 202.34 238.69 270.37 313.7 0.1107
(1.00) (0.80) (0.9) (0.9) (1.0)
11.Real Estate, Ownership of Dwellings, Business Services (only residential Building Part)
2747.66 2863.5 2980.94 3058.06 3179.09 0.0364
(12.30) (11.50) (11.2) (10.2) (9.7)
12 Public Administration
2198.27 2682.36 3579.48 3431.45 3764.59 0.1414
(9.90) (10.80) (13.4) (11.4) (11.5)
13 Other Services 312.18 348.41 446.45 363.92 434.9 0.0732
(1.40) (1.40) (1.7) (1.2) (1.3)
Total 22304.62 24828.64 26617.99 30090.21 32745.99 0.1008
(100.00) (100.00) (100.00) (100.00) (100.00) Note— Figures in brackets are percentages to total, P –Provisional, * compounded annual growth rate
Source :—Department of Economic and Statistical Analysis, Haryana.
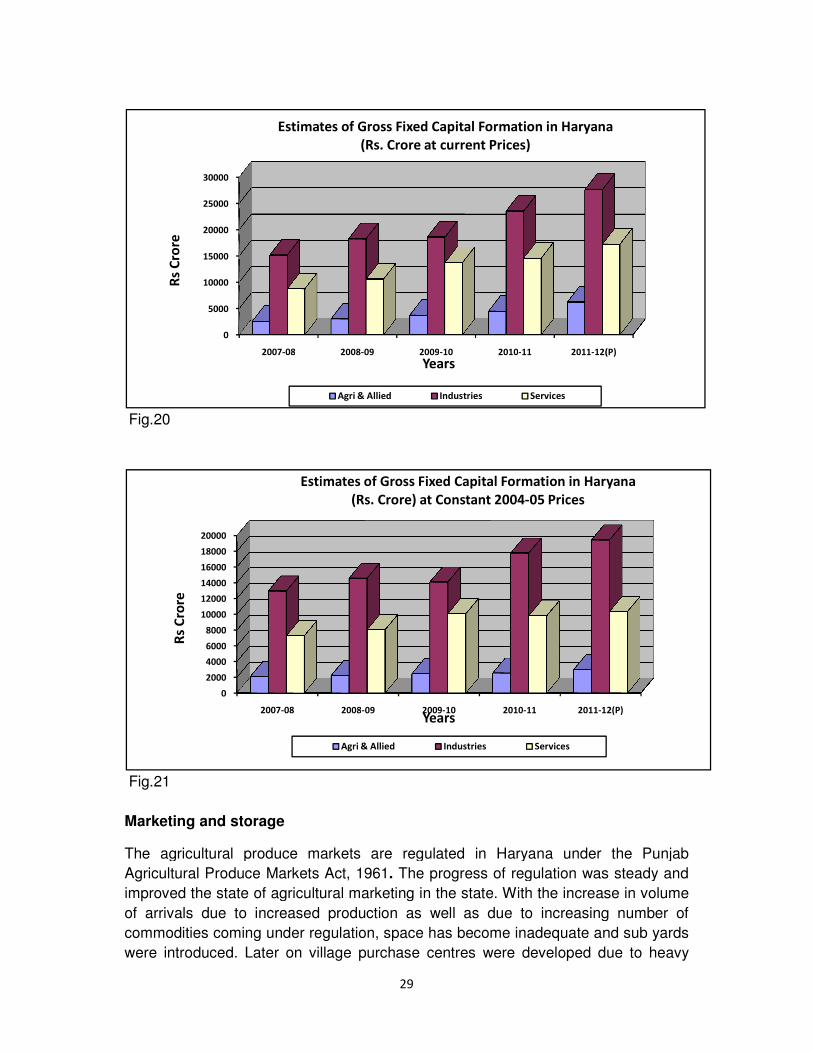
Fig.20
Fig.21
Marketing and storage
The agricultural produce markets
Agricultural Produce Markets Act,
improved the state of agricultural marketing in the state. With the increase in volume
of arrivals due to increased production as well as due to
commodities coming under regulation, space
were introduced. Later on village purchase centres were developed
0
5000
10000
15000
20000
25000
30000
2007-08
Rs
Cro
re
Estimates of Gross Fixed Capital Formation in Haryana
0
2000
4000
6000
8000
10000
12000
14000
16000
18000
20000
2007-08
Rs
Cro
re
Estimates of Gross Fixed Capital Formation in Haryana
29
The agricultural produce markets are regulated in Haryana under the Punjab
roduce Markets Act, 1961. The progress of regulation was steady and
the state of agricultural marketing in the state. With the increase in volume
of arrivals due to increased production as well as due to increasing number of
commodities coming under regulation, space has become inadequate and sub yards
were introduced. Later on village purchase centres were developed due to heavy
2008-09 2009-10 2010-11 2011-12(P)
Years
Estimates of Gross Fixed Capital Formation in Haryana
(Rs. Crore at current Prices)
Agri & Allied Industries Services
2008-09 2009-10 2010-11 2011-12(P)Years
Estimates of Gross Fixed Capital Formation in Haryana
(Rs. Crore) at Constant 2004-05 Prices
Agri & Allied Industries Services
regulated in Haryana under the Punjab
regulation was steady and
the state of agricultural marketing in the state. With the increase in volume
increasing number of
inadequate and sub yards
due to heavy
12(P)
Estimates of Gross Fixed Capital Formation in Haryana
12(P)
Estimates of Gross Fixed Capital Formation in Haryana
30
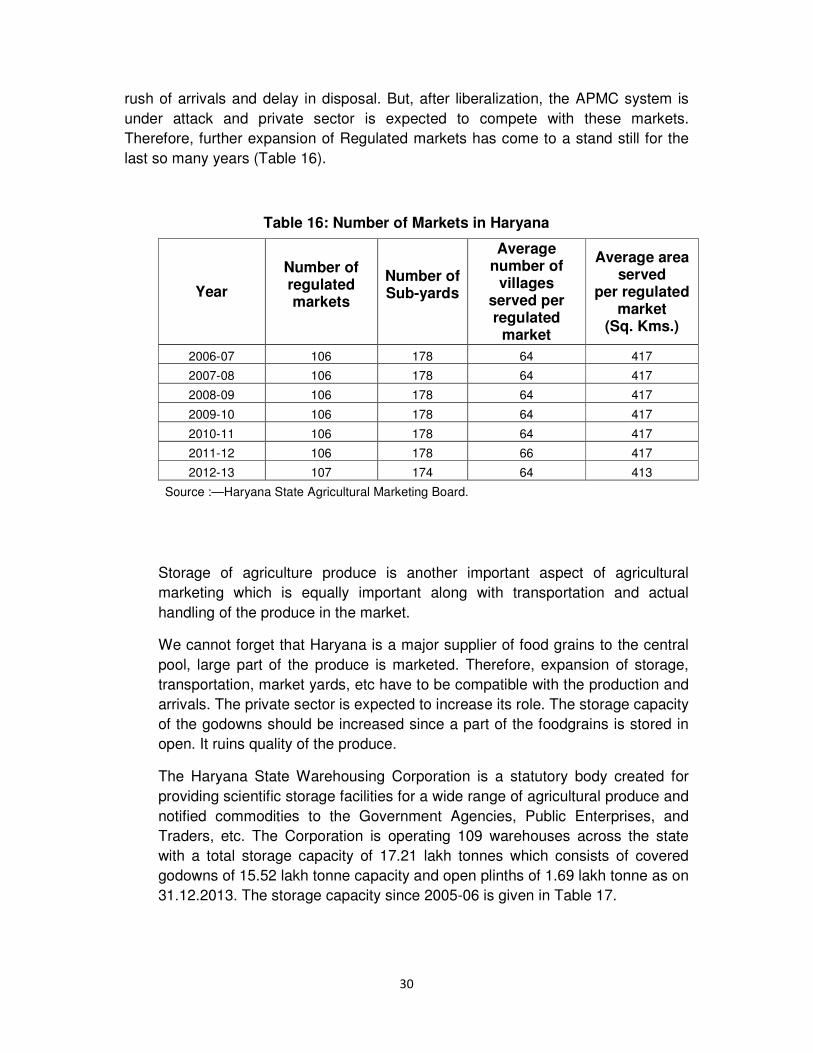
rush of arrivals and delay in disposal. But, after liberalization, the APMC system is
under attack and private sector is expected to compete with these markets.
Therefore, further expansion of Regulated markets has come to a stand still for the
last so many years (Table 16).
Table 16: Number of Markets in Haryana
Year
Number of regulated markets
Number of Sub-yards
Average number of
villages served per regulated
market
Average area served
per regulated market
(Sq. Kms.)
2006-07 106 178 64 417
2007-08 106 178 64 417
2008-09 106 178 64 417
2009-10 106 178 64 417
2010-11 106 178 64 417
2011-12 106 178 66 417
2012-13 107 174 64 413
Source :—Haryana State Agricultural Marketing Board.
Storage of agriculture produce is another important aspect of agricultural
marketing which is equally important along with transportation and actual
handling of the produce in the market.
We cannot forget that Haryana is a major supplier of food grains to the central
pool, large part of the produce is marketed. Therefore, expansion of storage,
transportation, market yards, etc have to be compatible with the production and
arrivals. The private sector is expected to increase its role. The storage capacity
of the godowns should be increased since a part of the foodgrains is stored in
open. It ruins quality of the produce.
The Haryana State Warehousing Corporation is a statutory body created for
providing scientific storage facilities for a wide range of agricultural produce and
notified commodities to the Government Agencies, Public Enterprises, and
Traders, etc. The Corporation is operating 109 warehouses across the state
with a total storage capacity of 17.21 lakh tonnes which consists of covered
godowns of 15.52 lakh tonne capacity and open plinths of 1.69 lakh tonne as on
31.12.2013. The storage capacity since 2005-06 is given in Table 17.
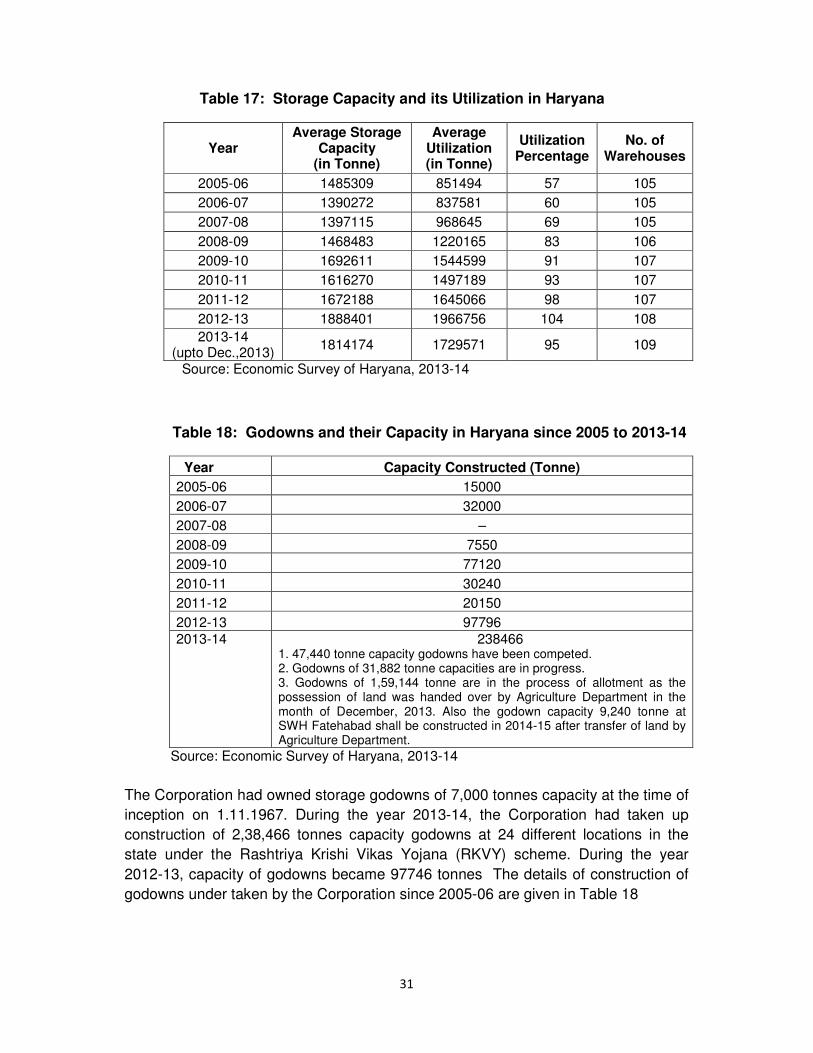
31
Table 17: Storage Capacity and its Utilization in Haryana
Year Average Storage
Capacity (in Tonne)
Average Utilization (in Tonne)
Utilization Percentage
No. of Warehouses
2005-06 1485309 851494 57 105
2006-07 1390272 837581 60 105
2007-08 1397115 968645 69 105
2008-09 1468483 1220165 83 106
2009-10 1692611 1544599 91 107
2010-11 1616270 1497189 93 107
2011-12 1672188 1645066 98 107
2012-13 1888401 1966756 104 108
2013-14 (upto Dec.,2013)
1814174 1729571 95 109
Source: Economic Survey of Haryana, 2013-14
Table 18: Godowns and their Capacity in Haryana since 2005 to 2013-14
Year Capacity Constructed (Tonne)
2005-06 15000
2006-07 32000
2007-08 –
2008-09 7550
2009-10 77120
2010-11 30240
2011-12 20150
2012-13 97796
2013-14 238466 1. 47,440 tonne capacity godowns have been competed. 2. Godowns of 31,882 tonne capacities are in progress. 3. Godowns of 1,59,144 tonne are in the process of allotment as the possession of land was handed over by Agriculture Department in the month of December, 2013. Also the godown capacity 9,240 tonne at SWH Fatehabad shall be constructed in 2014-15 after transfer of land by Agriculture Department.
Source: Economic Survey of Haryana, 2013-14
The Corporation had owned storage godowns of 7,000 tonnes capacity at the time of
inception on 1.11.1967. During the year 2013-14, the Corporation had taken up
construction of 2,38,466 tonnes capacity godowns at 24 different locations in the
state under the Rashtriya Krishi Vikas Yojana (RKVY) scheme. During the year
2012-13, capacity of godowns became 97746 tonnes The details of construction of
godowns under taken by the Corporation since 2005-06 are given in Table 18
32
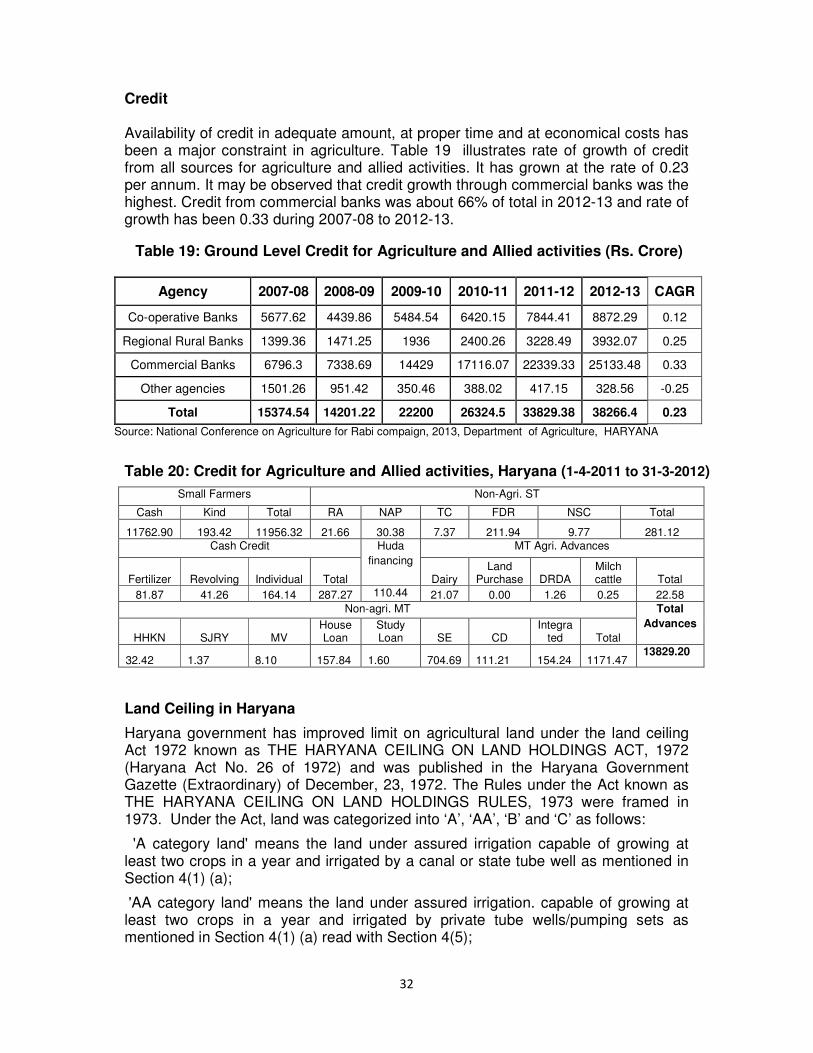
Credit Availability of credit in adequate amount, at proper time and at economical costs has been a major constraint in agriculture. Table 19 illustrates rate of growth of credit from all sources for agriculture and allied activities. It has grown at the rate of 0.23 per annum. It may be observed that credit growth through commercial banks was the highest. Credit from commercial banks was about 66% of total in 2012-13 and rate of growth has been 0.33 during 2007-08 to 2012-13.
Table 19: Ground Level Credit for Agriculture and Allied activities (Rs. Crore)
Agency 2007-08 2008-09 2009-10 2010-11 2011-12 2012-13 CAGR
Co-operative Banks 5677.62 4439.86 5484.54 6420.15 7844.41 8872.29 0.12
Regional Rural Banks 1399.36 1471.25 1936 2400.26 3228.49 3932.07 0.25
Commercial Banks 6796.3 7338.69 14429 17116.07 22339.33 25133.48 0.33
Other agencies 1501.26 951.42 350.46 388.02 417.15 328.56 -0.25
Total 15374.54 14201.22 22200 26324.5 33829.38 38266.4 0.23
Source: National Conference on Agriculture for Rabi compaign, 2013, Department of Agriculture, HARYANA
Table 20: Credit for Agriculture and Allied activities, Haryana (1-4-2011 to 31-3-2012)
Small Farmers Non-Agri. ST
Cash Kind Total RA NAP TC FDR NSC Total
11762.90 193.42 11956.32 21.66 30.38 7.37 211.94 9.77 281.12 Cash Credit Huda
financing
MT Agri. Advances
Fertilizer Revolving Individual Total Dairy Land
Purchase DRDA Milch cattle Total
81.87 41.26 164.14 287.27 110.44 21.07 0.00 1.26 0.25 22.58
Non-agri. MT Total
Advances
HHKN SJRY MV House Loan
Study Loan SE CD
Integrated Total
32.42 1.37 8.10 157.84 1.60 704.69 111.21 154.24 1171.47 13829.20
Land Ceiling in Haryana
Haryana government has improved limit on agricultural land under the land ceiling Act 1972 known as THE HARYANA CEILING ON LAND HOLDINGS ACT, 1972 (Haryana Act No. 26 of 1972) and was published in the Haryana Government Gazette (Extraordinary) of December, 23, 1972. The Rules under the Act known as THE HARYANA CEILING ON LAND HOLDINGS RULES, 1973 were framed in 1973. Under the Act, land was categorized into ‘A’, ‘AA’, ‘B’ and ‘C’ as follows:
'A category land' means the land under assured irrigation capable of growing at least two crops in a year and irrigated by a canal or state tube well as mentioned in Section 4(1) (a);
'AA category land' means the land under assured irrigation. capable of growing at least two crops in a year and irrigated by private tube wells/pumping sets as mentioned in Section 4(1) (a) read with Section 4(5);
33
'B category land' means the land under assured irrigation capable of growing. at least one crop in a year as mentioned in Section 4( 1 )(b); and 'C category land' means land of all other types including land under or charge as mentioned in section 4(1)(c); The maximum permissible limit of land was fixed 21.8 hectares of C category or equivalent to that of other categories. Other categories of land were adjusted on a formula treating A category of land = 1, AA category of land=1.25, B category of land= 1.5 and C category of land = 3. Thus 1 unit A land = 1.25 units of AA land= 1.5 units of B land = 3 units of C land.. On adjustment ceiling limits were roughly equal to 54.5 acres of “C” land, 27.25 acres “B” land, 22.71 acres AA land and 18.17 acres of A land The act has been amended in 2011 allowing ownership of any amount of land (both
urban and agricultural) to corporate bodies is effected retrospectively from the year it
was implemented that is September 1975. The Punjab and Haryana High Court
taking a suo -moto notice stayed its implementation. The High court order was
stayed by the Apex Court on a petition filed by land developers.
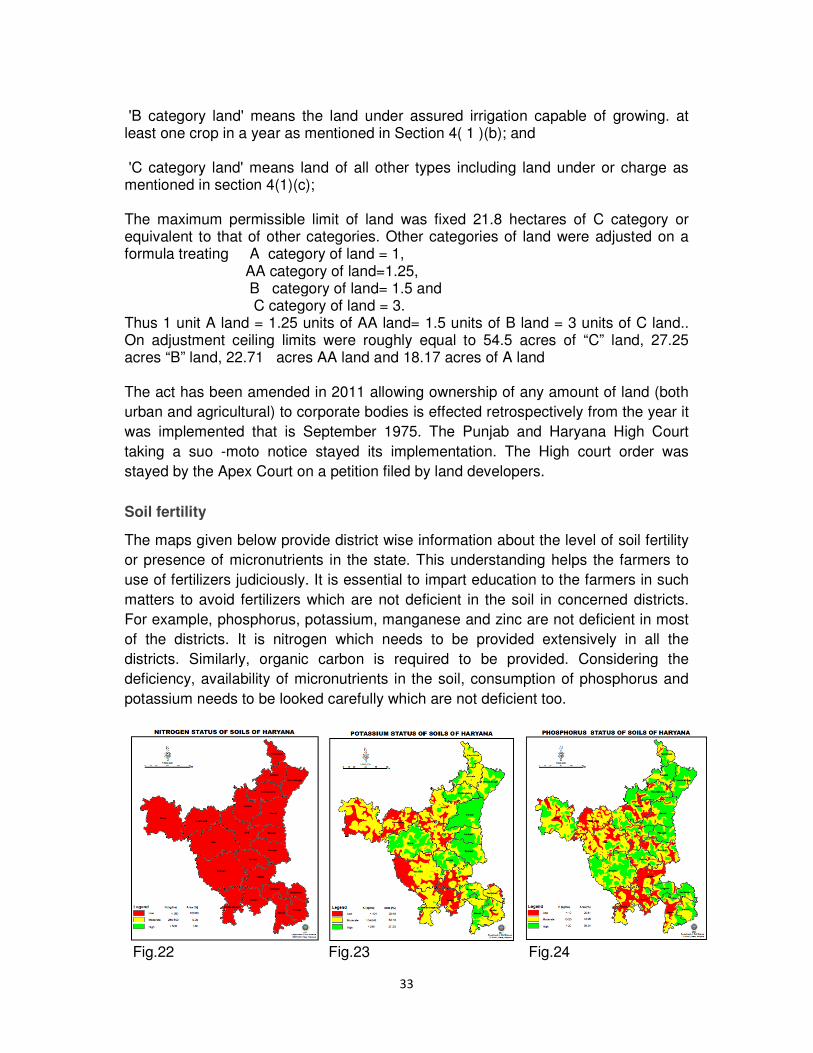
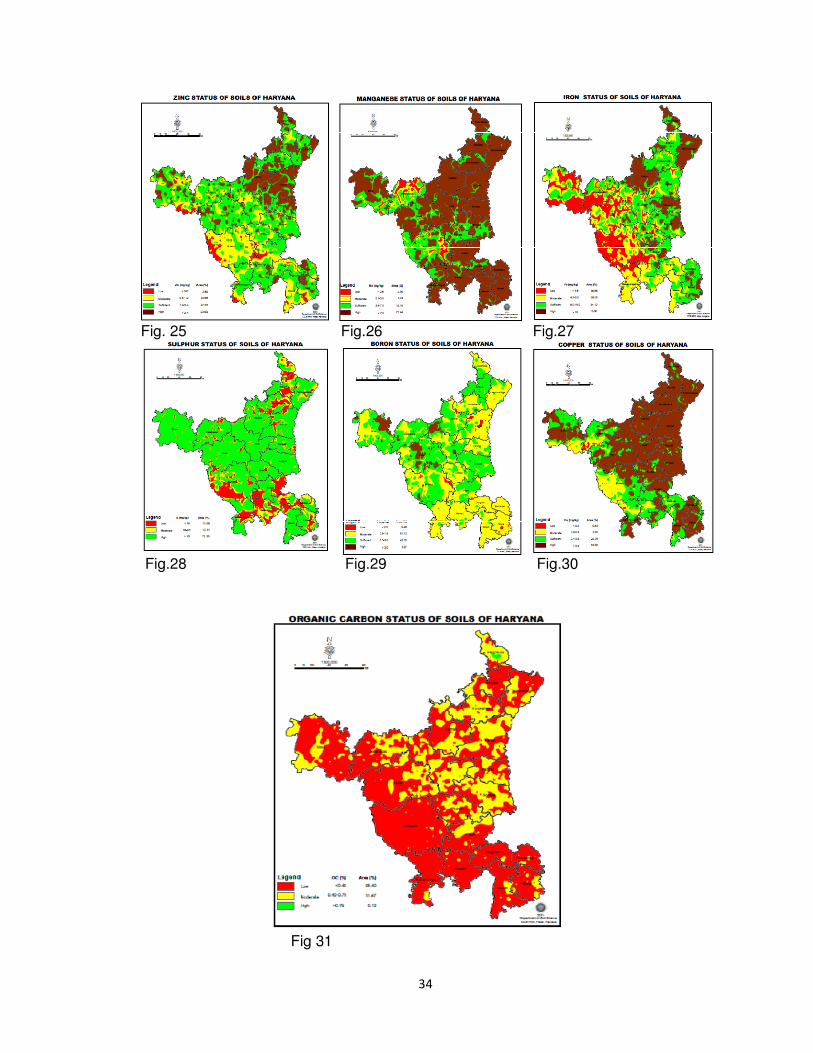
Soil fertility
The maps given below provide district wise information about the level of soil fertility
or presence of micronutrients in the state. This understanding helps the farmers to
use of fertilizers judiciously. It is essential to impart education to the farmers in such
matters to avoid fertilizers which are not deficient in the soil in concerned districts.
For example, phosphorus, potassium, manganese and zinc are not deficient in most
of the districts. It is nitrogen which needs to be provided extensively in all the
districts. Similarly, organic carbon is required to be provided. Considering the
deficiency, availability of micronutrients in the soil, consumption of phosphorus and
potassium needs to be looked carefully which are not deficient too.
Fig.22 Fig.23 Fig.24
34
Fig. 25 Fig.26 Fig.27
Fig.28 Fig.29 Fig.30
Fig 31
35
The problems of soil degradation (soil compaction, soil salinity, sodicity, water
logging, and pesticide residue), multiple nutrient deficiency, low organic carbon
content and decline in the total factor productivity have been observed under
different production systems in the state.
Seed
Seed is the most critical of all agricultural inputs and determines the performance
and efficiency of other inputs. It is important for enhancing productivity and
production and thereby, income of the farmers. It is, therefore, essential that quantity
of seeds with good genetic potential appropriate to the agro-climatic conditions are
produced in sufficient quantity at affordable price and made available to the farmers
timely for achieving higher agricultural production. Haryana and other states have
already prepared the long term seed plan (2013-14 to 2016-17) based on their agro-
climatic conditions, crop varieties being cultivated, targeted SRR (seed required for
normal conditions and seed required for contingency situations).
Availability of certified seeds at reasonable rates is equally important and one of the
vital inputs for agricultural growth. The state of seeds, viz. availability as well as
requirement in the state is given in (Table 21a for Rabi Crops and Table 21b for
Kharif Crops). At present in Haryana, availability of seed for the mentioned crops is
more than the requirement.
Conclusion
Diversion of agricultural land for non-agricultural use is an emerging problem in
Haryana.
The major cropping systems in the state are rice-wheat, cotton-wheat, pearlmillet-
wheat, clusterbean-raya/wheat, fallow-rapeseed & mustard and sugarcane. There is
considerable decline in water table in rice-wheat areas in the north eastern zone of
Haryana. The delay in planting and low yield of wheat in cotton based cropping
system are some of the important issues related to these cropping systems and
diversification.
Inadequate availability of quality seeds of vegetables, flowers, spices, planting
material for fruits, their higher cost and timely availability are some major constraints
in promoting horticulture in the state. Farmers also need proper knowledge for
controlling various pests and diseases, including processing and marketing of their
produce.
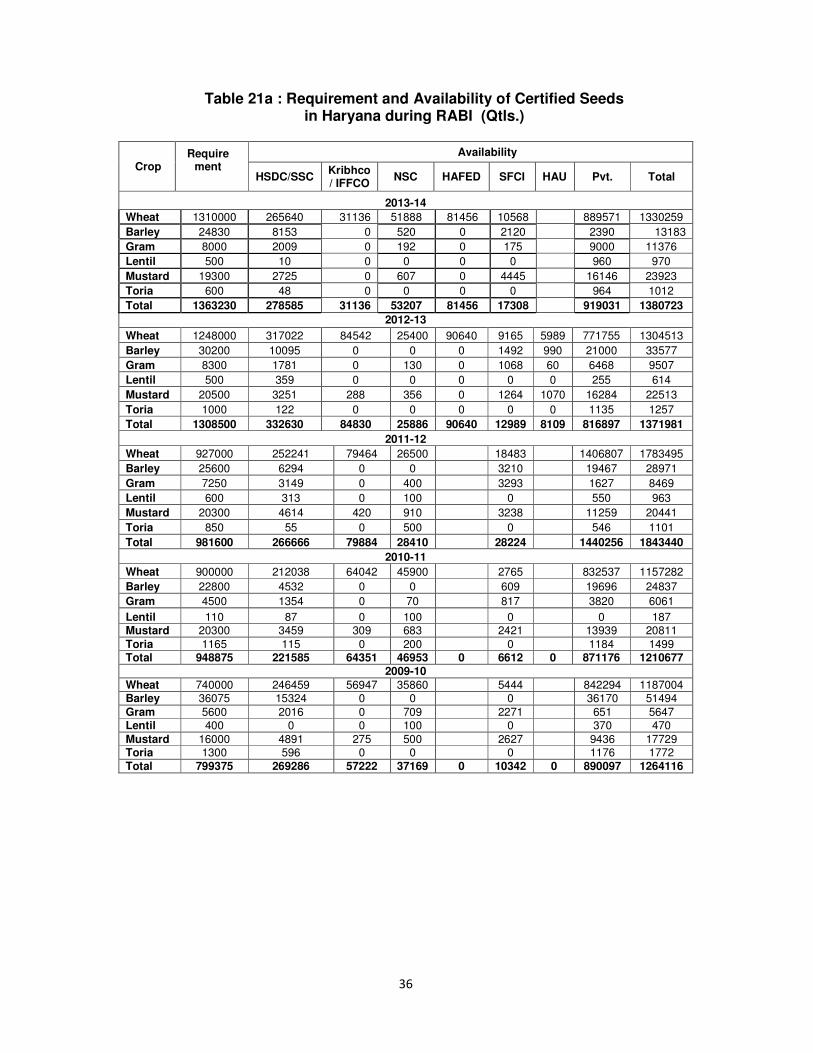
36
Table 21a : Requirement and Availability of Certified Seeds in Haryana during RABI (Qtls.)
Crop Require
ment
Availability
HSDC/SSC Kribhco / IFFCO
NSC HAFED SFCI HAU Pvt. Total
2013-14
Wheat 1310000 265640 31136 51888 81456 10568 889571 1330259
Barley 24830 8153 0 520 0 2120 2390 13183
Gram 8000 2009 0 192 0 175 9000 11376
Lentil 500 10 0 0 0 0 960 970
Mustard 19300 2725 0 607 0 4445 16146 23923
Toria 600 48 0 0 0 0 964 1012
Total 1363230 278585 31136 53207 81456 17308 919031 1380723
2012-13
Wheat 1248000 317022 84542 25400 90640 9165 5989 771755 1304513
Barley 30200 10095 0 0 0 1492 990 21000 33577
Gram 8300 1781 0 130 0 1068 60 6468 9507
Lentil 500 359 0 0 0 0 0 255 614
Mustard 20500 3251 288 356 0 1264 1070 16284 22513
Toria 1000 122 0 0 0 0 0 1135 1257
Total 1308500 332630 84830 25886 90640 12989 8109 816897 1371981
2011-12
Wheat 927000 252241 79464 26500 18483 1406807 1783495
Barley 25600 6294 0 0 3210 19467 28971
Gram 7250 3149 0 400 3293 1627 8469
Lentil 600 313 0 100 0 550 963
Mustard 20300 4614 420 910 3238 11259 20441
Toria 850 55 0 500 0 546 1101
Total 981600 266666 79884 28410 28224 1440256 1843440
2010-11
Wheat 900000 212038 64042 45900 2765 832537 1157282
Barley 22800 4532 0 0 609 19696 24837
Gram 4500 1354 0 70 817 3820 6061
Lentil 110 87 0 100 0 0 187 Mustard 20300 3459 309 683 2421 13939 20811
Toria 1165 115 0 200 0 1184 1499 Total 948875 221585 64351 46953 0 6612 0 871176 1210677
2009-10
Wheat 740000 246459 56947 35860 5444 842294 1187004 Barley 36075 15324 0 0 0 36170 51494
Gram 5600 2016 0 709 2271 651 5647 Lentil 400 0 0 100 0 370 470
Mustard 16000 4891 275 500 2627 9436 17729 Toria 1300 596 0 0 0 1176 1772
Total 799375 269286 57222 37169 0 10342 0 890097 1264116
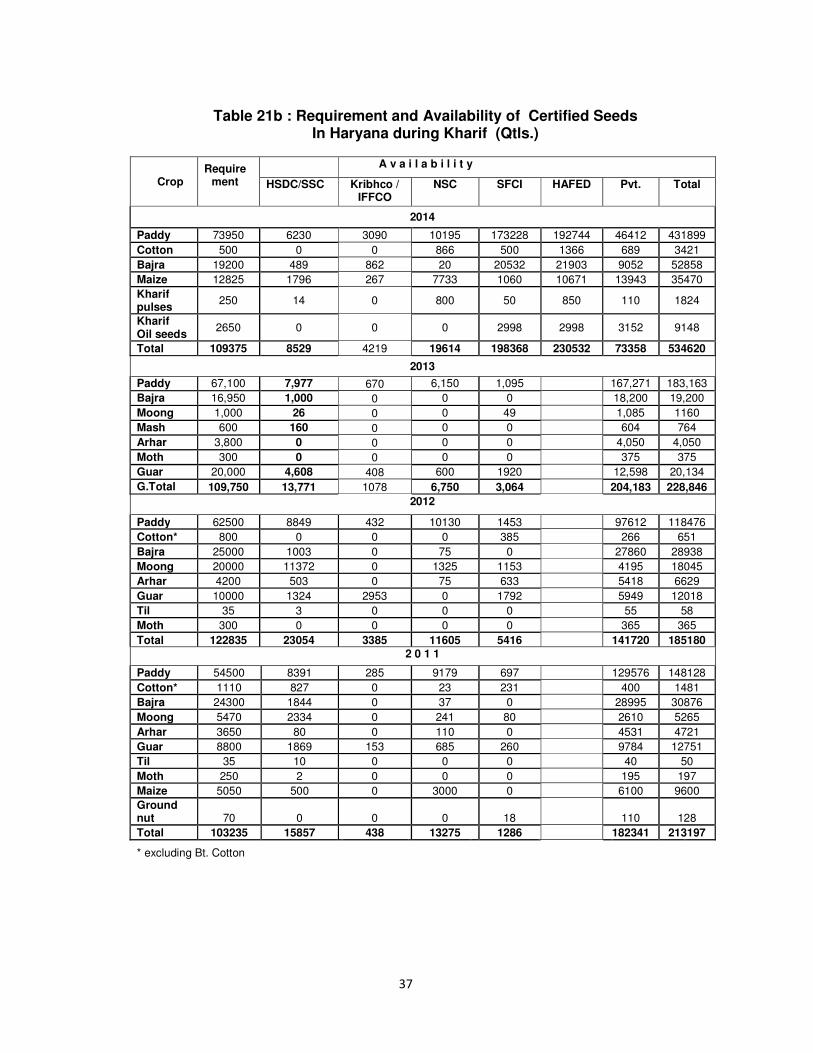
37
Table 21b : Requirement and Availability of Certified Seeds
In Haryana during Kharif (Qtls.)
Crop Require
ment
A v a i l a b i l i t y
HSDC/SSC Kribhco / IFFCO
NSC SFCI HAFED Pvt. Total
2014
Paddy 73950 6230 3090 10195 173228 192744 46412 431899
Cotton 500 0 0 866 500 1366 689 3421
Bajra 19200 489 862 20 20532 21903 9052 52858
Maize 12825 1796 267 7733 1060 10671 13943 35470
Kharif pulses
250 14 0 800 50 850 110 1824
Kharif Oil seeds
2650 0 0 0 2998 2998 3152 9148
Total 109375 8529 4219 19614 198368 230532 73358 534620
2013
Paddy 67,100 7,977 670 6,150 1,095 167,271 183,163
Bajra 16,950 1,000 0 0 0 18,200 19,200
Moong 1,000 26 0 0 49 1,085 1160
Mash 600 160 0 0 0 604 764
Arhar 3,800 0 0 0 0 4,050 4,050
Moth 300 0 0 0 0 375 375
Guar 20,000 4,608 408 600 1920 12,598 20,134
G.Total 109,750 13,771 1078 6,750 3,064 204,183 228,846
2012
Paddy 62500 8849 432 10130 1453 97612 118476
Cotton* 800 0 0 0 385 266 651
Bajra 25000 1003 0 75 0 27860 28938
Moong 20000 11372 0 1325 1153 4195 18045
Arhar 4200 503 0 75 633 5418 6629
Guar 10000 1324 2953 0 1792 5949 12018
Til 35 3 0 0 0 55 58
Moth 300 0 0 0 0 365 365
Total 122835 23054 3385 11605 5416 141720 185180
2 0 1 1
Paddy 54500 8391 285 9179 697 129576 148128
Cotton* 1110 827 0 23 231 400 1481
Bajra 24300 1844 0 37 0 28995 30876
Moong 5470 2334 0 241 80 2610 5265
Arhar 3650 80 0 110 0 4531 4721
Guar 8800 1869 153 685 260 9784 12751
Til 35 10 0 0 0 40 50
Moth 250 2 0 0 0 195 197
Maize 5050 500 0 3000 0 6100 9600
Ground nut 70 0 0 0 18
110 128
Total 103235 15857 438 13275 1286 182341 213197
* excluding Bt. Cotton
38
Haryana should place their Breeder Seed indent plan for production of Foundation
seeds and then certified seeds through their various seed producing agencies like
State Directorates of Agriculture, State Seeds Corporation, State Seed Farms, State
Agriculture University Farms, State Oilseed Grower Federations, other state co-
operatives, National Seeds Corporation (NSC), State Farms Corporation of India
(SFCI), Krishak Bharati Cooperative Limited (KRIBHCO), Indian Farmers Fertilizers
Cooperative Limited (IFFCO), private companies, etc.
Haryana is endowed with rich livestock genetic resources. The state is well known
for the best “Murrah” breed of buffalo and Hariana and Sahiwal breeds of cattle.
Buffalos contribute more than 90 per cent of milk in the state. In the integrated
farming system, research on livestock (dairying, goatery and piggery), poultry and
fishery component should receive priority in policy initiatives.
In order to help farmers to get more than one loan on a given property, the mortgage
of land by the banks should be regulated as per the value of the land and amount of
loan requested.
Risk and uncertainty are higher in agriculture and these are increasing owing to
climate change. Nothing can be worse for a farmer than a natural disaster, (untimely
rainfall destroy crops). The early information/warning system with respect to
weather, natural calamities, floods/droughts, shortage of critical inputs shall be
ensured and strengthened. To protect the farmers, the natural calamities shall be
assessed at the block level rather than at the district level. Further, in case of
damage of crops/enterprises by natural calamities, suitable interim financial relief
shall be made available immediately to the farmers till such time final assessment is
done by the state/ central government agencies.