Embed Size (px)
Citation preview
Peru Fruit and Vegetable Insight
An open foreign investment environment has unlocked highly productive agricultural land in Peru and allowed the nation to become a top fruit and vegetable exporter. Peru’s ascent is exemplified by recently becoming the leading global exporter of blueberries, a crop not commercially produced in the country just a decade ago. This rapid growth will not just be limited to one crop, as Peru invests in production of other high-value fruit and vegetables to continue its climb as a major exporter.
Executive Summary
AGRICULTURAL FINANCE
August 6, 2020
MetLife Investment Management | Peru Fruit and Vegetable Insight 2
How It StartedIn 1991, Peru passed the Foreign Investment Promotion Law, which paved the way for the agricultural industry to modernize practices and improve technology.1 The act legalized most private foreign land ownership and defined the rights of foreign investors’ capital. As a result, foreign direct investment into Peru grew from approximately zero in the early 1990s to close to $2 billion2 in Q4 2019.3 The pro-business environment allowed well-capitalized international companies to partner with Peruvian farmers to expand fruit and vegetable production. Shortly after the law was passed, total fruit and vegetable acreage began its surge from 274,000 hectares (ha) in 1990 to 675,000 ha in 2018 (5% CAGR).4
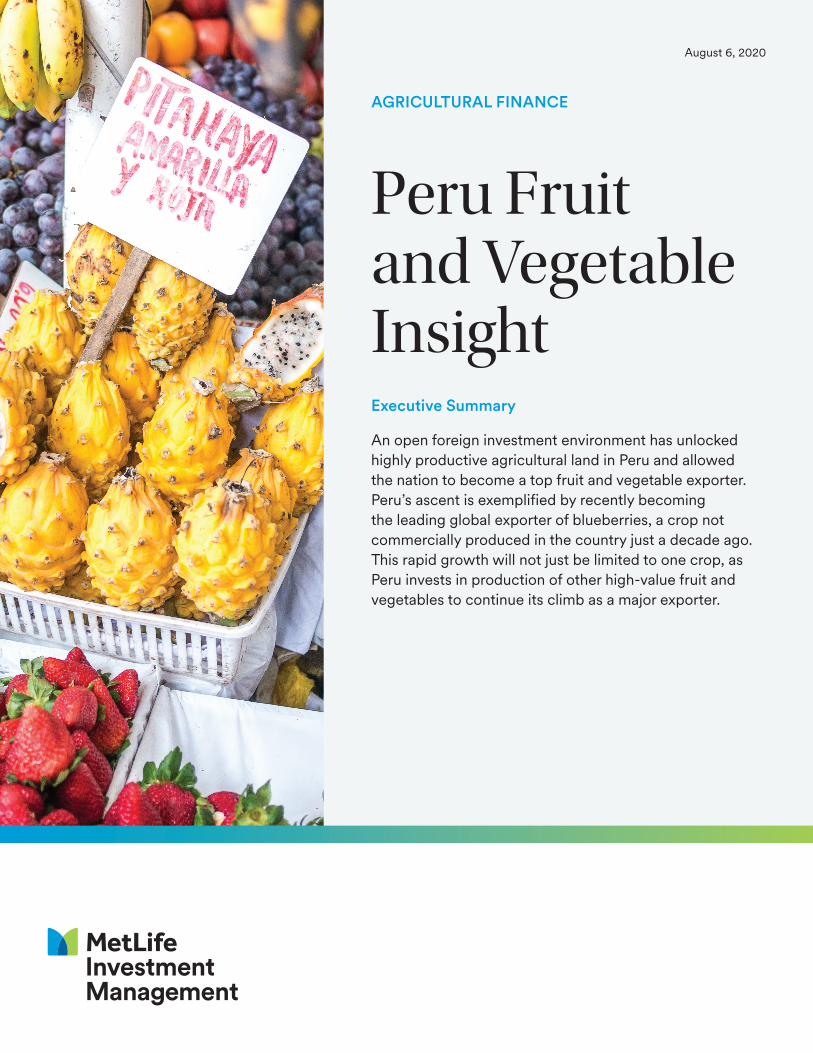
Asparagus production was the first to receive a boost. Asparagus acreage and yields in Peru remained stagnant throughout the 1970s and 1980s. Between 1990 and 2010, Peru’s asparagus acreage tripled while yields increased 68%.5 This trend also occurred across various fruits and vegetables like grapes and onions. As a result, Peru’s fruit and vegetable production has nearly quadrupled since 1990 and exports have soared (Figure 1).6
Buoying production has allowed Peruvian producers to capitalize on growing year-round demand for fruit and vegetables. Simultaneously, Peru pursued free trade agreements to improve the competitiveness of its exports in key markets. Peru currently has free trade agreements with 20 blocs. The U.S. and the European Union account for approximately 76% of Peru’s fruit and vegetable exports (Figure 2).7 Increased Peruvian imports have competed with some producers in these respective areas, but it primarily complements domestic production and fills seasonal supply gaps. These agreements have been vital in growing exports amid burgeoning production in Peru.
The Blueberry BoomExport companies helped improve Peru’s agricultural output and also introduced new crops. In 2009, Peru did not commercially produce blueberries, and the country did not even track production statistics for the commodity. Just ten years later, Peru is the leading global exporter of blueberries,8 valued at approximately $752 million in 2019.
Figure 1 | Peru Fruit and Vegetable Exports (million metric tons)
Source: SUNAT, MIM
Onions Bananas Grapes Asparagus Avocadoes Mangoes Citrus Blueberries
0.0
0.5
1.0
1.5
2.0
2.5
2000 20032002 2004 20052001 2006 2007 2008 2009 2010 2011 2012 2014 2015 2017 20182013 2016 2019
Figure 2 | Destinations for Peru’s Fruit and Vegetable Exports (2014-2018)
Source: Comtrade, MIM
EU38%
China7%
Other East Asia
5%
LatAm6%
Other Nations6%
U.S.38%
MetLife Investment Management | Peru Fruit and Vegetable Insight 3
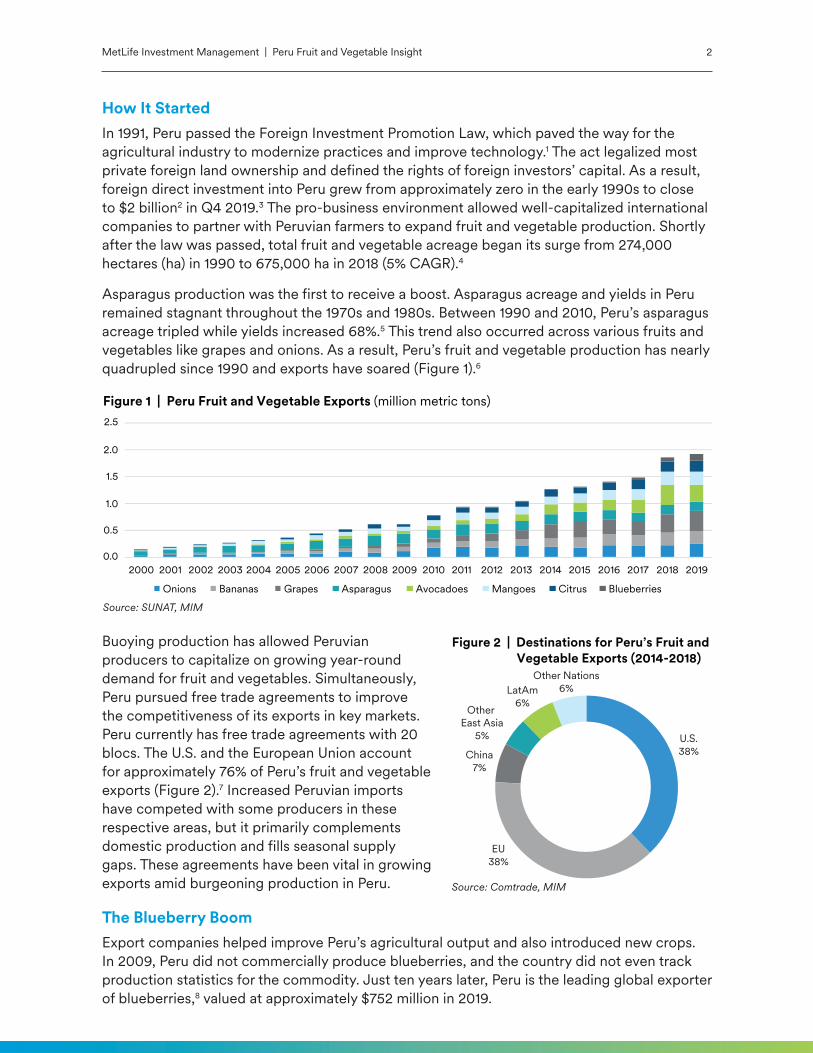
Blueberry production in Peru benefits from strong yields due to ideal growing conditions in the northern coastal region.9 Average blueberry yields in La Libertad—which holds 79% of Peru’s blueberry acreage—are 40% higher than the average yields for top U.S. producers (Figure 3).10 Additionally, wages for agricultural workers in the U.S. are approximately five times higher than in Peru. Labor accounts for approximately 66% of operating costs as harvest is primarily done by hand.11 Therefore, the combination of lower wages and stronger yields promotes wider profit margins for Peruvian blueberry operations.
These efficient growers further enhance profits by focusing on export sales, which command a price premium over the domestic market. With little domestic demand for blueberries in Peru, soaring production fostered blueberry exports climbing from just 44 metric tons (mt) in 2012 to 125,000 mt in 2019. Peru’s Ministry of Agriculture expects blueberry cultivation to grow by about 1,500 hectares per year in the near term, which would represent a 20-25% annual increase in acreage.12 Any acreage growth will translate directly to larger export volumes due to minimal domestic consumption. This rapid increase of blueberry cultivation appears to just be one of many crops Peru plans to significantly expand cultivation of in the coming years.
$10 Billion and BeyondPeru’s farm minister recently stated the goal of reaching $10 billion in agricultural exports by 2021 from $7.5 billion in 2019.13 This achievement appears inevitable as the government has invested significantly in irrigation infrastructure to improve productivity on existing farms and expand arable area. This will further support growth in production of other high-value fruits and vegetables like avocados.
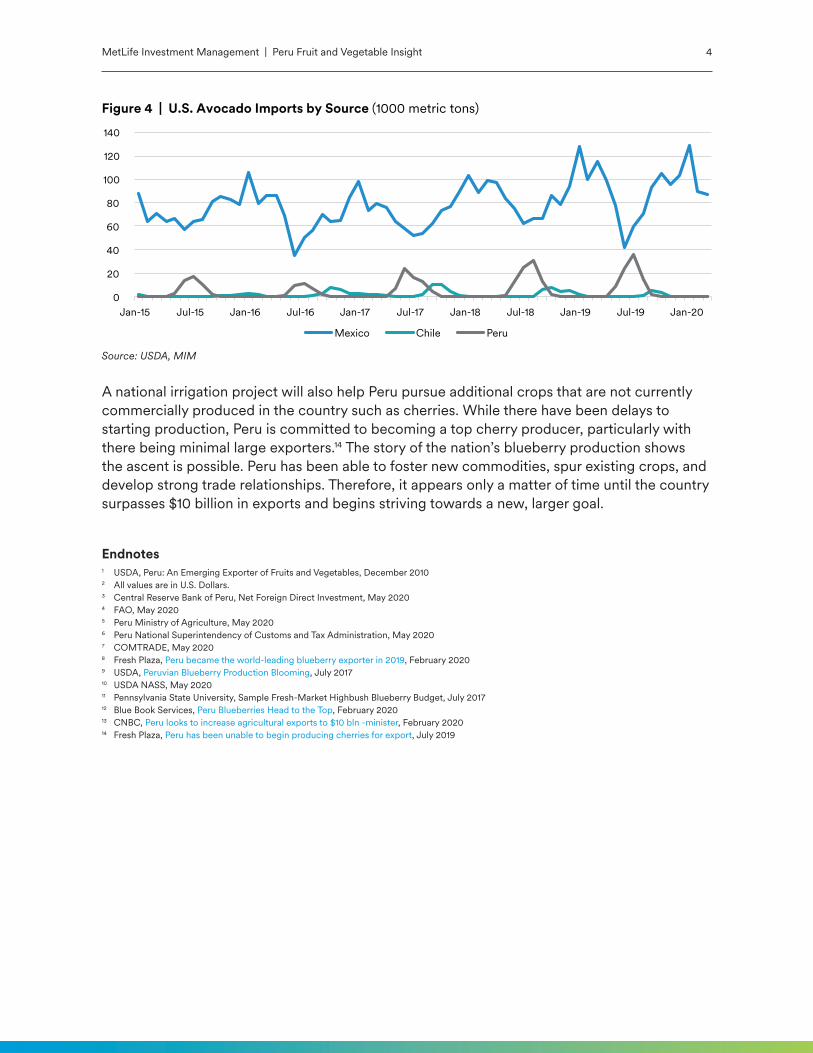
Since 2008, Peru’s avocado production has increased 270%. The farm minister believes that Peru’s avocados could eventually reach similar export sale volumes as Mexico. While Peru’s avocado exports to the U.S. remain a fraction of Mexico’s, volume has increased 78% since 2015. Additionally, Peru targets exports to the U.S. during the Northern Hemisphere summer when Mexico’s volumes are typically lower (Figure 4).
Figure 3 | Comparing Peru and U.S. Blueberry Yields(1000 lbs./acre)
Source: Peru MOA, USDA, MIM
0
5
10
15
20
La Libertad Lambayque Oregon Washington Michigan
Peru U.S.
Peru has been able to foster new commodities, spur existing crops, and develop strong trade relationships.
MetLife Investment Management | Peru Fruit and Vegetable Insight 4
Endnotes1 USDA, Peru: An Emerging Exporter of Fruits and Vegetables, December 20102 All values are in U.S. Dollars.3 Central Reserve Bank of Peru, Net Foreign Direct Investment, May 20204 FAO, May 20205 Peru Ministry of Agriculture, May 20206 Peru National Superintendency of Customs and Tax Administration, May 20207 COMTRADE, May 20208 Fresh Plaza, Peru became the world-leading blueberry exporter in 2019, February 20209 USDA, Peruvian Blueberry Production Blooming, July 201710 USDA NASS, May 202011 Pennsylvania State University, Sample Fresh-Market Highbush Blueberry Budget, July 201712 Blue Book Services, Peru Blueberries Head to the Top, February 202013 CNBC, Peru looks to increase agricultural exports to $10 bln -minister, February 202014 Fresh Plaza, Peru has been unable to begin producing cherries for export, July 2019
A national irrigation project will also help Peru pursue additional crops that are not currently commercially produced in the country such as cherries. While there have been delays to starting production, Peru is committed to becoming a top cherry producer, particularly with there being minimal large exporters.14 The story of the nation’s blueberry production shows the ascent is possible. Peru has been able to foster new commodities, spur existing crops, and develop strong trade relationships. Therefore, it appears only a matter of time until the country surpasses $10 billion in exports and begins striving towards a new, larger goal.
Figure 4 | U.S. Avocado Imports by Source (1000 metric tons)
Source: USDA, MIM
0
20
40
60
80
100
120
140
Jan-15 Jul-15 Jan-16 Jul-16 Jan-17 Jul-17 Jan-18 Jul-18 Jan-19 Jul-19 Jan-20
Mexico Chile Peru

MetLife Investment Management | Peru Fruit and Vegetable Insight 5
Authors
BLAINE NELSONAssociate Director, Agricultural Research & Strategy
Blaine Nelson is an Associate Director on MIM’s Agricultural Research & Strategy team and is responsible for market research and investment strategy development in support of the Agricultural Finance Group. In this role, he produces research publications and agricultural forecasts, and monitors various sectors within the agricultural space. Prior to joining MetLife, Nelson worked with The Atkins Group as an Agricultural Analyst. He earned his M.S. in Agricultural and Consumer Economics at the University of Illinois and holds a B.S. in Applied Economics from the University of Minnesota.
TOM KARMELAssociate Director, Agricultural Research & Strategy
Tom Karmel is an Associate Director on the Agricultural Research & Strategy team. He is responsible for quantitative market analysis to help drive investment strategy for MetLife Investment Management’s agricultural platform. In this role, Tom produces market insights, models agricultural credit conditions, and forecasts commodity prices to support MIM’s agricultural portfolio. Tom earned his M.S. in Agricultural Economics from Purdue University and completed his B.S. in Meteorology from Florida State University.
MICHAEL GUNDERSON, PHDDirector, Agricultural Research & Strategy
Michael Gunderson is Director, Head of Agricultural Research & Strategy. He provides leadership to market analysis of annual and permanent agricultural crops, forest and timberland products, and agribusinesses to help drive investment strategy for MetLife Investment Management. In this role, Mike shares market insights regarding agricultural credit conditions, commodity price forecasts, and industry dynamics to support MIM’s agricultural portfolio. Mike earned his Ph.D. in Agricultural Economics from Purdue University, an M.S. in Agricultural Economics from Cornell University, and a B.S. in Agribusiness, Farm, and Financial Management from the University of Illinois.
Disclosure
This document has been prepared by MetLife Investment Management (“MIM”) solely for informational purposes and does not constitute a recommendation regarding any investments or the provision of any investment advice or the offer or provision of any investment product or service, nor does it constitute or form part of any advertisement of, offer for sale or subscription of, olicitation or invitation of any offer or recommendation to purchase or subscribe for any securities or investment advisory services. The views expressed herein are solely those of MIM and do not necessarily reflect, nor are they necessarily consistent with, the views held by, or the forecasts utilized by, the entities within the MetLife enterprise that provide insurance products, annuities and employee benefit programs. The information and opinions presented or contained in this document are provided as the date it was written. It should be understood that subsequent developments may materially affect the information contained in this document, which none of MIM, its affiliates, advisors or representatives are under an obligation to update, revise or affirm. It is not MIM’s intention to provide, and you may not rely on this document as providing, a recommendation with respect to any particular investment strategy or investment. The information provided herein is neither tax nor legal advice. Investors should speak to their tax professional for specific information regarding their tax situation. Investment involves risk including possible loss of principal. Affiliates of MIM may perform services for, solicit business from, hold long or short positions in, or otherwise be interested in the investments (including derivatives) of any company mentioned herein. This document may contain forward-looking statements, as well as predictions, projections and forecasts of the economy or economic trends of the markets, which are not necessarily indicative of the future. Any or all forward-looking statements, as well as those included in any other material discussed at the presentation, may turn out to be wrong.
metlife.com/ag One MetLife Way | Whippany, New Jersey 07981
L0820006825[exp0822][All States] © 2020 MetLife Services and Solutions, LLC