Embed Size (px)
Citation preview
Agricultural and Farm Classification in the United Kingdom What does classifying farms involve? Farms are classified into groups according to type and size. Sometimes it is useful to classify the purely agricultural component of the farm1, and sometimes it is useful to classify the farm as a whole, which may include other environmental2 and diversified3 activities. This means there is a distinction between classifying Farm Businesses and classifying Agricultural Businesses, as illustrated in the diagram below.
PIGS CROPS
Farm Business: Small, Agriculture only Agricultural Business: Small, Mixed
SHEEP CATTLE MAINTAINS HEDGEROW
Farm Business: Medium, Some Environmental Activities Agricultural Business: Medium, Cattle & Sheep
DAIRY CHEESE-MAKING
Farm Business: Large, Mainly Diversified Activities Agricultural Business: Medium, Dairy
Why are farms classified? Farms are classified to allow analysis of the sector. Grouping together similar farms allows comparisons between results for different groups of farms. Classification systems are designed so that the farms in the same group are as similar as possible and farms in different groups are as different as possible. Because it is not practical to examine each farm individually it would be impossible to carry out meaningful analysis of questions like the following without classification:
Is the number of small farms shrinking? How many pig farms are there in the UK? How will small cattle farms be affected by new government policy? Are large farms more profitable? How diversified are cereal farms?
1 “Agriculture” being the science, art or practice of cultivating the soil, growing crops and raising livestock. 2 “Environmental activities” involving participation in agri-environment schemes 3 “Diversified activities” being non-agricultural activities involving the use of resources previously used by the agricultural business, for example providing facilities for tourists.
Farm Classification using 2000 SGMs and SLR 12/10/2004
There are a variety of users who may want to classify farms in order to present results of research or surveys. However, there are two primary users of the UK farm classification system.
The June Agricultural and Horticultural Census The June Census collects a snapshot of data on agricultural activity by recording the area of different types of crop and numbers of different types of livestock in June of each year. The farm classification system is then used to present results (published, for example, in Agriculture in the United Kingdom).
The Farm Business Survey (England, Wales and Northern Ireland) and
the Farm Accounts Survey (Scotland) The FBS/FAS collects data on costs, outputs, subsidies and investment from a sample of individual farms across the financial year. The farm classification system is used both to present results (published, for example, in Farm Incomes in the UK) and to make sure that the sample is representative of the whole industry and not biased toward a particular type or size of farm.
How does the UK farm classification system work? Four different kinds of classification need to be considered.
A. Classification of Agricultural Businesses by Type B. Classification of Agricultural Businesses by Size C. Classification of Farm Businesses by Type D. Classification of Farm Businesses by Size
A. Classification of Agricultural Businesses by Type Classification of Agricultural Businesses by type is a relatively simple process when only one agricultural enterprise type is present on a farm. However, when more than one enterprise type is present (for example both pigs and poultry), a system is needed for deciding how to classify the resulting Agricultural Business. This means that a system is needed for weighting the relative contributions of different crop or livestock types to the Agricultural Business as a whole. The UK system is based on weighting contributions by the profit associated with them. Standard Gross Margins (SGMs) are calculated per hectare of crops and per head of livestock and used to calculate the standard profit associated with each part of the Agricultural Business. What are SGMs and how are they calculated?
Farm Classification using 2000 SGMs and SLR 12/10/2004
Information on individual margins for each farm is not available, so standard figures for different livestock and crop types are used. SGMs are representative of the level of profit that could be expected on the average farm under “normal” conditions (i.e. no disease outbreaks or adverse weather). Different SGMs are calculated for North England, East England, West England, Wales, Scotland and Northern Ireland to allow for the differences in profit in different areas. SGMs reflect the “gross margin” expected, which means that they reflect the value of output minus the variable costs directly associated with producing that output. Variable costs are costs that vary in approximately direct proportion to the scale of production, for example seed, fertiliser and feed. Until 2004, the SGMS used for classification were based on a three-year average centred on 1988. The SGMs now in use are based on a five-year average centred on 2000. SGMs are based on a five-year average in order to lessen the impact of yearly fluctuations on calculated SGMs. The 2000 SGMs for England can be seen in Annex 1. Some special rules apply to the use of SGMs for particular enterprise types; for England and Wales these rules are also shown in Annex 1. How are Agricultural Businesses classified into different types? Once the numbers of livestock and hectares of crops have been multiplied by the relevant SGMs, a farm is allocated to a type according to where most of its total SGMs come from. A farm is allocated to a particular type when the contribution of a crop or livestock type (or set of crop and livestock types) comprises more than two-thirds of its total SGMs. There are several levels of detail provided for in the classification system; at the simplest and most commonly used level, farms are divided into 10 “robust types” for analysis4:
1. Cereals 2. General cropping 3. Horticulture 4. Specialist Pigs 5. Specialist Poultry 6. Dairy 7. LFA Grazing Livestock 8. Lowland Grazing Livestock 9. Mixed 10. Other (including Non-classifiable)
4 The key changes to the system made in 2004 were: the separation of Specialist Pigs and Specialist Poultry into two different robust types, the extension of Cattle and Sheep types to include other grazing livestock (inc. goats and deer), the allocation of Specialist Mushroom farms to Horticulture instead of Other, and the separation of main type Specialist Hardy Nursery Stock from main type Other Horticulture.
Farm Classification using 2000 SGMs and SLR 12/10/2004
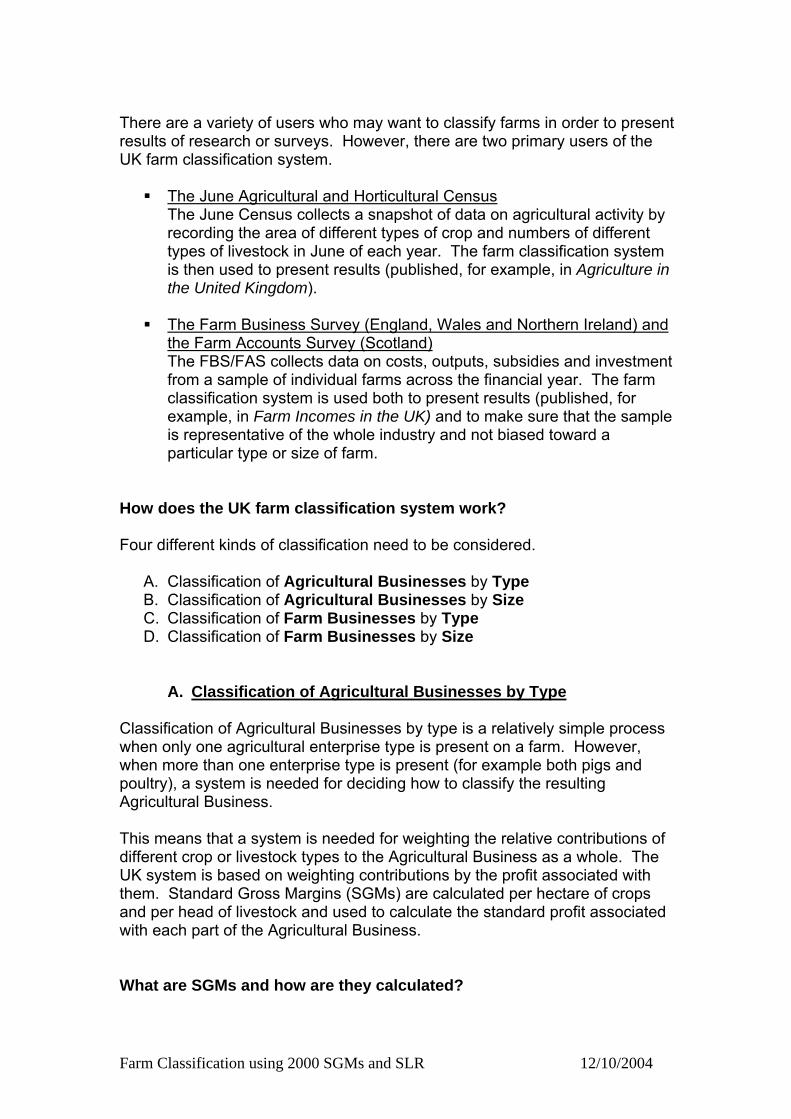
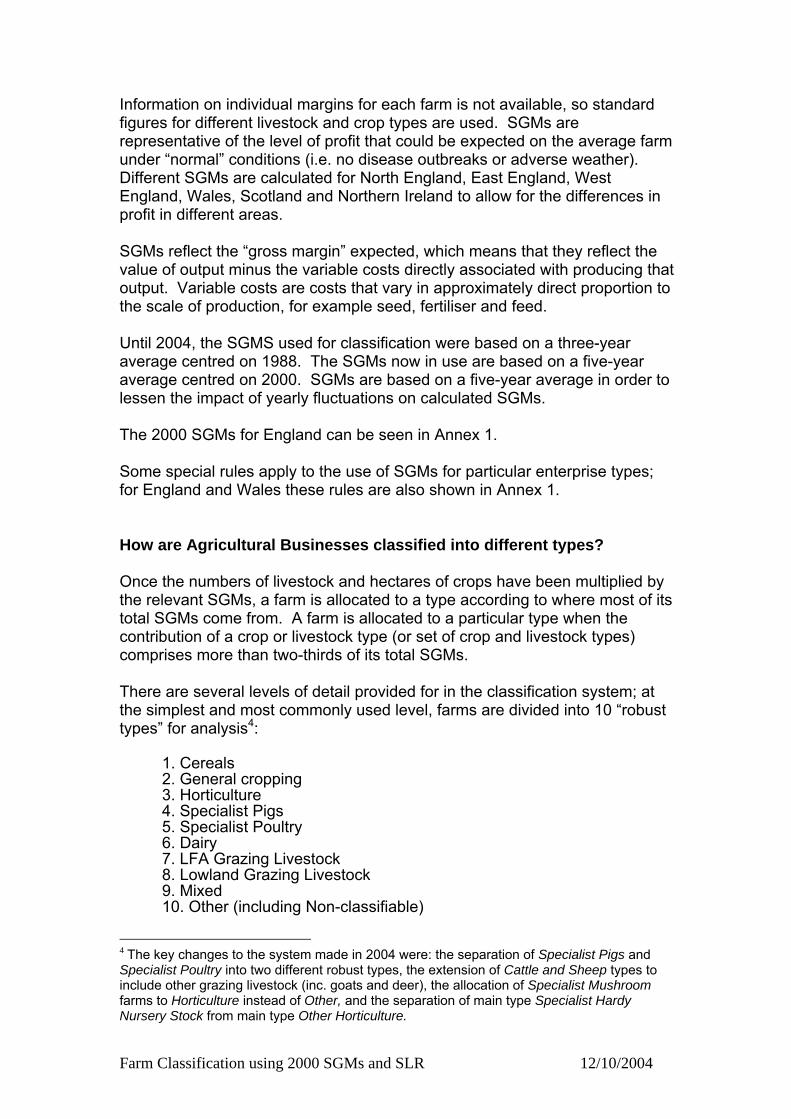
SGMs
CATTLE DAIRY
TA TtfS
FdttoSat W Iaeftae
F
Agricultural Business Robust Type: Dairy (>2/3 SGMs come from dairy)
PIGS CEREALS
Agricultural Business Robust Type: Mixed (neither accounts for >2/3 SGMs)
POULTRY SHEEP CATTLE
Agricultural Business Robust Type: Lowland Grazing Livestock (Cattle + Sheep > 2/3 SGMs)
he different Agricultural Business Types and their characteristics are listed in nnex 2.
he UK classification system for Agricultural Business Types is closely related o the Eurostat method used at EU-level, but there is a slightly different list of arm types to reflect UK agriculture, and a slightly different set of calculated GMs is used.
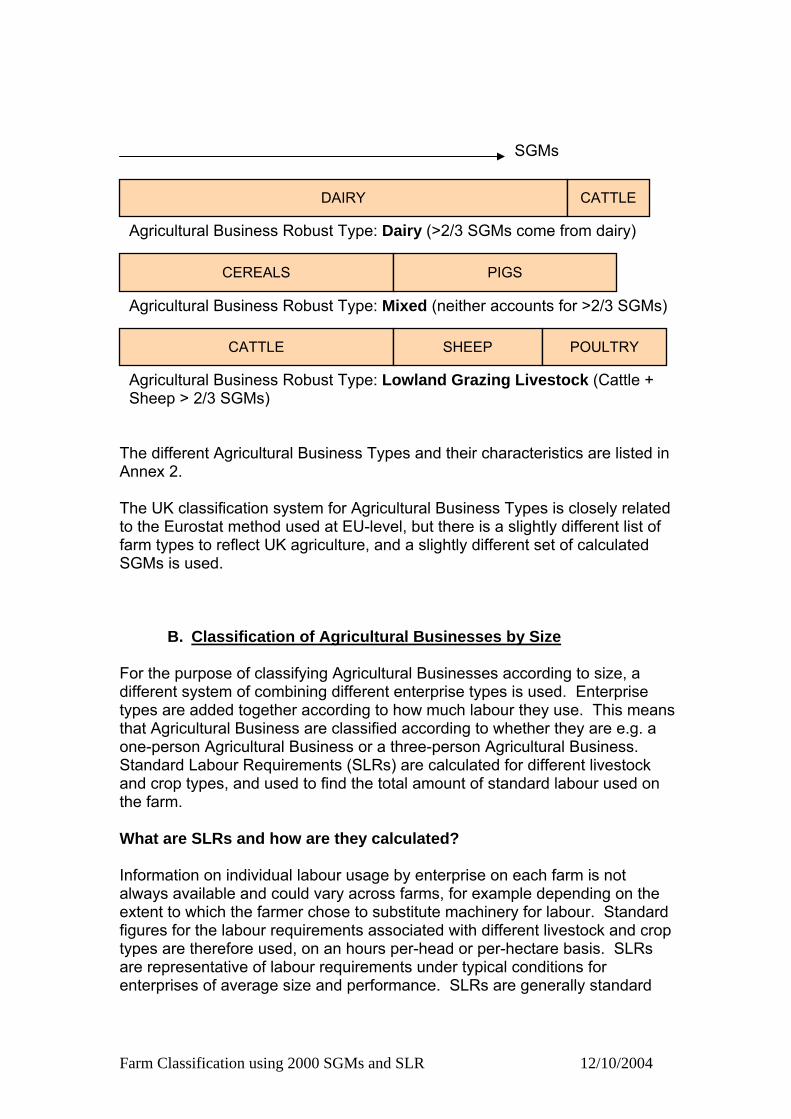
B. Classification of Agricultural Businesses by Size
or the purpose of classifying Agricultural Businesses according to size, a ifferent system of combining different enterprise types is used. Enterprise
ypes are added together according to how much labour they use. This means hat Agricultural Business are classified according to whether they are e.g. a ne-person Agricultural Business or a three-person Agricultural Business. tandard Labour Requirements (SLRs) are calculated for different livestock nd crop types, and used to find the total amount of standard labour used on he farm.
hat are SLRs and how are they calculated?
nformation on individual labour usage by enterprise on each farm is not lways available and could vary across farms, for example depending on the xtent to which the farmer chose to substitute machinery for labour. Standard
igures for the labour requirements associated with different livestock and crop ypes are therefore used, on an hours per-head or per-hectare basis. SLRs re representative of labour requirements under typical conditions for nterprises of average size and performance. SLRs are generally standard
arm Classification using 2000 SGMs and SLR 12/10/2004
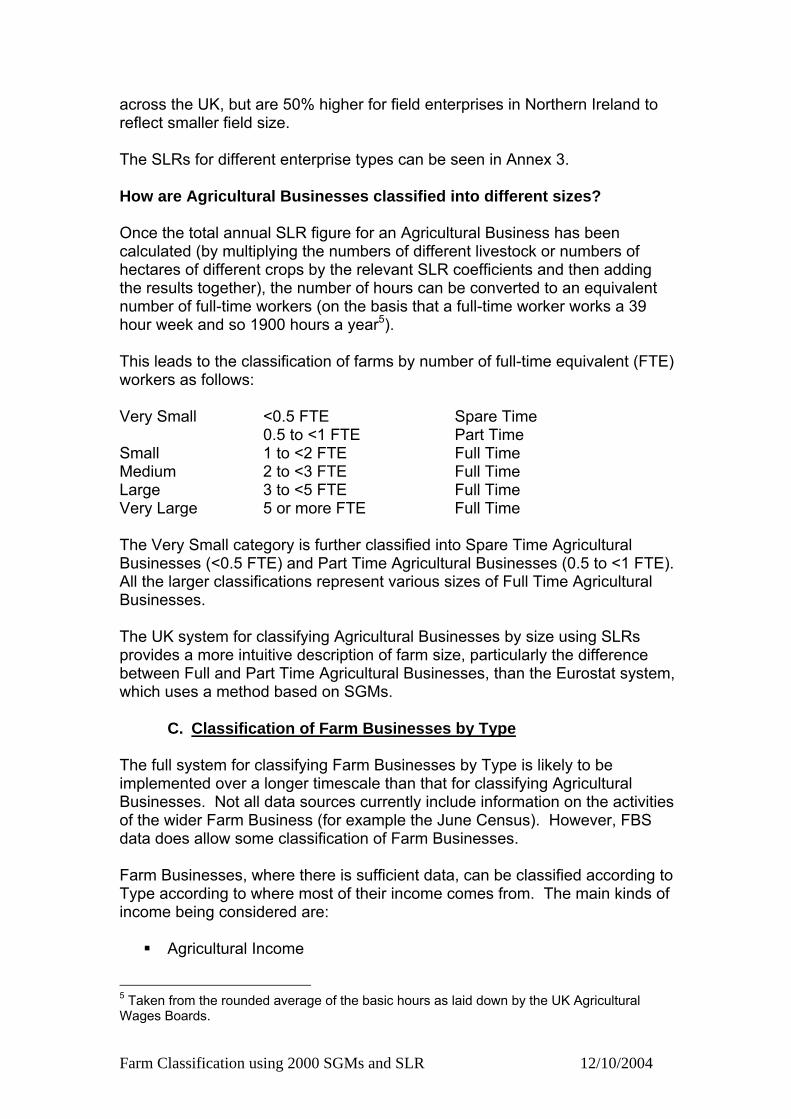
across the UK, but are 50% higher for field enterprises in Northern Ireland to reflect smaller field size. The SLRs for different enterprise types can be seen in Annex 3. How are Agricultural Businesses classified into different sizes? Once the total annual SLR figure for an Agricultural Business has been calculated (by multiplying the numbers of different livestock or numbers of hectares of different crops by the relevant SLR coefficients and then adding the results together), the number of hours can be converted to an equivalent number of full-time workers (on the basis that a full-time worker works a 39 hour week and so 1900 hours a year5). This leads to the classification of farms by number of full-time equivalent (FTE) workers as follows: Very Small <0.5 FTE Spare Time
0.5 to <1 FTE Part Time Small 1 to <2 FTE Full Time Medium 2 to <3 FTE Full Time Large 3 to <5 FTE Full Time Very Large 5 or more FTE Full Time The Very Small category is further classified into Spare Time Agricultural Businesses (<0.5 FTE) and Part Time Agricultural Businesses (0.5 to <1 FTE). All the larger classifications represent various sizes of Full Time Agricultural Businesses. The UK system for classifying Agricultural Businesses by size using SLRs provides a more intuitive description of farm size, particularly the difference between Full and Part Time Agricultural Businesses, than the Eurostat system, which uses a method based on SGMs.
C. Classification of Farm Businesses by Type The full system for classifying Farm Businesses by Type is likely to be implemented over a longer timescale than that for classifying Agricultural Businesses. Not all data sources currently include information on the activities of the wider Farm Business (for example the June Census). However, FBS data does allow some classification of Farm Businesses. Farm Businesses, where there is sufficient data, can be classified according to Type according to where most of their income comes from. The main kinds of income being considered are:
Agricultural Income
5 Taken from the rounded average of the basic hours as laid down by the UK Agricultural Wages Boards.
Farm Classification using 2000 SGMs and SLR 12/10/2004
Environmental Income (arising from membership of Agri-environment schemes)
Income from Diversification Income from Other Gainful Activity (including off-farm employment)
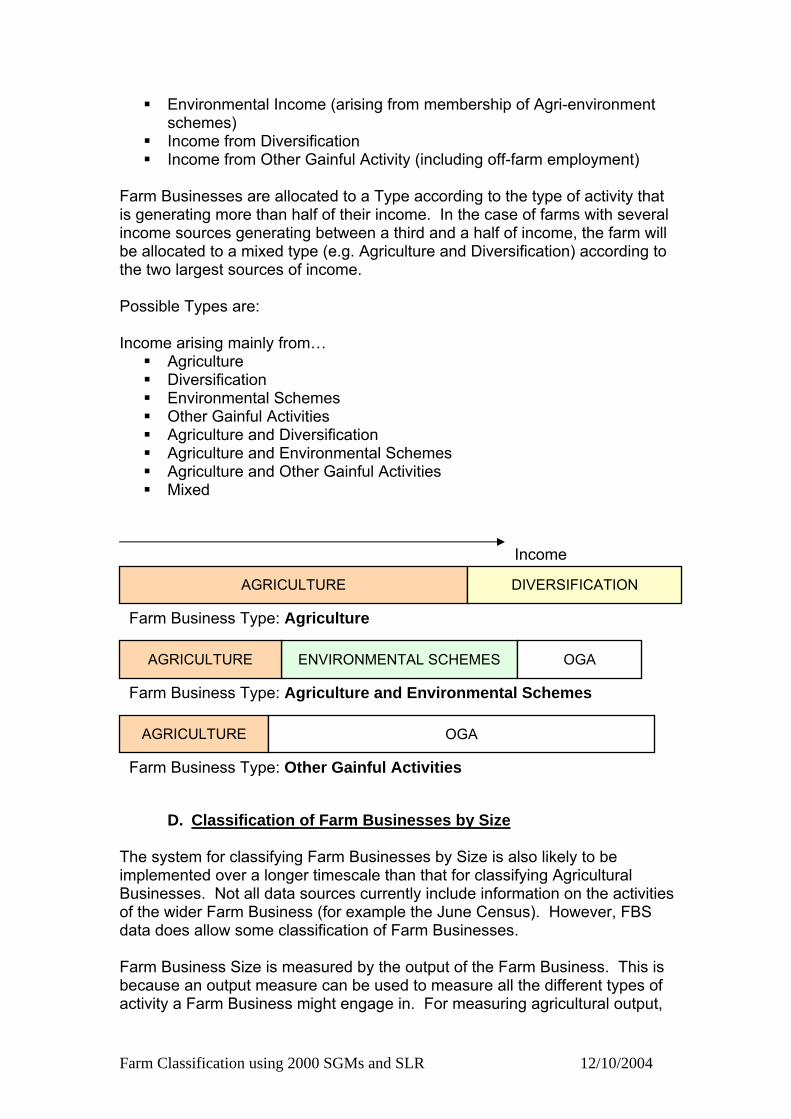
Farm Businesses are allocated to a Type according to the type of activity that is generating more than half of their income. In the case of farms with several income sources generating between a third and a half of income, the farm will be allocated to a mixed type (e.g. Agriculture and Diversification) according to the two largest sources of income. Possible Types are: Income arising mainly from…
Agriculture Diversification Environmental Schemes Other Gainful Activities Agriculture and Diversification Agriculture and Environmental Schemes Agriculture and Other Gainful Activities Mixed
Income
DIVERSIFICATION AGRICULTURE
Farm Business Type: Agriculture
OGA AGRICULTURE ENVIRONMENTAL SCHEMES
Farm Business Type: Agriculture and Environmental Schemes
OGA AGRICULTURE
Farm Business Type: Other Gainful Activities
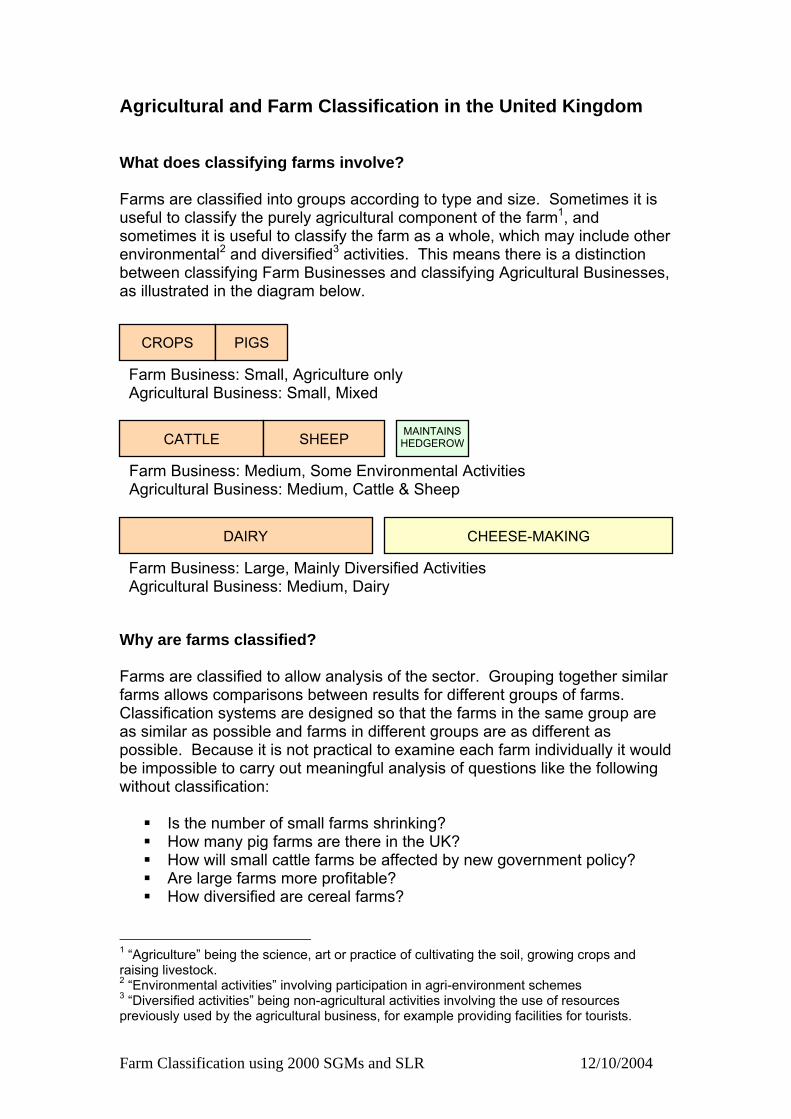
D. Classification of Farm Businesses by Size The system for classifying Farm Businesses by Size is also likely to be implemented over a longer timescale than that for classifying Agricultural Businesses. Not all data sources currently include information on the activities of the wider Farm Business (for example the June Census). However, FBS data does allow some classification of Farm Businesses. Farm Business Size is measured by the output of the Farm Business. This is because an output measure can be used to measure all the different types of activity a Farm Business might engage in. For measuring agricultural output,
Farm Classification using 2000 SGMs and SLR 12/10/2004
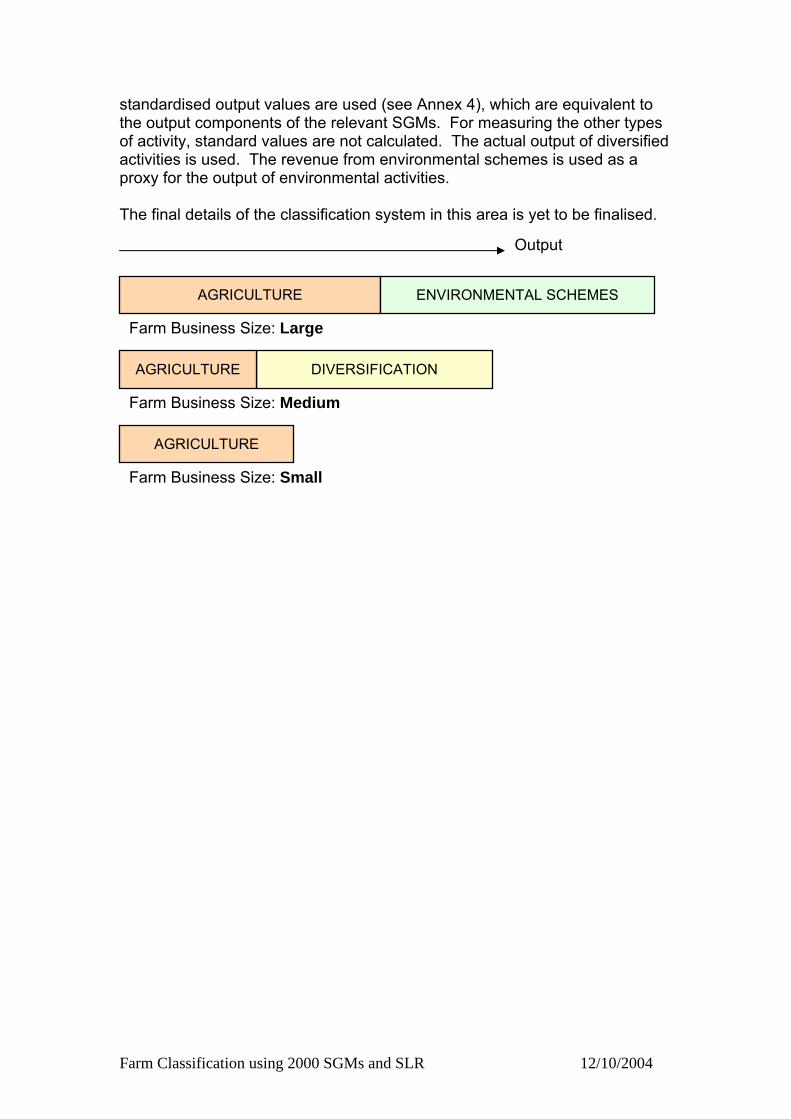
standardised output values are used (see Annex 4), which are equivalent to the output components of the relevant SGMs. For measuring the other types of activity, standard values are not calculated. The actual output of diversified activities is used. The revenue from environmental schemes is used as a proxy for the output of environmental activities. The final details of the classification system in this area is yet to be finalised.
Output
ENVIRONMENTAL SCHEMES AGRICULTURE
Farm Business Size: Large
AGRICULTURE DIVERSIFICATION
Farm Business Size: Medium
AGRICULTURE
Farm Business Size: Small
Farm Classification using 2000 SGMs and SLR 12/10/2004
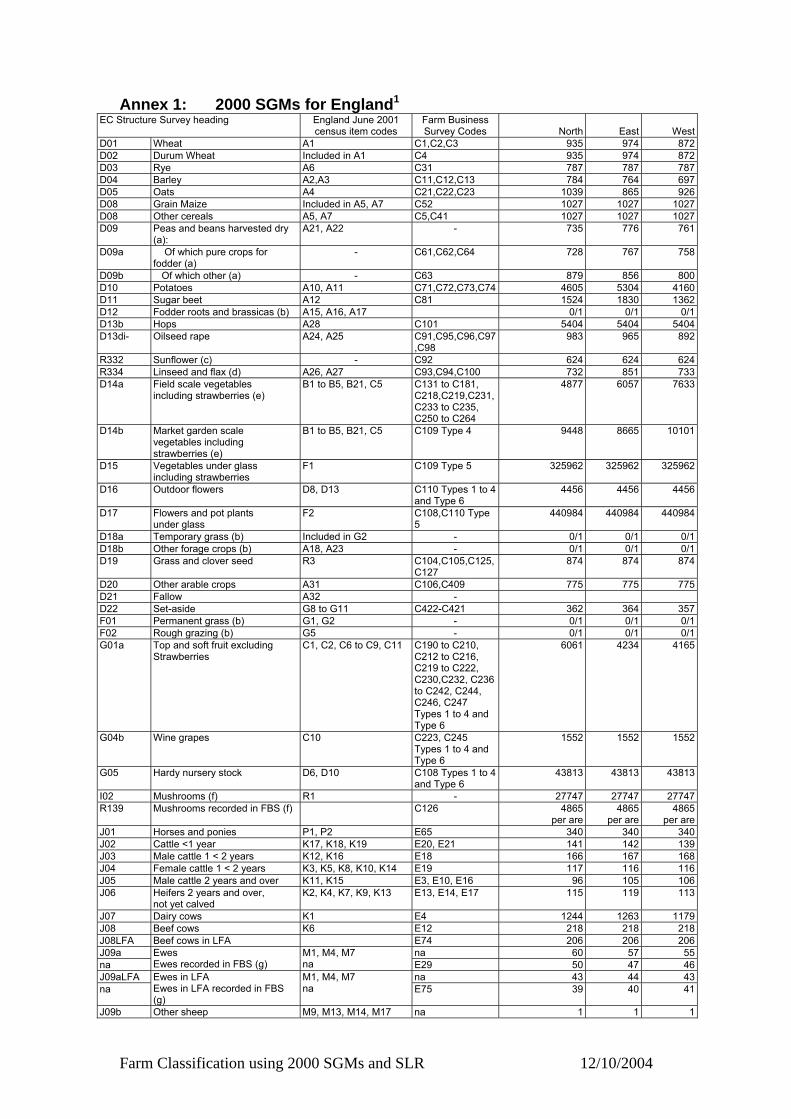
Annex 1: 2000 SGMs for England1
EC Structure Survey heading England June 2001 census item codes
Farm Business Survey Codes
North
East West
D01 Wheat A1 C1,C2,C3 935 974 872D02 Durum Wheat Included in A1 C4 935 974 872D03 Rye A6 C31 787 787 787D04 Barley A2,A3 C11,C12,C13 784 764 697D05 Oats A4 C21,C22,C23 1039 865 926D08 Grain Maize Included in A5, A7 C52 1027 1027 1027D08 Other cereals A5, A7 C5,C41 1027 1027 1027D09 Peas and beans harvested dry
(a): A21, A22 - 735 776 761
D09a Of which pure crops for fodder (a)
- C61,C62,C64 728 767 758
D09b Of which other (a) - C63 879 856 800D10 Potatoes A10, A11 C71,C72,C73,C74 4605 5304 4160D11 Sugar beet A12 C81 1524 1830 1362D12i Fodder roots and brassicas (b) A15, A16, A17 0/1 0/1 0/1D13b Hops A28 C101 5404 5404 5404D13di- Oilseed rape A24, A25 C91,C95,C96,C97
,C98 983 965 892
R332 Sunflower (c) - C92 624 624 624R334 Linseed and flax (d) A26, A27 C93,C94,C100 732 851 733D14a Field scale vegetables
including strawberries (e) B1 to B5, B21, C5 C131 to C181,
C218,C219,C231,C233 to C235, C250 to C264
4877 6057 7633
D14b Market garden scale vegetables including strawberries (e)
B1 to B5, B21, C5 C109 Type 4 9448 8665 10101
D15 Vegetables under glass including strawberries
F1 C109 Type 5 325962 325962 325962
D16 Outdoor flowers D8, D13 C110 Types 1 to 4 and Type 6
4456 4456 4456
D17 Flowers and pot plants under glass
F2 C108,C110 Type 5
440984 440984 440984
D18a Temporary grass (b) Included in G2 - 0/1 0/1 0/1D18b Other forage crops (b) A18, A23 - 0/1 0/1 0/1D19 Grass and clover seed R3 C104,C105,C125,
C127 874 874 874
D20 Other arable crops A31 C106,C409 775 775 775D21 Fallow A32 - D22 Set-aside G8 to G11 C422-C421 362 364 357F01 Permanent grass (b) G1, G2 - 0/1 0/1 0/1F02 Rough grazing (b) G5 - 0/1 0/1 0/1G01a Top and soft fruit excluding
Strawberries C1, C2, C6 to C9, C11 C190 to C210,
C212 to C216, C219 to C222, C230,C232, C236 to C242, C244, C246, C247 Types 1 to 4 and Type 6
6061 4234 4165
G04b Wine grapes C10 C223, C245 Types 1 to 4 and Type 6
1552 1552 1552
G05 Hardy nursery stock D6, D10 C108 Types 1 to 4 and Type 6
43813 43813 43813
I02 Mushrooms (f) R1 - 27747 27747 27747R139 Mushrooms recorded in FBS (f) C126 4865
per are 4865
per are 4865
per areJ01 Horses and ponies P1, P2 E65 340 340 340J02 Cattle <1 year K17, K18, K19 E20, E21 141 142 139J03 Male cattle 1 < 2 years K12, K16 E18 166 167 168J04 Female cattle 1 < 2 years K3, K5, K8, K10, K14 E19 117 116 116J05 Male cattle 2 years and over K11, K15 E3, E10, E16 96 105 106J06 Heifers 2 years and over,
not yet calved K2, K4, K7, K9, K13 E13, E14, E17 115 119 113
J07 Dairy cows K1 E4 1244 1263 1179J08 Beef cows K6 E12 218 218 218J08LFA Beef cows in LFA E74 206 206 206J09a na 60 57 55na
Ewes Ewes recorded in FBS (g)
M1, M4, M7 na E29 50 47 46
J09aLFA na 43 44 43na
Ewes in LFA Ewes in LFA recorded in FBS (g)
M1, M4, M7 na E75 39 40 41
J09b Other sheep M9, M13, M14, M17 na 1 1 1
Farm Classification using 2000 SGMs and SLR 12/10/2004
na Other sheep recorded in FBS (h)
na E28, E32, E34, E35,
8 8 8
J09bLFA na 1 1 1na
Other sheep in LFA Other sheep in LFA recorded in FBS (h)
M9, M13, M14, M17 na E28, E32, E34,
E35 4 4 3
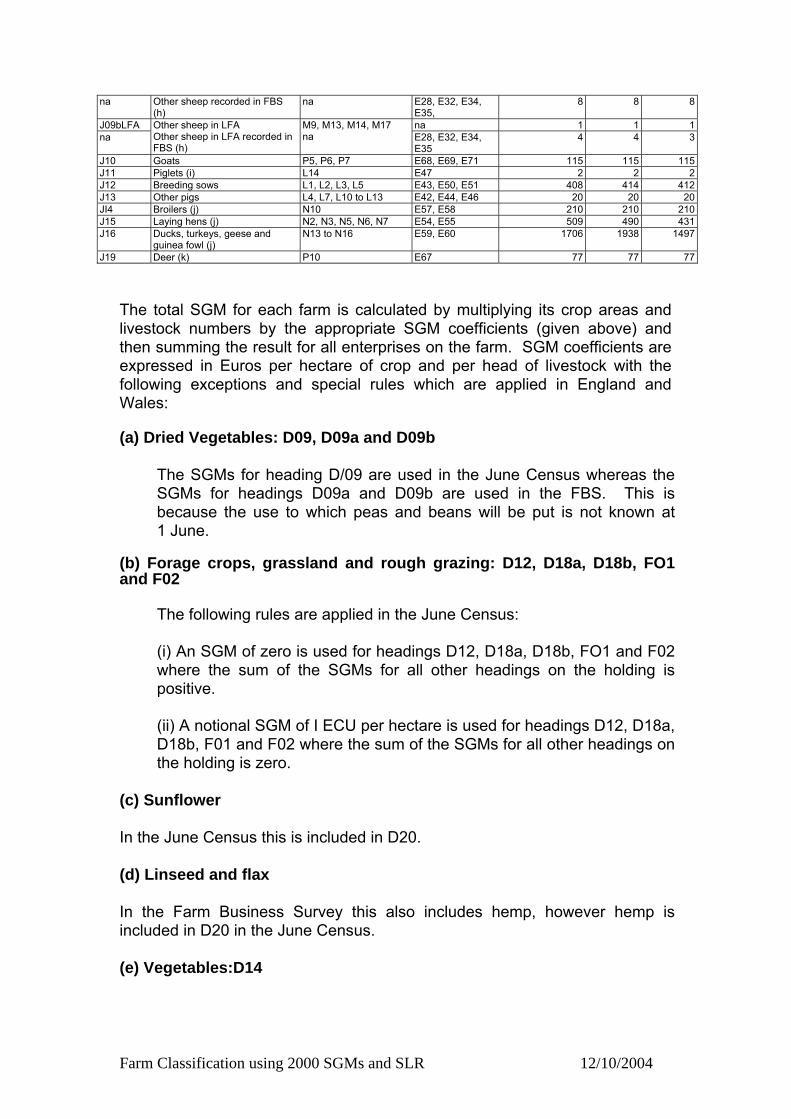
J10 Goats P5, P6, P7 E68, E69, E71 115 115 115J11 Piglets (i) L14 E47 2 2 2J12 Breeding sows L1, L2, L3, L5 E43, E50, E51 408 414 412J13 Other pigs L4, L7, L10 to L13 E42, E44, E46 20 20 20JI4 Broilers (j) N10 E57, E58 210 210 210J15 Laying hens (j) N2, N3, N5, N6, N7 E54, E55 509 490 431J16 Ducks, turkeys, geese and
guinea fowl (j) N13 to N16 E59, E60 1706 1938 1497
J19 Deer (k) P10 E67 77 77 77
The total SGM for each farm is calculated by multiplying its crop areas and livestock numbers by the appropriate SGM coefficients (given above) and then summing the result for all enterprises on the farm. SGM coefficients are expressed in Euros per hectare of crop and per head of livestock with the following exceptions and special rules which are applied in England and Wales: (a) Dried Vegetables: D09, D09a and D09b
The SGMs for heading D/09 are used in the June Census whereas the SGMs for headings D09a and D09b are used in the FBS. This is because the use to which peas and beans will be put is not known at 1 June.
(b) Forage crops, grassland and rough grazing: D12, D18a, D18b, FO1 and F02
The following rules are applied in the June Census:
(i) An SGM of zero is used for headings D12, D18a, D18b, FO1 and F02 where the sum of the SGMs for all other headings on the holding is positive. (ii) A notional SGM of I ECU per hectare is used for headings D12, D18a, D18b, F01 and F02 where the sum of the SGMs for all other headings on the holding is zero.
(c) Sunflower In the June Census this is included in D20. (d) Linseed and flax In the Farm Business Survey this also includes hemp, however hemp is included in D20 in the June Census. (e) Vegetables:D14
Farm Classification using 2000 SGMs and SLR 12/10/2004
In the June Census vegetable crops grown in the open (census items B1 to B5, B21 and C5) should be divided between headings D14a (field scale vegetables) and D14b (market garden scale vegetables) in accordance with the following rules:
(i) Where vegetable crops are grown on a holding with other field crops (defined as crops in regrouping code P1*) they should all be allocated to D14a (ii) Otherwise they should be allocated to D14b
(f) Mushrooms: I02 and R139
The coefficients for mushrooms are applied per are (100 square metres). Care needs to be taken in their application because the areas to which they are applied are recorded in hectares for both the Structure Survey and the FBS. Note also that data for mushrooms are not collected in the June Census but in the Mushroom Production Survey. This records the annual weight of compost used and the production system employed. These data are then converted in a production area in hectares for Structure Survey purposes using conversion factors, to which the SGM for heading I02 is applied. The production area represents the effective growing surface area (beds, trays, bags, blocks or similar) which is/will be used during the year. If it is used more than once the area is still counted once only. In contrast the FBS records the total area of all successive crops (i.e. the basic area multiplied by the number of complete harvests) in square metres to which the SGM for heading R139 is applied.
(g) Ewes: J/09a
For the census the SGM for ewes represents the gross margin from a normal breeding flock producing finished lambs, store lambs and ewe lambs for future replacements. For the FBS the SGM for ewes represent the gross margin from a hypothetical breeding flock producing store lambs and ewe lambs for future replacements only. It does not include the gross margin from finishing store lambs. This minimises the risk of ignoring the gross margin from finishing stores on holdings where store lambs are bought in for finishing in addition to those from the normal breeding flock or where there is no breeding flock at all The SGM is comprised of gross margins for the following two categories weighted together according to the populations recorded in the three EU regions of England at the June census: (i) ewes and shearlings kept for breeding, including those intended for slaughter, (ii) female sheep (1
Farm Classification using 2000 SGMs and SLR 12/10/2004
year and over) not yet used for breeding, already put or to be put to the ram in the year of the census (and hence due to join the breeding flock within 12 months from the June census date).
(h) Other sheep: J/09b For the census the SGM for other sheep represents a weighted average of the gross margin for the following categories of sheep:
i. Finishing of male and female sheep one year and over ii. All lambs under one year iii. Rams
June census populations of the above categories are used to weight the gross margins together. Lambs under one year and rams are given a gross margin of zero because the gross margin attributable to them is included in that for ewes. Because of the small number of male and female sheep over one year which are finished, the weighted average gross margin for the three categories is very low and is rounded up to 1 Euro. For the FBS the SGM for other sheep represents a weighted average of the gross margins for the following categories of sheep:
i. Finishing of male and female sheep one year and over ii. All lambs under one year (taken from store to finishing) iii. Ewe lambs under one year for future replacements iv. Rams
The gross margins for the above are weighted together on the basis of June census populations that are adjusted upwards for all categories other than rams. The adjustments are to allow for the fact that when used in FBS typology, the SGM’s are applied to the average annual numbers, not June census numbers. For the gross margin for lambs under one year (categories ii and iii above) the value of the incoming store lamb is based on the average values of store lambs which were used within the FBS SGM for ewes described above. This means that the gross margin for other sheep is consistent with that for ewes and therefore avoids double counting. Once again the gross margin of rams is taken as zero. The different approach used to calculate the SGM for census based typology and FBS based typology means that the other sheep SGM for the FBS is higher in value than that for the census. This reflects the fact that when it is calculated, it is based on higher populations for all categories (other than rams) and the component gross margins (other than rams) each contain more added value.
Farm Classification using 2000 SGMs and SLR 12/10/2004
(i) Piglets: J11
Piglets (census item L14) are taken into account only when there are no breeding sows (census items L1, L2, L3 and L5) on the holding. Thus if the sum of the June census items comprising breeding sows is zero, then the coefficient of 2 for piglets should be applied to the June census numbers. On the other hand, if the sum of the June census items comprising breeding sows is greater than zero, then no SGM coefficient is applied to the June census numbers of piglets.
(j) Fowls and other poultry: J14, J15 and J16
The coefficients for fowls and other poultry (census items N2, N3, N5, N6, N7, N10 and N13 to N16) are applied per 100 birds.
(k) Deer J19
Deer (census item P10) do not form part of the EU typology but for UK purposes are included in regrouping code P4*.
* Regrouping code: see the consolidated version of Commission Decision 85/377/EEC including amendments introduced in Commission Decisions 94/376/EC, 96/393/EC and 99/725/EC, Annex II part C I Codes regrouping several characteristics included in the 1999/2000 Farm Structure Survey.
Farm Classification using 2000 SGMs and SLR 12/10/2004
Annex 2: Agricultural Business types Robust Types:
1. Cereals Holdings on which cereals and other crops generally found in cereal rotations (e.g. oilseeds, peas and beans harvested dry and land set-aside) account for more than two thirds of their total SGM. These crops are all harvested with a combine harvester, are readily interchangeable with little impact on the capital and labour required and constitute a relatively homogenous group. Holdings on which land set-aside accounts for more than two thirds of their total SGM - specialist set-aside holdings - are excluded from this type and included in the other robust type.
2. General cropping Holdings on which arable crops (including field scale vegetables) account for more than two thirds of their total SGM excluding holdings classified as cereals; holdings on which a mixture of arable and horticultural crops account for more than two thirds of their total SGM excluding holdings classified as horticulture and holdings on which arable crops account for more than one third of their total SGM and no other grouping accounts for more than one third. 3. Horticulture Holdings on which fruit (including vineyards), hardy nursery stock, glasshouse flowers and vegetables, market garden scale vegetables, outdoor bulbs and flowers, and mushrooms account for more than two thirds of their total SGM. 4. Specialist Pigs Holdings on which pigs account for more than two thirds of their total SGM. 5. Specialist Poultry Holdings on which Poultry account for more than two thirds of their total SGM. 6. Dairy Holdings on which dairy cows account for more than two thirds of their total SGM. A holding is classified as a Less Favoured Area (LFA) holding if 50 percent or more of its total area is in the LFA and a lowland holding if less than 50 per cent of its total area is in the LFA.
7. LFA Grazing Livestock Holdings on which cattle, sheep and other grazing livestock account for more than two thirds of their total SGM except holdings classified as dairy. A holding is classified as a Less Favoured Area (LFA) holding if 50 per cent or more of its total area is in the LFA. Of holdings classified as LFA, those whose LFA land is wholly or mainly (50 per cent or more) in the Severely Disadvantaged Area (SDA) are classified as SDA; those
Farm Classification using 2000 SGMs and SLR 12/10/2004
whose LFA land is wholly or mainly (more than 50 per cent) in the Disadvantaged Area (DA) are classified as DA.
8. Lowland Grazing Livestock Holdings on which cattle, sheep and other grazing livestock account for more than two thirds of their total SGM except holdings classified as dairy. A holding is classified as lowland if less than 50 per cent of its total area is in the LFA. 9. Mixed Holdings in which none of the above categories is responsible for more than 2/3 of SGMs. This category includes mixed pigs and poultry farms as well as farms with a mixture of crops and livestock (where neither accounts for more than 2/3 of SGMs).
10. Other (including Non-classifiable) Holdings which either do not fit in well with mainstream agriculture, such as specialist horses, or which are of limited economic importance, such as specialist set-aside, specialist grass and forage and non-classifiable holdings. Specialist grass and forage holdings are holdings consisting only of fodder crops, or only of grass or rough grazing and having no livestock. Non classifiable farms are farms that fit into none of the above categories. Non classifiable holdings are holdings consisting of fallow or buildings and other areas only, for which no SGM coefficients are calculated.
Farm Classification using 2000 SGMs and SLR 12/10/2004
1. Ce 1 Ce [1312] reals reals
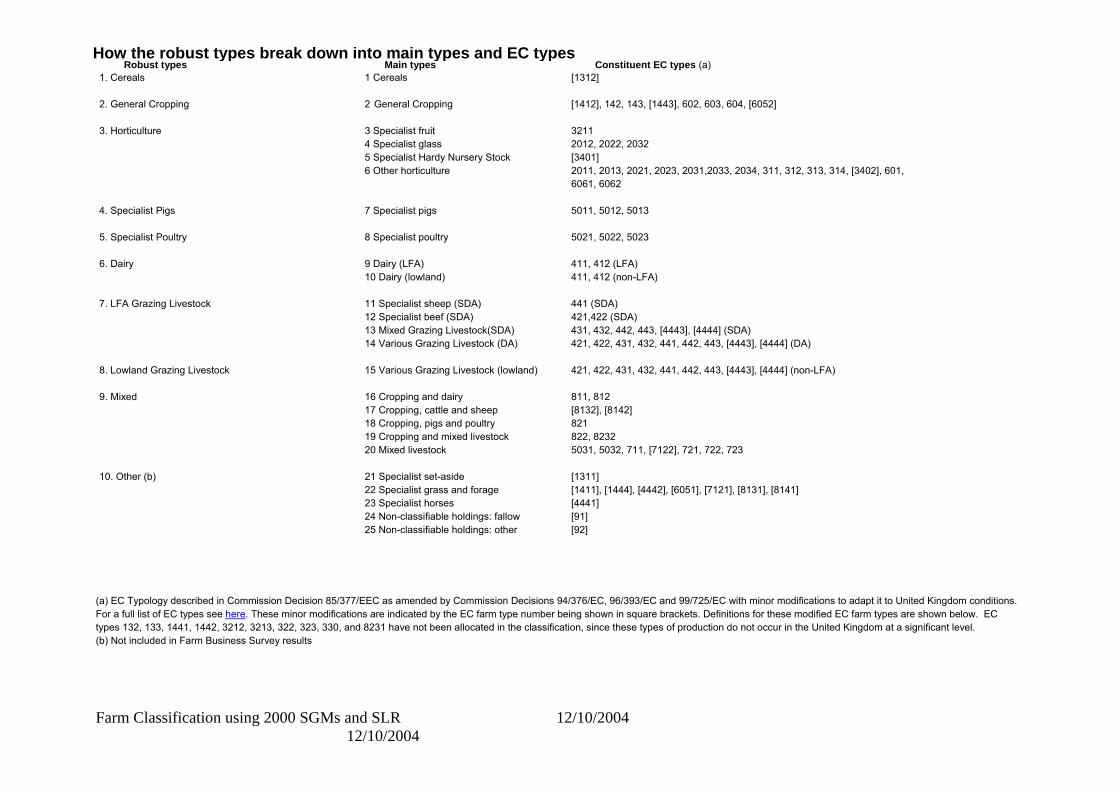
Robust types Main types Constituent EC types (a) How the robust types break down into main types and EC types
2. General Cropping 2 General Cropping [1412], 142, 143, [1443], 602, 603, 604, [6052] 3. Horticulture 3 Specialist fruit 3211 4 Specialist glass 2012, 2022, 2032 5 Specialist Hardy Nursery Stock [3401] 6 Other horticulture 2011, 2013, 2021, 2023, 2031,2033, 2034, 311, 312, 313, 314, [3402], 601, 6061, 6062 4. Specialist Pigs 7 Specialist pigs 5011, 5012, 5013 5. Specialist Poultry 8 Specialist poultry 5021, 5022, 5023 6. Dairy 9 Dairy (LFA) 411, 412 (LFA) 10 Dairy (lowland) 411, 412 (non-LFA) 7. LFA Grazing Livestock 11 Specialist sheep (SDA) 441 (SDA) 12 Specialist beef (SDA) 421,422 (SDA) 13 Mixed Grazing Livestock(SDA) 431, 432, 442, 443, [4443], [4444] (SDA) 14 Various Grazing Livestock (DA) 421, 422, 431, 432, 441, 442, 443, [4443], [4444] (DA) 8. Lowland Grazing Livestock 15 Various Grazing Livestock (lowland) 421, 422, 431, 432, 441, 442, 443, [4443], [4444] (non-LFA) 9. Mixed 16 Cropping and dairy 811, 812 17 Cropping, cattle and sheep [8132], [8142] 18 Cropping, pigs and poultry 821 19 Cropping and mixed livestock 822, 8232 20 Mixed livestock 5031, 5032, 711, [7122], 721, 722, 723 10. Other (b) 21 Specialist set-aside [1311] 22 Specialist grass and forage [1411], [1444], [4442], [6051], [7121], [8131], [8141] 23 Specialist horses [4441] 24 Non-classifiable holdings: fallow [91] 25 Non-classifiable holdings: other [92]
(a) EC Typology described in Commission Decision 85/377/EEC as amended by Commission Decisions 94/376/EC, 96/393/EC and 99/725/EC with minor modifications to adapt it to United Kingdom conditions. For a full list of EC types see here. These minor modifications are indicated by the EC farm type number being shown in square brackets. Definitions for these modified EC farm types are shown below. EC types 132, 133, 1441, 1442, 3212, 3213, 322, 323, 330, and 8231 have not been allocated in the classification, since these types of production do not occur in the United Kingdom at a significant level. (b) Not included in Farm Business Survey results
Farm Classification using 2000 SGMs and SLR 12/10/2004 12/10/2004
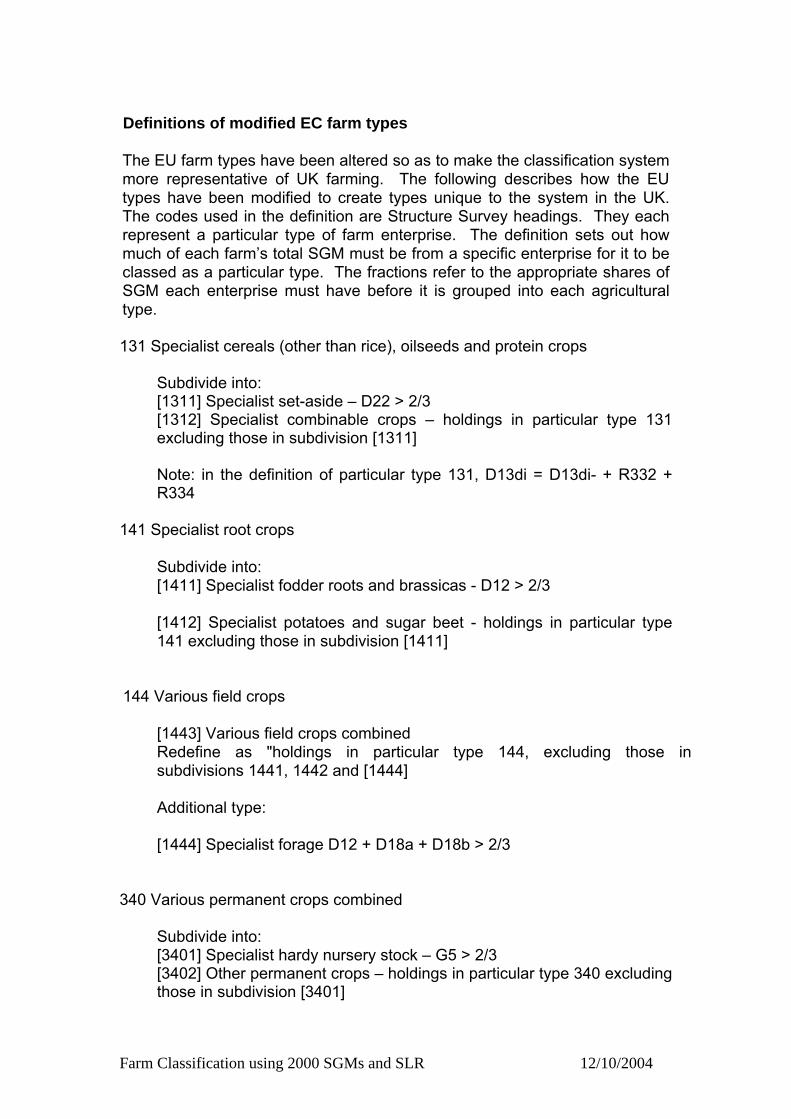
Definitions of modified EC farm types The EU farm types have been altered so as to make the classification system more representative of UK farming. The following describes how the EU types have been modified to create types unique to the system in the UK. The codes used in the definition are Structure Survey headings. They each represent a particular type of farm enterprise. The definition sets out how much of each farm’s total SGM must be from a specific enterprise for it to be classed as a particular type. The fractions refer to the appropriate shares of SGM each enterprise must have before it is grouped into each agricultural type. 131 Specialist cereals (other than rice), oilseeds and protein crops
Subdivide into: [1311] Specialist set-aside – D22 > 2/3 [1312] Specialist combinable crops – holdings in particular type 131 excluding those in subdivision [1311]
Note: in the definition of particular type 131, D13di = D13di- + R332 + R334
141 Specialist root crops
Subdivide into: [1411] Specialist fodder roots and brassicas - D12 > 2/3 [1412] Specialist potatoes and sugar beet - holdings in particular type 141 excluding those in subdivision [1411]
144 Various field crops
[1443] Various field crops combined Redefine as "holdings in particular type 144, excluding those in subdivisions 1441, 1442 and [1444]
Additional type: [1444] Specialist forage D12 + D18a + D18b > 2/3
340 Various permanent crops combined
Subdivide into: [3401] Specialist hardy nursery stock – G5 > 2/3 [3402] Other permanent crops – holdings in particular type 340 excluding those in subdivision [3401]
Farm Classification using 2000 SGMs and SLR 12/10/2004
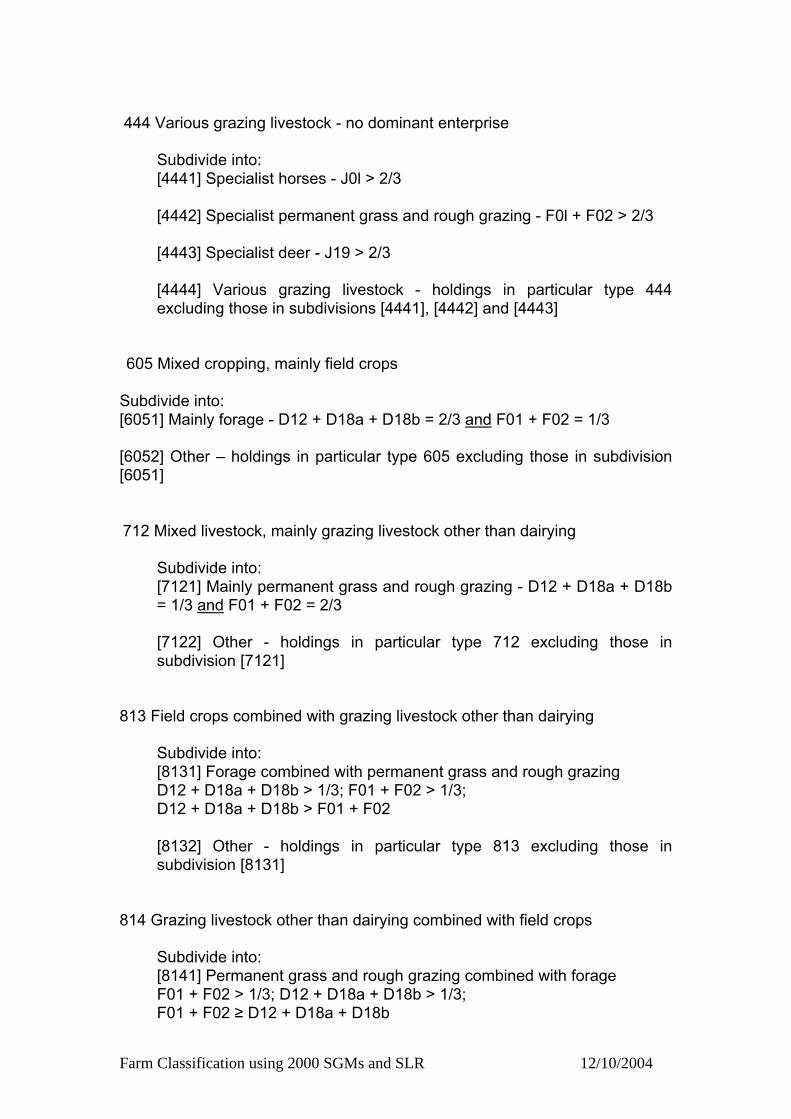
444 Various grazing livestock - no dominant enterprise
Subdivide into: [4441] Specialist horses - J0l > 2/3
[4442] Specialist permanent grass and rough grazing - F0l + F02 > 2/3
[4443] Specialist deer - J19 > 2/3
[4444] Various grazing livestock - holdings in particular type 444 excluding those in subdivisions [4441], [4442] and [4443]
605 Mixed cropping, mainly field crops
Subdivide into: [6051] Mainly forage - D12 + D18a + D18b = 2/3 and F01 + F02 = 1/3 [6052] Other – holdings in particular type 605 excluding those in subdivision [6051] 712 Mixed livestock, mainly grazing livestock other than dairying
Subdivide into: [7121] Mainly permanent grass and rough grazing - D12 + D18a + D18b = 1/3 and F01 + F02 = 2/3 [7122] Other - holdings in particular type 712 excluding those in subdivision [7121]
813 Field crops combined with grazing livestock other than dairying
Subdivide into: [8131] Forage combined with permanent grass and rough grazing D12 + D18a + D18b > 1/3; F01 + F02 > 1/3; D12 + D18a + D18b > F01 + F02 [8132] Other - holdings in particular type 813 excluding those in subdivision [8131]
814 Grazing livestock other than dairying combined with field crops
Subdivide into: [8141] Permanent grass and rough grazing combined with forage F01 + F02 > 1/3; D12 + D18a + D18b > 1/3; F01 + F02 ≥ D12 + D18a + D18b
Farm Classification using 2000 SGMs and SLR 12/10/2004
[8142] Other - holdings in particular type 813 excluding those in subdivision [8141]
9 Non classifiable Holdings
Subdivide into: [91] Fallow only - holdings with D21 only [92] Other – holdings in general type 9 excluding those in principal type [91]
Farm Classification using 2000 SGMs and SLR 12/10/2004
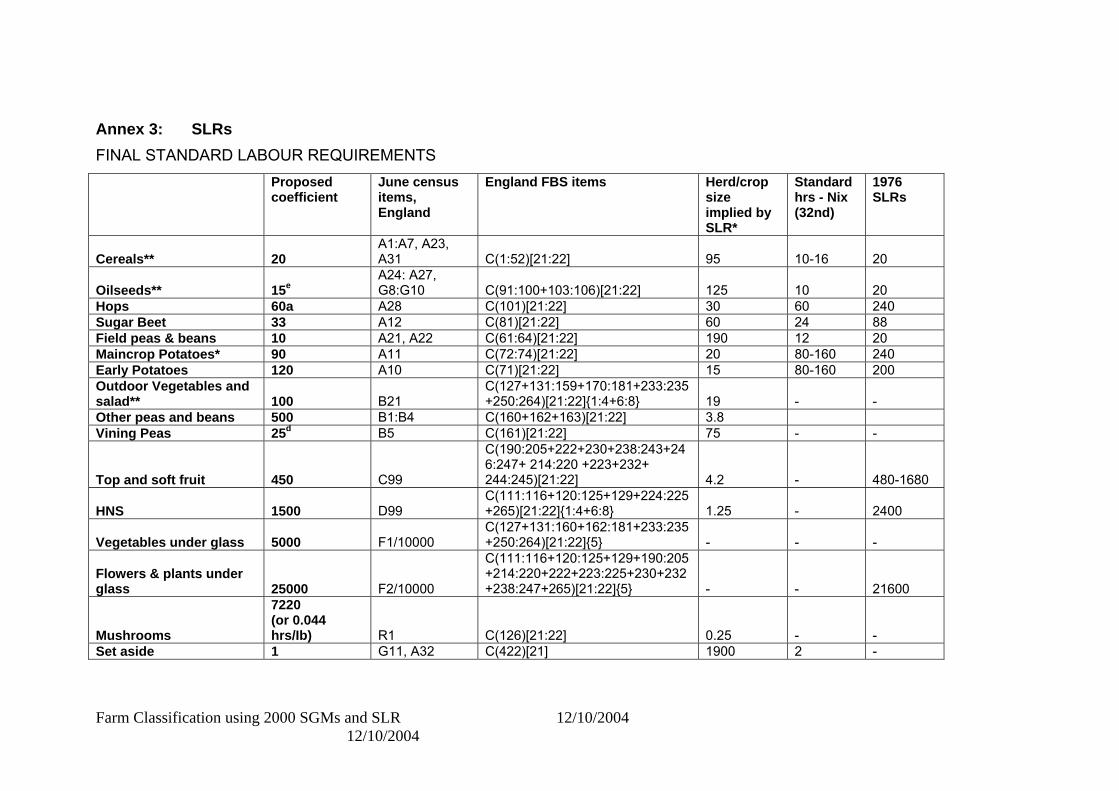
Annex 3: SLRs FINAL STANDARD LABOUR REQUIREMENTS Proposed
coefficient June census items, England
England FBS items Herd/crop size implied by SLR*
Standard hrs - Nix (32nd)
1976 SLRs
Cereals** 20A1:A7, A23, A31 C(1:52)[21:22] 95 10-16 20
Oilseeds** 15eA24: A27, G8:G10 C(91:100+103:106)[21:22] 125 10 20
Hops 60a A28 C(101)[21:22] 30 60 240Sugar Beet 33 A12 C(81)[21:22] 60 24 88Field peas & beans 10 A21, A22 C(61:64)[21:22] 190 12 20 Maincrop Potatoes* 90 A11 C(72:74)[21:22] 20 80-160 240Early Potatoes 120 A10 C(71)[21:22] 15 80-160 200Outdoor Vegetables and salad** 100 B21
C(127+131:159+170:181+233:235+250:264)[21:22]{1:4+6:8} 19 - -
Other peas and beans 500 B1:B4 C(160+162+163)[21:22] 3.8Vining Peas 25d B5 C(161)[21:22] 75 - -
Top and soft fruit 450 C99
C(190:205+222+230+238:243+246:247+ 214:220 +223+232+ 244:245)[21:22] 4.2 - 480-1680
HNS 1500 D99 C(111:116+120:125+129+224:225+265)[21:22]{1:4+6:8} 1.25 - 2400
Vegetables under glass 5000 F1/10000 C(127+131:160+162:181+233:235+250:264)[21:22]{5} - - -
Flowers & plants under glass 25000 F2/10000
C(111:116+120:125+129+190:205+214:220+222+223:225+230+232+238:247+265)[21:22]{5} - - 21600
Mushrooms
7220 (or 0.044 hrs/Ib) R1 C(126)[21:22] 0.25 - -
Set aside 1 G11, A32 C(422)[21] 1900 2 -
Farm Classification using 2000 SGMs and SLR 12/10/2004 12/10/2004
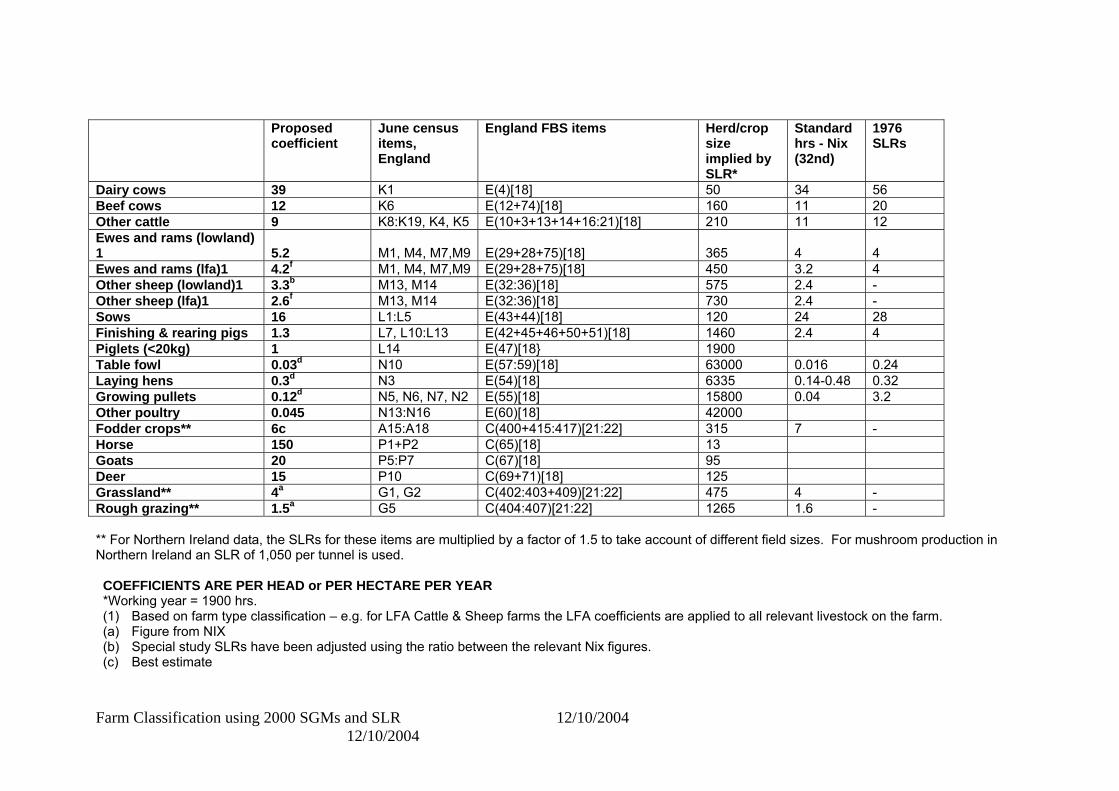
Proposed coefficient
June census items, England
England FBS items Herd/crop size implied by SLR*
Standard hrs - Nix (32nd)
1976 SLRs
Dairy cows 39 K1 E(4)[18] 50 34 56Beef cows 12 K6 E(12+74)[18] 160 11 20Other cattle 9 K8:K19, K4, K5 E(10+3+13+14+16:21)[18] 210 11 12 Ewes and rams (lowland) 1 5.2 M1, M4, M7,M9 E(29+28+75)[18] 365 4 4 Ewes and rams (lfa)1 4.2f M1, M4, M7,M9 E(29+28+75)[18] 450 3.2 4 Other sheep (lowland)1 3.3b M13, M14 E(32:36)[18] 575 2.4 - Other sheep (lfa)1 2.6f M13, M14 E(32:36)[18] 730 2.4 - Sows 16 L1:L5 E(43+44)[18] 120 24 28Finishing & rearing pigs 1.3 L7, L10:L13 E(42+45+46+50+51)[18] 1460 2.4 4 Piglets (<20kg) 1 L14 E(47)[18} 1900 Table fowl 0.03d N10 E(57:59)[18] 63000 0.016 0.24Laying hens 0.3d N3 E(54)[18] 6335 0.14-0.48 0.32Growing pullets 0.12d N5, N6, N7, N2 E(55)[18] 15800 0.04 3.2 Other poultry 0.045 N13:N16 E(60)[18] 42000 Fodder crops** 6c A15:A18 C(400+415:417)[21:22] 315 7 -Horse 150 P1+P2 C(65)[18] 13Goats 20 P5:P7 C(67)[18] 95Deer 15 P10 C(69+71)[18] 125Grassland** 4a G1, G2 C(402:403+409)[21:22] 475 4 - Rough grazing** 1.5a G5 C(404:407)[21:22] 1265 1.6 - ** For Northern Ireland data, the SLRs for these items are multiplied by a factor of 1.5 to take account of different field sizes. For mushroom production in Northern Ireland an SLR of 1,050 per tunnel is used. COEFFICIENTS ARE PER HEAD or PER HECTARE PER YEAR *Working year = 1900 hrs. (1) Based on farm type classification – e.g. for LFA Cattle & Sheep farms the LFA coefficients are applied to all relevant livestock on the farm. (a) Figure from NIX (b) Special study SLRs have been adjusted using the ratio between the relevant Nix figures. (c) Best estimate
Farm Classification using 2000 SGMs and SLR 12/10/2004 12/10/2004
(d) Nix and NFU data (f) LFA sheep coefficients generated by regression analysis of FBS LFA Cattle & Sheep farm labour after application of cattle coefficients
Farm Classification using 2000 SGMs and SLR 12/10/2004 12/10/2004
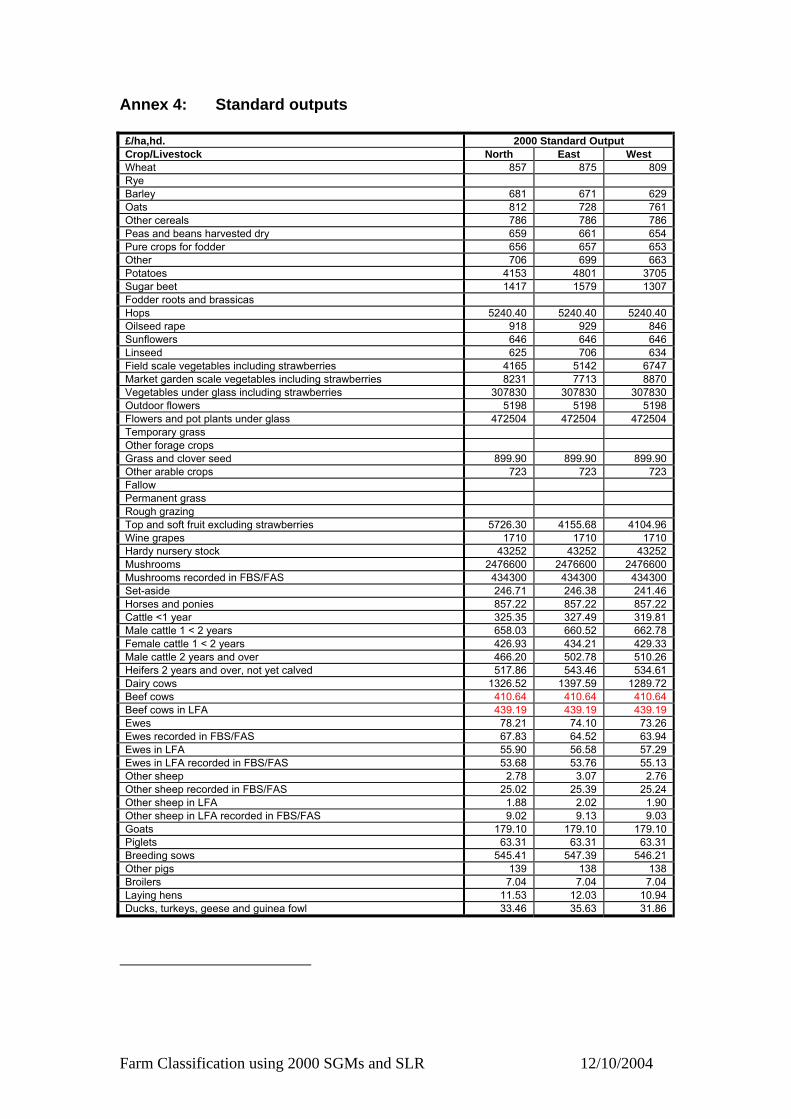
Annex 4: Standard outputs £/ha,hd. 2000 Standard Output Crop/Livestock North East West Wheat 857 875 809 Rye Barley 681 671 629 Oats 812 728 761 Other cereals 786 786 786 Peas and beans harvested dry 659 661 654 Pure crops for fodder 656 657 653 Other 706 699 663 Potatoes 4153 4801 3705 Sugar beet 1417 1579 1307 Fodder roots and brassicas Hops 5240.40 5240.40 5240.40 Oilseed rape 918 929 846 Sunflowers 646 646 646 Linseed 625 706 634 Field scale vegetables including strawberries 4165 5142 6747 Market garden scale vegetables including strawberries 8231 7713 8870 Vegetables under glass including strawberries 307830 307830 307830 Outdoor flowers 5198 5198 5198 Flowers and pot plants under glass 472504 472504 472504 Temporary grass Other forage crops Grass and clover seed 899.90 899.90 899.90 Other arable crops 723 723 723 Fallow Permanent grass Rough grazing Top and soft fruit excluding strawberries 5726.30 4155.68 4104.96 Wine grapes 1710 1710 1710 Hardy nursery stock 43252 43252 43252 Mushrooms 2476600 2476600 2476600 Mushrooms recorded in FBS/FAS 434300 434300 434300 Set-aside 246.71 246.38 241.46 Horses and ponies 857.22 857.22 857.22 Cattle <1 year 325.35 327.49 319.81 Male cattle 1 < 2 years 658.03 660.52 662.78 Female cattle 1 < 2 years 426.93 434.21 429.33 Male cattle 2 years and over 466.20 502.78 510.26 Heifers 2 years and over, not yet calved 517.86 543.46 534.61 Dairy cows 1326.52 1397.59 1289.72 Beef cows 410.64 410.64 410.64 Beef cows in LFA 439.19 439.19 439.19 Ewes 78.21 74.10 73.26 Ewes recorded in FBS/FAS 67.83 64.52 63.94 Ewes in LFA 55.90 56.58 57.29 Ewes in LFA recorded in FBS/FAS 53.68 53.76 55.13 Other sheep 2.78 3.07 2.76 Other sheep recorded in FBS/FAS 25.02 25.39 25.24 Other sheep in LFA 1.88 2.02 1.90 Other sheep in LFA recorded in FBS/FAS 9.02 9.13 9.03 Goats 179.10 179.10 179.10 Piglets 63.31 63.31 63.31 Breeding sows 545.41 547.39 546.21 Other pigs 139 138 138 Broilers 7.04 7.04 7.04 Laying hens 11.53 12.03 10.94 Ducks, turkeys, geese and guinea fowl 33.46 35.63 31.86
Farm Classification using 2000 SGMs and SLR 12/10/2004