Embed Size (px)
Citation preview

Home of the South African farmer | Ikhaya lomlimi waseNingizimu Africa | Tuiste van die Suid-Afrikaanse boer | Lehae la balimi ba Africa Borwa
Agri SA’s comments on Eskom’s Regulatory
Clearing Account (RCA) Application
MYPD3 Year 1 (2013/14)
4 February 2016
Thabi Nkosi: Senior Economist- Agri SA

Agri SA is a federation of agricultural organisations comprising of nine provincial
agricultural unions and 24 commodity organisations.
We promote, on behalf of our members:
• development
• profitability
• stability
• sustainability
of agriculture in South Africa by means of our involvement and input on national
and international policy level. Through our affiliations, we represent a diverse group
of farmers irrespective of gender, colour or creed.
Agri SA is also a member of Business Unity South Africa (BUSA) and thus also
engages with other sectors of the economy on matters of transversal importance
such as energy.
Who we are
© 2015 Agri SA 2

1. Context and background
• Impact of the drought on agriculture and South Africa
• Effect on irrigation farmers
2. General comments on Eskom’s submission
• Application of the MYPD methodology
• Economic assumptions
• Reliability of information
• Load shedding
• Power buy-backs and inflation adjustments
3. General recommendations
Content
© 2015 Agri SA 3
Context and background
© 2015 Agri SA 4

• As SA faces possible recession and the agricultural sector has been the worst
performing
• Agricultural production and farm incomes of both small- and large-scale farmers
have been severely affected by drought conditions.
Agricultural sector contracted by :
• 19.7% in Q2 2015
• 12.6% in Q3 2015
A further double digit contraction is expected to be reported in relation to the
last quarter of 2015
SA in the midst of the worst drought in decades
© 2015 Agri SA 5

Maize
• Estimated that 2016/17 maize harvest will amount to approximately 5 million
tons, down from an average annual harvest of 11 million tons
• Loss of revenue by maize farmers of at least R15 billion in 2015/16
Sugar
• Drought-induced revenue losses in the 2015/16 season have been
estimated to reach over R1.1 billion.
Livestock
• Thousands of livestock losses have been
reported, leading to revenue losses that are
yet to be estimated.
Estimated losses for farmers
© 2015 Agri SA 6

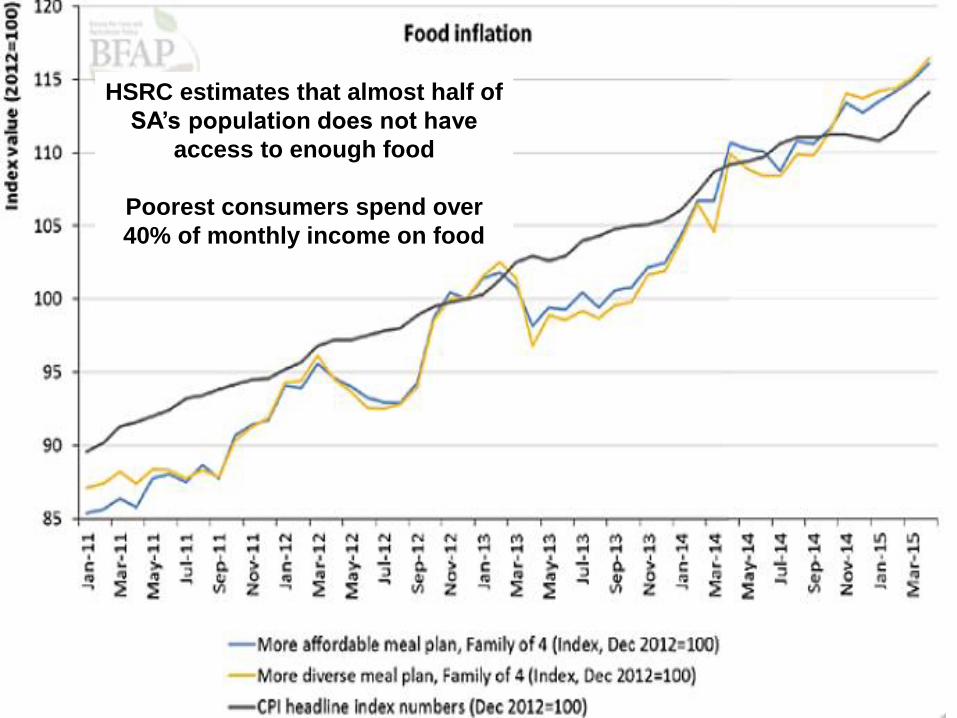
© 2015 Agri SA 7
Source: BFAP
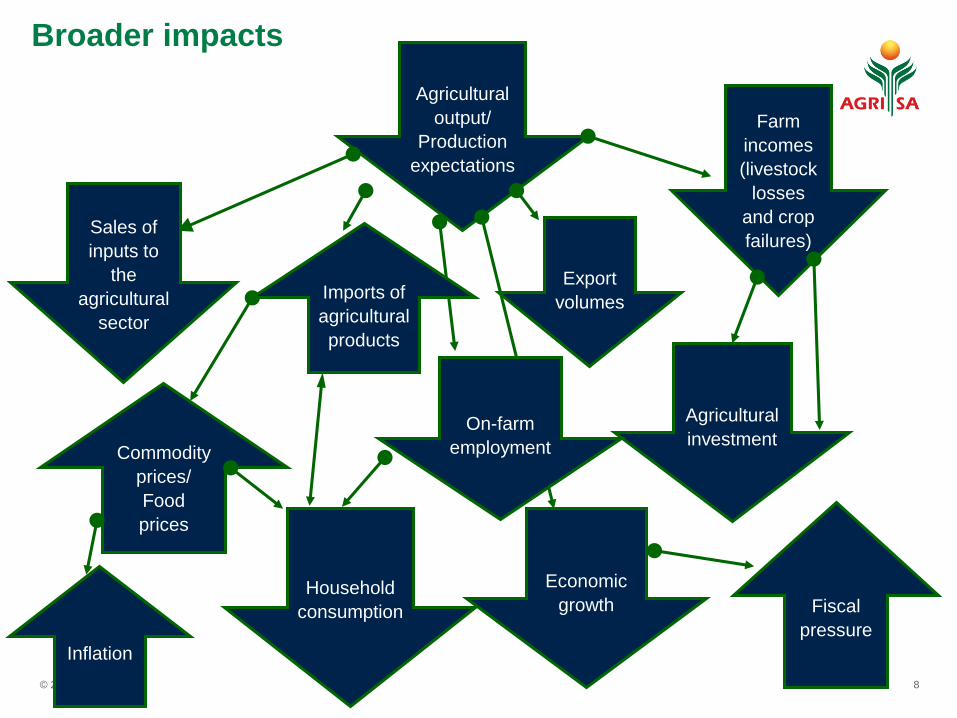
Broader impacts
© 2015 Agri SA 8
Agricultural
output/
Production
expectations
Sales of
inputs to
the
agricultural
sector
Export
volumes
Agricultural
investment
Farm
incomes
(livestock
losses
and crop
failures)
Commodity
prices/
Food
prices
Household
consumption
Economic
growth Fiscal
pressure
Inflation
On-farm
employment
Imports of
agricultural
products

• All farmers are users of electricity to varying degrees and are thus all sensitive to increases
in the price of electricity
Effect on irrigation farmers
© 2015 Agri SA 9
Irrigation farmers most
acutely affected by NERSA’s
RCA decision
17% of South Africa’s
maize production is under irrigation
47% of wheat is produced
on irrigated land
30% of sugar is produced
on irrigated lands
25% of the country’s food
is produced by irrigation-reliant and
energy-intensive industries
10%Contribution of
electricity costs to an average
producer’s total variable cost

Electricity costs constitute the second and fourth largest cost components
in the production of wheat and maize under irrigation respectively.
Undoubtedly, tariff hikes significantly in excess of the 8% communicated in
the original MYPD3 decision will place tremendous liquidity pressure on any
enterprise, especially if electricity constitutes a large proportion of variable
costs as in the case of irrigation-reliant agricultural industries
© 2015 Agri SA 10

© 2015 Agri SA 11
1 300
1 500
1 700
1 900
2 100
2 300
2 500
2 700
2 900
3 100
3 300
3 500
3 700
3 900
4 100
4 300
4 500
4 700
4 900
5 100
5 30015
-Fe
b-1
3
17
-Mar-
13
16
-Apr-
13
16
-May-1
3
15
-Jun
-13
15
-Jul-
13
14
-Aug
-13
13
-Sep
-13
13
-Oct-
13
12
-Nov-1
3
12
-Dec-1
3
11
-Jan
-14
10
-Fe
b-1
4
12
-Mar-
14
11
-Apr-
14
11
-May-1
4
10
-Jun
-14
10
-Jul-
14
9-A
ug-1
4
8-S
ep-1
4
8-O
ct-
14
7-N
ov-1
4
7-D
ec-1
4
6-J
an-1
5
5-F
eb
-15
7-M
ar-
15
6-A
pr-
15
6-M
ay-1
5
5-J
un-1
5
5-J
ul-1
5
4-A
ug-1
5
3-S
ep-1
5
3-O
ct-
15
2-N
ov-1
5
2-D
ec-1
5
1-J
an-1
6
R/ton
Date
PRICES OF USA WHITE MAIZE DELIVERED IN RANDFONTEIN
USA Import Parity
USA Export Parity
Safex WM
© 2015 Agri SA 12
HSRC estimates that almost half of
SA’s population does not have
access to enough food
Poorest consumers spend over
40% of monthly income on food

General comments
© 2015 Agri SA 13

Application of the MYPD methodology
© 2015 Agri SA 14
We acknowledge need for Eskom to maintain a healthy financial position and to advocate for full cost recovery BUT the downstream effects of substantial tariff hikes on sectors cannot be
ignored
We have supported the adoption of the MYPD methodology as a mechanism of bringing certainty and ensuring Eskom’s financial
viability
However, given the fragile state of the country’s key sectors and the economy at large a blind application of the methodology at this stage would be inappropriate and would
exacerbate economic difficulties
We urge NERSA to give greater consideration to the ability of customers to absorb cost increases and to the likely impact that further tariff increases will have on future demand and further revenue
variances which will give rise to further hefty RCA applications
(Vicious cycle)
We agree with Eskom that high electricity prices have unfavourably affected the demand for electricity, contributing to the unfavourable
revenue variance
Further price increases will almost certainly lead to reduced electricity consumption, continuing an unsustainable cycle of under-recovery and
unfavourable revenue variances
NOTE: Unlike the economy at large, the demand for electricity in the agricultural sector is relatively inelastic in the short term despite current efforts
to move to renewable sources of energy.

Economic assumptions
© 2015 Agri SA 15
• We recognise that the economic growth assumptions on which the original MYPD3
decision was based were concluded at a time when the economic outlook was slightly
more positive.
• We are however concerned that it appears that Eskom had missed an opportunity to
update the growth and sales assumptions made in their MYPD3 submission, to reflect
a more realistic view of the future prior to submitting to NERSA.
• The current RCA application indicates on page 42 that the sales forecast was finalised
on 14 September 2011, over a year prior to the submission of the MYPD3 application
to NERSA.
• We recommend that in future, a requirement to update economic assumptions in
line with the latest available information be imposed as far as is feasible to allow
for more realistic outlooks and projections.
• We further recommend that in future MYPD applications, the relationship
between economic growth and electricity sales to the various sectors be
relooked given the trend that most rapid growth has been observed in less
energy intensive sectors.

Reliability of information
© 2015 Agri SA
We are concerned about the number of errors being
reported by Eskom in the application:
• creates confusion
• erodes the confidence of industries in the
submissions made by Eskom and the decisions
taken by NERSA.
1. The first of these errors relates to a failure to add
the environmental levy to the total primary energy
costs in 2013/14.
2. The second error relates to the pricing applicable
to NPA customers and ultimately the allowed
revenue in the original MYPD3 decision.
Given the avoidable nature of these errors made
by either the regulator or Eskom, they should not
be laid at the doorstep of the consumer and thus
request that any contribution of such errors to the
RCA variance be disregarded 16

Load shedding
© 2015 Agri SA 17
• We are concerned with the manner in
which Eskom has accounted for load-
shedding in the RCA application
• Of the view that the information
provided is inadequate and does not
allow for informed comment.
• Concerned that this type of reporting,
caused by a lack of data collection,
sets an unfavourable precedent for
future RCA applications particularly
given the significance of load
shedding in 2014/15 and 2015/16.

Power buy backs
• Concerning to us that an unfavourable variance as a result of Power Buy Backs
has been included as part of the RCA application given that the resultant
decrease in sales was initiated and incentivised by Eskom.
• It is our view that the contribution of the PBB scheme to the reported variance be
disregarded.
Inflation Adjustment
• It is our understanding that over-expenditure on operating costs cannot be
included in an RCA application.
• For the purposes of the application, it would thus also be inappropriate to apply
an inflation adjustment on the operating cost over-expenditure of R10 billion.
• From Eskom’s submission, it is not clear whether inflation adjustments on this
over-expenditure were excluded.
Power Buy Backs and inflation adjustment
© 2015 Agri SA 18

General
recommendations
© 2015 Agri SA 19

Recommendations
20
Essentially, Eskom is a state-owned
utility and a supplier of a critical input
in the South African economy. Given
the impact of the organisation’s
operations on the cost of doing
business in South Africa, greater
transparency is required regarding
the methodologies applied to
calculate costs and determine
efficiency and prudency of
expenditure.
• Given the current fragile position of the South
African economy, consideration should be
given to recovering the approved RCA
balance over an extended period of time, as
allowable in the MYPD methodology.
• If the full RCA balance of R22.8 billion as
requested by Eskom were to be recovered in
the current period, an increase of
approximately 16% to the tariff may be likely.
• This would be destructive to the economy and
the agricultural sector in particular. It is
recognised that the EBITDA and EBIT ratios
are at such low levels that they may be
negatively considered by rating agencies. A
rigid phasing-in schedule for RCA should
however contribute towards alleviating this
position.

Thank you
© 2015 Agri SA 21