Embed Size (px)
DESCRIPTION
RP Agri Foreign Trade
Citation preview
BUREAU OF AGRICULTURAL STATISTICS BUREAU OF AGRICULTURAL STATISTICS
AGRICULTURAL FOREIGN TRADE DEVELOPMENT
2012 Annual Report
TERMS OF USE Agricultural Foreign Trade Development 2012 Annual Report is a publication of the Bureau of Agricultural Statistics (BAS), Department of Agriculture. The BAS reserves exclusive right to reproduce this publication in whatever form. Should any portion of this publication be included in a report/article, the title of the publication and the BAS should be cited as the source of the data. The BAS will not be responsible for any information derived from the processing of data contained in this publication.
ISSN-2012-0419 October 2013
Please direct technical inquiries to the Office of the Director Bureau of Agricultural Statistics Ben-Lor Building, 1184 Quezon Avenue Quezon City 1100 Philippines. Email: [email protected] Website: www.bas.gov.ph
BUREAU OF AGRICULTURAL STATISTICS BUREAU OF AGRICULTURAL STATISTICS
AGRICULTURAL FOREIGN TRADE DEVELOPMENT
2012 Annual Report
FOREWORD
The Agricultural Foreign Trade Development Report is an annual publication of the Bureau of Agricultural Statistics (BAS). This 23
rd edition presents a brief discussion
on the country’s overall agricultural trade performance in 2012. It summarizes the quarterly trade memos that are periodically provided to the Office of the Secretary, Department of Agriculture (DA). It features statistics on trade with the country’s trading partners, volume and value of top 10 agricultural exports and imports including the world prices of selected commodities. Data used in this report were sourced from the Foreign Trade Statistics of the National Statistics Office (NSO). The world price statistics were obtained from the Bangko Sentral ng Pilipinas (BSP) and the World Bank (WB). The BAS welcomes comments and suggestions from the data users and readers of this report.
ROMEO S. RECIDE Director
i 40
BUREAU OF AGRICULTURAL STATISTICS BUREAU OF AGRICULTURAL STATISTICS
AGRICULTURAL FOREIGN TRADE DEVELOPMENT
2012 Annual Report
TABLE OF CONTENTS
Pages
FOREWORD ……………………………………………………………………………………………………. i TABLE OF CONTENTS ……………………………………………………………………………………… iii LIST OF TABLES ………………………………………………………………………………………………. iv LIST OF FIGURES …………………………………………………………………………………………….. vi HIGHLIGHTS ……………………………………………………………………………………………………. 1 OVERALL AGRICULTURAL TRADE …………………………………………………………….. 1 TOP AGRICULTURAL EXPORTS …………………………………………………………………. 2 TOP AGRICULTURAL IMPORTS …………………………………………………………………. 3 WORLD PRICES TRENDS …………………………………………………………………………… 4 STATISTICAL TABLES AND GRAPHS ………………………………………………………………….. 7
iii 38
0.00
0.50
1.00
1.50
2.00
2.50
Jan
Feb
Mar
Ap
r
May Jun
Jul
Au
g
Sep
Oct
No
v
Dec
US
$/k
g
Month
Figure 25 World Prices of Coconut Oil
January-December, 2011-2012
2012
2011
0.40
0.45
0.50
0.55
0.60
0.65
0.70
0.75
Jan
Feb
Mar
Ap
r
May Jun
Jul
Au
g
Sep
Oct
No
v
Dec
US
$/k
g
Month
Figure 29World Prices of Rice (5% broken) January- December, 2011-2012
2012
2011
0.00
0.20
0.40
0.60
0.80
1.00
1.20
1.40
1.60
Jan
Feb
Mar
Ap
r
May Jun
Jul
Au
g
Sep
Oct
No
v
Dec
US
$/k
g
Month
Figure 26 World Prices of Copra
January to December, 2011-2012
2012
2011
0.35
0.40
0.45
0.50
0.55
0.60
0.65
0.70
0.75
0.80
Jan
Feb
Mar
Ap
r
May Jun
Jul
Au
g
Sep
Oct
No
v
Dec
US
$/k
g
Month
Figure 27 World Prices of Sugar
January- December, 2011-2012
2012
2011
0.00
0.10
0.20
0.30
0.40
0.50
0.60
0.70
0.80
0.90
Jan
Feb
Mar
Ap
r
May Jun
Jul
Au
g
Sep
Oct
No
v
Dec
US
$/k
g
Month
Figure 30World Prices of Rice (25% broken)
January- December, 2011-2012
2012
2011
0.40
0.45
0.50
0.55
0.60
0.65
0.70
0.75
0.80
Jan
Feb
Mar
Ap
r
May Jun
Jul
Au
g
Sep
Oct
No
v
Dec
US
$/k
g
MonthFigure 28
World Prices of SoybeanJanuary - December, 2011-2012
2012
2011
BUREAU OF AGRICULTURAL STATISTICS BUREAU OF AGRICULTURAL STATISTICS
AGRICULTURAL FOREIGN TRADE DEVELOPMENT
2012 Annual Report
LIST OF TABLES
Table No. Pages
1 SUMMARY OF PHILIPPINE AGRICULTURAL TRADE, 2010-2012 ….……… 9 1a PHILIPPINE AGRICULTURAL TRADE, BY QUARTER, 2011-2012 ………….. 10 2 AGRICULTURAL TRADE BALANCES WITH MAJOR TRADING PARTNERS OF THE PHILIPPINES, 2011-2012 ………………………………………………………. 11 3 QUANTITY AND VALUE OF PHILIPPINE AGRICULTURAL EXPORTS BY COMMODITY GROUP, 2011-2012 ………………….…………………………….. 12 4 TOP TEN PHILIPPINE AGRICULTURAL EXPORTS, 2011-2012 ………………. 14 4a VALUE OF TOP TEN AGRICULTURAL EXPORTS, BY QUARTER, 2011-2012 …………….……………………………………………………. 15 5 MAJOR MARKETS OF TOP TEN PHILIPPINE AGRICULTURAL EXPORTS, 2012 …………………………………………………………………………………. 16 6 QUANTITY AND VALUE OF PHILIPPINE AGRICULTURAL IMPORTS BY COMMODITY GROUP, 2011-2012 ………………………………………………… 20 7 TOP TEN AGRICULTURAL IMPORTS, 2011-2012 ………………………………… 21 7a VALUE OF TOP TEN AGRICULTURAL IMPORTS, BY QUARTER, 2011-2012 ………………………………………………………………….. 22 8 MAJOR SUPPLIERS OF TOP TEN PHILIPPINE AGRICULTURAL IMPORTS, 2012 ………………………………………………………………………………… 23
37 iv
Jan
ua
ry5
.23
05
.81
5(1
0.0
6)
2.1
32
2.2
29
(4.3
5)
0.9
45
8.9
20
(89
.41
)3
.50
45
.80
9(3
9.6
8)
Feb
rua
ry4
.94
26
.34
7(2
2.1
4)
2.2
47
2.4
11
(6.8
0)
1.0
68
10
.02
0(8
9.3
4)
3.7
79
5.5
81
(32
.29
)
Ma
rch
4.4
37
6.4
39
(31
.09
)2
.28
32
.60
4(1
2.3
3)
1.1
44
9.9
60
(88
.51
)3
.78
14
.83
9(2
1.8
6)
Ap
ril
4.2
21
6.6
17
(36
.21
)2
.24
42
.58
8(1
3.2
9)
1.0
30
10
.27
0(8
9.9
7)
3.6
65
4.9
71
(26
.27
)
Ma
y4
.07
16
.41
7(3
6.5
6)
2.3
56
2.6
89
(12
.38
)0
.95
31
0.1
10
(90
.57
)3
.37
64
.52
3(2
5.3
6)
Jun
e3
.71
96
.06
2(3
8.6
5)
2.3
30
2.6
00
(10
.38
)0
.95
49
.76
0(9
0.2
3)
2.8
63
4.5
25
(36
.73
)
July
4.1
99
5.9
09
(28
.94
)2
.36
02
.48
5(5
.03
)0
.96
59
.61
0(8
9.9
6)
2.8
93
4.5
62
(36
.58
)
Au
gust
3.8
54
5.9
62
(35
.36
)2
.34
82
.47
1(4
.98
)0
.95
19
.51
0(9
0.0
0)
2.5
95
4.6
18
(43
.81
)
Sep
tem
ber
3.9
46
6.0
60
(34
.88
)2
.31
42
.33
8(1
.03
)0
.96
59
.47
0(8
9.8
1)
2.7
63
4.5
16
(38
.82
)
Oct
ob
er3
.82
15
.46
3(3
0.0
6)
2.3
03
2.1
63
6.4
70
.95
69
.54
0(8
9.9
8)
2.9
54
4.0
85
(27
.69
)
No
vem
ber
3.5
25
5.4
03
(34
.76
)2
.15
32
.14
40
.42
0.9
34
9.5
60
(90
.23
)2
.80
03
.33
0(1
5.9
2)
Dec
emb
er3
.36
75
.21
9(3
5.4
9)
2.1
29
2.1
70
(1.8
9)
0.9
44
9.4
20
(89
.98
)2
.89
63
.34
7(1
3.4
7)
Co
ffee
In
tern
ati
on
al
Co
ffee
Org
an
iza
tio
n i
nd
ica
tor
pri
ce, o
ther
mil
d A
rab
ica
s, a
vera
ge N
ew Y
ork
an
d B
rem
en/H
am
bu
rg m
ark
ets,
ex-
do
ck
Co
ffee
In
tern
ati
on
al
Co
ffee
Org
an
iza
tio
n i
nd
ica
tor
pri
ce, R
ob
ust
as,
ave
rage
New
Yo
rk a
nd
Le
Ha
vre/
Ma
rsei
lles
ma
rket
s, e
x-d
ock
Ba
na
na
(C
entr
al
an
d S
ou
th A
mer
ica
n),
ma
jor
bra
nd
s, U
S im
po
rt p
rice
,fre
e o
n t
ruck
US
Go
lf p
ort
s
Ru
bb
er (
an
y o
rigi
n),
RSS
no
. 1, i
n b
ale
s, R
ub
ber
Tra
der
s A
sso
cia
tio
n, s
po
t, N
ew Y
ork
Sou
rce:
Ba
ng
ko S
entr
al n
g P
ilip
ina
s
Co
mm
od
ity
Pri
ce D
ata
, Wo
rld
Ba
nk
Tab
le 1
1. W
OR
LD P
RIC
ES O
F SE
LEC
TED
CO
MM
OD
ITIE
S, 2
011-
2012
… C
on
tin
ued
($ p
er k
g.)
Gro
wth
Rat
e
Ye
ar/M
on
thG
row
th
Rat
e
Gro
wth
Rat
e
Gro
wth
Rat
e
20
12
20
11
20
12
20
11
20
12
20
11
20
12
20
11
Co
ffe
e, A
rab
ica
Co
ffe
e, R
ob
ust
aB
anan
aR
ub
be
r
BUREAU OF AGRICULTURAL STATISTICS BUREAU OF AGRICULTURAL STATISTICS
AGRICULTURAL FOREIGN TRADE DEVELOPMENT
2012 Annual Report
LIST OF TABLES
Table No. Pages
9 DISTRIBUTION OF PHILIPPINE AGRICULTURAL EXPORTS TO ASEAN MEMBER COUNTRIES, 2012 …………………….………………….…… 27 9a DISTRIBUTION OF PHILIPPINE AGRICULTURAL EXPORTS TO AUSTRALIA, JAPAN, AND USA, 2012 ……………………………………………. 28 9b DISTRIBUTION OF PHILIPPINE AGRICULTURAL EXPORTS TO EU MEMBER COUNTRIES, 2012 ……………………………………………………. 29 10 DISTRIBUTION OF PHILIPPINE AGRICULTURAL IMPORTS FROM ASEAN MEMBER COUNTRIES, 2012 ……………………………………….. 31 10a DISTRIBUTION OF PHILIPPINE AGRICULTURAL IMPORTS FROM AUSTRALIA, JAPAN, AND USA, 2012 ………………………………………. 32 10b DISTRIBUTION OF PHILIPPINE AGRICULTURAL IMPORTS FROM EU MEMBER COUNTRIES, 2012 ……………………………………………… 33 11 WORLD PRICES OF SELECTED COMMODITIES JANUARY-DECEMBER, 2011-2012 …………………………………………………….. 35
v 36
20
12
20
11
20
12
20
11
20
12
20
11
Jan
ua
ry0
.54
20
.51
74
.88
0.5
34
0.4
68
14
.20
0.5
16
0.4
05
27
.48
0.2
73
0.2
65
2.9
8
Feb
rua
ry0
.53
80
.52
42
.58
-0
.47
3-
0.5
18
0.4
21
23
.26
0.2
80
0.2
93
(4.5
7)
Ma
rch
0.5
48
0.4
93
11
.20
-0
.45
6-
0.5
27
0.4
08
29
.02
0.2
81
0.2
91
(3.3
7)
Ap
ril
0.5
48
0.4
84
13
.11
-0
.44
8-
0.5
33
0.4
09
30
.39
0.2
74
0.3
19
(14
.19
)
Ma
y0
.60
10
.48
12
4.7
4-
0.4
48
-0
.56
20
.42
13
3.3
80
.26
90
.30
8(1
2.5
4)
Jun
e0
.60
00
.51
41
6.7
8-
0.4
74
-0
.54
10
.42
82
6.6
00
.26
70
.31
1(1
3.9
4)
July
0.5
74
0.5
38
6.5
90
.55
50
.50
79
.51
0.5
19
0.4
49
15
.47
0.3
33
0.3
01
10
.74
Au
gust
0.5
68
0.5
66
0.3
20
.54
50
.53
42
.10
0.5
09
0.4
65
9.3
90
.33
20
.31
07
.03
Sep
tem
ber
0.5
63
0.5
99
(5.9
3)
0.5
44
0.5
56
(2.1
1)
0.5
12
0.5
14
(0.3
9)
0.3
21
0.2
95
8.6
4
Oct
ob
er0
.55
80
.59
9(6
.86
)0
.53
30
.56
0(4
.94
)0
.52
00
.48
96
.40
0.3
21
0.2
75
16
.89
No
vem
ber
0.5
59
0.6
15
(9.1
0)
0.5
30
0.5
84
(9.2
9)
0.5
23
0.5
50
(4.8
7)
0.3
22
0.2
74
17
.20
Dec
emb
er0
.55
70
.58
6(4
.92
)0
.53
00
.56
6(6
.28
)0
.52
00
.54
4(4
.34
)0
.30
90
.25
91
9.3
3
Ric
e (T
ha
i) 5
% b
roke
n, w
hit
e ri
ce (
WR
), M
ille
d, i
nd
ica
tive
pri
ce b
ase
d o
n
wee
kly
surv
eys
of
exp
ort
tra
nsa
ctio
ns,
go
vern
men
t st
an
da
rd, F
.O.B
. Ba
ngk
ok
Ric
e (T
ha
i) 2
5%
bro
ken
, WR
, mil
led
, in
dic
ati
ve s
urv
ey p
rice
, go
vern
men
t st
an
da
rds,
F.O
.B. B
an
gko
k
Ric
e A
1 S
pec
ial
, bro
ken
ker
nel
ob
tain
ed f
rom
th
e m
illi
ng
of
WR
15
%, 2
0%
, an
d 2
5%
, in
dic
ati
ve p
rice
, go
vern
men
t st
an
da
rd, F
.O.B
. Ba
ngk
ok
Ma
ize
(US)
, No
. 2, y
ello
w, F
.O.B
. US
Gu
lf P
ort
s
Sou
rce:
Ba
ng
ko S
entr
al n
g P
ilip
ina
s
Co
mm
od
ity
Pri
ce D
ata
, Wo
rld
Ba
nk
Gro
wth
Rat
e
Mai
ze (
corn
)
20
11
5%
Bro
ken
20
12
25
% B
roke
n
Tab
le 1
1. W
OR
LD P
RIC
ES O
F SE
LEC
TED
CO
MM
OD
ITIE
S, 2
011-
2012
… C
on
tin
ued
($ p
er k
g.)
Ric
e
Gro
wth
Rat
e
Ye
ar/M
on
thA
1 S
pe
cial
Gro
wth
Rat
e
Gro
wth
Rat
e
BUREAU OF AGRICULTURAL STATISTICS BUREAU OF AGRICULTURAL STATISTICS
AGRICULTURAL FOREIGN TRADE DEVELOPMENT
2012 Annual Report
LIST OF FIGURES
Figure No. Pages
1 SHARE OF AGRICULTURAL AND NON-AGRICULTURAL EXPORTS TO TOTAL PHILIPPINE EXPORTS, 2012 ………………………………………………. 9 2 SHARE OF AGRICULTURAL AND NON-AGRICULTURAL IMPORTS TO TOTAL PHILIPPINE IMPORTS, 2012 ………………………………………………. 9 3 PHILIPPINE AGRICULTURAL EXPORTS, BY QUARTER, 2011-2012 ……... 10 4 PHILIPPINE AGRICULTURAL IMPORTS, BY QUARTER, 2011-2012 ……… 10 5 VALUE OF COCONUT OIL EXPORTS, BY QUARTER, 2011-2012 ………….. 18 6 VALUE OF FRESH BANANA EXPORTS, BY QUARTER, 2011-2012 ….…….. 18 7 VALUE OF TUNA EXPORTS, BY QUARTER, 2011-2012 ………….………….… 18 8 VALUE OF PINEAPPLE AND PINEAPPLE PRODUCT EXPORTS, BY QUARTER, 2011-2012 ………………………….………………………………………. 18 9 VALUE OF DESSICATED COCONUT EXPORTS, BY QUARTER, 2011-2012 ………………………….………………………………………. 18 10 VALUE OF SEAWEEDS AND CARAGEENAN EXPORTS, BY QUARTER, 2011-2012 ………………….………………………………………………. 18 11 VALUE OF TOBACCO MANUFACTURED EXPORTS, BY QUARTER, 2011-2012 ………………….………………………………………………. 19 12 VALUE OF COPRA OIL CAKE EXPORTS, BY QUARTER, 2011-2012 ………….………………………………………………………. 19 13 VALUE OF FERTILIZER MANUFACTURED EXPORTS, BY QUARTER, 2011-2012 …………………………………………………………………. 19
35 vi
WORLD PRICES
Jan
ua
ry1
.45
12
.03
8(2
8.8
0)
0.9
65
1.3
54
(28
.73
)0
.51
90
.65
3(2
0.4
4)
0.4
98
0.5
72
(12
.94
)
Feb
rua
ry1
.41
12
.25
6(3
7.4
6)
0.9
45
1.5
03
(37
.13
)0
.53
20
.65
0(1
8.1
5)
0.5
12
0.5
70
(10
.18
)
Ma
rch
1.3
38
1.9
25
(30
.49
)0
.88
81
.28
0(3
0.6
3)
0.5
31
0.5
79
(8.1
6)
0.5
43
0.5
53
(1.8
1)
Ap
ril
1.3
48
2.0
89
(35
.47
)0
.90
31
.42
1(3
6.4
5)
0.5
02
0.5
37
(6.5
9)
0.5
75
0.5
56
3.4
2
Ma
y1
.15
52
.09
7(4
4.9
2)
0.7
69
1.4
19
(45
.81
)0
.45
90
.48
4(5
.19
)0
.57
30
.55
63
.06
Jun
e1
.05
81
.80
3(4
1.3
2)
0.7
08
1.1
86
(40
.30
)0
.45
10
.55
6(1
8.8
0)
0.5
67
0.5
58
1.6
1
July
1.0
70
1.6
62
(35
.62
)0
.71
41
.12
1(3
6.3
1)
0.5
04
0.6
22
(18
.92
)0
.66
20
.55
91
8.4
3
Au
gust
1.0
01
1.4
54
(31
.16
)0
.65
60
.98
5(3
3.4
0)
0.4
60
0.6
12
(24
.76
)0
.68
40
.55
82
2.5
8
Sep
tem
ber
0.9
67
1.3
05
(25
.90
)0
.64
50
.86
7(2
5.6
1)
0.4
41
0.5
88
(25
.03
)0
.67
00
.54
32
3.3
9
Oct
ob
er0
.89
81
.20
8(2
5.6
6)
0.5
91
0.8
04
(26
.49
)0
.44
80
.56
1(2
0.1
9)
0.6
17
0.5
03
22
.66
No
vem
ber
0.8
48
1.4
79
(42
.66
)0
.57
70
.98
0(4
1.1
2)
0.4
26
0.5
30
(19
.47
)0
.58
90
.48
62
1.1
9
Dec
emb
er0
.78
51
.44
5(4
5.6
7)
0.5
26
0.9
68
(45
.66
)0
.42
60
.50
8(1
6.1
8)
0.6
07
0.4
74
28
.06
No
tes:
Co
con
ut
Oil
- (
Ph
ilip
pin
es/I
nd
on
esia
), b
ulk
,C.I
.F. R
ott
erd
am
Co
pra
- (
Ph
ilip
pin
es/I
nd
on
esia
), b
ulk
,C.I
.F. N
.W. E
uro
pe
Suga
r-In
tern
ati
on
al
Suga
r A
gree
men
t (I
SA)
F.O
.B. C
ari
bb
ean
Po
rt.
Soyb
ean
s (U
S), C
.I.F
. Ro
tter
da
m
Sou
rce:
Ba
ng
ko S
entr
al n
g P
ilip
ina
s
Co
mm
od
ity
Pri
ce D
ata
, Wo
rld
Ba
nk
Tab
le 1
1. W
OR
LD P
RIC
ES O
F SE
LEC
TED
CO
MM
OD
ITIE
S, 2
011-
2012
($ p
er k
g.)
Ye
ar/M
on
thG
row
th
Rat
e
20
12
Soyb
ean
s
Gro
wth
Rat
e
Gro
wth
Rat
e
20
11
20
12
20
11
Gro
wth
Rat
e
Co
con
ut
Oil
Co
pra
20
12
20
11
20
11
20
12
Suga
r
BUREAU OF AGRICULTURAL STATISTICS BUREAU OF AGRICULTURAL STATISTICS
AGRICULTURAL FOREIGN TRADE DEVELOPMENT
2012 Annual Report
LIST OF FIGURES
Figure No. Pages
14 VALUE OF CENTRIFUGAL SUGAR EXPORTS, BY QUARTER, 2011-2012 ………………….………………………………………………. 19 15 VALUE OF WHEAT (INCLUDING SPELT) & MESLIN IMPORTS, BY QUARTER, 2011-2012 ……….……………………………………………………….… 25 16 VALUE OF SOYABEAN OIL CAKE/MEAL IMPORTS, BY QUARTER, 2011-2012 ………………………………………………….………………. 25 17 VALUE OF MILK & CREAM AND PRODUCTS IMPORTS BY QUARTER, 2011-2012 ……………………………………………….…………………. 25 18 VALUE OF RICE IMPORTS, BY QUARTER, 2011-2012 ……………………..….. 25 19 VALUE OF FERTILIZER MANUFACTURED IMPORTS, BY QUARTER, 2011-2012 ………………………………………………………………….. 25 20 VALUE OF MEAT OF UREA IMPORTS, BY QUARTER, 2011-2012 ………………………………………………………………….. 25 21 VALUE OF COFFEE IMPORTS, BY QUARTER, 2011-2012 ……….………..…. 26 22 VALUE OF BOVINE ANIMALS IMPORTS, BY QUARTER, 2011-2012 ……………………………………………………….…………. 26 23 VALUE OF TOBACCO UNMANUFACTURED, BY QUARTER, 2011-2012 ………………………………………………………………………………….….…. 26 24 VALUE OF MAIZE/CORN, BY QUARTER, 2011-2012 …………….…..………… 26 25 WORLD PRICES OF COCONUT OIL, JANUARY - DECEMBER, 2011-2012 ………………………………………………………………………………………… 38 26 WORLD PRICES OF COPRA, JANUARY- DECEMBER, 2011-2012 …………. 38
vii 34
Ital
yLa
tvia
Lith
uan
iaLu
xem
bo
urg
Mal
taN
eth
erl
and
Po
lan
dP
ort
uga
lSl
ova
ck
Re
pu
blic
Slo
ven
iaSp
ain
Swe
de
n
UK
Gre
at
Bri
tain
& N
.
Ire
lan
d
1.
Foo
d a
nd
Liv
e A
nim
als
62
.46
90
.00
13
.26
30
.00
11
07
.52
89
.55
70
.27
82
6.1
41
0.7
83
16
.39
64
41
.11
7
A.
Live
An
ima
ls (
No
.)0
.00
10
.00
10
.81
10
.23
82
.34
24
.74
7
B.
Mea
t a
nd
Mea
t P
rep
ara
tio
ns
0.0
52
13
.40
80
.03
97
.58
62
.36
97
1.7
59
C.
Da
iry
Pro
du
cts
an
d B
ird
s Eg
gs1
.59
01
2.9
80
9.2
41
0.1
52
1.7
05
0.4
76
0.7
37
66
.74
8
D.
Fish
an
d F
ish
Pre
pa
rati
on
s0
.08
90
.32
4
0
.08
60
.15
70
.82
42
.03
0
E. C
erea
ls a
nd
Cer
eals
Pre
pa
rati
on
s1
.53
61
.00
20
.00
40
.04
10
.04
00
.29
62
.93
92
2.2
15
F. V
eget
ab
les
an
d F
ruit
s3
.15
95
.17
30
.00
21
.55
00
.01
00
.51
12
6.0
82
G.
Suga
r a
nd
Su
gar
Pre
pa
rati
on
s0
.05
23
.26
32
.66
20
.22
20
.91
12
9.4
52
H.
Co
ffee
, Tea
, Co
coa
, Sp
ices
an
d
1.2
82
5.5
58
0.0
78
0.8
43
0.8
07
13
.21
1
Ma
nu
fact
ure
s th
ereo
f
I. F
eed
ing
Stu
ff f
or
An
ima
ls
(exc
lud
ing
un
mil
led
Cer
eals
)
J. M
isce
lla
neo
us
Edib
le P
rod
uct
s a
nd
1
.30
7
33
.73
2
0.0
98
4
.68
3
2.0
50
7
0.8
58
P
rep
ara
tio
ns
II.
Tob
acc
o a
nd
To
ba
cco
Ma
nu
fact
ure
s0
.03
0
0.0
35
0.0
68
0
.16
8
0.0
88
0
.04
5
16
.03
4
III.
Cru
de
Ma
teri
als
0.8
24
5.1
46
0.7
28
0.4
81
22
.62
9
A.
Oil
See
ds
an
d O
legi
no
us
Fru
its
a/
0.0
23
B.
Cru
de
Ru
bb
er0
.03
80
.78
40
.00
13
.47
2
C.
Cru
de
Fert
iliz
er0
.00
30
.07
7
D.
Cru
de
An
ima
l a
nd
Veg
s. M
ate
ria
ls0
.78
64
.36
00
.72
70
.48
11
9.0
56
IV.
An
ima
l a
nd
Veg
eta
ble
Oil
an
d F
ats
1.5
92
2.8
10
0.0
42
7.2
58
2.6
32
0.5
87
26
.93
9
A.
An
ima
l a
nd
Veg
eta
ble
Oil
s a
nd
Fa
ts0
.09
02
.69
30
.04
23
.48
70
.54
31
7.6
32
B.
Fixe
d V
eget
ab
le O
il a
nd
Fa
ts1
.50
30
.11
73
.77
12
.63
20
.04
49
.30
7
V.
Fert
iliz
er M
an
ufa
ctu
red
6.8
13
0.5
79
0.0
36
1.0
85
18
.66
6
VI.
Agr
icu
ltu
ral
Ch
emic
als
an
d M
ate
ria
ls3
.63
71
2.7
52
0.2
28
1.4
46
0.1
62
9.4
03
67
.10
6
VII
. A
gric
ult
ura
l M
ach
iner
y (N
o.)
11
.55
03
.16
10
.00
20
.04
20
.85
94
.47
62
.07
23
9.4
35
TOTA
L V
ALU
E O
F A
GR
ICU
LTU
RA
L IM
PO
RTS
80
.10
0.0
01
0.0
80
.00
0.0
01
32
.01
9.6
70
.55
0.0
00
.00
36
.64
8.1
43
0.0
76
31
.93
TOTA
L V
ALU
E O
F P
HIL
IPP
INE
IMP
OR
TS3
18
.06
0.0
61
2.1
11
.08
3.1
63
25
.05
18
.82
6.0
51
.78
2.9
32
71
.82
12
8.1
52
90
.36
1,3
79
.43
a/
les
s th
an
0.0
01
Tab
le 1
0b.
DIS
TRIB
UTI
ON
OF
PH
ILIP
PIN
E A
GR
ICU
LTU
RA
L IM
PO
RTS
FR
OM
EU
MEM
BER
CO
UN
TRIE
S, 2
012
(C.I
.F. V
alu
e in
Mil
lio
n U
S $)
Tota
l
Ph
ilip
pin
e
Agr
icu
ltu
ral
Imp
ort
s
fro
m E
U
EUR
OP
EAN
UN
ION
Ite
m
53
.40
13
1.8
76
0.0
94
13
4.0
14
9.1
17
2.9
05
BUREAU OF AGRICULTURAL STATISTICS BUREAU OF AGRICULTURAL STATISTICS
AGRICULTURAL FOREIGN TRADE DEVELOPMENT
2012 Annual Report
LIST OF FIGURES
Figure No. Pages
27 WORLD PRICES OF SUGAR, JANUARY - DECEMBER, 2011-2012 ……….. 38 28 WORLD PRICES OF SOYBEANS, JANUARY - DECEMBER, 2011-2012 …… 38 29 WORLD PRICES OF RICE (5% BROKEN), JANUARY- DECEMBER, 2011-2012 ………………………………………………………………………………………… 38 30 WORLD PRICES OF RICE (25% BROKEN), JANUARY- DECEMBER, 2011-2012 ………………………………………………………………………………………….. 38 31 WORLD PRICES OF RICE (A1 SPECIAL), JANUARY - DECEMBER, 2011-2012 ………………………………………………………………………………………… 39 32 WORLD PRICES OF MAIZE, JANUARY- DECEMBER, 2011-2012 ….….…… 39 33 WORLD PRICES OF COFFEE, ARABICA, JANUARY- DECEMBER, 2011-2012 ………………………………………………………………………………………… 39 34 WORLD PRICES OF COFFEE, ROBUSTA, JANUARY- DECEMBER, 2011-2012 ………………………………………………………………………………………… 39 35 WORLD PRICES OF BANANA, JANUARY- DECEMBER, 2011-2012 ………. 39 36 WORLD PRICES OF RUBBER, JANUARY- DECEMBER, 2011-2012 ……….. 39
33 viii A
ust
ria
Be
lgiu
mC
ypru
sC
zech
Re
pu
blic
De
nm
ark
Esto
nia
Fin
lan
dFr
ance
Ge
rman
yG
ree
ceH
un
gary
Ire
lan
d
1.
Foo
d a
nd
Liv
e A
nim
als
2.1
34
37
.94
20
.93
50
.54
31
6.6
27
0.0
00
1.2
66
84
.48
95
9.6
51
0.0
41
0.0
02
11
.07
1
A.
Live
An
ima
ls (
No
.)0
.03
0.0
06
0.0
40
.90
0.3
7
B.
Mea
t a
nd
Mea
t P
rep
ara
tio
ns
8.9
72
0.2
88
0.0
09
2.9
18
0.1
23
23
.36
61
1.2
33
1.3
94
C.
Da
iry
Pro
du
cts
an
d B
ird
s Eg
gs2
.45
60
.51
18
.07
80
.87
31
7.5
56
4.3
80
6.0
12
D.
Fish
an
d F
ish
Pre
pa
rati
on
s0
.03
00
.12
40
.24
20
.15
10
.00
2
E. C
erea
ls a
nd
Cer
eals
Pre
pa
rati
on
s5
.00
00
.00
31
.22
40
.03
39
.52
20
.57
6
F. V
eget
ab
les
an
d F
ruit
s0
.19
36
.71
70
.64
70
.45
70
.04
00
.88
56
.61
20
.03
40
.09
2
G.
Suga
r a
nd
Su
gar
Pre
pa
rati
on
s0
.05
83
.87
20
.01
40
.34
10
.11
51
4.7
58
3.1
35
0.0
50
H.
Co
ffee
, Tea
, Co
coa
, Sp
ices
an
d M
an
ufa
ctu
res
0.0
11
0.7
41
0.0
07
2.2
59
1.6
18
0.0
07
ther
eof
I.
Feed
ing
Stu
ff f
or
An
ima
ls
(ex
clu
din
g u
nm
ille
d C
erea
ls)
J. M
isce
lla
neo
us
Edib
le P
rod
uct
s a
nd
0
.05
0
3
.30
6
1
.12
7
0
.04
2
5
.66
5
1
5.3
36
3
.46
2
P
rep
ara
tio
ns
II.
Tob
acc
o a
nd
To
ba
cco
Ma
nu
fact
ure
s1
4.3
76
0
.10
9
0
.06
6
0
.40
7
0
.45
1
0
.19
0
III.
Cru
de
Ma
teri
als
0.2
87
0.1
09
2.8
12
4.4
73
7.7
64
0.0
05
A.
Oil
See
ds
an
d O
legi
no
us
Fru
its
0.0
23
B.
Cru
de
Ru
bb
er0
.10
90
.01
40
.47
02
.05
6
C.
Cru
de
Fert
iliz
er0
.07
40
.00
1
D.
Cru
de
An
ima
l a
nd
Veg
s. M
ate
ria
ls0
.21
32
.79
84
.00
35
.68
40
.00
5
IV.
An
ima
l a
nd
Veg
eta
ble
Oil
an
d F
ats
1.5
29
0.9
76
1.2
17
8.1
59
0.1
38
A.
An
ima
l a
nd
Veg
eta
ble
Oil
s a
nd
Fa
ts0
.86
20
.97
61
.21
47
.62
60
.09
9
B.
Fixe
d V
eget
ab
le O
il a
nd
Fa
ts0
.66
70
.00
20
.53
20
.03
9
V.
Fert
iliz
er M
an
ufa
ctu
red
5.4
45
0.0
07
0.0
83
4.6
18
VI.
Agr
icu
ltu
ral
Ch
emic
als
an
d M
ate
ria
ls0
.43
37
.41
11
.33
50
.00
21
1.1
62
18
.00
70
.77
20
.35
8
VII
. A
gric
ult
ura
l M
ach
iner
y (N
o.)
0.0
97
1.3
01
0.1
34
0.5
68
0.0
10
1.6
01
13
.55
60
.00
6
TOTA
L V
ALU
E O
F A
GR
ICU
LTU
RA
L IM
PO
RTS
2.6
66
8.2
90
.93
0.7
92
2.4
30
.00
1.2
81
03
.09
11
2.1
60
.50
0.7
71
1.7
6
TOTA
L V
ALU
E O
F P
HIL
IPP
INE
IMP
OR
TS5
3.6
13
06
.49
1.3
97
6.8
57
6.5
30
.28
13
9.0
29
37
.27
15
54
.68
4.0
61
4.2
73
69
.98
a/
les
s th
an
0.0
01
EUR
OP
EAN
UN
ION
1.8
23
6.8
16
Tab
le 1
0b.
DIS
TRIB
UTI
ON
OF
PH
ILIP
PIN
E A
GR
ICU
LTU
RA
L IM
PO
RTS
FR
OM
EU
MEM
BER
CO
UN
TRIE
S, 2
012
(C.I
.F. V
alu
e in
Mil
lio
n U
S $)
Ite
m
2.3
07
0.0
40
9.3
38
16
.23
50
.06
2
BUREAU OF AGRICULTURAL STATISTICS BUREAU OF AGRICULTURAL STATISTICS
AGRICULTURAL FOREIGN TRADE DEVELOPMENT
2012 Annual Report
OVERALL AGRICULTURAL TRADE SITUATION
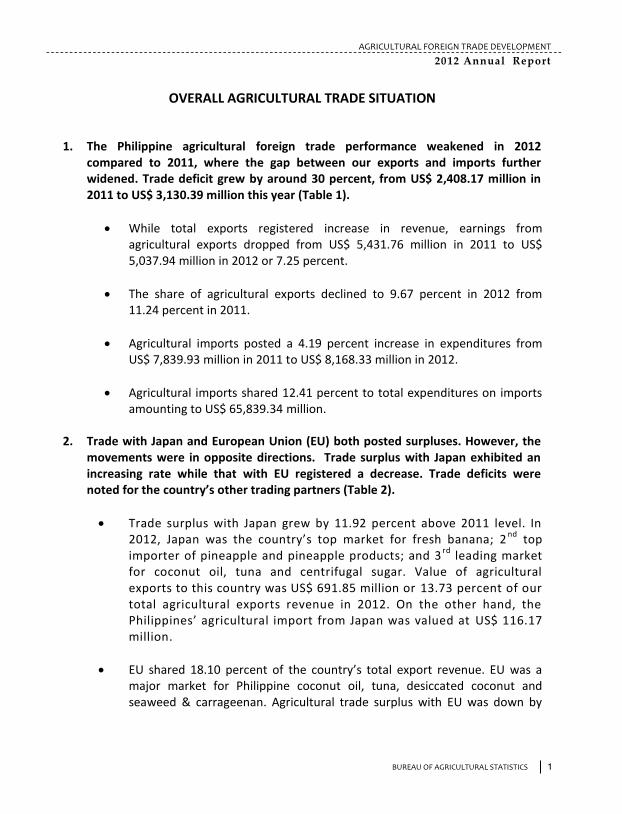
1. The Philippine agricultural foreign trade performance weakened in 2012
compared to 2011, where the gap between our exports and imports further widened. Trade deficit grew by around 30 percent, from US$ 2,408.17 million in 2011 to US$ 3,130.39 million this year (Table 1).
While total exports registered increase in revenue, earnings from agricultural exports dropped from US$ 5,431.76 million in 2011 to US$ 5,037.94 million in 2012 or 7.25 percent.
The share of agricultural exports declined to 9.67 percent in 2012 from 11.24 percent in 2011.
Agricultural imports posted a 4.19 percent increase in expenditures from US$ 7,839.93 million in 2011 to US$ 8,168.33 million in 2012.
Agricultural imports shared 12.41 percent to total expenditures on imports amounting to US$ 65,839.34 million.
2. Trade with Japan and European Union (EU) both posted surpluses. However, the
movements were in opposite directions. Trade surplus with Japan exhibited an increasing rate while that with EU registered a decrease. Trade deficits were noted for the country’s other trading partners (Table 2).
Trade surplus with Japan grew by 11.92 percent above 2011 level. In 2012, Japan was the country’s top market for fresh banana; 2
nd top
importer of pineapple and pineapple products; and 3rd
leading market for coconut oil, tuna and centrifugal sugar. Value of agricultural exports to this country was US$ 691.85 million or 13.73 percent of our total agricultural exports revenue in 2012. On the other hand, the Philippines’ agricultural import from Japan was valued at US$ 116.17 million.
EU shared 18.10 percent of the country’s total export revenue. EU was a major market for Philippine coconut oil, tuna, desiccated coconut and seaweed & carrageenan. Agricultural trade surplus with EU was down by 38.92 percent to US$ 279.82 million in 2012 from US$ 458.08 million in 2011. While agricultural imports increased by about 4.0 percent, exports
1 32
Item
Total Philippine
Agricultural
Imports
Australia Japan USA
1. Food and Live Animals 6106.15 690.65 27.96 1681.87
A. Live Animals (No.) 29.47 18.00 0.00 4.02
B. Meat and Meat Preparations 492.49 98.94 0.22 112.16
C. Dairy Products and Birds Eggs 792.736 83.963 0.125 223.162
D. Fish and Fish Preparations 232.183 0.308 21.561 9.771
E. Cereals and Cereals Preparations 1758.683 451.374 0.723 545.157
F. Vegetables and Fruits 412.498 6.729 0.524 80.383
G. Sugar and Sugar Preparations 235.532 3.666 0.126 44.728
H. Coffee, Tea, Cocoa, Spices and Manufactures thereof 363.662 2.235 1.114 12.329
I. Feeding Stuff for Animals
(excluding unmilled Cereals) 1063.766 17.185 0.197 585.345
J. Miscellaneous Edible Products and Preparations 725.129 8.252 3.373 64.810
II. Tobacco and Tobacco Manufactures 165.954 0.087 0.035 1.488
III. Crude Materials 311.641 2.718 11.348 41.711
A. Oil Seeds and Oleginous Fruits 100.732 0.706 0.073 20.679
B. Crude Rubber 35.379 0.028 7.664 1.158
C. Crude Fertil izer 82.355 0.000 0.186 0.365
D. Crude Animal and Vegs. Materials 93.175 1.984 3.425 19.508
IV. Animal and Vegetable Oil and Fats 409.061 11.328 0.620 2.619
A. Animal and Vegetable Oils and Fats 291.756 10.917 0.583 2.168
B. Fixed Vegetable Oil and Fats 117.304 0.411 0.037 0.451
V. Fertil izer Manufactured 638.105 5.421 30.826 1.746
VI. Agricultural Chemicals and Materials 399.738 4.161 35.789 16.160
VII. Agricultural Machinery (No.) 137.683 5.289 9.588 19.753
TOTAL VALUE OF AGRICULTURAL IMPORTS 8168.331 719.657 116.167 1765.348
TOTAL VALUE OF PHILIPPINE IMPORTS 65,839.335 1,453.909 6,986.691 7,596.233
Table 10a. DISTRIBUTION OF PHILIPPINE AGRICULTURAL IMPORTS FROM AUSTRALIA, JAPAN and USA, 2012
(C.I.F. Value in Million US $)
BUREAU OF AGRICULTURAL STATISTICS BUREAU OF AGRICULTURAL STATISTICS
AGRICULTURAL FOREIGN TRADE DEVELOPMENT
2012 Annual Report
38.92 percent to US$ 279.82 million in 2012 from US$ 458.08 million in 2011. While agricultural imports increased by about 4.0 percent, exports declined by about 14.50 percent.
Agricultural trade with ASEAN member-countries posted further trade deficit by 6.57 percent. Agricultural exports to ASEAN countries were down by 6.85 percent, but agricultural imports from the region moved up by 0.92 percent.
Trade deficit with Australia was sustained and further increased by 31.20 percent. Australia shared less than one (1) percent to our agricultural exports revenue at US$ 48.03 million and nearly nine (9) percent to our agricultural imports expenditures at US$ 719.66 million.
Agricultural trade with the United States of America (USA) posted biggest growth in deficit by 179.72 percent. Deficit grew to US$ 561.90 million from US$ 200.88 million in 2011. Exports decreased by 17.25 percent while imports by 6.66 percent. The USA shared about one fourth to our agricultural exports in 2012.
Trade with the rest of the world (ROW) sustained trade deficit though at very slow rate of 0.09 percent, that is, from US$ 1,401.88 million in 2011 to US$ 1,403.16 million in 2012.
3. Top Agricultural Exports
Top agricultural exports shared 68.46 percent to total agricultural exports revenue at US$ 3,448.95 million or 11.08 percent lower than the 2011 earnings. Coconut oil recorded the biggest export revenue though at a decreasing rate. Export gainers in 2012 included fresh banana, tuna, pineapple and pineapple products and copra oil cake (Tables 4-6).
Coconut oil shared 20.67 percent to the Philippine top ten (10) export earnings. However, this was lower by 26.94 percent in revenue compared to 2011. Export earnings were down to US$ 1,041.48 million in 2012 from US$ 1,425.45 million in 2011. The highest export recorded was in the 2
nd quarter
at US$ 294.39 million. Major markets were USA (44.10%); the Netherlands (31.64%); Japan (5.02%); Italy (3.48%); UK Great Britain and Northern Ireland (3.07%) and others (12.69%).
31 2
Bru
ne
iC
amb
od
iaIn
do
ne
sia
Lao
PD
RM
alay
sia
Mya
nm
arSa
bah
Sara
wak
Sin
gap
ore
Thai
lan
dV
ietn
am
1.
Foo
d a
nd
Liv
e A
nim
als
0.0
10
.06
30
2.2
51
63
.44
25
.47
0.0
01
86
.62
28
0.0
44
90
.72
14
48
.60
A.
Live
An
ima
ls (
No
.)-
-
-
-
-
-
-
0
.03
-
0.0
26
B.
Mea
t a
nd
Mea
t P
rep
ara
tio
ns
-
-
-
0
.02
-
-
0.5
7
1.3
1
0.0
8
1.9
87
C.
Da
iry
Pro
du
cts
an
d B
ird
s Eg
gs-
-
1
0.3
7
1
2.1
8
-
-
4.8
5
14
.35
4.3
0
46
.04
7
D.
Fish
an
d F
ish
Pre
pa
rati
on
s0
.01
-
6
.28
0
.38
0
.02
-
2
.22
1
.95
3
5.2
8
4
6.1
33
E. C
erea
ls a
nd
Cer
eals
Pre
pa
rati
on
s-
0.0
6
55
.20
4.6
1
14
.87
-
8.3
0
54
.24
36
5.7
3
5
02
.98
5
F. V
eget
ab
les
an
d F
ruit
s-
-
6
.78
1
.34
1
0.2
9
-
2
.34
1
2.7
8
8
.65
4
2.1
91
G.
Suga
r a
nd
Su
gar
Pre
pa
rati
on
s-
-
1
8.5
7
1
0.1
4
-
-
2.0
7
23
.07
7.4
9
61
.34
H.
Co
ffee
, Tea
, Co
coa
, Sp
ices
an
d
Ma
nu
fact
ure
s th
ereo
f
I. F
eed
ing
Stu
ff f
or
An
ima
ls-
-
5.8
2
1
.89
0.2
9
-
24
.16
35
.81
2.6
2
70
.59
(exc
lud
ing
un
mil
led
Cer
eals
)
J. M
isce
lla
neo
us
Edib
le P
rod
uct
s -
-
3
7.4
8
88
.31
-
-
12
1.1
8
1
14
.39
8.7
2
37
0.0
6
a
nd
Pre
pa
rati
on
s
II.
Tob
acc
o a
nd
To
ba
cco
Ma
nu
fact
ure
s-
-
1
.00
2
5.8
8
-
-
0.5
9
3.4
8
5.8
7
36
.82
III.
Cru
de
Ma
teri
als
0.0
00
.00
29
.49
1.8
10
.00
00
.00
2.5
07
.03
3.0
74
3.9
0
A.
Oil
See
ds
an
d O
legi
no
us
Fru
its
-
-
18
.71
0.0
1
-
-
0
.78
0
.10
1
.23
2
0.8
3
B.
Cru
de
Ru
bb
er-
-
0
.09
0
.95
-
-
0.1
6
3.4
5
0.1
3
4.7
8
C.
Cru
de
Fert
iliz
er-
-
0
.02
0
.20
-
-
1.2
5
0.1
6
1.2
4
2.8
6
D.
Cru
de
An
ima
l a
nd
Veg
s. M
ate
ria
ls-
-
1
0.6
6
0
.65
-
0.0
0
0
.32
3
.32
0
.47
1
5.4
2
IV.
An
ima
l a
nd
Veg
eta
ble
Oil
an
d F
ats
-
-
61
.44
25
3.0
9
-
-
22
.22
5.0
2
3.1
1
34
4.8
8
A.
An
ima
l a
nd
Veg
eta
ble
Oil
s a
nd
Fa
ts-
-
3
5.2
7
1
83
.98
-
-
1
3.0
1
4
.98
3
.05
2
40
.29
B.
Fixe
d V
eget
ab
le O
il a
nd
Fa
ts-
-
2
6.1
7
6
9.1
1
-
-
9.2
0
0.0
4
0.0
6
10
4.5
9
V.
Fert
iliz
er M
an
ufa
ctu
red
-
-
44
.43
55
.72
-
-
2
4.4
1
2
.72
5
5.9
8
1
83
.26
VI.
Agr
icu
ltu
ral
Ch
emic
als
an
d M
ate
ria
ls-
0.1
5
44
.91
14
.81
-
-
7
.83
4
8.2
8
1
3.5
9
1
29
.57
VII
. A
gric
ult
ura
l M
ach
iner
y (N
o.)
-
-
1.0
5
5.7
1
-
-
3
.59
8
.46
0
.98
1
9.7
9
TOTA
L V
ALU
E O
F A
GR
ICU
LTU
RA
L IM
PO
RTS
0.0
10
.20
48
4.5
80
.00
52
0.4
62
5.4
70
.00
0.0
02
47
.76
35
5.0
35
73
.30
22
06
.82
TOTA
L V
ALU
E O
F P
HIL
IPP
INE
IMP
OR
TS5
8.5
83
.01
2,9
64
.70
0
.05
2,5
42
.05
3
0.1
0
7
0.8
2
17
.86
4,6
56
.50
3
,65
9.0
6
1,0
59
.67
1
5,0
62
.40
Tota
l
Ph
ilip
pin
e
Agr
icu
ltu
ral
Imp
ort
s
fro
m A
SEA
N
16
1.7
6
4
4.5
7
-
-
-
2
2.1
2
5
7.8
5
2
0.9
3
Tab
le 1
0. D
ISTR
IBU
TIO
N O
F P
HIL
IPP
INE
AG
RIC
ULT
UR
AL
IMP
OR
TS F
RO
M A
SEA
N M
EMB
ER C
OU
NTR
IES,
201
2(C
.I.F
. Val
ue
in M
illi
on
US
$)
Ite
m
-
ASE
AN
30
7.2
4
BUREAU OF AGRICULTURAL STATISTICS BUREAU OF AGRICULTURAL STATISTICS
AGRICULTURAL FOREIGN TRADE DEVELOPMENT
2012 Annual Report
Fresh Bananas which shared 12.84 percent to the total top agricultural commodities was the Philippines’ 2
nd top export commodity in 2012.
Export revenue grew by 36.89 percent, the highest of which was posted during the 4
th quarter of 2012. Japan shared 47.51 percent at
US$ 307.24 million of the total export earnings from this commodity. Other major markets were People’s Republic of China, South Korean Republic, United Arab Emirates and Singapore.
Tuna generated US$ 455.10 million earnings from exports to the USA (31.03%); Germany (15.83%); Japan (12.32%); UK Great Britain and N. Ireland (8.35%); Italy (4.78%) and others (27.69%).
Export revenues from pineapple and pineapple products increased by 20.04 percent. The US$ 414.91 million earnings were mostly shared by procurement from USA (37.37%); Japan (15.19 %) and Singapore (13.57%).
Best performer in 2012 was copra oil cake which moved up by 111.93% in revenue from US$ 58.80 million to US$ 124.61 million finding its way to the top 8 list.
4. Top Agricultural Imports
The total value of top ten agricultural imports at US$ 4,108.71 million was about half (50.30%) of the country’s agricultural import expenditures at US$ 8,168.33 million in 2012. Except for milk & cream and products, meat of bovine animals and unmanufactured tobacco, expenditures for all of the top ten import commodities recorded increasing rate (Tables 7-8).
Wheat (including spelt) & Meslin had the largest share of nearly 12 percent to the total agricultural imports. The highest importation of wheat was recorded during the 3
rd quarter at US$ 295.44 million. More
than half (54.09 %) of our wheat imports were sourced from the USA; about 40.91 % from Australia while the rest came from India, Canada, Singapore and other countries.
3 30
Ital
yLa
tvia
Lith
uan
iaLu
xem
bo
urg
Mal
taN
eth
erl
and
Po
lan
dP
ort
uga
lSl
ova
ck
Re
pu
blic
Slo
ven
iaSp
ain
Swe
de
n
UK
Gre
at
Bri
tain
& N
.
Ire
lan
d
1.
Foo
d a
nd
Liv
e A
nim
als
29
.43
50
.08
60
.64
10
.00
00
.69
86
7.5
17
3.3
69
1.1
90
0.1
02
0.5
42
25
.40
44
.03
27
5.0
74
34
7.9
69
A.
Live
An
ima
ls (
No
.)0
.03
40
.12
00
.24
9
B.
Mea
t a
nd
Mea
t P
rep
ara
tio
ns
0.0
05
a/
0.0
22
C.
Da
iry
Pro
du
cts
an
d B
ird
s Eg
gsa
/0
.00
0
D.
Fish
an
d F
ish
Pre
pa
rati
on
s2
2.3
72
0.2
82
a/
0.5
58
14
.49
72
.26
10
.82
40
.06
70
.46
51
6.2
02
1.0
02
40
.84
61
91
.84
0
E. C
erea
ls a
nd
Cer
eals
Pre
pa
rati
on
s0
.56
60
.67
10
.00
40
.18
50
.00
31
.16
92
.96
9
F. V
eget
ab
les
an
d F
ruit
s4
.16
60
.08
60
.35
90
.13
64
3.1
07
1.1
08
0.2
89
0.0
35
0.0
77
8.0
84
2.9
68
27
.23
41
33
.26
7
G.
Suga
r a
nd
Su
gar
Pre
pa
rati
on
s0
.37
90
.00
40
.04
70
.06
80
.03
82
.70
83
.80
0
H.
Co
ffee
, Tea
, Co
coa
, Sp
ices
an
d
0.0
39
0.4
93
0.5
81
0.7
11
1.8
82
Ma
nu
fact
ure
s th
ereo
f
I. F
eed
ing
Stu
ff f
or
An
ima
ls
(exc
lud
ing
un
mil
led
Cer
eals
)
J. M
isce
lla
neo
us
Edib
le P
rod
uct
s a
nd
1
.91
21
.09
10
.07
30
.27
90
.02
12
.27
46
.35
1
P
rep
ara
tio
ns
II.
Tob
acc
o a
nd
To
ba
cco
Ma
nu
fact
ure
s0
.96
60
.49
60
.88
00
.67
51
.97
60
.06
00
.11
81
5.6
60
III.
Cru
de
Ma
teri
als
0.8
09
0.1
75
0.2
63
0.4
82
2.0
09
2.1
58
0.0
22
0.0
28
12
.55
70
.03
98
.85
16
9.6
74
A.
Oil
See
ds
an
d O
legi
no
us
Fru
its
0.0
00
B.
Cru
de
Ru
bb
er0
.03
4
C.
Cru
de
Fert
iliz
er0
.00
0
D.
Cru
de
An
ima
l a
nd
Veg
s. M
ate
ria
ls0
.80
90
.17
50
.26
30
.48
22
.00
92
.15
80
.02
20
.02
81
2.5
57
0.0
39
8.8
51
69
.64
0
IV.
An
ima
l a
nd
Veg
eta
ble
Oil
an
d F
ats
36
.24
20
.26
03
70
.93
8
a
/ 0
.01
3
2
0.9
36
0
.01
5
3
2.0
52
4
77
.25
7
A.
An
ima
l a
nd
Veg
eta
ble
Oil
s a
nd
Fa
ts0
.08
34
1.4
41
a/
0.2
71
0.0
81
44
.05
6
B.
Fixe
d V
eget
ab
le O
il a
nd
Fa
ts3
6.2
42
0.1
77
32
9.4
97
0.0
13
20
.66
50
.01
53
1.9
71
43
3.2
01
V.
Fert
iliz
er M
an
ufa
ctu
red
0.0
00
VI.
Agr
icu
ltu
ral
Ch
emic
als
an
d M
ate
ria
ls0
.42
80
.00
40
.14
10
.15
40
.01
61
.04
0
VII
. A
gric
ult
ura
l M
ach
iner
y (N
o.)
0.0
15
0.0
29
0.1
46
Tota
l Val
ue
of
Agr
icu
ltu
ral E
xpo
rts
67
.88
00
.52
11
.40
00
.00
01
.18
04
41
.34
96
.21
71
.35
30
.10
20
.58
36
1.0
27
4.1
75
11
6.1
11
91
1.7
46
Tota
l Val
ue
of
Ph
ilip
pin
e E
xpo
rts
21
8.6
02
1.1
32
4.1
32
5.3
22
30
.01
91
55
4.3
61
45
.63
91
5.6
84
4.7
94
2.1
05
10
9.3
28
84
.61
06
56
.58
35
91
0.1
46
a/
less
th
an
0.0
01
Tab
le 9
b.
DIS
TRIB
UTI
ON
OF
PH
ILIP
PIN
E A
GR
ICU
LTU
RA
L EX
PO
RTS
TO
EU
MEM
BER
CO
UN
TRIE
S, 2
012
(F.O
.B. V
alu
e in
'00
0 U
S $
) …
Con
tinu
ed
EUR
OP
EAN
UN
ION
7.5
89
0.0
12
Tota
l
Ph
ilip
pin
e
Agr
icu
ltu
ral
Exp
ort
s to
EU
7.5
77
Ite
m
BUREAU OF AGRICULTURAL STATISTICS BUREAU OF AGRICULTURAL STATISTICS
AGRICULTURAL FOREIGN TRADE DEVELOPMENT
2012 Annual Report
Coffee had the 7th
biggest agricultural import expenditure in 2012. From US$ 120.15 million in 2011, import expenditures increased to US$ 251.14 million or 109.02 percent growth. Most of our coffee imports came from Indonesia (56.19%); Vietnam (19.59%) and Malaysia (11.40%). Rice, the country’s 4
th top import commodity, recorded a 14.34 percent increase in
import expenditure from US$ 383.15 million in 2011 to US$ 438.08 million in 2012. Biggest importation in 2012 was recorded during the 3
rd quarter while the
least was posted in the 1st
quarter. Most of our rice imports (82.01%) were sourced from Vietnam; while the rest came from India, Pakistan, Myanmar, Thailand and other countries. Maize/corn importation grew by 84.35 percent at US$ 88.52 million in 2012 from US$ 48.02 million in 2011 moving to the 10
th top import commodity list of
2012. Heaviest importation was recorded during the first quarter at US$ 39.02 million while the least importation was during the third quarter at US$ 7.36 million. Corn was sourced largely from Thailand (35.04%), South Africa (25.54%) and Brazil (15.58%) and others.
5. World Price Trends
World prices were lower throughout 2012 for most of the monitored commodities - coconut oil, copra, sugar, maize, coffee, banana and rubber (Table 11).
Coconut oil and copra. Sustained downtrend in the prices of coconut oil and copra was noted from January to December of 2012. Price decreased by as much as 45% for both commodities. Price ranged from US$ 1.451/kg in January to US$ 0.785/kg in December for coconut oil. Prices of copra started at US$ 0.965/kg in January and were down to as low as US$ 0.526/kg in December. Sugar. Drop in the prices of sugar in the world market was observed through-out the year 2012. Highest price was posted in February at US $ 0.532/kg while the lowest price was during November and December at US$ 0.426/kg.
29 4 A
ust
ria
Be
lgiu
mC
ypru
sC
zech
Re
pu
blic
De
nm
ark
Esto
nia
Fin
lan
dFr
ance
Ge
rman
yG
ree
ceH
un
gary
Ire
lan
d
1.
Foo
d a
nd
Liv
e A
nim
als
0.1
08
26
.19
20
.83
50
.74
63
.24
20
.02
53
.71
91
2.5
33
87
.01
01
.90
90
.02
53
.53
1
A.
Live
An
ima
ls (
No
.)a
/0
.09
00
.00
5
B.
Mea
t a
nd
Mea
t P
rep
ara
tio
ns
a/
0.0
16
0.0
01
C.
Da
iry
Pro
du
cts
an
d B
ird
s Eg
gs
D.
Fish
an
d F
ish
Pre
pa
rati
on
s0
.07
06
.14
30
.56
20
.41
51
.67
52
.14
25
.49
27
2.5
32
1.6
24
0.0
02
1.8
07
E. C
erea
ls a
nd
Cer
eals
Pre
pa
rati
on
s0
.15
10
.12
60
.00
10
.04
50
.00
70
.03
50
.00
5
F. V
eget
ab
les
an
d F
ruit
s0
.03
51
9.6
93
0.0
25
0.3
31
1.5
54
0.0
25
1.5
76
6.6
99
13
.78
40
.18
80
.02
31
.68
5
G.
Suga
r a
nd
Su
gar
Pre
pa
rati
on
s0
.06
00
.00
1a
/a
/0
.00
10
.10
50
.38
8a
/
H.
Co
ffee
, Tea
, Co
coa
, Sp
ices
an
d
0.0
01
0.0
04
a/
a/
0.0
52
Ma
nu
fact
ure
s th
ereo
f
I. F
eed
ing
Stu
ff f
or
An
ima
ls
(exc
lud
ing
un
mil
led
Cer
eals
)
J. M
isce
lla
neo
us
Edib
le P
rod
uct
s a
nd
0
.00
30
.14
40
.11
7a
/ 0
.01
20
.10
20
.22
60
.06
10
.03
4
Pre
pa
rati
on
s
II.
Tob
acc
o a
nd
To
ba
cco
Ma
nu
fact
ure
s7
.96
80
.55
00
.00
10
.57
41
.33
20
.06
4
III.
Cru
de
Ma
teri
als
0.7
21
13
.59
90
.06
20
.02
91
2.0
37
0.0
25
7.3
77
7.1
26
0.1
57
0.1
40
1.0
08
A.
Oil
See
ds
an
d O
legi
no
us
Fru
its
B.
Cru
de
Ru
bb
er0
.03
4
C.
Cru
de
Fert
iliz
er
D.
Cru
de
An
ima
l a
nd
Veg
s. M
ate
ria
ls0
.72
11
3.5
99
0.0
62
0.0
29
12
.03
70
.02
57
.37
77
.09
20
.15
70
.14
01
.00
8
IV.
An
ima
l a
nd
Veg
eta
ble
Oil
an
d F
ats
1.4
52
0.0
69
0.4
43
0.0
02
0.2
49
0.2
77
14
.30
9
A.
An
ima
l a
nd
Veg
eta
ble
Oil
s a
nd
Fa
ts0
.89
80
.06
71
.21
4
B.
Fixe
d V
eget
ab
le O
il a
nd
Fa
ts0
.55
40
.06
90
.44
30
.00
20
.24
90
.21
01
3.0
95
V.
Fert
iliz
er M
an
ufa
ctu
red
VI.
Agr
icu
ltu
ral
Ch
emic
als
an
d M
ate
ria
ls0
.07
5a
/a
/ 0
.10
30
.11
8
VII
. A
gric
ult
ura
l M
ach
iner
y (N
o.)
0.0
02
0.0
15
0.0
85
Tota
l Val
ue
of
Agr
icu
ltu
ral E
xpo
rts
0.8
29
49
.28
50
.89
70
.84
31
6.2
74
0.0
27
3.9
94
20
.77
61
09
.96
62
.18
40
.22
94
.53
9
Tota
l Val
ue
of
Ph
ilip
pin
e E
xpo
rts
98
.16
63
02
.02
21
.90
89
7.5
15
36
.09
23
.83
21
15
.47
53
59
.61
91
95
6.0
92
31
.81
31
43
.20
42
8.5
98
a/
less
th
an
0.0
01
Sou
rce
of
ba
sic
da
ta: N
ati
on
al
Sta
tist
ics
Off
ice
(NSO
)
(F.O
.B. V
alu
e in
'00
0 U
S $
) EUR
OP
EAN
UN
ION
Tab
le 9
b.
DIS
TRIB
UTI
ON
OF
PH
ILIP
PIN
E A
GR
ICU
LTU
RA
L EX
PO
RTS
TO
EU
MEM
BER
CO
UN
TRIE
S, 2
01
2
Item
BUREAU OF AGRICULTURAL STATISTICS BUREAU OF AGRICULTURAL STATISTICS
AGRICULTURAL FOREIGN TRADE DEVELOPMENT
2012 Annual Report
Soybeans. Prices of soybeans were down from January to March and climbed up throughout the year at varied rates. Price peaked in August at US$ 0.684/kg.
Rice. Uptrend in the international prices of rice 5% broken were recorded from January to August while downtrend from September to December of 2012. Price peaked in May at US$ 0.601/kg. Prices of rice 25% broken were decreasing at varied rates for most of the months except in January, July and August when price increases were posted. Highest price was recorded in July at US$ 0.555/kg. Prices of rice A1 Special moved up from January to August but slowed down in September, November and December. Price ranged from US$ 0.509/kg to US$ 0.562/kg. Maize (corn). In 2012, monthly fluctuations were observed in the prices of maize. Highest price was US$ 0.333/kg in July while lowest was US$ 0.267/kg in June. Coffee, Arabica. Coffee Arabica was relatively cheaper at the world market in 2012 compared to 2011. Price decreases were sustained throughout the year. Price ranged from US$ 3.367/kg, (December) to US$ 5.230/kg (January). Coffee, Robusta. Prices of Robusta Coffee were relatively lower in 2012; however prices were higher in October and November relative to 2011. Banana. Lower prices of banana were noted in the world market throughout 2012. Price cuts were from a low of 88.51 percent to a high of 90.23 percent compared to 2011. Prices ranged from US$ 0.934/kg to US$ 1.144 /kg. Rubber. Decreases were likewise noted on the world prices of rubber. Price ranged from US$ 2.595/kg to US$ 3.781/kg.
5 28
Ite
mTo
tal P
hili
pp
ine
Agr
icu
ltu
ral E
xpo
rts
Au
stra
liaJa
pan
USA
1.
Foo
d a
nd
Liv
e A
nim
als
3,1
97
.78
2
35
.73
5
6
20
.86
7
65
9.6
87
A
. Li
ve A
nim
als
(N
o.)
13
.91
9
0.0
13
1.4
41
0.9
28
B.
Mea
t a
nd
Mea
t P
rep
ara
tio
ns
67
.53
0
0.4
20
35
.40
2
1
.05
8
C
. D
air
y P
rod
uct
s a
nd
Bir
ds
Eggs
88
.37
2
0.1
86
0.1
22
0.9
55
D.
Fish
an
d F
ish
Pre
pa
rati
on
s8
10
.80
3
5
.68
3
1
19
.07
0
22
5.5
63
E.
Cer
eals
an
d C
erea
ls P
rep
ara
tio
ns
10
4.8
20
1.7
70
3.5
99
14
.94
0
F.
Veg
eta
ble
s a
nd
Fru
its
1,6
15
.17
6
23
.01
6
4
31
.00
0
32
8.1
90
G
. Su
gar
an
d S
uga
r P
rep
ara
tio
ns
20
9.8
39
0.9
63
17
.69
9
6
2.8
84
H.
Co
ffee
, Tea
, Co
coa
, Sp
ices
an
d M
an
ufa
ctu
res
ther
eof
9.7
23
0.1
96
0.0
86
1.5
03
I. F
eed
ing
Stu
ff f
or
An
ima
ls(e
xclu
din
g u
nm
ille
d C
erea
ls)
J. M
isce
lla
neo
us
Edib
le P
rod
uct
s a
nd
Pre
pa
rati
on
s1
44
.98
0
3
.44
1
5.8
67
23
.18
0
II.
Tob
acc
o a
nd
To
ba
cco
Ma
nu
fact
ure
s2
33
.77
9
0
.76
1
0
.02
7
1
2.8
71
III.
Cru
de
Ma
teri
als
27
7.7
07
5.8
15
6.6
55
48
.55
1
A
. O
il S
eed
s a
nd
Ole
gin
ou
s Fr
uit
s1
.42
8
-
-
0
.02
0
B
. C
rud
e R
ub
ber
62
.07
5
-
0
.07
6
1
.71
4
C
. C
rud
e Fe
rtil
izer
0.7
76
-
0
.13
5
-
D.
Cru
de
An
ima
l a
nd
Veg
s. M
ate
ria
ls2
13
.42
8
5
.81
5
6
.44
5
4
6.8
16
IV.
An
ima
l a
nd
Veg
eta
ble
Oil
an
d F
ats
1,1
91
.93
7
2.9
83
63
.88
7
4
82
.17
0
A.
An
ima
l a
nd
Veg
eta
ble
Oil
s a
nd
Fa
ts9
7.2
19
1
.26
5
1
.73
0
1
7.1
89
B.
Fixe
d V
eget
ab
le O
il a
nd
Fa
ts1
,09
4.7
18
1
.71
8
6
2.1
57
46
4.9
80
V.
Fert
iliz
er M
an
ufa
ctu
red
11
8.7
93
0.6
19
-
0
.00
4
VI.
Agr
icu
ltu
ral
Ch
emic
als
an
d M
ate
ria
ls1
3.0
73
2
.11
9
0
.16
8
0
.14
9
VII
. A
gric
ult
ura
l M
ach
iner
y (N
o.)
4.8
66
-
0
.24
9
0
.01
8
To
tal V
alu
e o
f A
gric
ult
ura
l Exp
ort
s5
,03
7.9
37
4
8.0
32
69
1.8
54
1
,20
3.4
49
Tota
l Val
ue
of
Ph
ilip
pin
e E
xpo
rts
52
,09
9.5
20
38
7.2
47
9
,87
9.8
97
7,4
08
.38
8
0.4
85
Tab
le 9
a. D
ISTR
IBU
TIO
N O
F P
HIL
IPP
INE
AG
RIC
ULT
UR
AL
EXP
OR
TS T
O A
UST
RA
LIA
, JA
PA
N, a
nd
USA
, 201
2(F
.O.B
. Val
ue
in
Mil
lio
n U
S $)
13
2.6
19
0
.04
8
6.5
81
BUREAU OF AGRICULTURAL STATISTICS BUREAU OF AGRICULTURAL STATISTICS
AGRICULTURAL FOREIGN TRADE DEVELOPMENT
2012 Annual Report
STATISTICAL TABLES AND
26
30
38
46
54
62
70
78
86
94
1st 2nd 3rd 4th
Val
ue
in M
USD
Quarter
Figure 22Value of Meat of Bovine Animals Imports,
by Quarter, 2011-2012
2012
2011
20
27
34
41
48
55
62
69
76
83
90
1st 2nd 3rd 4th
Val
ue
in M
USD
Quarter
Figure 21 Value of Coffee Imports, by Quarter, 2011-2012
2012
2011
5
10
15
20
25
30
35
40
45
1st 2nd 3rd 4th
Val
ue
in M
USD
Quarter
Figure 24Value of Maize/Corn Imports,
by Quarter, 2011-2012
2012
2011
10
20
30
40
50
60
1st 2nd 3rd 4th
Val
ue
in M
USD
Quarter
Figure 23 Value of Tobacco Unmanufactured Imports,
by Quarter, 2011-2012
2012
2011
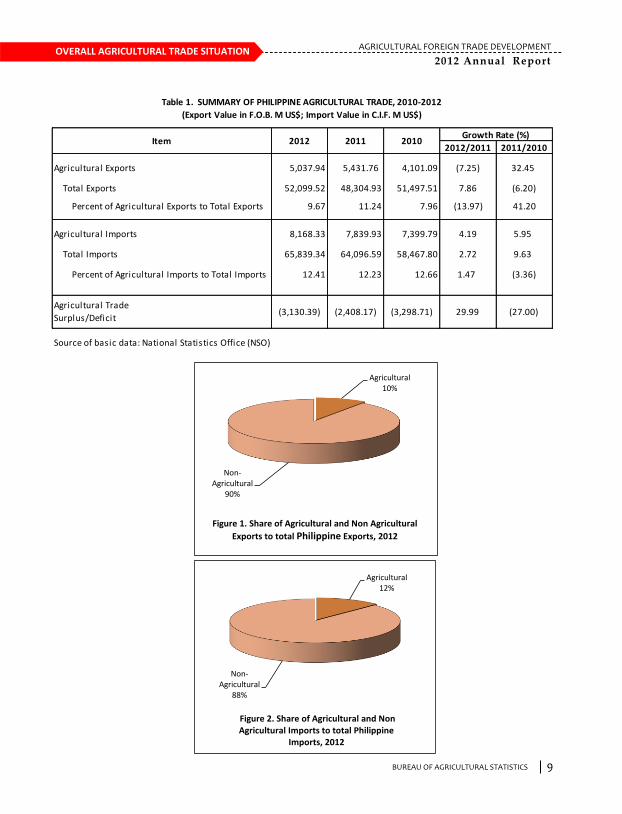
BUREAU OF AGRICULTURAL STATISTICS BUREAU OF AGRICULTURAL STATISTICS
AGRICULTURAL FOREIGN TRADE DEVELOPMENT
2012 Annual Report
9 24
OVERALL AGRICULTURAL TRADE SITUATION
2012/2011 2011/2010
Agricultural Exports 5,037.94 5,431.76 4,101.09 (7.25) 32.45
Total Exports 52,099.52 48,304.93 51,497.51 7.86 (6.20)
Percent of Agricultural Exports to Total Exports 9.67 11.24 7.96 (13.97) 41.20
Agricultural Imports 8,168.33 7,839.93 7,399.79 4.19 5.95
Total Imports 65,839.34 64,096.59 58,467.80 2.72 9.63
Percent of Agricultural Imports to Total Imports 12.41 12.23 12.66 1.47 (3.36)
Source of basic data: National Statistics Office (NSO)
(3,130.39)
Item 2012 2010
(3,298.71)
Table 1. SUMMARY OF PHILIPPINE AGRICULTURAL TRADE, 2010-2012
(Export Value in F.O.B. M US$; Import Value in C.I.F. M US$)
29.99 (27.00)
Growth Rate (%)2011
(2,408.17)Agricultural Trade
Surplus/Deficit
Quantity C.I.F. Value
COFFEE 104.57 251.14 100.00 100.00Indonesia (Includes West Irian) 61.32 141.12 58.64 56.19Vietnam 21.80 49.19 20.85 19.59Malaysia (Federation of Malaya) 4.14 28.64 3.96 11.40Thailand 6.84 21.70 6.54 8.64Singapore 9.40 6.45 8.99 2.57Others 1.07 4.04 1.02 1.61
MEAT OF BOVINE ANIMALS 82.58 238.70 100.00 100.00India 36.34 93.88 44.00 39.33Australia 25.30 85.06 30.63 35.63New Zealand (Excludes Western Samoa) 10.21 33.81 12.36 14.16United States of America 5.50 14.30 6.67 5.99Brazil 3.87 9.46 4.68 3.96Others 1.36 2.20 1.65 0.92
TOBACCO UNMANUFACTURED 52.59 144.59 100.00 100.01China, People's Republic of 15.41 33.63 29.30 23.26Turkey 5.01 13.10 9.53 9.06Brazil 5.64 15.62 10.73 10.81Belgium 3.30 14.06 6.27 9.73Malaysia(federation of Malaya) 1.21 9.85 2.31 6.81Others 22.01 58.33 41.86 40.34
MAIZE/CORN 136.57 88.52 100.01 100.00Thailand 79.25 31.02 58.02 35.04South Africa, Republic of 6.48 22.61 4.74 25.54Brazil 1.97 13.80 1.44 15.58India 20.51 5.41 15.02 6.11United States of America 7.62 5.04 5.58 5.69Others 20.76 10.64 15.20 12.03
Source of basic data: National Statistics Office (NSO)
Table 8. MAJOR SUPPLIERS OF TOP TEN PHILIPPINE AGRICULTURAL IMPORTS, 2012(Quantity in '000 M.T.; C.I.F. Values in Million US$) …Continued
Commodity/Country of Origin Quantity C.I.F. ValueShare (%)
Agricultural10%
Non-Agricultural
90%
Figure 1. Share of Agricultural and Non Agricultural
Exports to total Philippine Exports, 2012
Agricultural12%
Non-Agricultural
88%
Figure 2. Share of Agricultural and Non Agricultural Imports to total Philippine
Imports, 2012
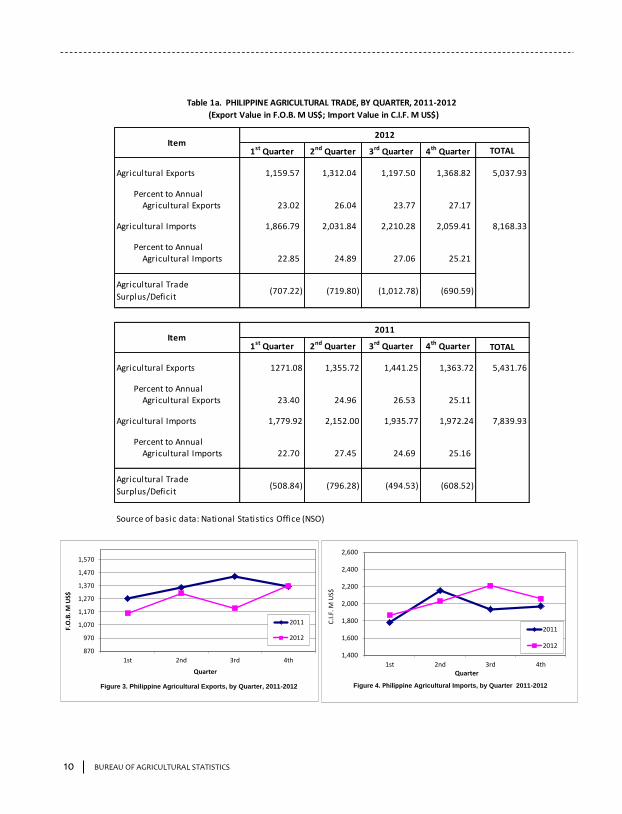
BUREAU OF AGRICULTURAL STATISTICS BUREAU OF AGRICULTURAL STATISTICS
AGRICULTURAL FOREIGN TRADE DEVELOPMENT
2012 Annual Report
23 10
1st Quarter 2nd Quarter 3rd Quarter 4th Quarter TOTAL
Agricultural Exports 1,159.57 1,312.04 1,197.50 1,368.82 5,037.93
Percent to AnnualAgricultural Exports 23.02 26.04 23.77 27.17
Agricultural Imports 1,866.79 2,031.84 2,210.28 2,059.41 8,168.33
Percent to AnnualAgricultural Imports 22.85 24.89 27.06 25.21
(707.22) (719.80) (1,012.78) (690.59)
1st Quarter 2nd Quarter 3rd Quarter 4th Quarter TOTAL
Agricultural Exports 1271.08 1,355.72 1,441.25 1,363.72 5,431.76
Percent to AnnualAgricultural Exports 23.40 24.96 26.53 25.11
Agricultural Imports 1,779.92 2,152.00 1,935.77 1,972.24 7,839.93
Percent to AnnualAgricultural Imports 22.70 27.45 24.69 25.16
(508.84) (796.28) (494.53) (608.52)
Source of basic data: National Statistics Office (NSO)
Item
Agricultural Trade
Surplus/Deficit
2011
2012
Agricultural Trade
Surplus/Deficit
Item
Table 1a. PHILIPPINE AGRICULTURAL TRADE, BY QUARTER, 2011-2012
(Export Value in F.O.B. M US$; Import Value in C.I.F. M US$)
Quantity C.I.F. Value
WHEAT (including spelt) & MESLIN 3,000.30 975.91 100.00 100.00United States of America 1,488.41 527.85 49.61 54.09Australia 1,356.16 399.20 45.20 40.91India 76.38 21.89 2.55 2.24Canada 49.28 16.65 1.64 1.71Singapore 21.47 7.23 0.72 0.74Others 8.60 3.09 0.29 0.32
SOYABEAN OIL/CAKE MEAL 1,455.57 689.32 100.00 100.00United States of America 978.70 481.52 67.24 69.85Argentina 438.71 189.04 30.14 27.42India 19.38 9.53 1.33 1.38Australia 15.39 7.47 1.06 1.08Taiwan (Republic of China) 0.82 0.65 0.06 0.09Others 2.56 1.11 0.18 0.16
MILK & CREAM AND PRODUCTS 283.43 644.35 100.00 100.00New Zealand (Excludes Western Samoa) 87.78 242.39 30.97 37.62United States of America 77.40 206.72 27.31 32.08Australia 25.17 71.78 8.88 11.14France 6.48 15.20 2.29 2.36Thailand 13.68 14.31 4.83 2.22Others 72.91 93.95 25.72 14.58
RICE 1,042.14 438.08 100.00 100.00Vietnam 843.94 359.28 80.98 82.01India 101.80 40.28 9.77 9.20Pakistan 42.31 13.39 4.06 3.06Myanmar 27.99 10.68 2.69 2.44Thailand 19.89 6.62 1.91 1.51Others 6.22 7.82 0.60 1.78
FERTILIZER MANUFACTURED 991.04 385.72 100.00 100.00China, People'S Republic of 443.78 164.77 44.78 42.72Canada 95.68 39.50 9.65 10.24Vietnam 81.18 35.78 8.19 9.28
Korea, Republic of South 96.78 32.16 9.77 8.34Japan (Excludes Okinawa) 104.68 30.28 10.56 7.85Others 168.95 83.23 17.05 21.58
UREA 616.03 252.39 100.00 100.00China, People's Republic of 231.74 92.81 37.62 36.77Malaysia (Federation Of Malaya) 134.83 55.15 21.89 21.85Indonesia (Includes West Irian) 103.16 42.17 16.75 16.71Singapore 46.04 21.98 7.47 8.71Vietnam 51.56 20.20 8.37 8.00Others 48.69 20.08 7.90 7.96
Table 8. MAJOR SUPPLIERS OF TOP TEN PHILIPPINE AGRICULTURAL IMPORTS, 2012(Quantity in '000 M.T.; C.I.F. Values in Million US$)
QuantityCommodity/Country of OriginShare (%)
C.I.F. Value
870
970
1,070
1,170
1,270
1,370
1,470
1,570
1st 2nd 3rd 4th
F.O
.B. M
US$
Quarter
2011
2012
Figure 3. Philippine Agricultural Exports, by Quarter, 2011-2012
1,400
1,600
1,800
2,000
2,200
2,400
2,600
1st 2nd 3rd 4th
C.I
.F. M
US$
Quarter
2011
2012
Figure 4. Philippine Agricultural Imports, by Quarter 2011-2012
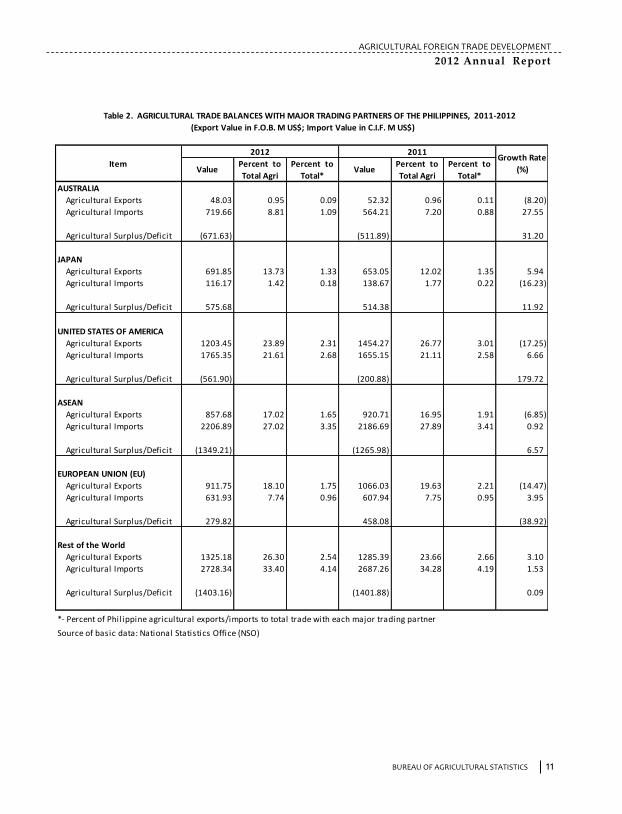
BUREAU OF AGRICULTURAL STATISTICS BUREAU OF AGRICULTURAL STATISTICS
AGRICULTURAL FOREIGN TRADE DEVELOPMENT
2012 Annual Report
11 22
AUSTRALIA
Agricultural Exports 48.03 0.95 0.09 52.32 0.96 0.11 (8.20)
Agricultural Imports 719.66 8.81 1.09 564.21 7.20 0.88 27.55
Agricultural Surplus/Deficit (671.63) (511.89) 31.20
JAPAN
Agricultural Exports 691.85 13.73 1.33 653.05 12.02 1.35 5.94
Agricultural Imports 116.17 1.42 0.18 138.67 1.77 0.22 (16.23)
Agricultural Surplus/Deficit 575.68 514.38 11.92
UNITED STATES OF AMERICA
Agricultural Exports 1203.45 23.89 2.31 1454.27 26.77 3.01 (17.25)
Agricultural Imports 1765.35 21.61 2.68 1655.15 21.11 2.58 6.66
Agricultural Surplus/Deficit (561.90) (200.88) 179.72
ASEAN
Agricultural Exports 857.68 17.02 1.65 920.71 16.95 1.91 (6.85)
Agricultural Imports 2206.89 27.02 3.35 2186.69 27.89 3.41 0.92
Agricultural Surplus/Deficit (1349.21) (1265.98) 6.57
EUROPEAN UNION (EU)
Agricultural Exports 911.75 18.10 1.75 1066.03 19.63 2.21 (14.47)
Agricultural Imports 631.93 7.74 0.96 607.94 7.75 0.95 3.95
Agricultural Surplus/Deficit 279.82 458.08 (38.92)
Rest of the World
Agricultural Exports 1325.18 26.30 2.54 1285.39 23.66 2.66 3.10
Agricultural Imports 2728.34 33.40 4.14 2687.26 34.28 4.19 1.53
Agricultural Surplus/Deficit (1403.16) (1401.88) 0.09
*- Percent of Philippine agricultural exports/imports to total trade with each major trading partner
Source of basic data: National Statistics Office (NSO)
Table 2. AGRICULTURAL TRADE BALANCES WITH MAJOR TRADING PARTNERS OF THE PHILIPPINES, 2011-2012
(Export Value in F.O.B. M US$; Import Value in C.I.F. M US$)
ItemGrowth Rate
(%)
2012 2011
ValuePercent to
Total*
Percent to
Total Agri
Percent to
Total AgriValue
Percent to
Total*
1st
Qu
arte
r2
nd
Qu
arte
r3rd
Qu
arte
r4
th Q
uar
ter
Tota
l1
st Q
uar
ter
2n
d Q
uar
ter3
rd Q
uar
ter
4th
Qu
arte
rTo
tal
Wh
eat
(in
clu
din
g sp
elt)
& M
esli
n2
09
.58
22
5.5
5
2
95
.44
24
5.3
5
9
75
.91
22
0.2
3
1
90
.81
23
8.6
6
3
11
.92
96
1.6
2
So
yab
ean
Oil
Ca
ke /
Mea
l 1
33
.61
16
9.7
2
1
55
.90
23
0.0
9
6
89
.32
15
6.9
1
1
43
.59
12
9.0
2
1
47
.10
57
6.6
2
Mil
k &
Cre
am
an
d P
rod
uct
s1
71
.92
17
1.3
5
1
58
.86
14
2.2
2
6
44
.35
17
2.1
3
1
84
.97
17
0.7
0
1
61
.00
68
8.7
9
Ric
e2
9.9
4
13
7.9
7
2
05
.46
64
.72
4
38
.08
3.5
4
2
33
.67
13
6.5
8
9
.36
38
3.1
5
Fer
tili
zer
Ma
nu
fact
ure
d6
9.7
4
89
.60
1
35
.14
91
.23
3
85
.72
72
.32
8
9.6
1
73
.82
9
1.3
9
32
7.1
3
Ure
a5
1.3
4
46
.81
7
8.0
2
76
.21
2
52
.39
59
.28
5
0.4
5
45
.00
7
9.1
8
23
3.9
2
Co
ffee
67
.68
6
1.3
6
64
.61
5
7.5
1
25
1.1
43
0.9
0
32
.07
2
9.3
5
27
.83
1
20
.15
Mea
t o
f B
ovi
ne
An
ima
ls5
4.8
1
52
.41
6
4.8
1
66
.67
2
38
.70
66
.87
7
1.2
7
54
.03
4
6.7
1
23
8.8
7
To
ba
cco
Un
ma
nu
fact
ure
d4
6.2
5
48
.95
3
0.5
1
18
.87
1
44
.59
32
.95
4
7.7
7
35
.75
3
7.8
6
15
4.3
3
Ma
ize/
Co
rn3
9.0
2
24
.39
7
.36
17
.75
8
8.5
29
.27
17
.33
6.5
21
4.9
14
8.0
2
Sou
rce
of
ba
sic
da
ta: N
ati
on
al
Sta
tist
ics
Off
ice
(NSO
)
ITEM
20
12
20
11
Tab
le 7
a. V
ALU
E O
F TO
P T
EN A
GR
ICU
LTU
RA
L IM
PO
RTS
, BY
QU
AR
TER
201
1-20
12(C
.I.F
. Val
ue
in M
illi
on
US
$)
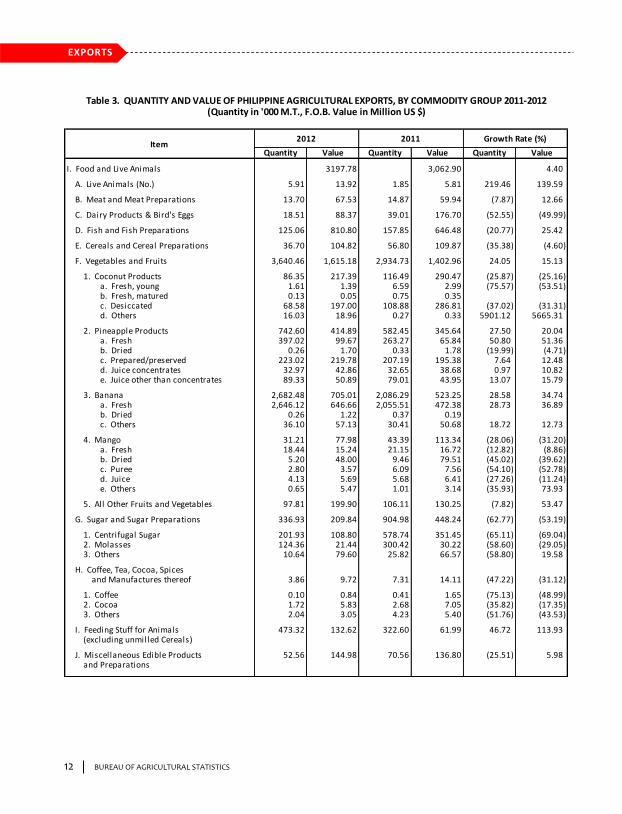
BUREAU OF AGRICULTURAL STATISTICS BUREAU OF AGRICULTURAL STATISTICS
AGRICULTURAL FOREIGN TRADE DEVELOPMENT
2012 Annual Report
21 12
EXPORTS
Quantity Value Quantity Value Quantity Value
I. Food and Live Animals 3197.78 3,062.90 4.40
A. Live Animals (No.) 5.91 13.92 1.85 5.81 219.46 139.59
B. Meat and Meat Preparations 13.70 67.53 14.87 59.94 (7.87) 12.66
C. Dairy Products & Bird's Eggs 18.51 88.37 39.01 176.70 (52.55) (49.99)
D. Fish and Fish Preparations 125.06 810.80 157.85 646.48 (20.77) 25.42
E. Cereals and Cereal Preparations 36.70 104.82 56.80 109.87 (35.38) (4.60)
F. Vegetables and Fruits 3,640.46 1,615.18 2,934.73 1,402.96 24.05 15.13
1. Coconut Products 86.35 217.39 116.49 290.47 (25.87) (25.16)a. Fresh, young 1.61 1.39 6.59 2.99 (75.57) (53.51)b. Fresh, matured 0.13 0.05 0.75 0.35c. Desiccated 68.58 197.00 108.88 286.81 (37.02) (31.31)d. Others 16.03 18.96 0.27 0.33 5901.12 5665.31
2. Pineapple Products 742.60 414.89 582.45 345.64 27.50 20.04a. Fresh 397.02 99.67 263.27 65.84 50.80 51.36b. Dried 0.26 1.70 0.33 1.78 (19.99) (4.71)c. Prepared/preserved 223.02 219.78 207.19 195.38 7.64 12.48d. Juice concentrates 32.97 42.86 32.65 38.68 0.97 10.82e. Juice other than concentrates 89.33 50.89 79.01 43.95 13.07 15.79
3. Banana 2,682.48 705.01 2,086.29 523.25 28.58 34.74a. Fresh 2,646.12 646.66 2,055.51 472.38 28.73 36.89b. Dried 0.26 1.22 0.37 0.19c. Others 36.10 57.13 30.41 50.68 18.72 12.73
4. Mango 31.21 77.98 43.39 113.34 (28.06) (31.20)a. Fresh 18.44 15.24 21.15 16.72 (12.82) (8.86)b. Dried 5.20 48.00 9.46 79.51 (45.02) (39.62)c. Puree 2.80 3.57 6.09 7.56 (54.10) (52.78)d. Juice 4.13 5.69 5.68 6.41 (27.26) (11.24)e. Others 0.65 5.47 1.01 3.14 (35.93) 73.93
5. All Other Fruits and Vegetables 97.81 199.90 106.11 130.25 (7.82) 53.47
G. Sugar and Sugar Preparations 336.93 209.84 904.98 448.24 (62.77) (53.19)
1. Centrifugal Sugar 201.93 108.80 578.74 351.45 (65.11) (69.04)2. Molasses 124.36 21.44 300.42 30.22 (58.60) (29.05)3. Others 10.64 79.60 25.82 66.57 (58.80) 19.58
H. Coffee, Tea, Cocoa, Spices and Manufactures thereof 3.86 9.72 7.31 14.11 (47.22) (31.12)
1. Coffee 0.10 0.84 0.41 1.65 (75.13) (48.99)2. Cocoa 1.72 5.83 2.68 7.05 (35.82) (17.35)3. Others 2.04 3.05 4.23 5.40 (51.76) (43.53)
I. Feeding Stuff for Animals 473.32 132.62 322.60 61.99 46.72 113.93(excluding unmilled Cereals)
J. Miscellaneous Edible Products 52.56 144.98 70.56 136.80 (25.51) 5.98and Preparations
Table 3. QUANTITY AND VALUE OF PHILIPPINE AGRICULTURAL EXPORTS, BY COMMODITY GROUP 2011-2012(Quantity in '000 M.T., F.O.B. Value in Million US $)
Growth Rate (%)Item
2012 2011
Qu
anti
tyC
.I.F.
Val
ue
1.
WH
EAT
(in
clu
din
g sp
elt)
& M
ESLI
N3
,00
0.3
0
97
5.9
1
1
1.9
5
2,7
87
.17
9
61
.62
12
.27
7
.65
1.4
9
2. S
OYA
BEA
N O
IL/C
AK
E M
EAL
1,4
55
.57
6
89
.32
8.4
4
2
,06
8.9
3
57
6.6
2
7
.35
(29
.65
)1
9.5
4
3.
MIL
K &
CR
EAM
an
d P
RO
DU
CTS
28
3.4
3
6
44
.35
7.8
9
2
73
.87
68
8.7
9
8
.79
3.4
9(6
.45
)
4.
RIC
E1
,04
2.1
4
43
8.0
8
5
.36
70
7.6
7
3
83
.15
4.8
9
4
7.2
61
4.3
4
5.
FER
TILI
ZER
MA
NU
FAC
TUR
ED9
91
.04
38
5.7
2
4
.72
88
9.9
7
3
27
.13
4.1
7
1
1.3
61
7.9
1
6.
UR
EA6
16
.03
25
2.3
9
3
.09
57
7.5
1
2
33
.92
2.9
8
6
.67
7.9
0
7. C
OFF
EE1
04
.57
25
1.1
4
3
.07
51
.61
1
20
.15
1.5
3
1
02
.62
10
9.0
2
8. M
EAT
OF
BO
VIN
E A
NIM
ALS
82
.58
2
38
.70
2.9
2
8
3.9
9
23
8.8
7
3
.05
(1.6
8)
(0.0
7)
9.T
OB
AC
CO
UN
MA
NU
FAC
TUR
ED5
2.5
9
14
4.5
9
1
.77
54
.54
1
54
.33
1.9
7
(3
.57
)(6
.31
)
10
. MA
IZE/
CO
RN
13
6.5
7
8
8.5
2
1.0
8
6
6.1
9
48
.02
0
.61
10
6.3
38
4.3
5
Tota
l o
f To
p 1
0 A
gric
ult
ura
l Im
po
rts
4,1
08
.71
50
.30
3
,73
2.6
14
7.6
1
10
.08
Oth
er A
gric
ult
ura
l Im
po
rts
4,0
59
.62
49
.70
4
,10
7.3
25
2.3
9
(1.1
6)
Tota
l A
gric
ult
ura
l Im
po
rts
8,1
68
.33
7,8
39
.93
4.1
9
So
urc
e o
f b
asi
c d
ata
: Na
tio
na
l St
ati
stic
s O
ffic
e (N
SO)
C.I.
F. V
alu
e%
Sh
are
Tab
le 7
. TO
P T
EN A
GR
ICU
LTU
RA
L IM
PO
RTS
, 201
1-20
12(Q
uan
tity
in '0
00 M
.T.;
C.I
.F. V
alu
e in
Mil
lio
n U
S$)
Ite
mG
row
th R
ate
(%
)2
01
1
Qu
anti
ty%
S
har
e
20
12
Qu
anti
tyC
.I.F.
Val
ue
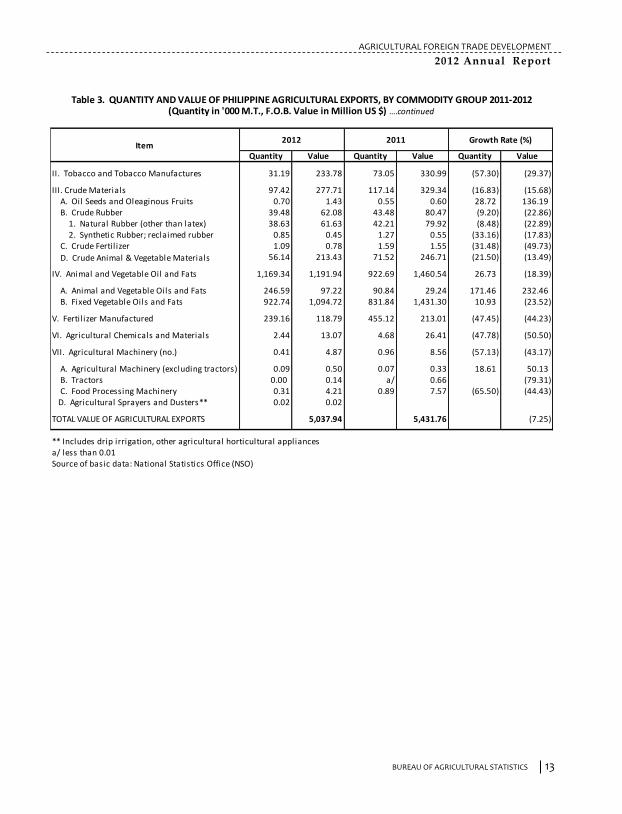
BUREAU OF AGRICULTURAL STATISTICS BUREAU OF AGRICULTURAL STATISTICS
AGRICULTURAL FOREIGN TRADE DEVELOPMENT
2012 Annual Report
13 20
IMPORTS
Quantity Value Quantity Value Quantity Value
II. Tobacco and Tobacco Manufactures 31.19 233.78 73.05 330.99 (57.30) (29.37)
III. Crude Materials 97.42 277.71 117.14 329.34 (16.83) (15.68)A. Oil Seeds and Oleaginous Fruits 0.70 1.43 0.55 0.60 28.72 136.19B. Crude Rubber 39.48 62.08 43.48 80.47 (9.20) (22.86)
1. Natural Rubber (other than latex) 38.63 61.63 42.21 79.92 (8.48) (22.89)2. Synthetic Rubber; reclaimed rubber 0.85 0.45 1.27 0.55 (33.16) (17.83)
C. Crude Fertil izer 1.09 0.78 1.59 1.55 (31.48) (49.73)
D. Crude Animal & Vegetable Materials 56.14 213.43 71.52 246.71 (21.50) (13.49)
IV. Animal and Vegetable Oil and Fats 1,169.34 1,191.94 922.69 1,460.54 26.73 (18.39)
A. Animal and Vegetable Oils and Fats 246.59 97.22 90.84 29.24 171.46 232.46B. Fixed Vegetable Oils and Fats 922.74 1,094.72 831.84 1,431.30 10.93 (23.52)
V. Fertil izer Manufactured 239.16 118.79 455.12 213.01 (47.45) (44.23)
VI. Agricultural Chemicals and Materials 2.44 13.07 4.68 26.41 (47.78) (50.50)
VII. Agricultural Machinery (no.) 0.41 4.87 0.96 8.56 (57.13) (43.17)
A. Agricultural Machinery (excluding tractors) 0.09 0.50 0.07 0.33 18.61 50.13B. Tractors 0.00 0.14 a/ 0.66 (79.31)C. Food Processing Machinery 0.31 4.21 0.89 7.57 (65.50) (44.43)
D. Agricultural Sprayers and Dusters** 0.02 0.02
TOTAL VALUE OF AGRICULTURAL EXPORTS 5,037.94 5,431.76 (7.25)
** Includes drip irrigation, other agricultural horticultural appliancesa/ less than 0.01Source of basic data: National Statistics Office (NSO)
Table 3. QUANTITY AND VALUE OF PHILIPPINE AGRICULTURAL EXPORTS, BY COMMODITY GROUP 2011-2012(Quantity in '000 M.T., F.O.B. Value in Million US $) ….continued
Item2012 2011 Growth Rate (%)
Quantity C.I.F. Value Quantity C.I.F. Value Quantity C.I.F. Value
I. Food and Live Animals 6,106.15 5,685.18 7.40
A. Live Animals (no.) 0.86 29.47 0.49 18.33 76.05 60.78
B. Meat and Meat Preparations 347.96 492.49 370.07 441.09 (5.97) 11.65
C. Dairy Products & Bird's Eggs 321.70 792.74 312.71 872.39 2.87 (9.13)
D. Fish and Fish Preparations 240.63 232.18 186.77 172.70 28.84 34.44
E. Cereals and Cereal Preparations 4,618.53 1,758.68 3,929.14 1,635.34 17.55 7.54
F. Vegetables and Fruits 595.61 412.50 542.32 357.71 9.83 15.32
G. Sugar and Sugar Preparations 304.32 235.53 360.43 243.48 (15.57) (3.26)
H. Coffee, Tea, Cocoa, Spices 139.16 363.66 101.73 268.91 36.79 35.24and Manufactures thereof
I. Feeding Stuff for Animals 2,030.67 1,063.77 2,704.40 932.97 (24.91) 14.02(excluding unmilled Cereals)
J. Miscellaneous Edible Products 286.77 725.13 319.62 742.26 (81.97) (77.64)and Preparations
II. Tobacco and Tobacco Manufactures 57.62 165.95 58.23 166.59 (1.06) (0.38)
III. Crude Materials 747.54 311.64 779.90 350.51 (4.15) (11.09)
A. Oil Seeds and Oleaginous Fruits 198.81 100.73 250.67 121.55 (20.69) (17.13)B. Crude Rubber 17.26 35.38 15.71 34.90 9.90 1.38C. Crude Fertil izer 485.69 82.35 474.45 90.71 2.37 (9.21)D. Crude Animal & Vegetable Materials 45.77 93.17 39.08 103.36 17.12 (9.85)
( including hides, skins and furkins, raw)
IV. Animal and Vegetable Oil and Fats 402.58 409.06 605.84 571.13 (33.55) (28.38)
A. Animal and Vegetable Oils and Fats 298.03 291.76 499.20 439.16 (40.30) (33.57)B. Fixed Vegetable Oils and Fats 104.55 117.30 106.64 131.97 (1.95) (11.11)
V. Fertil izer Manufactured 1,607.07 638.10 1,467.48 561.05 9.51 13.73
VI. Agricultural Chemicals and Materials 257.23 399.74 227.54 364.24 13.05 9.75
VII. Agricultural Machinery (no.) 7.82 137.68 8.42 141.23 (7.16) (2.51)
A. Agricultural Machinery (excluding tractors) 4.33 69.29 4.07 46.21 6.32 49.96B. Tractors 0.003 7.06 0.021 13.94 (88.07) (49.37)C. Food Processing Machines 2.98 58.35 4.02 77.63 (25.97) (24.84)D. Agricultural Sprayers and Dusters* 0.51 2.99 0.31 3.45 65.34 (13.45)
TOTAL VALUE OF AGRICULTURAL IMPORTS 8,168.33 7,839.93 4.19
*- Includes drip irrigation, other agricultural or horticultural appliancesSource of basic data: National Statistics Office (NSO)
Table 6. QUANTITY AND VALUE OF PHILIPPINE AGRICULTURAL IMPORTS, BY COMMODITY GROUP 2011-2012
(Quantity in '000 M.T.; C.I.F Value in Million US $)
ITEM2012 2011 Growth Rate (%)
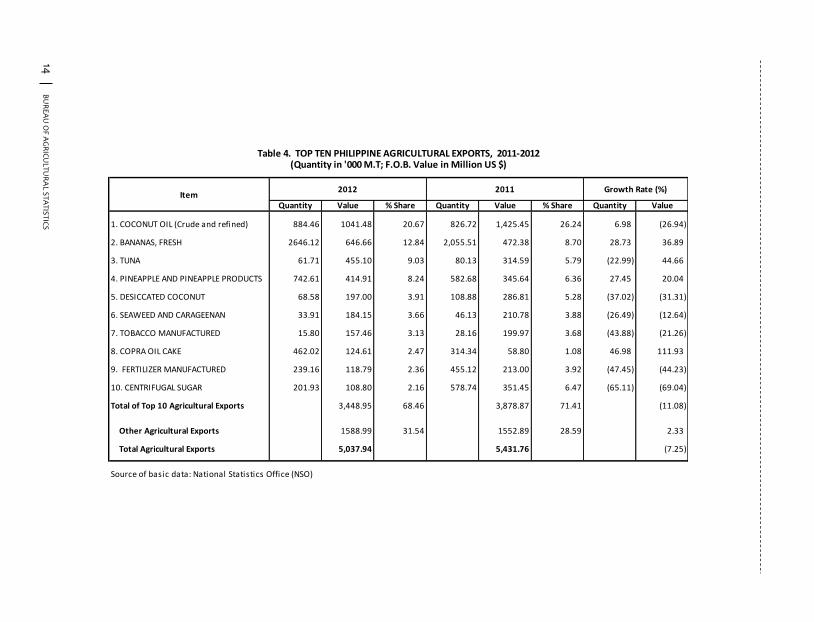
B
UR
EA
U O
F AG
RIC
ULTU
RA
L STA
TIST
ICS
B
UR
EA
U O
F AG
RIC
ULTU
RA
L STA
TISTIC
S
AG
RIC
ULT
UR
AL FO
RE
IGN
TR
AD
E D
EV
ELO
PM
EN
T
20
12
An
nu
al R
ep
ort
19
14
Quantity Value % Share Quantity Value % Share Quantity Value
1. COCONUT OIL (Crude and refined) 884.46 1041.48 20.67 826.72 1,425.45 26.24 6.98 (26.94)
2. BANANAS, FRESH 2646.12 646.66 12.84 2,055.51 472.38 8.70 28.73 36.89
3. TUNA 61.71 455.10 9.03 80.13 314.59 5.79 (22.99) 44.66
4. PINEAPPLE AND PINEAPPLE PRODUCTS 742.61 414.91 8.24 582.68 345.64 6.36 27.45 20.04
5. DESICCATED COCONUT 68.58 197.00 3.91 108.88 286.81 5.28 (37.02) (31.31)
6. SEAWEED AND CARAGEENAN 33.91 184.15 3.66 46.13 210.78 3.88 (26.49) (12.64)
7. TOBACCO MANUFACTURED 15.80 157.46 3.13 28.16 199.97 3.68 (43.88) (21.26)
8. COPRA OIL CAKE 462.02 124.61 2.47 314.34 58.80 1.08 46.98 111.93
9. FERTILIZER MANUFACTURED 239.16 118.79 2.36 455.12 213.00 3.92 (47.45) (44.23)
10. CENTRIFUGAL SUGAR 201.93 108.80 2.16 578.74 351.45 6.47 (65.11) (69.04)
Total of Top 10 Agricultural Exports 3,448.95 68.46 3,878.87 71.41 (11.08)
Other Agricultural Exports 1588.99 31.54 1552.89 28.59 2.33
Total Agricultural Exports 5,037.94 5,431.76 (7.25)
Source of basic data: National Statistics Office (NSO)
Table 4. TOP TEN PHILIPPINE AGRICULTURAL EXPORTS, 2011-2012(Quantity in '000 M.T; F.O.B. Value in Million US $)
Growth Rate (%)Item
2012 2011
0
20
40
60
80
10
0
12
0
14
0
16
0
1st
2n
d3
rd4
th
Value in M USD
Qu
arter
Figure
14
Valu
e o
f Ce
ntrifu
gal Sugar Exp
orts
by Q
uarte
r, 20
11
-20
12
20
12
20
11
5
10
15
20
25
30
35
40
45
50
55
1st
2n
d3
rd4
th
Value in M USD
Qu
arter
Figure
12
Valu
e o
f Co
pra O
il Cake
Expo
rts,b
y Qu
arter, 2
01
1-2
01
2
20
12
20
11
10
20
30
40
50
60
70
80
90
1st
2n
d3
rd4
th
Value in M USD
Qu
arter
Figure
13
Valu
e o
f Fertilize
r Man
ufactu
red
Expo
rts, b
y Qu
arter, 2
01
1-2
01
2
20
12
20
11
5
15
25
35
45
55
65
75
1st
2n
d3
rd4
th
Value in M USD
Qu
arter
Figure
11
Valu
e o
f Tob
acco M
anu
facture
d Exp
orts,
by Q
uarte
r , 20
11
-20
12
20
12
20
11
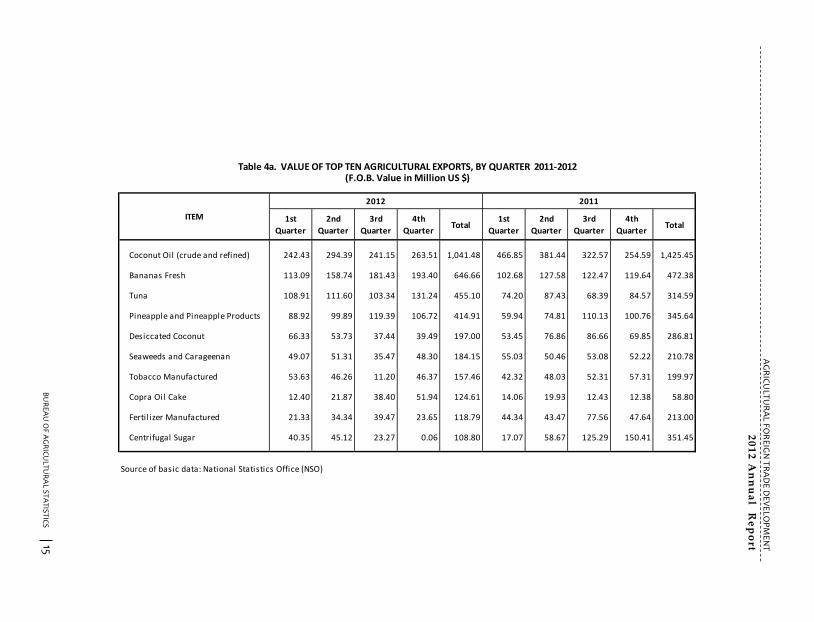
B
UR
EA
U O
F AG
RIC
ULTU
RA
L STA
TIST
ICS
B
UR
EA
U O
F AG
RIC
ULTU
RA
L STA
TISTIC
S
AG
RIC
ULT
UR
AL FO
RE
IGN
TR
AD
E D
EV
ELO
PM
EN
T
20
12
An
nu
al R
ep
ort
15 18
1st
Quarter
2nd
Quarter
3rd
Quarter
4th
QuarterTotal
1st
Quarter
2nd
Quarter
3rd
Quarter
4th
QuarterTotal
Coconut Oil (crude and refined) 242.43 294.39 241.15 263.51 1,041.48 466.85 381.44 322.57 254.59 1,425.45
Bananas Fresh 113.09 158.74 181.43 193.40 646.66 102.68 127.58 122.47 119.64 472.38
Tuna 108.91 111.60 103.34 131.24 455.10 74.20 87.43 68.39 84.57 314.59
Pineapple and Pineapple Products 88.92 99.89 119.39 106.72 414.91 59.94 74.81 110.13 100.76 345.64
Desiccated Coconut 66.33 53.73 37.44 39.49 197.00 53.45 76.86 86.66 69.85 286.81
Seaweeds and Carageenan 49.07 51.31 35.47 48.30 184.15 55.03 50.46 53.08 52.22 210.78
Tobacco Manufactured 53.63 46.26 11.20 46.37 157.46 42.32 48.03 52.31 57.31 199.97
Copra Oil Cake 12.40 21.87 38.40 51.94 124.61 14.06 19.93 12.43 12.38 58.80
Fertil izer Manufactured 21.33 34.34 39.47 23.65 118.79 44.34 43.47 77.56 47.64 213.00
Centrifugal Sugar 40.35 45.12 23.27 0.06 108.80 17.07 58.67 125.29 150.41 351.45
Source of basic data: National Statistics Office (NSO)
ITEM
2012 2011
Table 4a. VALUE OF TOP TEN AGRICULTURAL EXPORTS, BY QUARTER 2011-2012(F.O.B. Value in Million US $)
16
0
21
0
26
0
31
0
36
0
41
0
46
0
1st
2n
d3
rd4
th
Value in M USD
Qu
arter
Figure
5V
alue
of C
oco
nu
t Oil Exp
orts,
by Q
uarte
r, 20
11
-20
12
20
12
20
11
90
11
0
13
0
15
0
17
0
19
0
21
0
23
0
1st
2n
d3
rd4
th
Value in M USD
Qu
arter
Figure
6V
alue
of B
anan
a, Fresh
, Expo
rts, B
y Qu
arter, 2
01
1-2
01
2
20
12
20
11
50
60
70
80
90
10
0
11
0
12
0
13
0
14
0
1st
2n
d3rd
4th
Value in M USD
Qu
arter
Figure
7V
alue
of Tu
na, Exp
orts
by Q
uarte
r, 20
11
-20
12
20
12
20
11
50
60
70
80
90
10
0
11
0
12
0
13
0
1st
2nd
3rd
4th
Value in M USD
Qu
arter
Figure
8V
alue
of P
ine
app
le an
d P
ine
app
le P
rod
ucts
Expo
rts, by Q
uarte
r , 20
11
-20
12
20
12
20
11
30
35
40
45
50
55
60
1st
2n
d3
rd4
th
Value in M USD
Qu
arter
Figure
10
Valu
e o
f Seaw
ee
ds an
d C
aragee
nan
Expo
rts,b
y Qu
arter, 2
01
1-2
01
2
20
12
20
11
20
30
40
50
60
70
80
90
1st
2n
d3
rd4
th
Value in M USD
Qu
arter
Figure
9V
alue
of D
essicate
d C
oco
nu
t Expo
rts, b
y Qu
arter , 2
01
1-2
01
2
20
12
20
11
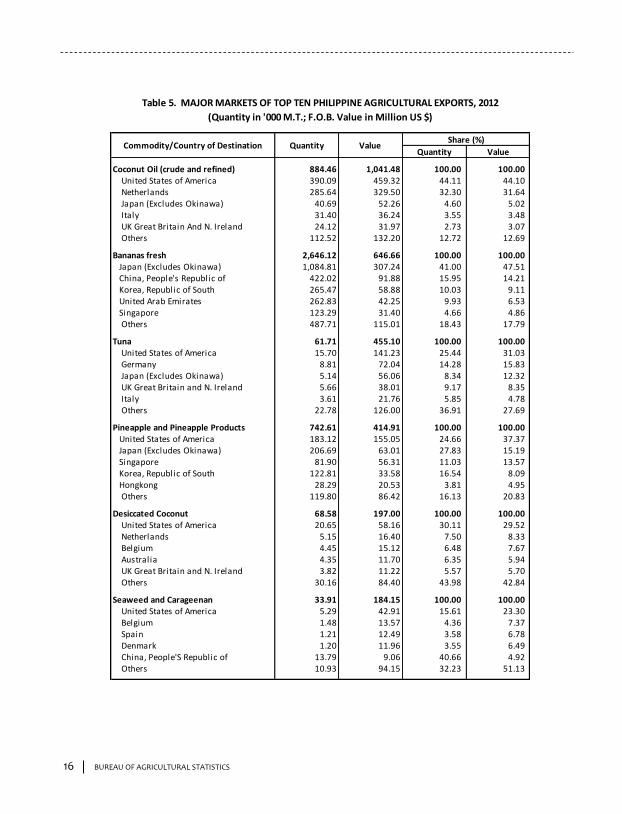
BUREAU OF AGRICULTURAL STATISTICS BUREAU OF AGRICULTURAL STATISTICS
AGRICULTURAL FOREIGN TRADE DEVELOPMENT
2012 Annual Report
17 16
Quantity Value
Coconut Oil (crude and refined) 884.46 1,041.48 100.00 100.00 United States of America 390.09 459.32 44.11 44.10 Netherlands 285.64 329.50 32.30 31.64 Japan (Excludes Okinawa) 40.69 52.26 4.60 5.02 Italy 31.40 36.24 3.55 3.48 UK Great Britain And N. Ireland 24.12 31.97 2.73 3.07 Others 112.52 132.20 12.72 12.69
Bananas fresh 2,646.12 646.66 100.00 100.00 Japan (Excludes Okinawa) 1,084.81 307.24 41.00 47.51 China, People's Republic of 422.02 91.88 15.95 14.21 Korea, Republic of South 265.47 58.88 10.03 9.11 United Arab Emirates 262.83 42.25 9.93 6.53 Singapore 123.29 31.40 4.66 4.86
Others 487.71 115.01 18.43 17.79
Tuna 61.71 455.10 100.00 100.00 United States of America 15.70 141.23 25.44 31.03 Germany 8.81 72.04 14.28 15.83 Japan (Excludes Okinawa) 5.14 56.06 8.34 12.32 UK Great Britain and N. Ireland 5.66 38.01 9.17 8.35 Italy 3.61 21.76 5.85 4.78
Others 22.78 126.00 36.91 27.69
Pineapple and Pineapple Products 742.61 414.91 100.00 100.00 United States of America 183.12 155.05 24.66 37.37 Japan (Excludes Okinawa) 206.69 63.01 27.83 15.19 Singapore 81.90 56.31 11.03 13.57 Korea, Republic of South 122.81 33.58 16.54 8.09 Hongkong 28.29 20.53 3.81 4.95
Others 119.80 86.42 16.13 20.83
Desiccated Coconut 68.58 197.00 100.00 100.00 United States of America 20.65 58.16 30.11 29.52 Netherlands 5.15 16.40 7.50 8.33 Belgium 4.45 15.12 6.48 7.67 Australia 4.35 11.70 6.35 5.94 UK Great Britain and N. Ireland 3.82 11.22 5.57 5.70 Others 30.16 84.40 43.98 42.84
Seaweed and Carageenan 33.91 184.15 100.00 100.00 United States of America 5.29 42.91 15.61 23.30 Belgium 1.48 13.57 4.36 7.37 Spain 1.21 12.49 3.58 6.78 Denmark 1.20 11.96 3.55 6.49 China, People'S Republic of 13.79 9.06 40.66 4.92 Others 10.93 94.15 32.23 51.13
Table 5. MAJOR MARKETS OF TOP TEN PHILIPPINE AGRICULTURAL EXPORTS, 2012
(Quantity in '000 M.T.; F.O.B. Value in Million US $)
Share (%)Commodity/Country of Destination Quantity Value
Quantity Value
Tobacco Manufactured 15.80 157.46 100.00 100.00 Thailand 5.14 57.82 32.52 36.72 Korea, Republic of South 4.60 46.59 29.08 29.59 Singapore 1.82 15.01 11.53 9.53 Indonesia (Includes West Irian) 0.25 14.04 1.59 8.92 Vietnam 1.66 8.61 10.51 5.47 Others 2.33 15.38 14.77 9.77
Copra Oil Cake 462.02 124.61 100.00 100.00 Korea, Republic of South 261.88 61.84 56.68 49.63 Vietnam 115.84 31.85 25.07 25.56 China, People'S Republic of 39.92 7.61 8.64 6.11 Netherlands 0.00 7.58 0.00 6.08 Pakistan 8.44 4.98 1.83 4.00 Others 35.95 10.75 7.78 8.63
Fertilizer Manufactured 239.16 118.79 100.00 100.00 Vietnam 187.01 96.75 78.19 81.44 Thailand 49.76 20.68 20.81 17.41 Australia 1.02 0.62 0.43 0.52 Turkey 0.50 0.36 0.21 0.30 China, People'S Republic of 0.30 0.17 0.13 0.15 Others 0.57 0.22 0.24 0.18
Centrifugal Sugar 201.93 108.80 100.00 100.00 United States of America 107.40 60.97 53.18 56.04 China, People'S Republic of 50.26 24.08 24.89 22.13 Japan (Excludes Okinawa) 21.00 11.01 10.40 10.12 Korea, Republic of South 9.92 5.46 4.91 5.02 Indonesia (Includes West Irian) 6.85 3.64 3.39 3.35 Others 6.50 3.65 3.22 3.35
Source of basic data: National Statistics Office (NSO)
Quantity ValueShare (%)
Table 5. MAJOR MARKETS OF TOP TEN PHILIPPINE AGRICULTURAL EXPORTS, 2012
(Quantity in '000 M.T.; F.O.B. Value in Million US $) …Continued
Commodity/Country of Destination
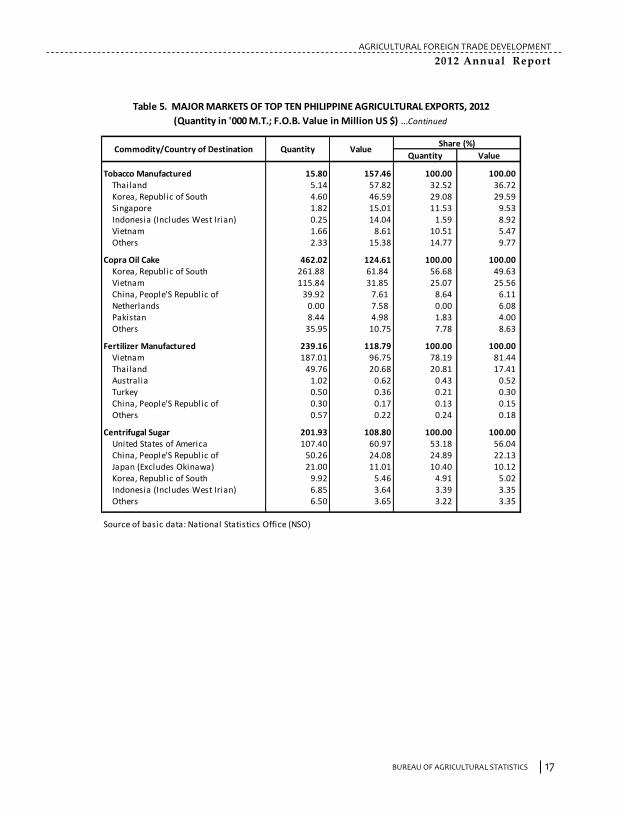
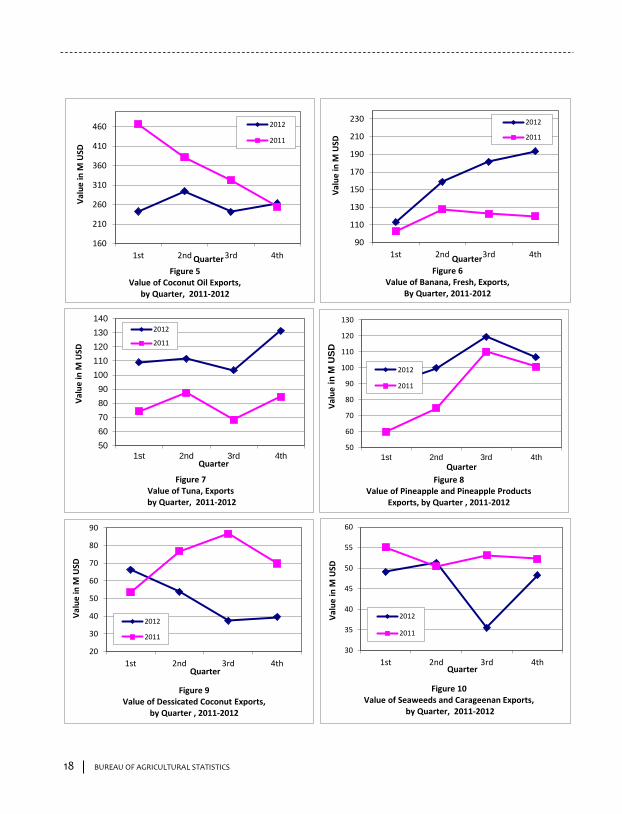
BUREAU OF AGRICULTURAL STATISTICS BUREAU OF AGRICULTURAL STATISTICS
AGRICULTURAL FOREIGN TRADE DEVELOPMENT
2012 Annual Report
15 18
1st
Qu
arte
r
2n
d
Qu
arte
r
3rd
Qu
arte
r
4th
Qu
arte
rTo
tal
1st
Qu
arte
r
2n
d
Qu
arte
r
3rd
Qu
arte
r
4th
Qu
arte
rTo
tal
Co
con
ut
Oil
(cr
ud
e a
nd
ref
ined
)2
42
.43
29
4.3
92
41
.15
26
3.5
11
,04
1.4
84
66
.85
38
1.4
43
22
.57
25
4.5
91
,42
5.4
5
Ba
na
na
s Fr
esh
11
3.0
91
58
.74
18
1.4
31
93
.40
64
6.6
61
02
.68
12
7.5
81
22
.47
11
9.6
44
72
.38
Tun
a1
08
.91
11
1.6
01
03
.34
13
1.2
44
55
.10
74
.20
87
.43
68
.39
84
.57
31
4.5
9
Pin
eap
ple
an
d P
inea
pp
le P
rod
uct
s8
8.9
29
9.8
91
19
.39
10
6.7
24
14
.91
59
.94
74
.81
11
0.1
31
00
.76
34
5.6
4
Des
icca
ted
Co
con
ut
66
.33
53
.73
37
.44
39
.49
19
7.0
05
3.4
57
6.8
68
6.6
66
9.8
52
86
.81
Sea
wee
ds
an
d C
ara
geen
an
49
.07
51
.31
35
.47
48
.30
18
4.1
55
5.0
35
0.4
65
3.0
85
2.2
22
10
.78
Tob
acc
o M
an
ufa
ctu
red
53
.63
46
.26
11
.20
46
.37
15
7.4
64
2.3
24
8.0
35
2.3
15
7.3
11
99
.97
Co
pra
Oil
Ca
ke
12
.40
21
.87
38
.40
51
.94
12
4.6
11
4.0
61
9.9
31
2.4
31
2.3
85
8.8
0
Fert
iliz
er M
an
ufa
ctu
red
21
.33
34
.34
39
.47
23
.65
11
8.7
94
4.3
44
3.4
77
7.5
64
7.6
42
13
.00
Cen
trif
uga
l Su
gar
40
.35
45
.12
23
.27
0.0
61
08
.80
17
.07
58
.67
12
5.2
91
50
.41
35
1.4
5
Sou
rce
of
ba
sic
da
ta: N
ati
on
al
Sta
tist
ics
Off
ice
(NSO
)
ITEM
20
12
20
11
Tab
le 4
a. V
ALU
E O
F TO
P T
EN A
GR
ICU
LTU
RA
L EX
PO
RTS
, BY
QU
AR
TER
201
1-20
12(F
.O.B
. Val
ue
in M
illi
on
US
$)
160
210
260
310
360
410
460
1st 2nd 3rd 4th
Val
ue
in M
USD
Quarter
Figure 5Value of Coconut Oil Exports,
by Quarter, 2011-2012
2012
2011
90
110
130
150
170
190
210
230
1st 2nd 3rd 4th
Val
ue
in M
USD
Quarter
Figure 6Value of Banana, Fresh, Exports,
By Quarter, 2011-2012
2012
2011
50
60
70
80
90
100
110
120
130
140
1st 2nd 3rd 4th
Val
ue
in M
USD
Quarter
Figure 7Value of Tuna, Exportsby Quarter, 2011-2012
2012
2011
50
60
70
80
90
100
110
120
130
1st 2nd 3rd 4th
Val
ue
in M
US
D
Quarter
Figure 8Value of Pineapple and Pineapple Products
Exports, by Quarter , 2011-2012
2012
2011
30
35
40
45
50
55
60
1st 2nd 3rd 4th
Val
ue
in M
USD
Quarter
Figure 10Value of Seaweeds and Carageenan Exports,
by Quarter, 2011-2012
2012
2011
20
30
40
50
60
70
80
90
1st 2nd 3rd 4th
Val
ue
in M
USD
Quarter
Figure 9Value of Dessicated Coconut Exports,
by Quarter , 2011-2012
2012
2011
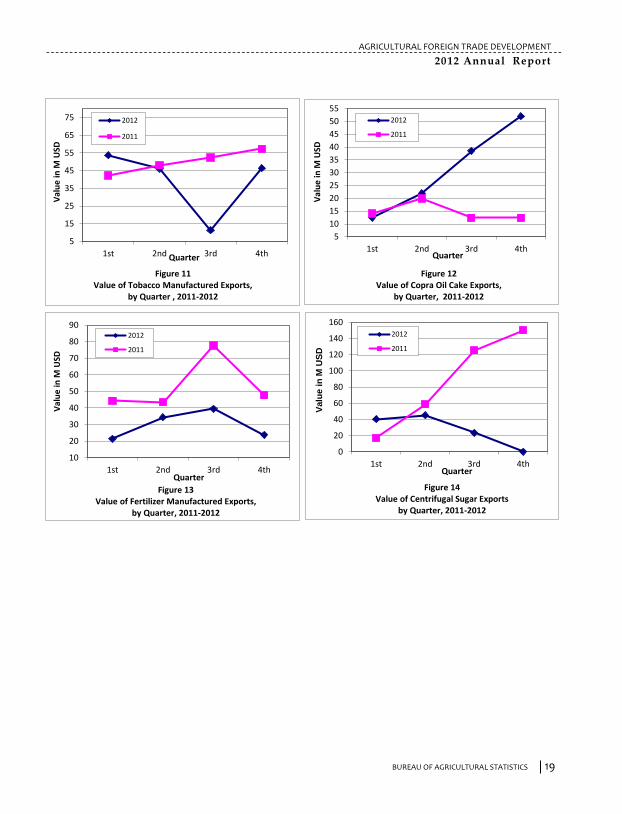
BUREAU OF AGRICULTURAL STATISTICS BUREAU OF AGRICULTURAL STATISTICS
AGRICULTURAL FOREIGN TRADE DEVELOPMENT
2012 Annual Report
19 14
Qu
anti
tyV
alu
e%
Sh
are
Qu
anti
tyV
alu
e%
Sh
are
Qu
anti
tyV
alu
e
1. C
OC
ON
UT
OIL
(C
rud
e a
nd
ref
ined
)8
84
.46
10
41
.48
20
.67
82
6.7
21
,42
5.4
52
6.2
46
.98
(26
.94
)
2. B
AN
AN
AS,
FR
ESH
26
46
.12
64
6.6
61
2.8
42
,05
5.5
14
72
.38
8.7
02
8.7
33
6.8
9
3. T
UN
A6
1.7
14
55
.10
9.0
38
0.1
33
14
.59
5.7
9(2
2.9
9)
44
.66
4. P
INEA
PP
LE A
ND
PIN
EAP
PLE
PR
OD
UC
TS7
42
.61
41
4.9
18
.24
58
2.6
83
45
.64
6.3
62
7.4
52
0.0
4
5. D
ESIC
CA
TED
CO
CO
NU
T6
8.5
81
97
.00
3.9
11
08
.88
28
6.8
15
.28
(37
.02
)(3
1.3
1)
6. S
EAW
EED
AN
D C
AR
AG
EEN
AN
33
.91
18
4.1
53
.66
46
.13
21
0.7
83
.88
(26
.49
)(1
2.6
4)
7. T
OB
AC
CO
MA
NU
FAC
TUR
ED1
5.8
01
57
.46
3.1
32
8.1
61
99
.97
3.6
8(4
3.8
8)
(21
.26
)
8. C
OP
RA
OIL
CA
KE
46
2.0
21
24
.61
2.4
73
14
.34
58
.80
1.0
84
6.9
81
11
.93
9.
FER
TILI
ZER
MA
NU
FAC
TUR
ED2
39
.16
11
8.7
92
.36
45
5.1
22
13
.00
3.9
2(4
7.4
5)
(44
.23
)
10
. CEN
TRIF
UG
AL
SUG
AR
20
1.9
31
08
.80
2.1
65
78
.74
35
1.4
56
.47
(65
.11
)(6
9.0
4)
Tota
l of
Top
10
Agr
icu
ltu
ral E
xpo
rts
3,4
48
.95
68
.46
3,8
78
.87
71
.41
(11
.08
)
Oth
er
Agr
icu
ltu
ral E
xpo
rts
15
88
.99
31
.54
15
52
.89
28
.59
2.3
3
Tota
l Agr
icu
ltu
ral E
xpo
rts
5,0
37
.94
5,4
31
.76
(7.2
5)
Sou
rce
of
ba
sic
da
ta: N
ati
on
al
Sta
tist
ics
Off
ice
(NSO
)
Tab
le 4
. TO
P T
EN P
HIL
IPP
INE
AG
RIC
ULT
UR
AL
EXP
OR
TS,
2011
-201
2(Q
uan
tity
in '0
00 M
.T; F
.O.B
. Val
ue
in M
illi
on
US
$)
Gro
wth
Rat
e (
%)
Ite
m2
01
22
01
1
0
20
40
60
80
100
120
140
160
1st 2nd 3rd 4th
Valu
e i
n M
US
D
Quarter
Figure 14Value of Centrifugal Sugar Exports
by Quarter, 2011-2012
2012
2011
5
10
15
20
25
30
35
40
45
50
55
1st 2nd 3rd 4th
Val
ue
in M
USD
Quarter
Figure 12Value of Copra Oil Cake Exports,
by Quarter, 2011-2012
2012
2011
10
20
30
40
50
60
70
80
90
1st 2nd 3rd 4th
Val
ue
in M
USD
Quarter
Figure 13Value of Fertilizer Manufactured Exports,
by Quarter, 2011-2012
2012
2011
5
15
25
35
45
55
65
75
1st 2nd 3rd 4th
Val
ue
in M
USD
Quarter
Figure 11Value of Tobacco Manufactured Exports,
by Quarter , 2011-2012
2012
2011
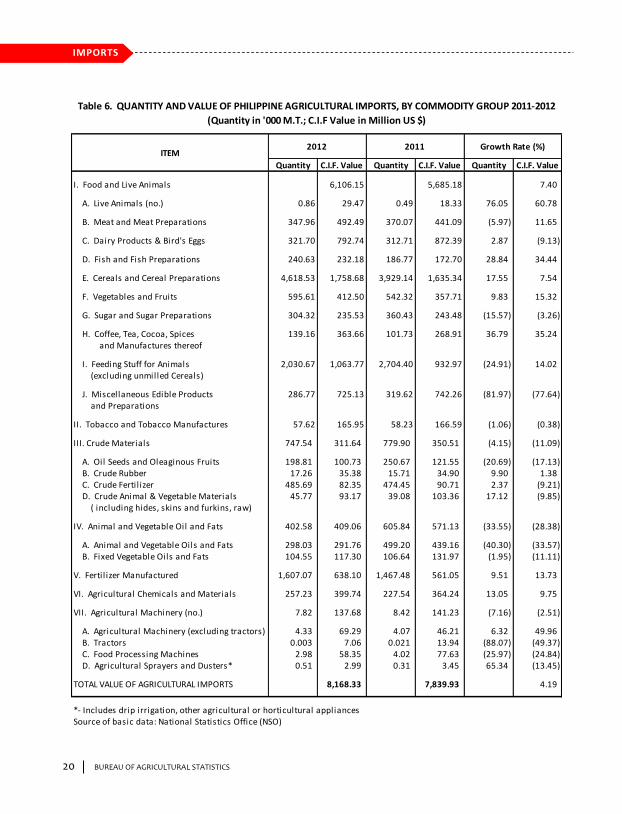
BUREAU OF AGRICULTURAL STATISTICS BUREAU OF AGRICULTURAL STATISTICS
AGRICULTURAL FOREIGN TRADE DEVELOPMENT
2012 Annual Report
13 20
IMPORTS
Quantity Value Quantity Value Quantity Value
II. Tobacco and Tobacco Manufactures 31.19 233.78 73.05 330.99 (57.30) (29.37)
III. Crude Materials 97.42 277.71 117.14 329.34 (16.83) (15.68)A. Oil Seeds and Oleaginous Fruits 0.70 1.43 0.55 0.60 28.72 136.19B. Crude Rubber 39.48 62.08 43.48 80.47 (9.20) (22.86)
1. Natural Rubber (other than latex) 38.63 61.63 42.21 79.92 (8.48) (22.89)2. Synthetic Rubber; reclaimed rubber 0.85 0.45 1.27 0.55 (33.16) (17.83)
C. Crude Fertil izer 1.09 0.78 1.59 1.55 (31.48) (49.73)
D. Crude Animal & Vegetable Materials 56.14 213.43 71.52 246.71 (21.50) (13.49)
IV. Animal and Vegetable Oil and Fats 1,169.34 1,191.94 922.69 1,460.54 26.73 (18.39)
A. Animal and Vegetable Oils and Fats 246.59 97.22 90.84 29.24 171.46 232.46B. Fixed Vegetable Oils and Fats 922.74 1,094.72 831.84 1,431.30 10.93 (23.52)
V. Fertil izer Manufactured 239.16 118.79 455.12 213.01 (47.45) (44.23)
VI. Agricultural Chemicals and Materials 2.44 13.07 4.68 26.41 (47.78) (50.50)
VII. Agricultural Machinery (no.) 0.41 4.87 0.96 8.56 (57.13) (43.17)
A. Agricultural Machinery (excluding tractors) 0.09 0.50 0.07 0.33 18.61 50.13B. Tractors 0.00 0.14 a/ 0.66 (79.31)C. Food Processing Machinery 0.31 4.21 0.89 7.57 (65.50) (44.43)
D. Agricultural Sprayers and Dusters** 0.02 0.02
TOTAL VALUE OF AGRICULTURAL EXPORTS 5,037.94 5,431.76 (7.25)
** Includes drip irrigation, other agricultural horticultural appliancesa/ less than 0.01Source of basic data: National Statistics Office (NSO)
Table 3. QUANTITY AND VALUE OF PHILIPPINE AGRICULTURAL EXPORTS, BY COMMODITY GROUP 2011-2012(Quantity in '000 M.T., F.O.B. Value in Million US $) ….continued
Item2012 2011 Growth Rate (%)
Quantity C.I.F. Value Quantity C.I.F. Value Quantity C.I.F. Value
I. Food and Live Animals 6,106.15 5,685.18 7.40
A. Live Animals (no.) 0.86 29.47 0.49 18.33 76.05 60.78
B. Meat and Meat Preparations 347.96 492.49 370.07 441.09 (5.97) 11.65
C. Dairy Products & Bird's Eggs 321.70 792.74 312.71 872.39 2.87 (9.13)
D. Fish and Fish Preparations 240.63 232.18 186.77 172.70 28.84 34.44
E. Cereals and Cereal Preparations 4,618.53 1,758.68 3,929.14 1,635.34 17.55 7.54
F. Vegetables and Fruits 595.61 412.50 542.32 357.71 9.83 15.32
G. Sugar and Sugar Preparations 304.32 235.53 360.43 243.48 (15.57) (3.26)
H. Coffee, Tea, Cocoa, Spices 139.16 363.66 101.73 268.91 36.79 35.24and Manufactures thereof
I. Feeding Stuff for Animals 2,030.67 1,063.77 2,704.40 932.97 (24.91) 14.02(excluding unmilled Cereals)
J. Miscellaneous Edible Products 286.77 725.13 319.62 742.26 (81.97) (77.64)and Preparations
II. Tobacco and Tobacco Manufactures 57.62 165.95 58.23 166.59 (1.06) (0.38)
III. Crude Materials 747.54 311.64 779.90 350.51 (4.15) (11.09)
A. Oil Seeds and Oleaginous Fruits 198.81 100.73 250.67 121.55 (20.69) (17.13)B. Crude Rubber 17.26 35.38 15.71 34.90 9.90 1.38C. Crude Fertil izer 485.69 82.35 474.45 90.71 2.37 (9.21)D. Crude Animal & Vegetable Materials 45.77 93.17 39.08 103.36 17.12 (9.85)
( including hides, skins and furkins, raw)
IV. Animal and Vegetable Oil and Fats 402.58 409.06 605.84 571.13 (33.55) (28.38)
A. Animal and Vegetable Oils and Fats 298.03 291.76 499.20 439.16 (40.30) (33.57)B. Fixed Vegetable Oils and Fats 104.55 117.30 106.64 131.97 (1.95) (11.11)
V. Fertil izer Manufactured 1,607.07 638.10 1,467.48 561.05 9.51 13.73
VI. Agricultural Chemicals and Materials 257.23 399.74 227.54 364.24 13.05 9.75
VII. Agricultural Machinery (no.) 7.82 137.68 8.42 141.23 (7.16) (2.51)
A. Agricultural Machinery (excluding tractors) 4.33 69.29 4.07 46.21 6.32 49.96B. Tractors 0.003 7.06 0.021 13.94 (88.07) (49.37)C. Food Processing Machines 2.98 58.35 4.02 77.63 (25.97) (24.84)D. Agricultural Sprayers and Dusters* 0.51 2.99 0.31 3.45 65.34 (13.45)
TOTAL VALUE OF AGRICULTURAL IMPORTS 8,168.33 7,839.93 4.19
*- Includes drip irrigation, other agricultural or horticultural appliancesSource of basic data: National Statistics Office (NSO)
Table 6. QUANTITY AND VALUE OF PHILIPPINE AGRICULTURAL IMPORTS, BY COMMODITY GROUP 2011-2012
(Quantity in '000 M.T.; C.I.F Value in Million US $)
ITEM2012 2011 Growth Rate (%)
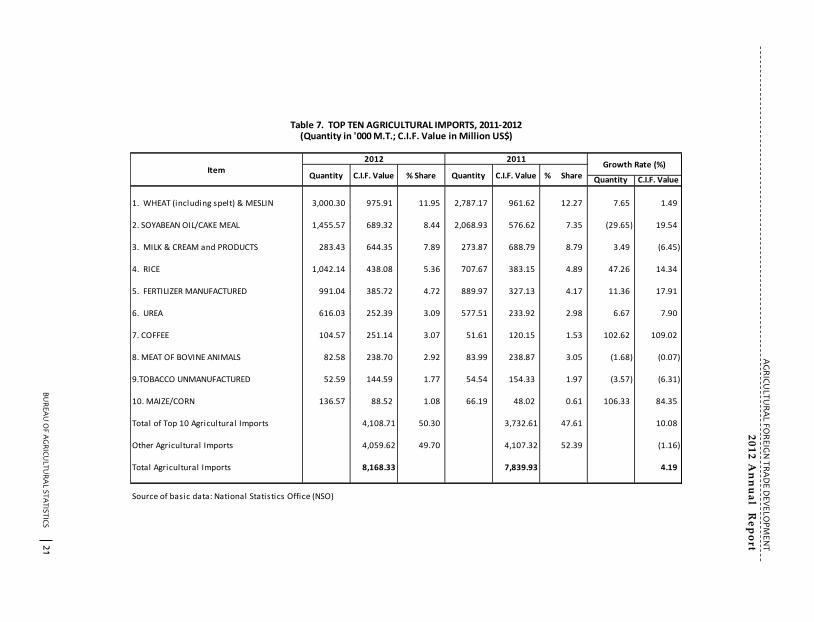
B
UR
EA
U O
F AG
RIC
ULTU
RA
L STA
TIST
ICS
B
UR
EA
U O
F AG
RIC
ULTU
RA
L STA
TISTIC
S
AG
RIC
ULT
UR
AL FO
RE
IGN
TR
AD
E D
EV
ELO
PM
EN
T
20
12
An
nu
al R
ep
ort
21 12 E
XP
OR
TS
Qu
antity
Valu
eQ
uan
tityV
alue
Qu
antity
Valu
e
I. Foo
d a
nd
Live An
ima
ls3
19
7.7
83
,06
2.9
04
.40
A. Live A
nim
als (N
o.)
5.9
11
3.9
21
.85
5.8
12
19
.46
13
9.5
9
B. M
eat a
nd
Mea
t Prep
ara
tion
s1
3.7
06
7.5
31
4.8
75
9.9
4(7
.87
)1
2.6
6
C. D
airy P
rod
ucts &
Bird
's Eggs1
8.5
18
8.3
73
9.0
11
76
.70
(52
.55
)(4
9.9
9)
D. Fish
an
d Fish
Prep
ara
tion
s1
25
.06
81
0.8
01
57
.85
64
6.4
8(2
0.7
7)
25
.42
E. Cerea
ls an
d C
ereal P
repa
ratio
ns
36
.70
10
4.8
25
6.8
01
09
.87
(35
.38
)(4
.60
)
F. Vegeta
bles a
nd
Fruits
3,6
40
.46
1,6
15
.18
2,9
34
.73
1,4
02
.96
24
.05
15
.13
1. C
oco
nu
t Pro
du
cts8
6.3
52
17
.39
11
6.4
92
90
.47
(25
.87
)(2
5.1
6)
a. Fresh
, you
ng
1.6
11
.39
6.5
92
.99
(75
.57
)(5
3.5
1)
b. Fresh
, ma
tured
0.1
30
.05
0.7
50
.35
c. Desicca
ted
68
.58
19
7.0
01
08
.88
28
6.8
1(3
7.0
2)
(31
.31
)d
. Oth
ers1
6.0
31
8.9
60
.27
0.3
35
90
1.1
25
66
5.3
1
2. P
inea
pp
le Pro
du
cts7
42
.60
41
4.8
95
82
.45
34
5.6
42
7.5
02
0.0
4a
. Fresh3
97
.02
99
.67
26
3.2
76
5.8
45
0.8
05
1.3
6b
. Dried
0.2
61
.70
0.3
31
.78
(19
.99
)(4
.71
)c. P
repa
red/p
reserved2
23
.02
21
9.7
82
07
.19
19
5.3
87
.64
12
.48
d. Ju
ice con
centra
tes3
2.9
74
2.8
63
2.6
53
8.6
80
.97
10
.82
e. Juice o
ther th
an
con
centra
tes8
9.3
35
0.8
97
9.0
14
3.9
51
3.0
71
5.7
9
3. B
an
an
a2
,68
2.4
87
05
.01
2,0
86
.29
52
3.2
52
8.5
83
4.7
4a
. Fresh2
,64
6.1
26
46
.66
2,0
55
.51
47
2.3
82
8.7
33
6.8
9b
. Dried
0.2
61
.22
0.3
70
.19
c. Oth
ers3
6.1
05
7.1
33
0.4
15
0.6
81
8.7
21
2.7
3
4. M
an
go3
1.2
17
7.9
84
3.3
91
13
.34
(28
.06
)(3
1.2
0)
a. Fresh
18
.44
15
.24
21
.15
16
.72
(12
.82
)(8
.86
)b
. Dried
5.2
04
8.0
09
.46
79
.51
(45
.02
)(3
9.6
2)
c. Pu
ree2
.80
3.5
76
.09
7.5
6(5
4.1
0)
(52
.78
)d
. Juice
4.1
35
.69
5.6
86
.41
(27
.26
)(1
1.2
4)
e. Oth
ers0
.65
5.4
71
.01
3.1
4(3
5.9
3)
73
.93
5. A
ll Oth
er Fruits a
nd
Vegeta
bles
97
.81
19
9.9
01
06
.11
13
0.2
5(7
.82
)5
3.4
7
G. Su
gar a
nd
Suga
r Prep
ara
tion
s3
36
.93
20
9.8
49
04
.98
44
8.2
4(6
2.7
7)
(53
.19
)
1. C
entrifu
gal Su
gar
20
1.9
31
08
.80
57
8.7
43
51
.45
(65
.11
)(6
9.0
4)
2. M
ola
sses1
24
.36
21
.44
30
0.4
23
0.2
2(5
8.6
0)
(29
.05
)3
. Oth
ers1
0.6
47
9.6
02
5.8
26
6.5
7(5
8.8
0)
19
.58
H. C
offee, Tea
, Co
coa
, Spices
an
d M
an
ufa
ctures th
ereof
3.8
69
.72
7.3
11
4.1
1(4
7.2
2)
(31
.12
)
1. C
offee
0.1
00
.84
0.4
11
.65
(75
.13
)(4
8.9
9)
2. C
oco
a1
.72
5.8
32
.68
7.0
5(3
5.8
2)
(17
.35
)3
. Oth
ers2
.04
3.0
54
.23
5.4
0(5
1.7
6)
(43
.53
)
I. Feedin
g Stuff fo
r An
ima
ls4
73
.32
13
2.6
23
22
.60
61
.99
46
.72
11
3.9
3(exclu
din
g un
milled
Cerea
ls)
J. Miscella
neo
us Ed
ible P
rod
ucts
52
.56
14
4.9
87
0.5
61
36
.80
(25
.51
)5
.98
an
d P
repa
ratio
ns
Table
3. QU
AN
TITY A
ND
VA
LUE O
F PH
ILIPP
INE A
GR
ICU
LTUR
AL EX
PO
RTS, B
Y C
OM
MO
DITY
GR
OU
P 2011-2012
(Qu
antity in
'000 M.T., F.O
.B. V
alue
in M
illion
US $)
Gro
wth
Rate
(%)
Item
20
12
20
11
Quantity C.I.F. Value
1. WHEAT (including spelt) & MESLIN 3,000.30 975.91 11.95 2,787.17 961.62 12.27 7.65 1.49
2. SOYABEAN OIL/CAKE MEAL 1,455.57 689.32 8.44 2,068.93 576.62 7.35 (29.65) 19.54
3. MILK & CREAM and PRODUCTS 283.43 644.35 7.89 273.87 688.79 8.79 3.49 (6.45)
4. RICE 1,042.14 438.08 5.36 707.67 383.15 4.89 47.26 14.34
5. FERTILIZER MANUFACTURED 991.04 385.72 4.72 889.97 327.13 4.17 11.36 17.91
6. UREA 616.03 252.39 3.09 577.51 233.92 2.98 6.67 7.90
7. COFFEE 104.57 251.14 3.07 51.61 120.15 1.53 102.62 109.02
8. MEAT OF BOVINE ANIMALS 82.58 238.70 2.92 83.99 238.87 3.05 (1.68) (0.07)
9.TOBACCO UNMANUFACTURED 52.59 144.59 1.77 54.54 154.33 1.97 (3.57) (6.31)
10. MAIZE/CORN 136.57 88.52 1.08 66.19 48.02 0.61 106.33 84.35
Total of Top 10 Agricultural Imports 4,108.71 50.30 3,732.61 47.61 10.08
Other Agricultural Imports 4,059.62 49.70 4,107.32 52.39 (1.16)
Total Agricultural Imports 8,168.33 7,839.93 4.19
Source of basic data: National Statistics Office (NSO)
C.I.F. Value% Share
Table 7. TOP TEN AGRICULTURAL IMPORTS, 2011-2012(Quantity in '000 M.T.; C.I.F. Value in Million US$)
ItemGrowth Rate (%)
2011
Quantity % Share
2012
Quantity C.I.F. Value
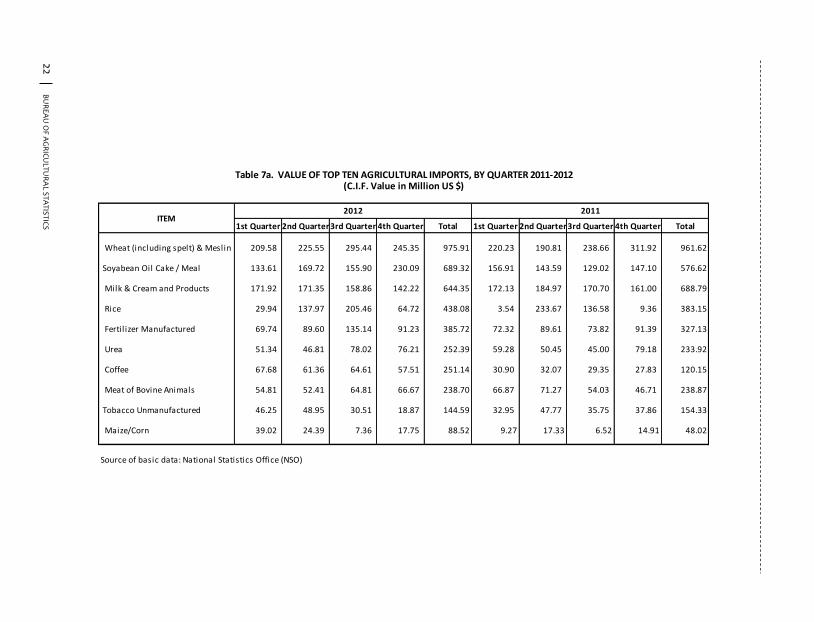
B
UR
EA
U O
F AG
RIC
ULTU
RA
L STA
TIST
ICS
B
UR
EA
U O
F AG
RIC
ULTU
RA
L STA
TISTIC
S
AG
RIC
ULT
UR
AL FO
RE
IGN
TR
AD
E D
EV
ELO
PM
EN
T
20
12
An
nu
al R
ep
ort
11 22
AU
STRA
LIA
Agricu
ltura
l Expo
rts4
8.0
30
.95
0.0
95
2.3
20
.96
0.1
1(8
.20
)
Agricu
ltura
l Imp
orts
71
9.6
68
.81
1.0
95
64
.21
7.2
00
.88
27
.55
Agricu
ltura
l Surp
lus/D
eficit(6
71
.63
)(5
11
.89
)3
1.2
0
JAP
AN
Agricu
ltura
l Expo
rts6
91
.85
13
.73
1.3
36
53
.05
12
.02
1.3
55
.94
Agricu
ltura
l Imp
orts
11
6.1
71
.42
0.1
81
38
.67
1.7
70
.22
(16
.23
)
Agricu
ltura
l Surp
lus/D
eficit5
75
.68
51
4.3
81
1.9
2
UN
ITED STA
TES OF A
MER
ICA
Agricu
ltura
l Expo
rts1
20
3.4
52
3.8
92
.31
14
54
.27
26
.77
3.0
1(1
7.2
5)
Agricu
ltura
l Imp
orts
17
65
.35
21
.61
2.6
81
65
5.1
52
1.1
12
.58
6.6
6
Agricu
ltura
l Surp
lus/D
eficit(5
61
.90
)(2
00
.88
)1
79
.72
ASEA
N
Agricu
ltura
l Expo
rts8
57
.68
17
.02
1.6
59
20
.71
16
.95
1.9
1(6
.85
)
Agricu
ltura
l Imp
orts
22
06
.89
27
.02
3.3
52
18
6.6
92
7.8
93
.41
0.9
2
Agricu
ltura
l Surp
lus/D
eficit(1
34
9.2
1)
(12
65
.98
)6
.57
EUR
OP
EAN
UN
ION
(EU)
Agricu
ltura
l Expo
rts9
11
.75
18
.10
1.7
51
06
6.0
31
9.6
32
.21
(14
.47
)
Agricu
ltura
l Imp
orts
63
1.9
37
.74
0.9
66
07
.94
7.7
50
.95
3.9
5
Agricu
ltura
l Surp
lus/D
eficit2
79
.82
45
8.0
8(3
8.9
2)
Re
st of th
e W
orld
Agricu
ltura
l Expo
rts1
32
5.1
82
6.3
02
.54
12
85
.39
23
.66
2.6
63
.10
Agricu
ltura
l Imp
orts
27
28
.34
33
.40
4.1
42
68
7.2
63
4.2
84
.19
1.5
3
Agricu
ltura
l Surp
lus/D
eficit(1
40
3.1
6)
(14
01
.88
)0
.09
*- Percen
t of P
hilip
pin
e agricu
ltura
l expo
rts/imp
orts to
tota
l trad
e with
each
ma
jor tra
din
g pa
rtner
Sou
rce of b
asic d
ata
: Na
tion
al Sta
tistics Office (N
SO)
Table
2. A
GR
ICU
LTUR
AL TR
AD
E BA
LAN
CES W
ITH M
AJO
R TR
AD
ING
PA
RTN
ERS O
F THE P
HILIP
PIN
ES, 20
11
-20
12
(Expo
rt Valu
e in
F.O.B
. M U
S$; Im
po
rt Valu
e in
C.I.F. M
US$
)
Item
Gro
wth
Rate
(%)
20
12
20
11
Valu
eP
erce
nt to
Total*
Pe
rcen
t to
Total A
gri
Pe
rcen
t to
Total A
griV
alue
Pe
rcen
t to
Total*
1st Quarter 2nd Quarter 3rd Quarter 4th Quarter Total 1st Quarter 2nd Quarter 3rd Quarter 4th Quarter Total
Wheat (including spelt) & Meslin 209.58 225.55 295.44 245.35 975.91 220.23 190.81 238.66 311.92 961.62
Soyabean Oil Cake / Meal 133.61 169.72 155.90 230.09 689.32 156.91 143.59 129.02 147.10 576.62
Milk & Cream and Products 171.92 171.35 158.86 142.22 644.35 172.13 184.97 170.70 161.00 688.79
Rice 29.94 137.97 205.46 64.72 438.08 3.54 233.67 136.58 9.36 383.15
Fertil izer Manufactured 69.74 89.60 135.14 91.23 385.72 72.32 89.61 73.82 91.39 327.13
Urea 51.34 46.81 78.02 76.21 252.39 59.28 50.45 45.00 79.18 233.92
Coffee 67.68 61.36 64.61 57.51 251.14 30.90 32.07 29.35 27.83 120.15
Meat of Bovine Animals 54.81 52.41 64.81 66.67 238.70 66.87 71.27 54.03 46.71 238.87
Tobacco Unmanufactured 46.25 48.95 30.51 18.87 144.59 32.95 47.77 35.75 37.86 154.33
Maize/Corn 39.02 24.39 7.36 17.75 88.52 9.27 17.33 6.52 14.91 48.02
Source of basic data: National Statistics Office (NSO)
ITEM2012 2011
Table 7a. VALUE OF TOP TEN AGRICULTURAL IMPORTS, BY QUARTER 2011-2012(C.I.F. Value in Million US $)
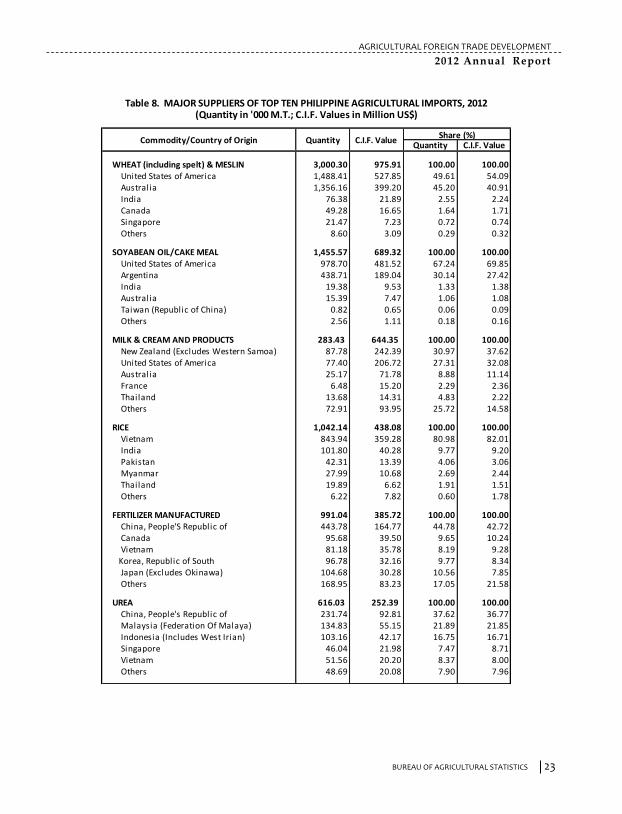
BUREAU OF AGRICULTURAL STATISTICS BUREAU OF AGRICULTURAL STATISTICS
AGRICULTURAL FOREIGN TRADE DEVELOPMENT
2012 Annual Report
23 10
1st Quarter 2nd Quarter 3rd Quarter 4th Quarter TOTAL
Agricultural Exports 1,159.57 1,312.04 1,197.50 1,368.82 5,037.93
Percent to AnnualAgricultural Exports 23.02 26.04 23.77 27.17
Agricultural Imports 1,866.79 2,031.84 2,210.28 2,059.41 8,168.33
Percent to AnnualAgricultural Imports 22.85 24.89 27.06 25.21
(707.22) (719.80) (1,012.78) (690.59)
1st Quarter 2nd Quarter 3rd Quarter 4th Quarter TOTAL
Agricultural Exports 1271.08 1,355.72 1,441.25 1,363.72 5,431.76
Percent to AnnualAgricultural Exports 23.40 24.96 26.53 25.11
Agricultural Imports 1,779.92 2,152.00 1,935.77 1,972.24 7,839.93
Percent to AnnualAgricultural Imports 22.70 27.45 24.69 25.16
(508.84) (796.28) (494.53) (608.52)
Source of basic data: National Statistics Office (NSO)
Item
Agricultural Trade
Surplus/Deficit
2011
2012
Agricultural Trade
Surplus/Deficit
Item
Table 1a. PHILIPPINE AGRICULTURAL TRADE, BY QUARTER, 2011-2012
(Export Value in F.O.B. M US$; Import Value in C.I.F. M US$)
Quantity C.I.F. Value
WHEAT (including spelt) & MESLIN 3,000.30 975.91 100.00 100.00United States of America 1,488.41 527.85 49.61 54.09Australia 1,356.16 399.20 45.20 40.91India 76.38 21.89 2.55 2.24Canada 49.28 16.65 1.64 1.71Singapore 21.47 7.23 0.72 0.74Others 8.60 3.09 0.29 0.32
SOYABEAN OIL/CAKE MEAL 1,455.57 689.32 100.00 100.00United States of America 978.70 481.52 67.24 69.85Argentina 438.71 189.04 30.14 27.42India 19.38 9.53 1.33 1.38Australia 15.39 7.47 1.06 1.08Taiwan (Republic of China) 0.82 0.65 0.06 0.09Others 2.56 1.11 0.18 0.16
MILK & CREAM AND PRODUCTS 283.43 644.35 100.00 100.00New Zealand (Excludes Western Samoa) 87.78 242.39 30.97 37.62United States of America 77.40 206.72 27.31 32.08Australia 25.17 71.78 8.88 11.14France 6.48 15.20 2.29 2.36Thailand 13.68 14.31 4.83 2.22Others 72.91 93.95 25.72 14.58
RICE 1,042.14 438.08 100.00 100.00Vietnam 843.94 359.28 80.98 82.01India 101.80 40.28 9.77 9.20Pakistan 42.31 13.39 4.06 3.06Myanmar 27.99 10.68 2.69 2.44Thailand 19.89 6.62 1.91 1.51Others 6.22 7.82 0.60 1.78
FERTILIZER MANUFACTURED 991.04 385.72 100.00 100.00China, People'S Republic of 443.78 164.77 44.78 42.72Canada 95.68 39.50 9.65 10.24Vietnam 81.18 35.78 8.19 9.28
Korea, Republic of South 96.78 32.16 9.77 8.34Japan (Excludes Okinawa) 104.68 30.28 10.56 7.85Others 168.95 83.23 17.05 21.58
UREA 616.03 252.39 100.00 100.00China, People's Republic of 231.74 92.81 37.62 36.77Malaysia (Federation Of Malaya) 134.83 55.15 21.89 21.85Indonesia (Includes West Irian) 103.16 42.17 16.75 16.71Singapore 46.04 21.98 7.47 8.71Vietnam 51.56 20.20 8.37 8.00Others 48.69 20.08 7.90 7.96
Table 8. MAJOR SUPPLIERS OF TOP TEN PHILIPPINE AGRICULTURAL IMPORTS, 2012(Quantity in '000 M.T.; C.I.F. Values in Million US$)
QuantityCommodity/Country of OriginShare (%)
C.I.F. Value
870
970
1,070
1,170
1,270
1,370
1,470
1,570
1st 2nd 3rd 4th
F.O
.B. M
US$
Quarter
2011
2012
Figure 3. Philippine Agricultural Exports, by Quarter, 2011-2012
1,400
1,600
1,800
2,000
2,200
2,400
2,600
1st 2nd 3rd 4th
C.I
.F. M
US$
Quarter
2011
2012
Figure 4. Philippine Agricultural Imports, by Quarter 2011-2012
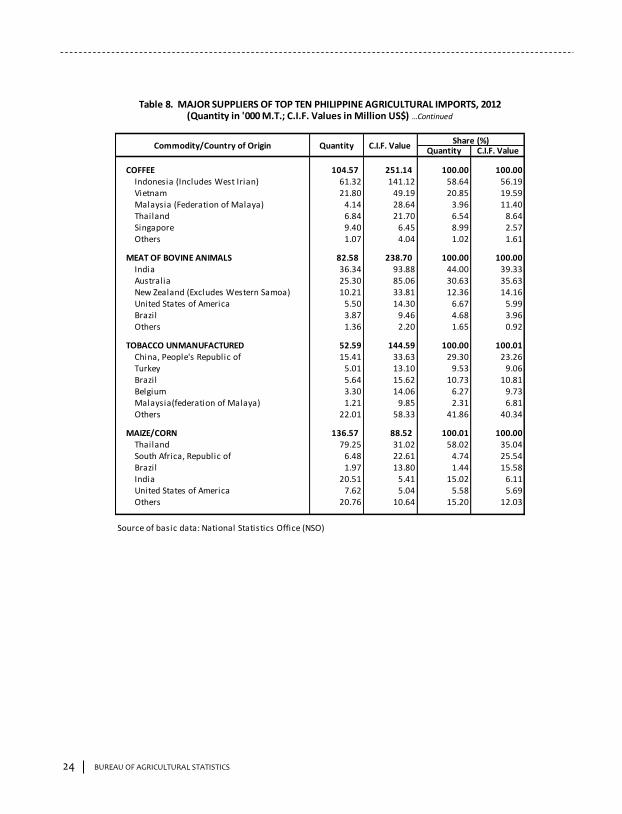
BUREAU OF AGRICULTURAL STATISTICS BUREAU OF AGRICULTURAL STATISTICS
AGRICULTURAL FOREIGN TRADE DEVELOPMENT
2012 Annual Report
9 24
OVERALL AGRICULTURAL TRADE SITUATION
2012/2011 2011/2010
Agricultural Exports 5,037.94 5,431.76 4,101.09 (7.25) 32.45
Total Exports 52,099.52 48,304.93 51,497.51 7.86 (6.20)
Percent of Agricultural Exports to Total Exports 9.67 11.24 7.96 (13.97) 41.20
Agricultural Imports 8,168.33 7,839.93 7,399.79 4.19 5.95
Total Imports 65,839.34 64,096.59 58,467.80 2.72 9.63
Percent of Agricultural Imports to Total Imports 12.41 12.23 12.66 1.47 (3.36)
Source of basic data: National Statistics Office (NSO)
(3,130.39)
Item 2012 2010
(3,298.71)
Table 1. SUMMARY OF PHILIPPINE AGRICULTURAL TRADE, 2010-2012
(Export Value in F.O.B. M US$; Import Value in C.I.F. M US$)
29.99 (27.00)
Growth Rate (%)2011
(2,408.17)Agricultural Trade
Surplus/Deficit
Quantity C.I.F. Value
COFFEE 104.57 251.14 100.00 100.00Indonesia (Includes West Irian) 61.32 141.12 58.64 56.19Vietnam 21.80 49.19 20.85 19.59Malaysia (Federation of Malaya) 4.14 28.64 3.96 11.40Thailand 6.84 21.70 6.54 8.64Singapore 9.40 6.45 8.99 2.57Others 1.07 4.04 1.02 1.61
MEAT OF BOVINE ANIMALS 82.58 238.70 100.00 100.00India 36.34 93.88 44.00 39.33Australia 25.30 85.06 30.63 35.63New Zealand (Excludes Western Samoa) 10.21 33.81 12.36 14.16United States of America 5.50 14.30 6.67 5.99Brazil 3.87 9.46 4.68 3.96Others 1.36 2.20 1.65 0.92
TOBACCO UNMANUFACTURED 52.59 144.59 100.00 100.01China, People's Republic of 15.41 33.63 29.30 23.26Turkey 5.01 13.10 9.53 9.06Brazil 5.64 15.62 10.73 10.81Belgium 3.30 14.06 6.27 9.73Malaysia(federation of Malaya) 1.21 9.85 2.31 6.81Others 22.01 58.33 41.86 40.34
MAIZE/CORN 136.57 88.52 100.01 100.00Thailand 79.25 31.02 58.02 35.04South Africa, Republic of 6.48 22.61 4.74 25.54Brazil 1.97 13.80 1.44 15.58India 20.51 5.41 15.02 6.11United States of America 7.62 5.04 5.58 5.69Others 20.76 10.64 15.20 12.03
Source of basic data: National Statistics Office (NSO)
Table 8. MAJOR SUPPLIERS OF TOP TEN PHILIPPINE AGRICULTURAL IMPORTS, 2012(Quantity in '000 M.T.; C.I.F. Values in Million US$) …Continued
Commodity/Country of Origin Quantity C.I.F. ValueShare (%)
Agricultural10%
Non-Agricultural
90%
Figure 1. Share of Agricultural and Non Agricultural
Exports to total Philippine Exports, 2012
Agricultural12%
Non-Agricultural
88%
Figure 2. Share of Agricultural and Non Agricultural Imports to total Philippine
Imports, 2012
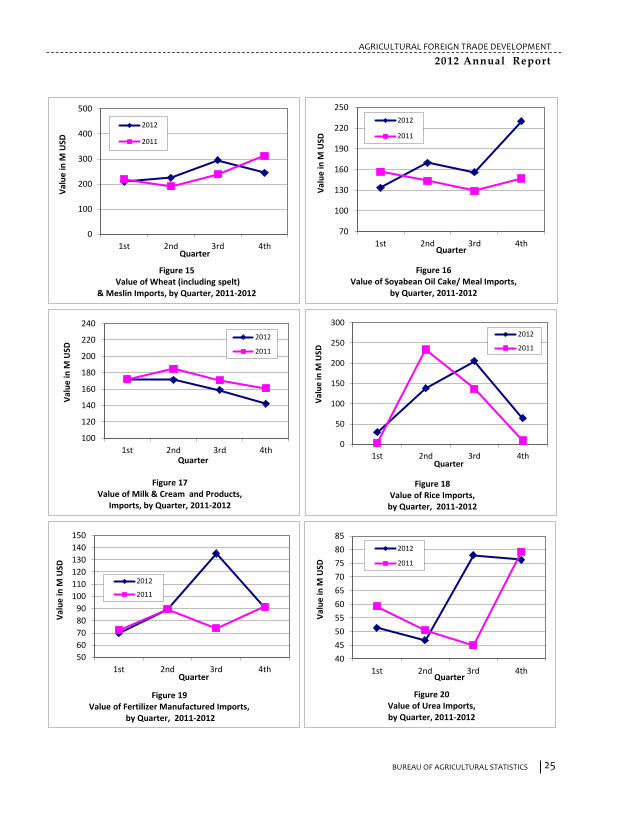
BUREAU OF AGRICULTURAL STATISTICS BUREAU OF AGRICULTURAL STATISTICS
AGRICULTURAL FOREIGN TRADE DEVELOPMENT
2012 Annual Report
25 40
50
60
70
80
90
100
110
120
130
140
150
1st 2nd 3rd 4th
Val
ue
in M
USD
Quarter
Figure 19 Value of Fertilizer Manufactured Imports,
by Quarter, 2011-2012
2012
2011
40
45
50
55
60
65
70
75
80
85
1st 2nd 3rd 4th
Val
ue
in M
USD
Quarter
Figure 20 Value of Urea Imports, by Quarter, 2011-2012
2012
2011
0
100
200
300
400
500
1st 2nd 3rd 4th
Val
ue
in M
USD
Quarter
Figure 15Value of Wheat (including spelt)
& Meslin Imports, by Quarter, 2011-2012
2012
2011
100
120
140
160
180
200
220
240
1st 2nd 3rd 4th
Val
ue
in M
USD
Quarter
Figure 17 Value of Milk & Cream and Products,
Imports, by Quarter, 2011-2012
2012
2011
0
50
100
150
200
250
300
1st 2nd 3rd 4th
Val
ue
in M
USD
Quarter
Figure 18 Value of Rice Imports,
by Quarter, 2011-2012
2012
2011
70
100
130
160
190
220
250
1st 2nd 3rd 4th
Val
ue
in M
USD
Quarter
Figure 16Value of Soyabean Oil Cake/ Meal Imports,
by Quarter, 2011-2012
2012
2011
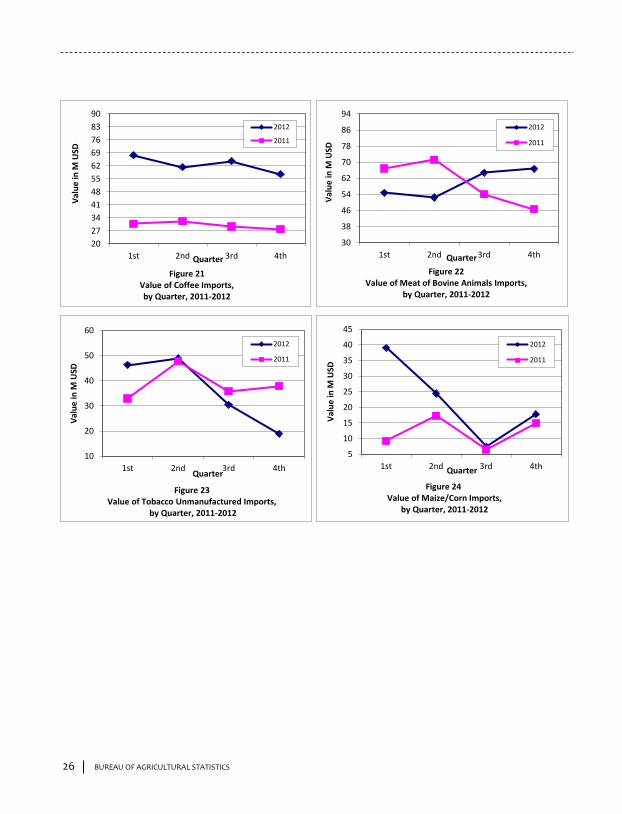
BUREAU OF AGRICULTURAL STATISTICS BUREAU OF AGRICULTURAL STATISTICS
AGRICULTURAL FOREIGN TRADE DEVELOPMENT
2012 Annual Report
STATISTICAL TABLES AND
26
30
38
46
54
62
70
78
86
94
1st 2nd 3rd 4th
Val
ue
in M
USD
Quarter
Figure 22Value of Meat of Bovine Animals Imports,
by Quarter, 2011-2012
2012
2011
20
27
34
41
48
55
62
69
76
83
90
1st 2nd 3rd 4th
Val
ue
in M
USD
Quarter
Figure 21 Value of Coffee Imports, by Quarter, 2011-2012
2012
2011
5
10
15
20
25
30
35
40
45
1st 2nd 3rd 4th
Val
ue
in M
USD
Quarter
Figure 24Value of Maize/Corn Imports,
by Quarter, 2011-2012
2012
2011
10
20
30
40
50
60
1st 2nd 3rd 4th
Val
ue
in M
USD
Quarter
Figure 23 Value of Tobacco Unmanufactured Imports,
by Quarter, 2011-2012
2012
2011
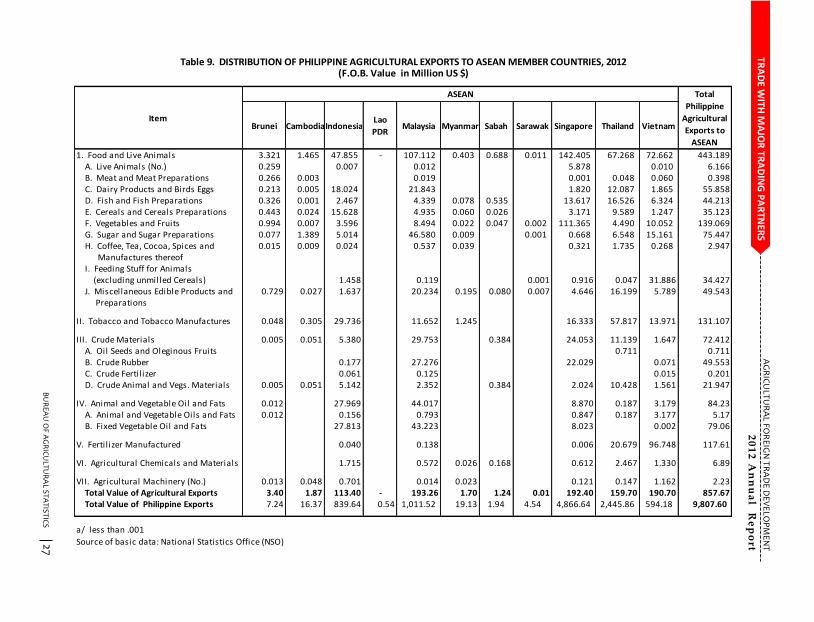
B
UR
EA
U O
F AG
RIC
ULTU
RA
L STA
TIST
ICS
B
UR
EA
U O
F AG
RIC
ULTU
RA
L STA
TISTIC
S
AG
RIC
ULT
UR
AL FO
RE
IGN
TR
AD
E D
EV
ELO
PM
EN
T
20
12
An
nu
al R
ep
ort
27 6
TRA
DE W
ITH M
AJO
R TR
AD
ING
PA
RTN
ERS
Brunei CambodiaIndonesiaLao
PDRMalaysia Myanmar Sabah Sarawak Singapore Thailand Vietnam
1. Food and Live Animals 3.321 1.465 47.855 - 107.112 0.403 0.688 0.011 142.405 67.268 72.662 443.189A. Live Animals (No.) 0.259 0.007 0.012 5.878 0.010 6.166B. Meat and Meat Preparations 0.266 0.003 0.019 0.001 0.048 0.060 0.398C. Dairy Products and Birds Eggs 0.213 0.005 18.024 21.843 1.820 12.087 1.865 55.858D. Fish and Fish Preparations 0.326 0.001 2.467 4.339 0.078 0.535 13.617 16.526 6.324 44.213E. Cereals and Cereals Preparations 0.443 0.024 15.628 4.935 0.060 0.026 3.171 9.589 1.247 35.123F. Vegetables and Fruits 0.994 0.007 3.596 8.494 0.022 0.047 0.002 111.365 4.490 10.052 139.069G. Sugar and Sugar Preparations 0.077 1.389 5.014 46.580 0.009 0.001 0.668 6.548 15.161 75.447H. Coffee, Tea, Cocoa, Spices and 0.015 0.009 0.024 0.537 0.039 0.321 1.735 0.268 2.947 Manufactures thereofI. Feeding Stuff for Animals
(excluding unmilled Cereals)J. Miscellaneous Edible Products and 0.729 0.027 1.637 20.234 0.195 0.080 0.007 4.646 16.199 5.789 49.543 Preparations
II. Tobacco and Tobacco Manufactures 0.048 0.305 29.736 11.652 1.245 16.333 57.817 13.971 131.107
III. Crude Materials 0.005 0.051 5.380 29.753 0.384 24.053 11.139 1.647 72.412A. Oil Seeds and Oleginous Fruits 0.711 0.711B. Crude Rubber 0.177 27.276 22.029 0.071 49.553C. Crude Fertil izer 0.061 0.125 0.015 0.201D. Crude Animal and Vegs. Materials 0.005 0.051 5.142 2.352 0.384 2.024 10.428 1.561 21.947
IV. Animal and Vegetable Oil and Fats 0.012 27.969 44.017 8.870 0.187 3.179 84.23A. Animal and Vegetable Oils and Fats 0.012 0.156 0.793 0.847 0.187 3.177 5.17B. Fixed Vegetable Oil and Fats 27.813 43.223 8.023 0.002 79.06
V. Fertil izer Manufactured 0.040 0.138 0.006 20.679 96.748 117.61
VI. Agricultural Chemicals and Materials 1.715 0.572 0.026 0.168 0.612 2.467 1.330 6.89
VII. Agricultural Machinery (No.) 0.013 0.048 0.701 0.014 0.023 0.121 0.147 1.162 2.23Total Value of Agricultural Exports 3.40 1.87 113.40 - 193.26 1.70 1.24 0.01 192.40 159.70 190.70 857.67Total Value of Philippine Exports 7.24 16.37 839.64 0.54 1,011.52 19.13 1.94 4.54 4,866.64 2,445.86 594.18 9,807.60
a/ less than .001
Source of basic data: National Statistics Office (NSO)
Table 9. DISTRIBUTION OF PHILIPPINE AGRICULTURAL EXPORTS TO ASEAN MEMBER COUNTRIES, 2012(F.O.B. Value in Million US $)
Item
ASEAN Total
Philippine
Agricultural
Exports to
ASEAN
0.916 0.047 31.886 34.4271.458 0.119 0.001
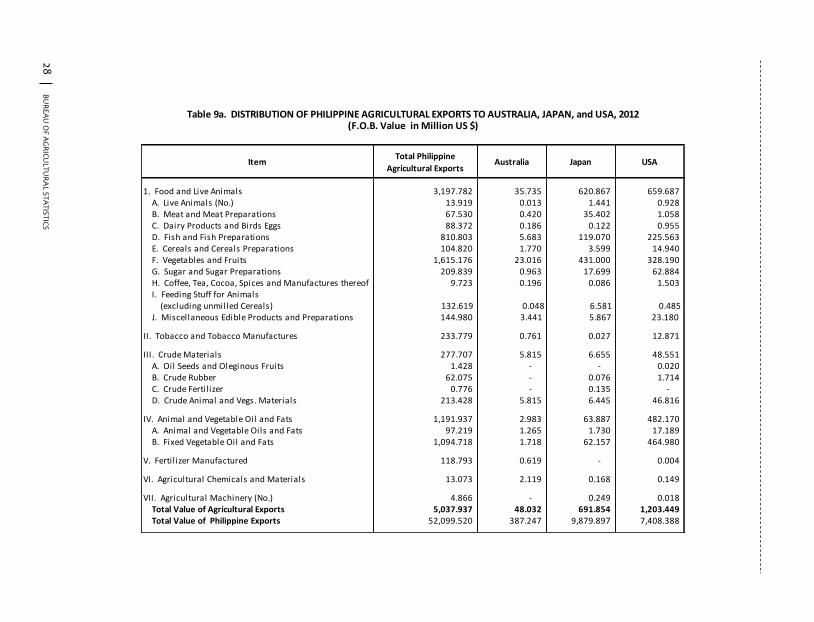
B
UR
EA
U O
F AG
RIC
ULTU
RA
L STA
TIST
ICS
B
UR
EA
U O
F AG
RIC
ULTU
RA
L STA
TISTIC
S
AG
RIC
ULT
UR
AL FO
RE
IGN
TR
AD
E D
EV
ELO
PM
EN
T
20
12
An
nu
al R
ep
ort
Soyb
ean
s. Prices o
f soyb
eans w
ere do
wn
from
Janu
ary to M
arch an
d clim
bed
up
th
rou
gho
ut th
e year at varied rates. P
rice peaked
in A
ugu
st at US$
0.6
84
/kg.
Rice
. Up
trend
in th
e intern
ation
al prices o
f rice 5
% b
roken
were re
cord
ed fro
m
Janu
ary to A
ugu
st wh
ile do
wn
trend
from
Septem
ber to
Dece
mb
er of 2
01
2. P
rice
peaked
in M
ay at US$
0.6
01
/kg. P
rices o
f rice 2
5%
bro
ken
we
re decreasin
g at varied rates fo
r mo
st of th
e mo
nth
s excep
t in Jan
uary, Ju
ly and
Au
gust w
hen
price in
creases were p
osted
. High
est price
w
as reco
rded
in Ju
ly at US$
0.5
55
/kg. P
rices o
f rice A
1 Sp
ecial m
oved
up
from
Janu
ary to A
ugu
st bu
t slow
ed d
ow
n in
Sep
tem
ber, N
ovem
be
r and
Dece
mb
er. Price ran
ged fro
m U
S$ 0
.50
9/kg to
US$
0
.56
2/kg.
Maize
(corn
). In 2012, mon
thly fluctu
ation
s were ob
served in the p
rices of m
aize. H
ighest p
rice was U
S$ 0.333/kg in Ju
ly wh
ile low
est was U
S$ 0.267/kg in Ju
ne.
Co
ffee
, Arab
ica. Co
ffee A
rabica w
as relatively cheap
er at the w
orld
market in
20
12
co
mp
ared to
20
11
. Price d
ecreases w
ere sustain
ed th
rou
gho
ut th
e year. Price
ranged
from
US$
3.3
67
/kg, (Dece
mb
er) to U
S$ 5
.23
0/kg (Jan
uary).
Co
ffee
, Ro
bu
sta. Price
s of R
ob
usta C
offe
e were relatively lo
wer in
20
12
; ho
we
ver p
rices were h
igher in
Octo
ber an
d N
ovem
ber re
lative to 2
01
1.
Ban
ana. Lo
we
r price
s of b
anan
a w
ere
no
ted
in th
e w
orld
ma
rket th
rou
gho
ut
20
12
. Price
cuts w
ere
from
a lo
w o
f 88
.51
pe
rcen
t to a h
igh o
f 90
.23
pe
rcen
t co
mp
are
d to
20
11
. Price
s range
d fro
m U
S$ 0
.93
4/kg to
US$
1.1
44
/kg. R
ub
be
r. Decrease
s were like
wise n
oted
on
the w
orld
price
s of ru
bb
er. Price ran
ged
from
US$
2.5
95
/kg to U
S$ 3
.78
1/kg.
5 28
ItemTotal Philippine
Agricultural ExportsAustralia Japan USA
1. Food and Live Animals 3,197.782 35.735 620.867 659.687 A. Live Animals (No.) 13.919 0.013 1.441 0.928 B. Meat and Meat Preparations 67.530 0.420 35.402 1.058 C. Dairy Products and Birds Eggs 88.372 0.186 0.122 0.955 D. Fish and Fish Preparations 810.803 5.683 119.070 225.563 E. Cereals and Cereals Preparations 104.820 1.770 3.599 14.940 F. Vegetables and Fruits 1,615.176 23.016 431.000 328.190 G. Sugar and Sugar Preparations 209.839 0.963 17.699 62.884 H. Coffee, Tea, Cocoa, Spices and Manufactures thereof 9.723 0.196 0.086 1.503 I. Feeding Stuff for Animals
(excluding unmilled Cereals)J. Miscellaneous Edible Products and Preparations 144.980 3.441 5.867 23.180
II. Tobacco and Tobacco Manufactures 233.779 0.761 0.027 12.871
III. Crude Materials 277.707 5.815 6.655 48.551 A. Oil Seeds and Oleginous Fruits 1.428 - - 0.020 B. Crude Rubber 62.075 - 0.076 1.714 C. Crude Fertil izer 0.776 - 0.135 - D. Crude Animal and Vegs. Materials 213.428 5.815 6.445 46.816
IV. Animal and Vegetable Oil and Fats 1,191.937 2.983 63.887 482.170 A. Animal and Vegetable Oils and Fats 97.219 1.265 1.730 17.189 B. Fixed Vegetable Oil and Fats 1,094.718 1.718 62.157 464.980
V. Fertil izer Manufactured 118.793 0.619 - 0.004
VI. Agricultural Chemicals and Materials 13.073 2.119 0.168 0.149
VII. Agricultural Machinery (No.) 4.866 - 0.249 0.018 Total Value of Agricultural Exports 5,037.937 48.032 691.854 1,203.449 Total Value of Philippine Exports 52,099.520 387.247 9,879.897 7,408.388
0.485
Table 9a. DISTRIBUTION OF PHILIPPINE AGRICULTURAL EXPORTS TO AUSTRALIA, JAPAN, and USA, 2012(F.O.B. Value in Million US $)
132.619 0.048 6.581
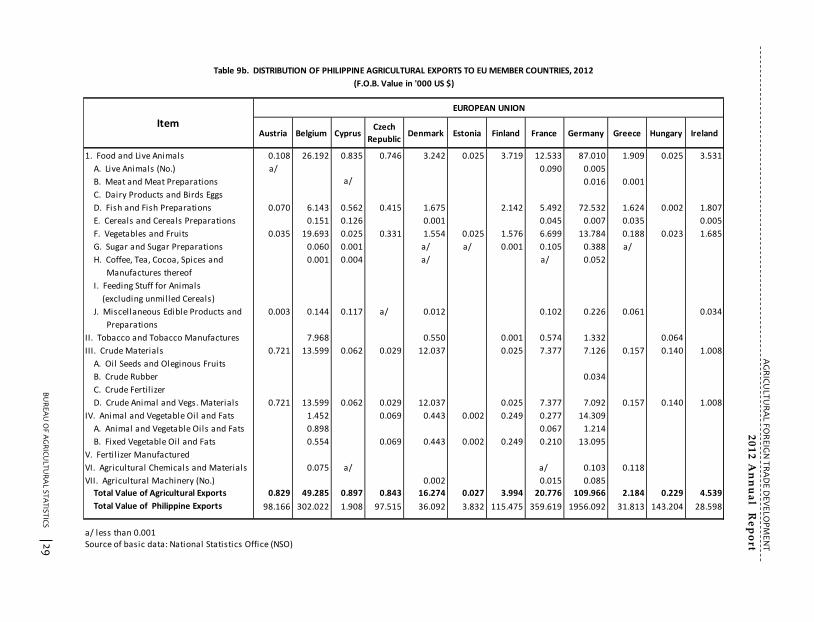
B
UR
EA
U O
F AG
RIC
ULTU
RA
L STA
TIST
ICS
B
UR
EA
U O
F AG
RIC
ULTU
RA
L STA
TISTIC
S
AG
RIC
ULT
UR
AL FO
RE
IGN
TR
AD
E D
EV
ELO
PM
EN
T
20
12
An
nu
al R
ep
ort
C
offe
e h
ad th
e 7
th bigge
st agricu
ltural im
po
rt exp
en
ditu
re in
20
12
. From
US$
1
20
.15
millio
n in
20
11
, imp
ort e
xpe
nd
iture
s incre
ased
to U
S$ 2
51
.14
millio
n o
r 1
09
.02
p
erce
nt
grow
th.
Mo
st o
f o
ur
coffe
e
imp
orts
came
fro
m
Ind
on
esia
(56
.19
%); V
ietn
am (1
9.5
9%
) an
d M
alaysia (11
.40
%).
Rice, th
e cou
ntry’s 4
th top
imp
ort co
mm
od
ity, record
ed a 14.34 p
ercent in
crease in
imp
ort exp
end
iture fro
m U
S$ 383.15 millio
n in
2011 to U
S$ 438.08 millio
n in
2012. B
iggest im
po
rtatio
n in
20
12
wa
s reco
rde
d d
urin
g the
3rd q
ua
rter w
hile
the
least w
as po
sted
in th
e 1
st qu
arter. M
ost o
f ou
r rice im
po
rts (82
.01
%) w
ere
sou
rced
from
Vie
tnam
; wh
ile th
e re
st came
from
Ind
ia, Pakistan
, Myan
mar,
Thailan
d an
d o
the
r cou
ntrie
s. M
aize
/corn
imp
ortatio
n gre
w b
y 84
.35
pe
rcen
t at U
S$ 8
8.5
2 m
illion
in 2
01
2
from
US$
48
.02
millio
n in
20
11
mo
ving to
the
10
th top
imp
ort co
mm
od
ity list of
20
12
. He
avie
st imp
orta
tion
wa
s reco
rde
d d
urin
g the
first qu
arter a
t US$
39
.02
m
illion
wh
ile th
e le
ast im
po
rtatio
n w
as d
urin
g the
third
qu
arte
r at US$
7.3
6
millio
n.
Co
rn
wa
s so
urce
d
large
ly fro
m
Th
aila
nd
(3
5.0
4%
), So
uth
A
frica (2
5.5
4%
) an
d B
razil (1
5.5
8%
) an
d o
the
rs. 5
.W
orld
Price
Tren
ds
W
orld
p
rices
we
re
low
er
thro
ugh
ou
t 2
01
2
for
mo
st o
f th
e
mo
nito
red
co
mm
od
ities - co
con
ut o
il, cop
ra, su
gar, m
aize
, coffe
e, b
an
an
a a
nd
rub
be
r (T
ab
le 1
1).
C
oco
nu
t oil an
d co
pra. Su
stain
ed
do
wn
tren
d in
the
price
s of co
con
ut o
il an
d
cop
ra w
as n
ote
d fro
m Ja
nu
ary to
De
cem
be
r of 2
01
2. P
rice d
ecre
ase
d b
y as
mu
ch a
s 45
% fo
r bo
th co
mm
od
ities. P
rice ra
ng
ed
from
US$
1.4
51
/kg
in
Jan
ua
ry to
U
S$
0
.78
5/kg
in
D
ece
mb
er
for
coco
nu
t o
il. P
rices
of
cop
ra
starte
d
at
US$
0
.96
5/kg
in
Ja
nu
ary
an
d
we
re
do
wn
to
a
s lo
w
as
US$
0
.52
6/k
g in
De
cem
be
r. Su
gar. Dro
p
in
the
p
rices
of
sug
ar
in
the
w
orld
m
ark
et
wa
s o
bse
rved
th
rou
gh
-ou
t the
ye
ar 2
01
2. H
igh
est p
rice w
as p
oste
d in
Fe
bru
ary
at U
S$
0
.53
2/k
g w
hile
the
low
est p
rice w
as d
urin
g N
ov
em
be
r an
d D
ece
mb
er a
t U
S$
0.4
26
/kg
.
29
4
Austria Belgium CyprusCzech
RepublicDenmark Estonia Finland France Germany Greece Hungary Ireland
1. Food and Live Animals 0.108 26.192 0.835 0.746 3.242 0.025 3.719 12.533 87.010 1.909 0.025 3.531
A. Live Animals (No.) a/ 0.090 0.005
B. Meat and Meat Preparations a/ 0.016 0.001
C. Dairy Products and Birds Eggs
D. Fish and Fish Preparations 0.070 6.143 0.562 0.415 1.675 2.142 5.492 72.532 1.624 0.002 1.807
E. Cereals and Cereals Preparations 0.151 0.126 0.001 0.045 0.007 0.035 0.005
F. Vegetables and Fruits 0.035 19.693 0.025 0.331 1.554 0.025 1.576 6.699 13.784 0.188 0.023 1.685
G. Sugar and Sugar Preparations 0.060 0.001 a/ a/ 0.001 0.105 0.388 a/
H. Coffee, Tea, Cocoa, Spices and 0.001 0.004 a/ a/ 0.052
Manufactures thereof
I. Feeding Stuff for Animals
(excluding unmilled Cereals)
J. Miscellaneous Edible Products and 0.003 0.144 0.117 a/ 0.012 0.102 0.226 0.061 0.034
Preparations
II. Tobacco and Tobacco Manufactures 7.968 0.550 0.001 0.574 1.332 0.064
III. Crude Materials 0.721 13.599 0.062 0.029 12.037 0.025 7.377 7.126 0.157 0.140 1.008
A. Oil Seeds and Oleginous Fruits
B. Crude Rubber 0.034
C. Crude Fertil izer
D. Crude Animal and Vegs. Materials 0.721 13.599 0.062 0.029 12.037 0.025 7.377 7.092 0.157 0.140 1.008
IV. Animal and Vegetable Oil and Fats 1.452 0.069 0.443 0.002 0.249 0.277 14.309
A. Animal and Vegetable Oils and Fats 0.898 0.067 1.214
B. Fixed Vegetable Oil and Fats 0.554 0.069 0.443 0.002 0.249 0.210 13.095
V. Fertil izer Manufactured
VI. Agricultural Chemicals and Materials 0.075 a/ a/ 0.103 0.118
VII. Agricultural Machinery (No.) 0.002 0.015 0.085
Total Value of Agricultural Exports 0.829 49.285 0.897 0.843 16.274 0.027 3.994 20.776 109.966 2.184 0.229 4.539
Total Value of Philippine Exports 98.166 302.022 1.908 97.515 36.092 3.832 115.475 359.619 1956.092 31.813 143.204 28.598
a/ less than 0.001Source of basic data: National Statistics Office (NSO)
(F.O.B. Value in '000 US $)
EUROPEAN UNION
Table 9b. DISTRIBUTION OF PHILIPPINE AGRICULTURAL EXPORTS TO EU MEMBER COUNTRIES, 2012
Item
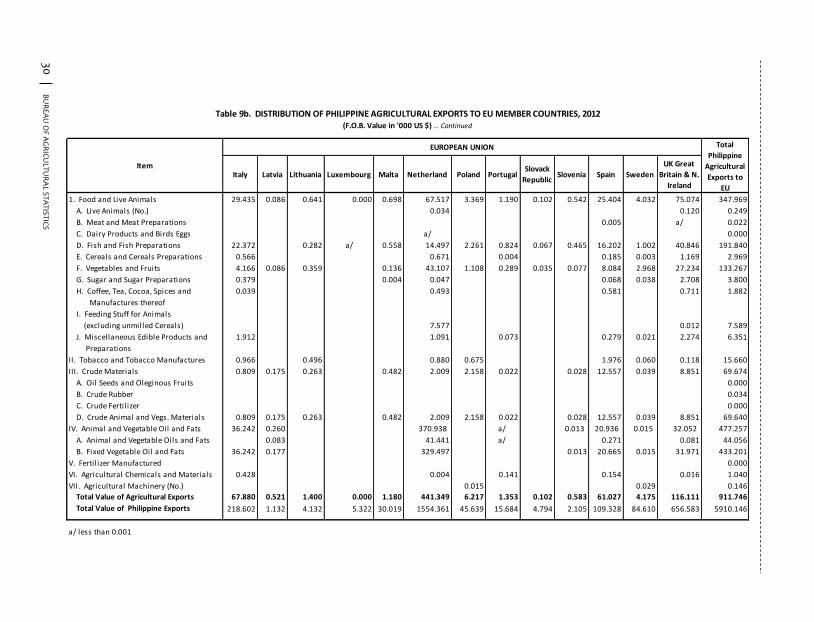
B
UR
EA
U O
F AG
RIC
ULTU
RA
L STA
TIST
ICS
B
UR
EA
U O
F AG
RIC
ULTU
RA
L STA
TISTIC
S
AG
RIC
ULT
UR
AL FO
RE
IGN
TR
AD
E D
EV
ELO
PM
EN
T
20
12
An
nu
al R
ep
ort
F
resh
Ba
na
na
s wh
ich sh
are
d 1
2.8
4 p
erce
nt to
the
tota
l top
ag
ricultu
ral
com
mo
ditie
s wa
s the
Ph
ilipp
ine
s’ 2n
d top
exp
ort co
mm
od
ity in
20
12
. E
xpo
rt re
ve
nu
e
gre
w
by
3
6.8
9
pe
rcen
t, th
e
hig
he
st o
f w
hich
w
as
po
sted
du
ring
the
4th q
ua
rter o
f 20
12
. Jap
an
sha
red
47
.51
pe
rcen
t at
US
$ 3
07
.24
millio
n o
f the
tota
l exp
ort e
arn
ing
s from
this co
mm
od
ity.
Oth
er m
ajo
r ma
rke
ts we
re P
eo
ple
’s Re
pu
blic o
f Ch
ina
, So
uth
Ko
rea
n
Re
pu
blic, U
nite
d A
rab
Em
irate
s an
d S
ing
ap
ore
.
Tu
na
gen
erate
d
US$
4
55
.10
m
illion
e
arnin
gs fro
m
exp
orts
to
the
U
SA
(31
.03
%); G
erm
any (1
5.8
3%
); Japan
(12
.32
%); U
K G
reat B
ritain an
d N
. Irelan
d
(8.3
5%
); Italy (4.7
8%
) and
oth
ers (2
7.6
9%
).
E
xp
ort re
ve
nu
es fro
m p
ine
ap
ple
an
d p
ine
ap
ple
pro
du
cts incre
ase
d
by
2
0.0
4
pe
rcen
t. T
he
U
S$
4
14
.91
m
illion
e
arn
ing
s w
ere
m
ostly
sh
are
d
by
p
rocu
rem
en
t fro
m
US
A
(37
.37
%);
Jap
an
(1
5.1
9
%)
an
d
Sin
ga
po
re (1
3.5
7%
). B
est p
erfo
rme
r in 2
01
2 w
as cop
ra oil cake
wh
ich m
ove
d u
p b
y 11
1.9
3%
in re
ven
ue
fro
m U
S$ 5
8.8
0 m
illion
to U
S$ 1
24
.61
millio
n fin
din
g its way to
the
top
8 list.
4
.To
p A
gricultu
ral Imp
orts
Th
e to
tal valu
e o
f top
ten
agricultu
ral imp
orts at U
S$ 4
,10
8.7
1 m
illion
wa
s abo
ut
half (5
0.3
0%
) of th
e co
un
try’s agricu
ltural im
po
rt exp
en
ditu
res at U
S$ 8
,16
8.3
3
millio
n in
20
12
. Excep
t for m
ilk & cre
am an
d p
rod
ucts, m
eat o
f bo
vine
anim
als an
d
un
man
ufactu
red
to
bacco
, e
xpe
nd
iture
s fo
r all
of
the
to
p
ten
im
po
rt co
mm
od
ities re
cord
ed
incre
asing rate
(Table
s 7-8
).
W
he
at
(inclu
din
g
spe
lt) &
M
eslin
h
ad
th
e
larg
est
sha
re
of
ne
arly
12
p
erce
nt to
the
tota
l ag
ricultu
ral im
po
rts. Th
e h
igh
est im
po
rtatio
n o
f w
he
at w
as re
cord
ed
du
ring
the
3rd q
ua
rter a
t US$
29
5.4
4 m
illion
. Mo
re
tha
n h
alf (5
4.0
9 %
) of o
ur w
he
at im
po
rts we
re so
urce
d fro
m th
e U
SA
; a
bo
ut 4
0.9
1 %
from
Au
stralia
wh
ile th
e re
st cam
e fro
m In
dia
, Ca
na
da
, Sin
ga
po
re a
nd
oth
er co
un
tries.
3 30
Italy Latvia Lithuania Luxembourg Malta Netherland Poland PortugalSlovack
RepublicSlovenia Spain Sweden
UK Great
Britain & N.
Ireland
1. Food and Live Animals 29.435 0.086 0.641 0.000 0.698 67.517 3.369 1.190 0.102 0.542 25.404 4.032 75.074 347.969
A. Live Animals (No.) 0.034 0.120 0.249
B. Meat and Meat Preparations 0.005 a/ 0.022
C. Dairy Products and Birds Eggs a/ 0.000
D. Fish and Fish Preparations 22.372 0.282 a/ 0.558 14.497 2.261 0.824 0.067 0.465 16.202 1.002 40.846 191.840
E. Cereals and Cereals Preparations 0.566 0.671 0.004 0.185 0.003 1.169 2.969
F. Vegetables and Fruits 4.166 0.086 0.359 0.136 43.107 1.108 0.289 0.035 0.077 8.084 2.968 27.234 133.267
G. Sugar and Sugar Preparations 0.379 0.004 0.047 0.068 0.038 2.708 3.800
H. Coffee, Tea, Cocoa, Spices and 0.039 0.493 0.581 0.711 1.882
Manufactures thereof
I. Feeding Stuff for Animals
(excluding unmilled Cereals)
J. Miscellaneous Edible Products and 1.912 1.091 0.073 0.279 0.021 2.274 6.351
Preparations
II. Tobacco and Tobacco Manufactures 0.966 0.496 0.880 0.675 1.976 0.060 0.118 15.660
III. Crude Materials 0.809 0.175 0.263 0.482 2.009 2.158 0.022 0.028 12.557 0.039 8.851 69.674
A. Oil Seeds and Oleginous Fruits 0.000
B. Crude Rubber 0.034
C. Crude Fertil izer 0.000
D. Crude Animal and Vegs. Materials 0.809 0.175 0.263 0.482 2.009 2.158 0.022 0.028 12.557 0.039 8.851 69.640
IV. Animal and Vegetable Oil and Fats 36.242 0.260 370.938 a/ 0.013 20.936 0.015 32.052 477.257
A. Animal and Vegetable Oils and Fats 0.083 41.441 a/ 0.271 0.081 44.056
B. Fixed Vegetable Oil and Fats 36.242 0.177 329.497 0.013 20.665 0.015 31.971 433.201
V. Fertil izer Manufactured 0.000
VI. Agricultural Chemicals and Materials 0.428 0.004 0.141 0.154 0.016 1.040
VII. Agricultural Machinery (No.) 0.015 0.029 0.146
Total Value of Agricultural Exports 67.880 0.521 1.400 0.000 1.180 441.349 6.217 1.353 0.102 0.583 61.027 4.175 116.111 911.746
Total Value of Philippine Exports 218.602 1.132 4.132 5.322 30.019 1554.361 45.639 15.684 4.794 2.105 109.328 84.610 656.583 5910.146
a/ less than 0.001
Table 9b. DISTRIBUTION OF PHILIPPINE AGRICULTURAL EXPORTS TO EU MEMBER COUNTRIES, 2012(F.O.B. Value in '000 US $) … Continued
EUROPEAN UNION
7.5890.012
Total
Philippine
Agricultural
Exports to
EU
7.577
Item
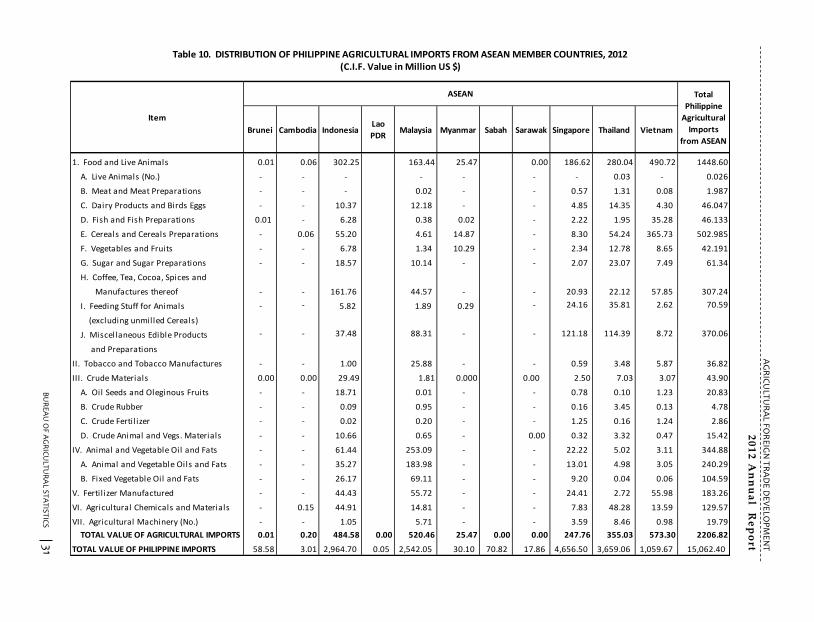
B
UR
EA
U O
F AG
RIC
ULTU
RA
L STA
TIST
ICS
B
UR
EA
U O
F AG
RIC
ULTU
RA
L STA
TISTIC
S
AG
RIC
ULT
UR
AL FO
RE
IGN
TR
AD
E D
EV
ELO
PM
EN
T
20
12
An
nu
al R
ep
ort
3
8.9
2 p
ercen
t to U
S$ 2
79
.82
millio
n in
20
12
from
US$
45
8.0
8 m
illion
in 2
01
1.
Wh
ile agricultu
ral imp
orts in
creased b
y abo
ut 4
.0 p
ercent, exp
orts d
eclined
b
y abo
ut 1
4.5
0 p
ercent.
A
gricultu
ral trad
e w
ith A
SEA
N m
em
be
r-cou
ntrie
s po
sted
furth
er tra
de
d
eficit b
y 6.5
7 p
erce
nt. A
gricultu
ral e
xpo
rts to A
SEA
N co
un
tries w
ere
d
ow
n b
y 6.8
5 p
erce
nt, b
ut agricu
ltura
l imp
orts fro
m th
e re
gion
mo
ved
up
b
y 0.9
2 p
erce
nt.
T
rad
e d
eficit w
ith A
ustra
lia wa
s susta
ine
d an
d fu
rthe
r incre
ase
d b
y 31
.20
p
erce
nt. A
ustra
lia sh
are
d le
ss than
on
e (1
) pe
rcen
t to o
ur a
gricultu
ral e
xpo
rts reve
nu
e a
t US$
48
.03
millio
n an
d n
ea
rly nin
e (9
) pe
rcen
t to o
ur
agricu
ltura
l imp
orts e
xpe
nd
iture
s at U
S$ 7
19
.66
millio
n.
A
gricu
ltura
l trad
e w
ith th
e U
nite
d S
tate
s of A
me
rica (U
SA
) po
sted
b
igg
est g
row
th in
de
ficit by
17
9.7
2 p
erce
nt. D
eficit g
rew
to U
S$
5
61
.90
millio
n fro
m U
S$
20
0.8
8 m
illion
in 2
01
1. E
xpo
rts de
crea
sed
b
y 1
7.2
5 p
erce
nt w
hile
imp
orts b
y 6
.66
pe
rcen
t. Th
e U
SA
sha
red
a
bo
ut o
ne
fou
rth to
ou
r ag
ricultu
ral e
xp
orts in
20
12
.
Trade w
ith th
e rest of th
e w
orld
(RO
W) su
stained
trade d
eficit tho
ugh
at very slo
w rate o
f 0.0
9 p
ercent, th
at is, from
US$
1,4
01
.88
millio
n in
20
11
to U
S$
1,4
03
.16
millio
n in
20
12
.
3.
Top
Agricu
ltural Exp
orts
To
p
agricultu
ral e
xpo
rts sh
ared
6
8.4
6
pe
rcen
t to
to
tal agricu
ltural
exp
orts
reve
nu
e at U
S$ 3
,44
8.9
5 m
illion
or 1
1.0
8 p
erce
nt lo
we
r than
the 2
01
1 e
arnin
gs. Co
con
ut o
il record
ed th
e biggest exp
ort reven
ue th
ou
gh at a d
ecreasing rate. Exp
ort
gainers in
2012 inclu
ded
fresh b
anan
a, tun
a, pin
eapp
le and
pin
eapp
le pro
du
cts and
co
pra o
il cake (Table
s 4-6
).
C
oco
nu
t o
il sh
ared
20
.67
p
ercent
to
the
P
hilip
pin
e to
p
ten
(10
) exp
ort
earnin
gs. Ho
we
ver, this w
as low
er by 2
6.9
4 p
ercen
t in reven
ue co
mp
ared to
2
01
1. Exp
ort earn
ings w
ere d
ow
n to
US$
1,0
41
.48
millio
n in
20
12
from
US$
1
,42
5.4
5 m
illion
in 2
01
1. Th
e h
ighest exp
ort re
cord
ed w
as in th
e 2n
d qu
arter at U
S$ 2
94
.39
millio
n. M
ajor m
arkets were
USA
(44
.10
%); th
e Neth
erland
s (3
1.6
4%
); Japan
(5.0
2%
); Italy (3.4
8%
); UK
Great B
ritain an
d N
orth
ern Irelan
d
(3.0
7%
) and
oth
ers (12
.69
%).
31 2
Brunei Cambodia IndonesiaLao
PDRMalaysia Myanmar Sabah Sarawak Singapore Thailand Vietnam
1. Food and Live Animals 0.01 0.06 302.25 163.44 25.47 0.00 186.62 280.04 490.72 1448.60
A. Live Animals (No.) - - - - - - - 0.03 - 0.026
B. Meat and Meat Preparations - - - 0.02 - - 0.57 1.31 0.08 1.987
C. Dairy Products and Birds Eggs - - 10.37 12.18 - - 4.85 14.35 4.30 46.047
D. Fish and Fish Preparations 0.01 - 6.28 0.38 0.02 - 2.22 1.95 35.28 46.133
E. Cereals and Cereals Preparations - 0.06 55.20 4.61 14.87 - 8.30 54.24 365.73 502.985
F. Vegetables and Fruits - - 6.78 1.34 10.29 - 2.34 12.78 8.65 42.191
G. Sugar and Sugar Preparations - - 18.57 10.14 - - 2.07 23.07 7.49 61.34
H. Coffee, Tea, Cocoa, Spices and
Manufactures thereof
I. Feeding Stuff for Animals - - 5.82 1.89 0.29 - 24.16 35.81 2.62 70.59
(excluding unmilled Cereals)
J. Miscellaneous Edible Products - - 37.48 88.31 - - 121.18 114.39 8.72 370.06
and Preparations
II. Tobacco and Tobacco Manufactures - - 1.00 25.88 - - 0.59 3.48 5.87 36.82
III. Crude Materials 0.00 0.00 29.49 1.81 0.000 0.00 2.50 7.03 3.07 43.90
A. Oil Seeds and Oleginous Fruits - - 18.71 0.01 - - 0.78 0.10 1.23 20.83
B. Crude Rubber - - 0.09 0.95 - - 0.16 3.45 0.13 4.78
C. Crude Fertil izer - - 0.02 0.20 - - 1.25 0.16 1.24 2.86
D. Crude Animal and Vegs. Materials - - 10.66 0.65 - 0.00 0.32 3.32 0.47 15.42
IV. Animal and Vegetable Oil and Fats - - 61.44 253.09 - - 22.22 5.02 3.11 344.88
A. Animal and Vegetable Oils and Fats - - 35.27 183.98 - - 13.01 4.98 3.05 240.29
B. Fixed Vegetable Oil and Fats - - 26.17 69.11 - - 9.20 0.04 0.06 104.59
V. Fertil izer Manufactured - - 44.43 55.72 - - 24.41 2.72 55.98 183.26
VI. Agricultural Chemicals and Materials - 0.15 44.91 14.81 - - 7.83 48.28 13.59 129.57
VII. Agricultural Machinery (No.) - - 1.05 5.71 - - 3.59 8.46 0.98 19.79
TOTAL VALUE OF AGRICULTURAL IMPORTS 0.01 0.20 484.58 0.00 520.46 25.47 0.00 0.00 247.76 355.03 573.30 2206.82
TOTAL VALUE OF PHILIPPINE IMPORTS 58.58 3.01 2,964.70 0.05 2,542.05 30.10 70.82 17.86 4,656.50 3,659.06 1,059.67 15,062.40
Total
Philippine
Agricultural
Imports
from ASEAN
161.76 44.57 - - - 22.12 57.85 20.93
Table 10. DISTRIBUTION OF PHILIPPINE AGRICULTURAL IMPORTS FROM ASEAN MEMBER COUNTRIES, 2012(C.I.F. Value in Million US $)
Item
-
ASEAN
307.24
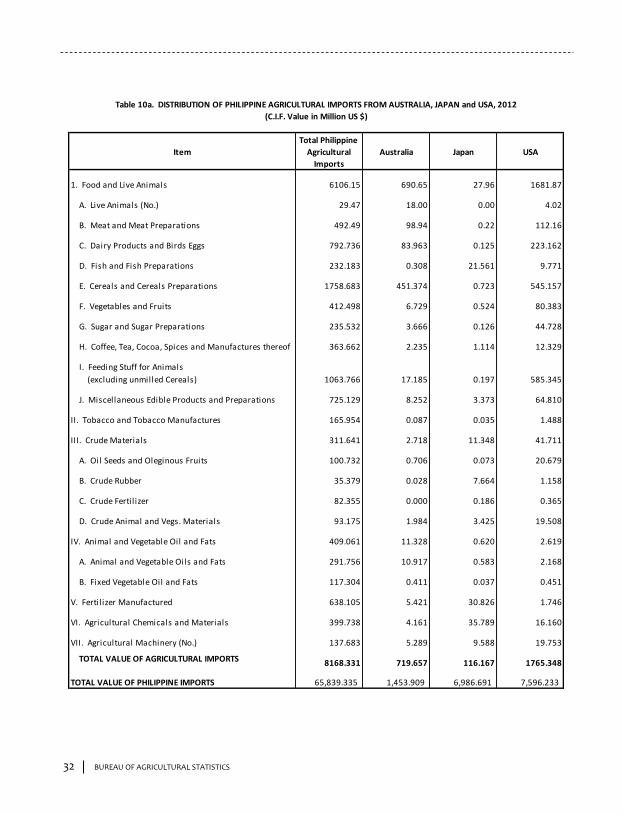
BUREAU OF AGRICULTURAL STATISTICS BUREAU OF AGRICULTURAL STATISTICS
AGRICULTURAL FOREIGN TRADE DEVELOPMENT
2012 Annual Report
OVERALL AGRICULTURAL TRADE SITUATION
1. The Philippine agricultural foreign trade performance weakened in 2012
compared to 2011, where the gap between our exports and imports further widened. Trade deficit grew by around 30 percent, from US$ 2,408.17 million in 2011 to US$ 3,130.39 million this year (Table 1).
While total exports registered increase in revenue, earnings from agricultural exports dropped from US$ 5,431.76 million in 2011 to US$ 5,037.94 million in 2012 or 7.25 percent.
The share of agricultural exports declined to 9.67 percent in 2012 from 11.24 percent in 2011.
Agricultural imports posted a 4.19 percent increase in expenditures from US$ 7,839.93 million in 2011 to US$ 8,168.33 million in 2012.
Agricultural imports shared 12.41 percent to total expenditures on imports amounting to US$ 65,839.34 million.
2. Trade with Japan and European Union (EU) both posted surpluses. However, the
movements were in opposite directions. Trade surplus with Japan exhibited an increasing rate while that with EU registered a decrease. Trade deficits were noted for the country’s other trading partners (Table 2).
Trade surplus with Japan grew by 11.92 percent above 2011 level. In 2012, Japan was the country’s top market for fresh banana; 2
nd top
importer of pineapple and pineapple products; and 3rd
leading market for coconut oil, tuna and centrifugal sugar. Value of agricultural exports to this country was US$ 691.85 million or 13.73 percent of our total agricultural exports revenue in 2012. On the other hand, the Philippines’ agricultural import from Japan was valued at US$ 116.17 million.
EU shared 18.10 percent of the country’s total export revenue. EU was a major market for Philippine coconut oil, tuna, desiccated coconut and seaweed & carrageenan. Agricultural trade surplus with EU was down by 38.92 percent to US$ 279.82 million in 2012 from US$ 458.08 million in 2011. While agricultural imports increased by about 4.0 percent, exports
1 32
Item
Total Philippine
Agricultural
Imports
Australia Japan USA
1. Food and Live Animals 6106.15 690.65 27.96 1681.87
A. Live Animals (No.) 29.47 18.00 0.00 4.02
B. Meat and Meat Preparations 492.49 98.94 0.22 112.16
C. Dairy Products and Birds Eggs 792.736 83.963 0.125 223.162
D. Fish and Fish Preparations 232.183 0.308 21.561 9.771
E. Cereals and Cereals Preparations 1758.683 451.374 0.723 545.157
F. Vegetables and Fruits 412.498 6.729 0.524 80.383
G. Sugar and Sugar Preparations 235.532 3.666 0.126 44.728
H. Coffee, Tea, Cocoa, Spices and Manufactures thereof 363.662 2.235 1.114 12.329
I. Feeding Stuff for Animals
(excluding unmilled Cereals) 1063.766 17.185 0.197 585.345
J. Miscellaneous Edible Products and Preparations 725.129 8.252 3.373 64.810
II. Tobacco and Tobacco Manufactures 165.954 0.087 0.035 1.488
III. Crude Materials 311.641 2.718 11.348 41.711
A. Oil Seeds and Oleginous Fruits 100.732 0.706 0.073 20.679
B. Crude Rubber 35.379 0.028 7.664 1.158
C. Crude Fertil izer 82.355 0.000 0.186 0.365
D. Crude Animal and Vegs. Materials 93.175 1.984 3.425 19.508
IV. Animal and Vegetable Oil and Fats 409.061 11.328 0.620 2.619
A. Animal and Vegetable Oils and Fats 291.756 10.917 0.583 2.168
B. Fixed Vegetable Oil and Fats 117.304 0.411 0.037 0.451
V. Fertil izer Manufactured 638.105 5.421 30.826 1.746
VI. Agricultural Chemicals and Materials 399.738 4.161 35.789 16.160
VII. Agricultural Machinery (No.) 137.683 5.289 9.588 19.753
TOTAL VALUE OF AGRICULTURAL IMPORTS 8168.331 719.657 116.167 1765.348
TOTAL VALUE OF PHILIPPINE IMPORTS 65,839.335 1,453.909 6,986.691 7,596.233
Table 10a. DISTRIBUTION OF PHILIPPINE AGRICULTURAL IMPORTS FROM AUSTRALIA, JAPAN and USA, 2012
(C.I.F. Value in Million US $)
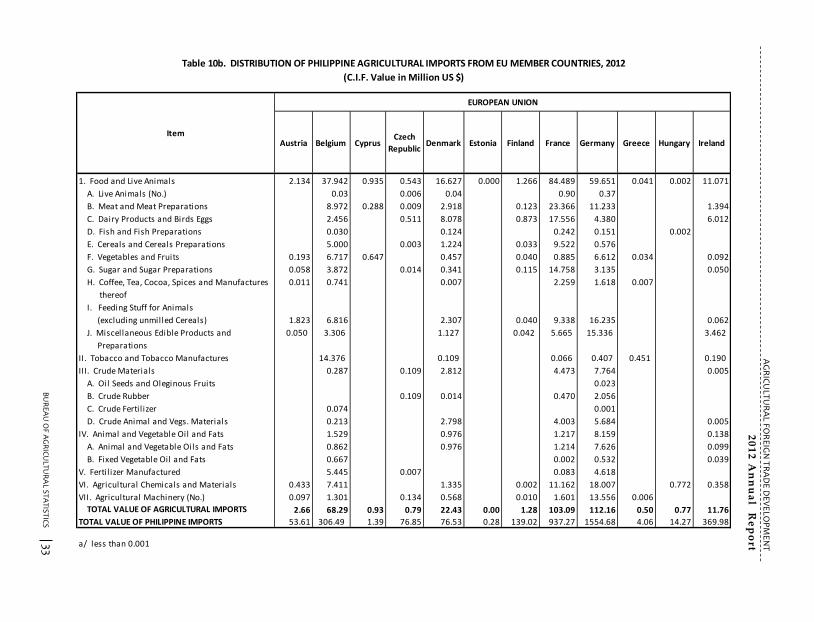
B
UR
EA
U O
F AG
RIC
ULTU
RA
L STA
TIST
ICS
B
UR
EA
U O
F AG
RIC
ULTU
RA
L STA
TISTIC
S
AG
RIC
ULT
UR
AL FO
RE
IGN
TR
AD
E D
EV
ELO
PM
EN
T
20
12
An
nu
al R
ep
ort
LIST O
F FIGU
RES
Figu
re No
.
Pages
27
W
OR
LD P
RIC
ES OF SU
GA
R, JA
NU
AR
Y - DEC
EMB
ER, 2
01
1-2
01
2 …
……
.. 3
8
28
W
OR
LD P
RIC
ES OF SO
YBEA
NS, JA
NU
AR
Y - DEC
EMB
ER, 2
01
1-2
01
2 …
…
38
2
9
WO
RLD
PR
ICES O
F RIC
E (5%
BR
OK
EN), JA
NU
AR
Y- D
ECEM
BE
R,
2
01
1-2
01
2 …
……
……
……
……
……
……
……
……
……
……
……
……
……
……
……
……
…
38
3
0
WO
RLD
PR
ICES O
F RIC
E (25
% B
RO
KEN
), JAN
UA
RY- D
ECEM
BER
,
20
11
-20
12
……
……
……
……
……
……
……
……
……
……
……
……
……
……
……
……
……
.. 3
8
31
W
OR
LD P
RIC
ES OF R
ICE (A
1 SP
ECIA
L), JAN
UA
RY - D
ECEM
BE
R,
2
01
1-2
01
2 …
……
……
……
……
……
……
……
……
……
……
……
……
……
……
……
……
…
39
3
2
WO
RLD
PR
ICES O
F MA
IZE, JAN
UA
RY
- DEC
EMB
ER, 2
01
1-2
01
2 …
.….…
…
39
3
3
WO
RLD
PR
ICES O
F CO
FFEE, AR
AB
ICA
, JAN
UA
RY
- DEC
EMB
ER
,
20
11
-20
12
……
……
……
……
……
……
……
……
……
……
……
……
……
……
……
……
……
3
9
34
W
OR
LD P
RIC
ES OF C
OFFEE, R
OB
USTA
, JAN
UA
RY- D
ECEM
BE
R,
2
01
1-2
01
2 …
……
……
……
……
……
……
……
……
……
……
……
……
……
……
……
……
…
39
3
5
WO
RLD
PR
ICES O
F BA
NA
NA
, JAN
UA
RY- D
ECEM
BER
, 20
11
-20
12
……
….
39
3
6
WO
RLD
PR
ICES O
F RU
BB
ER, JA
NU
AR
Y- DEC
EMB
ER, 2
01
1-2
01
2 …
……
.. 3
9
33 viii
Austria Belgium CyprusCzech
RepublicDenmark Estonia Finland France Germany Greece Hungary Ireland
1. Food and Live Animals 2.134 37.942 0.935 0.543 16.627 0.000 1.266 84.489 59.651 0.041 0.002 11.071
A. Live Animals (No.) 0.03 0.006 0.04 0.90 0.37
B. Meat and Meat Preparations 8.972 0.288 0.009 2.918 0.123 23.366 11.233 1.394
C. Dairy Products and Birds Eggs 2.456 0.511 8.078 0.873 17.556 4.380 6.012
D. Fish and Fish Preparations 0.030 0.124 0.242 0.151 0.002
E. Cereals and Cereals Preparations 5.000 0.003 1.224 0.033 9.522 0.576
F. Vegetables and Fruits 0.193 6.717 0.647 0.457 0.040 0.885 6.612 0.034 0.092
G. Sugar and Sugar Preparations 0.058 3.872 0.014 0.341 0.115 14.758 3.135 0.050
H. Coffee, Tea, Cocoa, Spices and Manufactures 0.011 0.741 0.007 2.259 1.618 0.007
thereof
I. Feeding Stuff for Animals
(excluding unmilled Cereals)
J. Miscellaneous Edible Products and 0.050 3.306 1.127 0.042 5.665 15.336 3.462
Preparations
II. Tobacco and Tobacco Manufactures 14.376 0.109 0.066 0.407 0.451 0.190
III. Crude Materials 0.287 0.109 2.812 4.473 7.764 0.005
A. Oil Seeds and Oleginous Fruits 0.023
B. Crude Rubber 0.109 0.014 0.470 2.056
C. Crude Fertil izer 0.074 0.001
D. Crude Animal and Vegs. Materials 0.213 2.798 4.003 5.684 0.005
IV. Animal and Vegetable Oil and Fats 1.529 0.976 1.217 8.159 0.138
A. Animal and Vegetable Oils and Fats 0.862 0.976 1.214 7.626 0.099
B. Fixed Vegetable Oil and Fats 0.667 0.002 0.532 0.039
V. Fertil izer Manufactured 5.445 0.007 0.083 4.618
VI. Agricultural Chemicals and Materials 0.433 7.411 1.335 0.002 11.162 18.007 0.772 0.358
VII. Agricultural Machinery (No.) 0.097 1.301 0.134 0.568 0.010 1.601 13.556 0.006
TOTAL VALUE OF AGRICULTURAL IMPORTS 2.66 68.29 0.93 0.79 22.43 0.00 1.28 103.09 112.16 0.50 0.77 11.76
TOTAL VALUE OF PHILIPPINE IMPORTS 53.61 306.49 1.39 76.85 76.53 0.28 139.02 937.27 1554.68 4.06 14.27 369.98
a/ less than 0.001
EUROPEAN UNION
1.823 6.816
Table 10b. DISTRIBUTION OF PHILIPPINE AGRICULTURAL IMPORTS FROM EU MEMBER COUNTRIES, 2012
(C.I.F. Value in Million US $)
Item
2.307 0.040 9.338 16.235 0.062
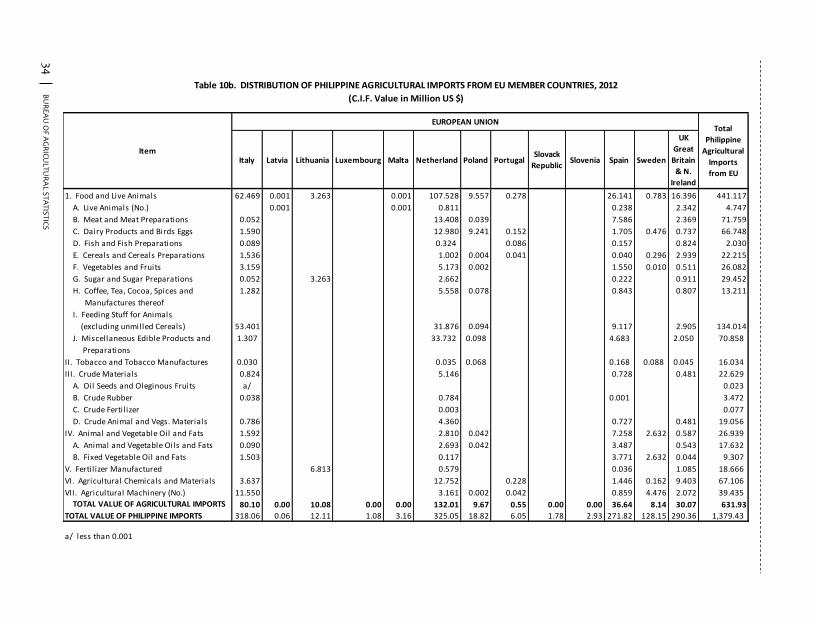
B
UR
EA
U O
F AG
RIC
ULTU
RA
L STA
TIST
ICS
B
UR
EA
U O
F AG
RIC
ULTU
RA
L STA
TISTIC
S
AG
RIC
ULT
UR
AL FO
RE
IGN
TR
AD
E D
EV
ELO
PM
EN
T
20
12
An
nu
al R
ep
ort
LIST OF FIG
UR
ES
Figure N
o.
P
ages
14
V
ALU
E OF C
ENTR
IFUG
AL SU
GA
R EX
PO
RTS,
B
Y QU
AR
TER, 2
01
1-2
01
2 …
……
……
……
.……
……
……
……
……
……
……
……
……
. 1
9
15
V
ALU
E OF W
HEA
T (INC
LUD
ING
SPELT) &
MESLIN
IMP
OR
TS,
BY Q
UA
RTER
, 20
11
-20
12
……
….…
……
……
……
……
……
……
……
……
……
……
.…
25
1
6
VA
LUE O
F SOYA
BEA
N O
IL CA
KE/M
EAL IM
PO
RTS,
B
Y QU
AR
TER, 2
01
1-2
01
2 …
……
……
……
……
……
……
……
……
……
.……
……
……
. 2
5
17
V
ALU
E OF M
ILK &
CR
EAM
AN
D P
RO
DU
CTS IM
PO
RTS
BY Q
UA
RTER
, 20
11
-20
12
……
……
……
……
……
……
……
……
……
.……
……
……
….
25
1
8
VA
LUE O
F RIC
E IMP
OR
TS, BY Q
UA
RTER
, 20
11
-20
12
……
……
……
……
..…..
25
1
9
VA
LUE O
F FERTILIZER
MA
NU
FAC
TUR
ED IM
PO
RTS,
B
Y QU
AR
TER, 2
01
1-2
01
2 …
……
……
……
……
……
……
……
……
……
……
……
……
.. 2
5
20
V
ALU
E OF M
EAT O
F UR
EA IM
PO
RTS,
B
Y QU
AR
TER, 2
01
1-2
01
2 …
……
……
……
……
……
……
……
……
……
……
……
……
.. 2
5
21
V
ALU
E OF C
OFFEE IM
PO
RTS, B
Y QU
AR
TER, 2
01
1-2
01
2 …
……
.……
…..…
. 2
6
22
V
ALU
E OF B
OV
INE A
NIM
ALS IM
PO
RTS,
B
Y QU
AR
TER, 2
01
1-2
01
2 …
……
……
……
……
……
……
……
……
……
……
.……
……
. 2
6
23
V
ALU
E OF TO
BA
CC
O U
NM
AN
UFA
CTU
RED
, BY Q
UA
RTER
,
20
11
-20
12
……
……
……
……
……
……
……
……
……
……
……
……
……
……
……
….…
.….
26
2
4
VA
LUE O
F MA
IZE/CO
RN
, BY Q
UA
RTER
, 20
11
-20
12
……
……
….…
..……
……
2
6
25
W
OR
LD P
RIC
ES OF C
OC
ON
UT O
IL, JAN
UA
RY - D
EC
EMB
ER,
2
01
1-2
01
2 …
……
……
……
……
……
……
……
……
……
……
……
……
……
……
……
……
…
38
2
6
WO
RLD
PR
ICES O
F CO
PR
A, JA
NU
AR
Y- D
ECEM
BER
, 20
11
-20
12
……
……
. 3
8
vii 34
Italy Latvia Lithuania Luxembourg Malta Netherland Poland PortugalSlovack
RepublicSlovenia Spain Sweden
UK
Great
Britain
& N.
Ireland
1. Food and Live Animals 62.469 0.001 3.263 0.001 107.528 9.557 0.278 26.141 0.783 16.396 441.117
A. Live Animals (No.) 0.001 0.001 0.811 0.238 2.342 4.747
B. Meat and Meat Preparations 0.052 13.408 0.039 7.586 2.369 71.759
C. Dairy Products and Birds Eggs 1.590 12.980 9.241 0.152 1.705 0.476 0.737 66.748
D. Fish and Fish Preparations 0.089 0.324 0.086 0.157 0.824 2.030
E. Cereals and Cereals Preparations 1.536 1.002 0.004 0.041 0.040 0.296 2.939 22.215
F. Vegetables and Fruits 3.159 5.173 0.002 1.550 0.010 0.511 26.082
G. Sugar and Sugar Preparations 0.052 3.263 2.662 0.222 0.911 29.452
H. Coffee, Tea, Cocoa, Spices and 1.282 5.558 0.078 0.843 0.807 13.211
Manufactures thereof
I. Feeding Stuff for Animals
(excluding unmilled Cereals)
J. Miscellaneous Edible Products and 1.307 33.732 0.098 4.683 2.050 70.858
Preparations
II. Tobacco and Tobacco Manufactures 0.030 0.035 0.068 0.168 0.088 0.045 16.034
III. Crude Materials 0.824 5.146 0.728 0.481 22.629
A. Oil Seeds and Oleginous Fruits a/ 0.023
B. Crude Rubber 0.038 0.784 0.001 3.472
C. Crude Fertil izer 0.003 0.077
D. Crude Animal and Vegs. Materials 0.786 4.360 0.727 0.481 19.056
IV. Animal and Vegetable Oil and Fats 1.592 2.810 0.042 7.258 2.632 0.587 26.939
A. Animal and Vegetable Oils and Fats 0.090 2.693 0.042 3.487 0.543 17.632
B. Fixed Vegetable Oil and Fats 1.503 0.117 3.771 2.632 0.044 9.307
V. Fertil izer Manufactured 6.813 0.579 0.036 1.085 18.666
VI. Agricultural Chemicals and Materials 3.637 12.752 0.228 1.446 0.162 9.403 67.106
VII. Agricultural Machinery (No.) 11.550 3.161 0.002 0.042 0.859 4.476 2.072 39.435
TOTAL VALUE OF AGRICULTURAL IMPORTS 80.10 0.00 10.08 0.00 0.00 132.01 9.67 0.55 0.00 0.00 36.64 8.14 30.07 631.93
TOTAL VALUE OF PHILIPPINE IMPORTS 318.06 0.06 12.11 1.08 3.16 325.05 18.82 6.05 1.78 2.93 271.82 128.15 290.36 1,379.43
a/ less than 0.001
Table 10b. DISTRIBUTION OF PHILIPPINE AGRICULTURAL IMPORTS FROM EU MEMBER COUNTRIES, 2012
(C.I.F. Value in Million US $)
Total
Philippine
Agricultural
Imports
from EU
EUROPEAN UNION
Item
53.401 31.876 0.094 134.0149.117 2.905
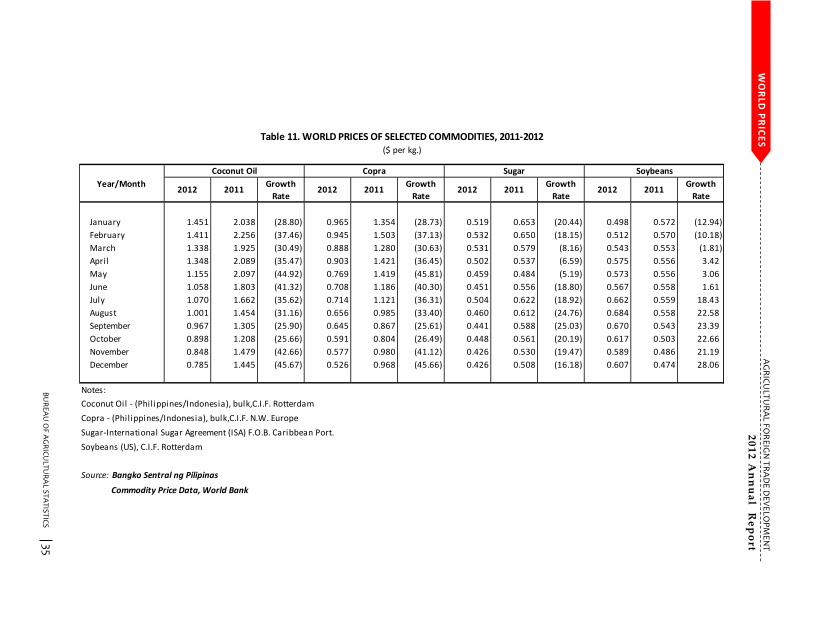
B
UR
EA
U O
F AG
RIC
ULTU
RA
L STA
TIST
ICS
B
UR
EA
U O
F AG
RIC
ULTU
RA
L STA
TISTIC
S
AG
RIC
ULT
UR
AL FO
RE
IGN
TR
AD
E D
EV
ELO
PM
EN
T
20
12
An
nu
al R
ep
ort
LIST O
F FIGU
RES
Figu
re No
.
Pages
1SH
AR
E OF A
GR
ICU
LTUR
AL A
ND
NO
N-A
GR
ICU
LTUR
AL EX
PO
RTS
TO
TOTA
L PH
ILIPP
INE EX
PO
RTS, 2
01
2 …
……
……
……
……
……
……
……
……
….
9
2SH
AR
E OF A
GR
ICU
LTUR
AL A
ND
NO
N-A
GR
ICU
LTUR
AL IM
PO
RTS
TO
TOTA
L PH
ILIPP
INE IM
PO
RTS, 2
01
2 …
……
……
……
……
……
……
……
……
….
9
3
PH
ILIPP
INE A
GR
ICU
LTUR
AL EX
PO
RTS, B
Y QU
AR
TER, 2
01
1-2
01
2 …
…...
10
4
P
HILIP
PIN
E AG
RIC
ULTU
RA
L IMP
OR
TS, BY Q
UA
RTER
, 20
11
-20
12
……
…
10
5
V
ALU
E OF C
OC
ON
UT O
IL EXP
OR
TS, BY Q
UA
RTER
, 20
11
-20
12
……
……
.. 1
8
6
VA
LUE O
F FRESH
BA
NA
NA
EXP
OR
TS, BY Q
UA
RTER
, 20
11
-20
12
….…
…..
18
7
V
ALU
E OF TU
NA
EXP
OR
TS, BY Q
UA
RTER
, 20
11
-20
12
……
……
.……
……
.…
18
8
V
ALU
E OF P
INEA
PP
LE AN
D P
INEA
PP
LE PR
OD
UC
T EXP
OR
TS,
BY Q
UA
RTER
, 20
11
-20
12
……
……
……
……
……
.……
……
……
……
……
……
……
….
18
9
V
ALU
E OF D
ESSICA
TED C
OC
ON
UT EX
PO
RTS,
B
Y QU
AR
TER, 2
01
1-2
01
2 …
……
……
……
……
….…
……
……
……
……
……
……
……
. 1
8
10
V
ALU
E OF SEA
WEED
S AN
D C
AR
AG
EENA
N EX
PO
RTS,
B
Y QU
AR
TER, 2
01
1-2
01
2 …
……
……
……
.……
……
……
……
……
……
……
……
……
. 1
8
11
V
ALU
E OF TO
BA
CC
O M
AN
UFA
CTU
RED
EXP
OR
TS,
BY Q
UA
RTER
, 20
11
-20
12
……
……
……
….…
……
……
……
……
……
……
……
……
….
19
1
2
VA
LUE O
F CO
PR
A O
IL CA
KE EX
PO
RTS,
B
Y QU
AR
TER, 2
01
1-2
01
2 …
……
….…
……
……
……
……
……
……
……
……
……
……
. 1
9
13
V
ALU
E OF FER
TILIZER M
AN
UFA
CTU
RED
EXP
OR
TS,
BY Q
UA
RTER
, 20
11
-20
12
……
……
……
……
……
……
……
……
……
……
……
……
….
19
35 vi
WO
RLD
PR
ICE
S
January 1.451 2.038 (28.80) 0.965 1.354 (28.73) 0.519 0.653 (20.44) 0.498 0.572 (12.94)
February 1.411 2.256 (37.46) 0.945 1.503 (37.13) 0.532 0.650 (18.15) 0.512 0.570 (10.18)
March 1.338 1.925 (30.49) 0.888 1.280 (30.63) 0.531 0.579 (8.16) 0.543 0.553 (1.81)
April 1.348 2.089 (35.47) 0.903 1.421 (36.45) 0.502 0.537 (6.59) 0.575 0.556 3.42
May 1.155 2.097 (44.92) 0.769 1.419 (45.81) 0.459 0.484 (5.19) 0.573 0.556 3.06
June 1.058 1.803 (41.32) 0.708 1.186 (40.30) 0.451 0.556 (18.80) 0.567 0.558 1.61
July 1.070 1.662 (35.62) 0.714 1.121 (36.31) 0.504 0.622 (18.92) 0.662 0.559 18.43
August 1.001 1.454 (31.16) 0.656 0.985 (33.40) 0.460 0.612 (24.76) 0.684 0.558 22.58
September 0.967 1.305 (25.90) 0.645 0.867 (25.61) 0.441 0.588 (25.03) 0.670 0.543 23.39
October 0.898 1.208 (25.66) 0.591 0.804 (26.49) 0.448 0.561 (20.19) 0.617 0.503 22.66
November 0.848 1.479 (42.66) 0.577 0.980 (41.12) 0.426 0.530 (19.47) 0.589 0.486 21.19
December 0.785 1.445 (45.67) 0.526 0.968 (45.66) 0.426 0.508 (16.18) 0.607 0.474 28.06
Notes:
Coconut Oil - (Philippines/Indonesia), bulk,C.I.F. Rotterdam
Copra - (Philippines/Indonesia), bulk,C.I.F. N.W. Europe
Sugar-International Sugar Agreement (ISA) F.O.B. Caribbean Port.
Soybeans (US), C.I.F. Rotterdam
Source: Bangko Sentral ng Pilipinas
Commodity Price Data, World Bank
Table 11. WORLD PRICES OF SELECTED COMMODITIES, 2011-2012($ per kg.)
Year/Month Growth
Rate 2012
Soybeans
Growth
Rate
Growth
Rate 20112012 2011
Growth
Rate
Coconut Oil Copra
20122011 20112012
Sugar
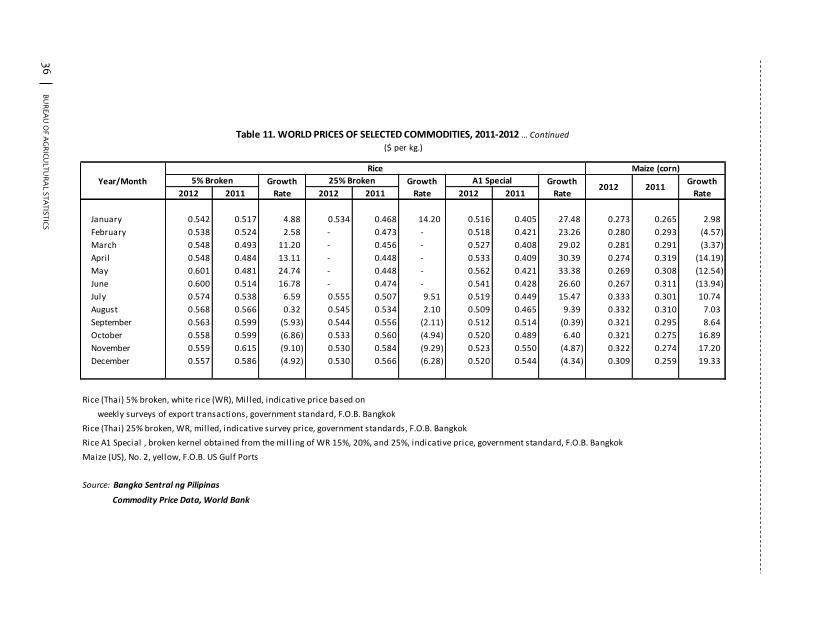
B
UR
EA
U O
F AG
RIC
ULTU
RA
L STA
TIST
ICS
B
UR
EA
U O
F AG
RIC
ULTU
RA
L STA
TISTIC
S
AG
RIC
ULT
UR
AL FO
RE
IGN
TR
AD
E D
EV
ELO
PM
EN
T
20
12
An
nu
al R
ep
ort
LIST OF TA
BLES
Tab
le No
.
Pages
9
DISTR
IBU
TION
OF P
HILIP
PIN
E AG
RIC
ULTU
RA
L EXP
OR
TS
TO A
SEAN
MEM
BER
CO
UN
TRIES, 2
01
2 …
……
……
……
….…
……
……
……
.……
2
7
9a
DISTR
IBU
TION
OF P
HILIP
PIN
E AG
RIC
ULTU
RA
L EXP
OR
TS
TO A
USTR
ALIA
, JAP
AN
, AN
D U
SA, 2
01
2 …
……
……
……
……
……
……
……
……
. 2
8
9b
D
ISTRIB
UTIO
N O
F PH
ILIPP
INE A
GR
ICU
LTUR
AL EX
PO
RTS
TO
EU M
EMB
ER C
OU
NTR
IES, 20
12
……
……
……
……
……
……
……
……
……
……
. 2
9
10
D
ISTRIB
UTIO
N O
F PH
ILIPP
INE A
GR
ICU
LTUR
AL IM
PO
RTS
FR
OM
ASEA
N M
EMB
ER C
OU
NTR
IES, 20
12
……
……
……
……
……
……
……
…..
31
1
0a
DISTR
IBU
TION
OF P
HILIP
PIN
E AG
RIC
ULTU
RA
L IMP
OR
TS
FRO
M A
USTR
ALIA
, JAP
AN
, AN
D U
SA, 2
01
2 …
……
……
……
……
……
……
……
. 3
2
10
b
DISTR
IBU
TION
OF P
HILIP
PIN
E AG
RIC
ULTU
RA
L IMP
OR
TS
FRO
M EU
MEM
BER
CO
UN
TRIES, 2
01
2 …
……
……
……
……
……
……
……
……
…
33
1
1
WO
RLD
PR
ICES O
F SELECTED
CO
MM
OD
ITIES
JAN
UA
RY-D
ECEM
BER
, 20
11
-20
12
……
……
……
……
……
……
……
……
……
……
.. 3
5
v 36
2012 2011 2012 2011 2012 2011
January 0.542 0.517 4.88 0.534 0.468 14.20 0.516 0.405 27.48 0.273 0.265 2.98
February 0.538 0.524 2.58 - 0.473 - 0.518 0.421 23.26 0.280 0.293 (4.57)
March 0.548 0.493 11.20 - 0.456 - 0.527 0.408 29.02 0.281 0.291 (3.37)
April 0.548 0.484 13.11 - 0.448 - 0.533 0.409 30.39 0.274 0.319 (14.19)
May 0.601 0.481 24.74 - 0.448 - 0.562 0.421 33.38 0.269 0.308 (12.54)
June 0.600 0.514 16.78 - 0.474 - 0.541 0.428 26.60 0.267 0.311 (13.94)
July 0.574 0.538 6.59 0.555 0.507 9.51 0.519 0.449 15.47 0.333 0.301 10.74
August 0.568 0.566 0.32 0.545 0.534 2.10 0.509 0.465 9.39 0.332 0.310 7.03
September 0.563 0.599 (5.93) 0.544 0.556 (2.11) 0.512 0.514 (0.39) 0.321 0.295 8.64
October 0.558 0.599 (6.86) 0.533 0.560 (4.94) 0.520 0.489 6.40 0.321 0.275 16.89
November 0.559 0.615 (9.10) 0.530 0.584 (9.29) 0.523 0.550 (4.87) 0.322 0.274 17.20
December 0.557 0.586 (4.92) 0.530 0.566 (6.28) 0.520 0.544 (4.34) 0.309 0.259 19.33
Rice (Thai) 5% broken, white rice (WR), Milled, indicative price based on
weekly surveys of export transactions, government standard, F.O.B. Bangkok
Rice (Thai) 25% broken, WR, milled, indicative survey price, government standards, F.O.B. Bangkok
Rice A1 Special , broken kernel obtained from the mill ing of WR 15%, 20%, and 25%, indicative price, government standard, F.O.B. Bangkok
Maize (US), No. 2, yellow, F.O.B. US Gulf Ports
Source: Bangko Sentral ng Pilipinas
Commodity Price Data, World Bank
Growth
Rate
Maize (corn)
20115% Broken
201225% Broken
Table 11. WORLD PRICES OF SELECTED COMMODITIES, 2011-2012 … Continued
($ per kg.)
Rice
Growth
Rate
Year/Month A1 SpecialGrowth
Rate
Growth
Rate
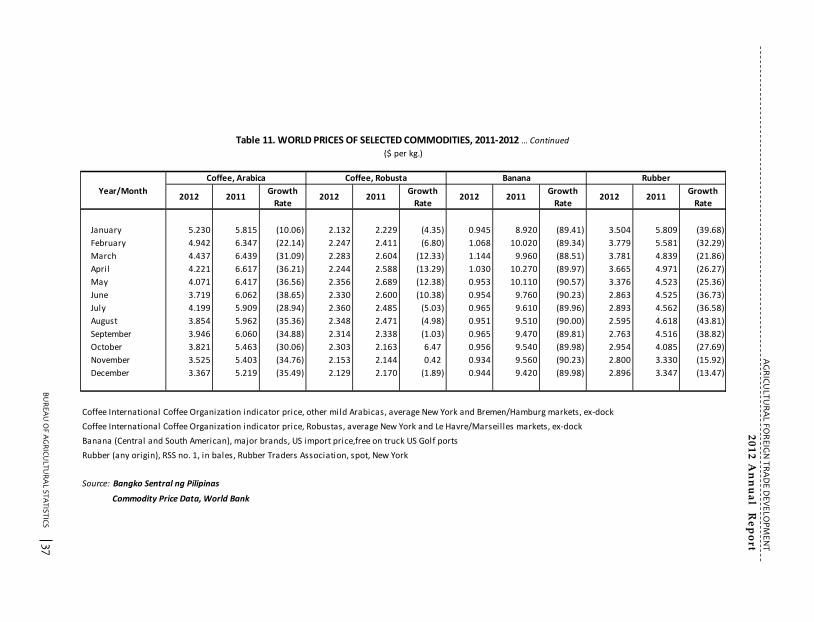
B
UR
EA
U O
F AG
RIC
ULTU
RA
L STA
TIST
ICS
B
UR
EA
U O
F AG
RIC
ULTU
RA
L STA
TISTIC
S
AG
RIC
ULT
UR
AL FO
RE
IGN
TR
AD
E D
EV
ELO
PM
EN
T
20
12
An
nu
al R
ep
ort
LIST O
F TAB
LES
Table N
o.
P
ages
1
SUM
MA
RY O
F PH
ILIPP
INE A
GR
ICU
LTUR
AL TR
AD
E, 20
10
-20
12
….…
……
9
1
a P
HILIP
PIN
E AG
RIC
ULTU
RA
L TRA
DE, B
Y QU
AR
TER, 2
01
1-2
01
2 …
……
…..
10
2
A
GR
ICU
LTUR
AL TR
AD
E BA
LAN
CES W
ITH M
AJO
R TR
AD
ING
PA
RTN
ERS
O
F THE P
HILIP
PIN
ES, 20
11
-20
12
……
……
……
……
……
……
……
……
……
……
….
11
3
Q
UA
NTITY A
ND
VA
LUE O
F PH
ILIPP
INE A
GR
ICU
LTUR
AL EX
PO
RTS
B
Y CO
MM
OD
ITY GR
OU
P, 2
01
1-2
01
2 …
……
……
……
.……
……
……
……
……
…..
12
4
TO
P TEN
PH
ILIPP
INE A
GR
ICU
LTUR
AL EX
PO
RTS, 2
01
1-2
01
2 …
……
……
….
14
4
a V
ALU
E OF TO
P TEN
AG
RIC
ULTU
RA
L EXP
OR
TS,
BY Q
UA
RTER
, 20
11
-20
12
……
……
….…
……
……
……
……
……
……
……
……
……
….
15
5
M
AJO
R M
AR
KE
TS OF TO
P TEN
PH
ILIPP
INE
AG
RIC
ULTU
RA
L
EXP
OR
TS, 20
12
……
……
……
……
……
……
……
……
……
……
……
……
……
……
……
….
16
6
Q
UA
NTITY A
ND
VA
LUE O
F PH
ILIPP
INE A
GR
ICU
LTUR
AL IM
PO
RTS
B
Y CO
MM
OD
ITY GR
OU
P, 2
01
1-2
01
2 …
……
……
……
……
……
……
……
……
……
2
0
7
TOP
TEN A
GR
ICU
LTUR
AL IM
PO
RTS, 2
01
1-2
01
2 …
……
……
……
……
……
……
2
1
7a
VA
LUE O
F TOP
TEN A
GR
ICU
LTUR
AL IM
PO
RTS,
B
Y QU
AR
TER, 2
01
1-2
01
2 …
……
……
……
……
……
……
……
……
……
……
……
……
.. 2
2
8
MA
JOR
SUP
PLIER
S OF TO
P TE
N P
HILIP
PIN
E AG
RIC
ULTU
RA
L
IMP
OR
TS, 20
12
……
……
……
……
……
……
……
……
……
……
……
……
……
……
……
…
23
37 iv
January 5.230 5.815 (10.06) 2.132 2.229 (4.35) 0.945 8.920 (89.41) 3.504 5.809 (39.68)
February 4.942 6.347 (22.14) 2.247 2.411 (6.80) 1.068 10.020 (89.34) 3.779 5.581 (32.29)
March 4.437 6.439 (31.09) 2.283 2.604 (12.33) 1.144 9.960 (88.51) 3.781 4.839 (21.86)
April 4.221 6.617 (36.21) 2.244 2.588 (13.29) 1.030 10.270 (89.97) 3.665 4.971 (26.27)
May 4.071 6.417 (36.56) 2.356 2.689 (12.38) 0.953 10.110 (90.57) 3.376 4.523 (25.36)
June 3.719 6.062 (38.65) 2.330 2.600 (10.38) 0.954 9.760 (90.23) 2.863 4.525 (36.73)
July 4.199 5.909 (28.94) 2.360 2.485 (5.03) 0.965 9.610 (89.96) 2.893 4.562 (36.58)
August 3.854 5.962 (35.36) 2.348 2.471 (4.98) 0.951 9.510 (90.00) 2.595 4.618 (43.81)
September 3.946 6.060 (34.88) 2.314 2.338 (1.03) 0.965 9.470 (89.81) 2.763 4.516 (38.82)
October 3.821 5.463 (30.06) 2.303 2.163 6.47 0.956 9.540 (89.98) 2.954 4.085 (27.69)
November 3.525 5.403 (34.76) 2.153 2.144 0.42 0.934 9.560 (90.23) 2.800 3.330 (15.92)
December 3.367 5.219 (35.49) 2.129 2.170 (1.89) 0.944 9.420 (89.98) 2.896 3.347 (13.47)
Coffee International Coffee Organization indicator price, other mild Arabicas, average New York and Bremen/Hamburg markets, ex-dock
Coffee International Coffee Organization indicator price, Robustas, average New York and Le Havre/Marseilles markets, ex-dock
Banana (Central and South American), major brands, US import price,free on truck US Golf ports
Rubber (any origin), RSS no. 1, in bales, Rubber Traders Association, spot, New York
Source: Bangko Sentral ng Pilipinas
Commodity Price Data, World Bank
Table 11. WORLD PRICES OF SELECTED COMMODITIES, 2011-2012 … Continued
($ per kg.)
Growth
Rate
Year/Month Growth
Rate
Growth
Rate
Growth
Rate 2012 2011 2012 20112012 2011 2012 2011
Coffee, Arabica Coffee, Robusta Banana Rubber
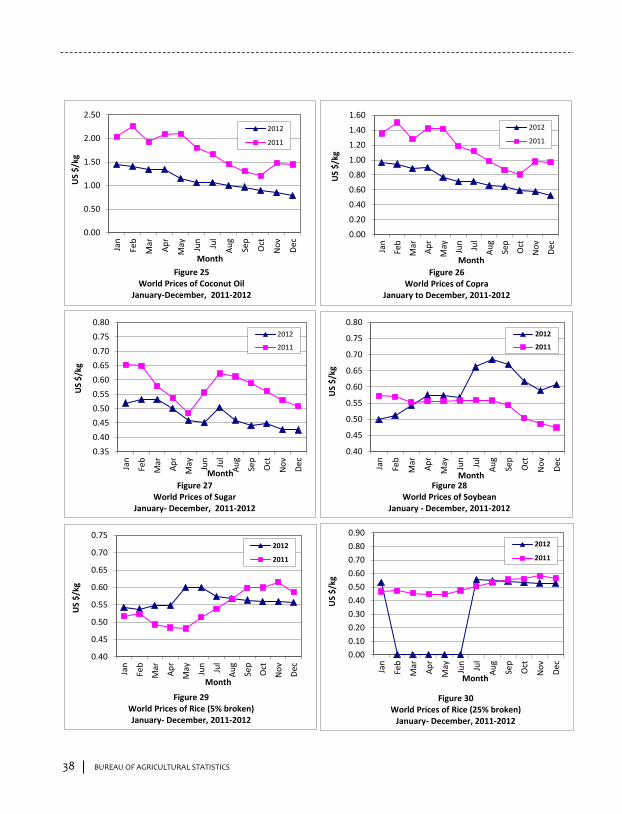
BUREAU OF AGRICULTURAL STATISTICS BUREAU OF AGRICULTURAL STATISTICS
AGRICULTURAL FOREIGN TRADE DEVELOPMENT
2012 Annual Report
TABLE OF CONTENTS
Pages
FOREWORD ……………………………………………………………………………………………………. i TABLE OF CONTENTS ……………………………………………………………………………………… iii LIST OF TABLES ………………………………………………………………………………………………. iv LIST OF FIGURES …………………………………………………………………………………………….. vi HIGHLIGHTS ……………………………………………………………………………………………………. 1 OVERALL AGRICULTURAL TRADE …………………………………………………………….. 1 TOP AGRICULTURAL EXPORTS …………………………………………………………………. 2 TOP AGRICULTURAL IMPORTS …………………………………………………………………. 3 WORLD PRICES TRENDS …………………………………………………………………………… 4 STATISTICAL TABLES AND GRAPHS ………………………………………………………………….. 7
iii 38
0.00
0.50
1.00
1.50
2.00
2.50Ja
n
Feb
Mar
Ap
r
May Jun
Jul
Au
g
Sep
Oct
No
v
Dec
US
$/k
g
Month
Figure 25 World Prices of Coconut Oil
January-December, 2011-2012
2012
2011
0.40
0.45
0.50
0.55
0.60
0.65
0.70
0.75
Jan
Feb
Mar
Ap
r
May Jun
Jul
Au
g
Sep
Oct
No
v
Dec
US
$/k
g
Month
Figure 29World Prices of Rice (5% broken) January- December, 2011-2012
2012
2011
0.00
0.20
0.40
0.60
0.80
1.00
1.20
1.40
1.60
Jan
Feb
Mar
Ap
r
May Jun
Jul
Au
g
Sep
Oct
No
v
Dec
US
$/k
g
Month
Figure 26 World Prices of Copra
January to December, 2011-2012
2012
2011
0.35
0.40
0.45
0.50
0.55
0.60
0.65
0.70
0.75
0.80
Jan
Feb
Mar
Ap
r
May Jun
Jul
Au
g
Sep
Oct
No
v
Dec
US
$/k
g
Month
Figure 27 World Prices of Sugar
January- December, 2011-2012
2012
2011
0.00
0.10
0.20
0.30
0.40
0.50
0.60
0.70
0.80
0.90
Jan
Feb
Mar
Ap
r
May Jun
Jul
Au
g
Sep
Oct
No
v
Dec
US
$/k
g
Month
Figure 30World Prices of Rice (25% broken)
January- December, 2011-2012
2012
2011
0.40
0.45
0.50
0.55
0.60
0.65
0.70
0.75
0.80
Jan
Feb
Mar
Ap
r
May Jun
Jul
Au
g
Sep
Oct
No
v
Dec
US
$/k
g
MonthFigure 28
World Prices of SoybeanJanuary - December, 2011-2012
2012
2011
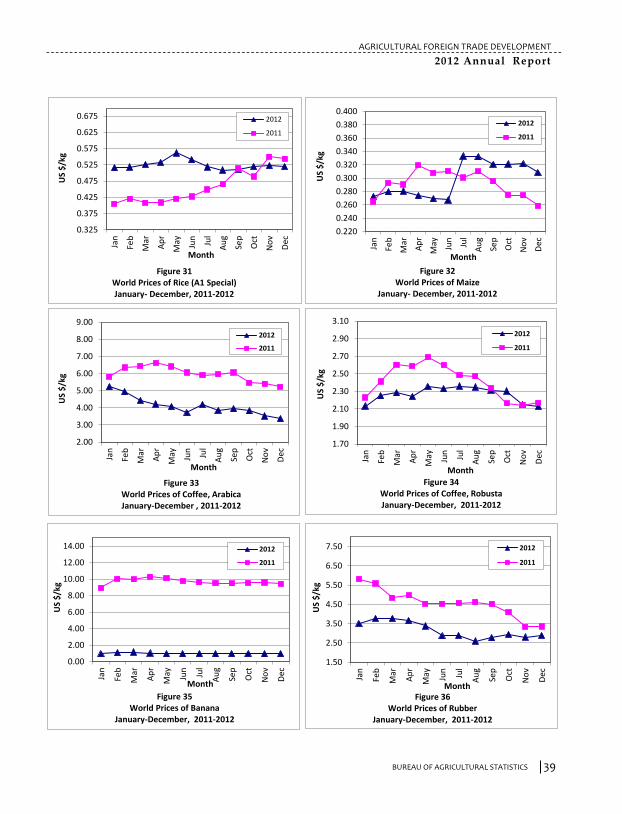
BUREAU OF AGRICULTURAL STATISTICS BUREAU OF AGRICULTURAL STATISTICS
AGRICULTURAL FOREIGN TRADE DEVELOPMENT
2012 Annual Report
39 40
0.220
0.240
0.260
0.280
0.300
0.320
0.340
0.360
0.380
0.400
Jan
Feb
Mar
Ap
r
May Jun
Jul
Au
g
Sep
Oct
No
v
Dec
US
$/k
g
Month
Figure 32 World Prices of Maize
January- December, 2011-2012
2012
2011
0.325
0.375
0.425
0.475
0.525
0.575
0.625
0.675Ja
n
Feb
Mar
Ap
r
May Jun
Jul
Au
g
Sep
Oct
No
v
Dec
US
$/k
g
Month
Figure 31World Prices of Rice (A1 Special) January- December, 2011-2012
2012
2011
2.00
3.00
4.00
5.00
6.00
7.00
8.00
9.00
Jan
Feb
Mar
Ap
r
May Jun
Jul
Au
g
Sep
Oct
No
v
Dec
US
$/k
g
Month
Figure 33World Prices of Coffee, ArabicaJanuary-December , 2011-2012
2012
2011
1.70
1.90
2.10
2.30
2.50
2.70
2.90
3.10
Jan
Feb
Mar
Ap
r
May Jun
Jul
Au
g
Sep
Oct
No
v
Dec
US
$/k
g
Month
Figure 34World Prices of Coffee, RobustaJanuary-December, 2011-2012
2012
2011
0.00
2.00
4.00
6.00
8.00
10.00
12.00
14.00
Jan
Feb
Mar
Ap
r
May Jun
Jul
Au
g
Sep
Oct
No
v
Dec
US
$/k
g
Month
Figure 35World Prices of Banana
January-December, 2011-2012
2012
2011
1.50
2.50
3.50
4.50
5.50
6.50
7.50
Jan
Feb
Mar
Ap
r
May Jun
Jul
Au
g
Sep
Oct
No
v
Dec
US
$/k
g
MonthFigure 36
World Prices of RubberJanuary-December, 2011-2012
2012
2011

BUREAU OF AGRICULTURAL STATISTICS BUREAU OF AGRICULTURAL STATISTICS
AGRICULTURAL FOREIGN TRADE DEVELOPMENT
2012 Annual Report
Department of Agriculture
BUREAU OF AGRICULTURAL STATISTICS 1184 Ben-Lor Bldg., Quezon Avenue, Quezon City
Tel. No.: +63(2) 372-3820 Fax. No.: +63(2) 371-2048
URL: http://bas.gov.ph
Republic of the Philippines
Department of Agriculture
BUREAU OF AGRICULTURAL STATISTICS
ISSN-2012-0370