Embed Size (px)
Citation preview

The INL is a U.S. Department of Energy National Laboratory operated by Battelle Energy Alliance.
Document ID: PLN-3867Revision ID: 0
Effective Date: 10/05/2011
Project No. 23841
AGR-3/4 Irradiation Experiment Test Plan

10/05/2011
598040
ixtka 10/5/11
Form 412.09 (Rev. 10)
Idaho National Laboratory
AGR-3/4 Irradiation Experiment Test Plan
Identifier: Revision: Effective Date:
PLN-3867 0
10/05/2011 Page: ii of ix
ii
REVISION LOG
Rev. Date Affected Pages Revision Description
0 10/05/2011 All Initial issue of the AGR-3/4 Irradiation Experiment Test Plan
Form 412.09 (Rev. 10)
Idaho National Laboratory
AGR-3/4 Irradiation Experiment Test Plan
Identifier: Revision: Effective Date:
PLN-3867 0
10/05/2011 Page: iii of ix
iii
SUMMARY
This document presents the current state of planning for the AGR-3/4 irradiation experiment, the combined third and fourth of eight planned irradiations for the Advanced Gas Reactor (AGR) Fuel Development and Qualification Program. Funding for this program is provided by the U.S. Department of Energy (DOE) as part of the Next-Generation Nuclear Plant (NGNP) Project. The objectives of the AGR-3/4 experiment are:
1. Irradiate fuel containing UCO designed-to-fail (DTF) fuel particles that will provide a known source of fission products for subsequent transport through compact matrix and structural graphite materials.
2. Assess the effects of sweep gas impurities, such as CO, H2O, and H2 typically found in the primary circuit of high temperature gas-cooled reactors, on fuel performance and subsequent fission product transport.
3. Provide irradiated fuel and material samples for post-irradiation examination (PIE) and safety
testing.
4. Support the refinement of fuel performance and fission product transport models with on-line, PIE and safety test data.
In order to achieve the test objectives, the AGR-3/4 experiment will be irradiated in the northeast flux trap (NEFT) position of the Advanced Test Reactor (ATR) at the Idaho National Laboratory (INL). The larger diameter of the NEFT location provides greater flexibility for test train design, significantly enhancing the capability for the combined irradiations. The test train contains twelve separate and independently controlled and monitored capsules. Each capsule contains four half an inch long compacts filled with both UCO unaltered “driver” fuel particles and UCO DTF fuel particles. The DTF fraction is specified to be 1 × 10⁻².
The irradiation is planned for 400 effective full power days (approximately two calendar years) with a peak fuel temperature ranging between 900°C and 1300°C depending on the specific capsule. Average fuel burnup, for the entire test, will be greater than 5% and lower than 19% FIMA. The fuel will experience fast neutron fluences between approximately 0.9 and 5.5 × 1025 n/m2 (E>0.18 MeV).

Form 412.09 (Rev. 10)
Idaho National Laboratory
AGR-3/4 Irradiation Experiment Test Plan
Identifier: Revision: Effective Date:
PLN-3867
0
10/05/2011 Page: iv of ix
iv
CONTENTS
SUMMARY ................................................................................................................................................. iii
ACRONYMS ............................................................................................................................................. viii
1. Introduction ........................................................................................................................................ 1
2. BACKGROUND ................................................................................................................................ 2
2.1 Test Objectives ......................................................................................................................... 2
2.2 Experiment Approach .............................................................................................................. 2
3. EXPERIMENT DESCRIPTION ........................................................................................................ 5
3.1 Fuel Particles ............................................................................................................................ 5
3.2 Fuel Compacts .......................................................................................................................... 8
3.3 Compact Matrix Ring Blanks, Graphite Rings and Sinks ...................................................... 12
3.4 Test Train ............................................................................................................................... 13
3.5 Fission Product Monitoring System ....................................................................................... 23
4. TEST CONDITION REQUIREMENTS .......................................................................................... 25
4.1 Particle Power ........................................................................................................................ 25
4.2 Temperature ........................................................................................................................... 26
4.3 Fuel Burnup............................................................................................................................ 30
4.4 Fast Neutron Fluence ............................................................................................................. 31
4.5 Irradiation Duration ................................................................................................................ 33
5. FISSION PRODUCT TRANSPORT ANALYSIS .......................................................................... 35
5.1 Model Description .................................................................................................................. 35
5.2 Physical Models ..................................................................................................................... 36
5.3 Concentration Profiles ............................................................................................................ 40
5.4 Model Improvements ............................................................................................................. 41
5.5 Analytical Estimation ............................................................................................................. 44
6. MEASUREMENT REQUIREMENTS ............................................................................................ 48
6.1 Neutron Dosimetry ................................................................................................................. 48
6.2 ATR Parameters ..................................................................................................................... 48
6.3 Temperature Measurements ................................................................................................... 48
6.4 Sweep Gas Parameters ........................................................................................................... 49
6.5 Fission Gas Release Monitoring ............................................................................................ 49
6.6 Data Validation and Qualification ......................................................................................... 49
7. OPERATIONAL REQUIREMENTS .............................................................................................. 51
7.1 Pre-irradiation ........................................................................................................................ 51
Form 412.09 (Rev. 10)
Idaho National Laboratory
AGR-3/4 Irradiation Experiment Test Plan
Identifier: Revision: Effective Date:
PLN-3867
0
10/05/2011 Page: v of ix
v
7.2 Irradiation ............................................................................................................................... 51
7.3 Post-irradiation ....................................................................................................................... 52
7.4 Safety ..................................................................................................................................... 53
7.5 Quality Assurance .................................................................................................................. 53
8. PROGRAM CONSTRAINTS AND SCHEDULE .......................................................................... 55
9. REFERENCES ................................................................................................................................. 56
Form 412.09 (Rev. 10)
Idaho National Laboratory
AGR-3/4 Irradiation Experiment Test Plan
Identifier: Revision: Effective Date:
PLN-3867
0
10/05/2011 Page: vi of ix
vi
FIGURES Figure 2-1. ATR core cross section displaying the NEFT position. ............................................................ 3
Figure 3-1. Schematic of a typical TRISO-coated fuel particle. .................................................................. 5
Figure 3-2. Schematic of an AGR-3/4 compact with DTF fuel particles placed along the axis. ................. 9
Figure 3-3. Axial schematic of the AGR-3/4 capsules. ............................................................................. 15
Figure 3-4. Radial schematic of an AGR-3/4 capsule. ............................................................................... 16
Figure 3-5. Simplified flow path for AGR-3/4 sweep gas. ........................................................................ 20
Figure 3-6. Radial schematic of the AGR-3/4 irradiation housing. ........................................................... 22
Figure 3-7. Illustration of the effect of reactor power on fuel compact power. ......................................... 23
Figure 3-8. Gross radiation monitor and spectrometer detector for one AGR-3/4 sweep gas line. ........... 24
Figure 4-1. Average particle power for the maximum compact (Capsule 6 – Level 4) and minimum compact (Capsule 12 – Level 4). ................................................................................ 26
Figure 4-2. Temperature radial distribution in Capsule 8 at BOL (top) and EOL (bottom). ..................... 29
Figure 4-3. Capsule average burnups for AGR-3/4. .................................................................................. 30
Figure 4-4. Compact average burnup for the maximum compact (Capsule 6 – Level 4) and minimum compact (Capsule 12 – Level 4). ................................................................................ 31
Figure 4-5. Capsule average fast neutron fluences for AGR-3/4. .............................................................. 32
Figure 4-6. Compact average fast neutron fluence for the maximum compact (Capsule 6 – Level 2) and minimum compact (Capsule 12 – Level 4). ..................................................................... 32
Figure 5-1. AGR-3/4 drawing (left) and Fluent representation (right). The five regions of the Fluent model are (from the center out) (1) DTF (red); (2) Fuel compact (yellow); (3) Matrix (green); (4) Graphite (light blue); (5) Sink (dark blue). .................................................. 35
Figure 5-2. Temperature profiles solved by Fluent for the above boundary conditions. ........................... 37
Figure 5-3. Cesium sorption isotherms at AGR-3/4 conditions. ................................................................ 39
Figure 5-4. Ag-110m concentration profiles at 300 EFPD. ....................................................................... 40
Figure 5-5. Cs-137 concentration profiles at 300 EFPD. ........................................................................... 40
Figure 5-6. Sr-90 concentration profiles at 300 EFPD. ............................................................................. 41
Figure 5-7. Ag-110m inventory through 400 EFPD. ................................................................................. 42
Figure 5-8. Cs-137 inventory through 400 EFPD. ..................................................................................... 43
Figure 5-9. Sr-90 inventory through 400 EFPD. ....................................................................................... 43
Figure 5-10. Ag-110m concentration profiles as a function of time (1100ºC nominal temperature). ............................................................................................................................... 44
Figure 5-11. Cs-137 concentration profiles as a function of time (1100ºC nominal temperature). ............ 45
Figure 5-12. Sr-90 concentration profiles as a function of time (1100ºC nominal temperature). .............. 45
Figure 5-13. Cs-137 concentration profiles in the graphite ring. ............................................................... 46
Form 412.09 (Rev. 10)
Idaho National Laboratory
AGR-3/4 Irradiation Experiment Test Plan
Identifier: Revision: Effective Date:
PLN-3867
0
10/05/2011 Page: vii of ix
vii
Figure 5-14. Analytical solution for transient diffusion in the graphite ring of AGR-3/4 ( D = 1.43 x 10⁻¹³ m2/s) ........................................................................................................................ 47
TABLES Table 3-1. Primary functions of particle fuel components. .......................................................................... 5
Table 3-2. Selected properties for kernel Lot G73V-20-69303. .................................................................. 6
Table 3-3. Selected properties for AGR-3/4 coated particle composites (Driver Fuel). .............................. 7
Table 3-3 (cont’d). Selected properties for AGR-3/4 coated particle composites (DTF). ........................... 8
Table 3-4. Selected properties for AGR-3/4 compacts. ............................................................................. 10
Table 3-5. AGR-3/4 compacts sent to INL. ............................................................................................... 11
Table 3-6. Selected properties for AGR-3/4 ring blanks and graphite rings and sinks. ............................. 13
Table 3-7. AGR-3/4 thermocouple assignments ........................................................................................ 17
Table 3-8. Characteristics of AGR-3/4 melt wires..................................................................................... 18
Table 3-9. Characteristics of AGR-3/4 flux wires. .................................................................................... 19
Table 4-1. AGR-3/4 temperature matrix. ................................................................................................... 28
Table 4-2. Summary of AGR-3/4 irradiation conditions. .......................................................................... 34
Table 5-1. Diffusion coefficient Arrhenius parameters. ............................................................................ 36
Table 5-2. Temperature boundary conditions. ........................................................................................... 37
Table 5-3. Sorption isotherm constants. ..................................................................................................... 38
Table 7-1. AGR-3/4 safety requirements. .................................................................................................. 53
Form 412.09 (Rev. 10)
Idaho National Laboratory
AGR-3/4 Irradiation Experiment Test Plan
Identifier: Revision: Effective Date:
PLN-3867
0
10/05/2011 Page: viii of ix
viii
ACRONYMS
AGR Advanced Gas Reactor
AGR-1 first irradiation test of the AGR program
AGR-2 second irradiation test of the AGR program
AGR-3/4 combined third and fourth irradiation tests of the AGR program
AGR-5/6 combined fifth and sixth irradiation tests of the AGR program
ATR Advanced Test Reactor
AWS American Welding Society
BAF bacon anisotropy factor
BOL beginning of life
BWXT BWX Technologies
CFD computational fluid dynamics
DOE Department of Energy (U.S.)
DTF designed-to-fail
EFPD effective full power days
EOL end of life
FIMA fissions per initial heavy metal atom
FP fission product
FPMS fission product monitoring system
HPGe hyper pure germanium
HTGR high temperature gas-cooled reactor
INL Idaho National Laboratory
IPyC inner pyrolytic carbon
LEU low enriched uranium
NDMAS NGNP Data Management and Analysis System
NEFT northeast flux trap
NGNP Next Generation Nuclear Plant
OPyC outer pyrolytic carbon
ORNL Oak Ridge National Laboratory
PALM powered axial locator mechanism
PIE post-irradiation examination
R/B release rate to birth rate ratio
RMS root mean square
Form 412.09 (Rev. 10)
Idaho National Laboratory
AGR-3/4 Irradiation Experiment Test Plan
Identifier: Revision: Effective Date:
PLN-3867
0
10/05/2011 Page: ix of ix
ix
SiC silicon carbide
TC thermocouple
TRISO tristructural-isotropic
UCO uranium oxycarbide
VHTR very high temperature gas-cooled reactor
Form 412.09 (Rev. 10)
Idaho National Laboratory
AGR-3/4 Irradiation Experiment Test Plan
Identifier: Revision: Effective Date:
PLN-3867
0
10/05/2011 Page: 1 of 57
1. Introduction
Several fuel irradiation experiments are planned for the Advanced Gas Reactor (AGR) Fuel Development and Qualification Program which supports the development of the Very-High-Temperature gas-cooled Reactor (VHTR) under the Next-Generation Nuclear Plant (NGNP) project. The goals of these experiments (Simonds 2010) are to provide irradiation performance data to support fuel process development, qualify fuel for normal operating conditions, support development and validation of fuel performance and fission product transport models and codes, and provide irradiated fuel and materials for post-irradiation examination (PIE) and safety testing. AGR-3/4 combines the third and fourth in this series of planned experiments to test tristructural-isotropic (TRISO)-coated, low enriched uranium (LEU) oxycarbide fuel. This combined experiment is intended to support the refinement of fission product transport models and to assess the effects of sweep gas impurities on fuel performance and fission product transport by irradiating DTF fuel particles and by measuring subsequent fission metal transport in fuel-compact matrix material and fuel-element graphite.
This document presents the conceptual planning to implement requirements from the Technical Program Plan (Simonds 2010) and the Irradiation Test Specification (Maki 2011) for the AGR-3/4 experiment. Following this introduction, the test objectives and experimental approach are outlined in Section 2; descriptions of the test articles, test train, and fission product monitoring system are presented in Section 3; anticipated irradiation conditions, including temperature, burnup, and fast neutron fluence are presented in Section 4; fission product transport analysis is presented in Section 5; measurements associated with test conduct are described in Section 6; significant operational procedures that apply to AGR-3/4 are briefly described in Section 7; safety and quality assurance issues are outlined in Section 8; program constraints and test schedule are listed in Section 9; and references are presented in Section 10. Requirements and planning associated with PIE and safety testing of the AGR-3/4 test articles will be presented elsewhere.
Form 412.09 (Rev. 10)
Idaho National Laboratory
AGR-3/4 Irradiation Experiment Test Plan
Identifier: Revision: Effective Date:
PLN-3867
0
10/05/2011 Page: 2 of 57
2. BACKGROUND
2.1 Test Objectives
As defined in the AGR Technical Program Plan (Simonds 2010), the objectives of the AGR-3/4 experiment are to:
1. Irradiate fuel containing uranium oxycarbide (UCO) DTF fuel particles that will provide a known source of fission products for subsequent transport through compact matrix and structural graphite materials.
2. Assess the effects of sweep gas impurities, such as CO, H2O, and H2 typically found in the primary circuit of high temperature gas-cooled reactors (HTGR), on fuel performance and subsequent fission product transport.
3. Provide irradiated fuel and material samples for post-irradiation examination (PIE) and safety
testing.
4. Support the refinement of fuel performance and fission product transport models with on-line, PIE and safety test data.
The primary objective of the test is directed towards providing data on fission product transport from particles with failed coatings using driver-coated fuel particles in combination with DTF particles. From the irradiation, data on fission product diffusivities in fuel kernels and sorptivities and diffusivities in compact matrix and graphite materials will be derived for use in upgrading fission product transport models.
AGR-3/4 will also provide irradiated fuel performance data on fission product gas release from failed particles and irradiated fuel samples for safety testing and PIE. The in-pile gas release, PIE, and safety testing data on fission gas and metal release from kernels will be used in the development of improved fission product transport models.
2.2 Experiment Approach
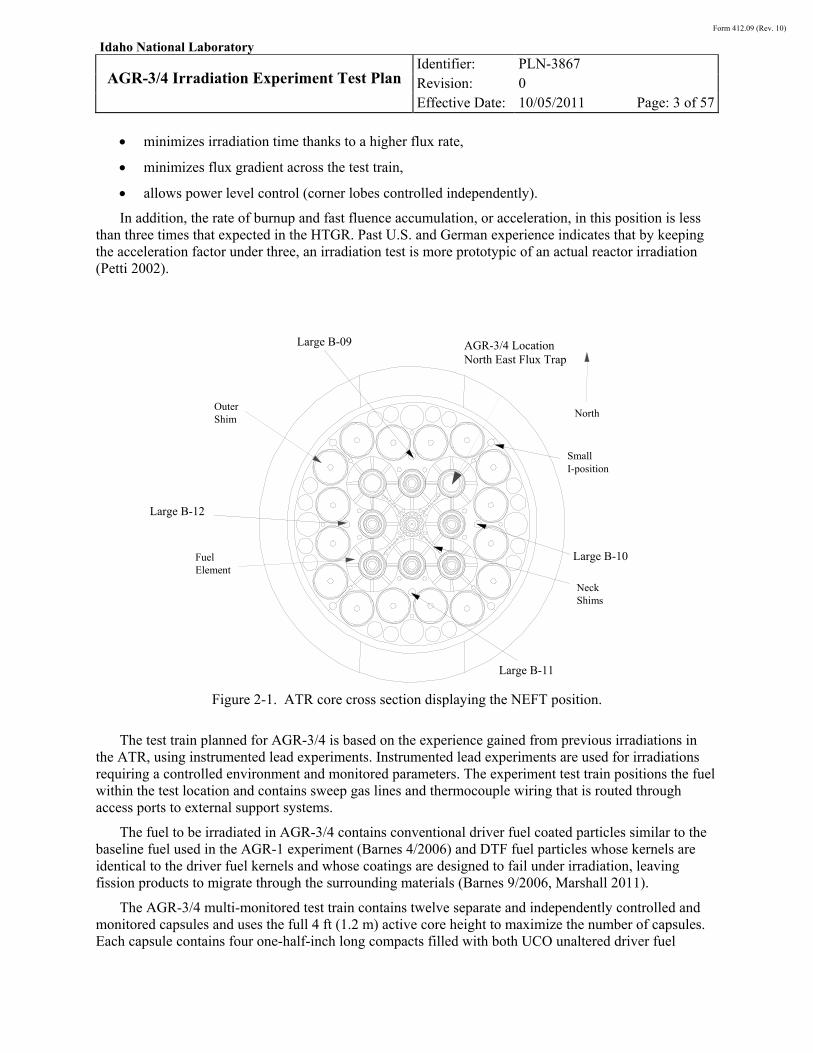
To achieve the test objectives outlined above, AGR-3/4 will be irradiated in the northeast flux trap (NEFT) position of the Advanced Test Reactor (ATR) at Idaho National Laboratory (INL). A core cross section indicating this location is displayed in Figure 2-1. Preliminary physics calculations (Chang and Parry 2011) have shown that the best ATR position to achieve significant end-of-irradiation conditions (peak compact burnup exceeding 16% fissions per initial heavy metal atom [FIMA] and maximum fast neutron fluence of about 5.5 × 1025 n/m2, E>0.18 MeV) after 400 effective full-power days (EFPDs), for a test train of sufficient size to accommodate test fuel and test articles, is obtained from irradiation in the NEFT. Contrary to the Large B positions used for AGR-1 and AGR-2, its larger diameter also provides greater flexibility for test train design, significantly enhancing the capability for the combined irradiations. Specifically, the AGR-3/4 irradiation in the NEFT position:
maximizes space for different fission product retention materials,
Form 412.09 (Rev. 10)
Idaho National Laboratory
AGR-3/4 Irradiation Experiment Test Plan
Identifier: Revision: Effective Date:
PLN-3867
0
10/05/2011 Page: 3 of 57
minimizes irradiation time thanks to a higher flux rate,
minimizes flux gradient across the test train,
allows power level control (corner lobes controlled independently).
In addition, the rate of burnup and fast fluence accumulation, or acceleration, in this position is less than three times that expected in the HTGR. Past U.S. and German experience indicates that by keeping the acceleration factor under three, an irradiation test is more prototypic of an actual reactor irradiation (Petti 2002).
Figure 2-1. ATR core cross section displaying the NEFT position.
The test train planned for AGR-3/4 is based on the experience gained from previous irradiations in the ATR, using instrumented lead experiments. Instrumented lead experiments are used for irradiations requiring a controlled environment and monitored parameters. The experiment test train positions the fuel within the test location and contains sweep gas lines and thermocouple wiring that is routed through access ports to external support systems.
The fuel to be irradiated in AGR-3/4 contains conventional driver fuel coated particles similar to the baseline fuel used in the AGR-1 experiment (Barnes 4/2006) and DTF fuel particles whose kernels are identical to the driver fuel kernels and whose coatings are designed to fail under irradiation, leaving fission products to migrate through the surrounding materials (Barnes 9/2006, Marshall 2011).
The AGR-3/4 multi-monitored test train contains twelve separate and independently controlled and monitored capsules and uses the full 4 ft (1.2 m) active core height to maximize the number of capsules. Each capsule contains four one-half-inch long compacts filled with both UCO unaltered driver fuel
North
Fuel Element
Outer Shim
Neck Shims
Small I-position
Large B-10
Large B-11
Large B-09
AGR-3/4 Location North East Flux Trap
Large B-12
Form 412.09 (Rev. 10)
Idaho National Laboratory
AGR-3/4 Irradiation Experiment Test Plan
Identifier: Revision: Effective Date:
PLN-3867
0
10/05/2011 Page: 4 of 57
particles and UCO DTF fuel particles with a DTF fraction of 1 × 10⁻² placed along the axis of the compacts.
It was initially foreseen that some individual unbounded fuel particles would be irradiated as separate piggyback samples to obtain additional data on irradiation effects, but it has subsequently been decided to not include these piggyback samples in AGR-3/4 to minimize thermal discontinuities in the experiment. A judgment was made that measurements of the diffusivity of metal fission products in graphite materials was a higher priority than the measurement of the diffusivity of gaseous fission products in inner pyrolitic carbon (IPyC) and outer pyrolitic carbon (OPyC) layers from irradiated, unbonded bi-structural isotropic particles.
Form 412.09 (Rev. 10)
Idaho National Laboratory
AGR-3/4 Irradiation Experiment Test Plan
Identifier: Revision: Effective Date:
PLN-3867
0
10/05/2011 Page: 5 of 57
3. EXPERIMENT DESCRIPTION
3.1 Fuel Particles
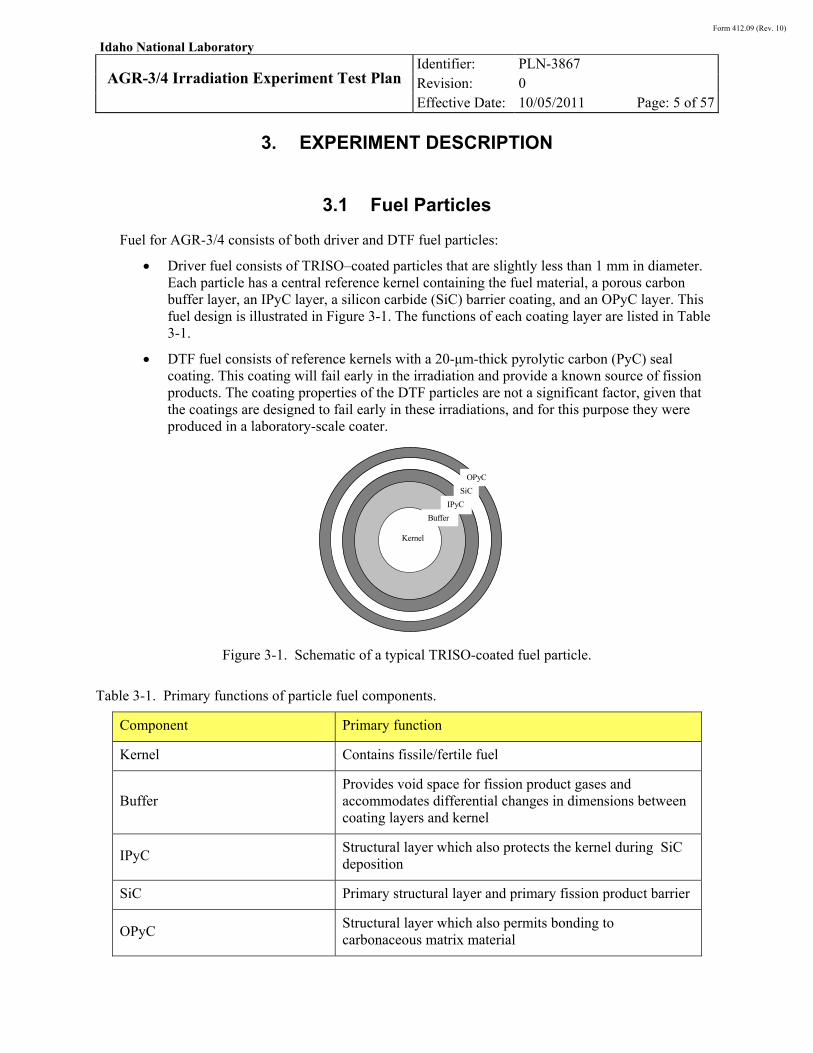
Fuel for AGR-3/4 consists of both driver and DTF fuel particles:
Driver fuel consists of TRISO–coated particles that are slightly less than 1 mm in diameter. Each particle has a central reference kernel containing the fuel material, a porous carbon buffer layer, an IPyC layer, a silicon carbide (SiC) barrier coating, and an OPyC layer. This fuel design is illustrated in Figure 3-1. The functions of each coating layer are listed in Table 3-1.
DTF fuel consists of reference kernels with a 20-μm-thick pyrolytic carbon (PyC) seal coating. This coating will fail early in the irradiation and provide a known source of fission products. The coating properties of the DTF particles are not a significant factor, given that the coatings are designed to fail early in these irradiations, and for this purpose they were produced in a laboratory-scale coater.
Figure 3-1. Schematic of a typical TRISO-coated fuel particle.
Table 3-1. Primary functions of particle fuel components.
Component Primary function
Kernel Contains fissile/fertile fuel
Buffer Provides void space for fission product gases and accommodates differential changes in dimensions between coating layers and kernel
IPyC Structural layer which also protects the kernel during SiC deposition
SiC Primary structural layer and primary fission product barrier
OPyC Structural layer which also permits bonding to carbonaceous matrix material
OPyC
SiC
IPyC
Buffer
Kernel
Form 412.09 (Rev. 10)
Idaho National Laboratory
AGR-3/4 Irradiation Experiment Test Plan
Identifier: Revision: Effective Date:
PLN-3867
0
10/05/2011 Page: 6 of 57
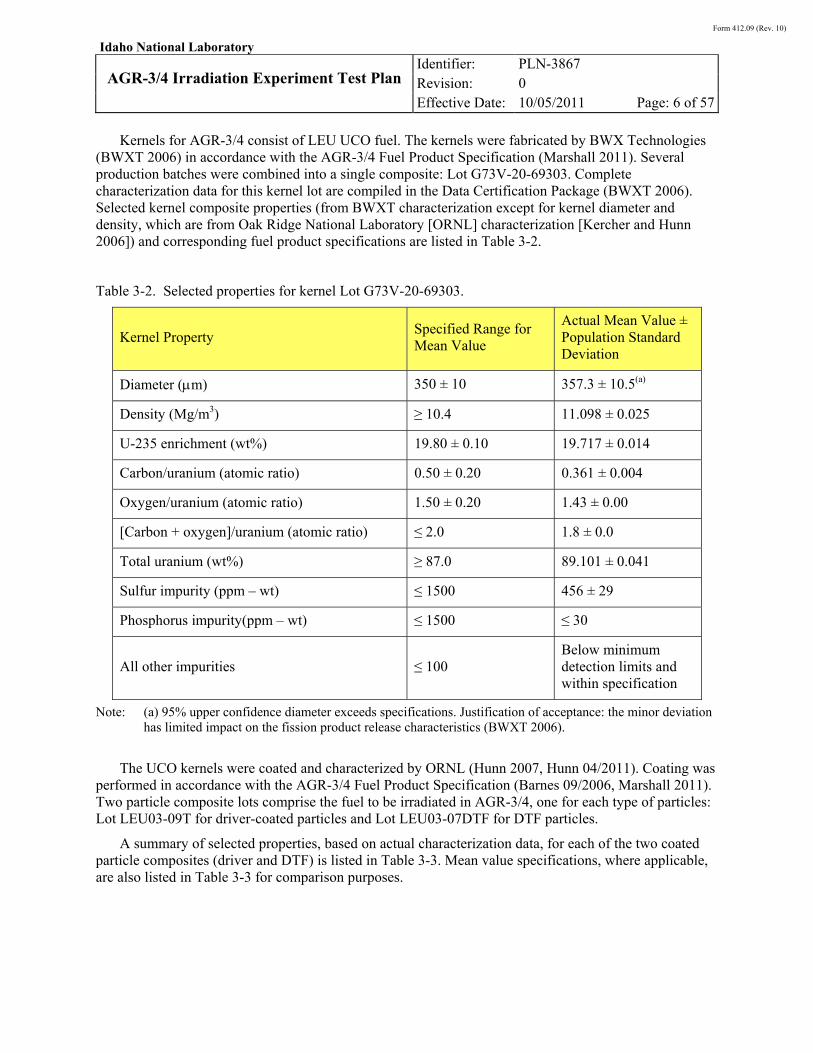
Kernels for AGR-3/4 consist of LEU UCO fuel. The kernels were fabricated by BWX Technologies (BWXT 2006) in accordance with the AGR-3/4 Fuel Product Specification (Marshall 2011). Several production batches were combined into a single composite: Lot G73V-20-69303. Complete characterization data for this kernel lot are compiled in the Data Certification Package (BWXT 2006). Selected kernel composite properties (from BWXT characterization except for kernel diameter and density, which are from Oak Ridge National Laboratory [ORNL] characterization [Kercher and Hunn 2006]) and corresponding fuel product specifications are listed in Table 3-2.
Table 3-2. Selected properties for kernel Lot G73V-20-69303.
Kernel Property Specified Range for Mean Value
Actual Mean Value ± Population Standard Deviation
Diameter (m) 350 ± 10 357.3 ± 10.5(a)
Density (Mg/m3) ≥ 10.4 11.098 ± 0.025
U-235 enrichment (wt%) 19.80 ± 0.10 19.717 ± 0.014
Carbon/uranium (atomic ratio) 0.50 ± 0.20 0.361 ± 0.004
Oxygen/uranium (atomic ratio) 1.50 ± 0.20 1.43 ± 0.00
[Carbon + oxygen]/uranium (atomic ratio) ≤ 2.0 1.8 ± 0.0
Total uranium (wt%) ≥ 87.0 89.101 ± 0.041
Sulfur impurity (ppm – wt) ≤ 1500 456 ± 29
Phosphorus impurity(ppm – wt) ≤ 1500 ≤ 30
All other impurities ≤ 100 Below minimum detection limits and within specification
Note: (a) 95% upper confidence diameter exceeds specifications. Justification of acceptance: the minor deviation has limited impact on the fission product release characteristics (BWXT 2006).
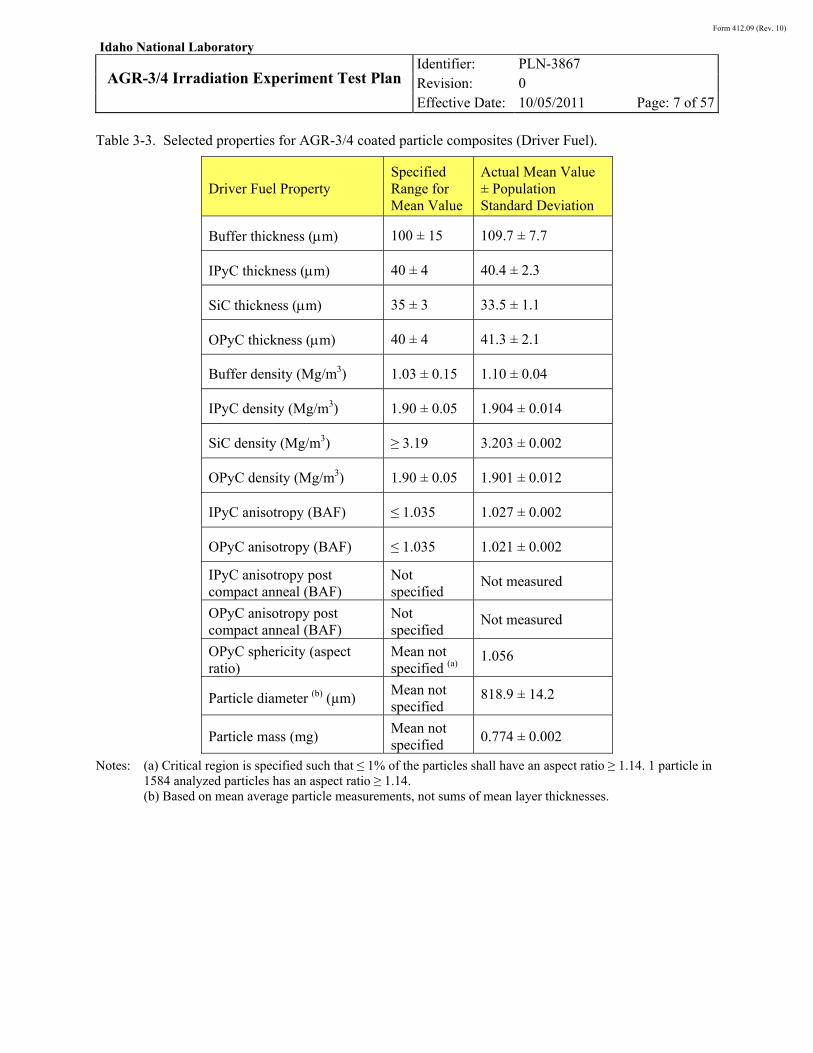
The UCO kernels were coated and characterized by ORNL (Hunn 2007, Hunn 04/2011). Coating was performed in accordance with the AGR-3/4 Fuel Product Specification (Barnes 09/2006, Marshall 2011). Two particle composite lots comprise the fuel to be irradiated in AGR-3/4, one for each type of particles: Lot LEU03-09T for driver-coated particles and Lot LEU03-07DTF for DTF particles.
A summary of selected properties, based on actual characterization data, for each of the two coated particle composites (driver and DTF) is listed in Table 3-3. Mean value specifications, where applicable, are also listed in Table 3-3 for comparison purposes.
Form 412.09 (Rev. 10)
Idaho National Laboratory
AGR-3/4 Irradiation Experiment Test Plan
Identifier: Revision: Effective Date:
PLN-3867
0
10/05/2011 Page: 7 of 57
Table 3-3. Selected properties for AGR-3/4 coated particle composites (Driver Fuel).
Driver Fuel Property Specified Range for Mean Value
Actual Mean Value ± Population Standard Deviation
Buffer thickness (m) 100 ± 15 109.7 ± 7.7
IPyC thickness (m) 40 ± 4 40.4 ± 2.3
SiC thickness (m) 35 ± 3 33.5 ± 1.1
OPyC thickness (m) 40 ± 4 41.3 ± 2.1
Buffer density (Mg/m3) 1.03 ± 0.15 1.10 ± 0.04
IPyC density (Mg/m3) 1.90 ± 0.05 1.904 ± 0.014
SiC density (Mg/m3) ≥ 3.19 3.203 ± 0.002
OPyC density (Mg/m3) 1.90 ± 0.05 1.901 ± 0.012
IPyC anisotropy (BAF) ≤ 1.035 1.027 ± 0.002
OPyC anisotropy (BAF) ≤ 1.035 1.021 ± 0.002
IPyC anisotropy post compact anneal (BAF)
Not specified
Not measured
OPyC anisotropy post compact anneal (BAF)
Not specified
Not measured
OPyC sphericity (aspect ratio)
Mean not specified (a)
1.056
Particle diameter (b) (µm) Mean not specified
818.9 ± 14.2
Particle mass (mg) Mean not specified
0.774 ± 0.002
Notes: (a) Critical region is specified such that ≤ 1% of the particles shall have an aspect ratio ≥ 1.14. 1 particle in 1584 analyzed particles has an aspect ratio ≥ 1.14.
(b) Based on mean average particle measurements, not sums of mean layer thicknesses.
Form 412.09 (Rev. 10)
Idaho National Laboratory
AGR-3/4 Irradiation Experiment Test Plan
Identifier: Revision: Effective Date:
PLN-3867
0
10/05/2011 Page: 8 of 57
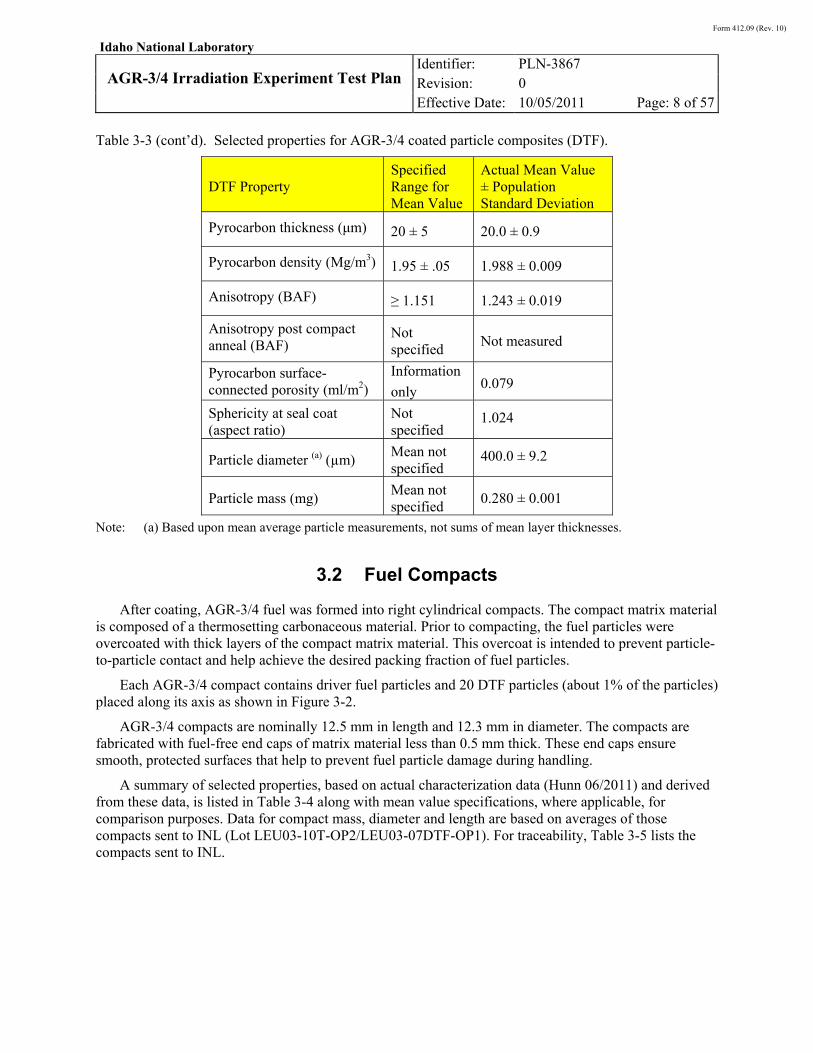
Table 3-3 (cont’d). Selected properties for AGR-3/4 coated particle composites (DTF).
DTF Property Specified Range for Mean Value
Actual Mean Value ± Population Standard Deviation
Pyrocarbon thickness (μm) 20 ± 5 20.0 ± 0.9
Pyrocarbon density (Mg/m3) 1.95 ± .05 1.988 ± 0.009
Anisotropy (BAF) ≥ 1.151 1.243 ± 0.019
Anisotropy post compact anneal (BAF)
Not specified
Not measured
Pyrocarbon surface-connected porosity (ml/m2)
Information
only 0.079
Sphericity at seal coat (aspect ratio)
Not specified
1.024
Particle diameter (a) (µm) Mean not specified
400.0 ± 9.2
Particle mass (mg) Mean not specified
0.280 ± 0.001
Note: (a) Based upon mean average particle measurements, not sums of mean layer thicknesses.
3.2 Fuel Compacts
After coating, AGR-3/4 fuel was formed into right cylindrical compacts. The compact matrix material is composed of a thermosetting carbonaceous material. Prior to compacting, the fuel particles were overcoated with thick layers of the compact matrix material. This overcoat is intended to prevent particle-to-particle contact and help achieve the desired packing fraction of fuel particles.
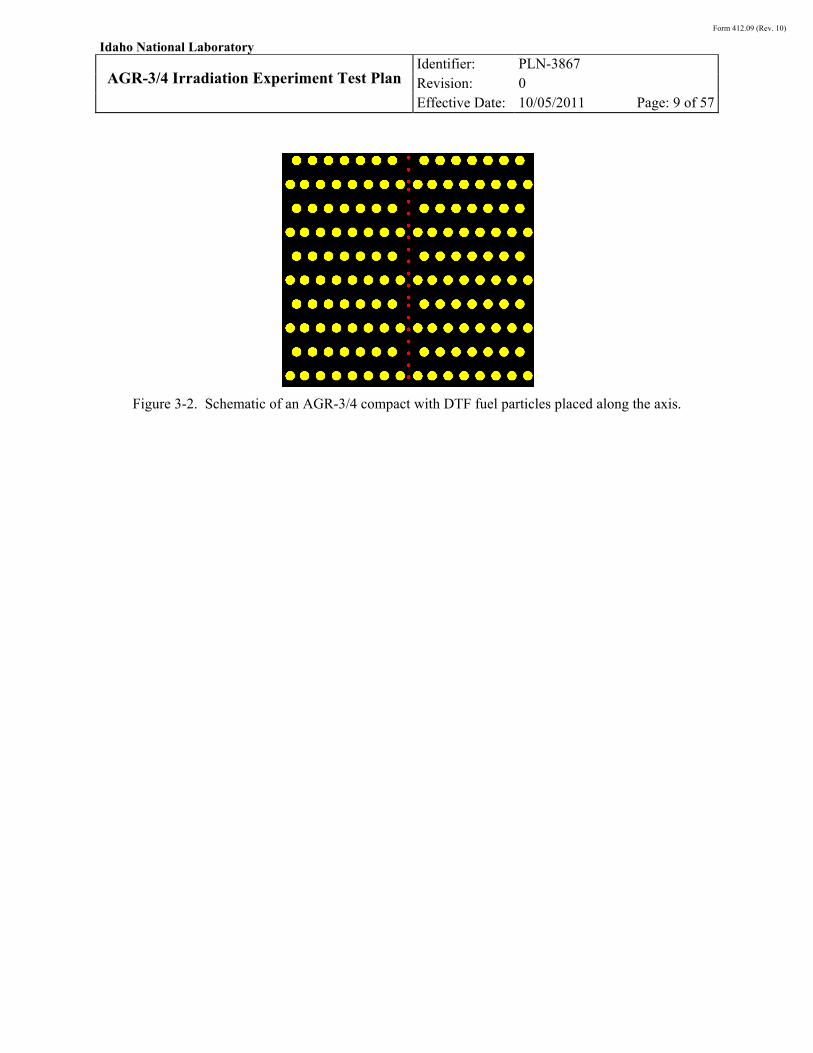
Each AGR-3/4 compact contains driver fuel particles and 20 DTF particles (about 1% of the particles) placed along its axis as shown in Figure 3-2.
AGR-3/4 compacts are nominally 12.5 mm in length and 12.3 mm in diameter. The compacts are fabricated with fuel-free end caps of matrix material less than 0.5 mm thick. These end caps ensure smooth, protected surfaces that help to prevent fuel particle damage during handling.
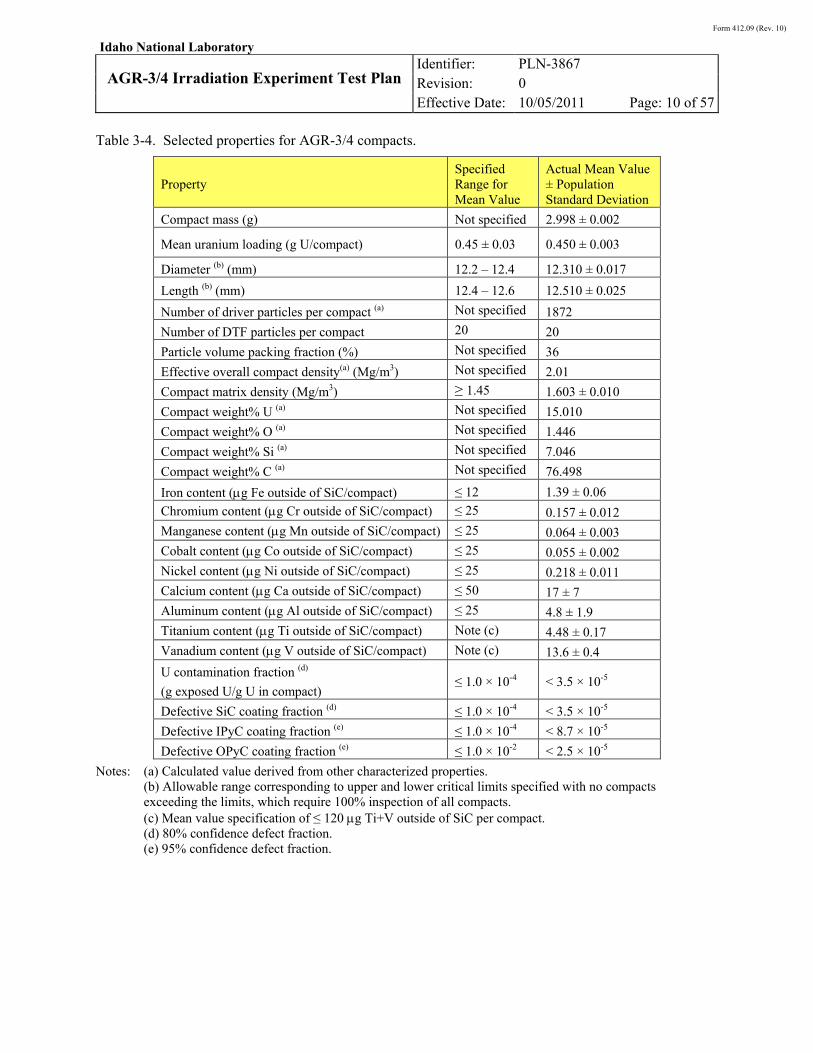
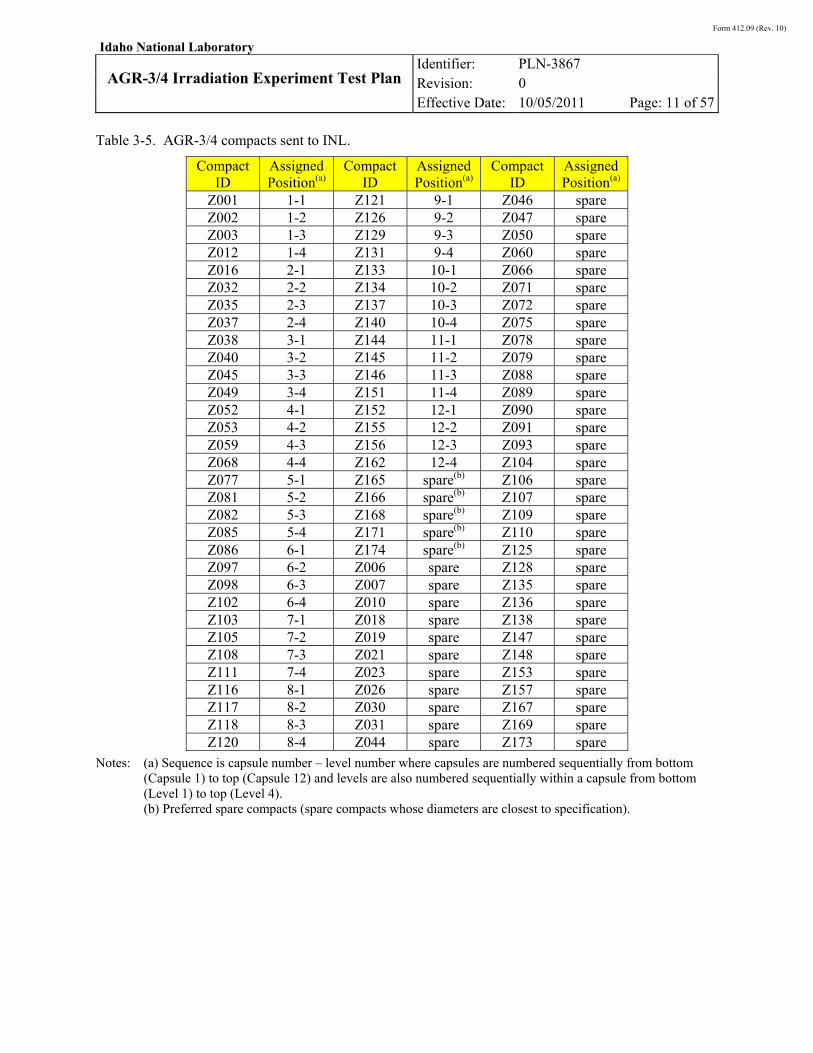
A summary of selected properties, based on actual characterization data (Hunn 06/2011) and derived from these data, is listed in Table 3-4 along with mean value specifications, where applicable, for comparison purposes. Data for compact mass, diameter and length are based on averages of those compacts sent to INL (Lot LEU03-10T-OP2/LEU03-07DTF-OP1). For traceability, Table 3-5 lists the compacts sent to INL.
Form 412.09 (Rev. 10)
Idaho National Laboratory
AGR-3/4 Irradiation Experiment Test Plan
Identifier: Revision: Effective Date:
PLN-3867
0
10/05/2011 Page: 9 of 57
Figure 3-2. Schematic of an AGR-3/4 compact with DTF fuel particles placed along the axis.
Form 412.09 (Rev. 10)
Idaho National Laboratory
AGR-3/4 Irradiation Experiment Test Plan
Identifier: Revision: Effective Date:
PLN-3867
0
10/05/2011 Page: 10 of 57
Table 3-4. Selected properties for AGR-3/4 compacts.
Property Specified Range for Mean Value
Actual Mean Value ± Population Standard Deviation
Compact mass (g) Not specified 2.998 ± 0.002
Mean uranium loading (g U/compact) 0.45 ± 0.03 0.450 ± 0.003
Diameter (b) (mm) 12.2 – 12.4 12.310 ± 0.017
Length (b) (mm) 12.4 – 12.6 12.510 ± 0.025
Number of driver particles per compact (a) Not specified 1872
Number of DTF particles per compact 20 20
Particle volume packing fraction (%) Not specified 36
Effective overall compact density(a) (Mg/m3) Not specified 2.01
Compact matrix density (Mg/m3) ≥ 1.45 1.603 ± 0.010
Compact weight% U (a) Not specified 15.010
Compact weight% O (a) Not specified 1.446
Compact weight% Si (a) Not specified 7.046
Compact weight% C (a) Not specified 76.498
Iron content (g Fe outside of SiC/compact) ≤ 12 1.39 ± 0.06
Chromium content (g Cr outside of SiC/compact) ≤ 25 0.157 ± 0.012
Manganese content (g Mn outside of SiC/compact) ≤ 25 0.064 ± 0.003
Cobalt content (g Co outside of SiC/compact) ≤ 25 0.055 ± 0.002
Nickel content (g Ni outside of SiC/compact) ≤ 25 0.218 ± 0.011
Calcium content (g Ca outside of SiC/compact) ≤ 50 17 ± 7
Aluminum content (g Al outside of SiC/compact) ≤ 25 4.8 ± 1.9
Titanium content (g Ti outside of SiC/compact) Note (c) 4.48 ± 0.17
Vanadium content (g V outside of SiC/compact) Note (c) 13.6 ± 0.4
U contamination fraction (d)
(g exposed U/g U in compact) ≤ 1.0 × 10⁻⁴ < 3.5 × 10⁻⁵
Defective SiC coating fraction (d) ≤ 1.0 × 10⁻⁴ < 3.5 × 10⁻⁵
Defective IPyC coating fraction (e) ≤ 1.0 × 10⁻⁴ < 8.7 × 10⁻⁵
Defective OPyC coating fraction (e) ≤ 1.0 × 10⁻² < 2.5 × 10⁻⁵
Notes: (a) Calculated value derived from other characterized properties. (b) Allowable range corresponding to upper and lower critical limits specified with no compacts exceeding the limits, which require 100% inspection of all compacts. (c) Mean value specification of ≤ 120 g Ti+V outside of SiC per compact. (d) 80% confidence defect fraction. (e) 95% confidence defect fraction.
Form 412.09 (Rev. 10)
Idaho National Laboratory
AGR-3/4 Irradiation Experiment Test Plan
Identifier: Revision: Effective Date:
PLN-3867
0
10/05/2011 Page: 11 of 57
Table 3-5. AGR-3/4 compacts sent to INL.
Compact ID
Assigned Position(a)
Compact ID
Assigned Position(a)
Compact ID
Assigned Position(a)
Z001 1-1 Z121 9-1 Z046 spare Z002 1-2 Z126 9-2 Z047 spare Z003 1-3 Z129 9-3 Z050 spare Z012 1-4 Z131 9-4 Z060 spare Z016 2-1 Z133 10-1 Z066 spare Z032 2-2 Z134 10-2 Z071 spare Z035 2-3 Z137 10-3 Z072 spare Z037 2-4 Z140 10-4 Z075 spare Z038 3-1 Z144 11-1 Z078 spare Z040 3-2 Z145 11-2 Z079 spare Z045 3-3 Z146 11-3 Z088 spare Z049 3-4 Z151 11-4 Z089 spare Z052 4-1 Z152 12-1 Z090 spare Z053 4-2 Z155 12-2 Z091 spare Z059 4-3 Z156 12-3 Z093 spare Z068 4-4 Z162 12-4 Z104 spare Z077 5-1 Z165 spare(b) Z106 spare Z081 5-2 Z166 spare(b) Z107 spare Z082 5-3 Z168 spare(b) Z109 spare Z085 5-4 Z171 spare(b) Z110 spare Z086 6-1 Z174 spare(b) Z125 spare Z097 6-2 Z006 spare Z128 spare Z098 6-3 Z007 spare Z135 spare Z102 6-4 Z010 spare Z136 spare Z103 7-1 Z018 spare Z138 spare Z105 7-2 Z019 spare Z147 spare Z108 7-3 Z021 spare Z148 spare Z111 7-4 Z023 spare Z153 spare Z116 8-1 Z026 spare Z157 spare Z117 8-2 Z030 spare Z167 spare Z118 8-3 Z031 spare Z169 spare Z120 8-4 Z044 spare Z173 spare
Notes: (a) Sequence is capsule number – level number where capsules are numbered sequentially from bottom (Capsule 1) to top (Capsule 12) and levels are also numbered sequentially within a capsule from bottom (Level 1) to top (Level 4).
(b) Preferred spare compacts (spare compacts whose diameters are closest to specification).
Form 412.09 (Rev. 10)
Idaho National Laboratory
AGR-3/4 Irradiation Experiment Test Plan
Identifier: Revision: Effective Date:
PLN-3867
0
10/05/2011 Page: 12 of 57
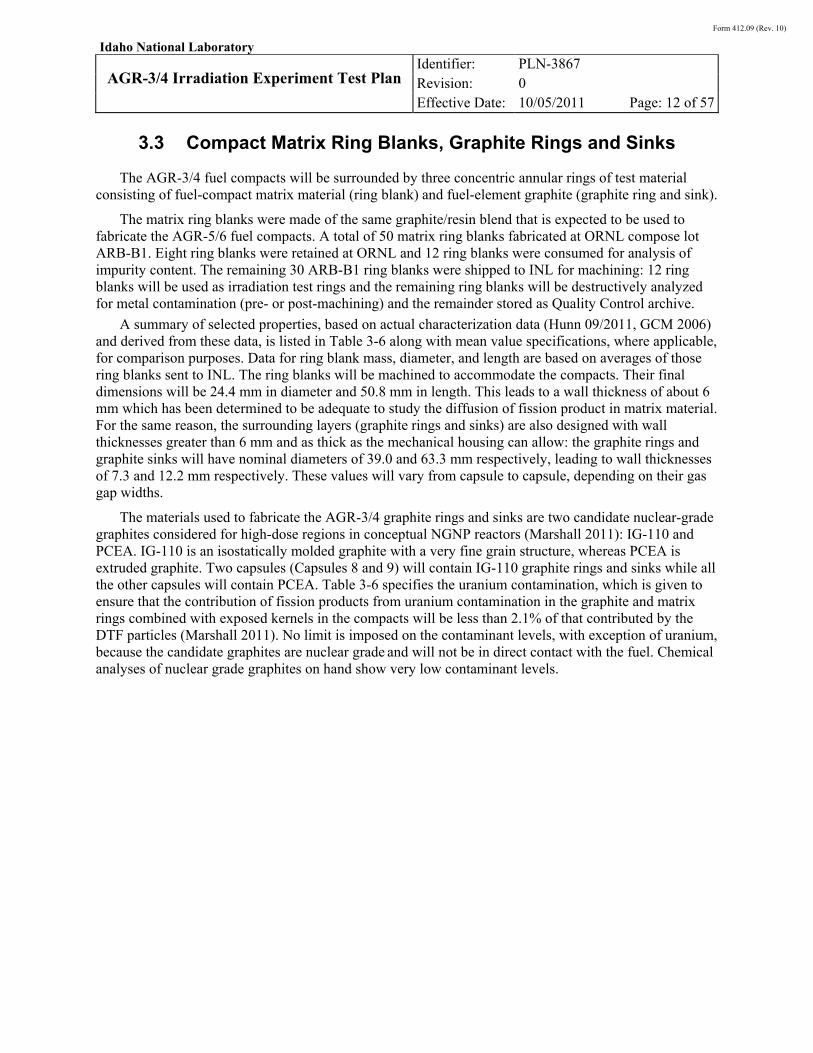
3.3 Compact Matrix Ring Blanks, Graphite Rings and Sinks
The AGR-3/4 fuel compacts will be surrounded by three concentric annular rings of test material consisting of fuel-compact matrix material (ring blank) and fuel-element graphite (graphite ring and sink).
The matrix ring blanks were made of the same graphite/resin blend that is expected to be used to fabricate the AGR-5/6 fuel compacts. A total of 50 matrix ring blanks fabricated at ORNL compose lot ARB-B1. Eight ring blanks were retained at ORNL and 12 ring blanks were consumed for analysis of impurity content. The remaining 30 ARB-B1 ring blanks were shipped to INL for machining: 12 ring blanks will be used as irradiation test rings and the remaining ring blanks will be destructively analyzed for metal contamination (pre- or post-machining) and the remainder stored as Quality Control archive.
A summary of selected properties, based on actual characterization data (Hunn 09/2011, GCM 2006) and derived from these data, is listed in Table 3-6 along with mean value specifications, where applicable, for comparison purposes. Data for ring blank mass, diameter, and length are based on averages of those ring blanks sent to INL. The ring blanks will be machined to accommodate the compacts. Their final dimensions will be 24.4 mm in diameter and 50.8 mm in length. This leads to a wall thickness of about 6 mm which has been determined to be adequate to study the diffusion of fission product in matrix material. For the same reason, the surrounding layers (graphite rings and sinks) are also designed with wall thicknesses greater than 6 mm and as thick as the mechanical housing can allow: the graphite rings and graphite sinks will have nominal diameters of 39.0 and 63.3 mm respectively, leading to wall thicknesses of 7.3 and 12.2 mm respectively. These values will vary from capsule to capsule, depending on their gas gap widths.
The materials used to fabricate the AGR-3/4 graphite rings and sinks are two candidate nuclear-grade graphites considered for high-dose regions in conceptual NGNP reactors (Marshall 2011): IG-110 and PCEA. IG-110 is an isostatically molded graphite with a very fine grain structure, whereas PCEA is extruded graphite. Two capsules (Capsules 8 and 9) will contain IG-110 graphite rings and sinks while all the other capsules will contain PCEA. Table 3-6 specifies the uranium contamination, which is given to ensure that the contribution of fission products from uranium contamination in the graphite and matrix rings combined with exposed kernels in the compacts will be less than 2.1% of that contributed by the DTF particles (Marshall 2011). No limit is imposed on the contaminant levels, with exception of uranium, because the candidate graphites are nuclear grade and will not be in direct contact with the fuel. Chemical analyses of nuclear grade graphites on hand show very low contaminant levels.
Form 412.09 (Rev. 10)
Idaho National Laboratory
AGR-3/4 Irradiation Experiment Test Plan
Identifier: Revision: Effective Date:
PLN-3867
0
10/05/2011 Page: 13 of 57
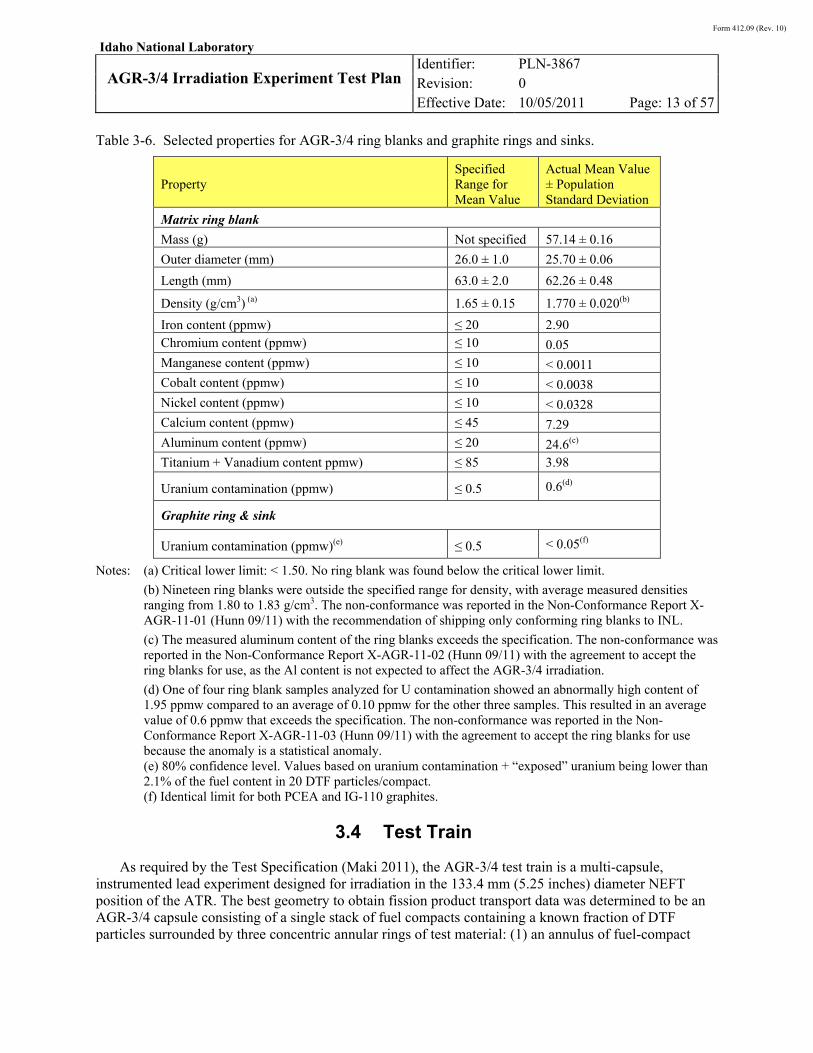
Table 3-6. Selected properties for AGR-3/4 ring blanks and graphite rings and sinks.
Property Specified Range for Mean Value
Actual Mean Value ± Population Standard Deviation
Matrix ring blank
Mass (g) Not specified 57.14 ± 0.16
Outer diameter (mm) 26.0 ± 1.0 25.70 ± 0.06
Length (mm) 63.0 ± 2.0 62.26 ± 0.48
Density (g/cm3) (a) 1.65 ± 0.15 1.770 ± 0.020(b)
Iron content (ppmw) ≤ 20 2.90 Chromium content (ppmw) ≤ 10 0.05 Manganese content (ppmw) ≤ 10 < 0.0011 Cobalt content (ppmw) ≤ 10 < 0.0038 Nickel content (ppmw) ≤ 10 < 0.0328 Calcium content (ppmw) ≤ 45 7.29 Aluminum content (ppmw) ≤ 20 24.6(c)
Titanium + Vanadium content ppmw) ≤ 85 3.98
Uranium contamination (ppmw) ≤ 0.5 0.6(d)
Graphite ring & sink
Uranium contamination (ppmw)(e) ≤ 0.5 < 0.05(f)
Notes: (a) Critical lower limit: < 1.50. No ring blank was found below the critical lower limit.
(b) Nineteen ring blanks were outside the specified range for density, with average measured densities ranging from 1.80 to 1.83 g/cm3. The non-conformance was reported in the Non-Conformance Report X-AGR-11-01 (Hunn 09/11) with the recommendation of shipping only conforming ring blanks to INL.
(c) The measured aluminum content of the ring blanks exceeds the specification. The non-conformance was reported in the Non-Conformance Report X-AGR-11-02 (Hunn 09/11) with the agreement to accept the ring blanks for use, as the Al content is not expected to affect the AGR-3/4 irradiation.
(d) One of four ring blank samples analyzed for U contamination showed an abnormally high content of 1.95 ppmw compared to an average of 0.10 ppmw for the other three samples. This resulted in an average value of 0.6 ppmw that exceeds the specification. The non-conformance was reported in the Non-Conformance Report X-AGR-11-03 (Hunn 09/11) with the agreement to accept the ring blanks for use because the anomaly is a statistical anomaly. (e) 80% confidence level. Values based on uranium contamination + “exposed” uranium being lower than 2.1% of the fuel content in 20 DTF particles/compact. (f) Identical limit for both PCEA and IG-110 graphites.
3.4 Test Train
As required by the Test Specification (Maki 2011), the AGR-3/4 test train is a multi-capsule, instrumented lead experiment designed for irradiation in the 133.4 mm (5.25 inches) diameter NEFT position of the ATR. The best geometry to obtain fission product transport data was determined to be an AGR-3/4 capsule consisting of a single stack of fuel compacts containing a known fraction of DTF particles surrounded by three concentric annular rings of test material: (1) an annulus of fuel-compact
Form 412.09 (Rev. 10)
Idaho National Laboratory
AGR-3/4 Irradiation Experiment Test Plan
Identifier: Revision: Effective Date:
PLN-3867
0
10/05/2011 Page: 14 of 57
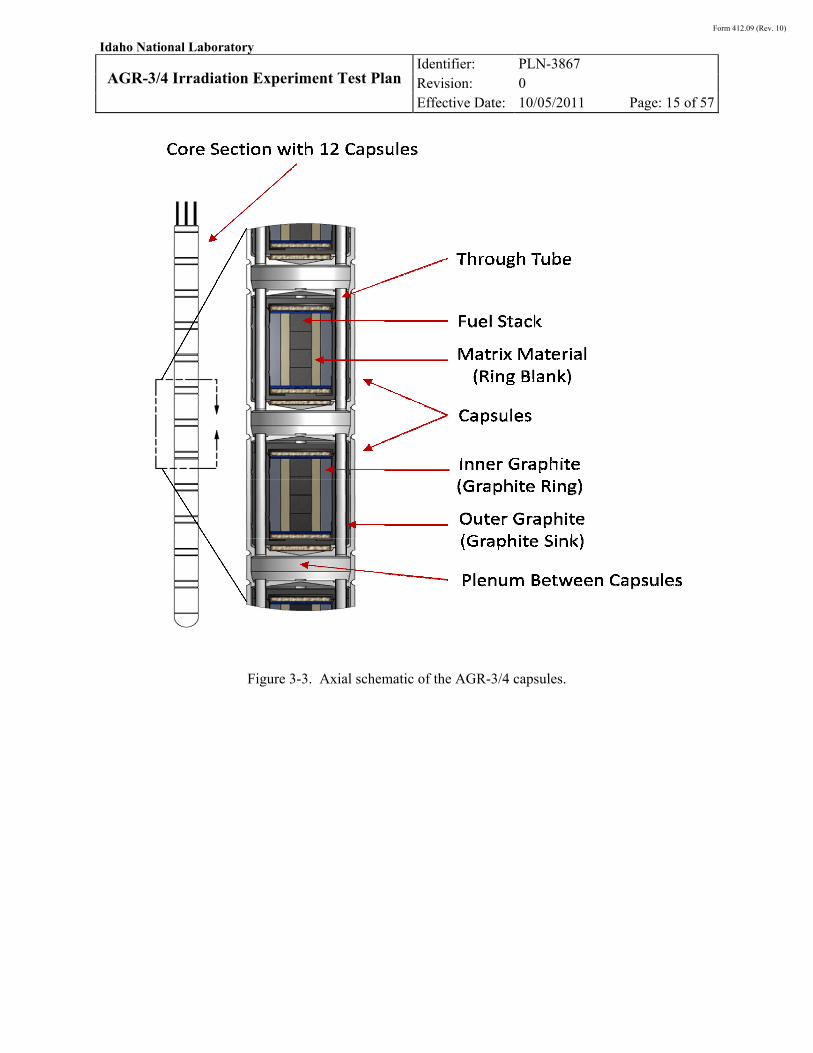
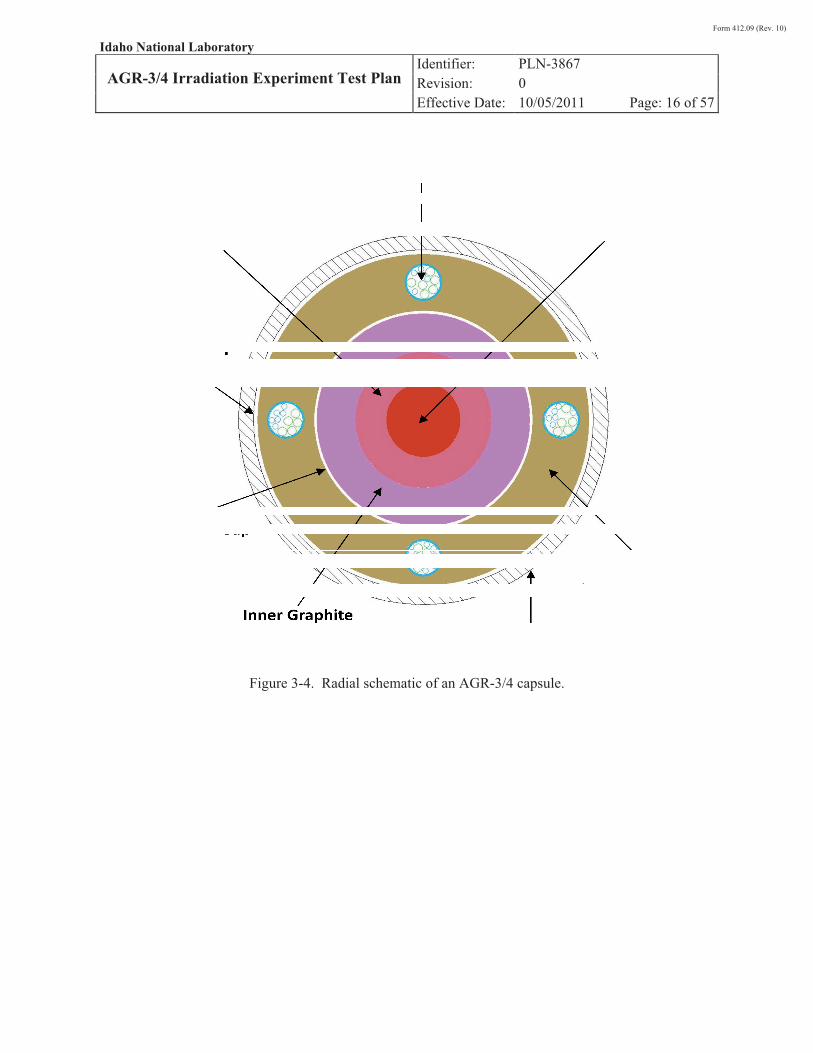
matrix material; (2) an annulus of fuel-element graphite; and (3) an annulus of graphite operating at lower temperature to act as a sink for fission products. This configuration will best reduce axial thermal gradients and hence, axial diffusion. The test reactor’s axial flux distribution and space considerations within the test train impose a practical limit of twelve independently controlled and monitored capsules per test train. An axial view of the test train is illustrated in Figure 3-3. Figure 3-4 illustrates a radial view of a capsule.
Steep temperature gradients occur in the capsules between the fuel stack and the successive concentric rings. Since peak temperatures in the fuel are limited by specifications, the graphite rings experience temperatures below the ranges of interest for the study of the diffusion of fission products in some capsules. In order to study the diffusion of fission products in graphite at higher temperatures the matrix material in Capsules 3, 8, and 10 was replaced by graphite.
There are two styles of capsules: a “fuel body” style where the graphite layer incorporates a floor and a lid (Capsules 2, 4, 6, 9 and 11) and a style where the graphite layer is simply a ring (seven remaining capsules). The floor and lid hold the inner part of the capsule (fuel + ring blank + graphite ring) as a single piece, allowing it to be removed after irradiation and to be heated in a furnace for fission product migration measurements. The former style capsule is 111.3 mm (4.38 inches) long and the latter style capsule is 101.6 mm (4 inches) long. Each of the twelve AGR-3/4 capsules hosts four one-half-inch long compacts. Significant features of the test train are described below and further details are presented in the Technical and Functional Requirements documents (TFR-630 2011, TFR-656 2010, TFR 729 2011).
Thermocouples
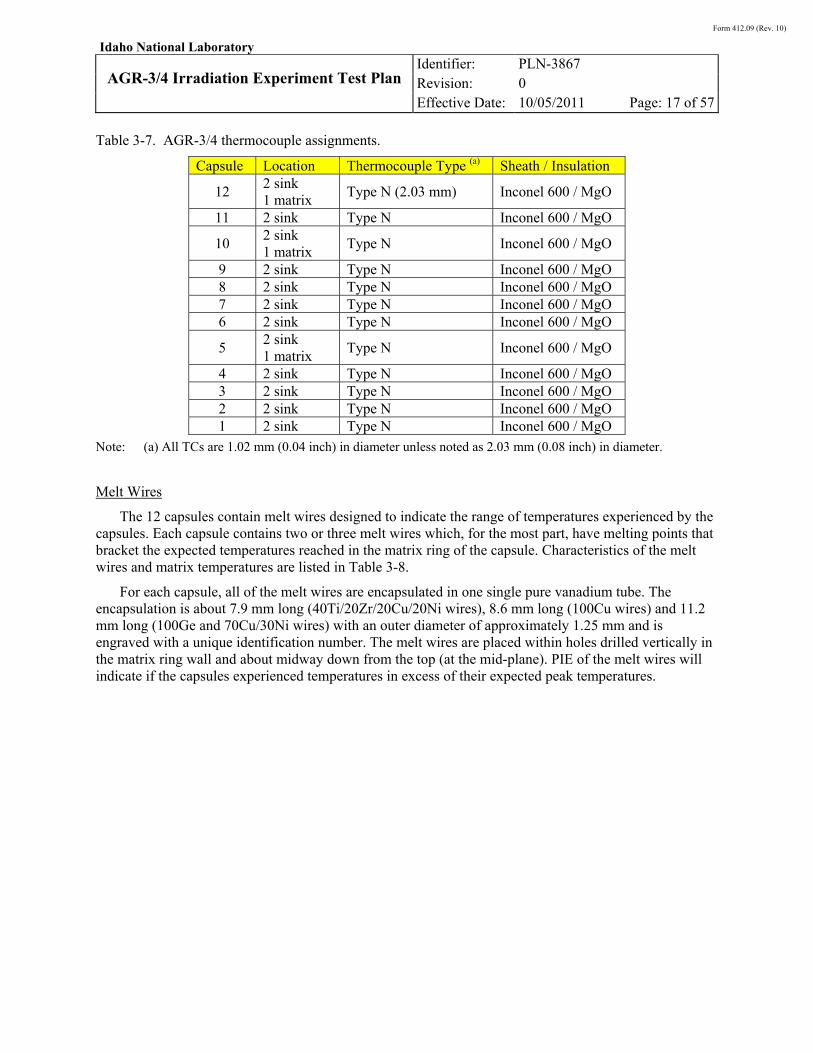
The type and size of thermocouples (TCs) used for AGR-3/4 are based on experience with the TCs used for AGR-1 and the specific geometry and operation characteristics of the AGR-3/4 experiment. Type N TCs are used to measure temperature in the 12 capsules. Commercial Type N TCs are used in AGR-3/4 because the lower temperatures encountered in the matrix and graphite rings are well within their operating range. The TCs are placed in holes drilled in the sink ring with three of them placed in the matrix ring. All TCs terminate at fuel stack mid-plane.
Specifically, Capsules 1, 2, 3, 4, 6, 7, 8, 9 and 11 have two TCs, both in the sink, and Capsules 5, 10, and 12 have three TCs, two in the sink and one in the matrix.
All TCs are sheathed with Inconel 600 alloy and are 1.02 mm (0.04 inch) in diameter, except for Capsule 12 whose TCs are 2.03 mm (0.08 inch) in diameter. Justification for the use of Inconel is the reasonable separation of the TCs from the fuel stack, which limits the risk of migration of nickel, iron, or chromium from Inconel TC sheathes through the graphite to potentially attack the SiC layer of the fuel. The small TC diameter is justified by the lower operating temperatures, which are also expected to extend TC life, and by the limited space in the thru tubes, which provide passages for the TCs as they are routed to the 12 capsules. Capsule 12, at the top of the test train, can be instrumented with larger TCs hence the larger diameter.
A summary of TC type, sheath, and insulation materials and placement within the test train is provided in Table 3-7.
Form 412.09 (Rev. 10)
Idaho National Laboratory
AGR-3/4 Irradiation Experiment Test Plan
Identifier: Revision: Effective Date:
PLN-3867
0
10/05/2011 Page: 15 of 57
Figure 3-3. Axial schematic of the AGR-3/4 capsules.
Form 412.09 (Rev. 10)
Idaho National Laboratory
AGR-3/4 Irradiation Experiment Test Plan Identifier: Revision: Effective Date:
PLN-3867 0 10/05/2011 Page: 16 of 57
Figure 3-4. Radial schematic of an AGR-3/4 capsule.
Form 412.09 (Rev. 10)
Idaho National Laboratory
AGR-3/4 Irradiation Experiment Test Plan
Identifier: Revision: Effective Date:
PLN-3867
0
10/05/2011 Page: 17 of 57
Table 3-7. AGR-3/4 thermocouple assignments.
Capsule Location Thermocouple Type (a) Sheath / Insulation
12 2 sink 1 matrix
Type N (2.03 mm) Inconel 600 / MgO
11 2 sink Type N Inconel 600 / MgO
10 2 sink 1 matrix
Type N Inconel 600 / MgO
9 2 sink Type N Inconel 600 / MgO 8 2 sink Type N Inconel 600 / MgO 7 2 sink Type N Inconel 600 / MgO 6 2 sink Type N Inconel 600 / MgO
5 2 sink 1 matrix
Type N Inconel 600 / MgO
4 2 sink Type N Inconel 600 / MgO 3 2 sink Type N Inconel 600 / MgO 2 2 sink Type N Inconel 600 / MgO 1 2 sink Type N Inconel 600 / MgO
Note: (a) All TCs are 1.02 mm (0.04 inch) in diameter unless noted as 2.03 mm (0.08 inch) in diameter.
Melt Wires
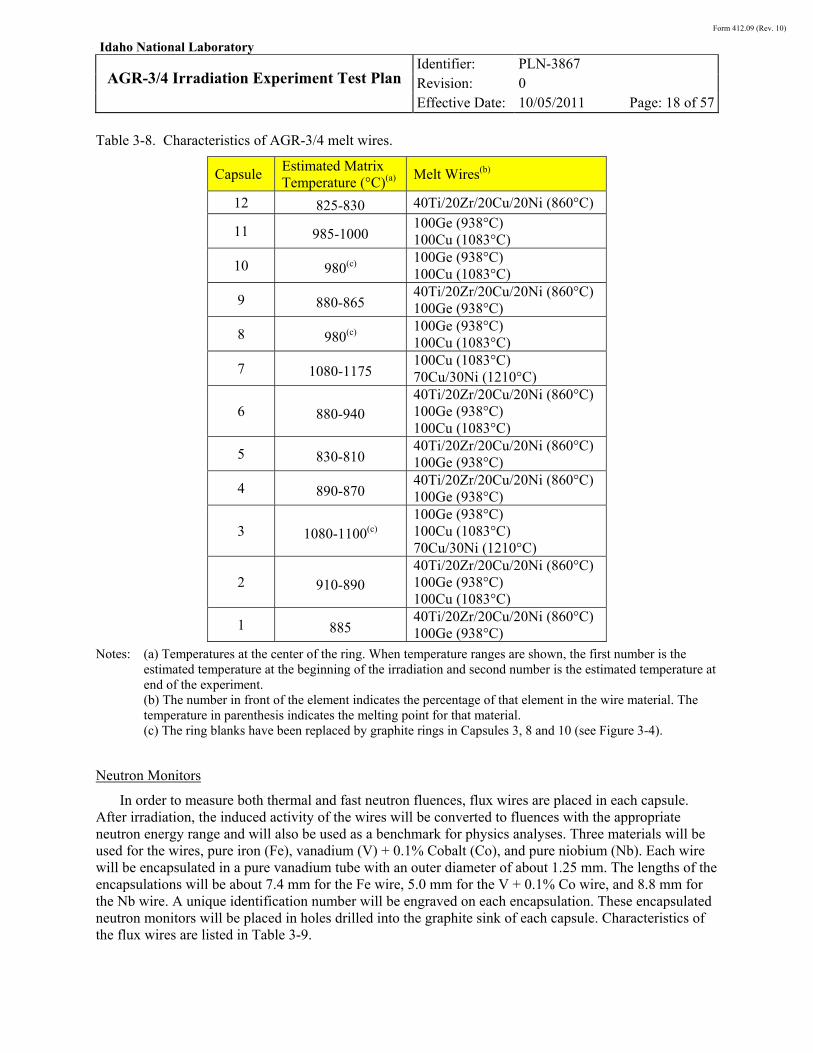
The 12 capsules contain melt wires designed to indicate the range of temperatures experienced by the capsules. Each capsule contains two or three melt wires which, for the most part, have melting points that bracket the expected temperatures reached in the matrix ring of the capsule. Characteristics of the melt wires and matrix temperatures are listed in Table 3-8.
For each capsule, all of the melt wires are encapsulated in one single pure vanadium tube. The encapsulation is about 7.9 mm long (40Ti/20Zr/20Cu/20Ni wires), 8.6 mm long (100Cu wires) and 11.2 mm long (100Ge and 70Cu/30Ni wires) with an outer diameter of approximately 1.25 mm and is engraved with a unique identification number. The melt wires are placed within holes drilled vertically in the matrix ring wall and about midway down from the top (at the mid-plane). PIE of the melt wires will indicate if the capsules experienced temperatures in excess of their expected peak temperatures.
Form 412.09 (Rev. 10)
Idaho National Laboratory
AGR-3/4 Irradiation Experiment Test Plan
Identifier: Revision: Effective Date:
PLN-3867
0
10/05/2011 Page: 18 of 57
Table 3-8. Characteristics of AGR-3/4 melt wires.
Capsule Estimated Matrix Temperature (°C)(a) Melt Wires(b)
12 825-830 40Ti/20Zr/20Cu/20Ni (860°C)
11 985-1000 100Ge (938°C) 100Cu (1083°C)
10 980(c) 100Ge (938°C) 100Cu (1083°C)
9 880-865 40Ti/20Zr/20Cu/20Ni (860°C) 100Ge (938°C)
8 980(c) 100Ge (938°C) 100Cu (1083°C)
7 1080-1175 100Cu (1083°C) 70Cu/30Ni (1210°C)
6 880-940 40Ti/20Zr/20Cu/20Ni (860°C) 100Ge (938°C) 100Cu (1083°C)
5 830-810 40Ti/20Zr/20Cu/20Ni (860°C) 100Ge (938°C)
4 890-870 40Ti/20Zr/20Cu/20Ni (860°C) 100Ge (938°C)
3 1080-1100(c) 100Ge (938°C) 100Cu (1083°C) 70Cu/30Ni (1210°C)
2 910-890 40Ti/20Zr/20Cu/20Ni (860°C) 100Ge (938°C) 100Cu (1083°C)
1 885 40Ti/20Zr/20Cu/20Ni (860°C) 100Ge (938°C)
Notes: (a) Temperatures at the center of the ring. When temperature ranges are shown, the first number is the estimated temperature at the beginning of the irradiation and second number is the estimated temperature at end of the experiment. (b) The number in front of the element indicates the percentage of that element in the wire material. The temperature in parenthesis indicates the melting point for that material. (c) The ring blanks have been replaced by graphite rings in Capsules 3, 8 and 10 (see Figure 3-4).
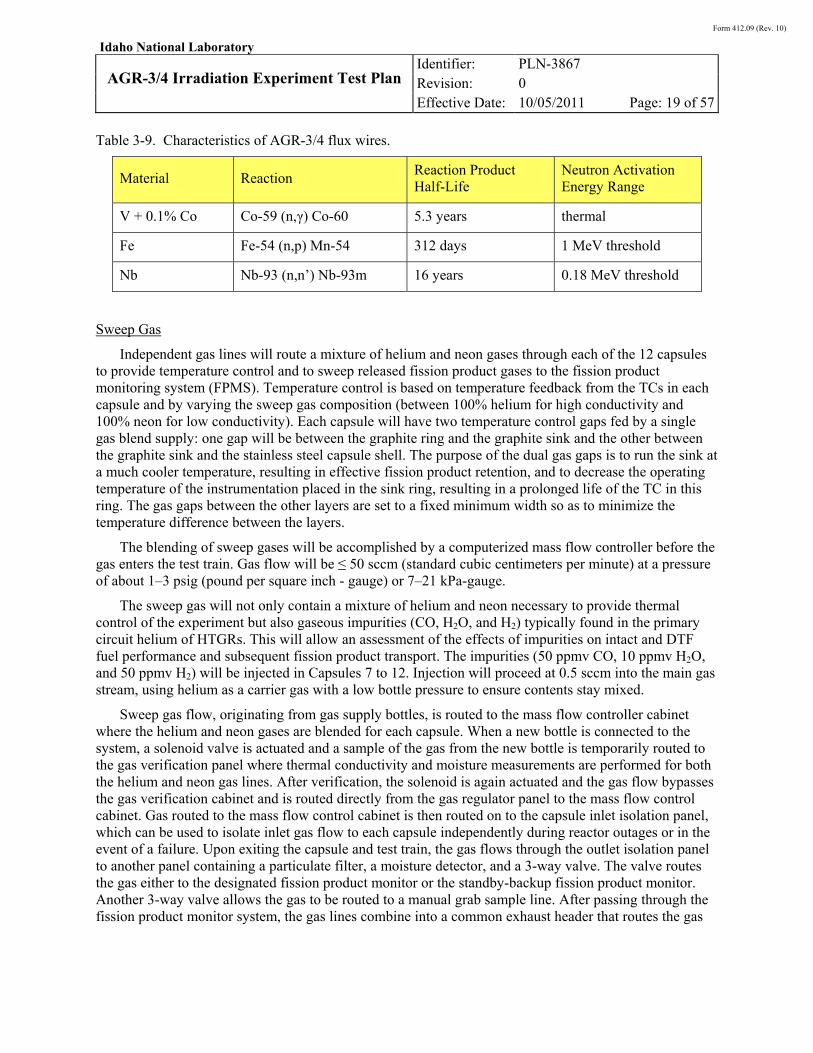
Neutron Monitors
In order to measure both thermal and fast neutron fluences, flux wires are placed in each capsule. After irradiation, the induced activity of the wires will be converted to fluences with the appropriate neutron energy range and will also be used as a benchmark for physics analyses. Three materials will be used for the wires, pure iron (Fe), vanadium (V) + 0.1% Cobalt (Co), and pure niobium (Nb). Each wire will be encapsulated in a pure vanadium tube with an outer diameter of about 1.25 mm. The lengths of the encapsulations will be about 7.4 mm for the Fe wire, 5.0 mm for the V + 0.1% Co wire, and 8.8 mm for the Nb wire. A unique identification number will be engraved on each encapsulation. These encapsulated neutron monitors will be placed in holes drilled into the graphite sink of each capsule. Characteristics of the flux wires are listed in Table 3-9.
Form 412.09 (Rev. 10)
Idaho National Laboratory
AGR-3/4 Irradiation Experiment Test Plan
Identifier: Revision: Effective Date:
PLN-3867
0
10/05/2011 Page: 19 of 57
Table 3-9. Characteristics of AGR-3/4 flux wires.
Material Reaction Reaction Product Half-Life
Neutron Activation Energy Range
V + 0.1% Co Co-59 (n,γ) Co-60 5.3 years thermal
Fe Fe-54 (n,p) Mn-54 312 days 1 MeV threshold
Nb Nb-93 (n,n’) Nb-93m 16 years 0.18 MeV threshold
Sweep Gas
Independent gas lines will route a mixture of helium and neon gases through each of the 12 capsules to provide temperature control and to sweep released fission product gases to the fission product monitoring system (FPMS). Temperature control is based on temperature feedback from the TCs in each capsule and by varying the sweep gas composition (between 100% helium for high conductivity and 100% neon for low conductivity). Each capsule will have two temperature control gaps fed by a single gas blend supply: one gap will be between the graphite ring and the graphite sink and the other between the graphite sink and the stainless steel capsule shell. The purpose of the dual gas gaps is to run the sink at a much cooler temperature, resulting in effective fission product retention, and to decrease the operating temperature of the instrumentation placed in the sink ring, resulting in a prolonged life of the TC in this ring. The gas gaps between the other layers are set to a fixed minimum width so as to minimize the temperature difference between the layers.
The blending of sweep gases will be accomplished by a computerized mass flow controller before the gas enters the test train. Gas flow will be ≤ 50 sccm (standard cubic centimeters per minute) at a pressure of about 1–3 psig (pound per square inch - gauge) or 7–21 kPa-gauge.
The sweep gas will not only contain a mixture of helium and neon necessary to provide thermal control of the experiment but also gaseous impurities (CO, H2O, and H2) typically found in the primary circuit helium of HTGRs. This will allow an assessment of the effects of impurities on intact and DTF fuel performance and subsequent fission product transport. The impurities (50 ppmv CO, 10 ppmv H2O, and 50 ppmv H2) will be injected in Capsules 7 to 12. Injection will proceed at 0.5 sccm into the main gas stream, using helium as a carrier gas with a low bottle pressure to ensure contents stay mixed.
Sweep gas flow, originating from gas supply bottles, is routed to the mass flow controller cabinet where the helium and neon gases are blended for each capsule. When a new bottle is connected to the system, a solenoid valve is actuated and a sample of the gas from the new bottle is temporarily routed to the gas verification panel where thermal conductivity and moisture measurements are performed for both the helium and neon gas lines. After verification, the solenoid is again actuated and the gas flow bypasses the gas verification cabinet and is routed directly from the gas regulator panel to the mass flow control cabinet. Gas routed to the mass flow control cabinet is then routed on to the capsule inlet isolation panel, which can be used to isolate inlet gas flow to each capsule independently during reactor outages or in the event of a failure. Upon exiting the capsule and test train, the gas flows through the outlet isolation panel to another panel containing a particulate filter, a moisture detector, and a 3-way valve. The valve routes the gas either to the designated fission product monitor or the standby-backup fission product monitor. Another 3-way valve allows the gas to be routed to a manual grab sample line. After passing through the fission product monitor system, the gas lines combine into a common exhaust header that routes the gas
Form 412.09 (Rev. 10)
Idaho National Laboratory
AGR-3/4 Irradiation Experiment Test Plan
Identifier: Revision: Effective Date:
PLN-3867
0
10/05/2011 Page: 20 of 57
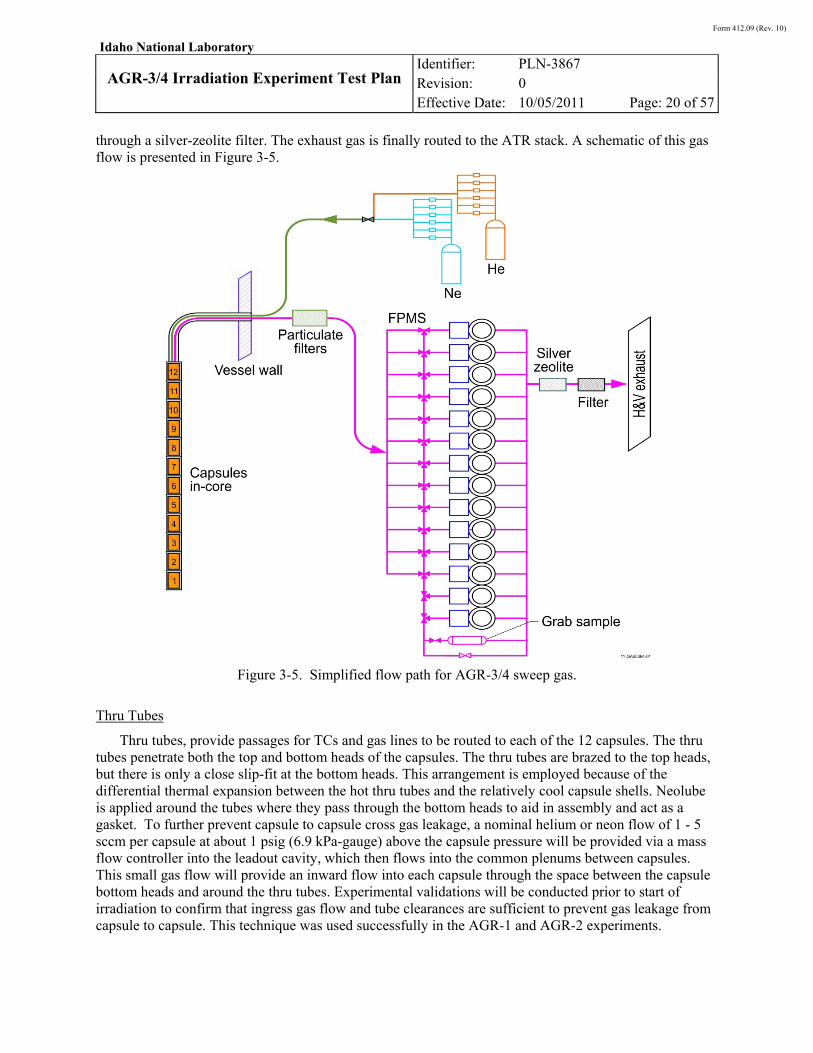
through a silver-zeolite filter. The exhaust gas is finally routed to the ATR stack. A schematic of this gas flow is presented in Figure 3-5.
Figure 3-5. Simplified flow path for AGR-3/4 sweep gas.
Thru Tubes
Thru tubes, provide passages for TCs and gas lines to be routed to each of the 12 capsules. The thru tubes penetrate both the top and bottom heads of the capsules. The thru tubes are brazed to the top heads, but there is only a close slip-fit at the bottom heads. This arrangement is employed because of the differential thermal expansion between the hot thru tubes and the relatively cool capsule shells. Neolube is applied around the tubes where they pass through the bottom heads to aid in assembly and act as a gasket. To further prevent capsule to capsule cross gas leakage, a nominal helium or neon flow of 1 - 5 sccm per capsule at about 1 psig (6.9 kPa-gauge) above the capsule pressure will be provided via a mass flow controller into the leadout cavity, which then flows into the common plenums between capsules. This small gas flow will provide an inward flow into each capsule through the space between the capsule bottom heads and around the thru tubes. Experimental validations will be conducted prior to start of irradiation to confirm that ingress gas flow and tube clearances are sufficient to prevent gas leakage from capsule to capsule. This technique was used successfully in the AGR-1 and AGR-2 experiments.

Form 412.09 (Rev. 10)
Idaho National Laboratory
AGR-3/4 Irradiation Experiment Test Plan
Identifier: Revision: Effective Date:
PLN-3867
0
10/05/2011 Page: 21 of 57
Power Shaping
Two techniques are used to adjust the neutron flux incident upon the AGR-3/4 test articles to shape the temporal and spatial fuel power distribution. These techniques include the placement of a hafnium filter around the capsules and raising the power throughout irradiation.
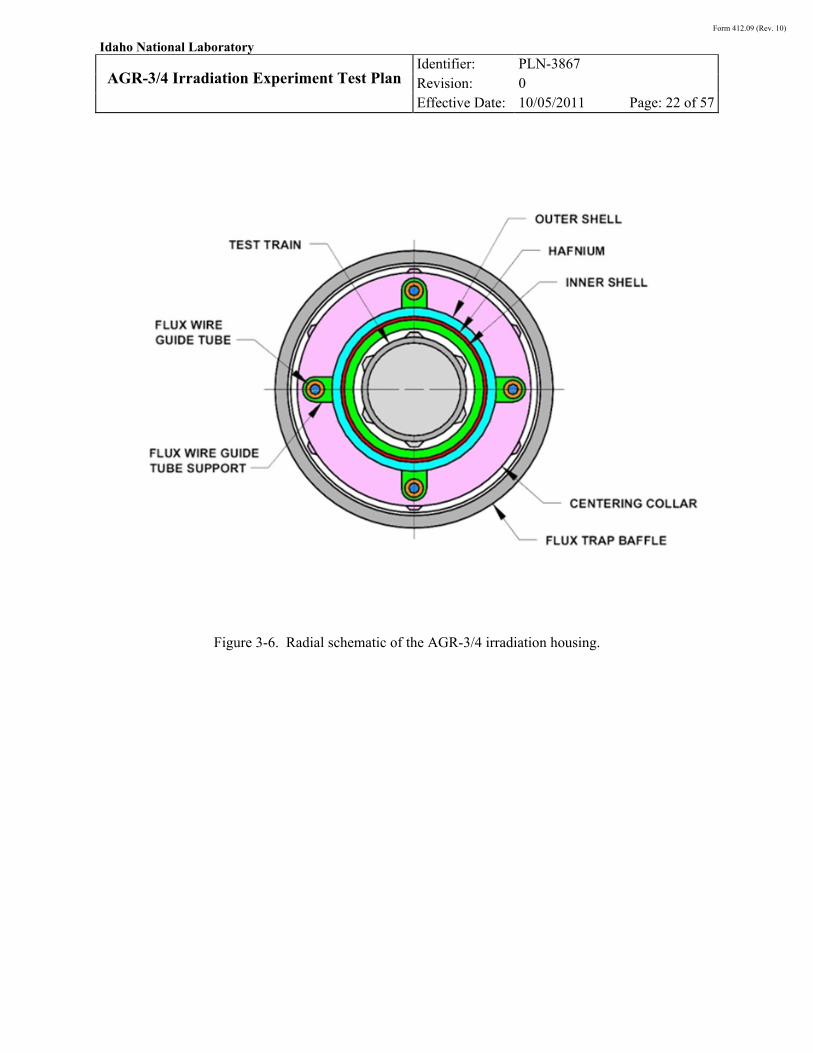
The AGR-3/4 experiment will be irradiated in the NEFT of ATR. However the ratio of fast to thermal neutron flux in the NEFT is too high compared to that of the NGNP and it therefore needs to be tailored. An irradiation housing provides neutron moderation and absorption to meet this need. It allows the experiment to simultaneously achieve the desired fuel burnup and fast neutron fluence while adapting to the ATR constraint of maintaining a minimum level of reactor power. The irradiation housing is installed between the capsule outer shells and the inside of the flux trap. It consists of three wraps of 0.007-inch thick hafnium sheet tightly wound between the inner and outer stainless steel shells which are welded top and bottom to provide a sealed environment as shown in Figure 3-6.
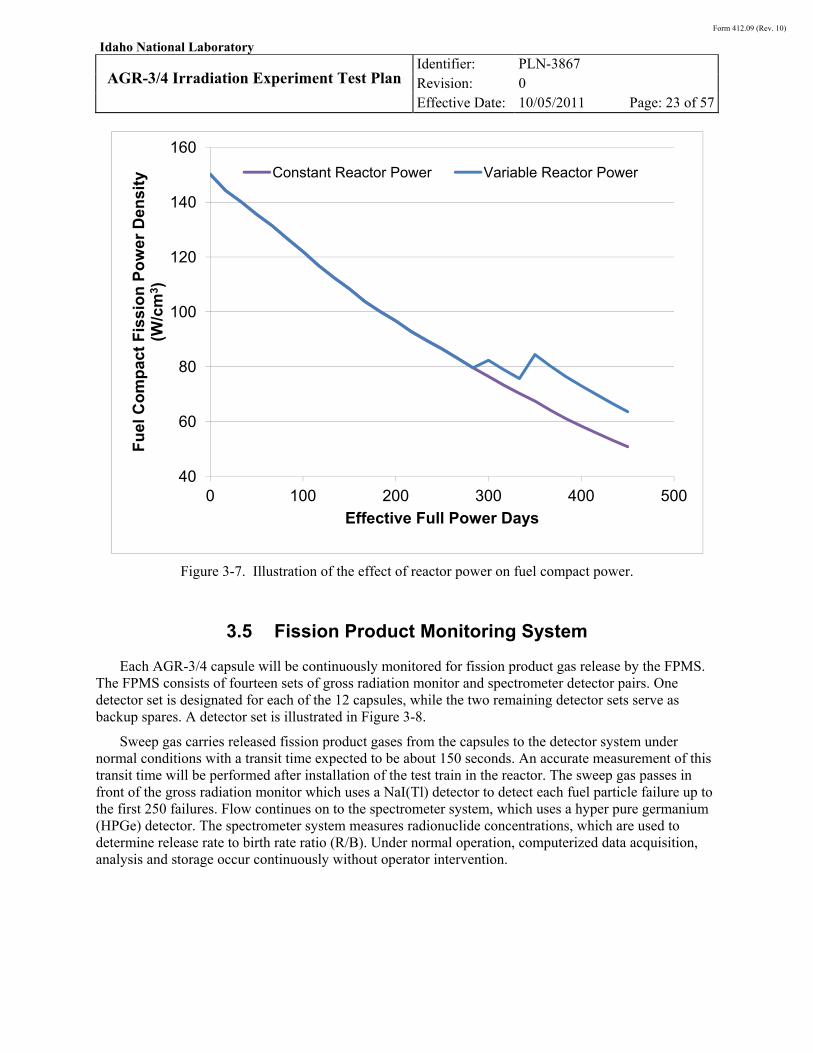
Another power shaping technique used in AGR-3/4 will consist in raising the power in the NEFT throughout the 400 EFPDs of irradiation. At a given power level, heat generation rate is highest at beginning of life (BOL) and drops exponentially as the fissile fuel content is consumed. For AGR-3/4, test fuel, this range of heat generation rates spans about 90 W/cm3 from BOL to essentially, full burnup. Unfortunately, temperature control of the test fuel can only be maintained within a limited range of heat generation rates (about half of the maximum heat rate i.e. 70 W/cm3 at most) for given control gas gap widths and with a varying mixture of helium and neon sweep gas. To reduce the range of test fuel heat generation rates, power will be increased in the NEFT throughout irradiation from 13.0 MW (BOL) to 16.3 MW (end of life [EOL]). The increase of power will balance the loss of heat generation caused by fuel depletion. This temporal effect is shown in Figure 3-7.
The two control gas gaps of each AGR-3/4 capsule are sized so that thermal control may be maintained throughout irradiation under normal reactor power. This allows for thermal control from BOL through approximately 450 EFPD. However, during a high power reactor cycle, or PALM cycle, reactor power is increased by as much as 43%, which results in a corresponding increase in test fuel power. Should this occur during the time the fuel would be normally operating above about 90 W/cm3 (between BOL and about 200 EFPD), the resulting increase in fuel power would exceed the power range that permits thermal control. In this case, the test train would be removed from the NEFT and placed in the ATR canal for the length of the PALM cycle. On the other hand, if the PALM cycle occurs later during the irradiation, its power level might match the increased power level needed in the NEFT to compensate for fuel depletion and in that case, the test train would be kept in position in the NEFT and be operated at the PALM cycle power level.
The current ATR planning includes two PALM cycles during the span of the AGR-3/4 irradiation, after about 170 EFPD and 365 EFPD of irradiation, but the planning is tentative only and subject to change before the beginning of irradiation.
Form 412.09 (Rev. 10)
Idaho National Laboratory
AGR-3/4 Irradiation Experiment Test Plan
Identifier: Revision: Effective Date:
PLN-3867
0
10/05/2011 Page: 22 of 57
Figure 3-6. Radial schematic of the AGR-3/4 irradiation housing.
Form 412.09 (Rev. 10)
Idaho National Laboratory
AGR-3/4 Irradiation Experiment Test Plan
Identifier: Revision: Effective Date:
PLN-3867
0
10/05/2011 Page: 23 of 57
Figure 3-7. Illustration of the effect of reactor power on fuel compact power.
3.5 Fission Product Monitoring System
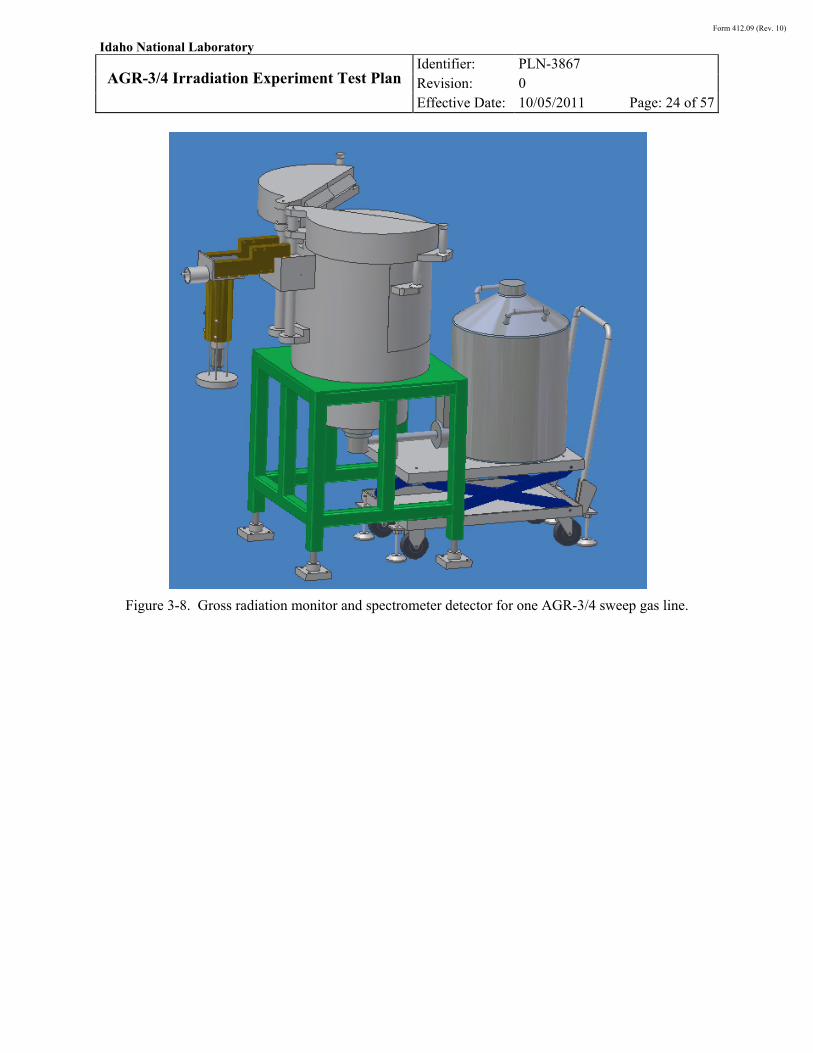
Each AGR-3/4 capsule will be continuously monitored for fission product gas release by the FPMS. The FPMS consists of fourteen sets of gross radiation monitor and spectrometer detector pairs. One detector set is designated for each of the 12 capsules, while the two remaining detector sets serve as backup spares. A detector set is illustrated in Figure 3-8.
Sweep gas carries released fission product gases from the capsules to the detector system under normal conditions with a transit time expected to be about 150 seconds. An accurate measurement of this transit time will be performed after installation of the test train in the reactor. The sweep gas passes in front of the gross radiation monitor which uses a NaI(Tl) detector to detect each fuel particle failure up to the first 250 failures. Flow continues on to the spectrometer system, which uses a hyper pure germanium (HPGe) detector. The spectrometer system measures radionuclide concentrations, which are used to determine release rate to birth rate ratio (R/B). Under normal operation, computerized data acquisition, analysis and storage occur continuously without operator intervention.
40
60
80
100
120
140
160
0 100 200 300 400 500
Fu
el C
om
pac
t F
issi
on
Po
wer
Den
sity
(W
/cm
3 )
Effective Full Power Days
Constant Reactor Power Variable Reactor Power
Form 412.09 (Rev. 10)
Idaho National Laboratory
AGR-3/4 Irradiation Experiment Test Plan
Identifier: Revision: Effective Date:
PLN-3867
0
10/05/2011 Page: 24 of 57
Figure 3-8. Gross radiation monitor and spectrometer detector for one AGR-3/4 sweep gas line.
Form 412.09 (Rev. 10)
Idaho National Laboratory
AGR-3/4 Irradiation Experiment Test Plan
Identifier: Revision: Effective Date:
PLN-3867
0
10/05/2011 Page: 25 of 57
4. TEST CONDITION REQUIREMENTS
This section presents the irradiation conditions expected for the AGR-3/4 experiment. These calculated conditions were derived from the latest available physics and thermal analyses. Initial calculations, presented below, were performed using AGR-1 fuel characteristics and assuming a maximum irradiation of 400 EFPD. Confirmatory physics calculations are being refined using the actual AGR-3/4 fuel characteristics and foreseeing extended irradiation.
4.1 Particle Power
Fuel power is restricted by specification (Maki 2011) and by an operational need to control test temperature (which is defined as the ability to adjust and maintain fuel temperatures within a prescribed range). The instantaneous peak power per particle specification of ≤ 400 mW/particle is intended to limit peak kernel temperatures and temperature gradients across the particle, which reduces fission product diffusion and potential fission product/SiC interactions. Note that a typical TRISO particle in an HTGR reactor experiences a power level of 50-100 mW.
Temperature control is achieved by varying the composition of the sweep gas (between 100% helium for high conductivity and 100% neon for low conductivity) within the control gas gap surrounding the fuel. For a given gas gap width, this control can be maintained within a range, or window, of fuel heat generation rates. Typically, temperature control requires peak heat rate to EOL heat rate to be ≤ 2.
In order to extend the time that thermal control can be maintained, the power level in the NEFT will be adjusted throughout the AGR-3/4 irradiation. It will be raised from 13.0 MW at BOL to 16.3 MW at 400 EFPD. This power shaping measure will enhance the fuel heat generation rate as the fuel depletes throughout irradiation. From 13.0 MW during the first six cycles, the power will be increased to 14.0 MW during cycle 7 and finally to 16.3 MW during the last cycle. The effect of the power increase is evident from the bumps appearing on the “Variable Power” curve on Figure 3-7.
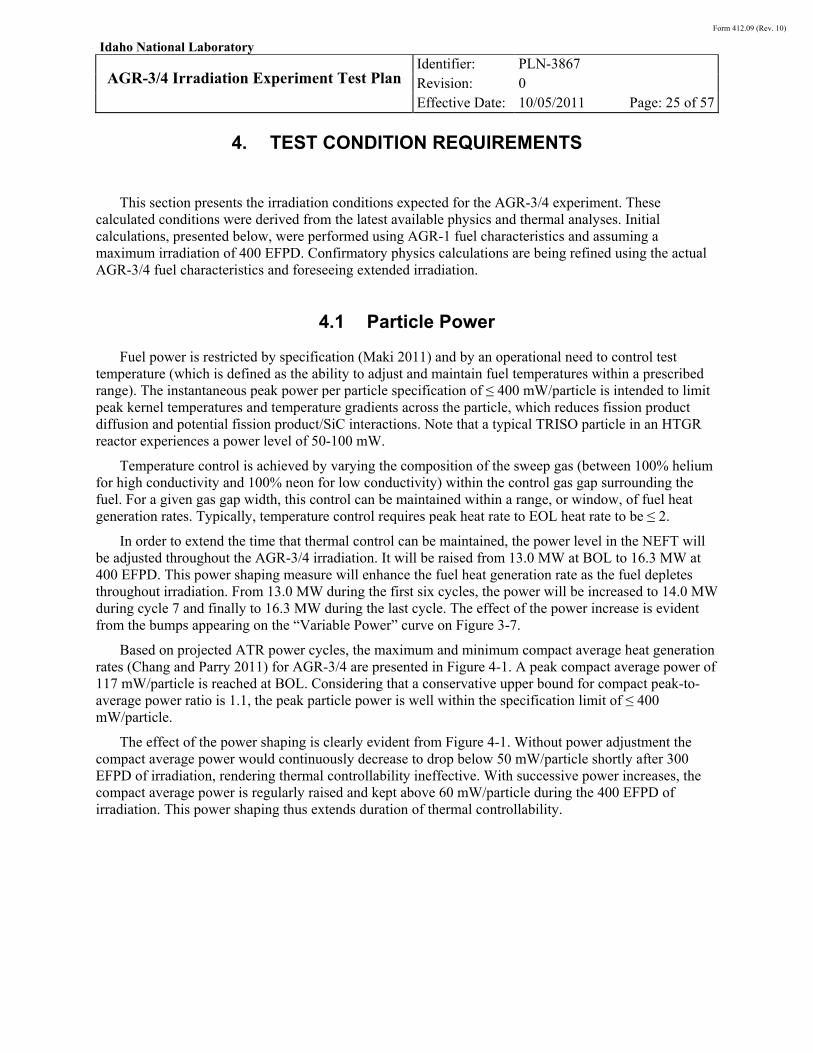
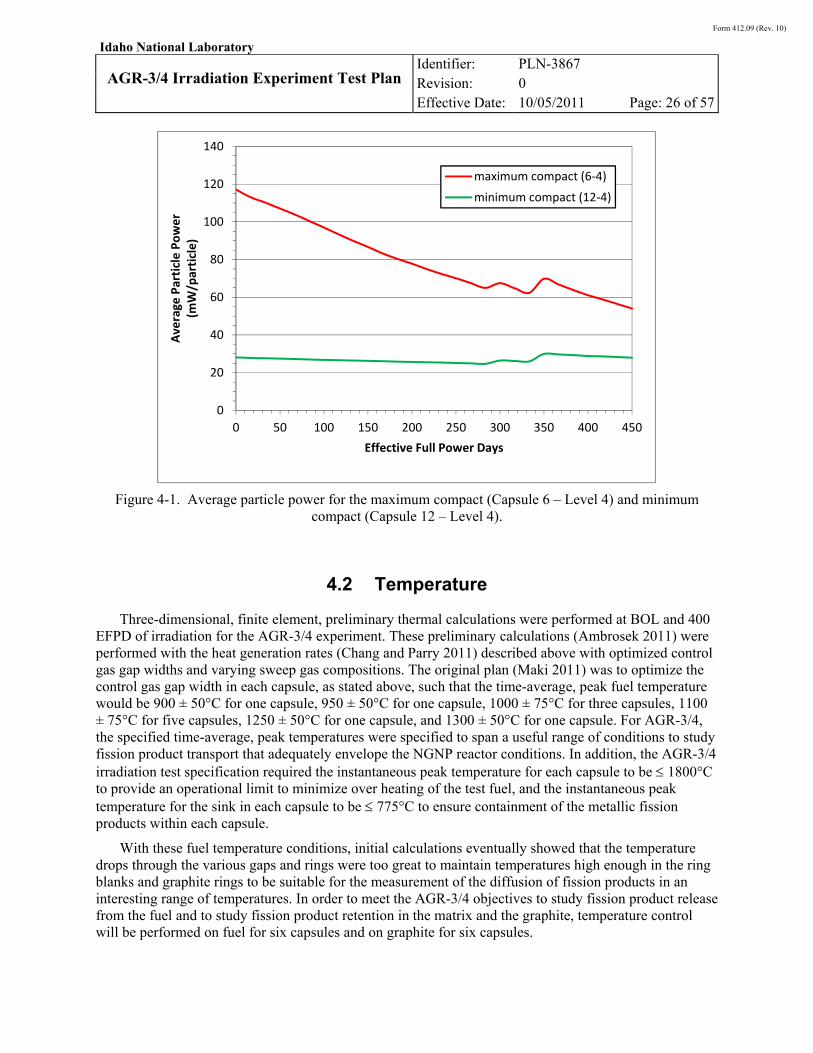
Based on projected ATR power cycles, the maximum and minimum compact average heat generation rates (Chang and Parry 2011) for AGR-3/4 are presented in Figure 4-1. A peak compact average power of 117 mW/particle is reached at BOL. Considering that a conservative upper bound for compact peak-to-average power ratio is 1.1, the peak particle power is well within the specification limit of ≤ 400 mW/particle.
The effect of the power shaping is clearly evident from Figure 4-1. Without power adjustment the compact average power would continuously decrease to drop below 50 mW/particle shortly after 300 EFPD of irradiation, rendering thermal controllability ineffective. With successive power increases, the compact average power is regularly raised and kept above 60 mW/particle during the 400 EFPD of irradiation. This power shaping thus extends duration of thermal controllability.
Form 412.09 (Rev. 10)
Idaho National Laboratory
AGR-3/4 Irradiation Experiment Test Plan
Identifier: Revision: Effective Date:
PLN-3867
0
10/05/2011 Page: 26 of 57
Figure 4-1. Average particle power for the maximum compact (Capsule 6 – Level 4) and minimum compact (Capsule 12 – Level 4).
4.2 Temperature
Three-dimensional, finite element, preliminary thermal calculations were performed at BOL and 400 EFPD of irradiation for the AGR-3/4 experiment. These preliminary calculations (Ambrosek 2011) were performed with the heat generation rates (Chang and Parry 2011) described above with optimized control gas gap widths and varying sweep gas compositions. The original plan (Maki 2011) was to optimize the control gas gap width in each capsule, as stated above, such that the time-average, peak fuel temperature would be 900 ± 50°C for one capsule, 950 ± 50°C for one capsule, 1000 ± 75°C for three capsules, 1100 ± 75°C for five capsules, 1250 ± 50°C for one capsule, and 1300 ± 50°C for one capsule. For AGR-3/4, the specified time-average, peak temperatures were specified to span a useful range of conditions to study fission product transport that adequately envelope the NGNP reactor conditions. In addition, the AGR-3/4 irradiation test specification required the instantaneous peak temperature for each capsule to be 1800°C to provide an operational limit to minimize over heating of the test fuel, and the instantaneous peak temperature for the sink in each capsule to be 775°C to ensure containment of the metallic fission products within each capsule.
With these fuel temperature conditions, initial calculations eventually showed that the temperature drops through the various gaps and rings were too great to maintain temperatures high enough in the ring blanks and graphite rings to be suitable for the measurement of the diffusion of fission products in an interesting range of temperatures. In order to meet the AGR-3/4 objectives to study fission product release from the fuel and to study fission product retention in the matrix and the graphite, temperature control will be performed on fuel for six capsules and on graphite for six capsules.
0
20
40
60
80
100
120
140
0 50 100 150 200 250 300 350 400 450
Average
Particle Power
(mW/particle)
Effective Full Power Days
maximum compact (6‐4)
minimum compact (12‐4)
Form 412.09 (Rev. 10)
Idaho National Laboratory
AGR-3/4 Irradiation Experiment Test Plan
Identifier: Revision: Effective Date:
PLN-3867
0
10/05/2011 Page: 27 of 57
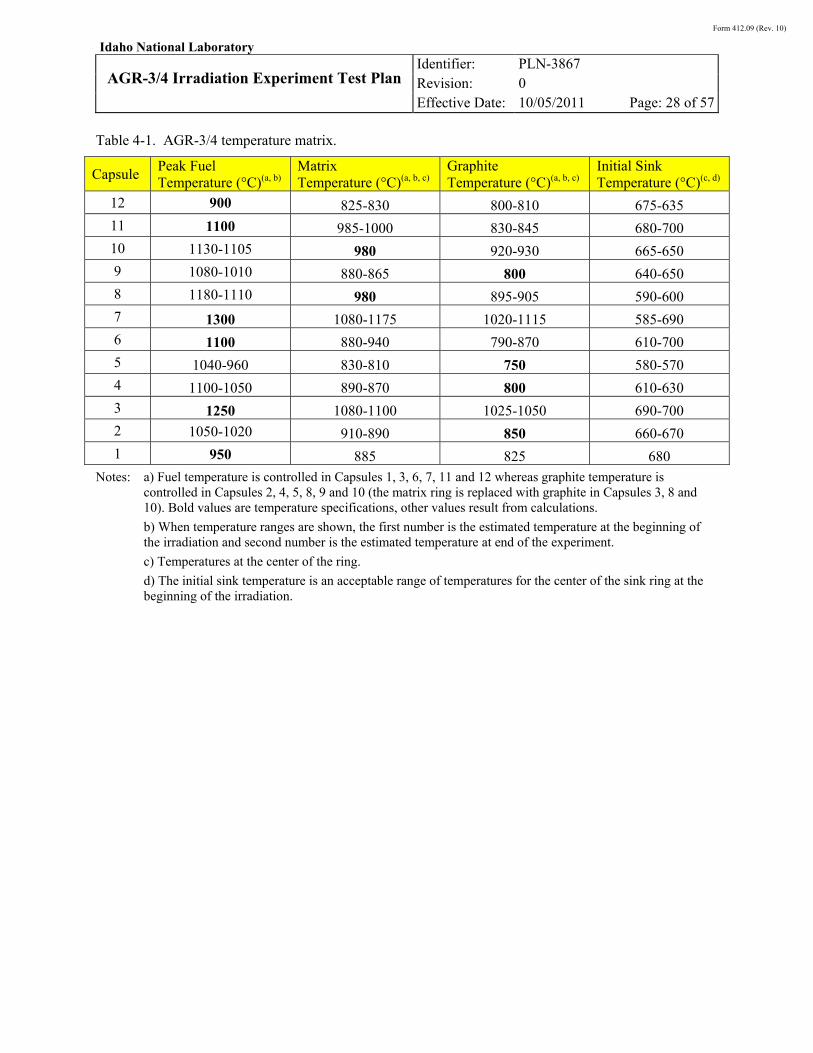
Table 4-1 details the temperature matrix planned for AGR-3/4 temperature control. Justification of this temperature matrix includes:
- The peak fuel temperature is set to 1300°C, as it was in the original plan.
- The peak sink temperature is set to 700°C (center of the ring) in order to preserve the life of the TCs.
- The peak graphite temperature is 1115°C (center of the ring), typical of the temperatures graphite will experience in NGNP reactors.
- To the greatest extent possible, the fuel and graphite temperature gradients must be kept steady over time in order to allow derivation of effective diffusivities in these materials.
- Matrix material in the ring blanks of Capsules 3, 8 and 10 is replaced by graphite to benefit from graphite at higher temperature.
- Capsules 8 and 10 comprise different graphites (Capsule 8: IG-110, Capsule 10: PCEA) but they are maintained at the same graphite temperature (980°C) in order to have a point of comparison.
- Capsules 4 (PCEA) and 9 (IG-110) comprise different graphites and are maintained at the same graphite temperature (800°C) in order to have another point of comparison at lower temperature.
- Capsules 3 and 7 are maintained at comparable fuel temperatures (~1250/1300°C) but they will experience different burnups, thus providing a point of comparison.
- Capsules 6 and 11 are maintained at the same fuel temperature (1100°C) and will also experience different burnups, thus providing another point of comparison at lower temperature.
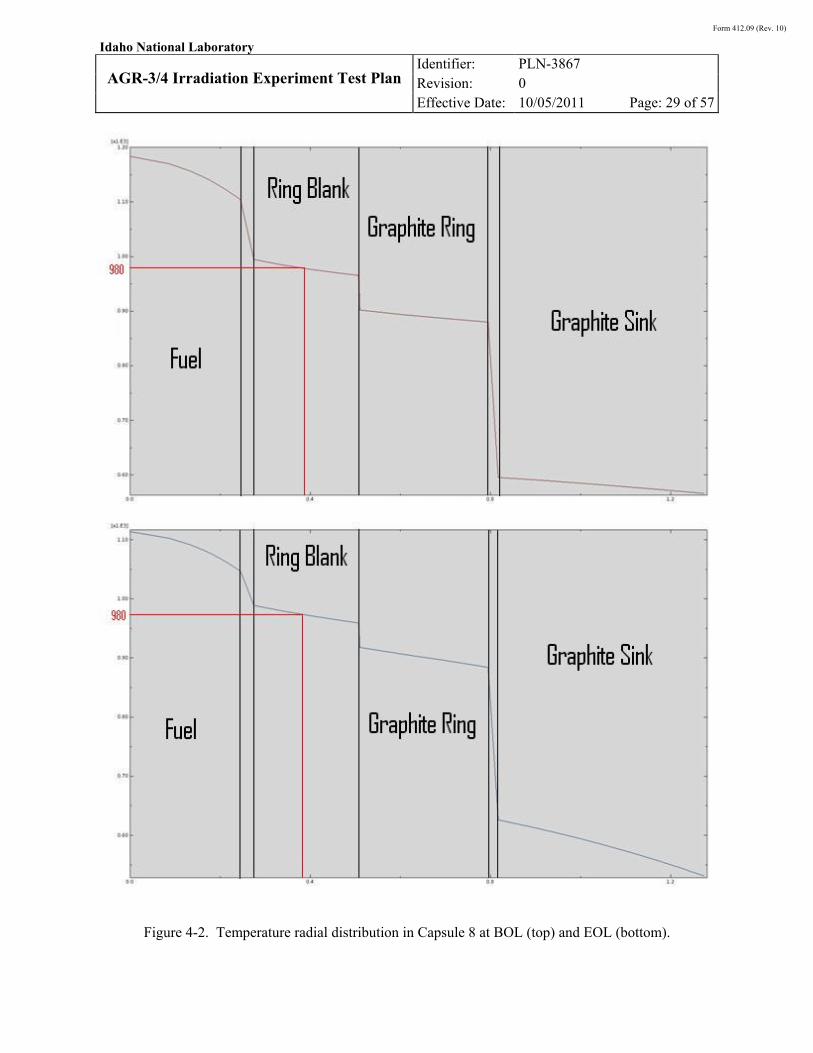
An illustrative example of these calculations is presented in Figure 4-2, which displays the temperature radial distribution in Capsule 8 at BOL and EOL. Capsule 8 is controlled by matrix temperature, with 980°C maintained at the center of the ring blank throughout irradiation. As shown on Figure 4-2, temperatures are well controlled within their limits by adjusting the gas mixture.
Form 412.09 (Rev. 10)
Idaho National Laboratory
AGR-3/4 Irradiation Experiment Test Plan
Identifier: Revision: Effective Date:
PLN-3867
0
10/05/2011 Page: 28 of 57
Table 4-1. AGR-3/4 temperature matrix.
Capsule Peak Fuel Temperature (°C)(a, b)
Matrix Temperature (°C)(a, b, c)
Graphite Temperature (°C)(a, b, c)
Initial Sink Temperature (°C)(c, d)
12 900 825-830 800-810 675-635 11 1100 985-1000 830-845 680-700 10 1130-1105 980 920-930 665-650 9 1080-1010 880-865 800 640-650 8 1180-1110 980 895-905 590-600 7 1300 1080-1175 1020-1115 585-690 6 1100 880-940 790-870 610-700 5 1040-960 830-810 750 580-570 4 1100-1050 890-870 800 610-630 3 1250 1080-1100 1025-1050 690-700 2 1050-1020 910-890 850 660-670 1 950 885 825 680
Notes: a) Fuel temperature is controlled in Capsules 1, 3, 6, 7, 11 and 12 whereas graphite temperature is controlled in Capsules 2, 4, 5, 8, 9 and 10 (the matrix ring is replaced with graphite in Capsules 3, 8 and 10). Bold values are temperature specifications, other values result from calculations.
b) When temperature ranges are shown, the first number is the estimated temperature at the beginning of the irradiation and second number is the estimated temperature at end of the experiment.
c) Temperatures at the center of the ring.
d) The initial sink temperature is an acceptable range of temperatures for the center of the sink ring at the beginning of the irradiation.
Form 412.09 (Rev. 10)
Idaho National Laboratory
AGR-3/4 Irradiation Experiment Test Plan
Identifier: Revision: Effective Date:
PLN-3867
0
10/05/2011 Page: 29 of 57
Figure 4-2. Temperature radial distribution in Capsule 8 at BOL (top) and EOL (bottom).
Form 412.09 (Rev. 10)
Idaho National Laboratory
AGR-3/4 Irradiation Experiment Test Plan
Identifier: Revision: Effective Date:
PLN-3867
0
10/05/2011 Page: 30 of 57
4.3 Fuel Burnup
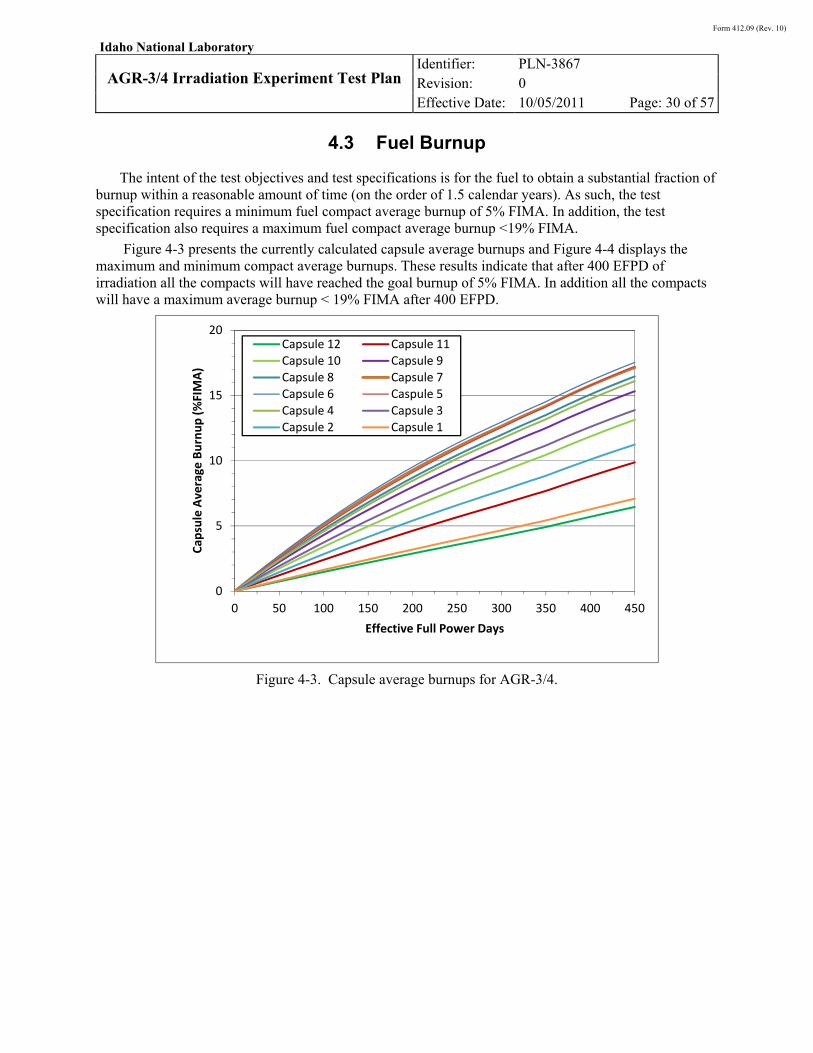
The intent of the test objectives and test specifications is for the fuel to obtain a substantial fraction of burnup within a reasonable amount of time (on the order of 1.5 calendar years). As such, the test specification requires a minimum fuel compact average burnup of 5% FIMA. In addition, the test specification also requires a maximum fuel compact average burnup <19% FIMA.
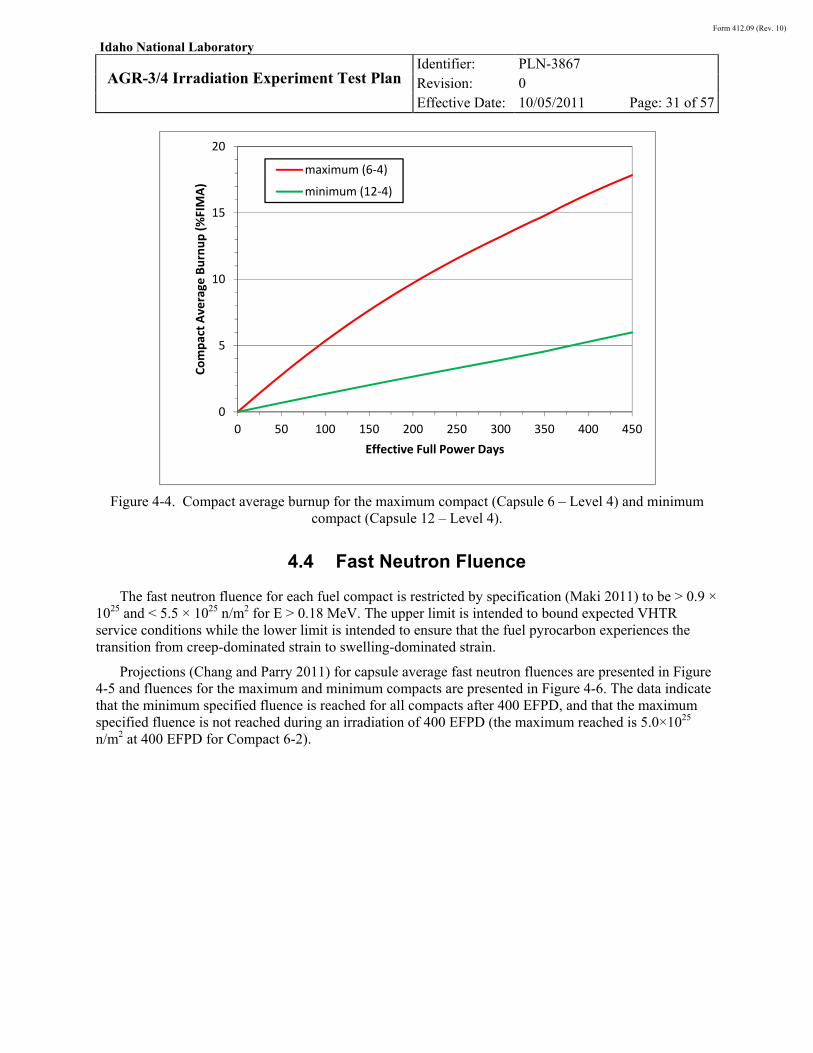
Figure 4-3 presents the currently calculated capsule average burnups and Figure 4-4 displays the maximum and minimum compact average burnups. These results indicate that after 400 EFPD of irradiation all the compacts will have reached the goal burnup of 5% FIMA. In addition all the compacts will have a maximum average burnup < 19% FIMA after 400 EFPD.
Figure 4-3. Capsule average burnups for AGR-3/4.
0
5
10
15
20
0 50 100 150 200 250 300 350 400 450
Cap
sule Average
Burnup (%FIMA)
Effective Full Power Days
Capsule 12 Capsule 11Capsule 10 Capsule 9Capsule 8 Capsule 7Capsule 6 Caspule 5
Capsule 4 Capsule 3Capsule 2 Capsule 1
Form 412.09 (Rev. 10)
Idaho National Laboratory
AGR-3/4 Irradiation Experiment Test Plan
Identifier: Revision: Effective Date:
PLN-3867
0
10/05/2011 Page: 31 of 57
Figure 4-4. Compact average burnup for the maximum compact (Capsule 6 – Level 4) and minimum compact (Capsule 12 – Level 4).
4.4 Fast Neutron Fluence
The fast neutron fluence for each fuel compact is restricted by specification (Maki 2011) to be > 0.9 × 1025 and < 5.5 × 1025 n/m2 for E > 0.18 MeV. The upper limit is intended to bound expected VHTR service conditions while the lower limit is intended to ensure that the fuel pyrocarbon experiences the transition from creep-dominated strain to swelling-dominated strain.
Projections (Chang and Parry 2011) for capsule average fast neutron fluences are presented in Figure 4-5 and fluences for the maximum and minimum compacts are presented in Figure 4-6. The data indicate that the minimum specified fluence is reached for all compacts after 400 EFPD, and that the maximum specified fluence is not reached during an irradiation of 400 EFPD (the maximum reached is 5.0×1025 n/m2 at 400 EFPD for Compact 6-2).
0
5
10
15
20
0 50 100 150 200 250 300 350 400 450
Compact Average
Burnup (%FIMA)
Effective Full Power Days
maximum (6‐4)
minimum (12‐4)

Form 412.09 (Rev. 10)
Idaho National Laboratory
AGR-3/4 Irradiation Experiment Test Plan
Identifier: Revision: Effective Date:
PLN-3867
0
10/05/2011 Page: 32 of 57
Figure 4-5. Capsule average fast neutron fluences for AGR-3/4.
Figure 4-6. Compact average fast neutron fluence for the maximum compact (Capsule 6 – Level 2) and minimum compact (Capsule 12 – Level 4).
0
1
2
3
4
5
6
0 50 100 150 200 250 300 350 400 450
Cap
sule Average
Fast Neutron Fluence
(10^25 n/m
2, E>0.18 M
eV)
Effective Full Power Days
Capsule 12 Capsule 11
Capsule 10 Capsule 9
Capsule 8 Capsule 7
Capsule 6 Caspule 5
Capsule 4 Capsule 3
Capsule 2 Capsule 1
0
1
2
3
4
5
6
0 50 100 150 200 250 300 350 400 450
Compact Average
Fast Neutron Fluence
(10^25 n/m
2, E>0.18 M
eV)
Effective Full Power Days
maximum (6‐2)
minimum (12‐4)
Form 412.09 (Rev. 10)
Idaho National Laboratory
AGR-3/4 Irradiation Experiment Test Plan
Identifier: Revision: Effective Date:
PLN-3867
0
10/05/2011 Page: 33 of 57
4.5 Irradiation Duration
The AGR-3/4 irradiation duration is scheduled to be 400 EFPD.
It is also constrained by the Technical Program Plan (Simonds 2010) assumption to limit the irradiation test acceleration to under three times that expected in a real-time VHTR irradiation, and by the test specifications (Maki 2011) for ancillary irradiation conditions. Since irradiating in a flux trap in the ATR assures test acceleration is under a factor of three, test duration is determined by evaluating the attributes of temperature, fast neutron fluence, and burnup. This approach must balance increasing duration with decreasing temperatures and increasing burnup and fast fluence.
A summary of the scheduled AGR-3/4 irradiation conditions and associated test specifications are presented in Table 4-2. As evident from the table, and discussed in Section 4.2, AGR-3/4 will have achieved the minimum specified burnup level of 5% FIMA well within two calendar years. Irradiation duration is scheduled to be 400 EFPD but it will ultimately depend on the ATR schedule. AGR-3/4 is planned for irradiation during 8 cycles of 50 EFPD but ATR constraints could result in shorter or longer cycles. The objective is to stop the irradiation around 400 EFPD as a shorter or longer irradiation could result in a violation of the test specifications. For instance, Figure 4-4 shows that some compacts will not have reached the minimum average burnup of 5% FIMA after 350 EFPD of irradiation. Conversely, Figure 4-6 shows that some compacts will have experienced a fluence higher than 5.5 × 1025 n/m2 after 450 EPFD of irradiation.
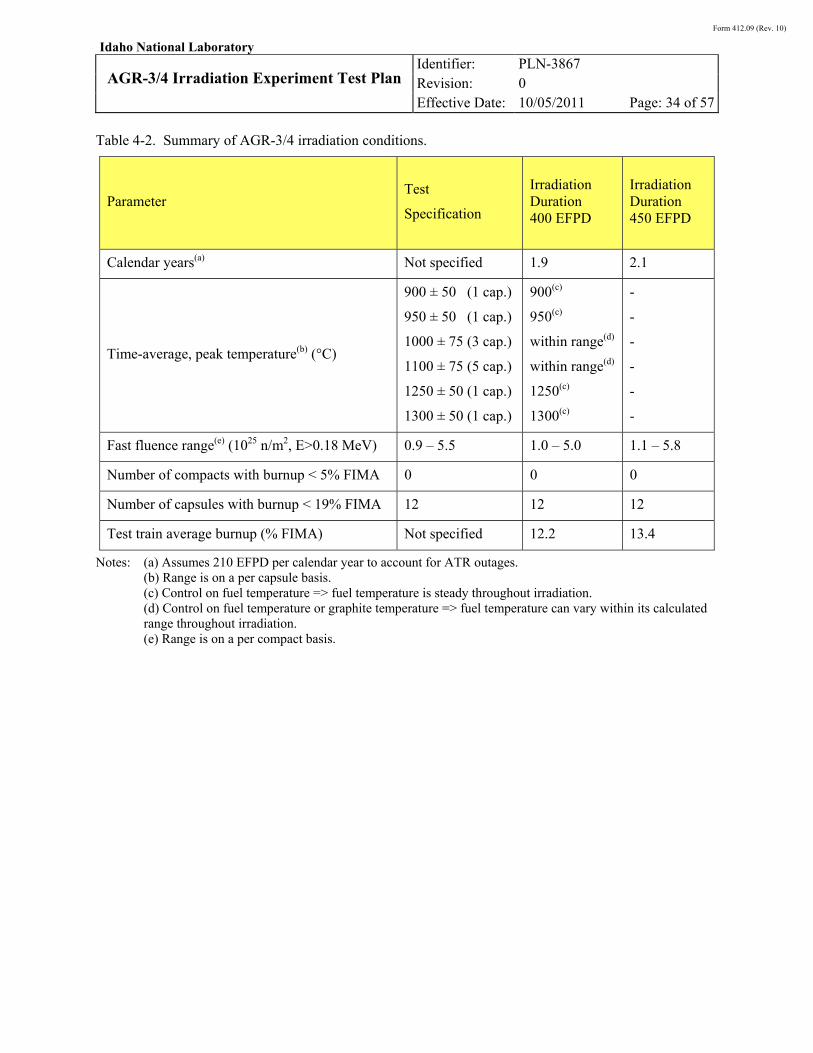
Form 412.09 (Rev. 10)
Idaho National Laboratory
AGR-3/4 Irradiation Experiment Test Plan
Identifier: Revision: Effective Date:
PLN-3867
0
10/05/2011 Page: 34 of 57
Table 4-2. Summary of AGR-3/4 irradiation conditions.
Parameter Test
Specification
Irradiation Duration 400 EFPD
Irradiation Duration 450 EFPD
Calendar years(a) Not specified 1.9 2.1
Time-average, peak temperature(b) (°C)
900 ± 50 (1 cap.)
950 ± 50 (1 cap.)
1000 ± 75 (3 cap.)
1100 ± 75 (5 cap.)
1250 ± 50 (1 cap.)
1300 ± 50 (1 cap.)
900(c)
950(c)
within range(d)
within range(d)
1250(c)
1300(c)
-
-
-
-
-
-
Fast fluence range(e) (1025 n/m2, E>0.18 MeV) 0.9 – 5.5 1.0 – 5.0 1.1 – 5.8
Number of compacts with burnup < 5% FIMA 0 0 0
Number of capsules with burnup < 19% FIMA 12 12 12
Test train average burnup (% FIMA) Not specified 12.2 13.4
Notes: (a) Assumes 210 EFPD per calendar year to account for ATR outages. (b) Range is on a per capsule basis. (c) Control on fuel temperature => fuel temperature is steady throughout irradiation. (d) Control on fuel temperature or graphite temperature => fuel temperature can vary within its calculated range throughout irradiation. (e) Range is on a per compact basis.
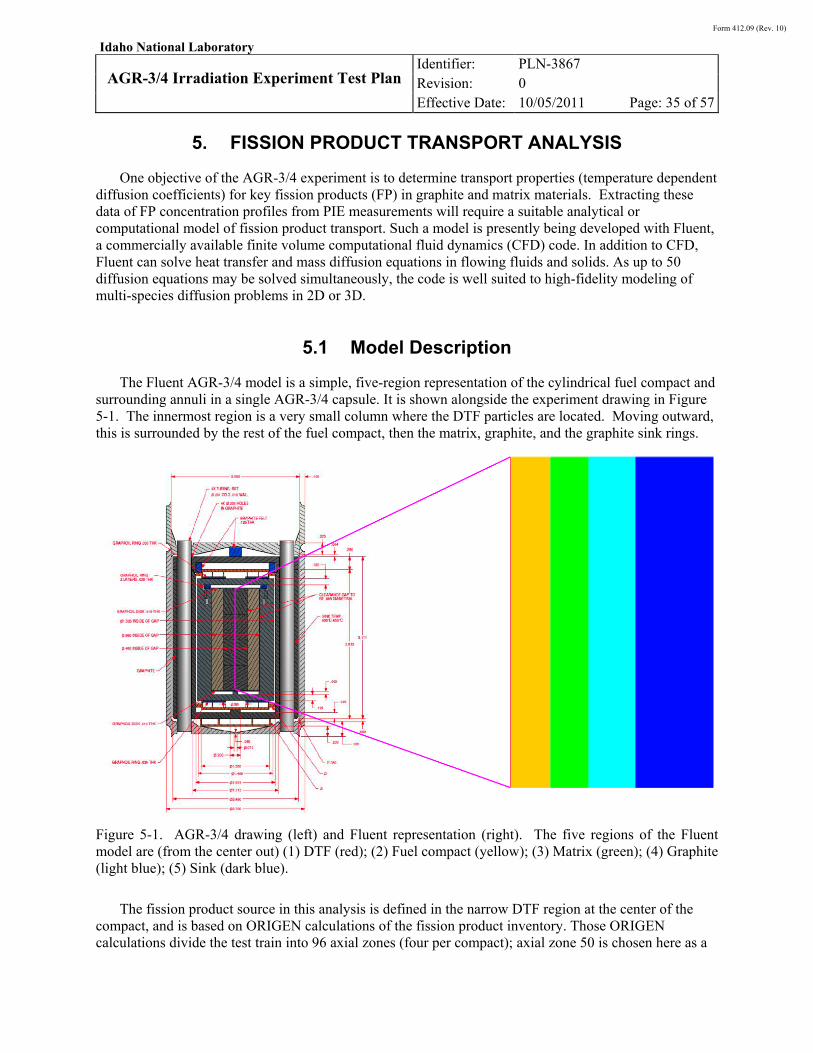
Form 412.09 (Rev. 10)
Idaho National Laboratory
AGR-3/4 Irradiation Experiment Test Plan
Identifier: Revision: Effective Date:
PLN-3867
0
10/05/2011 Page: 35 of 57
5. FISSION PRODUCT TRANSPORT ANALYSIS
One objective of the AGR-3/4 experiment is to determine transport properties (temperature dependent diffusion coefficients) for key fission products (FP) in graphite and matrix materials. Extracting these data of FP concentration profiles from PIE measurements will require a suitable analytical or computational model of fission product transport. Such a model is presently being developed with Fluent, a commercially available finite volume computational fluid dynamics (CFD) code. In addition to CFD, Fluent can solve heat transfer and mass diffusion equations in flowing fluids and solids. As up to 50 diffusion equations may be solved simultaneously, the code is well suited to high-fidelity modeling of multi-species diffusion problems in 2D or 3D.
5.1 Model Description
The Fluent AGR-3/4 model is a simple, five-region representation of the cylindrical fuel compact and surrounding annuli in a single AGR-3/4 capsule. It is shown alongside the experiment drawing in Figure 5-1. The innermost region is a very small column where the DTF particles are located. Moving outward, this is surrounded by the rest of the fuel compact, then the matrix, graphite, and the graphite sink rings.
Figure 5-1. AGR-3/4 drawing (left) and Fluent representation (right). The five regions of the Fluent model are (from the center out) (1) DTF (red); (2) Fuel compact (yellow); (3) Matrix (green); (4) Graphite (light blue); (5) Sink (dark blue).
The fission product source in this analysis is defined in the narrow DTF region at the center of the compact, and is based on ORIGEN calculations of the fission product inventory. Those ORIGEN calculations divide the test train into 96 axial zones (four per compact); axial zone 50 is chosen here as a
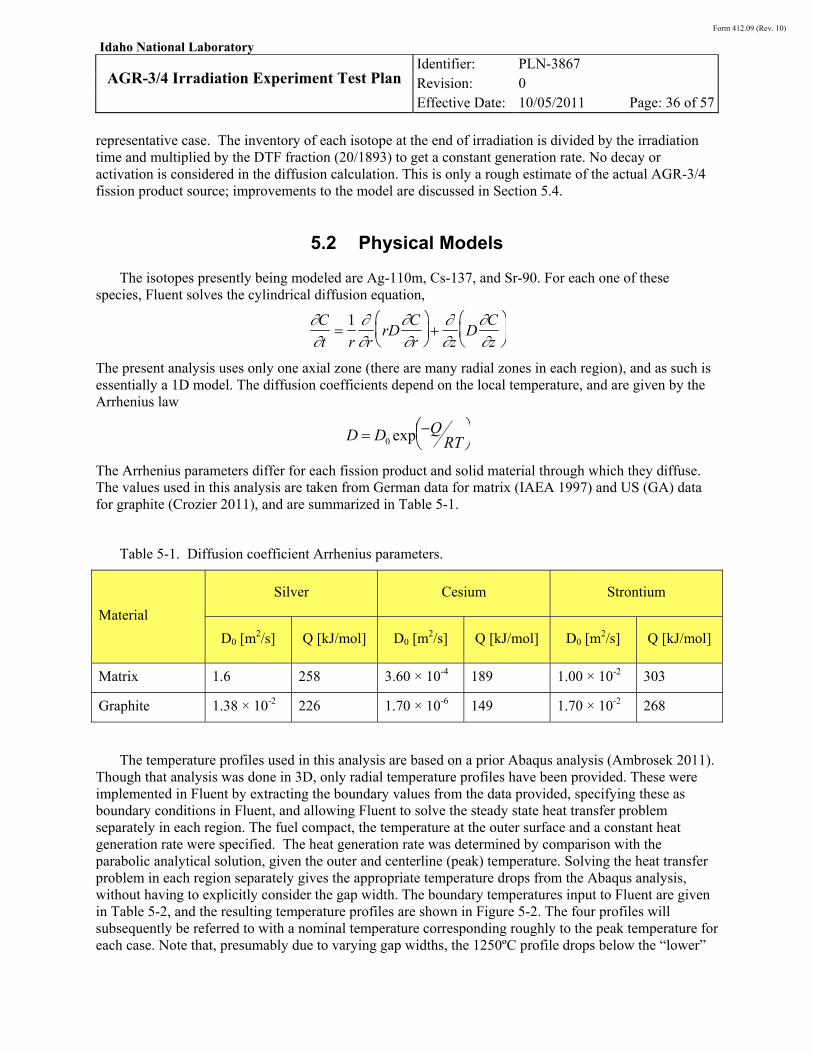
Form 412.09 (Rev. 10)
Idaho National Laboratory
AGR-3/4 Irradiation Experiment Test Plan
Identifier: Revision: Effective Date:
PLN-3867
0
10/05/2011 Page: 36 of 57
representative case. The inventory of each isotope at the end of irradiation is divided by the irradiation time and multiplied by the DTF fraction (20/1893) to get a constant generation rate. No decay or activation is considered in the diffusion calculation. This is only a rough estimate of the actual AGR-3/4 fission product source; improvements to the model are discussed in Section 5.4.
5.2 Physical Models
The isotopes presently being modeled are Ag-110m, Cs-137, and Sr-90. For each one of these species, Fluent solves the cylindrical diffusion equation,
C
t
1
r
r
rDC
r
z
DC
z
The present analysis uses only one axial zone (there are many radial zones in each region), and as such is essentially a 1D model. The diffusion coefficients depend on the local temperature, and are given by the Arrhenius law
D D0 exp QRT
The Arrhenius parameters differ for each fission product and solid material through which they diffuse. The values used in this analysis are taken from German data for matrix (IAEA 1997) and US (GA) data for graphite (Crozier 2011), and are summarized in Table 5-1.
Table 5-1. Diffusion coefficient Arrhenius parameters.
Material
Silver Cesium Strontium
D0 [m2/s] Q [kJ/mol] D0 [m
2/s] Q [kJ/mol] D0 [m2/s] Q [kJ/mol]
Matrix 1.6 258 3.60 × 10⁻⁴ 189 1.00 × 10⁻² 303
Graphite 1.38 × 10⁻² 226 1.70 × 10⁻⁶ 149 1.70 × 10⁻² 268
The temperature profiles used in this analysis are based on a prior Abaqus analysis (Ambrosek 2011). Though that analysis was done in 3D, only radial temperature profiles have been provided. These were implemented in Fluent by extracting the boundary values from the data provided, specifying these as boundary conditions in Fluent, and allowing Fluent to solve the steady state heat transfer problem separately in each region. The fuel compact, the temperature at the outer surface and a constant heat generation rate were specified. The heat generation rate was determined by comparison with the parabolic analytical solution, given the outer and centerline (peak) temperature. Solving the heat transfer problem in each region separately gives the appropriate temperature drops from the Abaqus analysis, without having to explicitly consider the gap width. The boundary temperatures input to Fluent are given in Table 5-2, and the resulting temperature profiles are shown in Figure 5-2. The four profiles will subsequently be referred to with a nominal temperature corresponding roughly to the peak temperature for each case. Note that, presumably due to varying gap widths, the 1250ºC profile drops below the “lower”
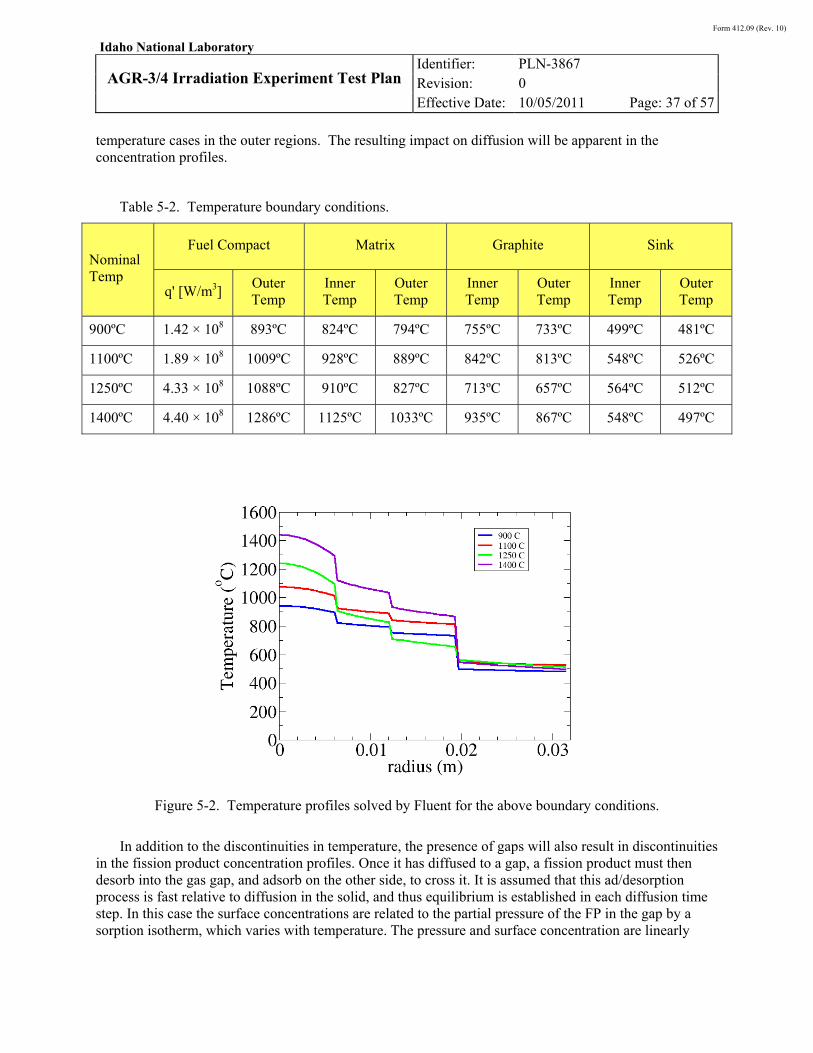
Form 412.09 (Rev. 10)
Idaho National Laboratory
AGR-3/4 Irradiation Experiment Test Plan
Identifier: Revision: Effective Date:
PLN-3867
0
10/05/2011 Page: 37 of 57
temperature cases in the outer regions. The resulting impact on diffusion will be apparent in the concentration profiles.
Table 5-2. Temperature boundary conditions.
Nominal Temp
Fuel Compact Matrix Graphite Sink
q' [W/m3] Outer Temp
Inner Temp
Outer Temp
Inner Temp
Outer Temp
Inner Temp
Outer Temp
900ºC 1.42 × 10⁸ 893ºC 824ºC 794ºC 755ºC 733ºC 499ºC 481ºC
1100ºC 1.89 × 10⁸ 1009ºC 928ºC 889ºC 842ºC 813ºC 548ºC 526ºC
1250ºC 4.33 × 10⁸ 1088ºC 910ºC 827ºC 713ºC 657ºC 564ºC 512ºC
1400ºC 4.40 × 10⁸ 1286ºC 1125ºC 1033ºC 935ºC 867ºC 548ºC 497ºC
Figure 5-2. Temperature profiles solved by Fluent for the above boundary conditions.
In addition to the discontinuities in temperature, the presence of gaps will also result in discontinuities in the fission product concentration profiles. Once it has diffused to a gap, a fission product must then desorb into the gas gap, and adsorb on the other side, to cross it. It is assumed that this ad/desorption process is fast relative to diffusion in the solid, and thus equilibrium is established in each diffusion time step. In this case the surface concentrations are related to the partial pressure of the FP in the gap by a sorption isotherm, which varies with temperature. The pressure and surface concentration are linearly
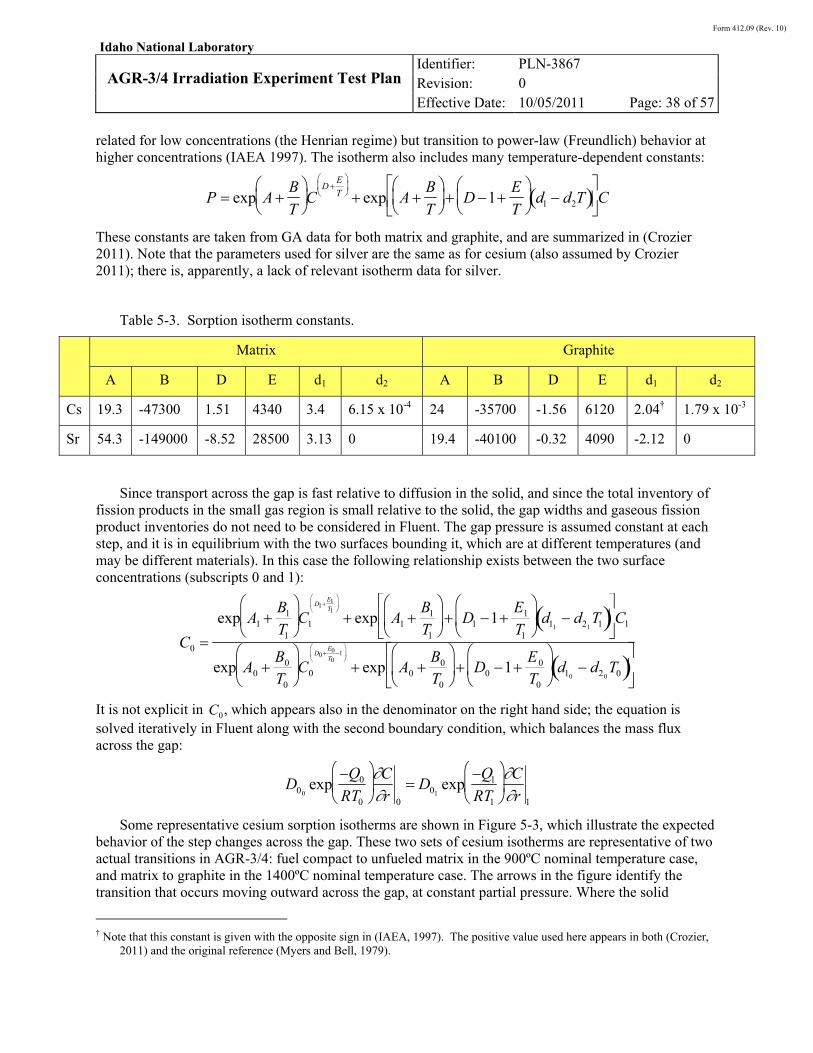
Form 412.09 (Rev. 10)
Idaho National Laboratory
AGR-3/4 Irradiation Experiment Test Plan
Identifier: Revision: Effective Date:
PLN-3867
0
10/05/2011 Page: 38 of 57
related for low concentrations (the Henrian regime) but transition to power-law (Freundlich) behavior at higher concentrations (IAEA 1997). The isotherm also includes many temperature-dependent constants:
P exp A B
T
C
DE
T
exp A
B
T
D 1
E
T
d1 d2T
C
These constants are taken from GA data for both matrix and graphite, and are summarized in (Crozier 2011). Note that the parameters used for silver are the same as for cesium (also assumed by Crozier 2011); there is, apparently, a lack of relevant isotherm data for silver.
Table 5-3. Sorption isotherm constants.
Matrix Graphite
A B D E d1 d2 A B D E d1 d2
Cs 19.3 -47300 1.51 4340 3.4 6.15 x 10⁻⁴ 24 -35700 -1.56 6120 2.04† 1.79 x 10⁻³
Sr 54.3 -149000 -8.52 28500 3.13 0 19.4 -40100 -0.32 4090 -2.12 0
Since transport across the gap is fast relative to diffusion in the solid, and since the total inventory of fission products in the small gas region is small relative to the solid, the gap widths and gaseous fission product inventories do not need to be considered in Fluent. The gap pressure is assumed constant at each step, and it is in equilibrium with the two surfaces bounding it, which are at different temperatures (and may be different materials). In this case the following relationship exists between the two surface concentrations (subscripts 0 and 1):
C0
exp A1 B1
T1
C1
D1E1T1
exp A1 B1
T1
D1 1
E1
T1
d11
d21T1
C1
exp A0 B0
T0
C0
D0E0T0
1
exp A0 B0
T0
D0 1
E0
T0
d10
d20T0
It is not explicit in C0, which appears also in the denominator on the right hand side; the equation is solved iteratively in Fluent along with the second boundary condition, which balances the mass flux across the gap:
D00exp
Q0
RT0
C
r 0
D01exp
Q1
RT1
C
r 1
Some representative cesium sorption isotherms are shown in Figure 5-3, which illustrate the expected behavior of the step changes across the gap. These two sets of cesium isotherms are representative of two actual transitions in AGR-3/4: fuel compact to unfueled matrix in the 900ºC nominal temperature case, and matrix to graphite in the 1400ºC nominal temperature case. The arrows in the figure identify the transition that occurs moving outward across the gap, at constant partial pressure. Where the solid
† Note that this constant is given with the opposite sign in (IAEA, 1997). The positive value used here appears in both (Crozier,
2011) and the original reference (Myers and Bell, 1979).
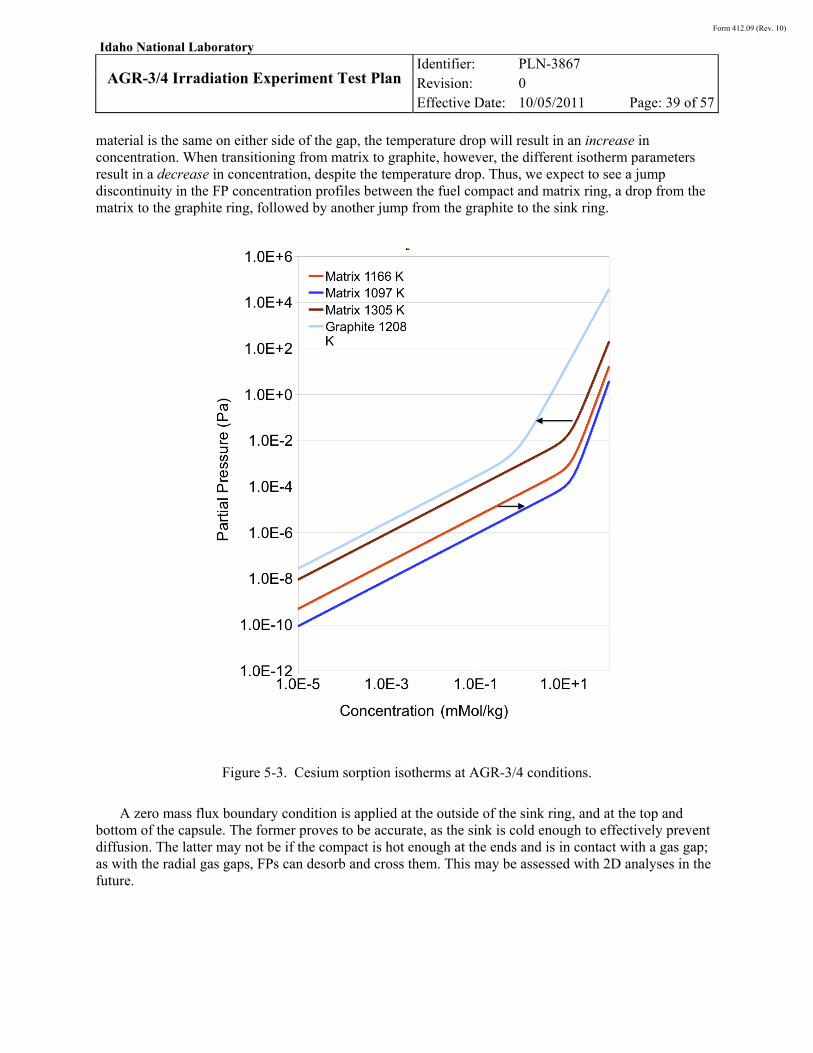
Form 412.09 (Rev. 10)
Idaho National Laboratory
AGR-3/4 Irradiation Experiment Test Plan
Identifier: Revision: Effective Date:
PLN-3867
0
10/05/2011 Page: 39 of 57
material is the same on either side of the gap, the temperature drop will result in an increase in concentration. When transitioning from matrix to graphite, however, the different isotherm parameters result in a decrease in concentration, despite the temperature drop. Thus, we expect to see a jump discontinuity in the FP concentration profiles between the fuel compact and matrix ring, a drop from the matrix to the graphite ring, followed by another jump from the graphite to the sink ring.
Figure 5-3. Cesium sorption isotherms at AGR-3/4 conditions.
A zero mass flux boundary condition is applied at the outside of the sink ring, and at the top and bottom of the capsule. The former proves to be accurate, as the sink is cold enough to effectively prevent diffusion. The latter may not be if the compact is hot enough at the ends and is in contact with a gas gap; as with the radial gas gaps, FPs can desorb and cross them. This may be assessed with 2D analyses in the future.
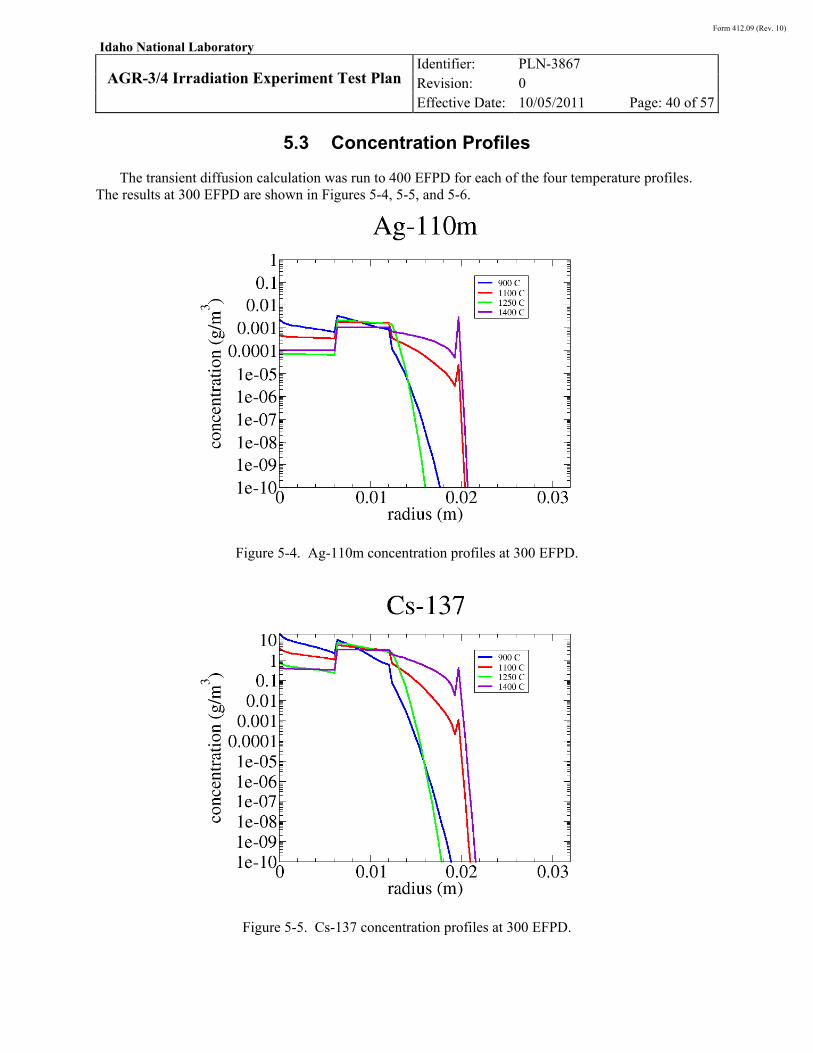
Form 412.09 (Rev. 10)
Idaho National Laboratory
AGR-3/4 Irradiation Experiment Test Plan
Identifier: Revision: Effective Date:
PLN-3867
0
10/05/2011 Page: 40 of 57
5.3 Concentration Profiles
The transient diffusion calculation was run to 400 EFPD for each of the four temperature profiles. The results at 300 EFPD are shown in Figures 5-4, 5-5, and 5-6.
Figure 5-4. Ag-110m concentration profiles at 300 EFPD.
Figure 5-5. Cs-137 concentration profiles at 300 EFPD.
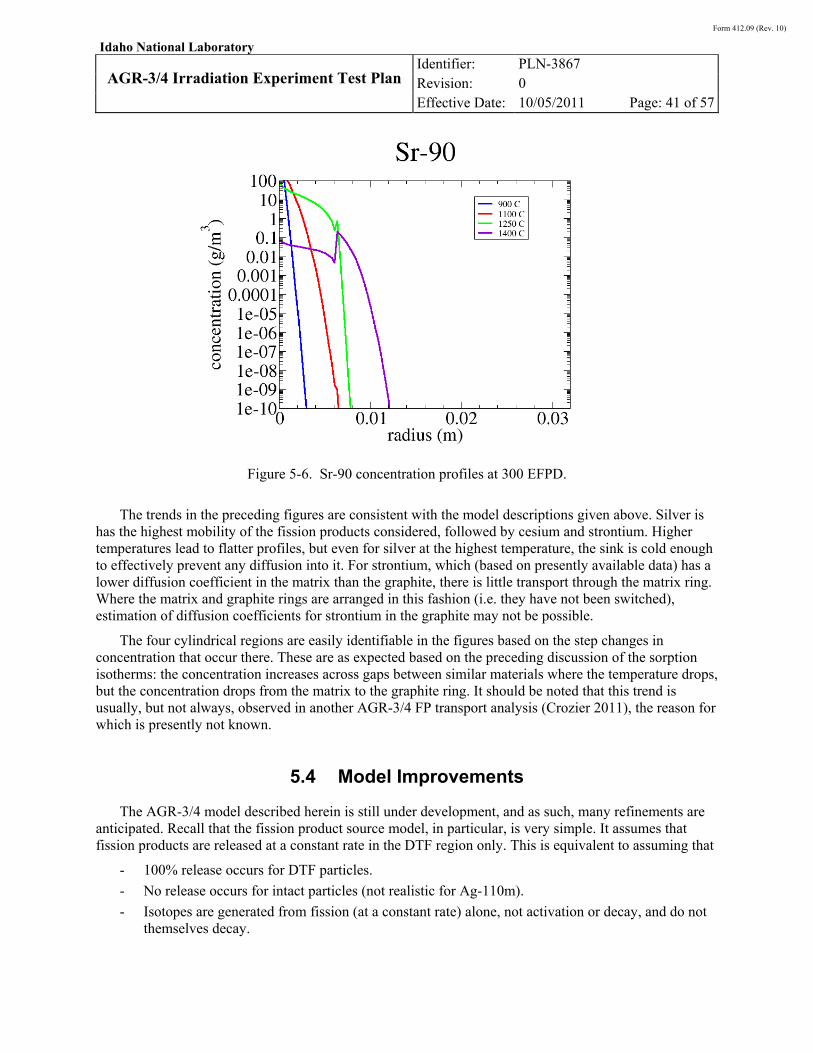
Form 412.09 (Rev. 10)
Idaho National Laboratory
AGR-3/4 Irradiation Experiment Test Plan
Identifier: Revision: Effective Date:
PLN-3867
0
10/05/2011 Page: 41 of 57
Figure 5-6. Sr-90 concentration profiles at 300 EFPD.
The trends in the preceding figures are consistent with the model descriptions given above. Silver is has the highest mobility of the fission products considered, followed by cesium and strontium. Higher temperatures lead to flatter profiles, but even for silver at the highest temperature, the sink is cold enough to effectively prevent any diffusion into it. For strontium, which (based on presently available data) has a lower diffusion coefficient in the matrix than the graphite, there is little transport through the matrix ring. Where the matrix and graphite rings are arranged in this fashion (i.e. they have not been switched), estimation of diffusion coefficients for strontium in the graphite may not be possible.
The four cylindrical regions are easily identifiable in the figures based on the step changes in concentration that occur there. These are as expected based on the preceding discussion of the sorption isotherms: the concentration increases across gaps between similar materials where the temperature drops, but the concentration drops from the matrix to the graphite ring. It should be noted that this trend is usually, but not always, observed in another AGR-3/4 FP transport analysis (Crozier 2011), the reason for which is presently not known.
5.4 Model Improvements
The AGR-3/4 model described herein is still under development, and as such, many refinements are anticipated. Recall that the fission product source model, in particular, is very simple. It assumes that fission products are released at a constant rate in the DTF region only. This is equivalent to assuming that
- 100% release occurs for DTF particles.
- No release occurs for intact particles (not realistic for Ag-110m).
- Isotopes are generated from fission (at a constant rate) alone, not activation or decay, and do not themselves decay.
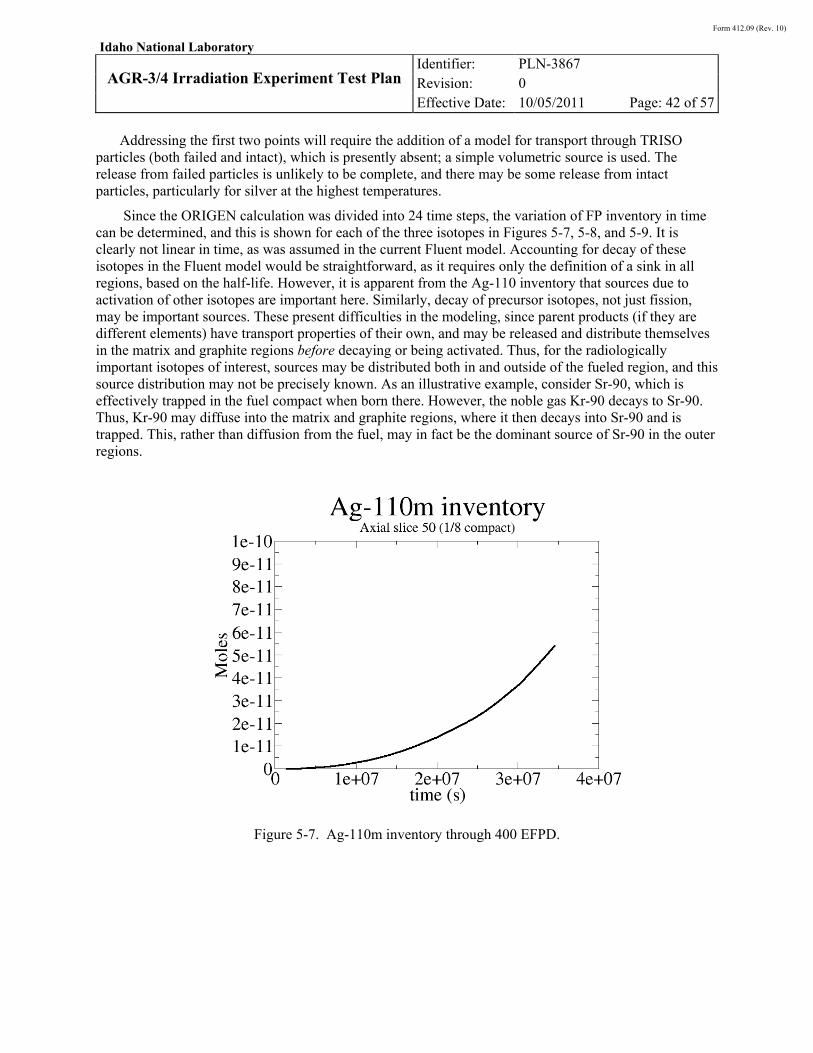
Form 412.09 (Rev. 10)
Idaho National Laboratory
AGR-3/4 Irradiation Experiment Test Plan
Identifier: Revision: Effective Date:
PLN-3867
0
10/05/2011 Page: 42 of 57
Addressing the first two points will require the addition of a model for transport through TRISO particles (both failed and intact), which is presently absent; a simple volumetric source is used. The release from failed particles is unlikely to be complete, and there may be some release from intact particles, particularly for silver at the highest temperatures.
Since the ORIGEN calculation was divided into 24 time steps, the variation of FP inventory in time can be determined, and this is shown for each of the three isotopes in Figures 5-7, 5-8, and 5-9. It is clearly not linear in time, as was assumed in the current Fluent model. Accounting for decay of these isotopes in the Fluent model would be straightforward, as it requires only the definition of a sink in all regions, based on the half-life. However, it is apparent from the Ag-110 inventory that sources due to activation of other isotopes are important here. Similarly, decay of precursor isotopes, not just fission, may be important sources. These present difficulties in the modeling, since parent products (if they are different elements) have transport properties of their own, and may be released and distribute themselves in the matrix and graphite regions before decaying or being activated. Thus, for the radiologically important isotopes of interest, sources may be distributed both in and outside of the fueled region, and this source distribution may not be precisely known. As an illustrative example, consider Sr-90, which is effectively trapped in the fuel compact when born there. However, the noble gas Kr-90 decays to Sr-90. Thus, Kr-90 may diffuse into the matrix and graphite regions, where it then decays into Sr-90 and is trapped. This, rather than diffusion from the fuel, may in fact be the dominant source of Sr-90 in the outer regions.
Figure 5-7. Ag-110m inventory through 400 EFPD.
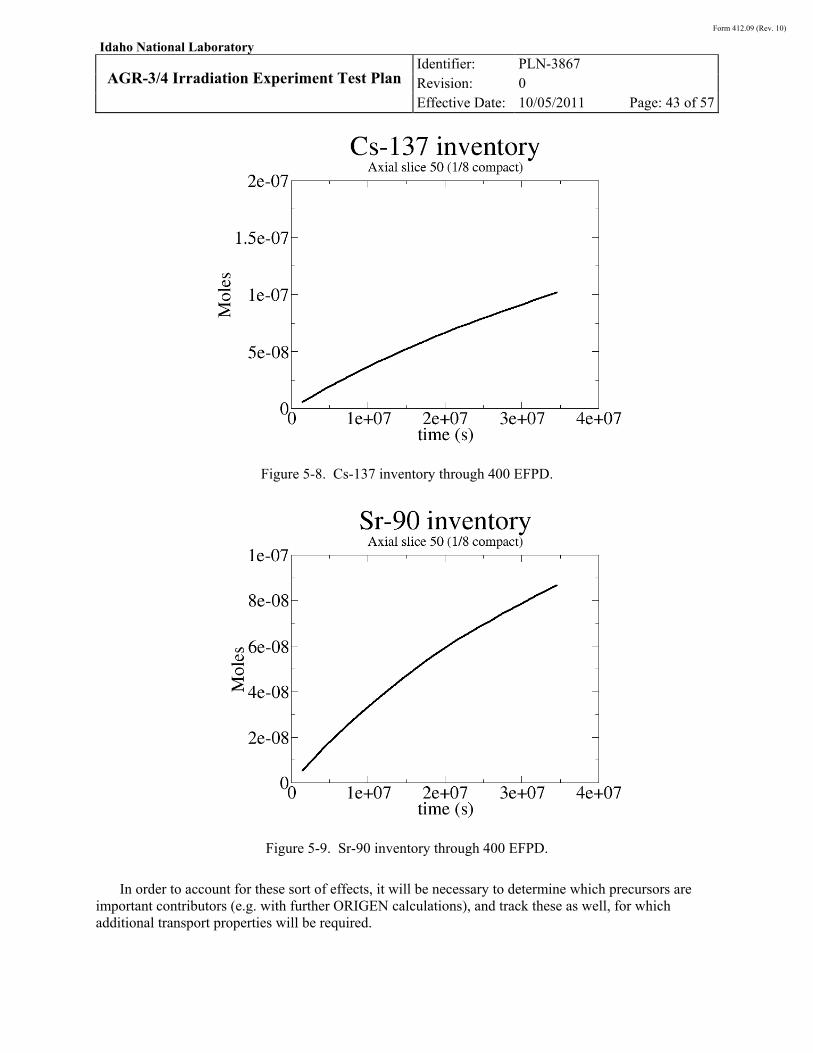
Form 412.09 (Rev. 10)
Idaho National Laboratory
AGR-3/4 Irradiation Experiment Test Plan
Identifier: Revision: Effective Date:
PLN-3867
0
10/05/2011 Page: 43 of 57
Figure 5-8. Cs-137 inventory through 400 EFPD.
Figure 5-9. Sr-90 inventory through 400 EFPD.
In order to account for these sort of effects, it will be necessary to determine which precursors are important contributors (e.g. with further ORIGEN calculations), and track these as well, for which additional transport properties will be required.
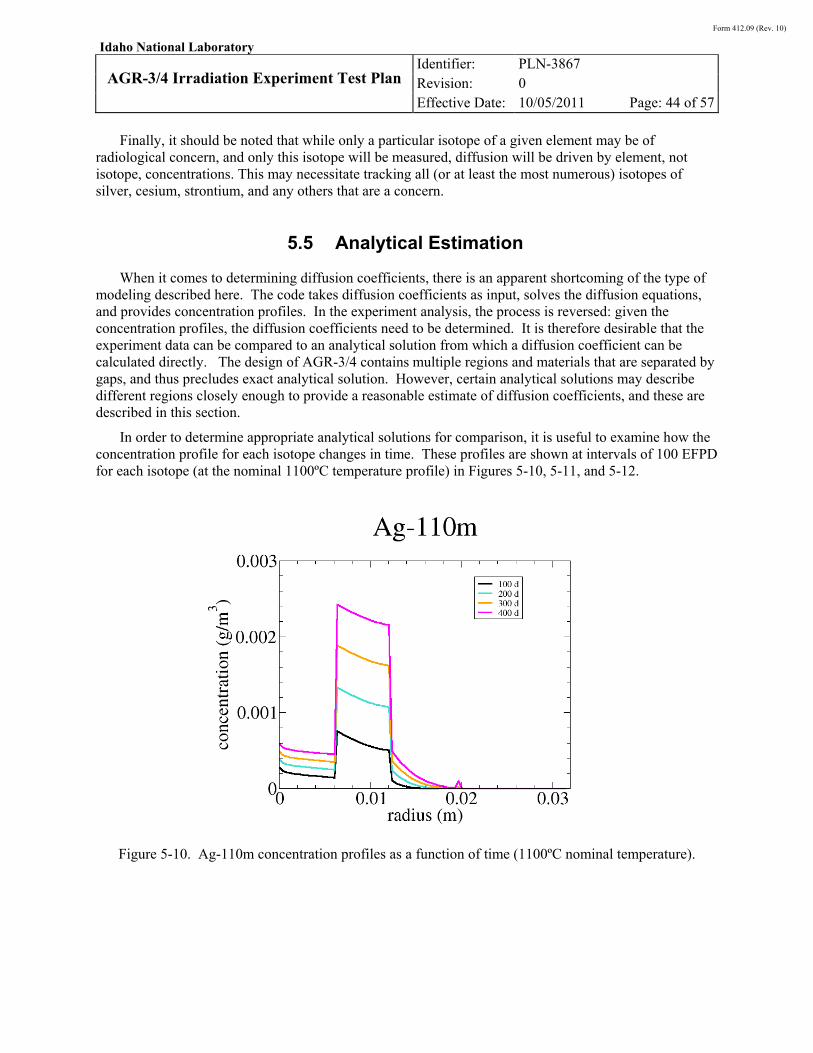
Form 412.09 (Rev. 10)
Idaho National Laboratory
AGR-3/4 Irradiation Experiment Test Plan
Identifier: Revision: Effective Date:
PLN-3867
0
10/05/2011 Page: 44 of 57
Finally, it should be noted that while only a particular isotope of a given element may be of radiological concern, and only this isotope will be measured, diffusion will be driven by element, not isotope, concentrations. This may necessitate tracking all (or at least the most numerous) isotopes of silver, cesium, strontium, and any others that are a concern.
5.5 Analytical Estimation
When it comes to determining diffusion coefficients, there is an apparent shortcoming of the type of modeling described here. The code takes diffusion coefficients as input, solves the diffusion equations, and provides concentration profiles. In the experiment analysis, the process is reversed: given the concentration profiles, the diffusion coefficients need to be determined. It is therefore desirable that the experiment data can be compared to an analytical solution from which a diffusion coefficient can be calculated directly. The design of AGR-3/4 contains multiple regions and materials that are separated by gaps, and thus precludes exact analytical solution. However, certain analytical solutions may describe different regions closely enough to provide a reasonable estimate of diffusion coefficients, and these are described in this section.
In order to determine appropriate analytical solutions for comparison, it is useful to examine how the concentration profile for each isotope changes in time. These profiles are shown at intervals of 100 EFPD for each isotope (at the nominal 1100ºC temperature profile) in Figures 5-10, 5-11, and 5-12.
Figure 5-10. Ag-110m concentration profiles as a function of time (1100ºC nominal temperature).
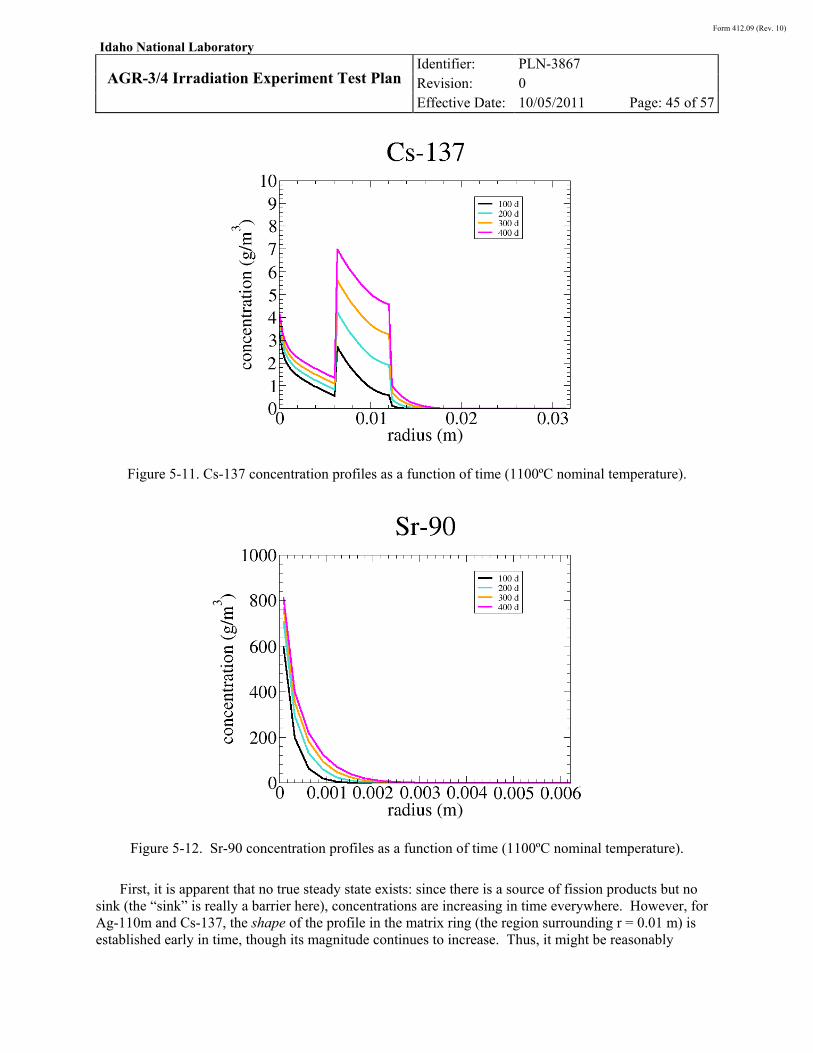
Form 412.09 (Rev. 10)
Idaho National Laboratory
AGR-3/4 Irradiation Experiment Test Plan
Identifier: Revision: Effective Date:
PLN-3867
0
10/05/2011 Page: 45 of 57
Figure 5-11. Cs-137 concentration profiles as a function of time (1100ºC nominal temperature).
Figure 5-12. Sr-90 concentration profiles as a function of time (1100ºC nominal temperature).
First, it is apparent that no true steady state exists: since there is a source of fission products but no sink (the “sink” is really a barrier here), concentrations are increasing in time everywhere. However, for Ag-110m and Cs-137, the shape of the profile in the matrix ring (the region surrounding r = 0.01 m) is established early in time, though its magnitude continues to increase. Thus, it might be reasonably
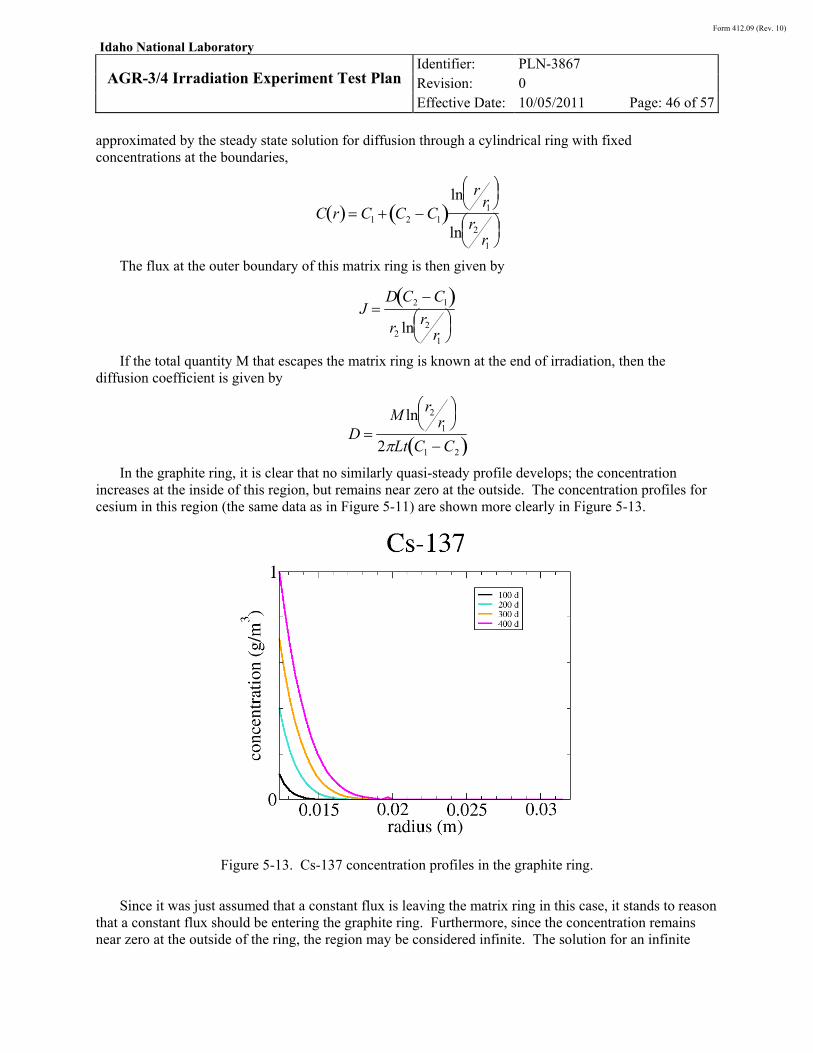
Form 412.09 (Rev. 10)
Idaho National Laboratory
AGR-3/4 Irradiation Experiment Test Plan
Identifier: Revision: Effective Date:
PLN-3867
0
10/05/2011 Page: 46 of 57
approximated by the steady state solution for diffusion through a cylindrical ring with fixed concentrations at the boundaries,
C r C1 C2 C1 ln r
r1
ln r2r1
The flux at the outer boundary of this matrix ring is then given by
J D C2 C1 r2 ln r2
r1
If the total quantity M that escapes the matrix ring is known at the end of irradiation, then the diffusion coefficient is given by
D M ln r2
r1
2Lt C1 C2
In the graphite ring, it is clear that no similarly quasi-steady profile develops; the concentration increases at the inside of this region, but remains near zero at the outside. The concentration profiles for cesium in this region (the same data as in Figure 5-11) are shown more clearly in Figure 5-13.
Figure 5-13. Cs-137 concentration profiles in the graphite ring.
Since it was just assumed that a constant flux is leaving the matrix ring in this case, it stands to reason that a constant flux should be entering the graphite ring. Furthermore, since the concentration remains near zero at the outside of the ring, the region may be considered infinite. The solution for an infinite
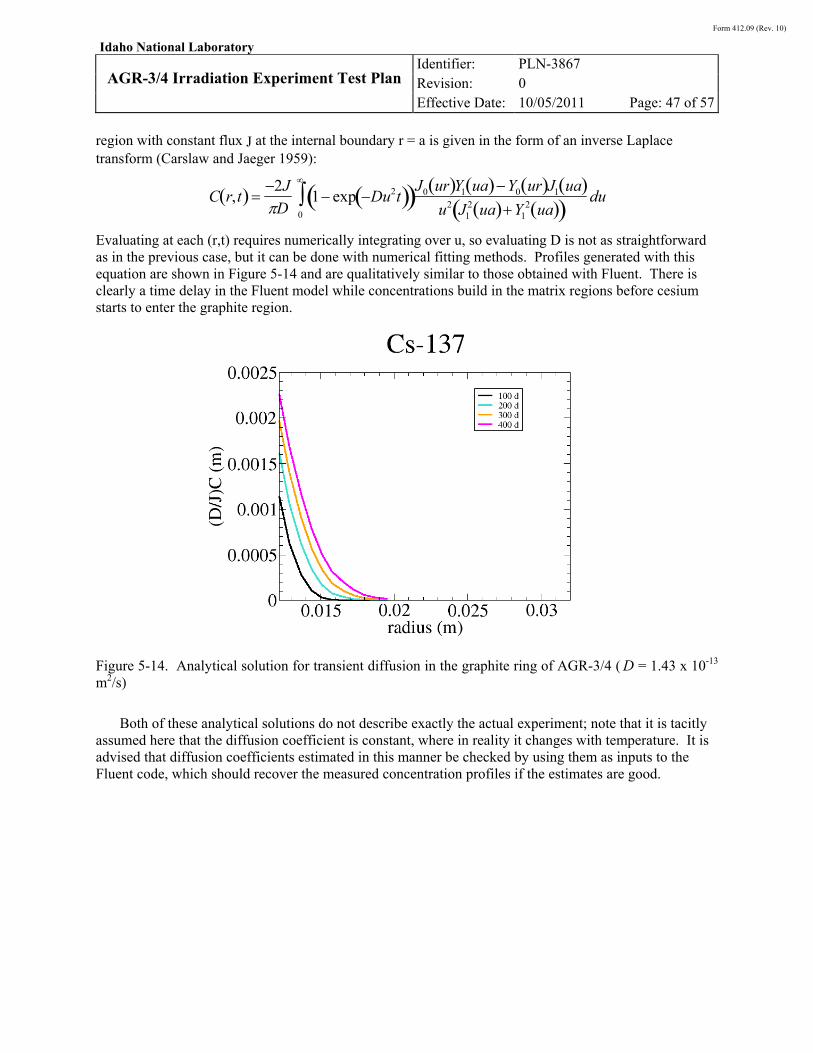
Form 412.09 (Rev. 10)
Idaho National Laboratory
AGR-3/4 Irradiation Experiment Test Plan
Identifier: Revision: Effective Date:
PLN-3867
0
10/05/2011 Page: 47 of 57
region with constant flux J at the internal boundary r = a is given in the form of an inverse Laplace transform (Carslaw and Jaeger 1959):
C r,t 2J
D1 exp Du2t
0
J0 ur Y1 ua Y0 ur J1 ua u2 J1
2 ua Y12 ua du
Evaluating at each (r,t) requires numerically integrating over u, so evaluating D is not as straightforward as in the previous case, but it can be done with numerical fitting methods. Profiles generated with this equation are shown in Figure 5-14 and are qualitatively similar to those obtained with Fluent. There is clearly a time delay in the Fluent model while concentrations build in the matrix regions before cesium starts to enter the graphite region.
Figure 5-14. Analytical solution for transient diffusion in the graphite ring of AGR-3/4 ( D = 1.43 x 10⁻¹³ m2/s)
Both of these analytical solutions do not describe exactly the actual experiment; note that it is tacitly assumed here that the diffusion coefficient is constant, where in reality it changes with temperature. It is advised that diffusion coefficients estimated in this manner be checked by using them as inputs to the Fluent code, which should recover the measured concentration profiles if the estimates are good.
Form 412.09 (Rev. 10)
Idaho National Laboratory
AGR-3/4 Irradiation Experiment Test Plan
Identifier: Revision: Effective Date:
PLN-3867
0
10/05/2011 Page: 48 of 57
6. MEASUREMENT REQUIREMENTS
Several measurements are needed to demonstrate that the AGR-3/4 has reached the irradiation condition goals and test specifications. These conditions include time-average peak temperature, time-average volume-average temperature, fuel burnup, fast neutron fluence, and fission gas release. Because the fuel compacts cannot be directly instrumented (which may induce particle failures), burnup, neutron fluence, and fuel temperature will be determined by calculations that require supporting measurement data. Each of these measurement categories are discussed below.
6.1 Neutron Dosimetry
Both thermal and fast neutron fluence measurements will be made for the AGR-3/4 experiment. The purpose of these measurements is to provide neutron exposure data that will support the calculations of the average burnup, fast neutron fluence and fission product inventory of each compact. This support may consist of a set of point values used to normalize physics calculations.
Following irradiation and test train disassembly, the encapsulated flux wires, described in Section 3.4, will be removed from each capsule. After removal from the encapsulation, the flux wires will be prepared and counted for their neutron induced radionuclide activities. Counting uncertainties will stay within specified limits of ± 10%. Data collected from the neutron monitors will be corrected for decay according to standard procedures. Derived fast neutron fluence data will be further corrected to energies greater than 0.18 MeV. At all times, identification information (monitor type, serial number or similar code, original test train location) will remain with each neutron monitor.
6.2 ATR Parameters
ATR data that describes the core neutronic and thermal-hydraulic environment will be required. These data will be used to assist physics analysis (to calculate fuel burnup, heat generation rates and fast neutron fluences), assist thermal analysis (to calculate compact temperatures), and support temperature control.
The ATR is a light water moderated 93% enriched uranium fueled test reactor. As shown in Figure 2-1, the fueled core is arranged in a four-lobe clover leaf configuration. Each of the four corner lobes can be controlled at different powers to match the requirements of various in-pile experiments. ATR is rated at a total thermal power of 250 MW, however the reactor is normally operated in the range of 105 to 115 MW to meet most experiment needs.
ATR data that will be provided include individual lobe powers, shim cylinder positions, and core inlet temperatures. These data are recorded, and backed up on a separate storage device, once every minute.
6.3 Temperature Measurements
Temperature measurements will be performed by TCs terminating within the matrix or sink rings of each capsule. These measurements will support thermal analyses of the test train, which ultimately will determine fuel temperatures, and will also support temperature control of the experiment. For this function, one TC per capsule is designated as the control TC. Measurements from the control TCs provide
Form 412.09 (Rev. 10)
Idaho National Laboratory
AGR-3/4 Irradiation Experiment Test Plan
Identifier: Revision: Effective Date:
PLN-3867
0
10/05/2011 Page: 49 of 57
feedback to the automated sweep gas control system, which adjusts gas blend to maintain reference temperatures.
AGR-3/4 TCs have an-installed accuracy of at least ± 2% of reading as required by the test specification. During normal and abnormal operation, TC data are recorded and backed up on a separate storage device, once every minute.
6.4 Sweep Gas Parameters
In addition to the TC measurements, several sweep gas parameters are required for thermal analyses and temperature control. These include pressure, mass flow rates of each constituent gas, and moisture content. Sweep gas pressures and constituent mass flow rates (which determine gas mixture ratios) will be used in physics and thermal analyses of the test train. Moisture content measurements (measured on the outlet side of the capsule and compared to the gas supply verification measurement) provide indicators of capsule integrity.
Capsule inlet pressure is measured to within ± 0.007 MPa (± 1 psi) with constituent mass flow rates measured within 1% RMS (root mean square). Moisture data are converted to ppm-vol (parts per million by volume) relative to 15 psi. These data are recorded, and backed up on a separate storage device, once every minute.
6.5 Fission Gas Release Monitoring
Fission gas release measurements provide indicators of fuel irradiation performance. Gross radiation monitors continuously measure the sweep gas from each capsule to indicate fuel particle failures. Spectrometer detectors measure radionuclide concentrations to determine R/B ratios of selected nuclides. R/B values provide indicators of initial fuel quality and also provide indications of fuel failure.
The gross radiation monitors have sufficient sensitivity to detect every fuel particle failure up to and including the first 250 failures from each capsule. These fuel particle failures are indicated by a rapid rise and drop, or spike, in the measured count rate. Such spikes are a result of a sudden release of stored fission product inventory. Measured spectra are automatically stored and backed up.
The spectrometer detector systems measure the concentrations of various krypton and xenon isotopes in the sweep gas from each capsule. During normal operation, 8-hour counting intervals are used to measure the concentrations of Kr-85m, Kr-87, Kr-88, Kr-89, Kr-90, Xe-131m, Xe-133, Xe-135, Xe-135m, Xe-137, Xe-138, and Xe-139. These concentrations are converted to fuel release rates, which with calculated birth rates will be used to determine R/B ratios. Measured spectra are automatically stored and backed up.
During reactor outages, the capsules are swept with pure helium-4. This sweep gas is analyzed for Xe-133 and Xe-135. These xenon concentrations are used to calculate concentrations of their parent iodine isotopes. Presence of the fission product iodine is also an indicator of fuel performance.
6.6 Data Validation and Qualification
Measured data are evaluated for validation and then qualified for use. The NGNP Data Management and Analysis System (NDMAS) processes the data for this purpose. The following parameters are

Form 412.09 (Rev. 10)
Idaho National Laboratory
AGR-3/4 Irradiation Experiment Test Plan
Identifier: Revision: Effective Date:
PLN-3867
0
10/05/2011 Page: 50 of 57
captured and processed by NDMAS: fuel irradiation data (TC readings, sweep gas compositions, flow rates and pressures, and moisture monitor readings), FPMS data (isotopic release data and gross gamma counts), and ATR operating conditions data (lobe powers, control cylinder positions, neck shim positions, and control rod positions).
Form 412.09 (Rev. 10)
Idaho National Laboratory
AGR-3/4 Irradiation Experiment Test Plan
Identifier: Revision: Effective Date:
PLN-3867
0
10/05/2011 Page: 51 of 57
7. OPERATIONAL REQUIREMENTS
All operational activities associated with the AGR-3/4 experiment comply with all applicable INL and ATR standard procedures. These activities also comply with all safety and quality assurance requirements outlined in Section 7. Activities requiring special or unique consideration are identified below.
7.1 Pre-irradiation
Prior to final test train assembly, confirmatory physics and thermal analyses will be made using actual fuel characterization data and expected ATR operating conditions. Based on these results, the control gas gap widths may be re-optimized. Also, stress analysis of the test train may be re-evaluated.
Following receipt and inspection AGR-3/4 fuel compacts are selected for irradiation based upon integrity and dimensions. The matrix rings in each capsule are then specifically bored to the same inside diameter (~12.4 mm) to accept these compacts.
After assembly, test train and fission product monitor components and sub-systems will undergo inspection, testing, and calibration, as needed. This includes, but is not limited to, leak testing of all pressure boundaries and gas lines and continuity checks for all TCs. Following these activities, a review will then be conducted whereby any findings will be corrected.
Following successful completion of the review and obtaining all appropriate ATR approvals, the AGR-3/4 test train will be inserted into the NEFT of the ATR, air within the lead and gas lines will be purged, and final component inspections will be performed.
7.2 Irradiation
During irradiation, temperature control is automatically maintained by the gas control system. This system requires temperature feedback from a control TC within each capsule. Should a control TC fail, a previously selected back-up TC within the same capsule will be used as the control TC and the reference control temperature reset based on thermal analysis calculations. Should all TCs fail within a capsule, results from physics and thermal analyses supported by the operating history of an adjacent capsule will be used to manually set the gas blends of the affected capsule. Ultimately, should all TCs fail within the test, temperature control may be based on predictive thermal analyses, augmented by analyses of fission product gas release which is sensitive to temperature.
Thermocouple drift will be monitored by analyses. With actual gas mixes and predicted heat generation rates from physics analyses, the thermal model will be adjusted and calibrated to TC readings during the start of the first irradiation cycle (about two days after reactor start-up so that xenon equilibrium is reached). Thereafter, thermal model results will be compared to the TC readings. Should the difference between model predictions and actual readings of a control TC differ by more than 50°C (about 4 to 5% of reading), control set points for the gas mix system will be adjusted to compensate for the TC drift.
Current ATR planning includes two PALM cycles during the span of AGR-3/4 irradiation. These PALM cycles are scheduled to last about 14 and 2 EFPD respectively and are planned after about 170 and 365 EFPD of irradiation. During the first PALM cycle, the test train should be removed from the NEFT and placed in the ATR canal for the length of the PALM cycle. During the second PALM cycle, the power level might match the increased power level needed in the NEFT to compensate for fuel depletion,
Form 412.09 (Rev. 10)
Idaho National Laboratory
AGR-3/4 Irradiation Experiment Test Plan
Identifier: Revision: Effective Date:
PLN-3867
0
10/05/2011 Page: 52 of 57
in which case the test train should be kept in position in the NEFT and be operated at the PALM cycle power level.
During any switch in control gas (to pure helium-4, to a neon helium mix, etc.), flows of the common plenum gas and each control gas will be appropriately adjusted to ensure that continuity is maintained in the pressure differential between the common plenum and each capsule. This ensures that cross flow between capsules is avoided. After each ATR shutdown and during the entire outage, the control gas will be switched to pure helium-4 for each capsule, and the helium will continuously flow through each capsule at the nominal operating flow rate. The plenum flow will also be maintained at its nominal operating flow rate.
Should a capsule experience excessive fuel particle failures, on the order of 5% or approximately 400 particles, sweep gas to the capsule will be set to consist of 100% helium-4. The helium sweep gas will be maintained at the nominal operating flow rate until the end of the irradiation.
Indicators of moisture ingress (sweep gas outlet moisture content higher than inlet content) will be closely monitored. Past experience has shown that once the presence of moisture is detected, the content rapidly increases. Should a rapid increase in moisture be observed in a capsule, the test train may be removed from the reactor at the next scheduled reactor outage to avoid significant water-graphite interactions possibly compromising other capsules via gaps that may form around the thru tubes (because of reactions between steam and Neolube).
Program participants may be able to view time-series data on-line via a secured site. Viewable data should include at least TC measurements, sweep gas parameters, and gross radiation monitor count rates. Content and format for this possible data presentation has not been fully defined.
As a result of cycle-to-cycle variations in ATR lobe powers, accumulated burnup and fast neutron fluence for the AGR-3/4 test articles must be periodically updated based on as-run data. These as-run physics data reports will be issued after the end of each reactor cycle to the test completion.
7.3 Post-irradiation
The AGR-3/4 test train will be removed from the reactor after completion of the irradiation. For removal, the TCs and gas lines will be disconnected at the reactor vessel penetration flange (where the leadout passes through the reactor wall). The gas lines will then be capped and a cover installed on the test train leadout flange. The entire test train is then lifted from the NEFT test position and passed through the transfer chute to the ATR canal.
After completion of the irradiation, the test train will cool in the canal for about 3-months before being transferred to a hot cell for disassembly. Preliminary PIE will be conducted during and immediately after disassembly. Plans for follow-on detailed PIE have not yet been finalized but they should be similar to that proposed for the AGR-1 experiment (Demkowicz 2010).
Within a year of test completion, a Final Irradiation Test Results report will be issued. Results from PIE and safety testing will be documented separately after the completion of those activities.
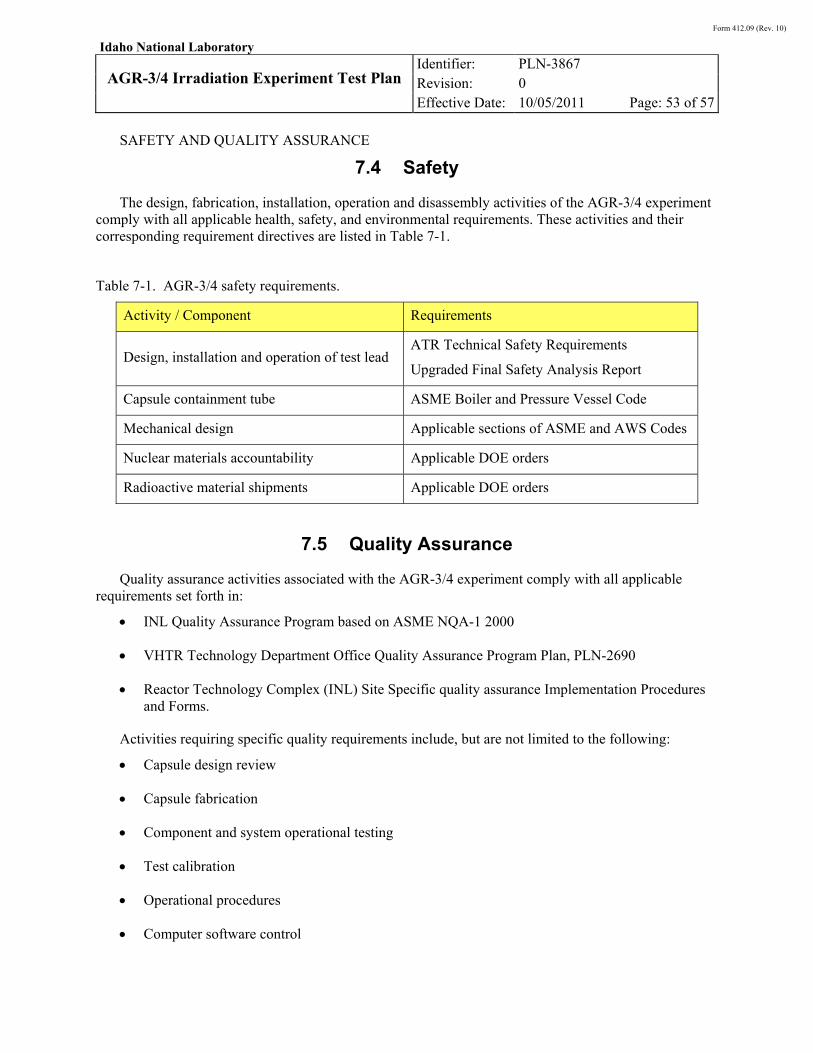
Form 412.09 (Rev. 10)
Idaho National Laboratory
AGR-3/4 Irradiation Experiment Test Plan
Identifier: Revision: Effective Date:
PLN-3867
0
10/05/2011 Page: 53 of 57
SAFETY AND QUALITY ASSURANCE
7.4 Safety
The design, fabrication, installation, operation and disassembly activities of the AGR-3/4 experiment comply with all applicable health, safety, and environmental requirements. These activities and their corresponding requirement directives are listed in Table 7-1.
Table 7-1. AGR-3/4 safety requirements.
Activity / Component Requirements
Design, installation and operation of test lead ATR Technical Safety Requirements
Upgraded Final Safety Analysis Report
Capsule containment tube ASME Boiler and Pressure Vessel Code
Mechanical design Applicable sections of ASME and AWS Codes
Nuclear materials accountability Applicable DOE orders
Radioactive material shipments Applicable DOE orders
7.5 Quality Assurance
Quality assurance activities associated with the AGR-3/4 experiment comply with all applicable requirements set forth in:
INL Quality Assurance Program based on ASME NQA-1 2000
VHTR Technology Department Office Quality Assurance Program Plan, PLN-2690
Reactor Technology Complex (INL) Site Specific quality assurance Implementation Procedures and Forms.
Activities requiring specific quality requirements include, but are not limited to the following:
Capsule design review
Capsule fabrication
Component and system operational testing
Test calibration
Operational procedures
Computer software control
Form 412.09 (Rev. 10)
Idaho National Laboratory
AGR-3/4 Irradiation Experiment Test Plan
Identifier: Revision: Effective Date:
PLN-3867
0
10/05/2011 Page: 54 of 57
Irradiation data collection
Neutron monitor analysis
Fission product gas analysis
Data management
Data validation
Reporting.
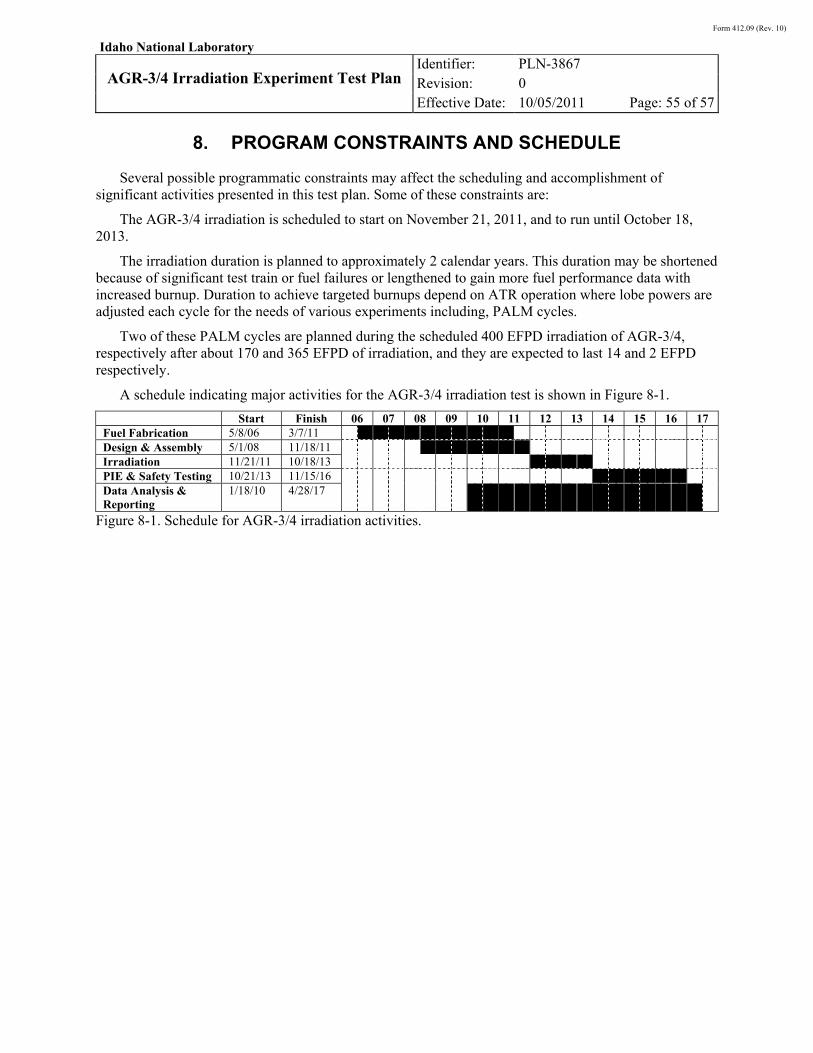
Form 412.09 (Rev. 10)
Idaho National Laboratory
AGR-3/4 Irradiation Experiment Test Plan
Identifier: Revision: Effective Date:
PLN-3867
0
10/05/2011 Page: 55 of 57
8. PROGRAM CONSTRAINTS AND SCHEDULE
Several possible programmatic constraints may affect the scheduling and accomplishment of significant activities presented in this test plan. Some of these constraints are:
The AGR-3/4 irradiation is scheduled to start on November 21, 2011, and to run until October 18, 2013.
The irradiation duration is planned to approximately 2 calendar years. This duration may be shortened because of significant test train or fuel failures or lengthened to gain more fuel performance data with increased burnup. Duration to achieve targeted burnups depend on ATR operation where lobe powers are adjusted each cycle for the needs of various experiments including, PALM cycles.
Two of these PALM cycles are planned during the scheduled 400 EFPD irradiation of AGR-3/4, respectively after about 170 and 365 EFPD of irradiation, and they are expected to last 14 and 2 EFPD respectively.
A schedule indicating major activities for the AGR-3/4 irradiation test is shown in Figure 8-1.
Start Finish 06 07 08 09 10 11 12 13 14 15 16 17 Fuel Fabrication 5/8/06 3/7/11 Design & Assembly 5/1/08 11/18/11 Irradiation 11/21/11 10/18/13 PIE & Safety Testing 10/21/13 11/15/16 Data Analysis & Reporting
1/18/10 4/28/17
Figure 8-1. Schedule for AGR-3/4 irradiation activities.
Form 412.09 (Rev. 10)
Idaho National Laboratory
AGR-3/4 Irradiation Experiment Test Plan
Identifier: Revision: Effective Date:
PLN-3867
0
10/05/2011 Page: 56 of 57
9. REFERENCES
R. G. Ambrosek, “Thermal Evaluations for AGR-3/4 Experiment in the NEFT”, ECAR-1361, August 24, 2011.
C. M. Barnes, “AGR-1 Fuel Product Specification and Characterization Guidance”, EDF-4380, Rev. 8, April 25, 2006.
C. M. Barnes, “AGR-3 & 4 Fuel Product Specification”, EDF-6638, Rev. 1, September 14, 2006.
BWXT, “Industrial Fuel Fabrication and Development Lot G73V-20-69303”, Data Certification Package, June 6, 2006.
H. S. Carslaw and J. C. Jaeger, “Conduction of Heat in Solids”, second edition, Oxford University Press, 1959.
G. S. Chang and J. R. Parry, “Physics Evaluations for the AGR-3/4 Experiment Irradiated in the ATR NEFT in Support of Final Design Activities,” ECAR-1346, Rev. 1, September 13, 2011.
J. Crozier, “Engineering Services for the Next Generation Nuclear Plant (NGNP) with Hydrogen Production: Fission Product Transport Predictions for AGR-3/4”, GA Document no. 911200, April 6, 2011.
P.A. Demkowicz, “AGR-1 Post-Irradiation Examination Plan”, PLN-2828, Rev. 1, March 29, 2010.
GCM, “Graphite Contamination Measurements - Shiva ID U060802018 & U060802019 – P.O. #3400075184 – Job #UP4897”, August 8, 2006.
J. Hunn, “Data Compilation for AGR-3/4 Driver Fuel Coated Particle Composite LEU03-09T”, ORNL/TM-2007/019, March 2007.
J. Hunn, “Data Compilation for AGR-3/4 Designed-To-Fail (DTF) Fuel Particle Batch LEU03-07DTF”, ORNL/TM-2011/109, April 2011.
J. Hunn, “Data Compilation for AGR-3/4 Designed-to-Fail (DTF) Fuel Compact Lot (LEU03-10T-OP2/LEU03-07DTF-OP1)-Z”, ORNL/TM-2011/124, June 2011.
J. Hunn, “Data Compilation for AGR-3/4 Matrix Ring Blanks Lot ARB-B1”, ORNL/TM-2011/272, September 2011.
IAEA, “Fuel performance and fission product behaviour in gas cooled reactors”, TECDOC-978, November 1997.
A.K. Kercher and J. D. Hunn, “Results from ORNL Characterization of Nominal 350 µm LEUCO Kernels (LEU03) from the BWXT G73V-20-69303 Composite”, ORNL/TM-2006/552, October 2006.
J.T. Maki, “AGR-3/4 Irradiation Test Specification”, SPC-1345, Rev. 1, October 2011.
D. W. Marshall, “AGR-3/4 DTF Fuel and Capsule Component Material Specifications”, SPC-1214, Rev. 1, June 21, 2011.
B. F. Myers and W. E. Bell, “Cesium Transport Data for HTGR Systems”, Document no. GA-A13990, September 1979.
D.A. Petti, J.T. Maki, J. Buongiorno, R.R. Hobbins and G.K. Miller, “Key Differences in the Fabrication, Irradiation and Safety Testing of U.S. and German TRISO-coated Particle Fuel and Their Implications on Fuel Performance”, INEEL/EXT-02-00300, February 27, 2002.
Form 412.09 (Rev. 10)
Idaho National Laboratory
AGR-3/4 Irradiation Experiment Test Plan
Identifier: Revision: Effective Date:
PLN-3867
0
10/05/2011 Page: 57 of 57
J. Simonds, “Technical Program Plan for the Next Generation Nuclear Plant/ Advanced Gas Reactor Fuel Development and Qualification Program”, PLN-3636, September 30, 2010.
TFR-630, “Advanced Gas Reactor AGR-3/4 Experiment Test Train”, Technical and Functional Requirements, TFR-630, January 27, 2011.
TFR-656, “Temperature Control and Off Gas Monitoring Systems for Advanced Gas Reactor Experiment AGR-3/4”, Technical and Functional Requirements, TFR-656, November 8, 2010.
TFR-729, “Advanced Gas Reactor AGR-3/4 North East Flux Trap Irradiation Housing”, Technical and Functional Requirements, TFR-729, January 27, 2011.