Embed Size (px)
Citation preview
Agilent Spectrum Mill Proteomics Software
ACHIEVE SUPERIOR PROTEOMICS RESULTS
1000 200 300 400 500 600 700 8000
100%2.49e+3
MSTag1 R E F D T L A
MH+: 922.4751 m/z: 461.7412 z: 2Mass (m/z)
b2
a2
IL
NR TD
LT
ALT LTD
P(m/z)-H2OP(m/z)
P(m/z)
F R b2y1
y2
y6++
y7++
b3
b3
b4
DDE- T-15ug.12806.12808.2.pkl
y8
y4
y5
y6
y7y5y4DFE P(m/z)-R
2
GET ANSWERS TO MORE OF YOUR PROTEOMIC QUESTIONS
Spectrum Mill uses a multistep approach to database searching that allows flexibility at each step. Automation is achieved by creating a workflow that links parameter settings for each step.
Spectrum Mill delivers more efficiency and productivity to your workflow
Extraction
MS/MS Search
Autovalidation
Quality Metrics
Report
• Extract and filter MS/MS spectra• Determine precursor area for quantitation
• Refine precursor monosotopic m/z assignment
• Concatenate results from multiple searches• Scoring optimized for CID, ETD, and HCD
• Employs ppm-based product ion tolerances• Allows unexpected modifications
• Validate peptide spectral matches using false discovery rate (FDR)
• Filter at the protein level based on FDR
• Troubleshoot efficiency issues with chromatography, sample handling, and chemical labeling
• Measure effectiveness of optimized MS/MS data acquisition
• Organize by PSM, distinct peptide, protein or modification site
• Quantify using label-free, SILAC, iTRAQ, TMT
• Compares across samples• Automatically export results
“Spectrum Mill has grown from software initially developed when I was a graduate student at UCSF and then later as a scientist at Millennium Pharmaceuticals Inc. Since Agilent first commercialized Spectrum Mill in 2003, we have maintained an excellent collaborative development relationship. I continue to evolve the tools and algorithms within Spectrum Mill driven by new instrumentation and techniques utilized in my research.”
KARL CLAUSER, PRINCIPAL RESEARCH SCIENTIST, BROAD INSTITUTE OF MIT AND HARVARD
3
1000 200 300 400 500 600 700 8000
100%2.49e+3
MSTag1 R E F D T L A
MH+: 922.4751 m/z: 461.7412 z: 2Mass (m/z)
b2
a2
IL
NR TD
LT
ALT LTD
P(m/z)-H2OP(m/z)
P(m/z)
F R b2y1
y2
y6++
y7++
b3
b3
b4
DDE- T-15ug.12806.12808.2.pkl
y8
y4
y5
y6
y7y5y4DFE P(m/z)-R
Agilent’s Spectrum Mill software offers the versatility to meet the diverse goals of your proteomics research. In fact, the software’s numerous utilities can help you find answers to all sorts of “what if” questions in designing and executing proteomic experiments.
Spectrum Mill software provides tools for:• Discovery proteomics including
protein identification and export of results for statistical interpretation and pathway analysis.
• Protein quantification using label-free, SILAC, iTRAQ, and TMT methods.
• Targeted proteomics, including utilities such as MRM Selector, Peptide Selector, and export of inclusion lists for QQQ or Q-TOF systems.
• Quality assessment and validation of peptide and protein identifications (including FDR).
• Visualization and creation of summary protein and peptide reports to easily explore complex data.
Increase your productivityDon’t let data processing be a bottleneck in your workflow. Spectrum Mill is designed to get results fast and to take full advantage of your server’s multicore microprocessor. Spectrum Mill allows you to customize and save parameter sets for the different processing steps. This provides an easy mechanism for consistent data processing. These parameter sets can be linked to create a custom workflow to run unattended batches. The software manages the job queue to ensure optimized server performance. Spectrum Mill also supports data from Thermo mass spectrometers. What this means to your lab is simple: more efficiency and productivity.
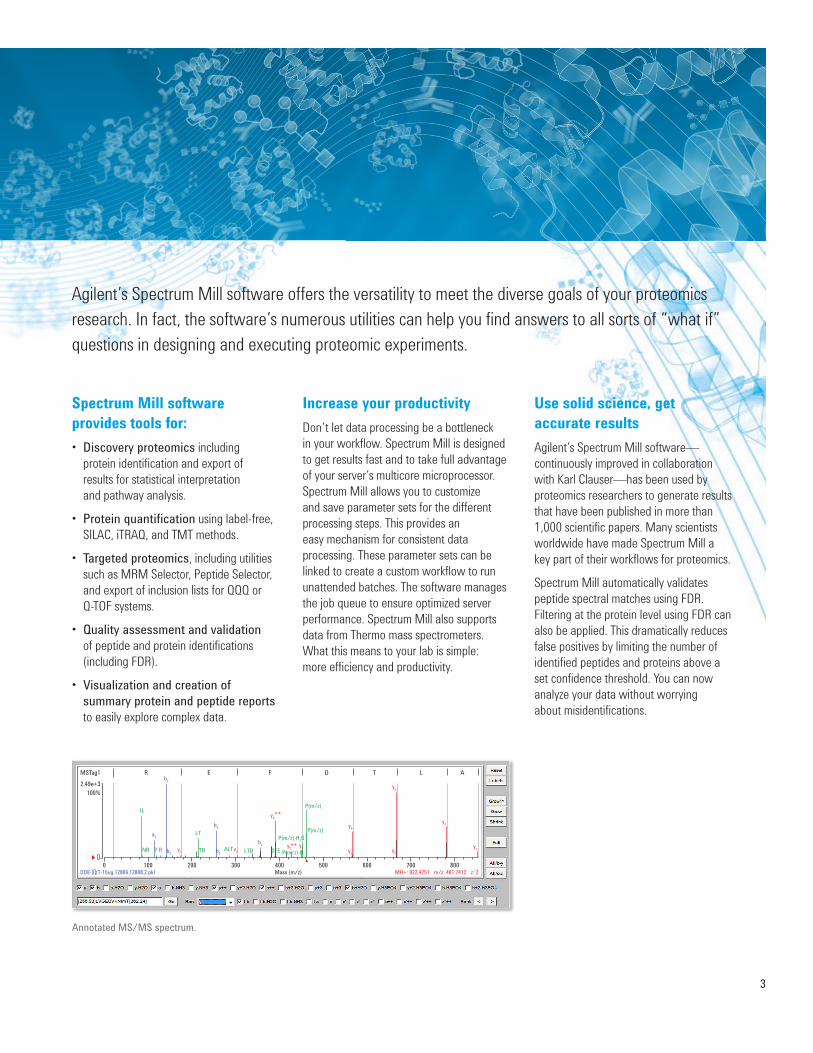
Annotated MS/MS spectrum.
Use solid science, get accurate resultsAgilent’s Spectrum Mill software— continuously improved in collaboration with Karl Clauser—has been used by proteomics researchers to generate results that have been published in more than 1,000 scientific papers. Many scientists worldwide have made Spectrum Mill a key part of their workflows for proteomics.
Spectrum Mill automatically validates peptide spectral matches using FDR. Filtering at the protein level using FDR can also be applied. This dramatically reduces false positives by limiting the number of identified peptides and proteins above a set confidence threshold. You can now analyze your data without worrying about misidentifications.
4
Detecting and identifying modified proteins are critical tasks for researchers trying to understand biological processes. Popular search engines enable you to look for both unmodified and modified proteins. Spectrum Mill, however, gives you more information about the modifications in your proteins.
PINPOINT IMPORTANT PROTEIN MODIFICATIONS
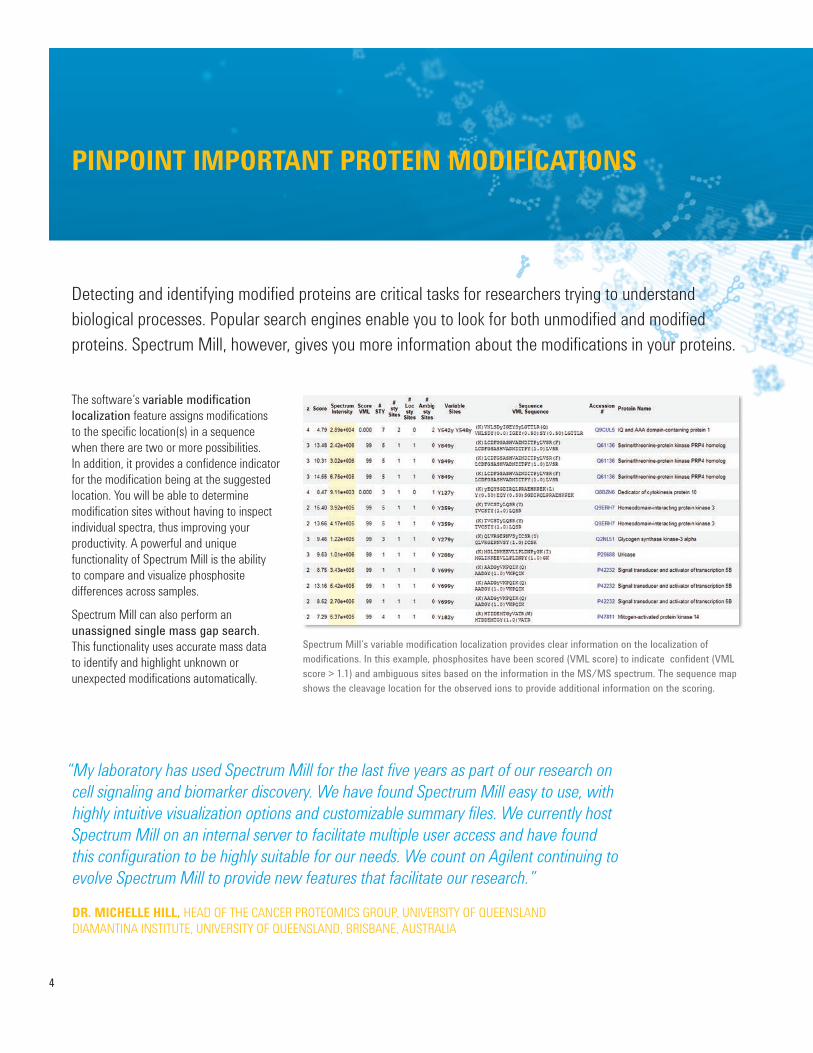
The software’s variable modification localization feature assigns modifications to the specific location(s) in a sequence when there are two or more possibilities. In addition, it provides a confidence indicator for the modification being at the suggested location. You will be able to determine modification sites without having to inspect individual spectra, thus improving your productivity. A powerful and unique functionality of Spectrum Mill is the ability to compare and visualize phosphosite differences across samples.
Spectrum Mill can also perform an unassigned single mass gap search. This functionality uses accurate mass data to identify and highlight unknown or unexpected modifications automatically.
Spectrum Mill’s variable modification localization provides clear information on the localization of modifications. In this example, phosphosites have been scored (VML score) to indicate confident (VML score > 1.1) and ambiguous sites based on the information in the MS/MS spectrum. The sequence map shows the cleavage location for the observed ions to provide additional information on the scoring.
“My laboratory has used Spectrum Mill for the last five years as part of our research on cell signaling and biomarker discovery. We have found Spectrum Mill easy to use, with highly intuitive visualization options and customizable summary files. We currently host Spectrum Mill on an internal server to facilitate multiple user access and have found this configuration to be highly suitable for our needs. We count on Agilent continuing to evolve Spectrum Mill to provide new features that facilitate our research.”
DR. MICHELLE HILL, HEAD OF THE CANCER PROTEOMICS GROUP, UNIVERSITY OF QUEENSLAND DIAMANTINA INSTITUTE, UNIVERSITY OF QUEENSLAND, BRISBANE, AUSTRALIA
5
1000 200 300 400 500 600 700 8000
100%2.49e+3
MSTag1 R E F D T L A
MH+: 922.4751 m/z: 461.7412 z: 2Mass (m/z)
b2
a2
IL
NR TD
LT
ALT LTD
P(m/z)-H2OP(m/z)
P(m/z)
F R b2y1
y2
y6++
y7++
b3
b3
b4
DDE- T-15ug.12806.12808.2.pkl
y8
y4
y5
y6
y7y5y4DFE P(m/z)-R
Spectrum Mill easily integrates with other analysis tools, letting you take your proteomics discovery data further. You can upload Spectrum Mill search results to Proteome Software’s popular Scaffold suite and compare them with results from other search engines.
GENERATE MORE MEANINGFUL RESULTS
Protein abundances from the search results can be imported into Agilent’s Mass Profiler Professional (MPP) for statistical interpretation and visualization. This novel workflow is possible because Spectrum Mill automatically extracts and assigns precursor areas for identified peptides. During report generation, protein abundance is then calculated by summing the areas for peptides belonging to that protein. Protein grouping and associated protein-level
quantitation allows for peptides shared between multiple proteins to be either included or excluded. Sample group differences can be quickly visualized in MPP and mapped to pathways using Pathway Architect. By discovering pathways relevant to your experiment, Spectrum Mill gets you to the biology faster.
Spectrum Mill can produce a list of accurate masses and retention times from MS/MS peptide identifications for MS-only protein
profiling workflows. Agilent’s MassHunter Profinder software can find peptides across multiple sample files using this peptide target list. Profinder has extensive tools for automated processing, data review and manual curation.
Spectrum Mill’s ability to export results in different ways allows you to use other software programs to review and interpret your experiments your way.
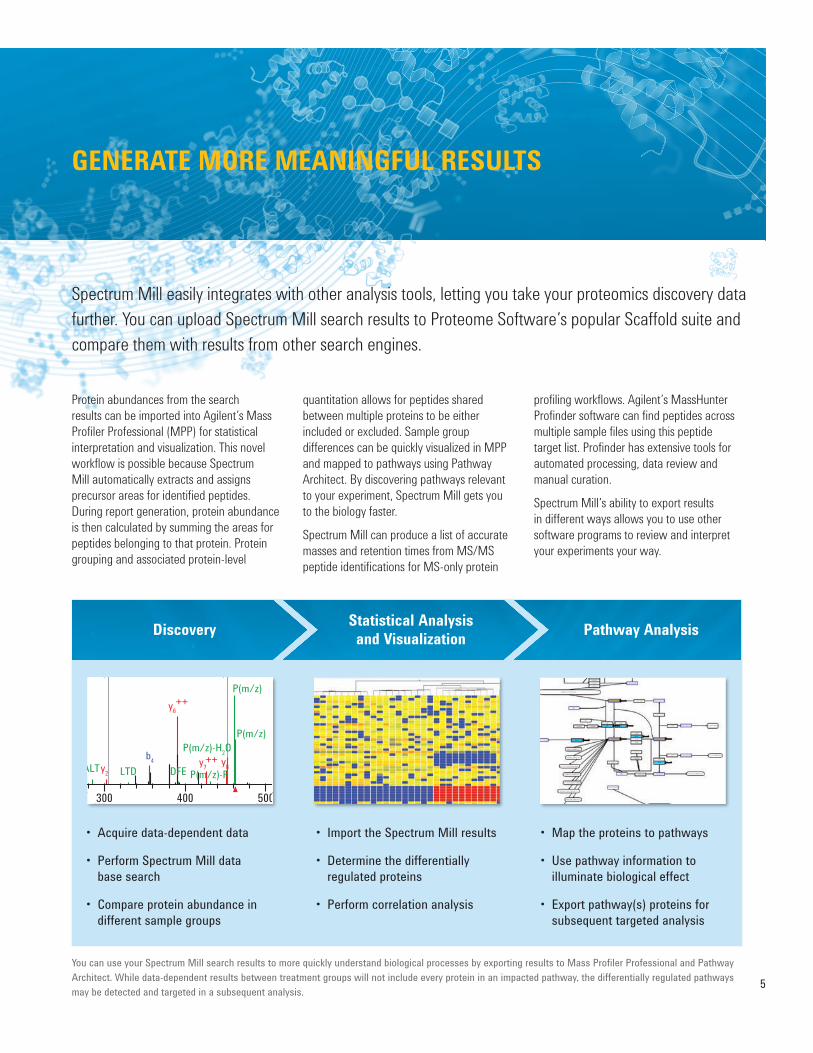
You can use your Spectrum Mill search results to more quickly understand biological processes by exporting results to Mass Profiler Professional and Pathway Architect. While data-dependent results between treatment groups will not include every protein in an impacted pathway, the differentially regulated pathways may be detected and targeted in a subsequent analysis.
• Acquire data-dependent data
• Perform Spectrum Mill data base search
• Compare protein abundance in different sample groups
• Import the Spectrum Mill results
• Determine the differentially regulated proteins
• Perform correlation analysis
• Map the proteins to pathways
• Use pathway information to illuminate biological effect
• Export pathway(s) proteins for subsequent targeted analysis
Discovery Statistical Analysis and Visualization Pathway Analysis
6
FOCUS YOUR ANALYSIS WITH TARGETED PROTEOMICS
Once you have identified a set of interesting proteins, the next step may be to set up a targeted analysis for specific peptides. You can export identified peptide spectra from Spectrum Mill and use it in Skyline software from the MacCoss group at the University of Washington in Seattle.
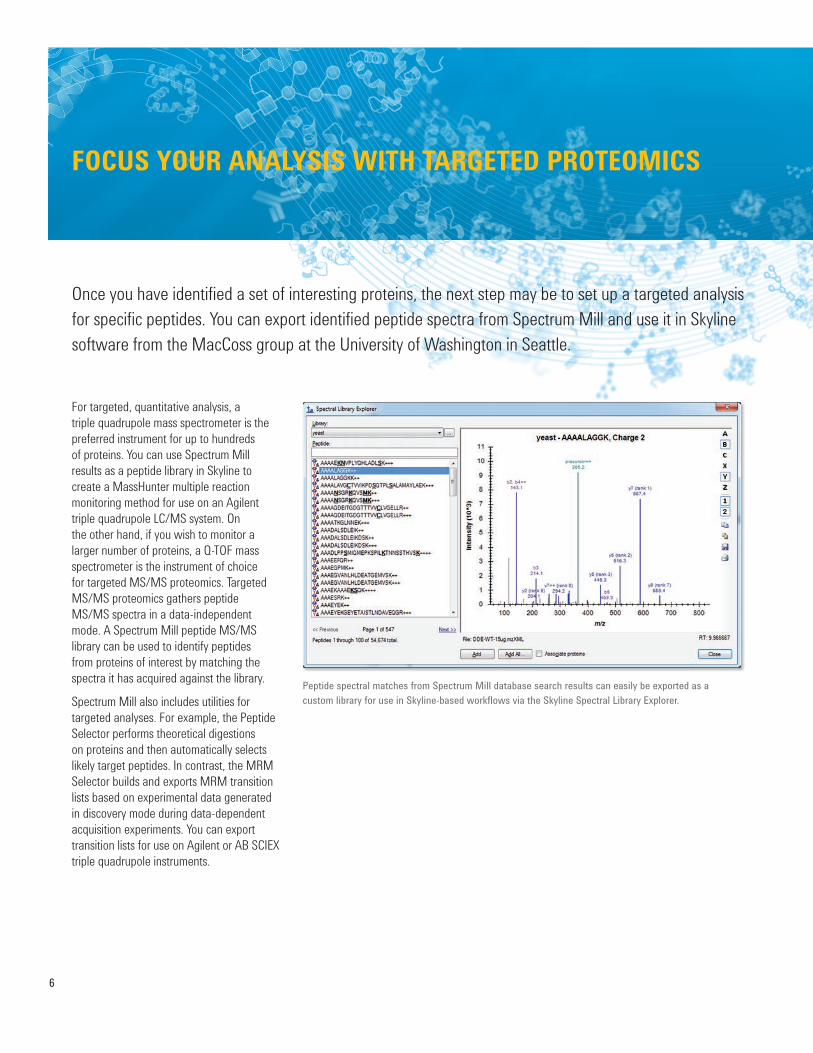
For targeted, quantitative analysis, a triple quadrupole mass spectrometer is the preferred instrument for up to hundreds of proteins. You can use Spectrum Mill results as a peptide library in Skyline to create a MassHunter multiple reaction monitoring method for use on an Agilent triple quadrupole LC/MS system. On the other hand, if you wish to monitor a larger number of proteins, a Q-TOF mass spectrometer is the instrument of choice for targeted MS/MS proteomics. Targeted MS/MS proteomics gathers peptide MS/MS spectra in a data-independent mode. A Spectrum Mill peptide MS/MS library can be used to identify peptides from proteins of interest by matching the spectra it has acquired against the library.
Spectrum Mill also includes utilities for targeted analyses. For example, the Peptide Selector performs theoretical digestions on proteins and then automatically selects likely target peptides. In contrast, the MRM Selector builds and exports MRM transition lists based on experimental data generated in discovery mode during data-dependent acquisition experiments. You can export transition lists for use on Agilent or AB SCIEX triple quadrupole instruments.
Peptide spectral matches from Spectrum Mill database search results can easily be exported as a custom library for use in Skyline-based workflows via the Skyline Spectral Library Explorer.
7
Skyline Software
Mass Profiler Professional
Scaffold Software
Pathway Architect
Agilent 6400 Series QQQ
1000 200 300 400 500 600 700 8000
100%2.49e+3
MSTag1 R E F D T L A
MH+: 922.4751 m/z: 461.7412 z: 2Mass (m/z)
b2
a2
IL
NR TD
LT
ALT LTD
P(m/z)-H2OP(m/z)
P(m/z)
F R b2y1
y2
y6++
y7++
b3
b3
b4
DDE- T-15ug.12806.12808.2.pkl
y8
y4
y5
y6
y7y5y4DFE P(m/z)-R
SPECTRUM MILL
Agilent 6500 Series Q-TOF
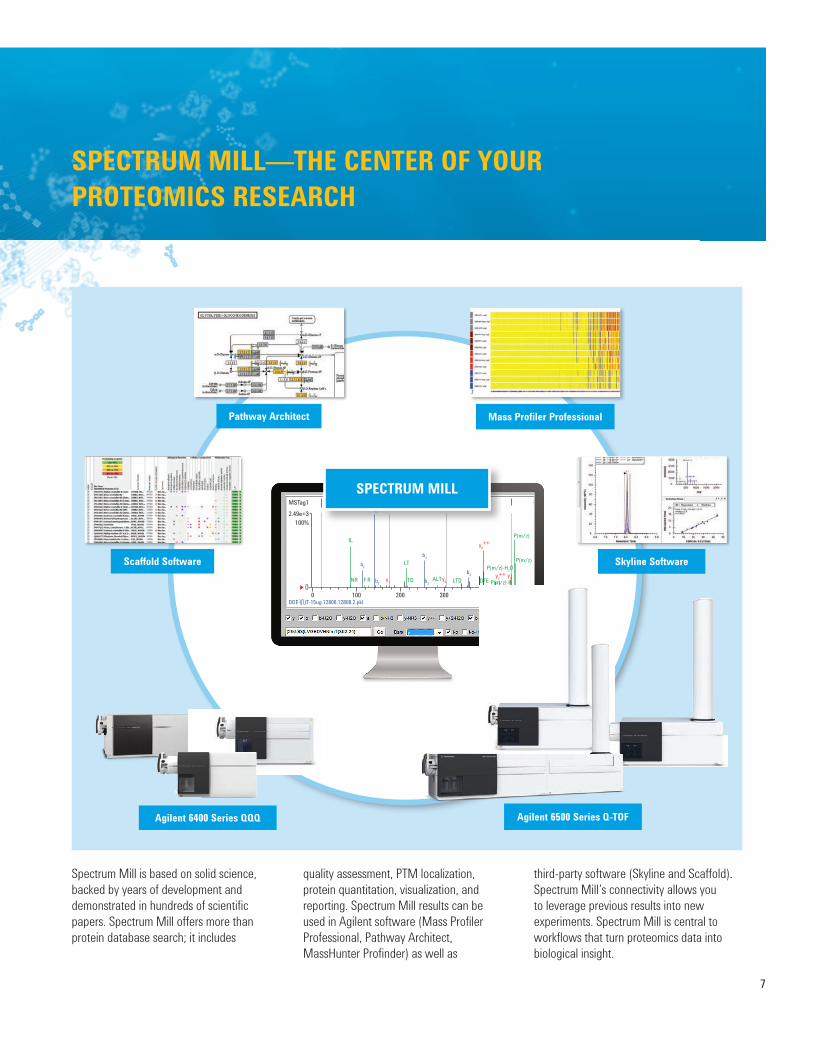
SPECTRUM MILL—THE CENTER OF YOUR PROTEOMICS RESEARCH
Spectrum Mill is based on solid science, backed by years of development and demonstrated in hundreds of scientific papers. Spectrum Mill offers more than protein database search; it includes
quality assessment, PTM localization, protein quantitation, visualization, and reporting. Spectrum Mill results can be used in Agilent software (Mass Profiler Professional, Pathway Architect, MassHunter Profinder) as well as
third-party software (Skyline and Scaffold). Spectrum Mill’s connectivity allows you to leverage previous results into new experiments. Spectrum Mill is central to workflows that turn proteomics data into biological insight.
Learn more www.agilent.com/chem/spectrum_mill
Find a local Agilent customer center agilent.com/chem/contactus
USA and Canada [email protected]
Europe [email protected]
Asia Pacific [email protected]
For Research Use Only. Not for use in diagnostic procedures.
Information, descriptions, and specifications in this publication are subject to change without notice. Agilent Technologies shall not be liable for errors contained herein or for incidental or consequential damages in connection with the furnishing, performance, or use of this material.
© Agilent Technologies, Inc. 2015 Published in USA, February 4, 2015 5991-5250EN