Embed Size (px)
Citation preview

Agilent GSM/EDGE Self-Guided Demonstration for theE4438C ESG Vector Signal Generator and PSA Series Spectrum Analyzers
Product Note
Striving to meet all your test needs
Agilent knows that the time you spend learning about testequipment is time you would rather spend working on yourown product. This Self-guided Demo is part of an effort toshorten the learning curve for you, so that you can get backto doing what you do best. It is a quick way to learn about thekey features of the TDMA personality. For detailed productfeatures and TDMA specifications, see the Option 402 product overview. For detailed specifications on the baseinstrument, see the E4438C data sheet. All are listed in the back of this document.
2
Introduction . . . . . . . . . . . . . . . . . . . . . . . . . . . . . . . . . . . . . . . . . . . . . . . . . . . . . . . . . . . . . . . .3
Demo configuration . . . . . . . . . . . . . . . . . . . . . . . . . . . . . . . . . . . . . . . . . . . . . . . . . . . . . . . . .3
Background information . . . . . . . . . . . . . . . . . . . . . . . . . . . . . . . . . . . . . . . . . . . . . . . . . . . . . .4
Explore the GSM menu structure . . . . . . . . . . . . . . . . . . . . . . . . . . . . . . . . . . . . . . . . . . . . . .5
GSM measurements . . . . . . . . . . . . . . . . . . . . . . . . . . . . . . . . . . . . . . . . . . . . . . . . . . . . . . . .12
GSM spectrum . . . . . . . . . . . . . . . . . . . . . . . . . . . . . . . . . . . . . . . . . . . . . . . . . . . . . . . .12
Transmit power . . . . . . . . . . . . . . . . . . . . . . . . . . . . . . . . . . . . . . . . . . . . . . . . . . . . . . . .13
GMSK power versus time . . . . . . . . . . . . . . . . . . . . . . . . . . . . . . . . . . . . . . . . . . . . . . .13
GMSK phase and frequency . . . . . . . . . . . . . . . . . . . . . . . . . . . . . . . . . . . . . . . . . . . . .18
GMSK output RF spectrum and Tx band spurious . . . . . . . . . . . . . . . . . . . . . . . . . . . .22
Explore the EDGE menu structure . . . . . . . . . . . . . . . . . . . . . . . . . . . . . . . . . . . . . . . .25
EDGE measurements . . . . . . . . . . . . . . . . . . . . . . . . . . . . . . . . . . . . . . . . . . . . . . . . . . . . . . .27
EDGE power versus time, output RF spectrum and EVM . . . . . . . . . . . . . . . . . . . . . .27
EDGE multicarrier waveform creation and spectrum view . . . . . . . . . . . . . . . . . . . . .28
Related Agilent literature . . . . . . . . . . . . . . . . . . . . . . . . . . . . . . . . . . . . . . . . . . . . . . . . . . . .31
Table of contents

3
Introduction
Demo configuration
In watching hundreds of users work with our equipment, we observed that it is rare for anew user to read the manual before attempting to use the instrument. Most people preferto “learn by doing”. This demo was created for those people who just can’t wait to getgoing. It takes the new user quickly through a series of common measurement setups forthe ESG and PSA with enough detail to learn how they function, but without attemptingto be exhaustive in its coverage. We start with a recommended instrument configuration,move through some background information on the GSM/EDGE, review the setup of the signal generator, and conclude with some common PSA measurements. Detailed keystrokes are provided. [ ] indicates hard keys on the front panel. indicate soft keysgenerated on the instrument display. Bold text indicates the feature name; underlinedtext indicates the desired selection.
See table 1 for a list of options that are required for the ESG and PSA for the GSM/EDGE demo.
Product type Model number Required optionsESG Vector Signal Generator E4438C 001 or 002 – Baseband generator
402 – TDMA personalities PSA Spectrum Analyzer E4440A/E4443A/ B7J – Digital demodulation
E4445A hardware202 – GSM with EDGE measurement personality
Table 1. Required demo equipment
Connect the RF output of the ESG to the 50 Ω RF input of the PSA series spectrum analyzer with a RF cable, see figure 1. For multi-slot measurements, the PSA will need an external trigger signal from the ESG. Connect the “EVENT 1” output on the rear panelof the ESG to the “TRIGGER IN” input on the rear panel of the PSA with a 50 Ω BNC connector cable. Connect the 10 MHz OUT from the ESG to EXT REF IN on the PSA.
Figure 1. Demo set-up
(Rear panel) Event 1 10 MHz out
EXT triggerinput
E4440A Vector Signal Analyzer
E4438C ESG Vector Signal Generatorwith Option 001
(Rear panel) Event 1 10 MHz in
LAN or GPIB

4
The Global System for Mobile Communications (GSM) digital cellular standard is a timedivision multiple access (TDMA) channel access scheme that uses GMSK (Gaussian minimum shift keying) modulation.
Each GSM frequency channel is shared by up to 8 mobiles. Since there are a maximum of eight users per frequency, there are eight timeslots (TS) per GSM frame. Therefore,each mobile uses the channel for one timeslot and then waits for its turn to come roundagain in the next frame. The mobile transmitter turns on only during its active timeslot.The requirement to transmit in a single timeslot and stay idle during the remaining seventimeslots results in very tight demands on the switching on and off of the RF power. If amobile station does not perform according to the specifications, it will disturb othermobile stations in adjacent timeslots and on adjacent channels.
EDGE (Enhanced Data Rates for GSM Evolution) is an enhancement to the GSM standard,that uses 3π/8 8PSK (phase shift keying) modulation. This improvement to the GSMstandard promises to deliver wireless services such as multimedia and other broadbandapplications.
Since many essential EDGE transmitter measurements are similar to GSM measurements,the greater part of this guide addresses GSM measurements. The last part concentrateson the EDGE measurements, particularly where they are different from GSM.
GPRS (General Packet Radio Service) and EGPRS (Enhanced General Packet RadioService) are other enhancements to the GSM standard. GPRS and EGPRS operate in apacket switched network, whereas GSM and EDGE are part of a circuit switched network.In GPRS or EGPRS, a user can utilize up to 8 timeslots for transmission and reception ofdata. GPRS uses GMSK modulation and has the same spectral characteristics as GSM.EGPRS uses GMSK or 3π/8 8PSK modulation, and has spectral characteristics similar to GSM or EDGE.
GSM EDGEModulation GMSK 3π/8 8PSKBits/symbol 1 3Data bits per burst 114 342Symbol rate 270.833 kHz 270.833 kHzFilter 0.3 Gaussian Linearized Gaussian
Table 2. Representative specifications for GSM and EDGE signal formats
Background information

5
GSM signal configurationThe purpose of this section is to explore the GSM feature set, as well as the variousparameters that can be adjusted.
ESG instructions Keystrokes
Select GSM mode (see figure 2) [Preset] [Mode] Real Time TDMA GSM
Figure 2. GSM main menu page 1
The default Data Format for GSM is Pattern, see figure 2. This setting creates a continuousGMSK modulated data stream. This data is not bursted or framed. Notice that the defaultdata type is a PN23 (Pseudorandom Noise of period 223-1 bits). This Data pattern can bevaried from: (PN9, PN11, PN15, PN20, PN23 or a fixed sequence of data), or the user canchoose to supply his own data. The keys that are in grey indicate that the functionality iscurrently not available. The keys that are in black indicate that those features are availableand can be modified. These will change depending on the operating mode. If the Datapattern is a PN sequence, then the Pattern Trigger key is (N/A). However, if the data pattern is changed to any other pattern, then the following functions illustrated in figure 3are available for Pattern Trigger.
Figure 3. GSM pattern trigger menu
The ESG may also be used to trigger other equipment with the Sync Out feature (see figure 4a). The only selection available for Data Format Pattern mode is Begin Pattern.This outputs a 1-bit synchronization signal to the EVENT 1 rear panel connector.
Explore the GSM menustructure

6
ESG instructions Keystrokes
View second page of GSM menu structure (figure 4) More (1 of 2)
Figure 4a. GSM page 2 of 2 menu
Figure 4b. Modify standard submenu
The Modify Standard soft key, see figure 4a, allows the user to change various parameters such as filtering, symbol rate, modulation type, phase polarity, and differentialdata encoding (figure 4b).
7
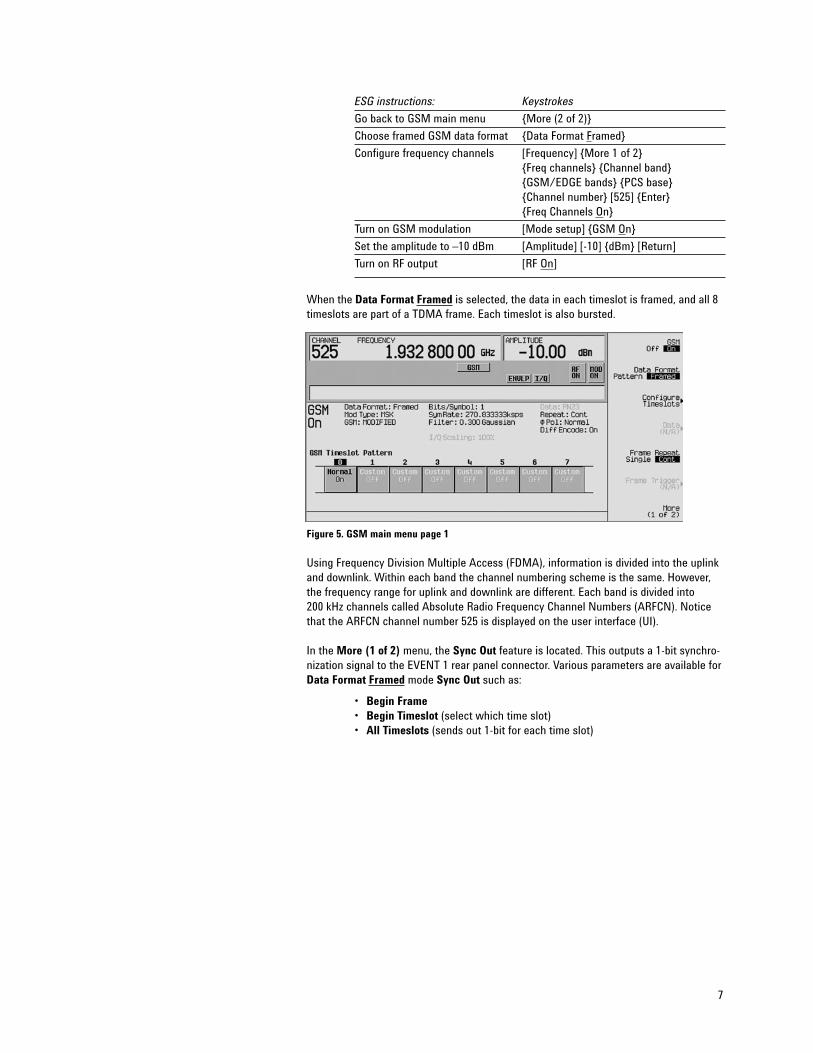
ESG instructions: Keystrokes
Go back to GSM main menu More (2 of 2)
Choose framed GSM data format Data Format Framed
Configure frequency channels [Frequency] More 1 of 2 Freq channels Channel band GSM/EDGE bands PCS base Channel number [525] Enter Freq Channels On
Turn on GSM modulation [Mode setup] GSM On
Set the amplitude to –10 dBm [Amplitude] [-10] dBm [Return]
Turn on RF output [RF On]
When the Data Format Framed is selected, the data in each timeslot is framed, and all 8timeslots are part of a TDMA frame. Each timeslot is also bursted.
Figure 5. GSM main menu page 1
Using Frequency Division Multiple Access (FDMA), information is divided into the uplinkand downlink. Within each band the channel numbering scheme is the same. However,the frequency range for uplink and downlink are different. Each band is divided into 200 kHz channels called Absolute Radio Frequency Channel Numbers (ARFCN). Noticethat the ARFCN channel number 525 is displayed on the user interface (UI).
In the More (1 of 2) menu, the Sync Out feature is located. This outputs a 1-bit synchro-nization signal to the EVENT 1 rear panel connector. Various parameters are available forData Format Framed mode Sync Out such as:
• Begin Frame• Begin Timeslot (select which time slot)• All Timeslots (sends out 1-bit for each time slot)

8
Notice that parameters such as Configure Timeslots and Frame Trigger, are listed on theright side of the UI (figure 5). The Frame Trigger soft key offers the following choices totrigger single or continuous TDMA Frames:
• Trigger Key (hard key on the front panel)• Bus (via SCPI commands)• Ext (allows delay bits to be set)
The Modify Standard soft key, located on page 2 of the menu structure, has the sameselections as the Data Format Pattern mode, but in addition the Burst Shape of thetimeslots can be configured. These parameters affect all of the 8 timeslots.
Figure 6. GSM modify standard submenu
The ESG offers all timeslot bursts as specified by the GSM standard.
Figure 7. GSM configure timeslot menu
The Timeslot Type soft key selects the type of timeslot for each of the 8 timeslots. TheConfigure soft key allows the user to set various parameters in each of the timeslots,such as user data, training sequence, etc… The TDMA frame can be a combination of any of the time slot types.

Normal (Normal soft key) see figure 8
A normal burst is the most common burst in the GSM system and is transmitted in onetimeslot either from the base station or the mobile station. This burst type configures thetimeslot as a traffic channel, which carries either user data or signaling data. The GSMnetwork organizes TCH channels in 26 frame multiframes. Frames 0 through 11 are TCHchannels where the payload is either user data or signaling information, frame 12 is theslow associated control channel, and frame 25 is an idle channel. However, the ESGdoesn’t implement the SAACH channel. The SACCH is responsible for supervision andcontrol messages, such as power control and timing information. The S field (stealingflag) is reserved to indicate a FACCH (fast associated control channel). This channeltransmits handover information.
A different payload can be selected for each timeslot when in Data Framed mode ForNormal, Sync and Access timeslots, pressing the E softkey from within the Configuremenu reveals a menu of choices for internal Data Generation (PN9, PN11, PN15, PN20,PN23 or a fixed sequence of data) or the user can choose to supply his own data. Thenumber of data bits in the E field depends on the timeslot type chosen. For Customtimeslots: The same choices as above are automatically displayed when the ConfigureCustom softkey is pressed.
For a normal GSM burst, when Multiframe Channel is selected as the payload type,TCH/FS, CS-1, DL/UL MCS-1 are available packet types in the payload field.
In the GSM multiframe, CS-1 and DL/UL MCS-1 packets are transmitted in a 52 framemultiframe channel, see figure 9. Frames 25 and 51 are RF blanked. All the timeslots inframes 12 and 38 are all active. The timeslots within these frames are set as follows: T1 (tail bits field 1) = 0s, S1 (stealing bits field 1) = 0s, TS (training sequence ormidamble) = same as the configured timeslot, S2 = 0s, T2 = 0s, G =1s.
If TCH/FS is selected as the payload, frame 12 is RF blanked. All the timeslots in frame 25 are all active. The timeslots within these frames are set as follows: T1 (tail bits field 1) = 0s, S1 (stealing bits field 1) = 0s, TS (training sequence ormidamble)=same as the configured timeslot, S2 = 0s, T2 = 0s, G = 1s.
Please see the TDMA Product Overview, literature number 5988-4431EN, for more details.
Figure 8. GSM configure one timeslot
9

10
Figure 9. GSM burst with packets mapped onto a PDTCH
Frequency correction (FCorr soft key)
Timing is a critical need in a GSM system. The base station has to provide the means fora mobile station to synchronize with the master frequency of the system. To achieve synchronization the base station transmits a frequency correction burst, during certainknown intervals. This frequency correction burst is a fixed sequence of zeros for theduration of one timeslot.
In a GSM network, frequency correction bursts occur every 10 frames (Frame 0, Frame10, Frame 20 etc. of a BCH signaling data multiframe , and always occur in timeslot 0 (the base station always generates the BCH on timeslot 0). To maximize the flexibility ofthe ESG, however, any timeslot may be set to the frequency correction type.
If a timeslot is selected as a frequency correction burst, the ESG repeats the frequencycorrection burst in every frame, not every 10 frames (as defined by standard).
Synchronization (Sync soft key)
The base station sends signals on the BCH, which contain some system parameters, such asthose which enable the mobile to synchronize to the BS. The mobile, however, needs adefined training sequence before it can demodulate and decode this information. Thebase station tells the mobile which training sequence to use with the synchronizationburst. The synchronization burst has an extended midamble (or training sequence) with a fixed sequence in order to give the mobile the “key” it needs to decode the systemparameters. Like frequency correction channels, synchronization channels occur every 10 frames (Frame 1, Frame 11, Frame 21 etc. of a signaling data multiframe, and thebursts always occur in timeslot 0. To maximize the flexibility of the ESG, however, anytimeslot may be set to the synchronization type.
The synchronization burst will be repeated every frame, not every 10 frames (as calledout by the standard), if the built-in data generator is used. To repeat every 10 frames, a long data sequence could be generated and loaded directly into the signal generator’spattern RAM .
3 1 1 326 bits 57 bits57 bits
Control bit
Control bit
Midamble Guardperiod
DataData
8.25 bits
Tailbits
Tailbits
240 ms
4.615 ms
576.92 µs
Multiframe
TDMA Frame
Timeslot(normal burst)
52 Frames(frames 0 thru frames 51)
8 Timeslots
156.25 Bits
TS0TS2 TS3 TS4 TS6
TS7TS1 TS5

11
Random Access (Access softkey)Mobiles use a random access burst when trying to gain initial access to the system. Thisburst type is shorter than a normal burst, and is used by the base station to measure thetime delay a mobile’s burst is experiencing.
Dummy (Dummy softkey)In the GSM system, the base station must transmit something in each timeslot of thebase channel. Even if these timeslots are not allocated to communication with anymobiles, the base station has to transmit dummy bursts, specially defined for this purpose, in the idle timeslots of the base channel.
Custom (Custom softkey)The custom timeslot is provided for users’ flexibility, but it is not a standard GSM times-lot type. A custom timeslot is configured using an internally-generated data pattern, adownloaded sequence of bits stored in a user file, or by supplying external data.

12
GSM spectrumIf you have completed the ESG setup instruction on pages 5, 6, and 7, measurements canbe made. The first measurement that will be made will be to view the spectrum.
PSA instructions: Keystrokes
Enter GSM w/EDGE mode in the analyzer [Preset] [Mode] GSM (w/EDGE)
Verify setup for GSM PCS band. The default [Mode Setup] Radio Band
device setting is for BTS. PCS 1900
Set center frequency to absolute RF [FREQUENCY] ARFCN [525]
channel number (ARFCN) 525 (1.9328 GHz) [Enter]
Turn on the external reference [System] Reference Freq Ref EXT
Figure 10. GSM spectrum and I/Q waveforms
GSM measurements
13
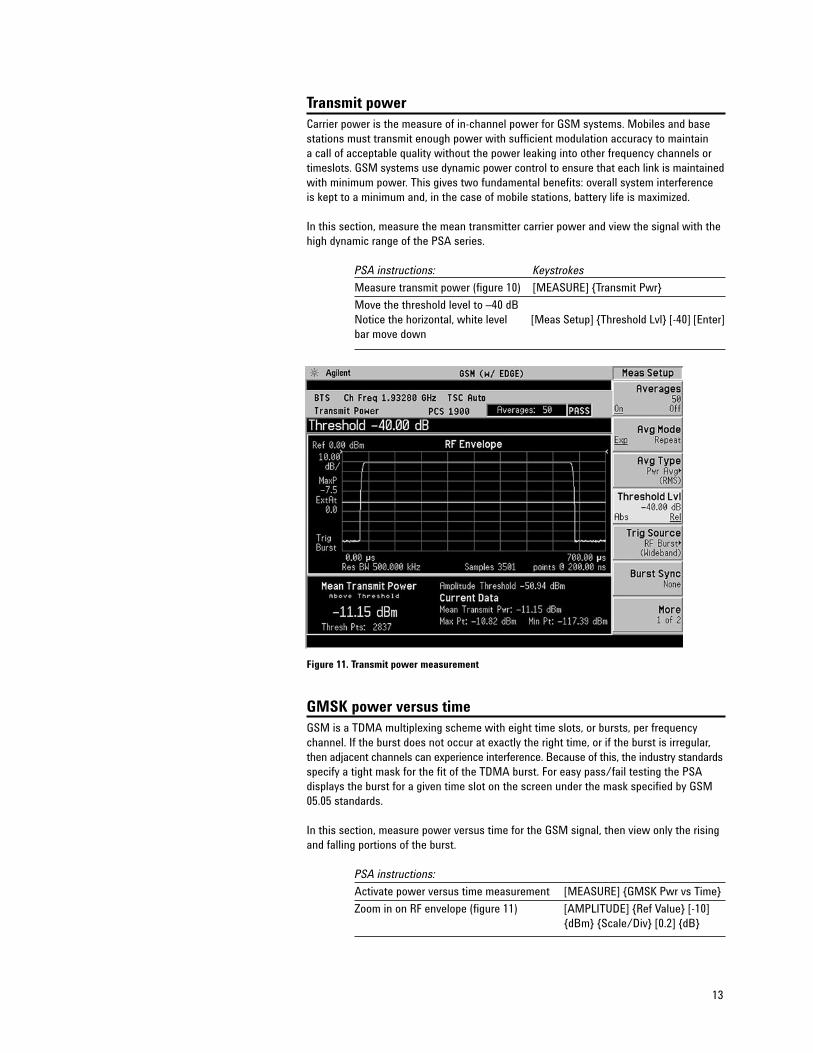
Transmit powerCarrier power is the measure of in-channel power for GSM systems. Mobiles and basestations must transmit enough power with sufficient modulation accuracy to maintain a call of acceptable quality without the power leaking into other frequency channels ortimeslots. GSM systems use dynamic power control to ensure that each link is maintainedwith minimum power. This gives two fundamental benefits: overall system interference is kept to a minimum and, in the case of mobile stations, battery life is maximized.
In this section, measure the mean transmitter carrier power and view the signal with thehigh dynamic range of the PSA series.
PSA instructions: Keystrokes
Measure transmit power (figure 10) [MEASURE] Transmit Pwr
Move the threshold level to –40 dBNotice the horizontal, white level [Meas Setup] Threshold Lvl [-40] [Enter]bar move down
Figure 11. Transmit power measurement
GMSK power versus timeGSM is a TDMA multiplexing scheme with eight time slots, or bursts, per frequencychannel. If the burst does not occur at exactly the right time, or if the burst is irregular,then adjacent channels can experience interference. Because of this, the industry standardsspecify a tight mask for the fit of the TDMA burst. For easy pass/fail testing the PSA displays the burst for a given time slot on the screen under the mask specified by GSM05.05 standards.
In this section, measure power versus time for the GSM signal, then view only the risingand falling portions of the burst.
PSA instructions:
Activate power versus time measurement [MEASURE] GMSK Pwr vs Time
Zoom in on RF envelope (figure 11) [AMPLITUDE] Ref Value [-10] dBm Scale/Div [0.2] dB

14
Figure 12. GSM power versus time measurement
PSA instructions: Keystrokes
View the shape of the rising and [Trace/View] Rise & Fallfalling parts of the burst (figure 13)
Expand the rising edge display [Zoom]You can toggle between the three display sections by pressing the [Next Window] key.
Zoom in on the trace [AMPLITUDE] Ref Value [-8.5] dBm
Scale/Div [1] dB
Figure 13. GSM power versus time measurement rising edge of burst

15
PSA instructions: Keystrokes
Turn on averaging and display maximum [Meas Setup] Avg Bursts On and minimum averaged traces (figure 14) Avg Type Max & MinObserve the different typed of averaging available under the Avg Type menu.
Deactivate averaging and view full display Avg Bursts Off
Figure 14. Rising edge of GSM burst with averaging on
Next we’ll change the shape of the burst on the ESG source.
ESG instructions: Keystrokes
Increase the rise time of the GSM More (1 of 2) Modify Standard* burst to 6 bits (figure 15) Burst Shape Rise Time [6] bits
Notice the different parameters that can be varied such as filtering, symbol rate, modulation type, burst shape, phase polarity, and differential data encoding.
Figure 15. Modified burst shape
16
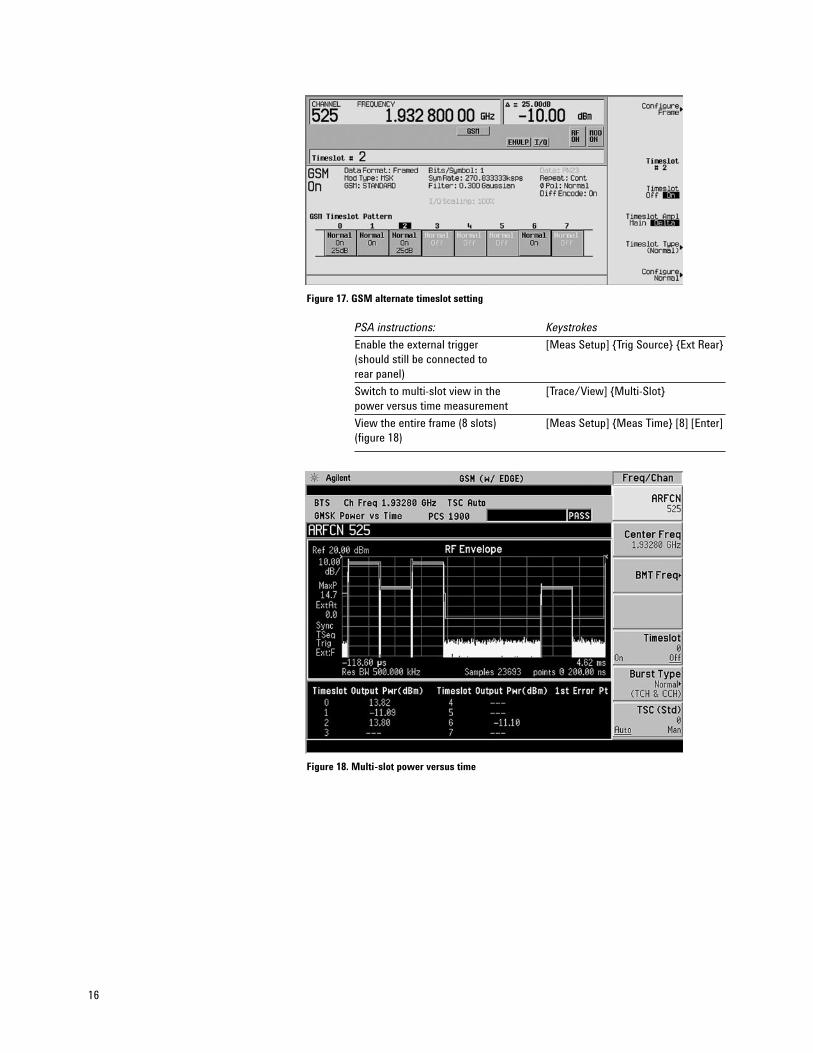
Figure 17. GSM alternate timeslot setting
PSA instructions: Keystrokes
Enable the external trigger [Meas Setup] Trig Source Ext Rear(should still be connected to rear panel)
Switch to multi-slot view in the [Trace/View] Multi-Slotpower versus time measurement
View the entire frame (8 slots) [Meas Setup] Meas Time [8] [Enter](figure 18)
Figure 18. Multi-slot power versus time
17
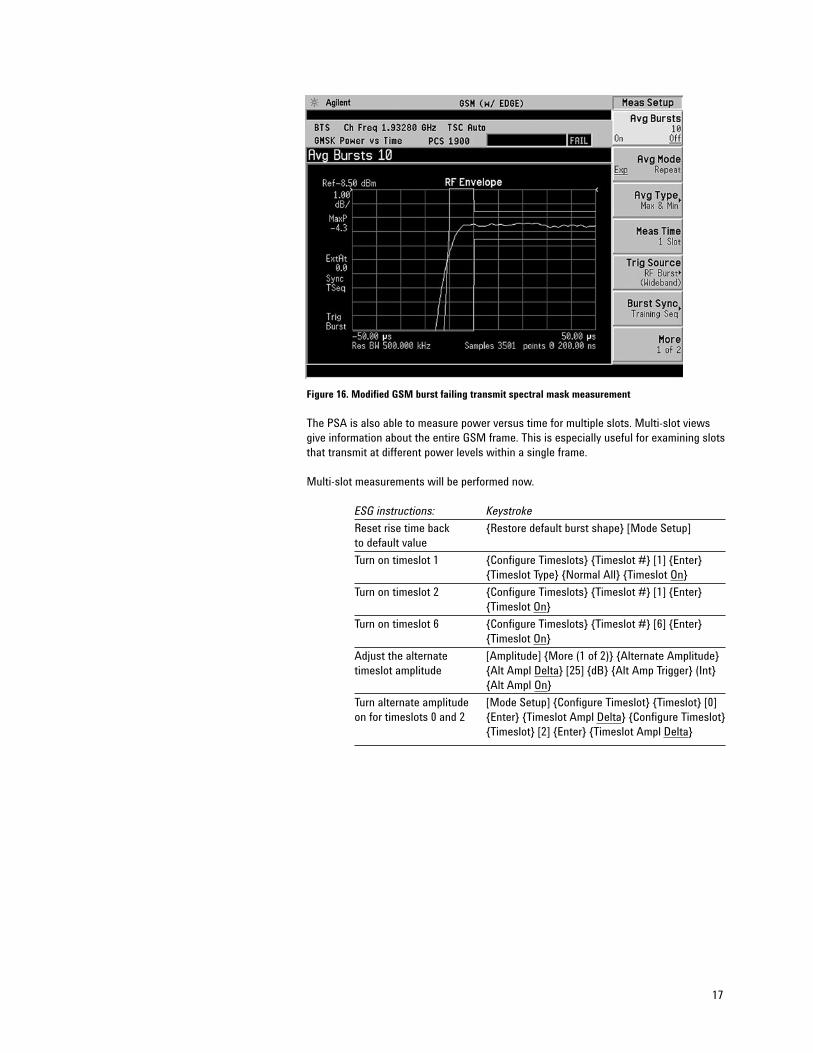
Notice that the measurement is now failing, see figure 16.
Figure 16. Modified GSM burst failing transmit spectral mask measurement
The PSA is also able to measure power versus time for multiple slots. Multi-slot viewsgive information about the entire GSM frame. This is especially useful for examining slotsthat transmit at different power levels within a single frame.
Multi-slot measurements will be performed now.
ESG instructions: Keystroke
Reset rise time back Restore default burst shape [Mode Setup]to default value
Turn on timeslot 1 Configure Timeslots Timeslot # [1] EnterTimeslot Type Normal All Timeslot On
Turn on timeslot 2 Configure Timeslots Timeslot # [1] EnterTimeslot On
Turn on timeslot 6 Configure Timeslots Timeslot # [6] EnterTimeslot On
Adjust the alternate [Amplitude] More (1 of 2) Alternate Amplitudetimeslot amplitude Alt Ampl Delta [25] dB Alt Amp Trigger (Int
Alt Ampl On
Turn alternate amplitude [Mode Setup] Configure Timeslot Timeslot [0]on for timeslots 0 and 2 Enter Timeslot Ampl Delta Configure Timeslot
Timeslot [2] Enter Timeslot Ampl Delta

18
GMSK phase and frequencyPhase and frequency error are the measures of modulation quality for GSM systems.Since GSM systems use relative phase to transmit information, phase and frequencyaccuracy are critical to the system’s performance. In a real system, phase error willreduce the ability of a receiver to correctly demodulate.
Demodulation and signal analysis is complicated by the challenge of synchronizing to the actual GSM signal. The Agilent PSA series has multiple trigger and synchronizationoptions to make measurements simple. In this section, a one-button measurement captures the phase and frequency error information.
PSA instructions: Keystrokes
Measure GMSK phase and [MEASURE] GMSK Phase & Freqfrequency error
Enable the external trigger [Meas Setup] Trig Source Ext RearThe two vertical, white bars in the RF Envelope plot of the lower, left part of the display indicate which timeslot is being measured.
Make the measurements on timeslot 1 [FREQUENCY] Timeslot On [1] [Enter](figure 19)
View the polar vector diagram [Trace/View] I/Q Measured(figures 20 and 22)
View the demodulated I and Q bits Data Bits(figure 23)
Figure 19. Phase and frequency error

19
Figure 20. I/Q polar vector plot
ESG instructions Keystrokes
Add I/Q impairments to [I/Q] I/Q Adjustments I/Q Gain Balance [3] dBthe GSM Signal
Turn on I/Q impairment I/Q Adjustments On
Figure 21. Added I/Q impairments to the GSM signal

20
Figure 22. I/Q polar vector plot of impaired GSM signal
ESG instructions Keystrokes
Turn on I/Q impairment I/Q Adjustments Off
Figure 23. I and Q demodulated bits
Notice that the TS (training sequence or midamble) is highlighted, see figure 23 and 24.The other bits are the other fields of the timeslot. The only portion of the timeslot that isnot demodulated is the guard field. The data is only demodulated to the symbol level,thus for any of the payload data that is channel encoded, will not be decoded to bit level.

21
Figure 24. Portion of GSM Configure Normal Timeslot Menu

22
GMSK output RF spectrum The modulation process in a transmitter causes the continuous wave (CW) carrier tospread spectrally. This is referred to as “spectrum due to modulation and widebandnoise.” Defects in the transmit chain may cause the spectrum to spread excessively,resulting in interference with other frequency bands. Measuring the spectrum due tomodulation can be thought of as making an adjacent channel power (ACP) measurementwhere several adjacent channels are considered.
GSM transmitters ramp RF power rapidly. The transmitted RF carrier power versus timemeasurement is used to ensure that this process happens at the correct times and at thecorrect rate. If RF power is ramped too quickly, undesirable spectral components willarise in the transmitted signal. This upsets the “spectrum due to switching” which again results in interference with other frequency bands.
Spectrum due to modulation and spectrum due to switching measurements are usuallygrouped together and known as the output RF spectrum (ORFS). The GSM 3GPP specifi-cations have particular restrictions on ORFS for a series of frequencies. Verification ofcompliance with the 3GPP specification requires up to 80 dB of dynamic range. The PSAseries has more than enough dynamic range to accomplish this, and a complete ORFSmeasurement (modulation and switching) can be performed in 3 seconds1. Another greatfeature of the PSA series’ ORFS measurement is its ability to represent the spectrum dueto modulation data in either a traditional table format or a spectrum trace with a mask.Both the table and the mask use a pass/fail indicator to signify compliance with theGSM specification.
This exercise explores the ORFS measurement using the PSA
PSA instructions: Keystrokes
Make measurements on timeslot 0 [FREQUENCY] Timeslot Off [Enter]
Activate the ORFS measurement (figure 25) [MEASURE] GMSK Output RF The default setting measures spectrum Spectrum [Meas Setup] due to modulation at multiple offsets. Ofs Freq List StandardThis measurement takes about one second to complete.
Examine spectrum due to modulation at a [Meas Setup] Meas Method single offset (250 kHz) (figure 26) Single Offset
Now measure the spectrum due Meas Type Switchingto switchingGo back to multi-offset measurement Meas Method Multi-OffsetObserve that this measurement is completed in about 2 seconds.
Restore the default measurement More Restore Meas Defaults
[Return]
View ORFS with mask (figure 27) Mod Method SweepThis measurement takes several seconds to complete
1. Remote operation with SCPI commands.

23
Figure 25. ORFS spectrum due to modulation
Figure 26. ORFS spectrum due to modulation at 250 kHz
24
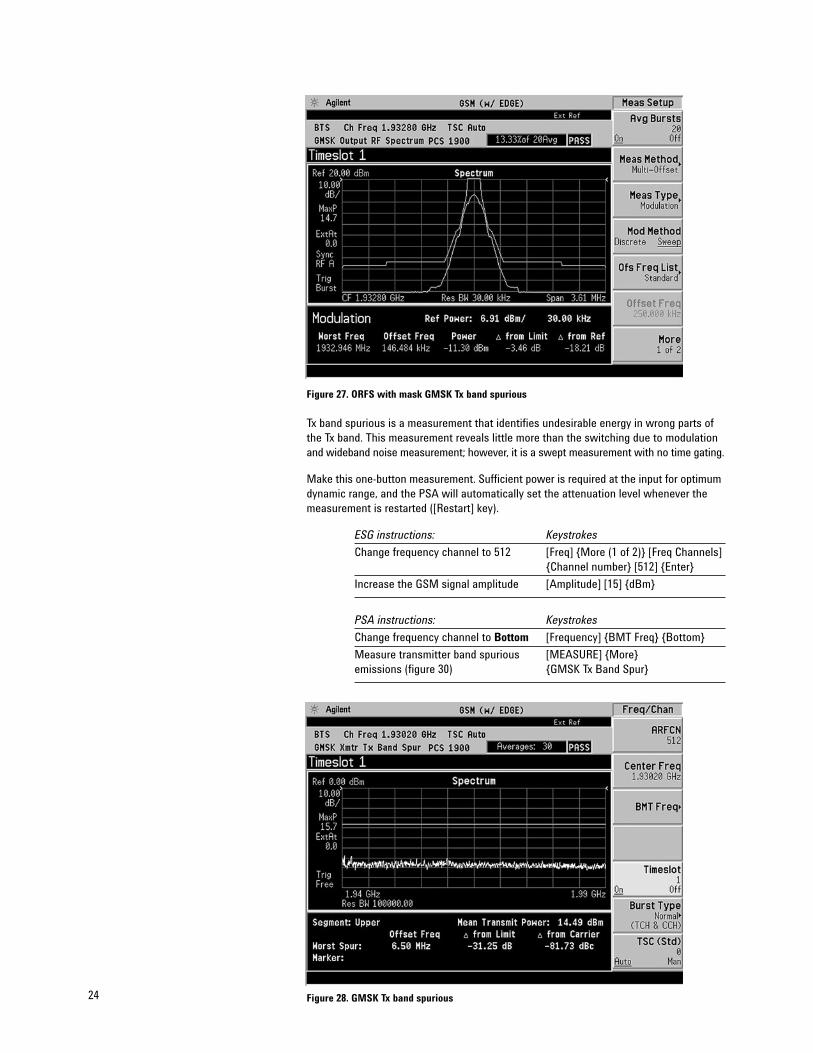
Figure 27. ORFS with mask GMSK Tx band spurious
Tx band spurious is a measurement that identifies undesirable energy in wrong parts ofthe Tx band. This measurement reveals little more than the switching due to modulationand wideband noise measurement; however, it is a swept measurement with no time gating.
Make this one-button measurement. Sufficient power is required at the input for optimumdynamic range, and the PSA will automatically set the attenuation level whenever themeasurement is restarted ([Restart] key).
ESG instructions: Keystrokes
Change frequency channel to 512 [Freq] More (1 of 2) [Freq Channels]Channel number [512] Enter
Increase the GSM signal amplitude [Amplitude] [15] dBm
PSA instructions: Keystrokes
Change frequency channel to Bottom [Frequency] BMT Freq Bottom
Measure transmitter band spurious [MEASURE] More emissions (figure 30) GMSK Tx Band Spur
Figure 28. GMSK Tx band spurious

25
EDGE signal configuration
EDGE has the same spectral characteristics as GSM, as well as the same symbol rateand frame structure (table 1). Therefore many of the EDGE measurements are almost,identical to the GSM measurements. The only measurement that is significantly differentbetween the two signal formats is modulation accuracy. The critical metric for GSM modulation quality is phase error. For EDGE, the modulation quality metric is EVM (error vector magnitude).
Figure 29. The error vector diagram
Figure 29 defines the error vector, a measure of the amplitude and phase differencesbetween the ideal modulated signal and the actual modulated signal. The root-mean-square (rms) of the error vector is computed and expressed as a percentage of thesquare root of the mean power of the ideal signal. This is the error vector magnitude(EVM). EVM is a common modulation quality metric widely used in digital communications.Though the EDGE signal has considerable inter-symbol-interference or ISI, a proprietaryISI compensation algorithm PSA instructions provides both a clear constellation diagramand accurate EVM measurements.
This exercise explores some of the EDGE measurements with emphasis on the EVMmeasurement.
ESG instructions: Keystrokes
Select EDGE mode [Mode Setup] GSM Off [Mode] Real Time TDMA EDGE
Choose EDGE data format Data Format Framed
Turn on EDGE modulation More EDGE On
Set the amplitude to –2 dBm [Amplitude] [-2] dBm
An EDGE burst is transmitted in one timeslot either from the base station or the mobilestation. This burst type configures the timeslot as a traffic channel, which carries eitheruser data or signaling data. The GSM network organizes TCH channels in 26 frame multi-frames. Frames 1 through 12 are TCH channels where the payload is either user data orsignaling information, frame 13 is the slow associated control channel, and frame 26 isan idle channel. However, the ESG doesn’t implement this structure. Whatever timeslot ischosen, is repeated for every TDMA frame. The SACCH is responsible for supervision andcontrol messages, such as power control and timing information. The S field (stealingflag) is reserved to indicate a FACCH (fast associated control channel). This channeltransmits handover information.
Q
I
Magnitude Error
Phase of Error Vector
Measured Signal
Ideal Signal(Reference)
Phase Error
Error Vector
Magnitude of Error Vector
θ
φ
Explore the EDGE menu structure

26
Figure 30. EDGE main menu page 1
A different payload can be selected for each timeslot when in Data Framed mode forNormal, Sync and Access timeslots, pressing the E softkey from within the Configuremenu reveals a menu of choices (see figure 31) for internal data generation (PN9, PN11,PN15, PN20, PN23 or a fixed sequence of data) or the user can choose to supply his owndata. The number of data bits in the E field depends on the timeslot type chosen.
In the EDGE multiframe, MCS-5, MCS-9, E-TCHS/F43.2 and UNCODED are the availablepayload fields.
MCS-5, MCS-9, and UNCODED packets are transmitted in a 52 frame multiframe channel, see TDMA Product Overview for details, literature number 5988-4431EN.Frames 25 and 51 are RF blanked. Frames 12 and 38 are all active. The timeslots withinthese frames are set as follows: T1 (tail bits field 1) = 1s, S1 (stealing bits field 1) = 0sTS (training sequence or midamble) = same as the configured timeslot, S2 = 0s, T2 = 1s,G =1s.
If E-TCH/F43.2 is selected as the payload, frame 12 is RF blanked. All the timeslots in frame 25 are all active. The timeslots within this frames is set as follows: T1 (tail bits field 1) = 1s, S1 (stealing bits field 1) = 0s, TS (training sequence ormidamble) = same as the configured timeslot, S2 = 0s, T2 = 1s, G =1s.
Figure 31. EDGE Normal Burst Configure Timeslot menu
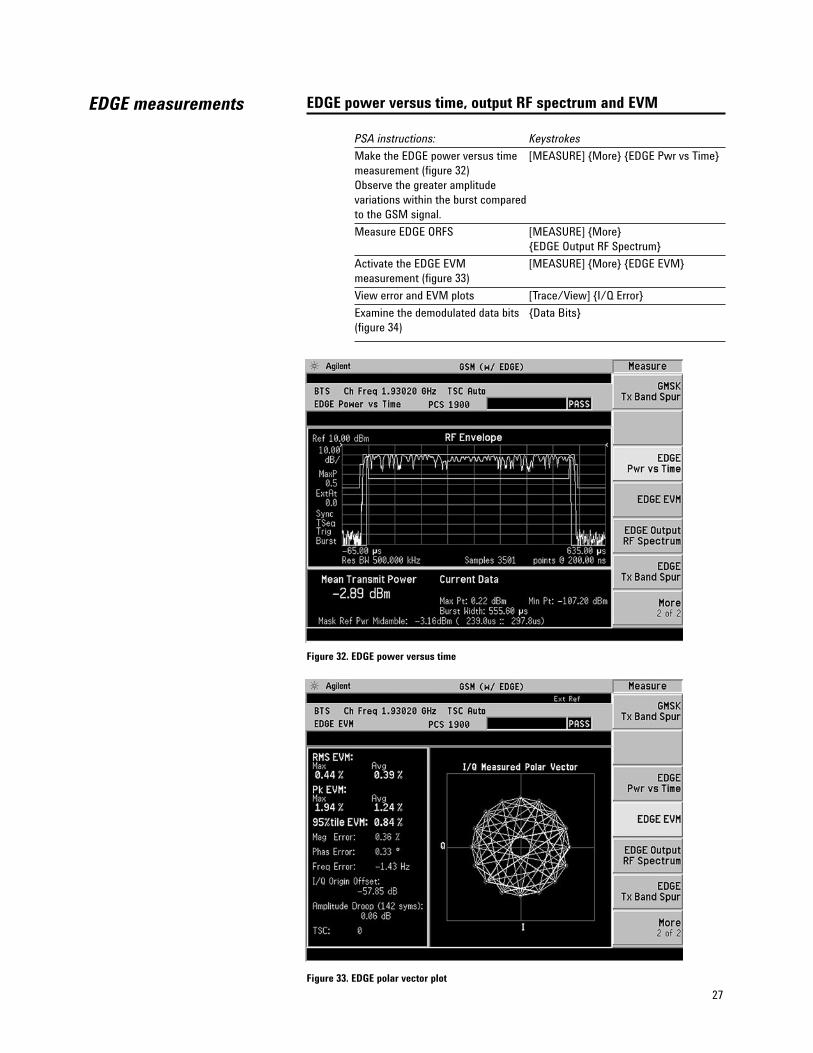
EDGE power versus time, output RF spectrum and EVM
PSA instructions: Keystrokes
Make the EDGE power versus time [MEASURE] More EDGE Pwr vs Timemeasurement (figure 32)Observe the greater amplitude variations within the burst compared to the GSM signal.
Measure EDGE ORFS [MEASURE] More EDGE Output RF Spectrum
Activate the EDGE EVM [MEASURE] More EDGE EVMmeasurement (figure 33)
View error and EVM plots [Trace/View] I/Q Error
Examine the demodulated data bits Data Bits(figure 34)
Figure 32. EDGE power versus time
Figure 33. EDGE polar vector plot
27
EDGE measurements

28
Figure 34. EDGE demodulated data bits
EDGE multicarrier waveform creation and spectrum viewThe GSM and EDGE test signals created thus far are single carrier real-time GSM andEDGE test signals. The ESG can also create multicarrier GSM waveforms or multicarrierEDGE waveforms. These waveforms are non-framed and non-bursted GSM or EDGE testsignals. The multicarrier waveform creation feature is included at no additional chargewith the baseband generator.
ESG instructions: Keystrokes
Create a multicarrier EDGE EDGE Off [Mode] Custom (3p/8 8-PSK) modulated waveform. ARB Waveform Generator
Turn on multicarrier feature Multicarrier On
Create a multicarrier EDGE waveform Multicarrier Define Initialize TableCarrier Setup EDGE
Create 4 EDGE modulated carriers # of carriers [4] Enter
Space the EDGE modulated carriers Frequency Spacing [500] kHz500 kHz apart (this is the GSM or EDGE Donechannel spacing)
Apply the multicarrier waveform Apply multicarrier
Make the starting phase of the EDGE More (1 of 2) Carrier Phases Randommodulated carriers Random with respect to one another
Turn on the digital modulation [Mode Setup] Digital Modulation On

29
Figure 35. Digital Modulation menu for creating a multicarrier EDGE modulated waveform
Notice the ARB EDGE setup automatically sets the filter to EDGE, and the symbol rate to270.833 ksps as the standard requires.
The waveform can be clipped if desired. The following steps tell how custom waveformcan be clipped.
ESG instructions: Keystrokes
Select the waveform from [Mode] Dual ARB Select Waveform WFM1:the Dual ARB menu AUTOGEN_WAVEFORM
Turn ARB on ARB On
Now clip the waveform to 65% Waveform Segments StoreWaveform Utilities Clipping |I+jQ| Clip To [65] % Apply to Waveform
Figure 36. ARB waveform clipping menu
More details about waveform clipping can be found in the Agilent ESG Vector SignalGenerator Users Guide, part number E4400-90503.

30
PSA instructions: Keystrokes
Change the instrument settings to [Mode] Spectrum Analysisspectrum analysis mode
Change the Frequency Channel Center Frequency [1.93020] GHzto that of the PSA
Change the span [Span] [5] MHz
Turn on averaging [BW/Avg] Average On
Figure 37. Spectrum of 4 EDGE modulated carriers spaced 500 kHz apart
31
Related Agilent literatureBrochures
Agilent E4438C ESG Vector Signal GeneratorPublication number 5988-3935EN
Wireless 3G SolutionsPublication number 5968-5860
Data sheetsE4438C ESG Vector Signal Generator
Publication number 5988-4039EN
Configuration guidesE4438C ESG Vector Signal Generator
Publication number 5988-4085EN
Application notesDigital Modulation in Communication Systems-An Introduction
Publication number 5965-7160EMeasuring Edge Signals – New and Modified Techniques and Measurement Requirements Application note 1361
Publication number 5980-2580ENTesting and Troubleshooting Digital RF Communications Transmitter Designs -Application note 1313
Publication number 5968-3578E Understanding GSM Transmitter and Receiver Measurements for Base Transceiver Stations and their Components - Application note 1312
Publication number 5968-2320E Testing and Troubleshooting Digital RF Communications Receiver Designs
Publication number 5968-3579ECharacterizing Digitally Modulated Signals with CCDF Curves
Publication number 5968-6875E
Product overviewsReal-time TDMA Firmware Option for the E4438C ESG Vector Signal Generator – Option 402
Publication number 5988-4311EN
Other Agilent productsWireless Communications Products
Publication number 5968-6174ECDMA Solutions
Publication number 5966-3058EAgilent E4406A Vector Signal Analyzer
Publication number 5968-7618EAgilent E4440E Performance Spectrum Analyzer
Publication number 5980-1284ESee www.agilent.com for more information

By internet, phone, or fax, get assistancewith all your test and measurement needs.
Online Assistancewww.agilent.com/find/assistPhone or FaxUnited States:(tel) 1 800 452 4844
Canada:(tel) 1 877 894 4414(fax) (905) 282 6495
China:(tel) 800-810-0189(fax) 1-0800-650-0121
Europe:(tel) (31 20) 547 2323(fax) (31 20) 547 2390
Japan:(tel) (81) 426 56 7832(fax) (81) 426 56 7840
Korea:(tel) (82-2) 2004-5004 (fax) (82-2) 2004-5115
Latin America:(tel) (305) 269 7500(fax) (305) 269 7599
Taiwan:(tel) 080-004-7866 (fax) (886-2) 2545-6723
Other Asia Pacific Countries:(tel) (65) 375-8100 (fax) (65) 836-0252Email: [email protected]
Product specifications and descriptions in this document subject to change without notice.
Copyright © 2002 Agilent Technologies, Inc.Printed in U.S.A. March 13, 20025988-4948EN
See the ESG family Web page for the latest informationGet the latest news, product and support information,application literature, firmware upgrades and more. Agilent’s Internet address for the ESG family is:
www.agilent.com/find/esg
Agilent Technologies’ Test and Measurement Support, Services, and AssistanceAgilent Technologies aims to maximize the value youreceive, while minimizing your risk and problems. Westrive to ensure that you get the test and measurementcapabilities you paid for and obtain the support youneed. Our extensive support resources and servicescan help you choose the right Agilent products for your applications and apply them successfully. Every instrument and system we sell has a global warranty.Support is available for at least five years beyond theproduction life of the product. Two concepts underlieAgilent’s overall support policy: “Our Promise” and“Your Advantage.”
Our Promise“Our Promise” means your Agilent test and measurementequipment will meet its advertised performance andfunctionality. When you are choosing new equipment,we will help you with product information, includingrealistic performance specifications and practical recommendations from experienced test engineers.When you use Agilent equipment, we can verify that it works properly, help with product operation, andprovide basic measurement assistance for the use ofspecified capabilities, at no extra cost upon request.Many self-help tools are available.
Your Advantage“Your Advantage” means that Agilent offers a wide rangeof additional expert test and measurement services,which you can purchase according to your unique technical and business needs. Solve problems efficientlyand gain a competitive edge by contracting with us forcalibration, extra-cost upgrades, out-of-warranty repairs,and on-site education and training, as well as design,system integration, project management, and other professional services. Experienced Agilent engineersand technicians can help you maximize your productivity,optimize the return on investment of your Agilentinstruments and systems, and obtain dependable measurement accuracy for the life of those products.