Embed Size (px)
Citation preview
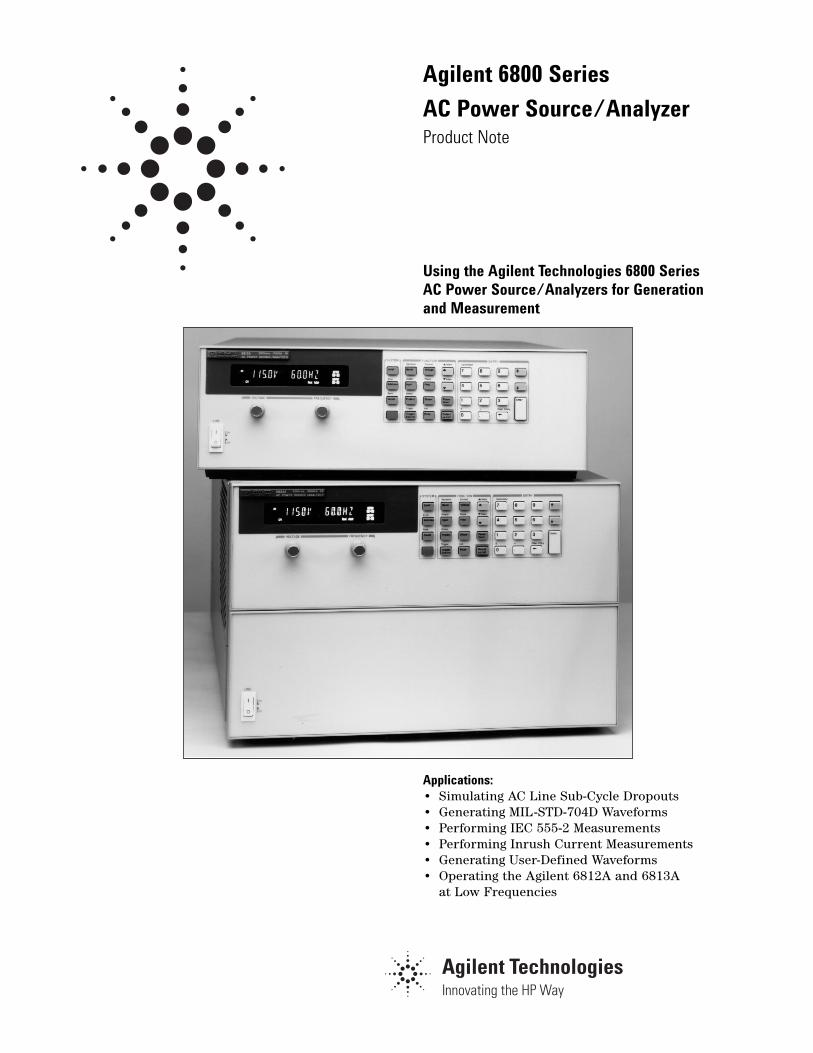
Agilent 6800 Series
AC Power Source/AnalyzerProduct Note
Using the Agilent Technologies 6800 Series AC Power Source/Analyzers for Generation and Measurement
Applications:• Simulating AC Line Sub-Cycle Dropouts• Generating MIL-STD-704D Waveforms• Performing IEC 555-2 Measurements• Performing Inrush Current Measurements• Generating User-Defined Waveforms• Operating the Agilent 6812A and 6813A
at Low Frequencies
2
3468
111418212428
IntroductionThis note provides information on how you can use the features of the Agilent Technologies 6800series ac power source/analyzers to address a variety of applications. Although your exact appli-cation may not be listed here, the capabilitiesdescribed can be generalized and applied to yourspecific needs. The programming examples aregiven in QBASIC.
These are the capabilities that are discussed and a description of how they can be applied:
Table of Contents
Introduction to the Agilent 6800 AC Power Source/AnalyzerAgilent 6800 Series Output TransientsAgilent 6800 Series TriggeringAgilent 6800 Series MeasurementsApplication 1: Simulating AC Line Sub-Cycle DropoutsApplication 2: Generating MIL-STD-704D WaveformsApplication 3: Performing IEC 555-2 MeasurementsApplication 4: Performing Inrush Current MeasurementsApplication 5: Generating User-Defined WaveformsApplication 6: Operating the Agilent 6812A and 6813A
at Low Frequencies
3
The 6800 series ac power source/analyzers aremembers of the Agilent Technologies “One-Box”Solution power products family. These productsoffer an integrated solution for ac power testingapplications.
The 6800 series combines the functionality of thefollowing instruments in one box:
• power amplifier • arbitrary waveform generator • power analyzer • harmonic analyzer • waveform digitizer
The power amplifier and arbitrary waveform generator capabilities produce waveforms withprogrammable amplitude, frequency, and wave-shape. Each model has pre-programmed sine,square, and clipped sine waveshapes. For addedflexibility, twelve user-defined waveforms can be created and stored in non-volatile memory.
Waveforms can be programmed using the 6800series transient generation system to simulatesophisticated and repeatable ac line disturbancesor output sequences.
The power analyzer and harmonic analyzer capa-bilities provide high precision measurementsincluding:
• rms, dc, ac+dc voltage and current • peak voltage and current • real, apparent, and reactive power• harmonic analysis of voltage and current wave-
forms providing amplitude and phase up to the50th harmonic
• total harmonic distortion• triggered acquisition of digitized voltage and
current
The 6800 series can be used in bench or ATE appli-cations. The fully featured front panel and built-inGPIB and RS-232 interfaces allow you to programwaveforms, measure parameters, and monitor thestatus of the ac power source/analyzer.
Each model features a SCPI (Standard Commandsfor Programmable Instruments) command set. Thisindustry standard command set simplifies test sys-tem development by offering command set common-ality between all types of instrumentation. Instru-ments performing the same function use the sameself-documenting SCPI instructions. For example,the same commands are used to program a wave-shape on the 6800 series ac power source/analyzersas on a function generator. Because you spend lesstime learning device commands, you can get yourapplication up and running faster.
The following sections of this product note explainhow to optimize your usage of the features of the6800 series products. At the end of this productnote there are practical examples that show howthese features can be applied.
Introduction to the Agilent 6800 AC Power Source/Analyzer
4
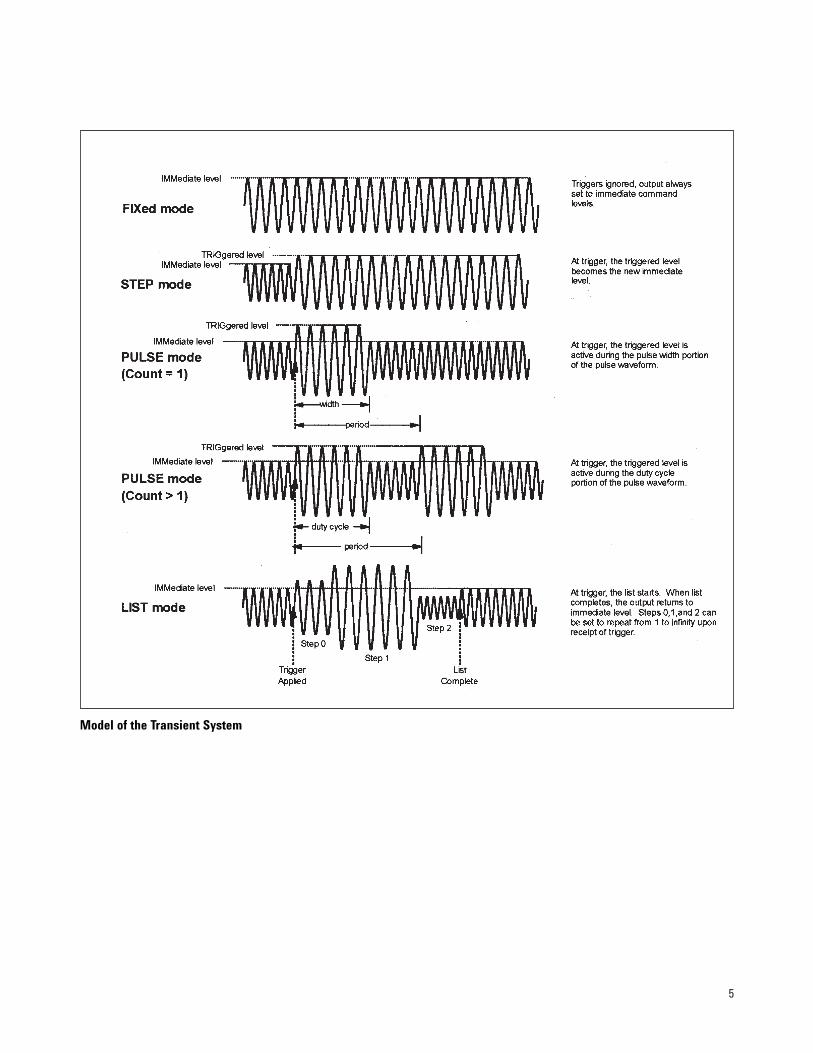
A programmable output value of the ac powersource/analyzer can operate in one of four modes:FIXED, Step, Pulse, or List. The default setting isFIXED mode, where the output will stay “fixed” atthe programmed value until another command issent to change it. The remaining three operatingmodes constitute the Transient Subsystem. Outputtransients are used to:
• synchronize output changes with a particularphase of the voltage waveform
• synchronize output changes with trigger signals• simulate ac line disturbances with precise dura-
tion and phase control• create sequences of output changes
Output transients are triggered actions and willcause the output of the ac power source/analyzerto react in a manner defined by the selected mode.
What Programmable Functions can beControlled by the Transient Subsystem?The 6800 series provides control of many outputparameters. Most of these can be programmed asan output transient. The following output parame-ters are subject to transient control:
• ac output voltage• dc output voltage (Agilent 6812A and 6813A only)• frequency • phase (Agilent 6834A only) • waveform shape • ac voltage slew rate • dc voltage slew rate (6812A and 6813A only) • frequency slew rate • peak current limit (6812A and 6813A only) • rms current limit • dwell time (List mode only)
Upon receipt of a trigger, an output parameter setto Step, Pulse, or List mode will transition from animmediate level (its initial output setting) to one ormore levels (successive output settings). The num-ber of successive output settings is, in part, whatdifferentiates one transient mode from another.
What is a STEP Transient?A Step transient generates a single triggered out-put change (from an immediate output level toONE successive output level) of one or more of theoutput parameters subject to transient control.Only output parameters programmed to Step modewill be part of the triggered action. The output will remain at the final output level once the Steptransient is complete.
What is a PULSE Transient?A Pulse transient generates a triggered outputchange that returns to its immediate output levelafter a programmed time period. A Pulse transientcan also be programmed to repeat the outputchange more than once or continuously.
What is a LIST Transient?A List transient generates a sequence of outputchanges. Each output change of the sequence iscalled a List point. All parameters subject to tran-sient control can be programmed at each List point.
A List can contain up to one hundred points. Thelist of points can be programmed to execute onceor to repeat from one to an infinite number of times.
Agilent’s 6800 series List points can be paced byexternal triggers. When paced by triggers, the out-put will remain at a particular List point until atrigger is received. Only then will it proceed to thenext programmed point.
List points can also be paced by individual pro-grammable dwell time parameters associated withevery point. Only when the dwell time for a partic-ular List point expires will it proceed to the nextList point.
Once the List is completed, the output returns tothe immediate levels.
Agilent 6800 Series Output Transients
5
Model of the Transient System
6
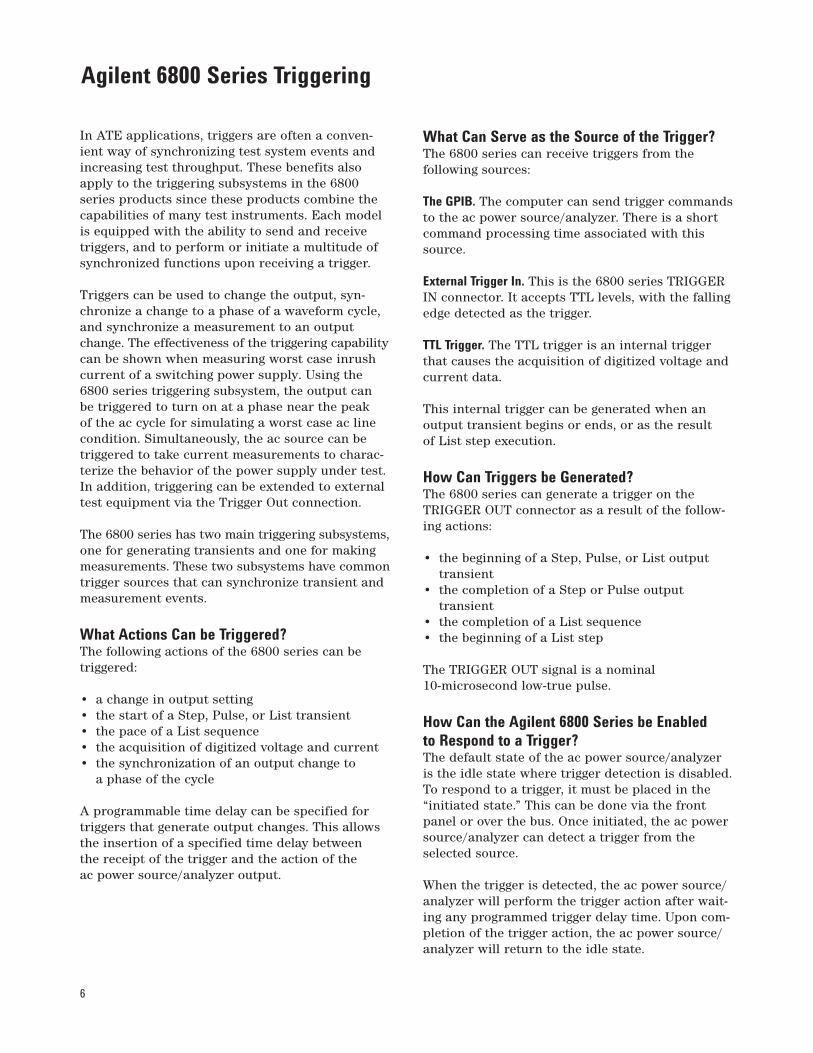
In ATE applications, triggers are often a conven-ient way of synchronizing test system events andincreasing test throughput. These benefits alsoapply to the triggering subsystems in the 6800series products since these products combine thecapabilities of many test instruments. Each modelis equipped with the ability to send and receivetriggers, and to perform or initiate a multitude ofsynchronized functions upon receiving a trigger.
Triggers can be used to change the output, syn-chronize a change to a phase of a waveform cycle,and synchronize a measurement to an outputchange. The effectiveness of the triggering capabilitycan be shown when measuring worst case inrushcurrent of a switching power supply. Using the6800 series triggering subsystem, the output can be triggered to turn on at a phase near the peak of the ac cycle for simulating a worst case ac linecondition. Simultaneously, the ac source can betriggered to take current measurements to charac-terize the behavior of the power supply under test. In addition, triggering can be extended to externaltest equipment via the Trigger Out connection.
The 6800 series has two main triggering subsystems,one for generating transients and one for makingmeasurements. These two subsystems have commontrigger sources that can synchronize transient andmeasurement events.
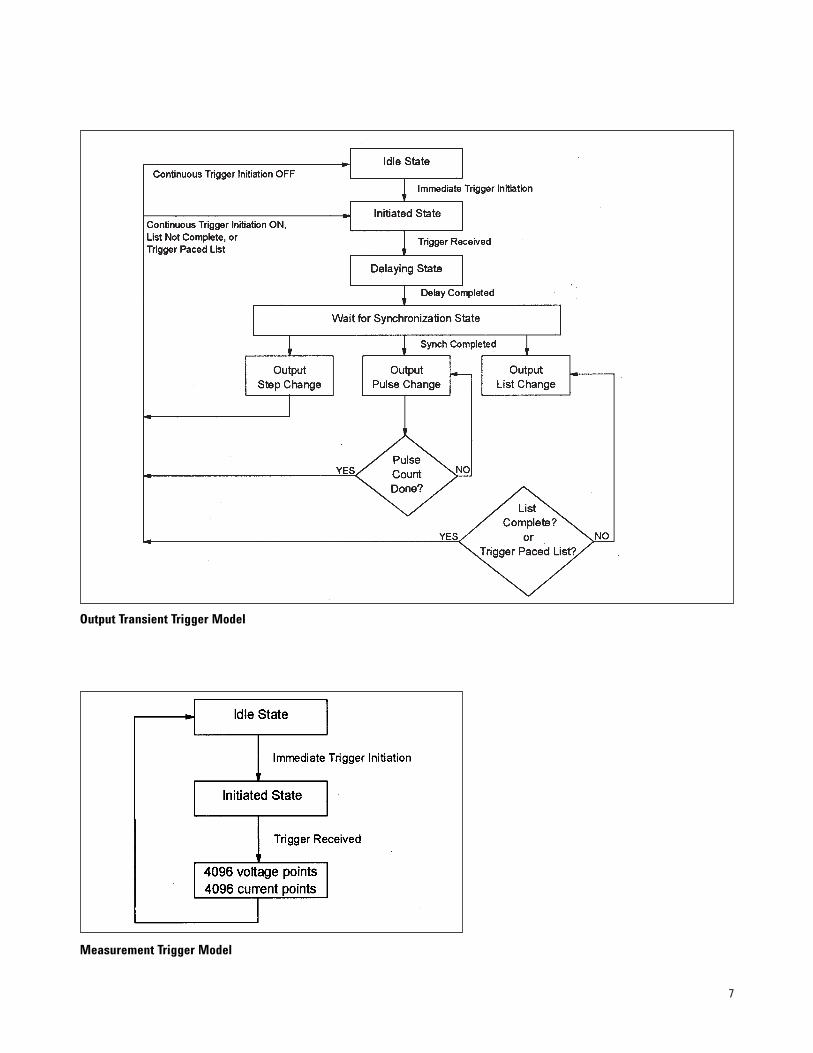
What Actions Can be Triggered?The following actions of the 6800 series can be triggered:
• a change in output setting• the start of a Step, Pulse, or List transient • the pace of a List sequence • the acquisition of digitized voltage and current • the synchronization of an output change to
a phase of the cycle
A programmable time delay can be specified fortriggers that generate output changes. This allowsthe insertion of a specified time delay between the receipt of the trigger and the action of the ac power source/analyzer output.
What Can Serve as the Source of the Trigger?The 6800 series can receive triggers from the following sources:
The GPIB. The computer can send trigger commandsto the ac power source/analyzer. There is a shortcommand processing time associated with thissource.
External Trigger In. This is the 6800 series TRIGGERIN connector. It accepts TTL levels, with the fallingedge detected as the trigger.
TTL Trigger. The TTL trigger is an internal triggerthat causes the acquisition of digitized voltage andcurrent data.
This internal trigger can be generated when an output transient begins or ends, or as the result of List step execution.
How Can Triggers be Generated?The 6800 series can generate a trigger on the TRIGGER OUT connector as a result of the follow-ing actions:
• the beginning of a Step, Pulse, or List outputtransient
• the completion of a Step or Pulse output transient
• the completion of a List sequence• the beginning of a List step
The TRIGGER OUT signal is a nominal 10-microsecond low-true pulse.
How Can the Agilent 6800 Series be Enabled to Respond to a Trigger?The default state of the ac power source/analyzeris the idle state where trigger detection is disabled.To respond to a trigger, it must be placed in the“initiated state.” This can be done via the frontpanel or over the bus. Once initiated, the ac powersource/analyzer can detect a trigger from theselected source.
When the trigger is detected, the ac power source/analyzer will perform the trigger action after wait-ing any programmed trigger delay time. Upon com-pletion of the trigger action, the ac power source/analyzer will return to the idle state.
Agilent 6800 Series Triggering
7
Output Transient Trigger Model
Measurement Trigger Model
8
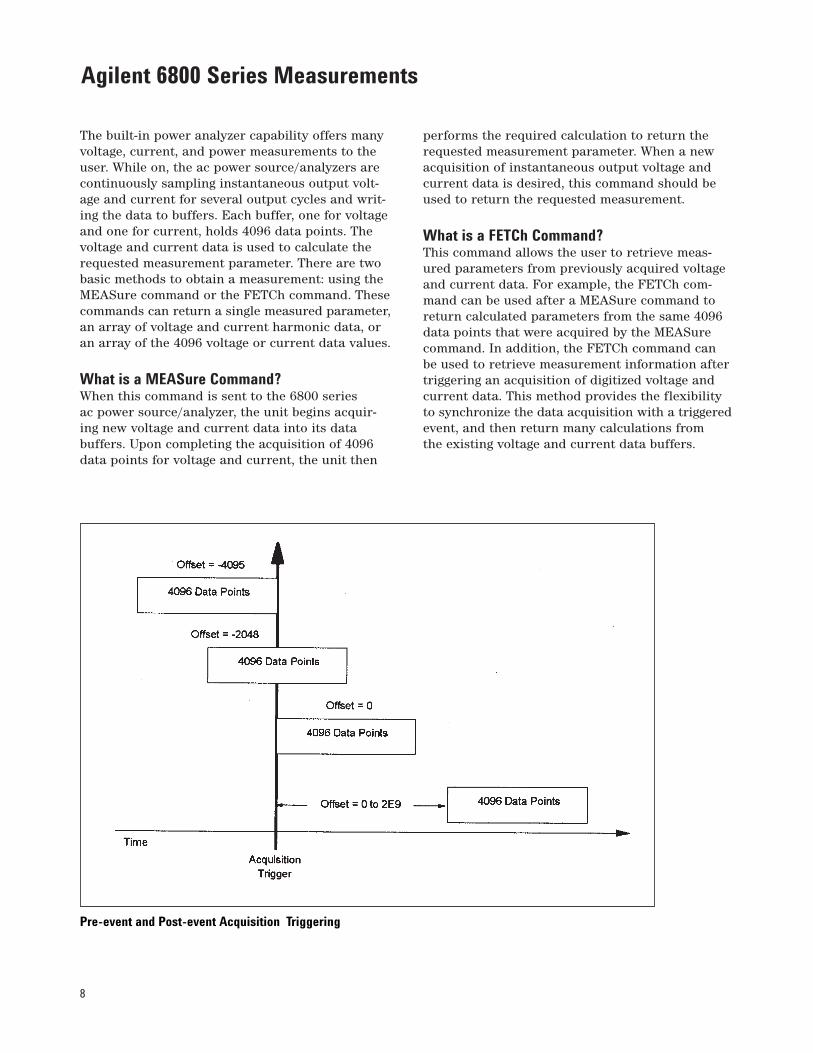
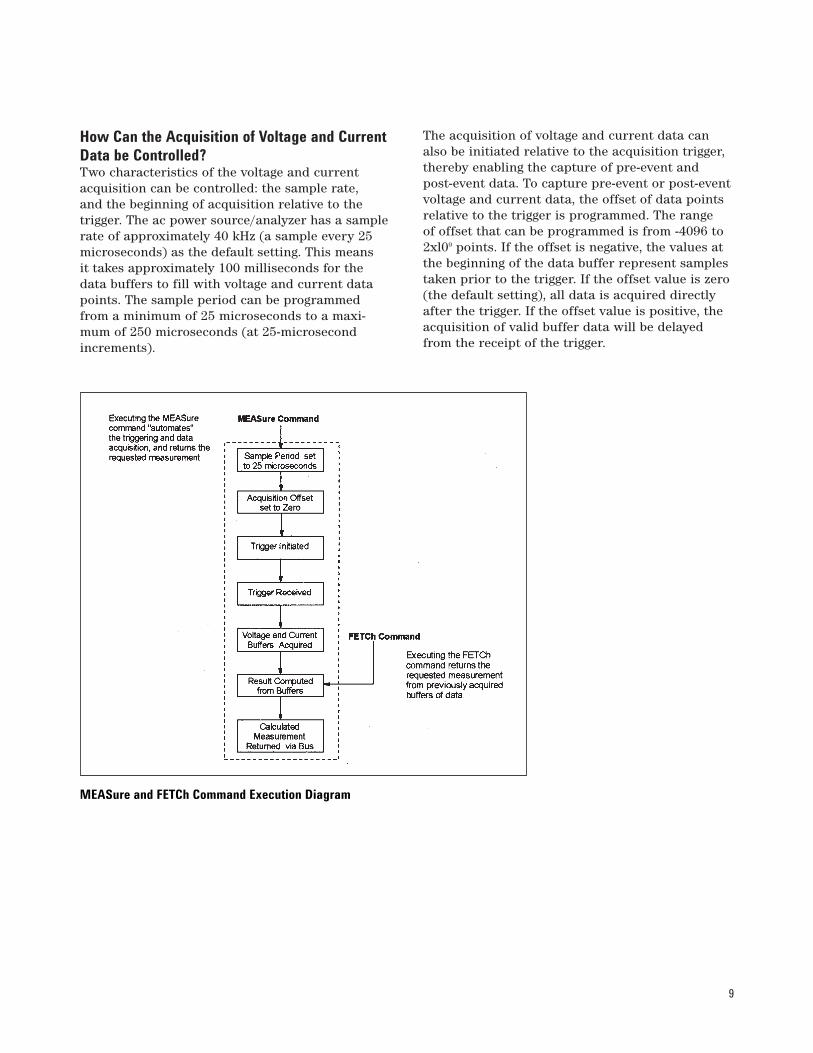
The built-in power analyzer capability offers manyvoltage, current, and power measurements to theuser. While on, the ac power source/analyzers arecontinuously sampling instantaneous output volt-age and current for several output cycles and writ-ing the data to buffers. Each buffer, one for voltageand one for current, holds 4096 data points. Thevoltage and current data is used to calculate therequested measurement parameter. There are twobasic methods to obtain a measurement: using theMEASure command or the FETCh command. Thesecommands can return a single measured parameter,an array of voltage and current harmonic data, oran array of the 4096 voltage or current data values.
What is a MEASure Command?When this command is sent to the 6800 series ac power source/analyzer, the unit begins acquir-ing new voltage and current data into its databuffers. Upon completing the acquisition of 4096data points for voltage and current, the unit then
performs the required calculation to return therequested measurement parameter. When a newacquisition of instantaneous output voltage andcurrent data is desired, this command should beused to return the requested measurement.
What is a FETCh Command?This command allows the user to retrieve meas-ured parameters from previously acquired voltageand current data. For example, the FETCh com-mand can be used after a MEASure command toreturn calculated parameters from the same 4096data points that were acquired by the MEASurecommand. In addition, the FETCh command can be used to retrieve measurement information aftertriggering an acquisition of digitized voltage andcurrent data. This method provides the flexibilityto synchronize the data acquisition with a triggeredevent, and then return many calculations from the existing voltage and current data buffers.
Agilent 6800 Series Measurements
Pre-event and Post-event Acquisition Triggering
9
How Can the Acquisition of Voltage and CurrentData be Controlled?Two characteristics of the voltage and currentacquisition can be controlled: the sample rate, and the beginning of acquisition relative to thetrigger. The ac power source/analyzer has a samplerate of approximately 40 kHz (a sample every 25microseconds) as the default setting. This means it takes approximately 100 milliseconds for thedata buffers to fill with voltage and current datapoints. The sample period can be programmedfrom a minimum of 25 microseconds to a maxi-mum of 250 microseconds (at 25-microsecondincrements).
The acquisition of voltage and current data canalso be initiated relative to the acquisition trigger,thereby enabling the capture of pre-event and post-event data. To capture pre-event or post-eventvoltage and current data, the offset of data pointsrelative to the trigger is programmed. The range of offset that can be programmed is from -4096 to2xl09 points. If the offset is negative, the values atthe beginning of the data buffer represent samplestaken prior to the trigger. If the offset value is zero(the default setting), all data is acquired directlyafter the trigger. If the offset value is positive, theacquisition of valid buffer data will be delayedfrom the receipt of the trigger.
MEASure and FETCh Command Execution Diagram
10
The following section contains six applicationexamples. For each application, there is:
• An overview of the application• A description of the Agilent 6800 series features
used to implement the application• The advantages and benefits of the 6800 series
solution
• The details of the implementation of the solution• A sample program in QBASIC using the National
GPIB interface card• A description of variations on the application
(if applicable)
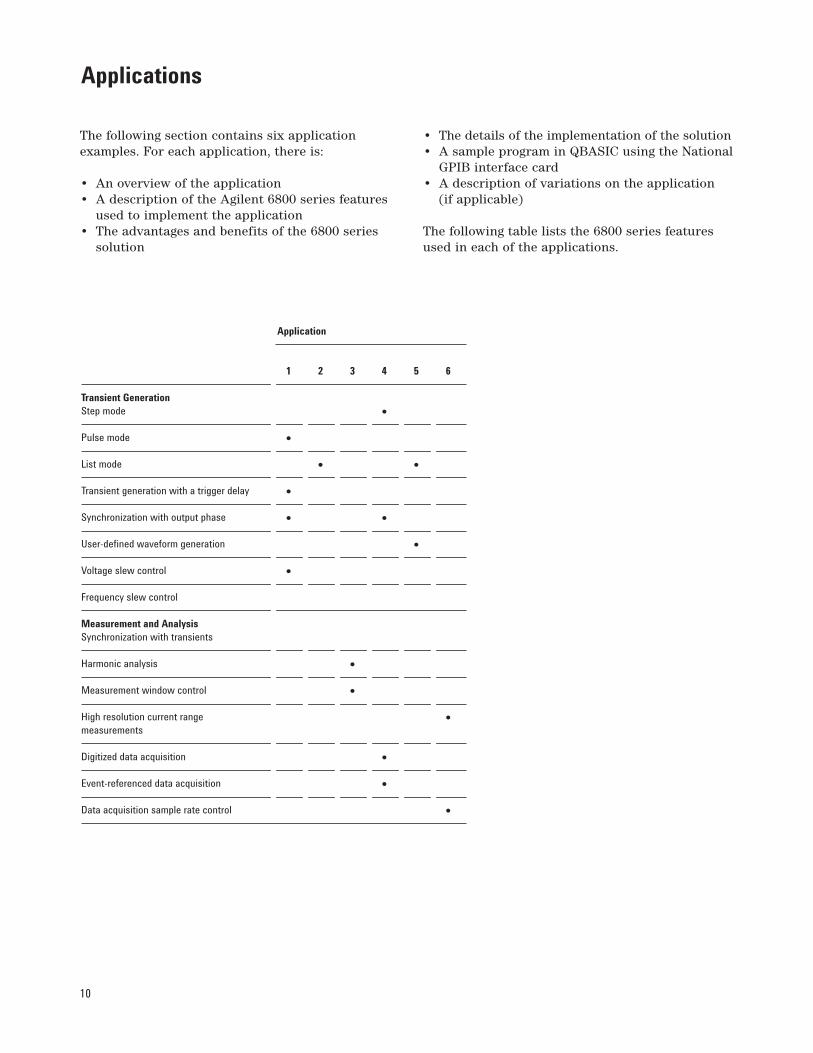
The following table lists the 6800 series featuresused in each of the applications.
Applications
Application
1 2 3 4 5 6
Transient GenerationStep mode •Pulse mode •List mode • •Transient generation with a trigger delay •Synchronization with output phase • •User-defined waveform generation •Voltage slew control •Frequency slew control
Measurement and AnalysisSynchronization with transients
Harmonic analysis •Measurement window control •High resolution current range •measurements
Digitized data acquisition •Event-referenced data acquisition •Data acquisition sample rate control •
11
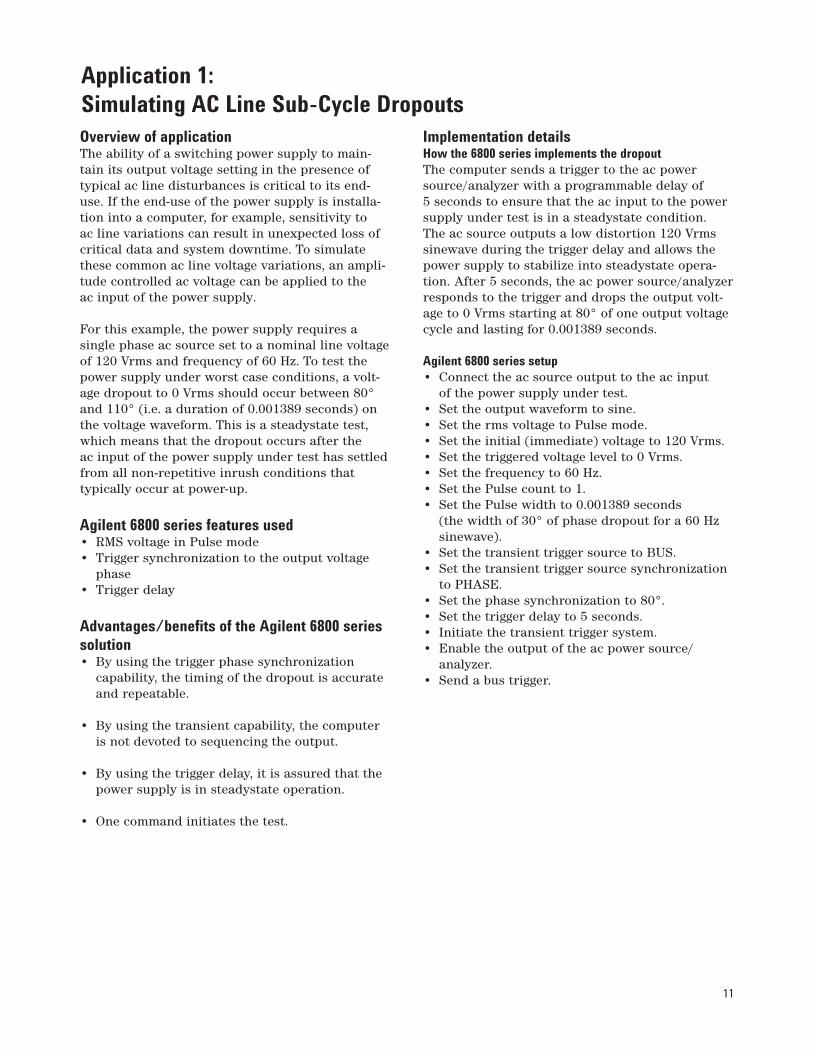
Overview of applicationThe ability of a switching power supply to main-tain its output voltage setting in the presence oftypical ac line disturbances is critical to its end-use. If the end-use of the power supply is installa-tion into a computer, for example, sensitivity to ac line variations can result in unexpected loss ofcritical data and system downtime. To simulatethese common ac line voltage variations, an ampli-tude controlled ac voltage can be applied to the ac input of the power supply.
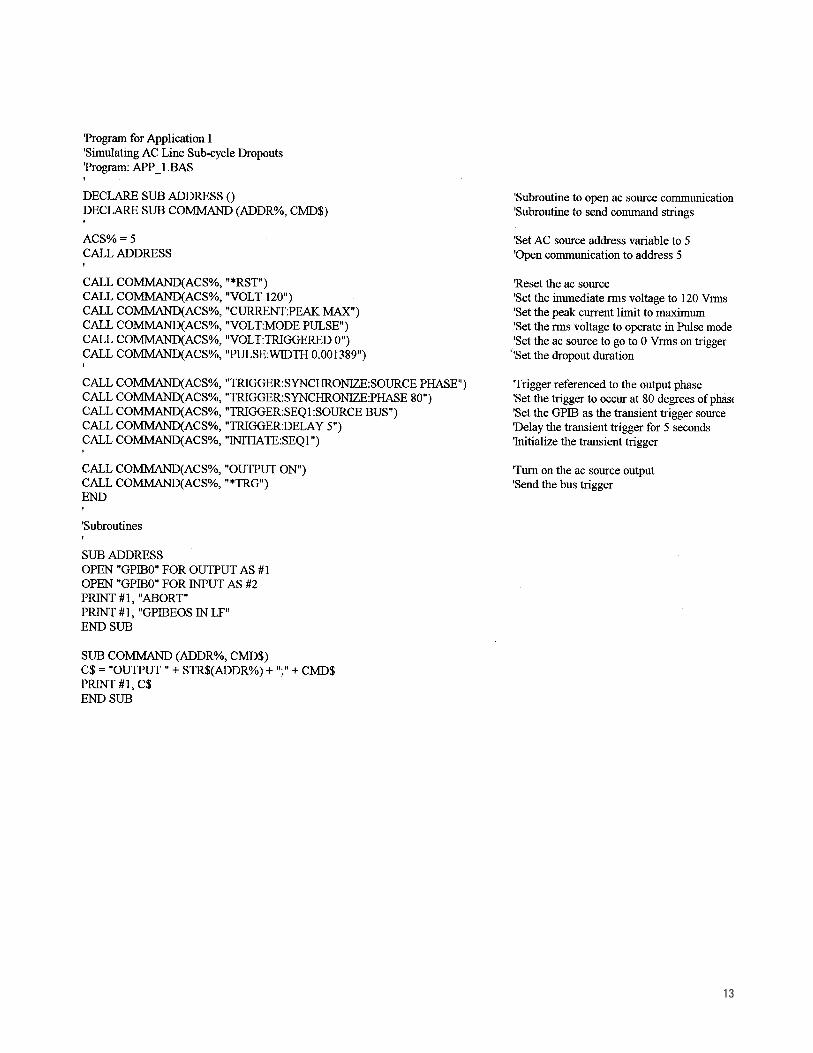
For this example, the power supply requires a single phase ac source set to a nominal line voltageof 120 Vrms and frequency of 60 Hz. To test thepower supply under worst case conditions, a volt-age dropout to 0 Vrms should occur between 80°and 110° (i.e. a duration of 0.001389 seconds) onthe voltage waveform. This is a steadystate test,which means that the dropout occurs after the ac input of the power supply under test has settledfrom all non-repetitive inrush conditions that typically occur at power-up.
Agilent 6800 series features used• RMS voltage in Pulse mode• Trigger synchronization to the output voltage
phase• Trigger delay
Advantages/benefits of the Agilent 6800 seriessolution• By using the trigger phase synchronization
capability, the timing of the dropout is accurateand repeatable.
• By using the transient capability, the computeris not devoted to sequencing the output.
• By using the trigger delay, it is assured that thepower supply is in steadystate operation.
• One command initiates the test.
Implementation detailsHow the 6800 series implements the dropoutThe computer sends a trigger to the ac powersource/analyzer with a programmable delay of 5 seconds to ensure that the ac input to the powersupply under test is in a steadystate condition. The ac source outputs a low distortion 120 Vrmssinewave during the trigger delay and allows thepower supply to stabilize into steadystate opera-tion. After 5 seconds, the ac power source/analyzerresponds to the trigger and drops the output volt-age to 0 Vrms starting at 80° of one output voltagecycle and lasting for 0.001389 seconds.
Agilent 6800 series setup• Connect the ac source output to the ac input
of the power supply under test.• Set the output waveform to sine.• Set the rms voltage to Pulse mode.• Set the initial (immediate) voltage to 120 Vrms.• Set the triggered voltage level to 0 Vrms.• Set the frequency to 60 Hz.• Set the Pulse count to 1.• Set the Pulse width to 0.001389 seconds
(the width of 30° of phase dropout for a 60 Hzsinewave).
• Set the transient trigger source to BUS.• Set the transient trigger source synchronization
to PHASE.• Set the phase synchronization to 80°.• Set the trigger delay to 5 seconds.• Initiate the transient trigger system.• Enable the output of the ac power source/
analyzer.• Send a bus trigger.
Application 1: Simulating AC Line Sub-Cycle Dropouts
12
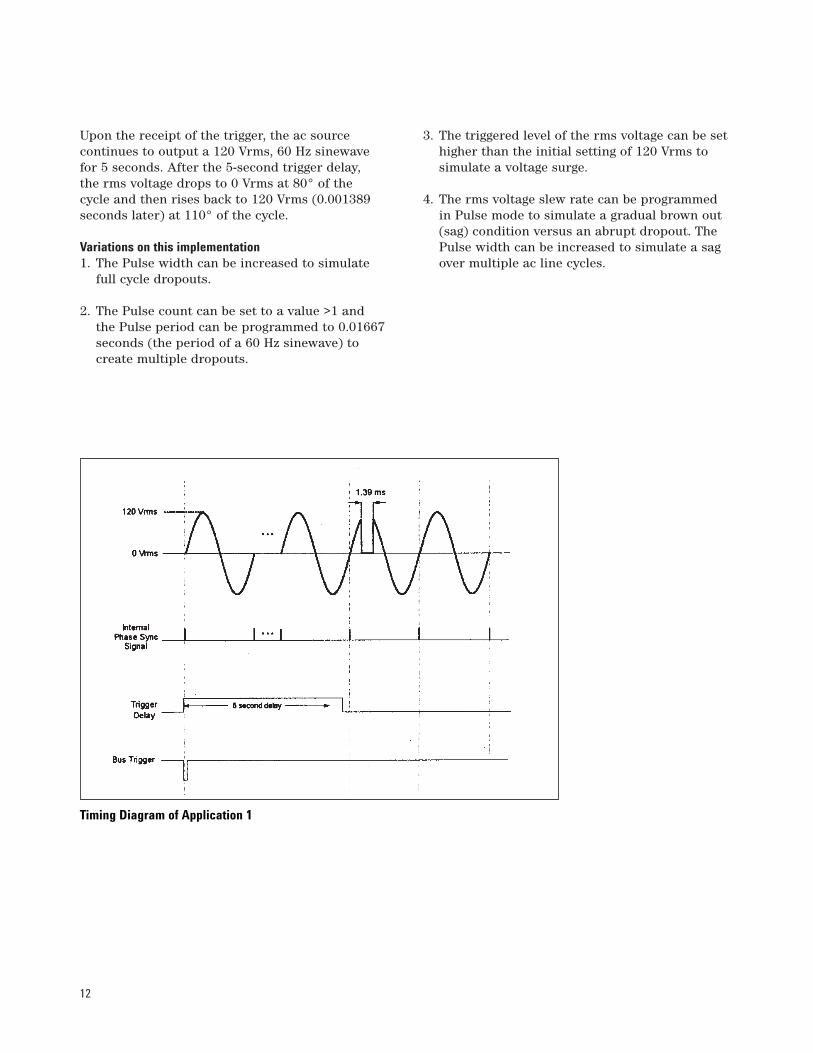
Upon the receipt of the trigger, the ac source continues to output a 120 Vrms, 60 Hz sinewave for 5 seconds. After the 5-second trigger delay, the rms voltage drops to 0 Vrms at 80° of the cycle and then rises back to 120 Vrms (0.001389seconds later) at 110° of the cycle.
Variations on this implementation1. The Pulse width can be increased to simulate
full cycle dropouts.
2. The Pulse count can be set to a value >1 and the Pulse period can be programmed to 0.01667seconds (the period of a 60 Hz sinewave) to create multiple dropouts.
3. The triggered level of the rms voltage can be sethigher than the initial setting of 120 Vrms tosimulate a voltage surge.
4. The rms voltage slew rate can be programmed in Pulse mode to simulate a gradual brown out(sag) condition versus an abrupt dropout. ThePulse width can be increased to simulate a sagover multiple ac line cycles.
Timing Diagram of Application 1
13
14
Overview of applicationU.S. Military Standard 704D (September 30, 1980)establishes the requirements of electrical powertransfer between the aircraft or ground supportelectrical system, and the electronic equipment utilizing this power on board the aircraft. Whentesting to this standard, electrical aircraft equip-ment must be subjected to voltage and frequencytransients that can occur under normal operation,emergency power operation, and during powersource transfers.
The “pass” criteria for aircraft equipment is depend-ent upon the specification of the equipment undertest. In general, the intent of the test is that:
• the equipment is permitted a degradation orloss of function unless required otherwise by its specifications
• the equipment is not permitted to produce adamaging or unsafe condition
• the equipment must automatically recover fullspecified performance when normal ac powercharacteristics are restored
For this example, the equipment under test has a single phase ac input with 115 Vrms and 400 Hzrequirements. The device is tested under ac voltagetransients initially, and then under frequency tran-sient conditions. These transients are as follows:
At 400 Hz:Voltage Test 1: 180 Vpk (127 Vrms) for 10 ms, and
then slew to 124 Vpk (88 Vrms) at 800 Vpk (566 Vrms) per second.
Voltage Test 2: 80 Vpk (57 Vrms) for 10 ms, and then slew to 108 Vpk (76 Vrms) at 400 Vpk (283 Vrms) per second.
At 115 Vrms:Frequency Test 1: 425 Hz for 1 s, 420 Hz for 4 s,
410 Hz for 5 s, and 407 Hz for 4 s.Frequency Test 2: 375 Hz for 1 s, 380 Hz for 4 s,
390 Hz for 5 s, and 393 Hz for 4 s.
In this example, the voltage and frequency tran-sients will be executed as an integrated testsequence.
Agilent 6800 series features used• RMS voltage and frequency control in List mode• RMS voltage slew control• List dwell time control• Triggering system to execute the List
Advantages/benefits of the Agilent 6800 seriessolution• The List capability allows the ac power
source/analyzer outputs to sequence througheach RMS voltage and frequency setting withaccurate timing according to the standard andwithout controller intervention.
• By using the programmable RMS voltage slewcontrol, the RMS voltage level excursions can be faithfully reproduced as per the standard.
• The List settings for MIL-STD-704D are stored in non-volatile memory, so the test need only be set up once and then executed as needed.
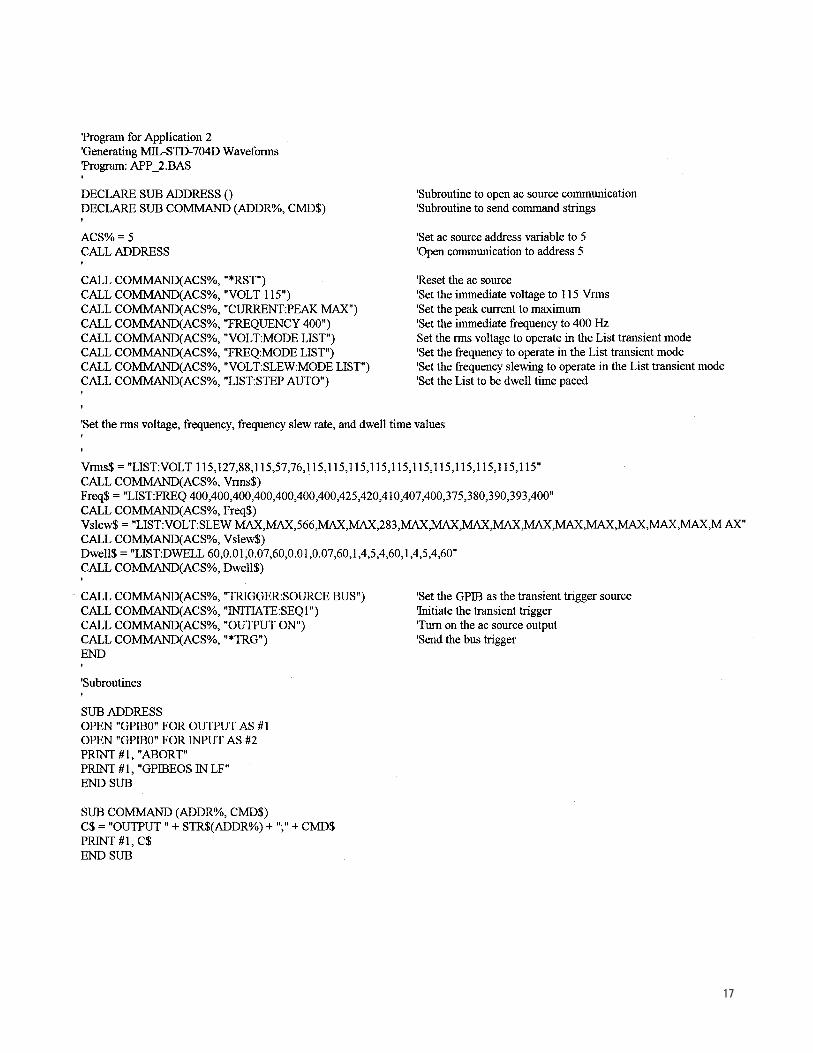
Implementation detailsHow the 6800 series implements MIL-STD-704D RMSvoltage and frequency transientsThe computer sets up List sequence, then ac powersource/analyzer is sent a bus trigger. Upon receiptof the trigger, the ac power source/analyzer’s out-put is set according to the voltage, voltage slew,and frequency values of the first List point. Theoutput will remain at the first List point settinguntil the dwell time for that List point expires. Theunit will then sequence through each successiveList point paced by the respective dwell times untilthe List is completed. Upon completion of the List,the output will return to the immediate settings.
Agilent 6800 series setup• Connect the ac source output to the ac input
of the equipment under test.• Set the rms voltage to 115 Vrms.• Set the frequency to 400 Hz.• Set the rms voltage to List mode.• Set the rms voltage slew to List mode.• Set the frequency to List mode.• Set the List to sequence automatically.
Application 2:Generating MIL-STD-704D Waveforms
15
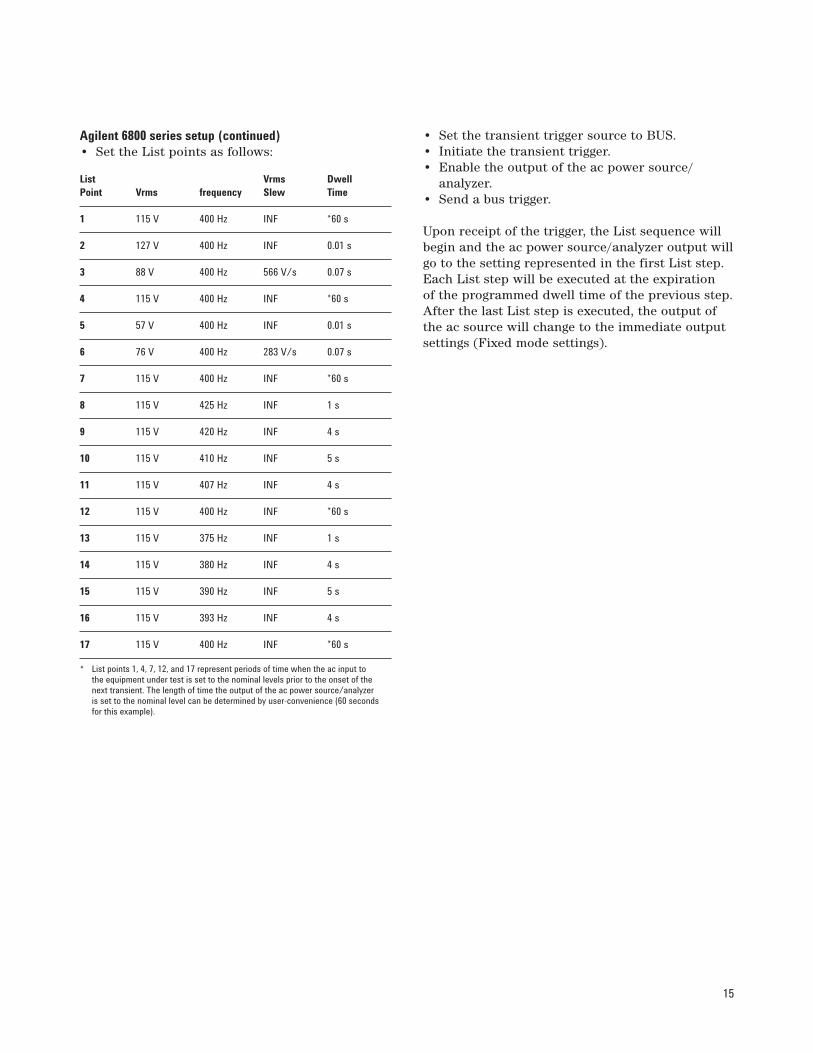
Agilent 6800 series setup (continued)• Set the List points as follows:
List Vrms DwellPoint Vrms frequency Slew Time
1 115 V 400 Hz INF *60 s
2 127 V 400 Hz INF 0.01 s
3 88 V 400 Hz 566 V/s 0.07 s
4 115 V 400 Hz INF *60 s
5 57 V 400 Hz INF 0.01 s
6 76 V 400 Hz 283 V/s 0.07 s
7 115 V 400 Hz INF *60 s
8 115 V 425 Hz INF 1 s
9 115 V 420 Hz INF 4 s
10 115 V 410 Hz INF 5 s
11 115 V 407 Hz INF 4 s
12 115 V 400 Hz INF *60 s
13 115 V 375 Hz INF 1 s
14 115 V 380 Hz INF 4 s
15 115 V 390 Hz INF 5 s
16 115 V 393 Hz INF 4 s
17 115 V 400 Hz INF *60 s
* List points 1, 4, 7, 12, and 17 represent periods of time when the ac input to the equipment under test is set to the nominal levels prior to the onset of the next transient. The length of time the output of the ac power source/analyzer is set to the nominal level can be determined by user-convenience (60 secondsfor this example).
• Set the transient trigger source to BUS. • Initiate the transient trigger. • Enable the output of the ac power source/
analyzer.• Send a bus trigger.
Upon receipt of the trigger, the List sequence willbegin and the ac power source/analyzer output willgo to the setting represented in the first List step.Each List step will be executed at the expiration of the programmed dwell time of the previous step.After the last List step is executed, the output ofthe ac source will change to the immediate outputsettings (Fixed mode settings).
16
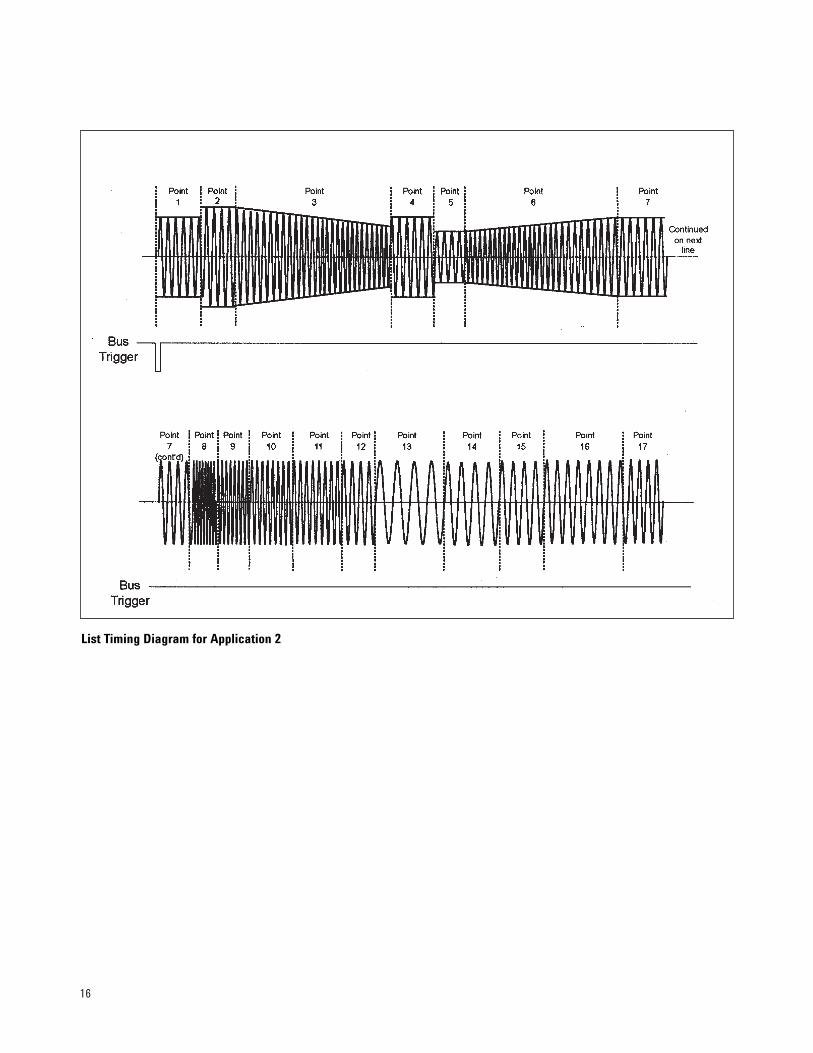
List Timing Diagram for Application 2
17
18
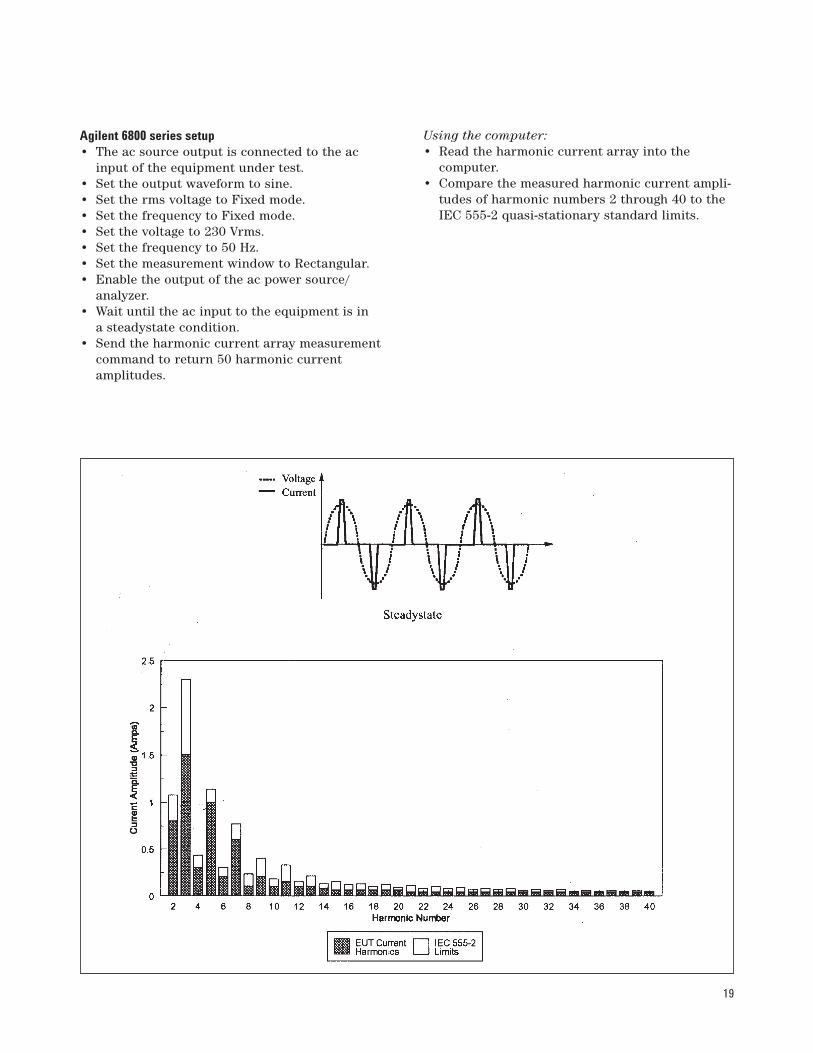
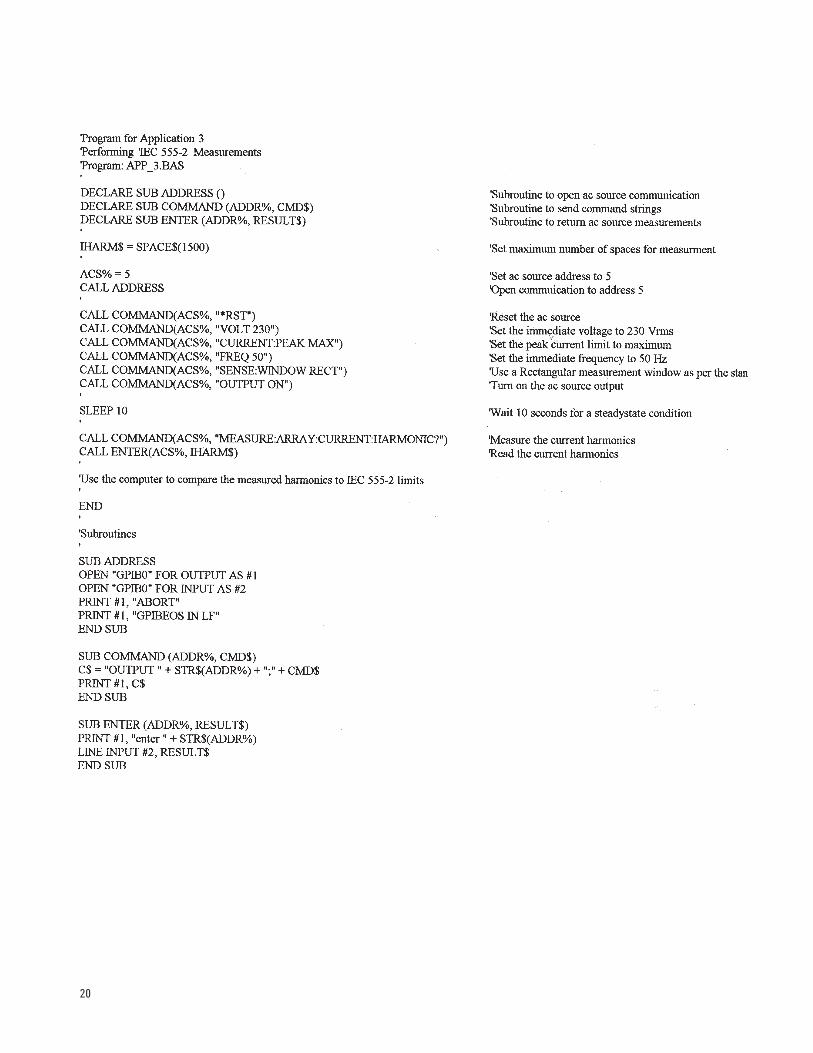
Overview of applicationIEC 555-2 (1982) is a regulatory standard that pertains to ac line disturbances, namely currentharmonics. These current harmonics are caused byconnecting household appliances and similar elec-trical equipment to a 230 V, 50 Hz ac mains. Thisstandard establishes limits on the amount of har-monic energy electrical equipment can inject on theac line to ensure that other devices connected tothe ac power distribution system are not adverselyaffected. The generated current harmonics can varyor fluctuate with time (due to electronic productsthat cycle the ac line), or can have steadystate(quasi-stationary) characteristics.
When testing electronic equipment with a singlephase ac input for compliance to the quasi-stationarypart of this standard, it is necessary to have an acsource with low distortion and low output imped-ance to avoid introducing unacceptable measure-ment errors. The measurement instrument mustuse the required Rectangular (or Hanning) meas-urement window and must have the capability toreturn measured current amplitude data up to the 40th harmonic of the fundamental.
Agilent 6800 series features used• RMS Voltage and frequency control• Measurement window control• Harmonic current measurement
Advantages/benefits of the Agilent 6800 series• The 6800 series provides a “One-Box” Solution,
so a separate power analyzer is not required forquasi-stationary harmonic measurements.
• The 6800 series provides an IEC 555 compliantRectangular measurement window built into thestandard unit.
• The low distortion, low output impedance and16-bit measurement accuracy of the 6800 seriesprovide full compliance to the measurementrequirements.
Implementation detailsHow the 6800 series implements IEC 555 quasi-stationaryharmonic current measurementsThe output of the ac power source/analyzer is set to 230 V and 50 Hz. The measurement windowis changed from the default value (KBessel) to the Rectangular window. To perform the harmonicanalysis, the ac power source/analyzer is sent acommand to measure an array of harmonic currentamplitudes. This array of current harmonics can be transferred to the computer for PASS/FAILanalysis versus the limits of the standard.
Application 3: Performing IEC 555-2 Measurements
19
Agilent 6800 series setup• The ac source output is connected to the ac
input of the equipment under test.• Set the output waveform to sine.• Set the rms voltage to Fixed mode.• Set the frequency to Fixed mode.• Set the voltage to 230 Vrms.• Set the frequency to 50 Hz.• Set the measurement window to Rectangular.• Enable the output of the ac power source/
analyzer.• Wait until the ac input to the equipment is in
a steadystate condition.• Send the harmonic current array measurement
command to return 50 harmonic current amplitudes.
Using the computer:• Read the harmonic current array into the
computer.• Compare the measured harmonic current ampli-
tudes of harmonic numbers 2 through 40 to theIEC 555-2 quasi-stationary standard limits.
20

21
Overview of applicationSwitch mode power supplies are commonly used in many electronic products. These power suppliestypically have input capacitors that cause high levels of peak inrush current to be drawn as theycharge from the rectified line at turn-on. The peakamplitude of the inrush current varies with theturn-on phase of the ac voltage cycle. Usually, thehighest peak inrush currents occur near the peak(90°) of the voltage cycle. Characterization ofinrush current versus turn-on phase allows fordetermination of worst case inrush current condi-tions, which must be determined to properly selectfuses and circuit breakers, to uncover componentstresses, and to determine if a product will pro-duce ac line disturbances that interact with otherequipment connected to the branch circuit.
For this example, the equipment under testrequires an ac line voltage of 120 Vrms at 60 Hz.
Agilent 6800 series features used• RMS voltage and frequency control• Peak current measurement• Pre-event current data capture• Trigger synchronization to the output voltage
phase• Measurement and waveform generation
synchronization• High crest factor
Advantages/benefits of the Agilent 6800 seriessolutionThe 6800 series provides a “One-Box” Solution formeasurement and waveform generation and elimi-nates the worry of synchronizing separate instru-ments. The ability to turn-on relative to the outputvoltage phase allows worst case inrush characteri-zation, which results in a more reliable product.
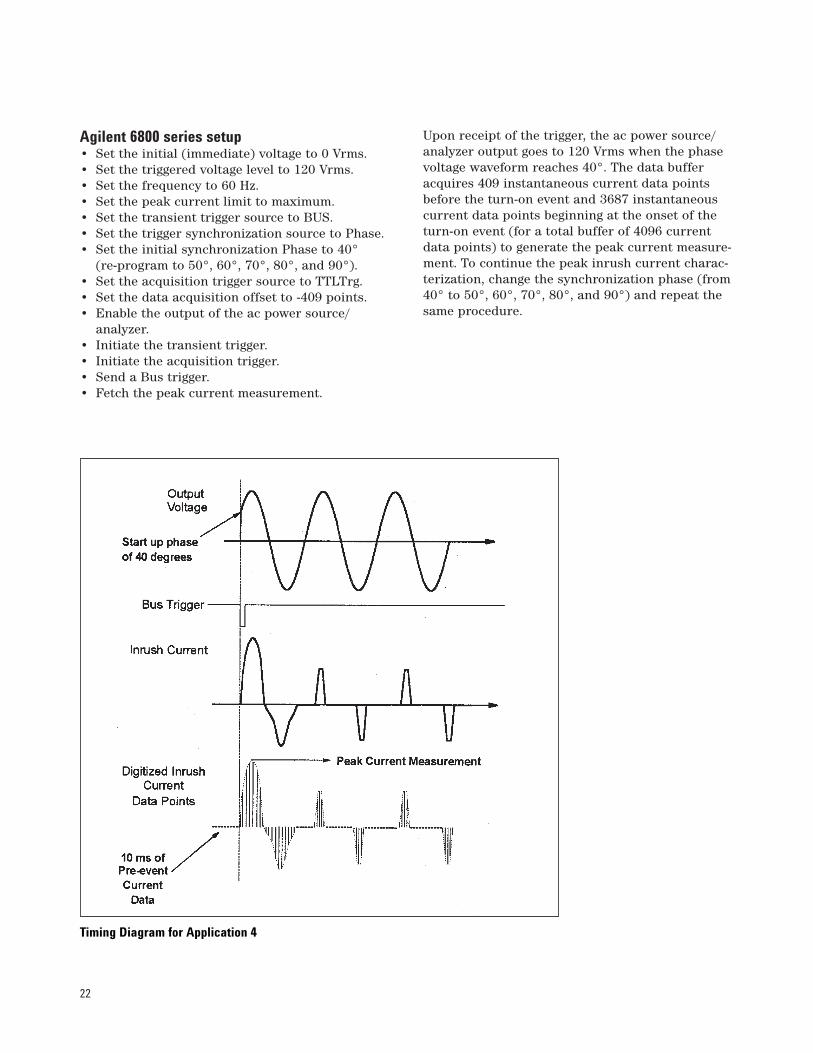
Implementation detailsHow the 6800 series implements peak inrush currentmeasurements The RMS voltage is programmed to Step mode to generate a turn-on condition from 0 Vrms to 120 Vrms. The turn-on is synchronized to thephase of the output voltage. The current measure-ment is programmed to occur at turn-on with 10 milliseconds of pre-event data to ensure thatthe full inrush event is captured. To characterizethe inrush current of the unit under test, the turn-on phase is initially set to 40° for the first peakinrush current measurement and is then increasedat 10° increments up to 90° for succeeding peakinrush current measurements. Between tests, theinput capacitors of the unit under test are allowedto fully discharge for proper characterization.
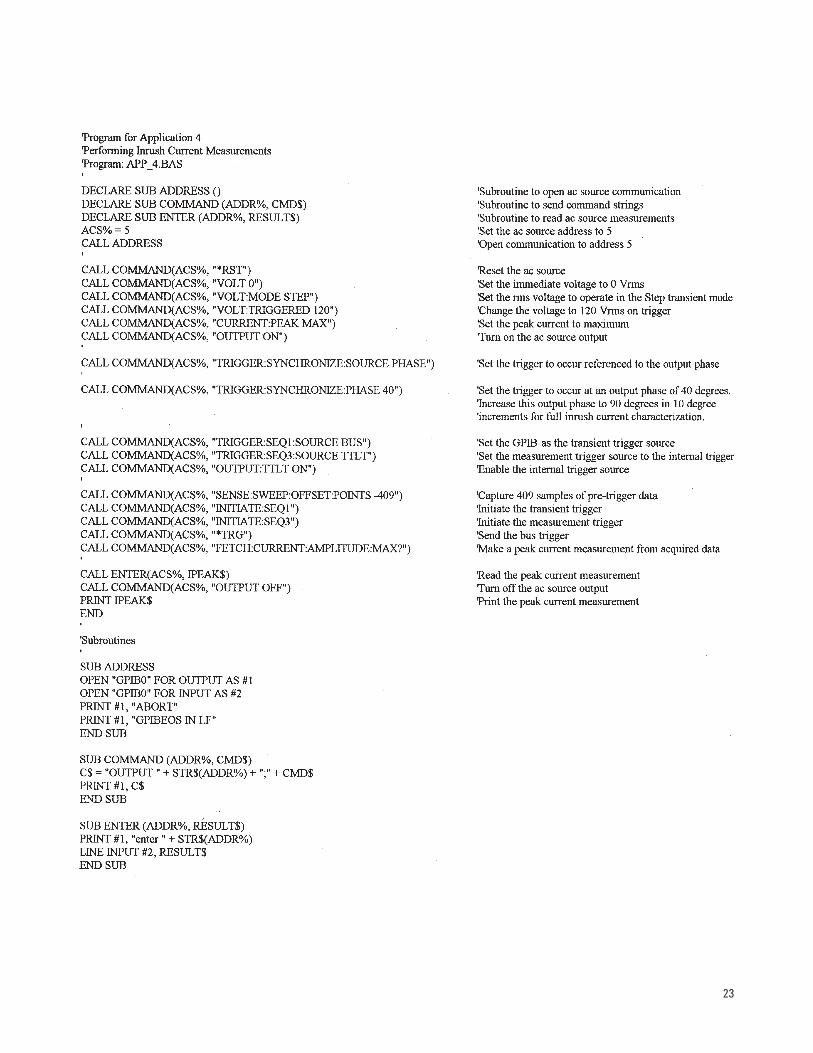
Application 4: Performing Inrush Current Measurements
22
Agilent 6800 series setup• Set the initial (immediate) voltage to 0 Vrms.• Set the triggered voltage level to 120 Vrms.• Set the frequency to 60 Hz.• Set the peak current limit to maximum.• Set the transient trigger source to BUS.• Set the trigger synchronization source to Phase.• Set the initial synchronization Phase to 40°
(re-program to 50°, 60°, 70°, 80°, and 90°).• Set the acquisition trigger source to TTLTrg.• Set the data acquisition offset to -409 points.• Enable the output of the ac power source/
analyzer.• Initiate the transient trigger.• Initiate the acquisition trigger.• Send a Bus trigger.• Fetch the peak current measurement.
Upon receipt of the trigger, the ac power source/analyzer output goes to 120 Vrms when the phasevoltage waveform reaches 40°. The data bufferacquires 409 instantaneous current data pointsbefore the turn-on event and 3687 instantaneouscurrent data points beginning at the onset of theturn-on event (for a total buffer of 4096 currentdata points) to generate the peak current measure-ment. To continue the peak inrush current charac-terization, change the synchronization phase (from40° to 50°, 60°, 70°, 80°, and 90°) and repeat thesame procedure.
Timing Diagram for Application 4
23
24
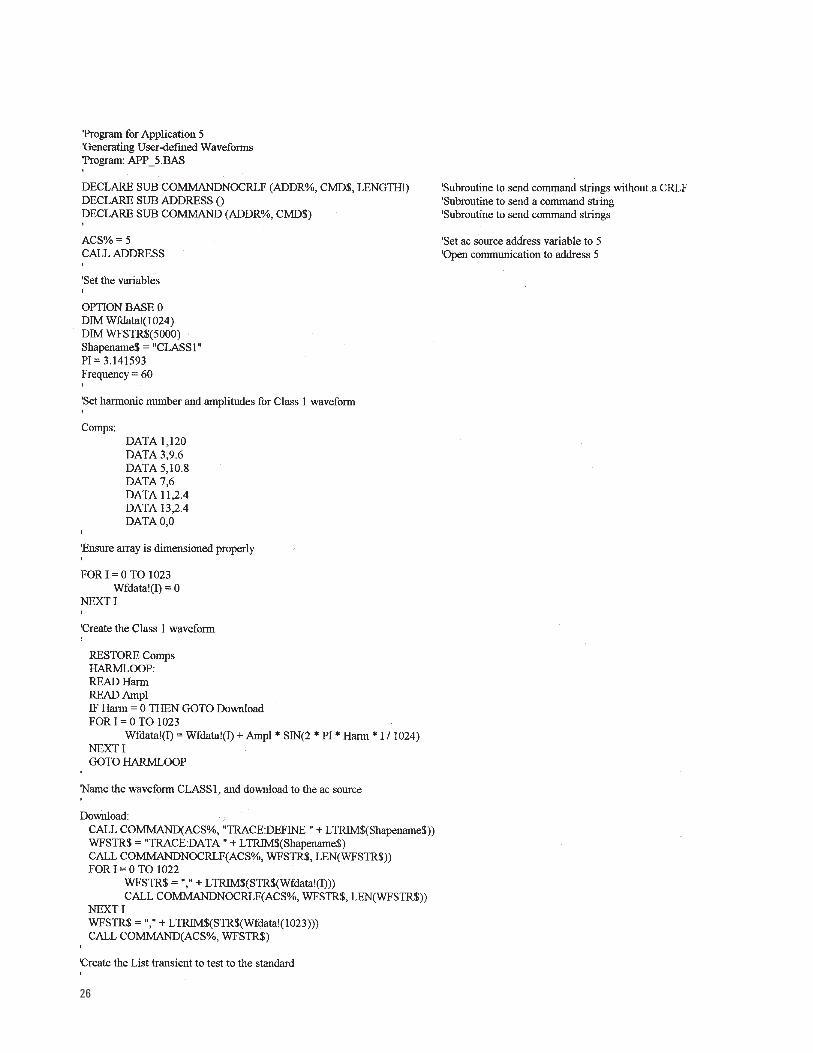
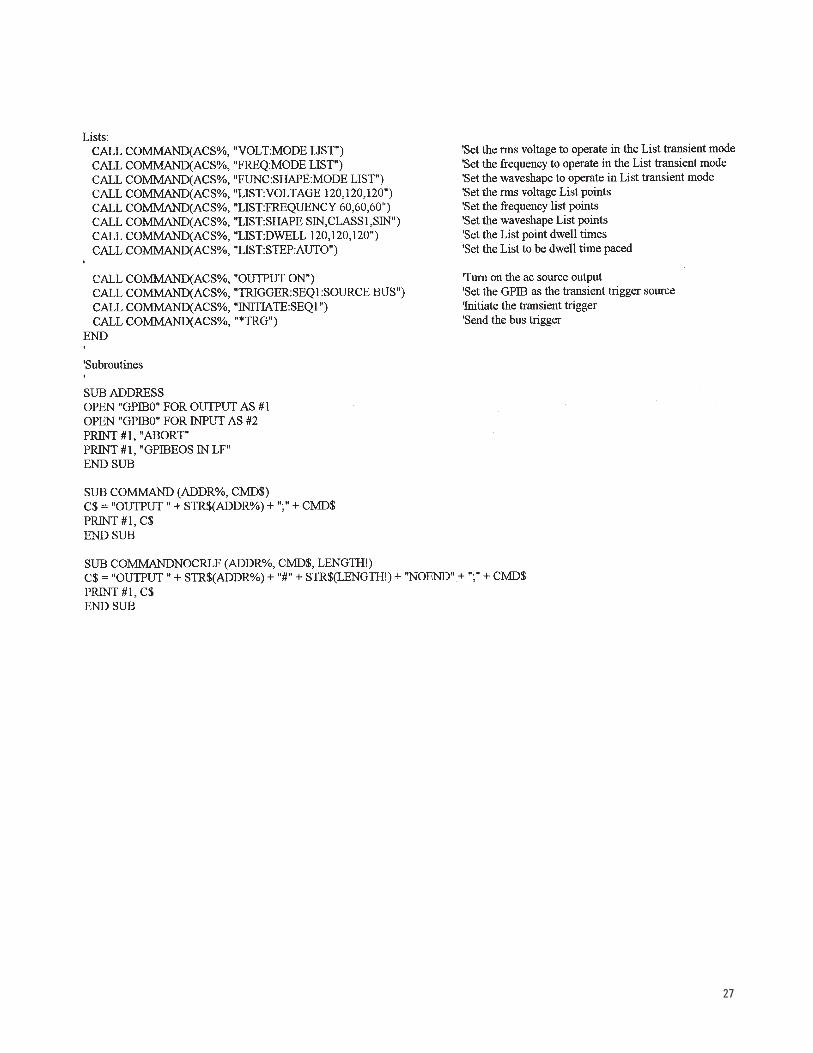
Overview of applicationThe creation of user-defined waveforms is usefulfor simulating ac line disturbances that are uniqueto the operational environment of the device beingtested, and then measuring that device’s suscepti-bility to the disturbance. This is the fundamentalobjective of environmental test standards that per-tain to the ac line. A specific example is the draftfor IEC 77A (Secretariat) 101 draft (dated 10/15/93),which defines the test and measurement methodsfor evaluating electronic and electrical equipmentimmunity to voltage harmonics and inter-harmon-ics on the ac line. Upon subjecting the equipmentto the voltage harmonics, it must recover to its fulloperative capabilities to meet the “pass” criteria of this draft.
For this example, a waveform with harmonic volt-age content as defined by the IEC 77A (Secretariat)101 draft (dated 10/15/93) will be created, stored,and generated by the ac power source/analyzer.
Harmonic Voltage Levels (for 120 Vrms)
Harmonic Number Class 1 Class 2
3 9.6 V 7.2 V
5 10.8 V 9.6 V
7 6 V 8.4 V
11 2.4 V 8.4 V
13 2.4 V 7.2 V
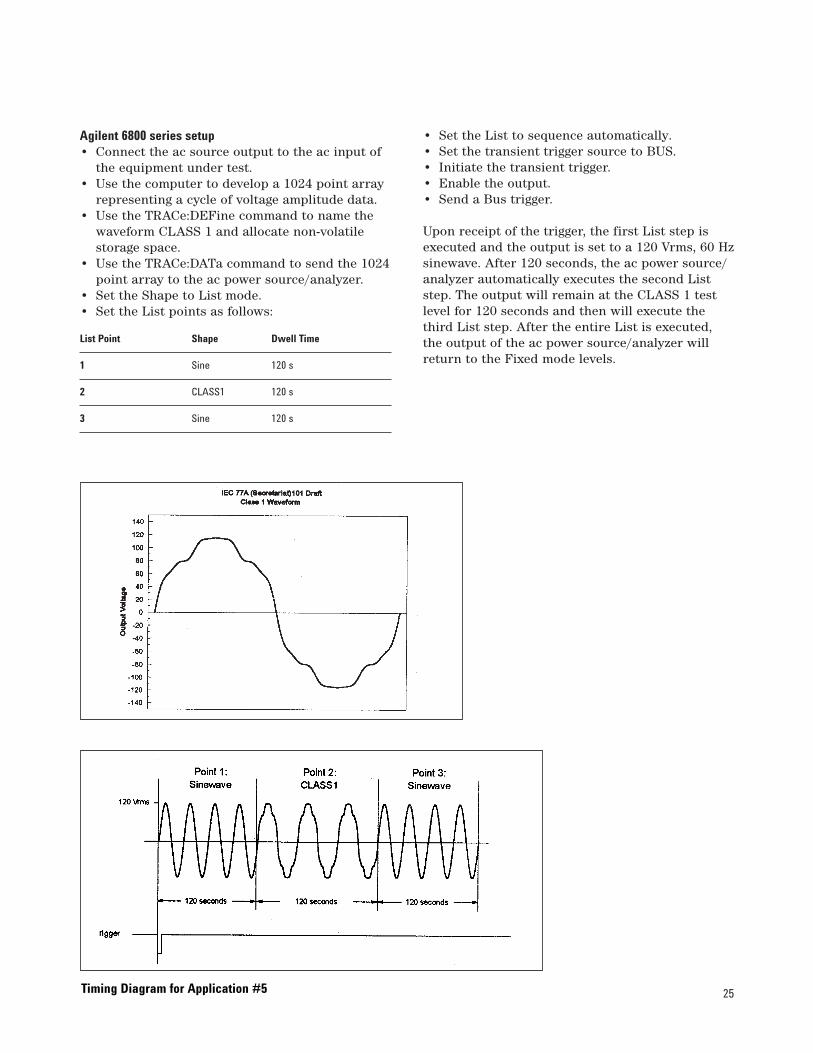
The equipment under test used for this examplehas an ac input rating of 120 Vrms, 60 Hz, and 5 Arms. The waveform generated will comply withthe Class 1 harmonic combination (as currentlyproposed) shown above. This draft specifies thatthe equipment under test must be subjected to the harmonic waveform of either Class for 2 min-utes, succeeded by 2 minutes of the fundamental(120 Vrms sinewave) waveform.
Agilent 6800 series features used• Non-volatile, user-defined (arbitrary) waveform
creation/storage • rms voltage programming • Frequency programming • Waveform shape transient generation • List transient mode
Advantages/benefits of the Agilent 6800 seriessolutionThe user-defined waveform is stored in non-volatile memory, eliminating the need for con-stant re-creation and making it easy to recall the waveform as the test is needed. A List of out-put waveforms can be generated by combiningbuilt-in and user-defined waveforms, simplifyingcomplex test sequences. The user-defined wave-form can be recalled as if it was one of the stan-dard output shapes (such as sine and square waveforms) and can be used in all modes wherethe FUNCtion:SHAPe command is valid.
Implementation detailsHow the 6800 series implements user-defined waveformsThe computer is used to generate an array of 1024 voltage amplitude points that represent onecycle of the 77A (Secretariat) 101 Class 1 wave-form. This data is sent to the ac source as a named(CLASS 1) user-defined waveform and is stored ina non-volatile memory location. The List mode ofthe ac power source/analyzer is used to sequencethrough the appropriate output settings at 2-minuteintervals as per the draft. The programmed param-eters for each List point are shape (waveform) anddwell time. The rms voltage and frequency outputsettings remain in Fixed mode. The first List pointis the fundamental waveform (120 Vrms sinewaveat 60 Hz) and will be output upon receipt of a tran-sient trigger for 2 minutes. The CLASS 1 waveformwill be output for 2 minutes as part of the secondList point. After this 2-minute test, the fundamen-tal waveform will be output again as part of thefinal List point.
Application 5: Generating User-Defined Waveforms
25
Agilent 6800 series setup• Connect the ac source output to the ac input of
the equipment under test.• Use the computer to develop a 1024 point array
representing a cycle of voltage amplitude data.• Use the TRACe:DEFine command to name the
waveform CLASS 1 and allocate non-volatilestorage space.
• Use the TRACe:DATa command to send the 1024point array to the ac power source/analyzer.
• Set the Shape to List mode.• Set the List points as follows:
List Point Shape Dwell Time
1 Sine 120 s
2 CLASS1 120 s
3 Sine 120 s
• Set the List to sequence automatically. • Set the transient trigger source to BUS. • Initiate the transient trigger. • Enable the output. • Send a Bus trigger.
Upon receipt of the trigger, the first List step isexecuted and the output is set to a 120 Vrms, 60 Hzsinewave. After 120 seconds, the ac power source/analyzer automatically executes the second Liststep. The output will remain at the CLASS 1 testlevel for 120 seconds and then will execute thethird List step. After the entire List is executed,the output of the ac power source/analyzer willreturn to the Fixed mode levels.
Timing Diagram for Application #5
26
27
28
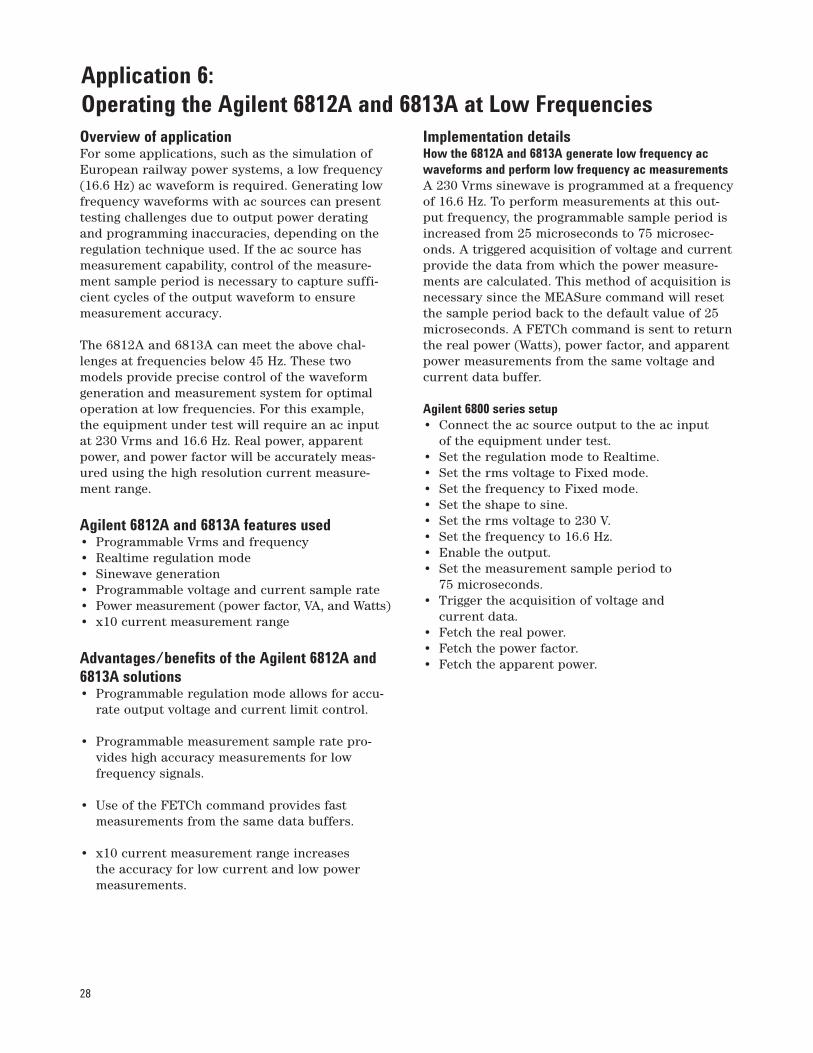
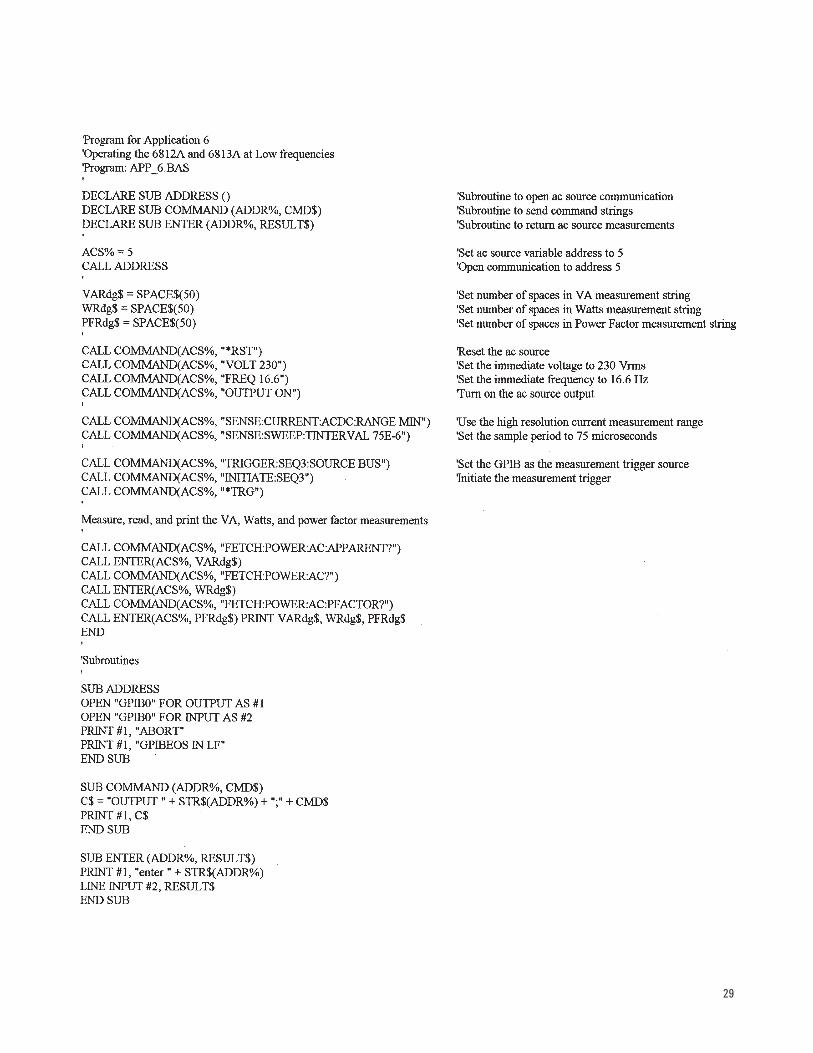
Overview of applicationFor some applications, such as the simulation ofEuropean railway power systems, a low frequency(16.6 Hz) ac waveform is required. Generating lowfrequency waveforms with ac sources can presenttesting challenges due to output power deratingand programming inaccuracies, depending on theregulation technique used. If the ac source hasmeasurement capability, control of the measure-ment sample period is necessary to capture suffi-cient cycles of the output waveform to ensuremeasurement accuracy.
The 6812A and 6813A can meet the above chal-lenges at frequencies below 45 Hz. These two models provide precise control of the waveformgeneration and measurement system for optimaloperation at low frequencies. For this example, the equipment under test will require an ac inputat 230 Vrms and 16.6 Hz. Real power, apparentpower, and power factor will be accurately meas-ured using the high resolution current measure-ment range.
Agilent 6812A and 6813A features used• Programmable Vrms and frequency• Realtime regulation mode• Sinewave generation• Programmable voltage and current sample rate• Power measurement (power factor, VA, and Watts)• x10 current measurement range
Advantages/benefits of the Agilent 6812A and6813A solutions• Programmable regulation mode allows for accu-
rate output voltage and current limit control.
• Programmable measurement sample rate pro-vides high accuracy measurements for low frequency signals.
• Use of the FETCh command provides fast measurements from the same data buffers.
• x10 current measurement range increases the accuracy for low current and low powermeasurements.
Implementation detailsHow the 6812A and 6813A generate low frequency acwaveforms and perform low frequency ac measurementsA 230 Vrms sinewave is programmed at a frequencyof 16.6 Hz. To perform measurements at this out-put frequency, the programmable sample period isincreased from 25 microseconds to 75 microsec-onds. A triggered acquisition of voltage and currentprovide the data from which the power measure-ments are calculated. This method of acquisition isnecessary since the MEASure command will resetthe sample period back to the default value of 25microseconds. A FETCh command is sent to returnthe real power (Watts), power factor, and apparentpower measurements from the same voltage andcurrent data buffer.
Agilent 6800 series setup• Connect the ac source output to the ac input
of the equipment under test.• Set the regulation mode to Realtime.• Set the rms voltage to Fixed mode.• Set the frequency to Fixed mode.• Set the shape to sine.• Set the rms voltage to 230 V.• Set the frequency to 16.6 Hz.• Enable the output.• Set the measurement sample period to
75 microseconds.• Trigger the acquisition of voltage and
current data.• Fetch the real power.• Fetch the power factor.• Fetch the apparent power.
Application 6: Operating the Agilent 6812A and 6813A at Low Frequencies
29
Agilent Technologies’ Test and Measurement Support, Services, and AssistanceAgilent Technologies aims to maximize the value you receive,while minimizing your risk and problems. We strive to ensurethat you get the test and measurement capabilities you paid for and obtain the support you need. Our extensive supportresources and services can help you choose the right Agilentproducts for your applications and apply them successfully.Every instrument and system we sell has a global warranty.Support is available for at least five years beyond the produc-tion life of the product. Two concepts underlie Agilent’s overall support policy: “Our Promise” and “Your Advantage.”
Our Promise“Our Promise” means your Agilent test and measurement equip-ment will meet its advertised performance and functionality.When you are choosing new equipment, we will help you withproduct information, including realistic performance specifica-tions and practical recommendations from experienced testengineers. When you use Agilent equipment, we can verify thatit works properly, help with product operation, and providebasic measurement assistance for the use of specified capabili-ties, at no extra cost upon request. Many self-help tools areavailable.
Your Advantage“Your Advantage” means that Agilent offers a wide range of additional expert test and measurement services, which you can purchase according to your unique technical and businessneeds. Solve problems efficiently and gain a competitive edge by contracting with us for calibration, extra-cost upgrades, out-of-warranty repairs, and on-site education and training, as well as design, system integration, project management, and otherprofessional services. Experienced Agilent engineers and tech-nicians worldwide can help you maximize your productivity,optimize the return on investment of your Agilent instrumentsand systems, and obtain dependable measurement accuracy for the life of those products.
By internet, phone, or fax, get assistance with all your test and measurement needs.
Online Assistancewww.agilent.com/find/assistPhone or FaxUnited States:(tel) 1 800 452 4844
Canada:(tel) 1 877 894 4414(fax) (905) 206 4120
Europe:(tel) (31 20) 547 2323(fax) (31 20) 547 2390
Japan:(tel) (81) 426 56 7832(fax) (81) 426 56 7840
Latin America:(tel) (305) 269 7500(fax) (305) 269 7599
Australia:(tel) 1 800 629 485 (fax) (61 3) 9210 5947
New Zealand:(tel) 0 800 738 378 (fax) (64 4) 495 8950
Asia Pacific:(tel) (852) 3197 7777(fax) (852) 2506 9284
Product specifications and descriptions in this document subject to change without notice.
Copyright © 1995, 2000 Agilent TechnologiesPrinted in U.S.A. 10/005963-7044E