Embed Size (px)
Citation preview

E N E R G I Z E D B Y O P P O R T U N I T I E S
2 0 1 6 A N N UA L R E P O R T
I N F R A S T R U C T U R E
A G G R E G AT E & M I N I N G
E N E R G Y

An
nu
al R
ep
ort
Des
ign
by
Fal
k H
arri
son
/ fa
lkh
arri
son
.co
m
INFRASTRUCTURE GROUP
10 Astec and Dillman Equipment 12 Roadtec 14 Carlson Paving Products 16 Astec Australia 18 Astec Mobile Machinery
AGGREGATE & MINING GROUP
20 Telsmith 22 Osborn Engineered Products 24 Breaker Technology 26 Astec do Brasil 28 Kolberg-Pioneer 30 Johnson Crushers
International 32 Astec Mobile Screens 34 Telestack
ENERGY GROUP
36 Heatec 38 CEI Enterprises 40 Peterson Pacific Corp. 42 GEFCO 44 Power Flame
CORPORATE INFORMATION 46 Corporate Executive Officers
(in thousands, except as noted*) 2016 2015 2014 2013 2012
OPERATING RESULTS Net sales $1,147,431 $983,157 $975,595 $932,998 $936,273
Net income attributable to controlling interest 55,159 32,797 34,458 39,042 40,828
FINANCIAL POSITION
Total assets $ 843,601 $777,353 $802,265 $749,291 $728,783
Working capital 407,972 399,785 388,862 385,680 355,336
Equity 648,841 609,858 596,152 577,311 547,534
PER COMMON SHARE*
Net income attributable to controlling interest
Basic $ 2.40 $ 1.43 $ 1.51 $ 1.72 $ 1.80
Diluted 2.38 1.42 1.49 1.69 1.77
Book value per common share at year end 27.99 26.30 25.62 24.85 23.68
OTHER DATA Weighted average number of common
shares outstanding
Basic 22,992 22,934 22,819 22,749 22,680
Diluted 23,142 23,120 23,105 23,081 23,051
Associates* 4,218 3,740 3,952 3,708 3,860
FINANCIAL OVERVIEW
CONTENTS
01 Our Industry-Leading Footprint 02 Letter to Shareholders 06 New Technologies
OTHER INFORMATION
Transfer AgentComputershare250 Royall Street, Canton, MA 02021800.617.6437www.computershare.com/investor
Stock ExchangeNASDAQ, National Market—ASTE
AuditorsKPMG LLP, Knoxville, TN
General Counsel and LitigationChambliss, Bahner & Stophel, P.C., Chattanooga, TN
Securities CounselAlston & Bird LLP, Atlanta, GA
Investor RelationsStephen C. Anderson, 423.553.5934
Corporate OfficeAstec Industries, Inc. 1725 Shepherd Road Chattanooga, TN 37421Ph 423.899.5898 Fax 423.899.4456www.astecindustries.com
The form 10-K, as filed with the Securities and Exchange Commission, may be obtained at no cost by any shareholder upon written request to Astec Industries, Inc., Attention Investor Relations.
The Company’s Code of Conduct is posted at www.astecindustries.com.
The Annual Meeting will be held on April 27, 2017, at 10:00 A.M. EST in the Training Center of Astec, Inc. located at 4101 Jerome Avenue, Chattanooga, TN 37407.
23431_Astec_2016AnnualReportCvr.indd 2 2/28/17 3:09 PM
8
10514
6
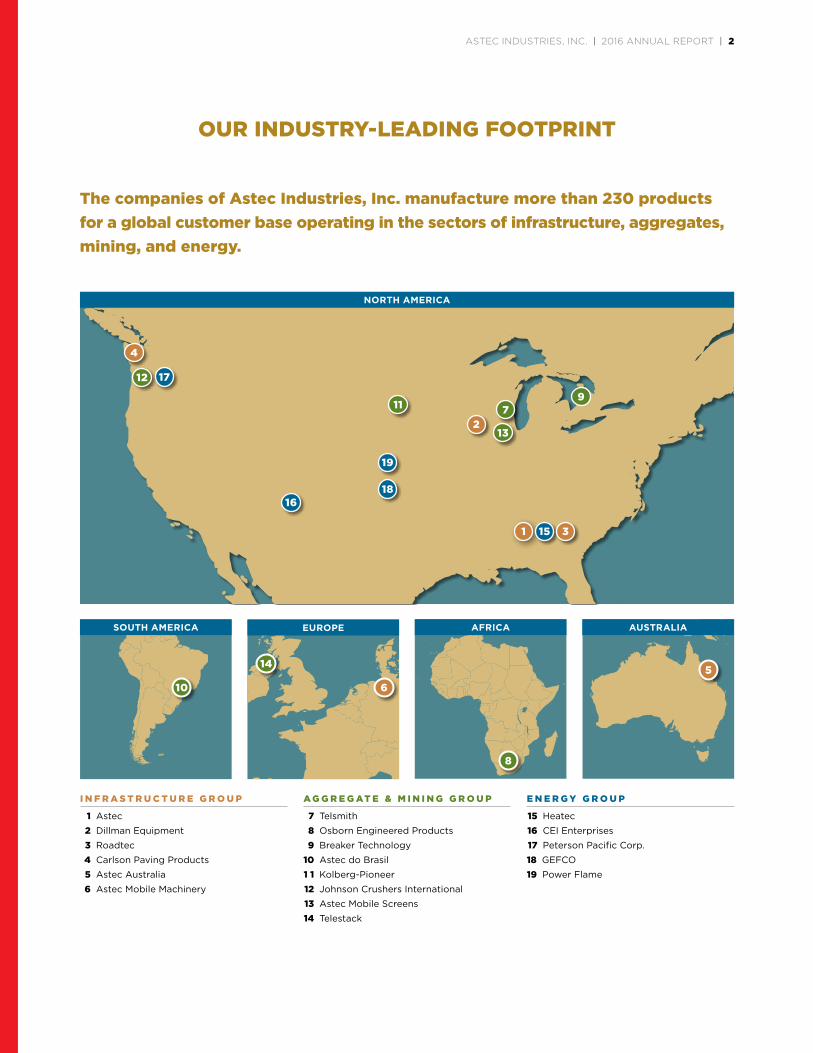
OUR INDUSTRY-LEADING FOOTPRINT
7
1618
19
2
1
11
12
4
13
9
The companies of Astec Industries, Inc. manufacture more than 230 products for a global customer base operating in the sectors of infrastructure, aggregates, mining, and energy.
EUROPE AUSTRALIA
NORTH AMERICA
SOUTH AMERICA AFRICA
I N F R A S T R U C T U R E G R O U P
1 Astec
2 Dillman Equipment
3 Roadtec
4 Carlson Paving Products
5 Astec Australia
6 Astec Mobile Machinery
A G G R E G AT E & M I N I N G G R O U P
7 Telsmith
8 Osborn Engineered Products
9 Breaker Technology
10 Astec do Brasil
1 1 Kolberg-Pioneer
12 Johnson Crushers International
13 Astec Mobile Screens
14 Telestack
E N E R G Y G R O U P
15 Heatec
16 CEI Enterprises
17 Peterson Pacific Corp.
18 GEFCO
19 Power Flame
15 3
17
ASTEC INDUSTRIES, INC. | 2016 ANNUAL REPORT | 2

CONGRESSIONAL ACTION
The United States Congress
passed a long-term highway bill
in December 2015. The term is
for five years and the funding
increase is 15% over the life of the
bill. Our Infrastructure Group of
companies felt the results of this
bill passing almost immediately
as orders came in from our
customers, and this group
enjoyed a very good year overall.
We are energized by the outlook
in the Infrastructure Group for
the life of this bill.
INFRASTRUCTURE GROUP
In addition to the long-term
highway bill there could be more
funding for infrastructure on the
way from our newly elected
President of the United States.
Anyone who paid attention to
the presidential election in the
United States knows that the
new incoming administration
supports additional funding to
help improve and expand our
infrastructure system in the
United States. Time will tell, but
we will be ready for the
opportunities that come with a
potential infrastructure bill.
Our wood pellet plant business is
also in our Infrastructure Group.
This business added over $100
million to our revenues in 2016.
While we anticipate this revenue
may be down somewhat in 2017,
we are energized by the
projected need for wood pellets
in 2018 and beyond. Our plants
are well known in the industry
now, so we are in position to
supply wood pellet plants for the
projected demand increase.
F E L L O W S H A R E H O L D E R S This year's annual report theme, “Energized by Opportunities,” proves that opportunities come in various forms — including the Federal Highway Bill in the United States; our wood pellet plant business; multiple new product releases; and headwinds that, while still present, seem to at least have steadied..
3 | ASTEC INDUSTRIES, INC. | 2016 ANNUAL REPORT

NEW PRODUCTS
New products have been a
competitive advantage for our
company since day one.
We are not sitting still. We
displayed 65 products at the
2017 ConExpo show in Las
Vegas. More importantly, 27
of those products are new
products. An additional 22
of those products have
improvements. This means that
out of 65 products on display,
49 were new and improved
products. We are energized
by this show, and some of
these products are featured in
this report.
Our headwinds have been very
well documented in the news.
They are low oil and natural
gas prices; the global mining
slowdown; and a strong U.S.
dollar, which hurts our ability
to sell and export equipment
from the United States. We have
been working to offset these
headwinds with new products
and lean manufacturing methods
to reduce costs. While we are not
all the way there yet, we have
made improvements and we
have seen a slight pickup
in activity.
AGGREGATE AND MINING GROUP
Our Aggregate and Mining Group
experienced a slowdown in the
areas where mining’s lag hurt
economies around the world,
while the United States market
remained flat overall.
We are energized by the
opportunities in this group that
will come with the highway bill in
" Time will tell,
but we will be
ready for the
opportunities
that come
with a potential
infrastructure bill." Benjamin G. Brock, President and Chief Executive Officer
ASTEC INDUSTRIES, INC. | 2016 ANNUAL REPORT | 4
the United States and by what
seems to be a bottoming out in
the mining industry.
ENERGY GROUP
Our Energy Group worked to
offset slow equipment sales in
the oil and natural gas industries
with sales to chemical, food,
electricity, and other industrial
segments. As a result, we have
developed new products in this
group that will help us in the long
run. We see opportunity in the
Energy Group starting more in
2018 for notable growth; however
we are pleased to see the rig
counts in the United States rising
as this letter is being written.
INTERNATIONAL SALES
In regard to international sales,
we continue to support
our structure that we have
worked to put in place since
2007. We believe that keeping
our people in place for sales
and service will pay off when
the currencies eventually swing.
We are also designing equipment
with the future in mind, so what
we are designing today can
be more easily modified for
international markets in the
future. That being said, we
did see a heartbeat in the
international side of the business
during the fourth Quarter in
2016. We will be in position to
grow international sales when the
economic environment is right.
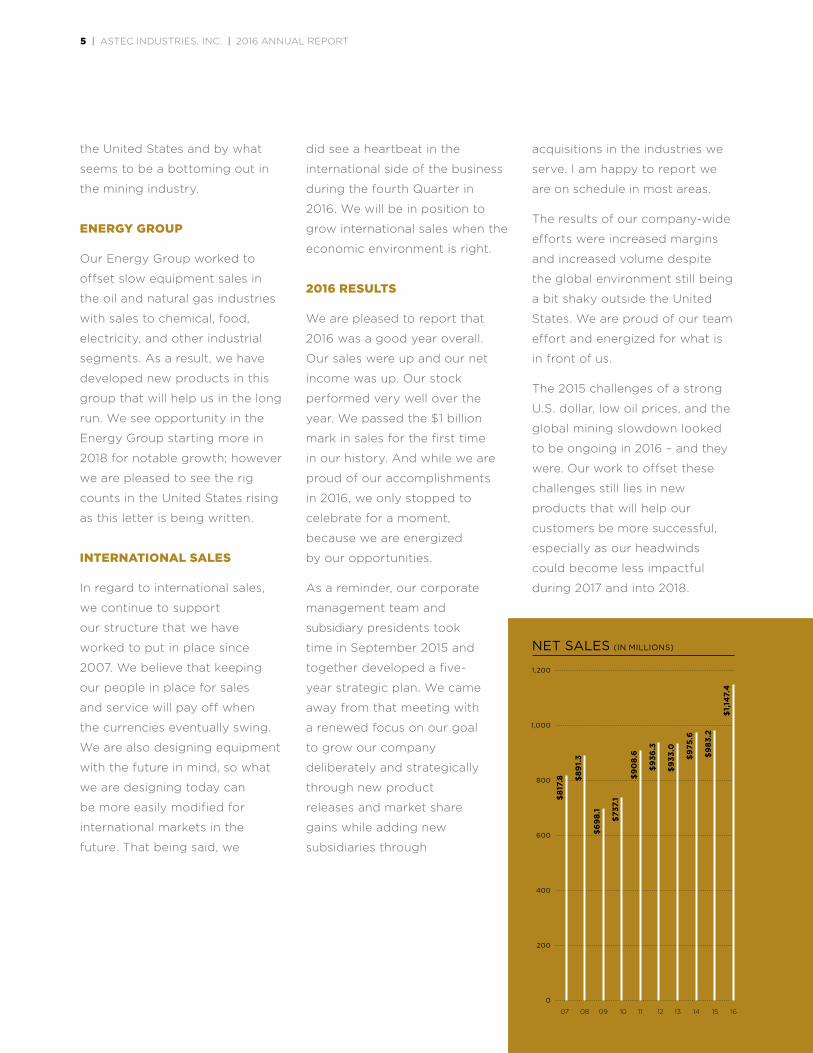
2016 RESULTS
We are pleased to report that
2016 was a good year overall.
Our sales were up and our net
income was up. Our stock
performed very well over the
year. We passed the $1 billion
mark in sales for the first time
in our history. And while we are
proud of our accomplishments
in 2016, we only stopped to
celebrate for a moment,
because we are energized
by our opportunities.
As a reminder, our corporate
management team and
subsidiary presidents took
time in September 2015 and
together developed a five-
year strategic plan. We came
away from that meeting with
a renewed focus on our goal
to grow our company
deliberately and strategically
through new product
releases and market share
gains while adding new
subsidiaries through
acquisitions in the industries we
serve. I am happy to report we
are on schedule in most areas.
The results of our company-wide
efforts were increased margins
and increased volume despite
the global environment still being
a bit shaky outside the United
States. We are proud of our team
effort and energized for what is
in front of us.
The 2015 challenges of a strong
U.S. dollar, low oil prices, and the
global mining slowdown looked
to be ongoing in 2016 – and they
were. Our work to offset these
challenges still lies in new
products that will help our
customers be more successful,
especially as our headwinds
could become less impactful
during 2017 and into 2018.
1,200
1,000
800
600
400
200
0
07 08 09 10 11 12 13 14 15 16
NET SALES (IN MILLIONS)
$817
.8 $89
1.3
$69
8.1
$737
.1
$90
8.6
$936
.3
$933
.0
$975
.6
$983
.2
$1,1
47.
4
5 | ASTEC INDUSTRIES, INC. | 2016 ANNUAL REPORT

We have been fortunate to
remain debt free with cash on
hand. Our plan is to use this
position for acquiring companies
we feel are a fit with our family
of companies. We have a goal of
making one or two acquisitions
during 2017. However, we do not
see acquisitions as an absolutely
must-do item. We will only add
to our family if we believe that
there is a strategic fit with our
business. To that end, we did
announce the addition of Power
Flame to our family of companies
during 2016. Power Flame is
the leader in industrial and
commercial use burners with
great market shares in every
segment they serve. We are
pleased to have the Power Flame
team with us and look forward
to participating in their future
growth and success.
We will continue to focus on
safety, sales and gross margin
improvement in 2017. We will also
continue to benchmark between
subsidiaries in more formal
ways, and push our R&D
efforts across the board. We
are maintaining our
international sales and
service structure so we are
ready whenever the U.S.
dollar weakens again.
IN CONCLUSION
In closing, we were pleased
with our 2016 results overall.
At the close of 2016 Chief
Operating Officer Richard J.
Dorris and I marked the end
of our third year being in our
current roles. As we enter our
fourth year of leadership we are
pleased with the progress made,
and we are energized by the
opportunities for improvement
and growth in the short and long
term. We have a great team of
corporate and subsidiary officers,
and I will tell you that in traveling
to our subsidiaries and job sites
we are truly blessed with great
people at all levels of our
company. Our people are why
we are the company we are
today with the opportunity to
be even better.
We are all energized by
opportunities! The best is yet
to come.
Thank you for taking the time to
read this letter and thank you for
your support.
Sincerely,
Benjamin G. Brock
President
and Chief Executive Officer
Astec Industries, Inc.
We are also designing equipment with the future in mind, so what we are designing today can be more easily modified for international markets.
10
8
6
4
2
0
OPERATING PROFIT (IN PERCENT)
9.54
%
8.9
1%
4.3
9%
6.8
6%
6.4
3%
5.4
6%
5.97
%
5.30
%
5.0
8%
7.6
0%
07 08 09 10 11 12 13 14 15 16
ASTEC INDUSTRIES, INC. | 2016 ANNUAL REPORT | 6
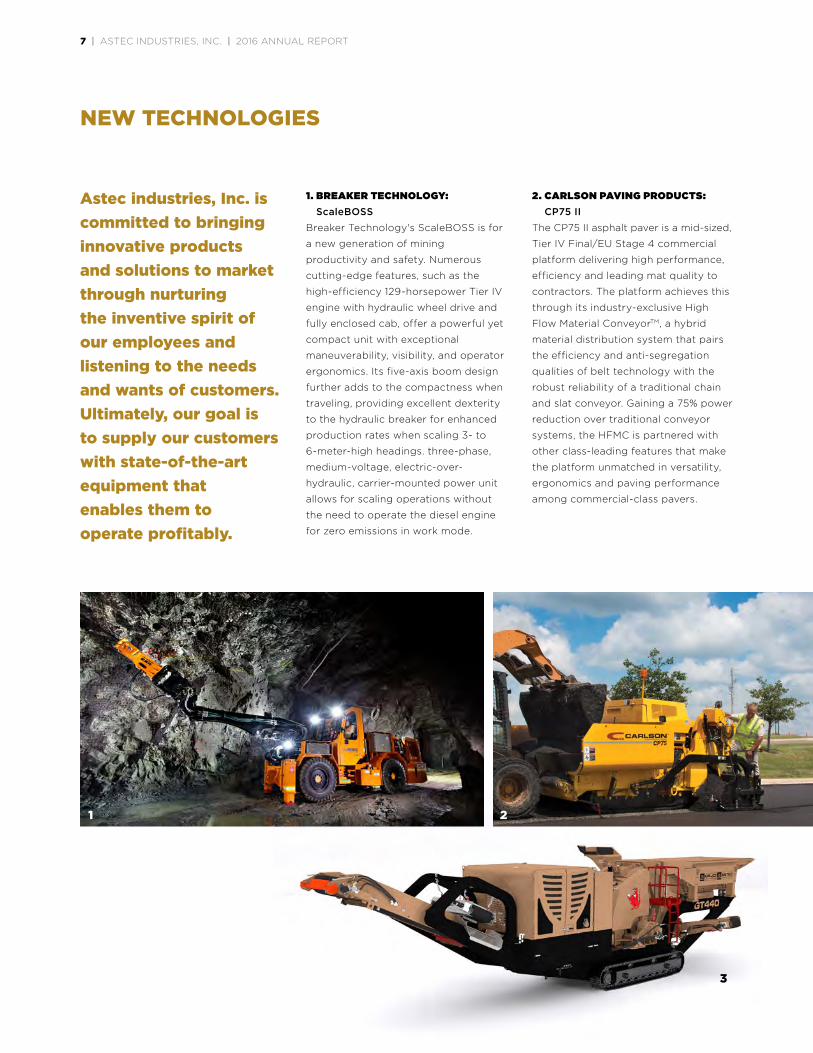
1. BREAKER TECHNOLOGY: ScaleBOSS
Breaker Technology's ScaleBOSS is for
a new generation of mining
productivity and safety. Numerous
cutting-edge features, such as the
high-efficiency 129-horsepower Tier IV
engine with hydraulic wheel drive and
fully enclosed cab, offer a powerful yet
compact unit with exceptional
maneuverability, visibility, and operator
ergonomics. Its five-axis boom design
further adds to the compactness when
traveling, providing excellent dexterity
to the hydraulic breaker for enhanced
production rates when scaling 3- to
6-meter-high headings. three-phase,
medium-voltage, electric-over-
hydraulic, carrier-mounted power unit
allows for scaling operations without
the need to operate the diesel engine
for zero emissions in work mode.
2. CARLSON PAVING PRODUCTS: CP75 II
The CP75 II asphalt paver is a mid-sized,
Tier IV Final/EU Stage 4 commercial
platform delivering high performance,
efficiency and leading mat quality to
contractors. The platform achieves this
through its industry-exclusive High
Flow Material ConveyorTM, a hybrid
material distribution system that pairs
the efficiency and anti-segregation
qualities of belt technology with the
robust reliability of a traditional chain
and slat conveyor. Gaining a 75% power
reduction over traditional conveyor
systems, the HFMC is partnered with
other class-leading features that make
the platform unmatched in versatility,
ergonomics and paving performance
among commercial-class pavers.
NEW TECHNOLOGIES
Astec industries, Inc. is committed to bringing innovative products and solutions to market through nurturing the inventive spirit of our employees and listening to the needs and wants of customers. Ultimately, our goal is to supply our customers with state-of-the-art equipment that enables them to operate profitably.
1 2
3
7 | ASTEC INDUSTRIES, INC. | 2016 ANNUAL REPORT

3. KOLBERG-PIONEER, INC.: GT440 mobile hybrid horizontal shaft impactor (HSI)
Kolberg-Pioneer released the latest
patent-pending hybrid technology in
their GT440 mobile horizontal shaft
impactor in 2016. The GT440 hybrid HSI
has the ability to run on both line power
and diesel power when necessary. With
the addition of the hybrid technology to
the mobile HSI, Kolberg-Pioneer
continues to offer end users and dealers
the latest solutions for their operations
in the aggregate, recycling, construction
and industrial markets.
The new GT440 hybrid HSI features an
Andreas 42" x 40" horizontal shaft
impact crusher, which includes a 3- or
4-bar rotor configuration, allowing the
end user to choose the best solution for
their application. On-site mobility and
quick setup provide producers with
more flexibility, and the capability of
continuous crushing and tracking allows
producers to achieve up to 30% more
uptime in their operation.
4. ASTEC MOBILE SCREENS, INC.: ProSizer® 3600
The ProSizer® 3600 is designed to work
in both recycle and aggregate
applications. Its robust 36" x 46"
horizontal shaft impactor and up to
6' x 18' double deck screen will process
slabby materials and recycled asphalt
pavement (RAP) millings faster than
ever. Astec Mobile Screens’ high-
performance mobile crushing and
screening equipment meets site-to-site
processing needs for all producers.
With the addition of the ProSizer® 3600
to the performance-proven ProSizer®
Series, which includes the 3100 and
4200, producers have the option to
select the plant that would work best
for their application. In addition, Astec
Mobile Screens’ ProSizer® contains the
industry’s most advanced application
knowledge from the asphalt plant to
the RAP processing operation and
can assist producers in improving
their bottom line by increasing
RAP utilization in
their operation.
5. ASTEC MOBILE SCREENS, INC.: GT205 mobile hybrid multi-frequency screen
Astec Mobile Screens released the
latest patent-pending hybrid
technology in their GT205 mobile
multi-frequency screen in 2016. The
GT205 hybrid multi-frequency screen
has the ability to run on both line power
and diesel power when necessary. With
the addition of the hybrid technology
to the mobile multi-frequency screen,
Astec Mobile Screens continues to
offer end users and dealers the latest
solutions for their operations in the
aggregate, recycling, construction
and industrial markets.
The new GT205 hybrid features
a high-performance 5' x 20' multi-
frequency screen designed for
aggregate, recycle and industrial
operations. The simple controls create
an easy-to-operate machine that
increases uptime. The multi-frequency
technology also provides up to 50%
higher screening capacity on the
bottom deck.
4
5
ASTEC INDUSTRIES, INC. | 2016 ANNUAL REPORT | 8
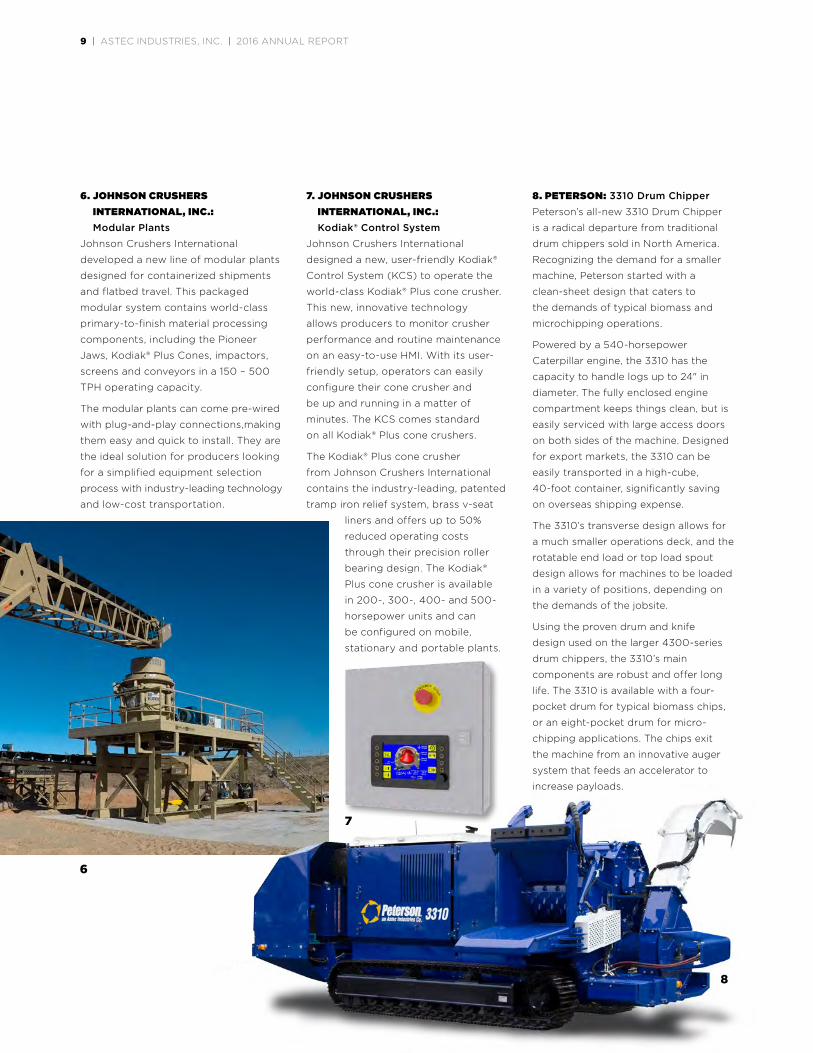
6. JOHNSON CRUSHERS INTERNATIONAL, INC.: Modular Plants
Johnson Crushers International
developed a new line of modular plants
designed for containerized shipments
and flatbed travel. This packaged
modular system contains world-class
primary-to-finish material processing
components, including the Pioneer
Jaws, Kodiak® Plus Cones, impactors,
screens and conveyors in a 150 – 500
TPH operating capacity.
The modular plants can come pre-wired
with plug-and-play connections,making
them easy and quick to install. They are
the ideal solution for producers looking
for a simplified equipment selection
process with industry-leading technology
and low-cost transportation.
7. JOHNSON CRUSHERS INTERNATIONAL, INC.: Kodiak® Control System
Johnson Crushers International
designed a new, user-friendly Kodiak®
Control System (KCS) to operate the
world-class Kodiak® Plus cone crusher.
This new, innovative technology
allows producers to monitor crusher
performance and routine maintenance
on an easy-to-use HMI. With its user-
friendly setup, operators can easily
configure their cone crusher and
be up and running in a matter of
minutes. The KCS comes standard
on all Kodiak® Plus cone crushers.
The Kodiak® Plus cone crusher
from Johnson Crushers International
contains the industry-leading, patented
tramp iron relief system, brass v-seat
liners and offers up to 50%
reduced operating costs
through their precision roller
bearing design. The Kodiak®
Plus cone crusher is available
in 200-, 300-, 400- and 500-
horsepower units and can
be configured on mobile,
stationary and portable plants.
8. PETERSON: 3310 Drum ChipperPeterson’s all-new 3310 Drum Chipper
is a radical departure from traditional
drum chippers sold in North America.
Recognizing the demand for a smaller
machine, Peterson started with a
clean-sheet design that caters to
the demands of typical biomass and
microchipping operations.
Powered by a 540-horsepower
Caterpillar engine, the 3310 has the
capacity to handle logs up to 24" in
diameter. The fully enclosed engine
compartment keeps things clean, but is
easily serviced with large access doors
on both sides of the machine. Designed
for export markets, the 3310 can be
easily transported in a high-cube,
40-foot container, significantly saving
on overseas shipping expense.
The 3310’s transverse design allows for
a much smaller operations deck, and the
rotatable end load or top load spout
design allows for machines to be loaded
in a variety of positions, depending on
the demands of the jobsite.
Using the proven drum and knife
design used on the larger 4300-series
drum chippers, the 3310’s main
components are robust and offer long
life. The 3310 is available with a four-
pocket drum for typical biomass chips,
or an eight-pocket drum for micro-
chipping applications. The chips exit
the machine from an innovative auger
system that feeds an accelerator to
increase payloads.
7
6
8
9 | ASTEC INDUSTRIES, INC. | 2016 ANNUAL REPORT
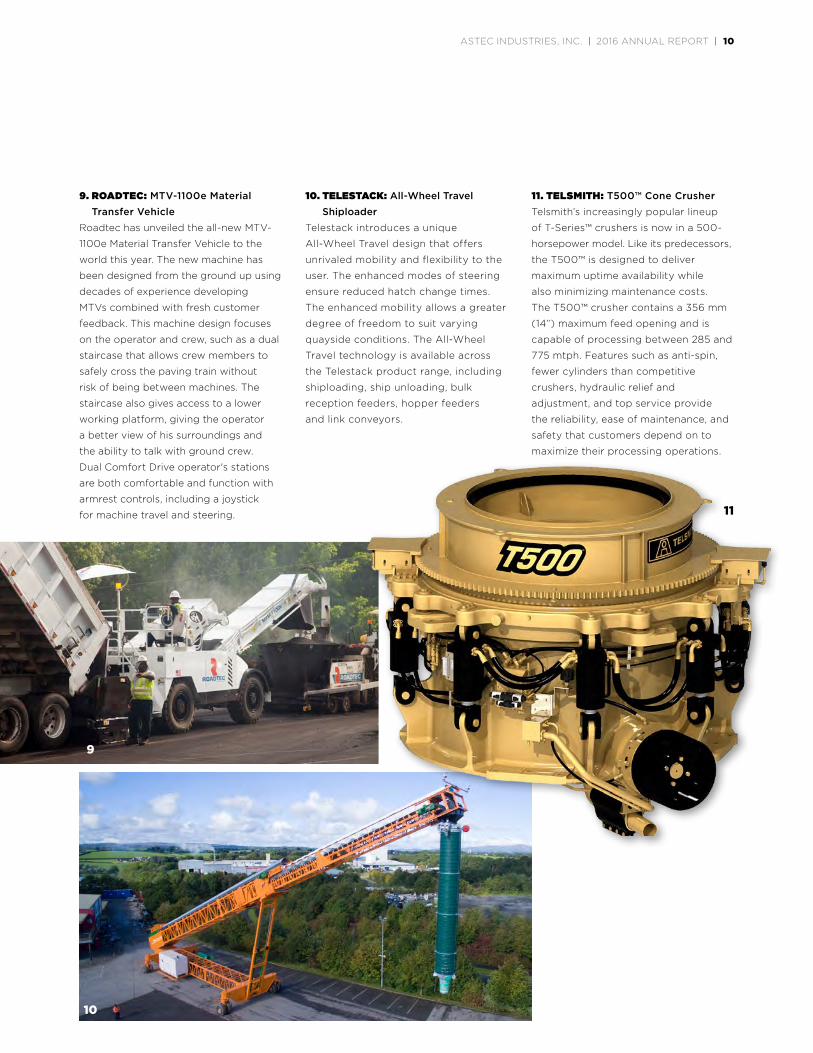
9. ROADTEC: MTV-1100e Material Transfer Vehicle
Roadtec has unveiled the all-new MTV-
1100e Material Transfer Vehicle to the
world this year. The new machine has
been designed from the ground up using
decades of experience developing
MTVs combined with fresh customer
feedback. This machine design focuses
on the operator and crew, such as a dual
staircase that allows crew members to
safely cross the paving train without
risk of being between machines. The
staircase also gives access to a lower
working platform, giving the operator
a better view of his surroundings and
the ability to talk with ground crew.
Dual Comfort Drive operator's stations
are both comfortable and function with
armrest controls, including a joystick
for machine travel and steering.
10. TELESTACK: All-Wheel Travel Shiploader
Telestack introduces a unique
All-Wheel Travel design that offers
unrivaled mobility and flexibility to the
user. The enhanced modes of steering
ensure reduced hatch change times.
The enhanced mobility allows a greater
degree of freedom to suit varying
quayside conditions. The All-Wheel
Travel technology is available across
the Telestack product range, including
shiploading, ship unloading, bulk
reception feeders, hopper feeders
and link conveyors.
11. TELSMITH: T500™ Cone CrusherTelsmith’s increasingly popular lineup
of T-Series™ crushers is now in a 500-
horsepower model. Like its predecessors,
the T500™ is designed to deliver
maximum uptime availability while
also minimizing maintenance costs.
The T500™ crusher contains a 356 mm
(14”) maximum feed opening and is
capable of processing between 285 and
775 mtph. Features such as anti-spin,
fewer cylinders than competitive
crushers, hydraulic relief and
adjustment, and top service provide
the reliability, ease of maintenance, and
safety that customers depend on to
maximize their processing operations.
9
10
11
ASTEC INDUSTRIES, INC. | 2016 ANNUAL REPORT | 10
ASTEC and Dillman Equipment offer a complete line of portable,
relocatable and stationary asphalt plant equipment. In addition,
ASTEC manufactures soil remediation equipment and wood pellet
manufacturing plants.
In 2016, ASTEC enhanced its position as a global leader in design,
innovation, manufacturing and service.
ASTEC participated in the Bauma trade fair April 11-17, 2016, in
Munich, Germany, debuting a new ultra-portable Double Barrel
Express plant. This compact plant ships in just two loads and is
able to produce mix with up to 50% reclaimed asphalt pavement
(RAP) content. ASTEC also unveiled a new concept for a RAP-
Pre dryer, which is capable of increaseing asphalt plant RAP into
the 80% range.
ASTEC was pleased to see the enthusiastic paving industry
response to the Double Barrel® XHR drum dryer with an external
mixer as a premium solution for utilizing a high percentage of RAP.
This innovative plant concept enables production of high- quality
mixes using 0 to 70% recycled asphalt pavement (RAP) content
with automatic baghouse temperature control.
ASTEC achieved some significant milestones in 2016. The
ASTEC facility in Chattanooga, Tennessee, worked a record
number of days without an OSHA recordable incident. At the same
time, ASTEC manufactured an all-time-record-volume of new
equipment in 2016.
ASTEC completed construction of a new manufacturing bay
at the Chattanooga facility. The 23,800-square-foot addition,
which is designed and equipped primarily for manufacturing dryer
drums for asphalt plants and wood pellet plants, began operating
in December.
ASTEC is optimistic about future prospects and plans to continue
to position itself to take full advantage of opportunities both
domestically and abroad. ASTEC continues to grow and maintain
customer loyalty through innovative equipment designs, industry-
leading customer service and outstanding technical education.
INDUSTRIES SERVED:
PRODUCTS AND SERVICES:n Portable Asphalt Plants
n Relocatable Asphalt Plants
n Stationary Asphalt Plants
n Soil Remediation Equipment
n Wood Pellet Processing Plants
n Control Systems
REPORTING GROUP: INFRASTRUCTURE
LOCATION: CHATTANOOGA, TENNESSEE, USA AND PRAIRIE DU CHIEN, WISCONSIN, USA
ASTEC DILLMAN EQUIPMENT
" ASTEC offers a complete line of
portable, relocatable and
stationary asphalt plant
equipment produced under the
ASTEC and the DILLMAN brands."
INFRASTRUCTURE
ENERGY
IMAGES, TOP TO BOTTOM: 1. Plant Process Control Systems 2. Double Barrel XHR Drum3. Ultra-Portable Double Barrel Express Plant4. 400 TPH Portable Double Barrel Facility5. 600,000-tonne-per-year Wood Pellet Manufacturing Plant6. Dillman 600TPH Relocatable UniDrum Plant
11 | ASTEC INDUSTRIES, INC. | 2016 ANNUAL REPORT

1 2
3
4
5 6
ASTEC INDUSTRIES, INC. | 2016 ANNUAL REPORT | 12

INDUSTRIES SERVED:
PRODUCTS AND SERVICES:n Milling Machines
n Cold In-Place Asphalt Recyclers
n Commercial-Class Asphalt Pavers
n Highway-Class Asphalt Pavers
n Material Transfer Vehicles
n Self-Propelled Brooms
n Soil Stabilizer
REPORTING GROUP: INFRASTRUCTURE
LOCATION: CHATTANOOGA, TENNESSEE, USA
ROADTEC
" In 2016, Roadtec focused on a
new approach to distribution and
service by signing new dealers
for several territories that were
previously handled directly."
INFRASTRUCTURE
In 2016, Roadtec focused on a new approach to distribution
and service by signing new dealers for several territories that
were previously handled directly. This new distribution strategy
will allow Roadtec to provide equipment and support much
closer to the customer, which will result in much more exposure
and trust with the customer base. Roadtec will still keep the
direct personnel for those areas but now their role will be as
support for these new dealers.
Roadtec’s industry-leading Guardian Intellimatics™ System
continues to evolve and add new features and improve user-
friendliness and accessibility. Moving to a web server approach
rather than directly connecting to the individual machines allows
better overall fleet management capabilities and makes features
like real-time production reporting much more powerful. The
Guardian system allows Roadtec and its customers to be much
more proactive on service and parts ordering.
Roadtec continues to expand its line of competitive wear
parts for other makes and models of asphalt paving and cold
planing equipment and is aggressively promoting these new
parts. This is an area of business that is rapidly growing and
allows Roadtec to expose customers of the competition to its
world-renowned customer service.
IMAGES, TOP TO BOTTOM: 1. Roadtec RP-190e Paver 2. Roadtec SX-6 Soil Stabilizer3. Roadtec CB-100 Broom4. Roadtec SB-2500e Material Transfer Vehicle5. Roadtec MTV-1100e Material Transfer Vehicle6. Roadtec RX-900 Milling Machine7. Roadtec RP-175 Paver8. Roadtec SX-8 Soil Stabilizer
13 | ASTEC INDUSTRIES, INC. | 2016 ANNUAL REPORT

1
4 7
5
2
3
6
7
8
ASTEC INDUSTRIES, INC. | 2016 ANNUAL REPORT | 14
Located in Tacoma, Washington, Carlson Paving Products
has grown to become the asphalt paving industry’s leader in
highway-class asphalt screeds, commercial-class paver platforms
and attachment innovations that enhance the safety and longevity
of America’s roadways.
Continuing to solidify itself as the preeminent leader among
asphalt screed manufacturers, Carlson produces seven
highway-class screed platforms in front-mount, rear-mount
and fixed-width variations. With their ability to mount to all
North American tractors built by the major paver manufacturers,
as well as the ability to retrofit to nearly all previous models,
Carlson’s line of the EZIII, EZIV, EZV and EZR2 screeds remains
the most demanded platform by highway-class contractors on
the market today.
In 2016, Carlson continued to upgrade and grow its commercial
paver lineup with the launching of the CP75 II, a high-production,
economical Tier IV Final/EU Stage IV commercial platform built
with the class-exclusive High Flow Material Conveyor™. The
platform joins the CP100, the commercial class’ leading heavy-
duty paver renowned for its highway-class build and EZC815
electrically heated screed, to bring contractors superior paver
platforms unmatched in performance, contractor focus and
mat quality.
Advancing work zone safety and roadway longevity, Carlson has
added the all-in-one LED Blade Light™ to its wide array of
attachment technologies. With the industry’s leading directional
LED platform for safer mobile equipment illumination, Carlson has
enhanced its lighting system with the ability to be powered by
AC and DC sources in a single platform for greater versatility
and safety on jobsite applications including flagging stations,
stationary illumination and more.
With its ever-growing product line and steadfast dedication to
the customer, Carlson Paving Products enters 2017 poised to take
advantage of emerging opportunities and deliver innovative
solutions for the commercial- and highway-class contractor.
INDUSTRIES SERVED:
PRODUCTS AND SERVICES:n Asphalt Paving Screeds
n Commercial-Class Asphalt Pavers
n Asphalt Screed Attachments
n Mobile Equipment Lighting
REPORTING GROUP: INFRASTRUCTURE
LOCATION: TACOMA, WASHINGTON, USA
CARLSON PAVING PRODUCTS
" Carlson Paving Products has
grown to become the asphalt
paving industry’s leader in
highway-class asphalt screeds,
commercial-class paver platforms
and attachment innovations that
enhance the safety and longevity
of America’s roadways."
IMAGES, TOP TO BOTTOM: 1. Carlson EZV Front-Mount Screed 2. Carlson CP 100 Commercial Class Paver3. Carlson EZIV Front-Mount Screed4. Carlson CP75 II Commercial Paver5. Carlson Blade Light6. Carlson EZR2 Rear-Mount Screed
INFRASTRUCTURE
15 | ASTEC INDUSTRIES, INC. | 2016 ANNUAL REPORT

1 2 3
4
5 6
ASTEC INDUSTRIES, INC. | 2016 ANNUAL REPORT | 16
Astec Australia Pty. Ltd. offers a complete line of Astec
manufactured asphalt plants, asphalt mobile equipment, and
aggregate and mining equipment to the Australian, New Zealand
and South Pacific region.
The delivery of above-market service expectations underpinned
Australia’s performance in 2016. The commitment to customer
expectation and needs was influential in generating an
encouraging result for the year, as Asphalt Mobile and Aggregate
market segments performed well. The new RP170EX pavers, the
RP190EX series and the new E Series Shuttle Buggy were
successfully introduced to the market, resulting in a positive
impact on sales. Our aggregate business grew with major sales
for AMS, BTI, JCI and Telsmith in boom systems, fixed and track
crushing, and screening equipment. The AMS 2618VM high-
frequency screen rack machine was successfully introduced to
the local market and demonstrated Astec Mobile Screens’ unique
capability for handling finely graded products to the growing
recycling segment. In the asphalt segment, Heatec’s new
generation of bitumen tank products was successfully launched
and resulted in a substantial sale to a leading customer. Australia’s
parts and service sales performed well.
In 2017, Astec Australia is confident of continued growth, with the
company well positioned for good contributions from all product
lines and services to consolidate its overall market position.
INDUSTRIES SERVED:
PRODUCTS AND SERVICES:n Milling Machines
n Cold In-Place Asphalt Recyclers
n Commercial-Class Asphalt Pavers
n Highway-Class Asphalt Pavers
n Material Transfer Vehicles
n Self-Propelled Brooms
REPORTING GROUP: INFRASTRUCTURE
LOCATION: ACACIA RIDGE, QUEENSLAND, AUSTRALIA
ASTEC AUSTRALIA
" Exclusively representing products
manufactured by the family of
Astec companies, Astec Australia
continues to grow through their
delivery of service excellence that
exceeds customer needs and
expectations."
INFRASTRUCTURE
AGGREGATE AND MINING
ENERGY
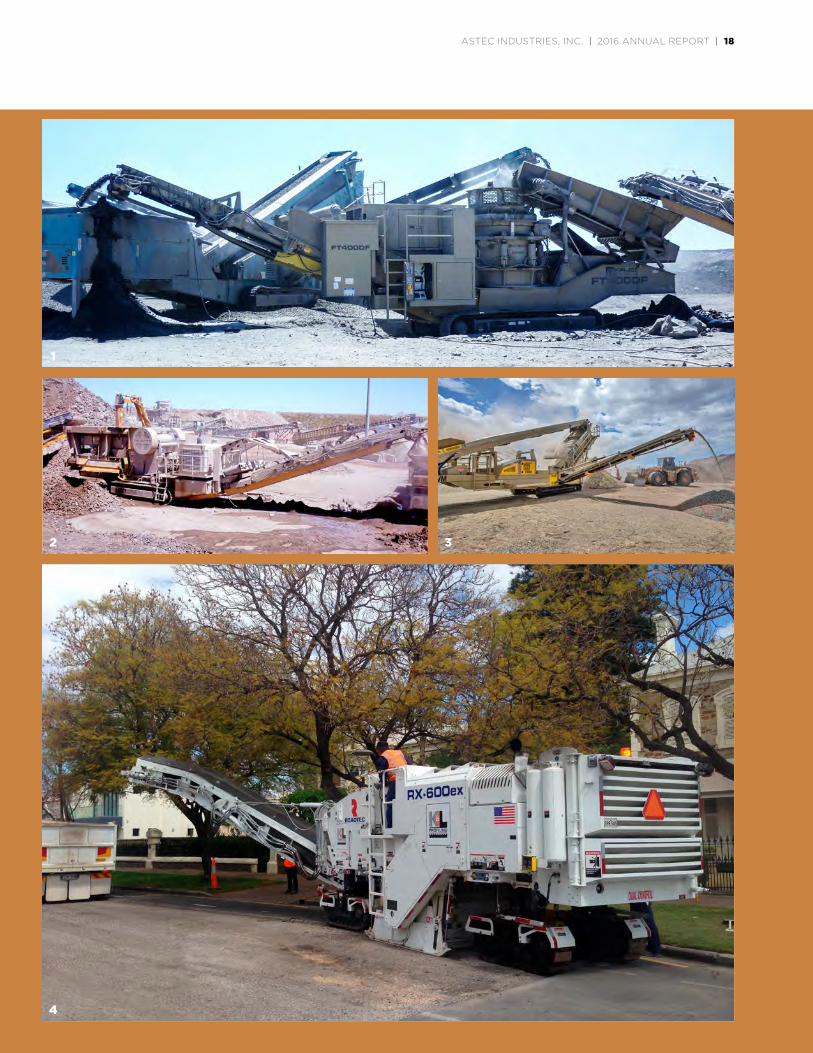
IMAGES, TOP TO BOTTOM: 1. FT400DF Cone Crushing Plant 2. FT300 Cone Crushing Plant3. FT2618VM Screen Plant4. RX600ex Cold Planer
17 | ASTEC INDUSTRIES, INC. | 2016 ANNUAL REPORT
1
4
2
1
5
3
ASTEC INDUSTRIES, INC. | 2016 ANNUAL REPORT | 18
AMM supplies road wideners, specialized asphalt/RCC paving
screeds, and material remix hoppers for hot mix asphalt and
stabilized soil. Located in Hameln, Germany, AMM has sold
equipment to several European countries and to a few countries
in the Middle East. To date, the primary products sold by AMM
have been from Roadtec.
In 2015, AMM began representing Peterson Pacific products
in Europe.
In the future, AMM will work to represent additional Astec
Industries' subsidiaries as opportunities arise.
INDUSTRIES SERVED:
PRODUCTS AND SERVICES:n Material Transfer Vehicles
n Asphalt Pavers—Asphalt Screeds
n Milling Machines
n Cold In-Place Recyclers
n Front Mounted Brooms
n Road Wideners
n Wood Processing Equipment
REPORTING GROUP: INFRASTRUCTURE
LOCATION: HAMELN, GERMANY
ASTEC MOBILE MACHINERY
" AMM supplies road wideners,
specialized asphalt/RCC paving
screeds, and material remix
hoppers for hot mix asphalt
and stabilized soil."
INFRASTRUCTURE
ENERGY
19 | ASTEC INDUSTRIES, INC. | 2016 ANNUAL REPORT
IMAGES, TOP TO BOTTOM: 1. Tamper Bar Screed2. Shuttle Buggy 2500E3. Dual paving with two Shuttle Buggy MTVs 4. RX-600e Asphalt Milling Machine
19 | ASTEC INDUSTRIES, INC. | 2016 ANNUAL REPORT

1
2
3
4
ASTEC INDUSTRIES, INC. | 2016 ANNUAL REPORT | 20
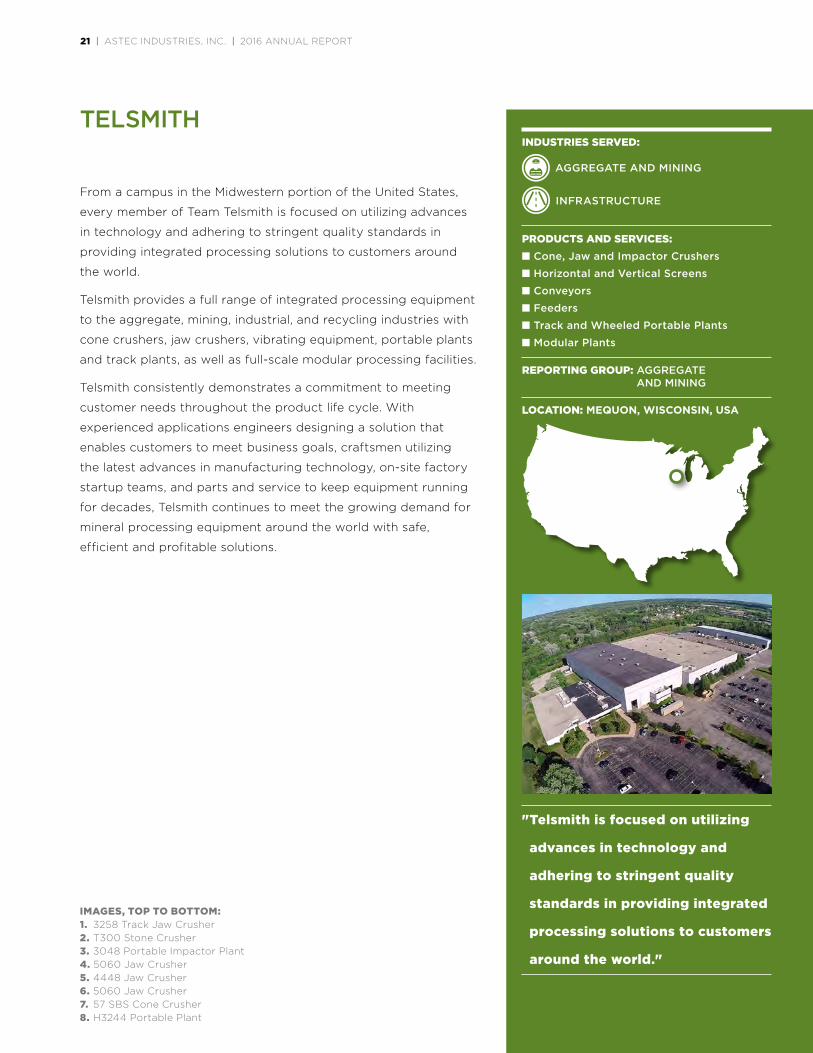
From a campus in the Midwestern portion of the United States,
every member of Team Telsmith is focused on utilizing advances
in technology and adhering to stringent quality standards in
providing integrated processing solutions to customers around
the world.
Telsmith provides a full range of integrated processing equipment
to the aggregate, mining, industrial, and recycling industries with
cone crushers, jaw crushers, vibrating equipment, portable plants
and track plants, as well as full-scale modular processing facilities.
Telsmith consistently demonstrates a commitment to meeting
customer needs throughout the product life cycle. With
experienced applications engineers designing a solution that
enables customers to meet business goals, craftsmen utilizing
the latest advances in manufacturing technology, on-site factory
startup teams, and parts and service to keep equipment running
for decades, Telsmith continues to meet the growing demand for
mineral processing equipment around the world with safe,
efficient and profitable solutions.
INDUSTRIES SERVED:
PRODUCTS AND SERVICES:n Cone, Jaw and Impactor Crushers
n Horizontal and Vertical Screens
n Conveyors
n Feeders
n Track and Wheeled Portable Plants
n Modular Plants
REPORTING GROUP: AGGREGATE AND MINING
LOCATION: MEQUON, WISCONSIN, USA
TELSMITH
" Telsmith is focused on utilizing
advances in technology and
adhering to stringent quality
standards in providing integrated
processing solutions to customers
around the world."
INFRASTRUCTURE
AGGREGATE AND MINING
IMAGES, TOP TO BOTTOM: 1. 3258 Track Jaw Crusher 2. T300 Stone Crusher3. 3048 Portable Impactor Plant4. 5060 Jaw Crusher5. 4448 Jaw Crusher6. 5060 Jaw Crusher7. 57 SBS Cone Crusher8. H3244 Portable Plant
21 | ASTEC INDUSTRIES, INC. | 2016 ANNUAL REPORT

1 2
3 4
65 7
8
ASTEC INDUSTRIES, INC. | 2016 ANNUAL REPORT | 22
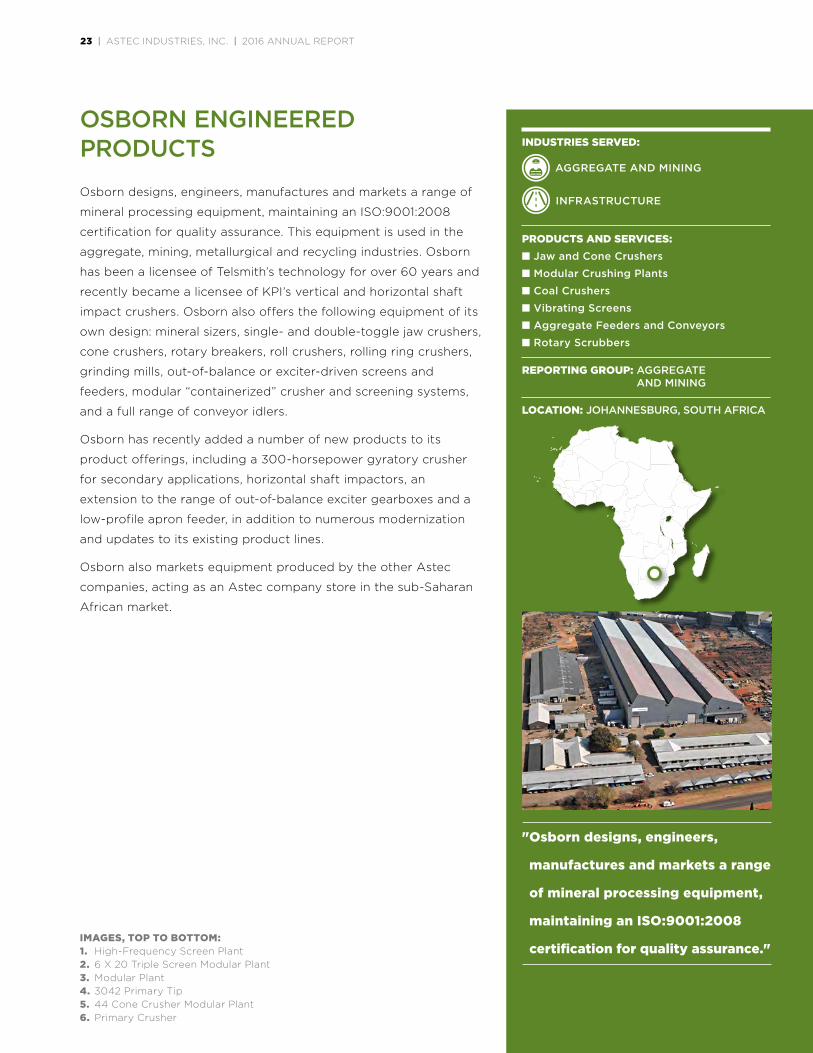
Osborn designs, engineers, manufactures and markets a range of
mineral processing equipment, maintaining an ISO:9001:2008
certification for quality assurance. This equipment is used in the
aggregate, mining, metallurgical and recycling industries. Osborn
has been a licensee of Telsmith’s technology for over 60 years and
recently became a licensee of KPI’s vertical and horizontal shaft
impact crushers. Osborn also offers the following equipment of its
own design: mineral sizers, single- and double-toggle jaw crushers,
cone crushers, rotary breakers, roll crushers, rolling ring crushers,
grinding mills, out-of-balance or exciter-driven screens and
feeders, modular “containerized” crusher and screening systems,
and a full range of conveyor idlers.
Osborn has recently added a number of new products to its
product offerings, including a 300-horsepower gyratory crusher
for secondary applications, horizontal shaft impactors, an
extension to the range of out-of-balance exciter gearboxes and a
low-profile apron feeder, in addition to numerous modernization
and updates to its existing product lines.
Osborn also markets equipment produced by the other Astec
companies, acting as an Astec company store in the sub-Saharan
African market.
INDUSTRIES SERVED:
PRODUCTS AND SERVICES:n Jaw and Cone Crushers
n Modular Crushing Plants
n Coal Crushers
n Vibrating Screens
n Aggregate Feeders and Conveyors
n Rotary Scrubbers
REPORTING GROUP: AGGREGATE AND MINING
LOCATION: JOHANNESBURG, SOUTH AFRICA
OSBORN ENGINEERED PRODUCTS
" Osborn designs, engineers,
manufactures and markets a range
of mineral processing equipment,
maintaining an ISO:9001:2008
certification for quality assurance."
INFRASTRUCTURE
AGGREGATE AND MINING
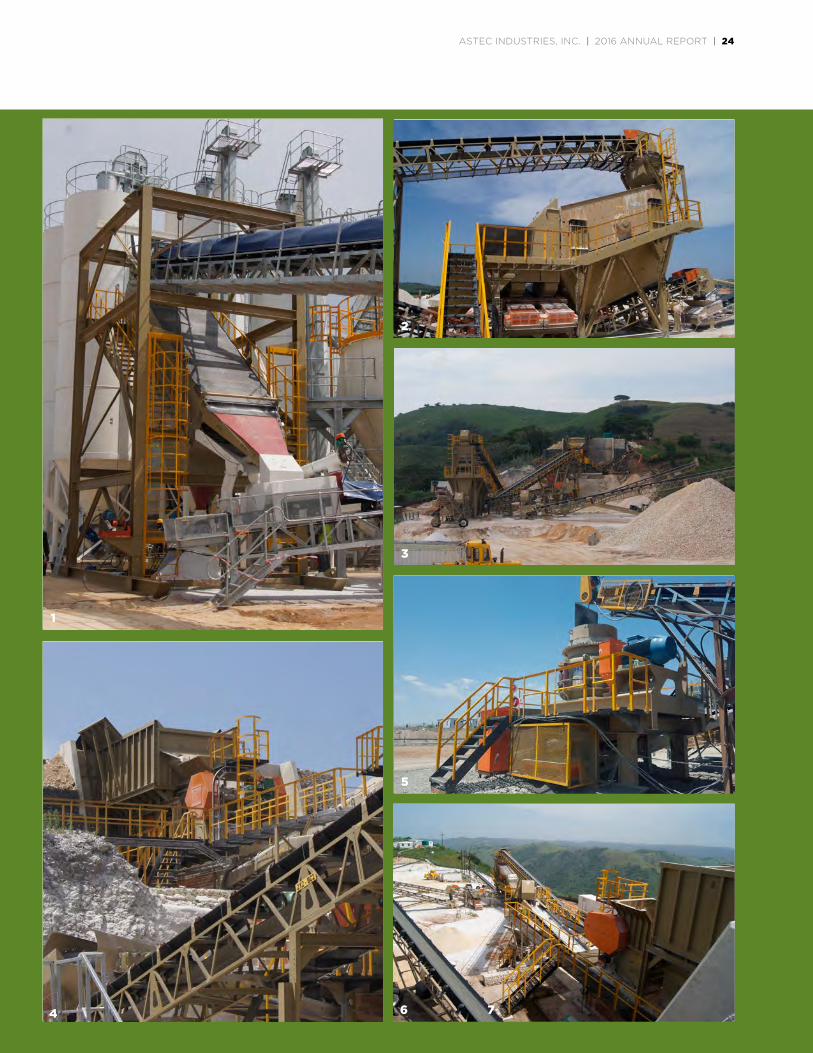
IMAGES, TOP TO BOTTOM: 1. High-Frequency Screen Plant 2. 6 X 20 Triple Screen Modular Plant3. Modular Plant4. 3042 Primary Tip5. 44 Cone Crusher Modular Plant6. Primary Crusher
23 | ASTEC INDUSTRIES, INC. | 2016 ANNUAL REPORT
7
1
2
3
5
4 6
ASTEC INDUSTRIES, INC. | 2016 ANNUAL REPORT | 24
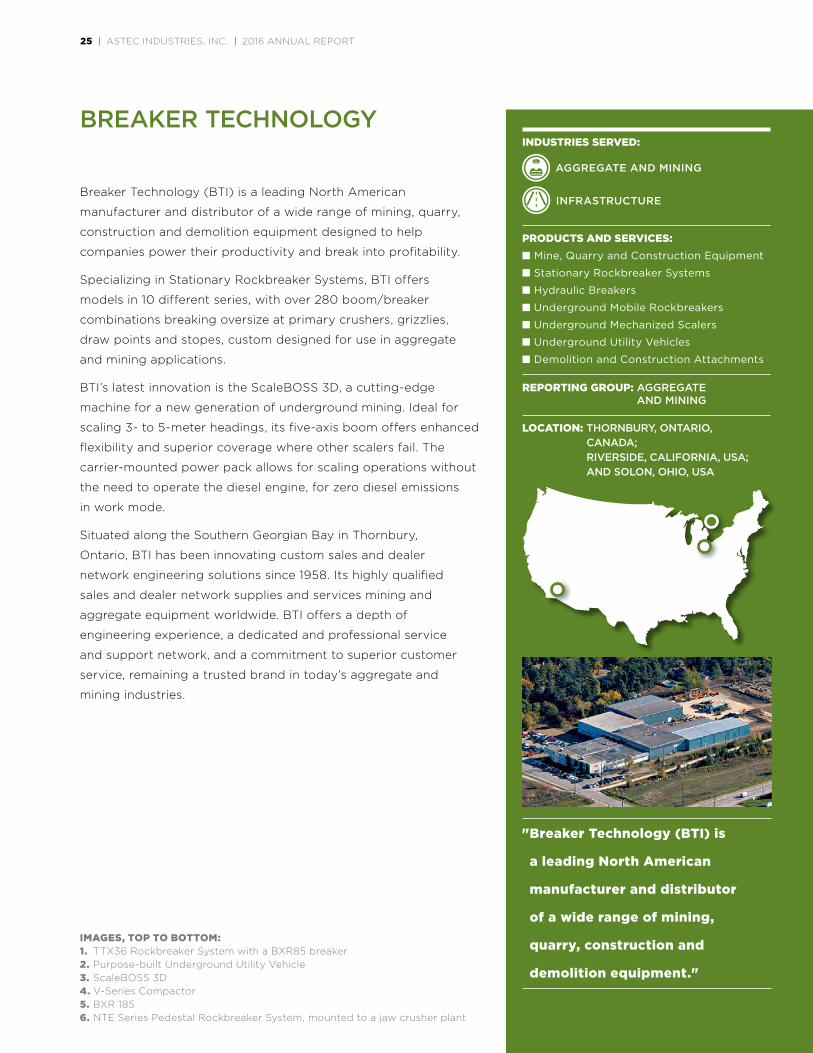
Breaker Technology (BTI) is a leading North American
manufacturer and distributor of a wide range of mining, quarry,
construction and demolition equipment designed to help
companies power their productivity and break into profitability.
Specializing in Stationary Rockbreaker Systems, BTI offers
models in 10 different series, with over 280 boom/breaker
combinations breaking oversize at primary crushers, grizzlies,
draw points and stopes, custom designed for use in aggregate
and mining applications.
BTI’s latest innovation is the ScaleBOSS 3D, a cutting-edge
machine for a new generation of underground mining. Ideal for
scaling 3- to 5-meter headings, its five-axis boom offers enhanced
flexibility and superior coverage where other scalers fail. The
carrier-mounted power pack allows for scaling operations without
the need to operate the diesel engine, for zero diesel emissions
in work mode.
Situated along the Southern Georgian Bay in Thornbury,
Ontario, BTI has been innovating custom sales and dealer
network engineering solutions since 1958. Its highly qualified
sales and dealer network supplies and services mining and
aggregate equipment worldwide. BTI offers a depth of
engineering experience, a dedicated and professional service
and support network, and a commitment to superior customer
service, remaining a trusted brand in today’s aggregate and
mining industries.
INDUSTRIES SERVED:
PRODUCTS AND SERVICES:n Mine, Quarry and Construction Equipment
n Stationary Rockbreaker Systems
n Hydraulic Breakers
n Underground Mobile Rockbreakers
n Underground Mechanized Scalers
n Underground Utility Vehicles
n Demolition and Construction Attachments
REPORTING GROUP: AGGREGATE AND MINING
LOCATION: THORNBURY, ONTARIO, CANADA; RIVERSIDE, CALIFORNIA, USA; AND SOLON, OHIO, USA
BREAKER TECHNOLOGY
INFRASTRUCTURE
AGGREGATE AND MINING
" Breaker Technology (BTI) is
a leading North American
manufacturer and distributor
of a wide range of mining,
quarry, construction and
demolition equipment."
IMAGES, TOP TO BOTTOM: 1. TTX36 Rockbreaker System with a BXR85 breaker 2. Purpose-built Underground Utility Vehicle3. ScaleBOSS 3D4. V-Series Compactor 5. BXR 1856. NTE Series Pedestal Rockbreaker System, mounted to a jaw crusher plant
25 | ASTEC INDUSTRIES, INC. | 2016 ANNUAL REPORT

1 2
3
4 5 6
ASTEC INDUSTRIES, INC. | 2016 ANNUAL REPORT | 26

Astec do Brasil is the only Astec Industries, Inc. manufacturing
facility in South America. This facility produces a complete line of
equipment, including crushers, vibrating screens, portable plants
and asphalt plants, in addition to the marketing and support of
Astec Industries' equipment, such as track-mounted equipment,
material transfer vehicles and scalers. With the delivery and
startup of complete crushing plants already manufactured in the
new facility, Astec do Brasil is becoming an important supplier
for the aggregate, mining and infrastructure segments, with the
goal of becoming the leader in the Brazilian market and expanding
to the Mercosur market—which has already begun with equipment
shipped to Argentina and Colombia. Astec do Brasil continues to
increase its line of products, focusing on quality, efficiency and
customer satisfaction.
INDUSTRIES SERVED:
PRODUCTS AND SERVICES:n Mobile Screening Plants
n Portable Screening Plants
n Stationary Screen Structures
n High-Frequency Screens
n Crushing and Vibrating Equipment
n Asphalt Production Equipment
REPORTING GROUP: AGGREGATE AND MINING
LOCATION: VESPASIANO, MINAS GERAIS, BRASIL
ASTEC DO BRASIL
INFRASTRUCTURE
AGGREGATE AND MINING
" Astec do Brasil continues to
increase its line of products,
focusing on quality, efficiency
and customer satisfaction."
IMAGES, TOP TO BOTTOM: 1. CM44SBS Portable Plant2. Complete Crushing Plant with equipment: • Two 8' x 24' TD Vibrating Screens3. Primary Crushing Plant with equipment: • H3244 Jaw Crusher • 5' x 14' DD Vibrating Screen • VGF 48" x 16' Vibrating Feeder 4. 3450 Hydra Jaw Crusher 5. Complete Crushing Plant with equipment • 6' x 20' TD • DD Vibrating Screen6. CMH3244 Portable Plant
27 | ASTEC INDUSTRIES, INC. | 2016 ANNUAL REPORT

1
2
4
6
5
3
ASTEC INDUSTRIES, INC. | 2016 ANNUAL REPORT | 28
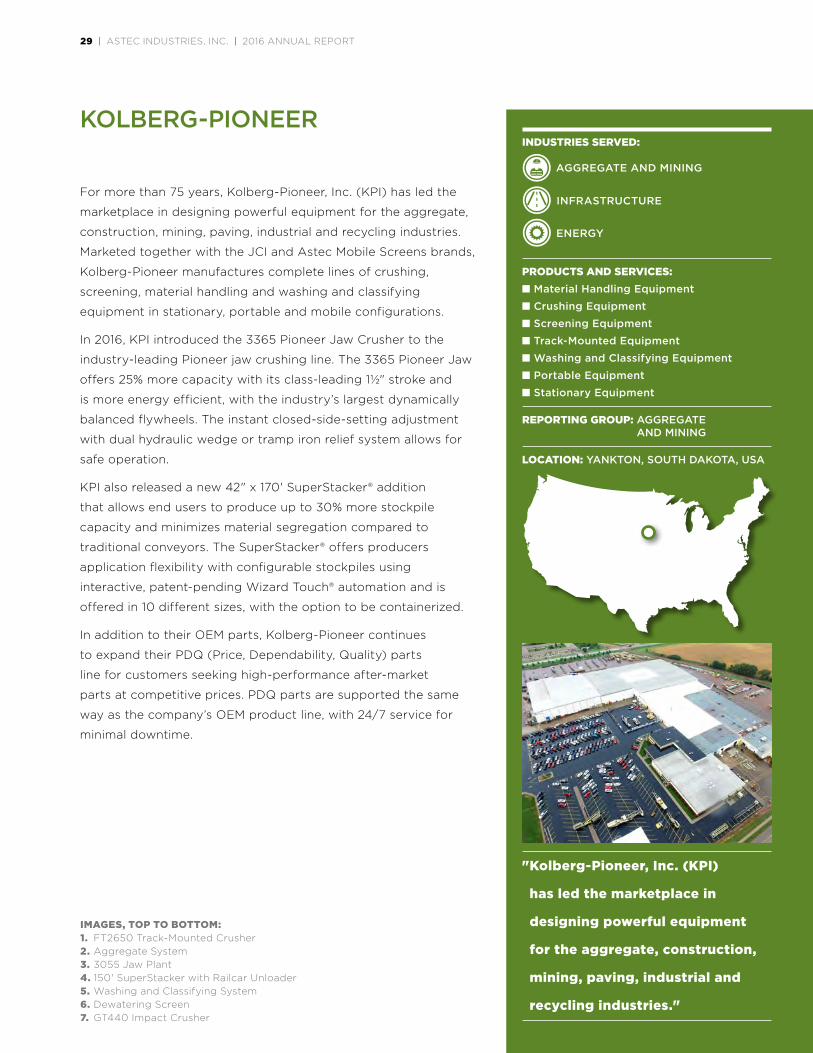
For more than 75 years, Kolberg-Pioneer, Inc. (KPI) has led the
marketplace in designing powerful equipment for the aggregate,
construction, mining, paving, industrial and recycling industries.
Marketed together with the JCI and Astec Mobile Screens brands,
Kolberg-Pioneer manufactures complete lines of crushing,
screening, material handling and washing and classifying
equipment in stationary, portable and mobile configurations.
In 2016, KPI introduced the 3365 Pioneer Jaw Crusher to the
industry-leading Pioneer jaw crushing line. The 3365 Pioneer Jaw
offers 25% more capacity with its class-leading 1½" stroke and
is more energy efficient, with the industry’s largest dynamically
balanced flywheels. The instant closed-side-setting adjustment
with dual hydraulic wedge or tramp iron relief system allows for
safe operation.
KPI also released a new 42" x 170' SuperStacker® addition
that allows end users to produce up to 30% more stockpile
capacity and minimizes material segregation compared to
traditional conveyors. The SuperStacker® offers producers
application flexibility with configurable stockpiles using
interactive, patent-pending Wizard Touch® automation and is
offered in 10 different sizes, with the option to be containerized.
In addition to their OEM parts, Kolberg-Pioneer continues
to expand their PDQ (Price, Dependability, Quality) parts
line for customers seeking high-performance after-market
parts at competitive prices. PDQ parts are supported the same
way as the company’s OEM product line, with 24/7 service for
minimal downtime.
INDUSTRIES SERVED:
PRODUCTS AND SERVICES:n Material Handling Equipment
n Crushing Equipment
n Screening Equipment
n Track-Mounted Equipment
n Washing and Classifying Equipment
n Portable Equipment
n Stationary Equipment
REPORTING GROUP: AGGREGATE AND MINING
LOCATION: YANKTON, SOUTH DAKOTA, USA
KOLBERG-PIONEER
" Kolberg-Pioneer, Inc. (KPI)
has led the marketplace in
designing powerful equipment
for the aggregate, construction,
mining, paving, industrial and
recycling industries."
INFRASTRUCTURE
AGGREGATE AND MINING
ENERGY
IMAGES, TOP TO BOTTOM: 1. FT2650 Track-Mounted Crusher 2. Aggregate System3. 3055 Jaw Plant4. 150' SuperStacker with Railcar Unloader5. Washing and Classifying System6. Dewatering Screen7. GT440 Impact Crusher
29 | ASTEC INDUSTRIES, INC. | 2016 ANNUAL REPORT

1 2
3 4
6
75
ASTEC INDUSTRIES, INC. | 2016 ANNUAL REPORT | 30
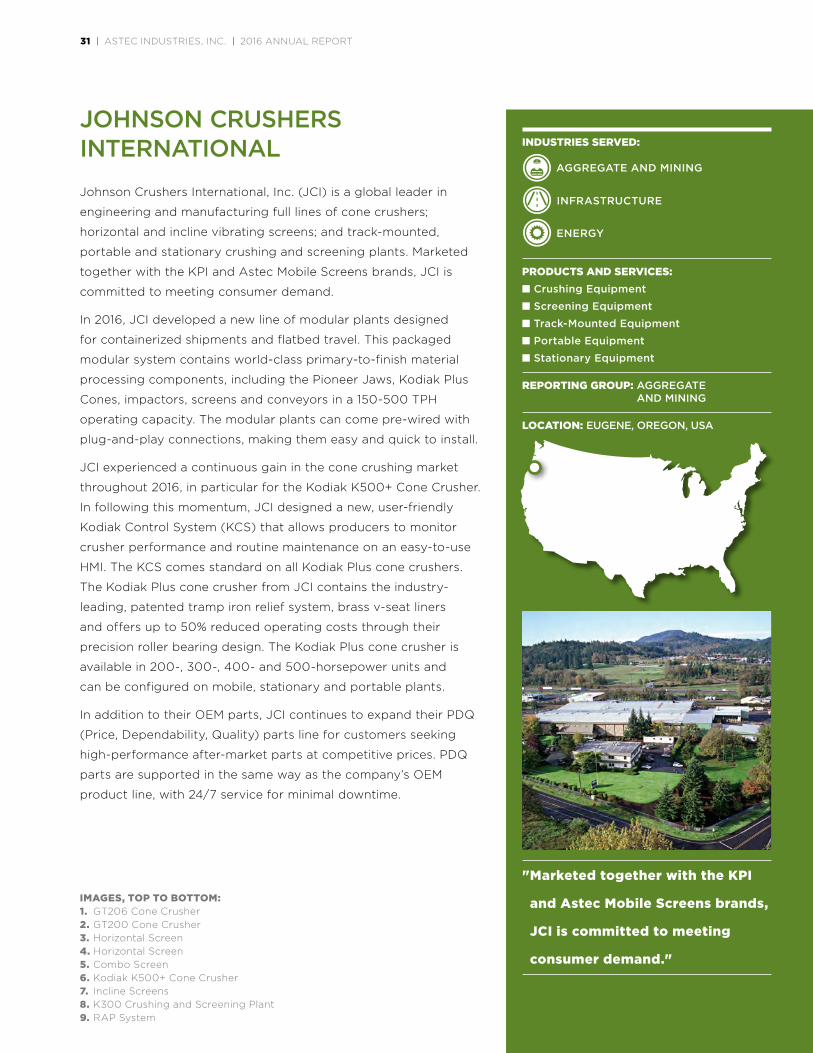
Johnson Crushers International, Inc. (JCI) is a global leader in
engineering and manufacturing full lines of cone crushers;
horizontal and incline vibrating screens; and track-mounted,
portable and stationary crushing and screening plants. Marketed
together with the KPI and Astec Mobile Screens brands, JCI is
committed to meeting consumer demand.
In 2016, JCI developed a new line of modular plants designed
for containerized shipments and flatbed travel. This packaged
modular system contains world-class primary-to-finish material
processing components, including the Pioneer Jaws, Kodiak Plus
Cones, impactors, screens and conveyors in a 150-500 TPH
operating capacity. The modular plants can come pre-wired with
plug-and-play connections, making them easy and quick to install.
JCI experienced a continuous gain in the cone crushing market
throughout 2016, in particular for the Kodiak K500+ Cone Crusher.
In following this momentum, JCI designed a new, user-friendly
Kodiak Control System (KCS) that allows producers to monitor
crusher performance and routine maintenance on an easy-to-use
HMI. The KCS comes standard on all Kodiak Plus cone crushers.
The Kodiak Plus cone crusher from JCI contains the industry-
leading, patented tramp iron relief system, brass v-seat liners
and offers up to 50% reduced operating costs through their
precision roller bearing design. The Kodiak Plus cone crusher is
available in 200-, 300-, 400- and 500-horsepower units and
can be configured on mobile, stationary and portable plants.
In addition to their OEM parts, JCI continues to expand their PDQ
(Price, Dependability, Quality) parts line for customers seeking
high-performance after-market parts at competitive prices. PDQ
parts are supported in the same way as the company’s OEM
product line, with 24/7 service for minimal downtime.
INDUSTRIES SERVED:
PRODUCTS AND SERVICES:n Crushing Equipment
n Screening Equipment
n Track-Mounted Equipment
n Portable Equipment
n Stationary Equipment
REPORTING GROUP: AGGREGATE AND MINING
LOCATION: EUGENE, OREGON, USA
JOHNSON CRUSHERS INTERNATIONAL
" Marketed together with the KPI
and Astec Mobile Screens brands,
JCI is committed to meeting
consumer demand."
INFRASTRUCTURE
AGGREGATE AND MINING
ENERGY
IMAGES, TOP TO BOTTOM: 1. GT206 Cone Crusher 2. GT200 Cone Crusher3. Horizontal Screen4. Horizontal Screen5. Combo Screen6. Kodiak K500+ Cone Crusher7. Incline Screens8. K300 Crushing and Screening Plant9. RAP System
31 | ASTEC INDUSTRIES, INC. | 2016 ANNUAL REPORT

2
1
4
5
6 7
98
3
ASTEC INDUSTRIES, INC. | 2016 ANNUAL REPORT | 32

Astec Mobile Screens, Inc. is recognized as a global leader in
screening solutions. Marketed together with the KPI and JCI
brands, the company’s products include mobile screening plants,
portable and stationary screen structures, and high- frequency
screens for quarry, recycle, sand and gravel, industrial and other
material processing industries.
In 2016, Astec Mobile Screens released their latest screening
technology to their GT mobile screen line. The GT205 multi-
frequency screen offers up to 15 g’s of force on the bottom deck,
which creates up to 50% more performance than competitive
units. The unit is ideal for the toughest applications where
conventional incline screens are limited. The release of the
multi-frequency screen will continue into other GT models as
well as being offered as a stationary or portable option.
Astec Mobile Screens also redesigned its ProSizer® 3100. The 3100
has been designed specifically to improve performance in milling
RAP. The new unit features a final Tier IV engine, upgraded
crusher controls, a swing-out return conveyor and improved
maintenance features. In addition, we incorporated common
designs and purchased components into the unit to improve
manufacturing efficiency and reduce the requirement for unique
stocked parts from our dealer.
In addition to their OEM parts, Astec Mobile Screens continues
to expand their PDQ (Price, Dependability and Quality) parts
line for customers seeking high-performance after-market
parts at competitive prices. PDQ parts are supported in the same
way as the company’s OEM product line, with 24/7 service for
minimal downtime.
INDUSTRIES SERVED:
PRODUCTS AND SERVICES:n Track-Mounted Screening Plants
n Stationary Screen Structures
n Portable Screening Plants
n High-Frequency Screens
REPORTING GROUP: AGGREGATE AND MINING
LOCATION: STERLING, ILLINOIS, USA
ASTEC MOBILE SCREENS
" Astec Mobile Screens, Inc. is
recognized as a global leader
in screening solutions."
INFRASTRUCTURE
AGGREGATE AND MINING
ENERGY
IMAGES, TOP TO BOTTOM: 1. GT165DF Screen Plant 2. GT205 Multi-Frequency Screen3. High-Frequency Screen4. RAP Processing System5. ProSizer 42006. GT104 Track-Mounted Screening Plant7. ProSizer 31008. PTSC 2618VM9. GT205S Multi-Frequency Screen
33 | 2016 ANNUAL REPORT
3
21
3
4
5
6 7
98
2016 ANNUAL REPORT | 34

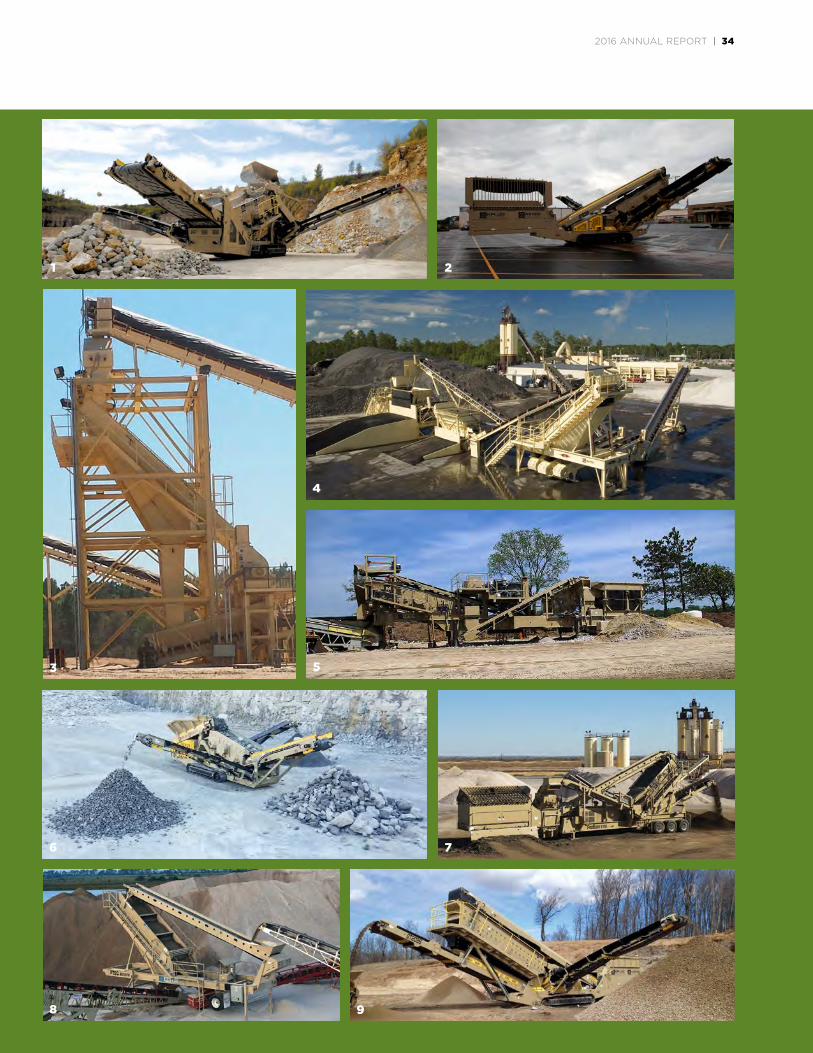
Telestack's solutions are used for vessel loading and unloading,
stacking, reclaiming, and rail wagon loading and unloading of dry
bulk materials. The end users are some of the biggest companies
in their chosen industries and they rely on Telestack's proven
record of performance to develop customized solutions for their
bulk handling facilities. Its externally audited procedures—ISO
14001 (Environmental Management), OHSAS 18001 (Health &
Safety Management) and ISO 9001 (Quality Management
Systems)—ensure ensures Telestack has the processes in place
to deliver what the customer ordered on time, within budget and
to the expected quality standards. Robust designs and innovative
assembly designs allow Telestack equipment to be easily packed
into shipping containers and quickly assembled on-site anywhere
in the world, ensuring Telestack is competitive globally.
INDUSTRIES SERVED:
PRODUCTS AND SERVICES:n Shiploaders and Unloaders
n Bulk Reception Feeders
n Radial Telescopic Stackers
n Mobile Truck Unloaders
n Track-Mounted Conveyors
n Reclaim Hoppers
n Mobile Truck Unloaders
REPORTING GROUP: AGGREGATE AND MINING
LOCATION: OMAGH, NORTHERN IRELAND
TELESTACK
" Telestack offers a range of mobile
bulk material handling solutions
that are used in ports and inland
river terminals, mines, quarries,
power stations, steel mills and
cement plants."
INFRASTRUCTURE
AGGREGATE AND MINING
ENERGY
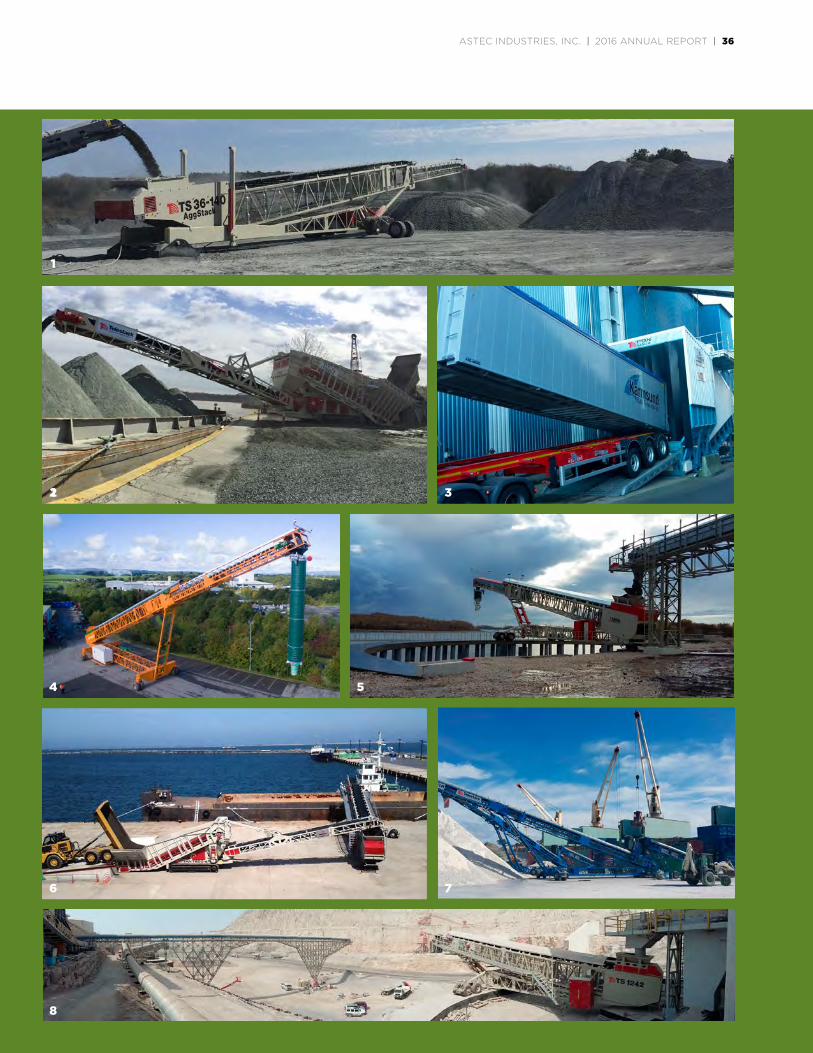
IMAGES, TOP TO BOTTOM: 1. Aggstack TS 36-140 Low Tail Radial Telescopic Conveyor 2. Titan T1600-8 Bulk Reception Feeder3. Titan S450-6 Bulk Reception Feeder4. TB52 Export All-Wheel Travel Shiploader5. TS850 Radial Telescopic Conveyor 6. Titan T800-6 Bulk Reception Feeder and TS 1042 Radial
Telescopic Conveyor 7. TL318 Mobile Links and TCL 331 Radial Stackers8. TS 1242 Radial Telescopic Conveyor
35 | ASTEC INDUSTRIES, INC. | 2016 ANNUAL REPORT
1
1 32
4
6
8
7
5
ASTEC INDUSTRIES, INC. | 2016 ANNUAL REPORT | 36
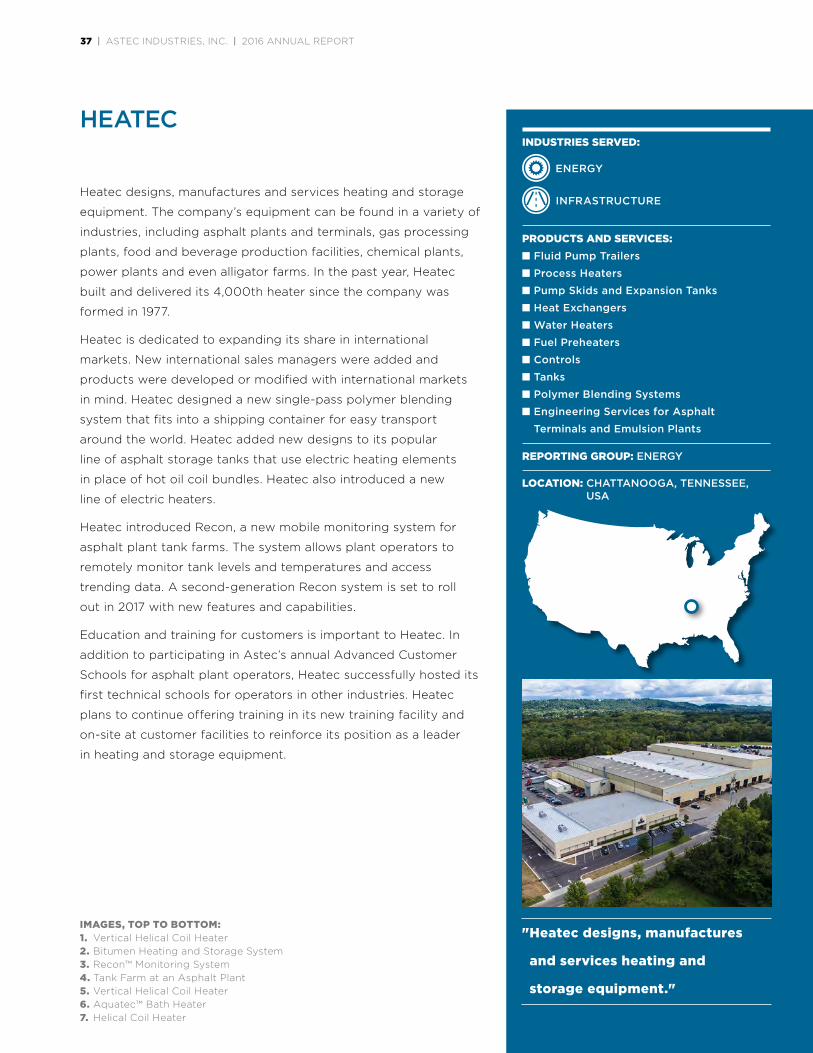
IMAGES, TOP TO BOTTOM: 1. Vertical Helical Coil Heater2. Bitumen Heating and Storage System3. Recon™ Monitoring System4. Tank Farm at an Asphalt Plant5. Vertical Helical Coil Heater6. Aquatec™ Bath Heater7. Helical Coil Heater
Heatec designs, manufactures and services heating and storage
equipment. The company’s equipment can be found in a variety of
industries, including asphalt plants and terminals, gas processing
plants, food and beverage production facilities, chemical plants,
power plants and even alligator farms. In the past year, Heatec
built and delivered its 4,000th heater since the company was
formed in 1977.
Heatec is dedicated to expanding its share in international
markets. New international sales managers were added and
products were developed or modified with international markets
in mind. Heatec designed a new single-pass polymer blending
system that fits into a shipping container for easy transport
around the world. Heatec added new designs to its popular
line of asphalt storage tanks that use electric heating elements
in place of hot oil coil bundles. Heatec also introduced a new
line of electric heaters.
Heatec introduced Recon, a new mobile monitoring system for
asphalt plant tank farms. The system allows plant operators to
remotely monitor tank levels and temperatures and access
trending data. A second-generation Recon system is set to roll
out in 2017 with new features and capabilities.
Education and training for customers is important to Heatec. In
addition to participating in Astec’s annual Advanced Customer
Schools for asphalt plant operators, Heatec successfully hosted its
first technical schools for operators in other industries. Heatec
plans to continue offering training in its new training facility and
on-site at customer facilities to reinforce its position as a leader
in heating and storage equipment.
INDUSTRIES SERVED:
PRODUCTS AND SERVICES:n Fluid Pump Trailers
n Process Heaters
n Pump Skids and Expansion Tanks
n Heat Exchangers
n Water Heaters
n Fuel Preheaters
n Controls
n Tanks
n Polymer Blending Systems
n Engineering Services for Asphalt
Terminals and Emulsion Plants
REPORTING GROUP: ENERGY
LOCATION: CHATTANOOGA, TENNESSEE, USA
HEATEC
ENERGY
" Heatec designs, manufactures
and services heating and
storage equipment."
INFRASTRUCTURE
37 | ASTEC INDUSTRIES, INC. | 2016 ANNUAL REPORT

21
3
5
4
6
7
ASTEC INDUSTRIES, INC. | 2016 ANNUAL REPORT | 38

CEI Enterprises designs, produces and services mixing equipment
for both concrete and modified asphalt materials. Products include
concrete production facilities, asphalt-rubber blending systems,
hot oil heaters, and storage tanks for liquid asphalt and fuel, as
well as liquid additive systems.
Concrete production equipment includes the Fusion™ hybrid-
process ready mix plant. The Fusion plant combines precision
aggregate management with traditional cement metering.
This hybrid process yields superior-quality concrete, while using
proportionately less cement than common methods. The reduced
cement consumption contributes to higher profitability for
producers, while still letting them offer better concrete mix to
their local markets.
Fusion plants can be paired with another CEI product, the
TSB Mobile Batch Mixer™. This portable twin-shaft mixer allows
ready-mix plant operators to expand their product offerings
to include Roller Compacted Concrete (RCC), Cement Treated
Base (CTB) and conventional concrete.
CEI continues to develop the Fusion product line with portable
and wet and dry models.
CEI is an industry leader in asphalt-rubber blending systems.
These systems mix ground rubber from recycled tires with liquid
asphalt to create better, longer-lasting roads.
INDUSTRIES SERVED:
PRODUCTS AND SERVICES:n Asphalt-Rubber Blending Systems
n Hot Oil Heaters
n Asphalt Storage Tanks
n Heavy Fuel Preheaters
n Emission Control Equipment
n Liquid Additive Systems
n Asphalt Storage Tanks
n Concrete Plants
REPORTING GROUP: ENERGY
LOCATION: ALBUQUERQUE, NEW MEXICO, USA
CEI ENTERPRISES
INFRASTRUCTURE
ENERGY
" CEI Enterprises of Albuquerque,
New Mexico, designs, produces
and services mixing equipment
for both concrete and modified
asphalt materials."
IMAGES, TOP TO BOTTOM: 1. CEI Portable, Self-erecting Cement Silo 2. CEI Asphalt-Rubber Blending System3. CEI Jacketed Firebox Hot Oil Heater4. Fusion Plant paired with TSB Mobile Batch Mixer™5. CEI Asphalt Storage Tanks and Additive System 6. Portable Aggregate Blending System for Fusion Product Line 7. CEI Fusion™ Hybrid-Process Ready Mix Plant8. CEI Fusion™ Hybrid-Process Ready Mix Plant
39 | ASTEC INDUSTRIES, INC. | 2016 ANNUAL REPORT

1
2
3
65
7 8
4
ASTEC INDUSTRIES, INC. | 2016 ANNUAL REPORT | 40
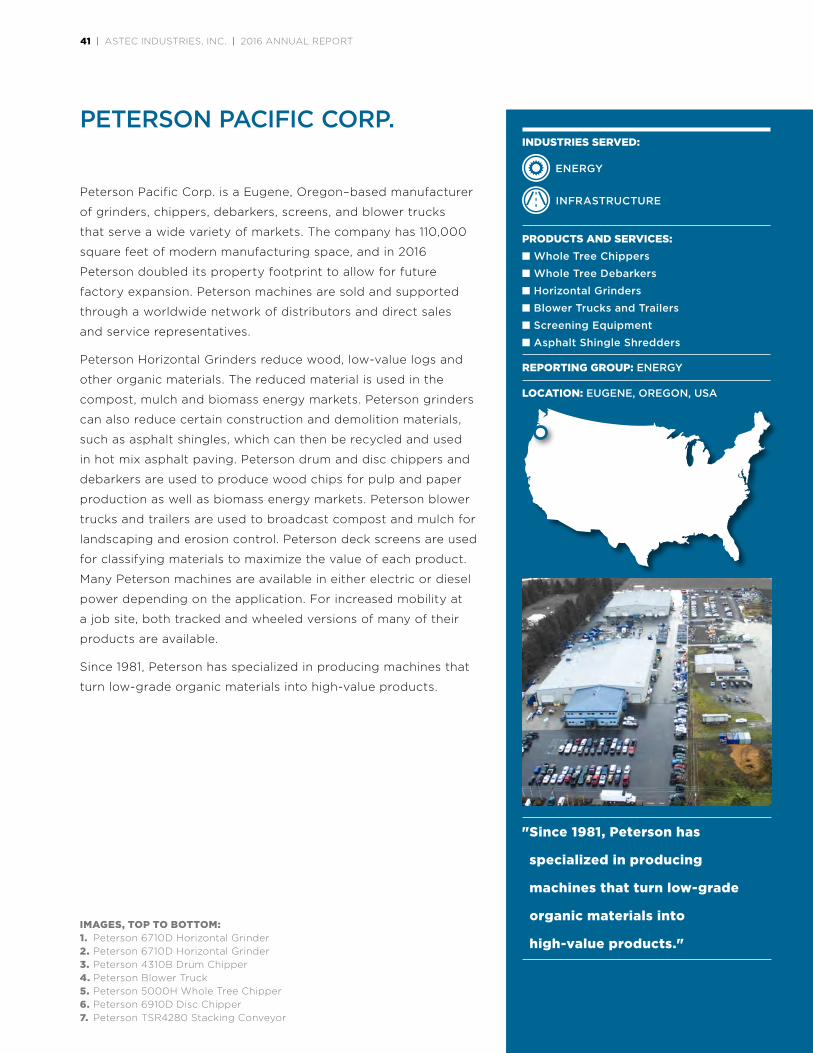
Peterson Pacific Corp. is a Eugene, Oregon–based manufacturer
of grinders, chippers, debarkers, screens, and blower trucks
that serve a wide variety of markets. The company has 110,000
square feet of modern manufacturing space, and in 2016
Peterson doubled its property footprint to allow for future
factory expansion. Peterson machines are sold and supported
through a worldwide network of distributors and direct sales
and service representatives.
Peterson Horizontal Grinders reduce wood, low-value logs and
other organic materials. The reduced material is used in the
compost, mulch and biomass energy markets. Peterson grinders
can also reduce certain construction and demolition materials,
such as asphalt shingles, which can then be recycled and used
in hot mix asphalt paving. Peterson drum and disc chippers and
debarkers are used to produce wood chips for pulp and paper
production as well as biomass energy markets. Peterson blower
trucks and trailers are used to broadcast compost and mulch for
landscaping and erosion control. Peterson deck screens are used
for classifying materials to maximize the value of each product.
Many Peterson machines are available in either electric or diesel
power depending on the application. For increased mobility at
a job site, both tracked and wheeled versions of many of their
products are available.
Since 1981, Peterson has specialized in producing machines that
turn low-grade organic materials into high-value products.
INDUSTRIES SERVED:
PRODUCTS AND SERVICES:n Whole Tree Chippers
n Whole Tree Debarkers
n Horizontal Grinders
n Blower Trucks and Trailers
n Screening Equipment
n Asphalt Shingle Shredders
REPORTING GROUP: ENERGY
LOCATION: EUGENE, OREGON, USA
PETERSON PACIFIC CORP.
INFRASTRUCTURE
ENERGY
" Since 1981, Peterson has
specialized in producing
machines that turn low-grade
organic materials into
high-value products."IMAGES, TOP TO BOTTOM: 1. Peterson 6710D Horizontal Grinder 2. Peterson 6710D Horizontal Grinder3. Peterson 4310B Drum Chipper4. Peterson Blower Truck5. Peterson 5000H Whole Tree Chipper6. Peterson 6910D Disc Chipper 7. Peterson TSR4280 Stacking Conveyor
41 | ASTEC INDUSTRIES, INC. | 2016 ANNUAL REPORT

1
2 3
54
6 7
ASTEC INDUSTRIES, INC. | 2016 ANNUAL REPORT | 42
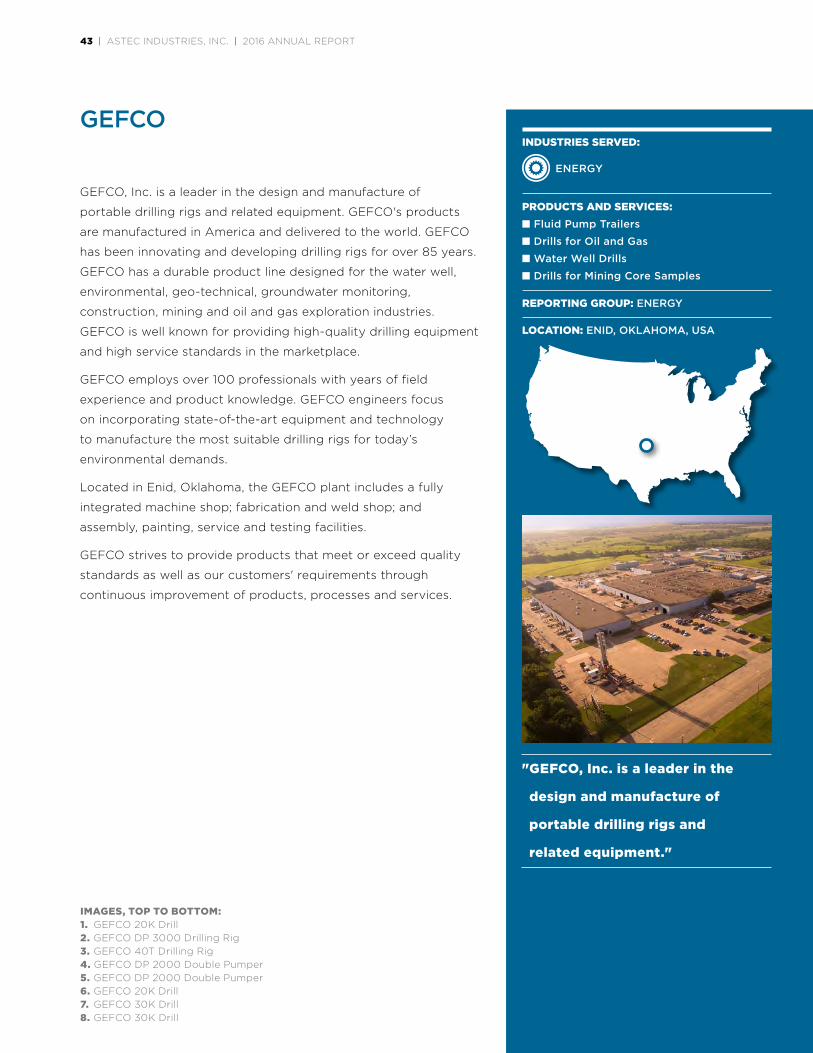
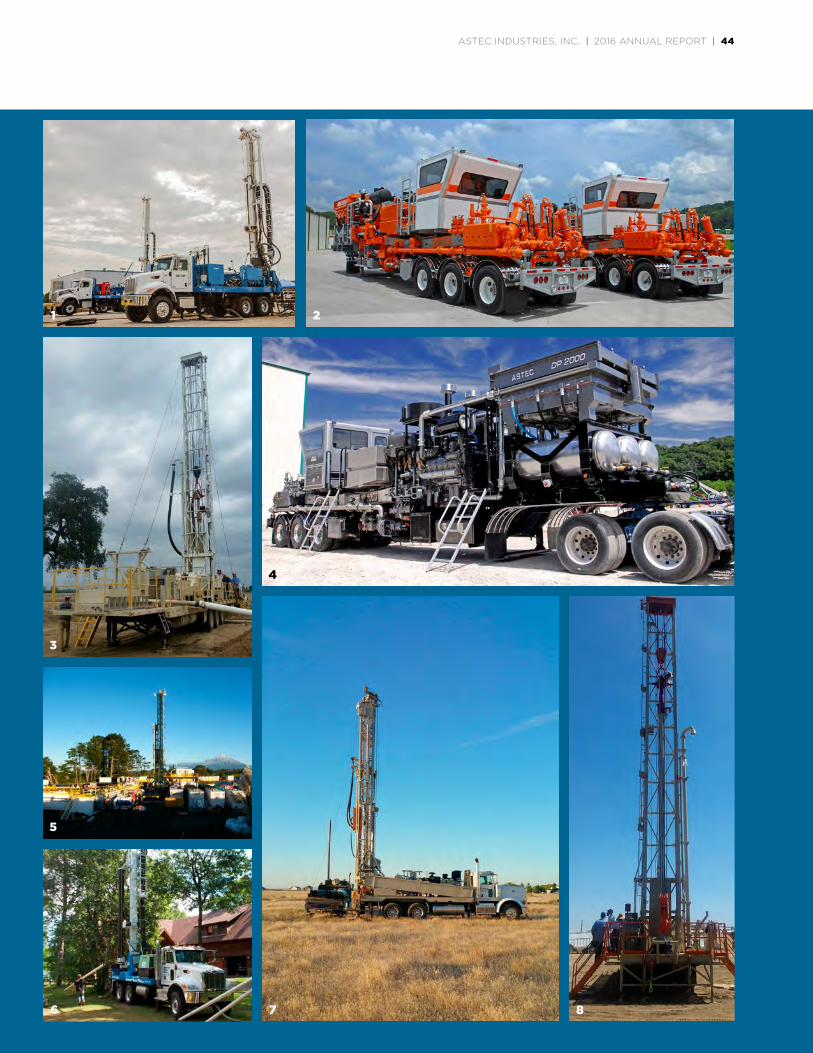
GEFCO, Inc. is a leader in the design and manufacture of
portable drilling rigs and related equipment. GEFCO's products
are manufactured in America and delivered to the world. GEFCO
has been innovating and developing drilling rigs for over 85 years.
GEFCO has a durable product line designed for the water well,
environmental, geo-technical, groundwater monitoring,
construction, mining and oil and gas exploration industries.
GEFCO is well known for providing high-quality drilling equipment
and high service standards in the marketplace.
GEFCO employs over 100 professionals with years of field
experience and product knowledge. GEFCO engineers focus
on incorporating state-of-the-art equipment and technology
to manufacture the most suitable drilling rigs for today’s
environmental demands.
Located in Enid, Oklahoma, the GEFCO plant includes a fully
integrated machine shop; fabrication and weld shop; and
assembly, painting, service and testing facilities.
GEFCO strives to provide products that meet or exceed quality
standards as well as our customers' requirements through
continuous improvement of products, processes and services.
INDUSTRIES SERVED:
PRODUCTS AND SERVICES:n Fluid Pump Trailers
n Drills for Oil and Gas
n Water Well Drills
n Drills for Mining Core Samples
REPORTING GROUP: ENERGY
LOCATION: ENID, OKLAHOMA, USA
GEFCO
ENERGY
" GEFCO, Inc. is a leader in the
design and manufacture of
portable drilling rigs and
related equipment."
IMAGES, TOP TO BOTTOM: 1. GEFCO 20K Drill 2. GEFCO DP 3000 Drilling Rig3. GEFCO 40T Drilling Rig4. GEFCO DP 2000 Double Pumper5. GEFCO DP 2000 Double Pumper6. GEFCO 20K Drill7. GEFCO 30K Drill8. GEFCO 30K Drill
43 | ASTEC INDUSTRIES, INC. | 2016 ANNUAL REPORT
1 2
4
3
5
6 7 8
ASTEC INDUSTRIES, INC. | 2016 ANNUAL REPORT | 44

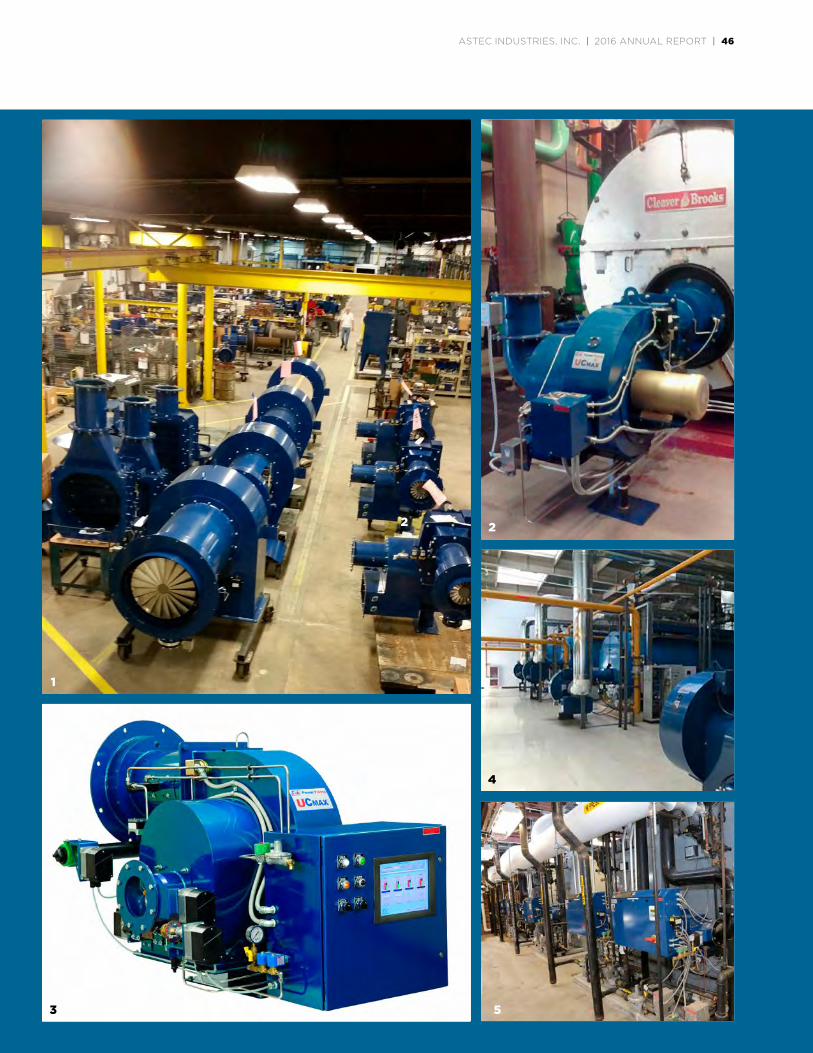
Power Flame products are sold to a wide range of customers
in the commercial and industrial burner markets to produce
steam or hot water for heating buildings, schools and hospitals,
and for food processing, aerospace, petrochemical and
infrastructure applications.
Power Flame products consist of “Design and Build” burners
capable of converting liquid or gaseous fuels into usable energy.
Their product lines cover input capacities from 400,000 to
120,000,000 BTU/HR. Their combustion systems are offered
through manufacturer representatives for retrofit to replace
existing combustion equipment with new, state-of-the-art
systems or directly to OEM (Original Equipment Manufacturers)
customers for new packaged energy generating systems.
Power Flame was the first to introduce packaged commercial/
industrial low-NOx combustion systems in the United States.
Advanced designs in that technology place Power Flame at
the leading edge of low- and ultra-low NOx applications.
Power Flame currently leverages these technologies in China
in cooperation with the Beijing Environmental Protection Board
(EPB) and the U.S. Trade and Development Agency (USTDA)
to set new emission and efficiency standards for cleaner air in
and around Beijing.
In addition to state-of-the-art combustion systems, Power Flame
offers a wide range of operating control systems, which can vary
from simple relay-based logic to microprocessor-based controls
to sophisticated PLC applications.
INDUSTRIES SERVED:
PRODUCTS AND SERVICES:n Forced Draft Burners
n Direct Fired Applications
n Indirect Fired Applications
n Control Systems
n Pump Sets
n Custom Engineered System
n UL Certified Laboratory
REPORTING GROUP: ENERGY
LOCATION: PARSONS, KANSAS, USA
" Power Flame manufactures
products for the commercial and
industrial burner markets for
heating buildings, schools and
hospitals, and for food processing,
aerospace, petrochemical and
infrastructure applications."
POWER FLAME
INFRASTRUCTURE
ENERGY
IMAGES, TOP TO BOTTOM: 1. RF and low-NOx burners in “B” cell ready for shipment to Beijing, China 2. UCMAX ultra-low emission burner on a steam boiler at Saddleback Hospital
in Southern California3. High-capacity Ultra CMAX burner with integral PLC-based controls4. Low-emission CMAX burners on four steam boilers at a rice winery
outside Beijing5. Type C burners on heating boilers at Ellis Island National Park, New York
45 | ASTEC INDUSTRIES, INC. | 2016 ANNUAL REPORT
1
2 2
3 5
4
ASTEC INDUSTRIES, INC. | 2016 ANNUAL REPORT | 46

BOARD OF DIRECTORS
ASTEC INDUSTRIES' CORPORATE EXECUTIVE OFFICERS
Glen E. TellockPresident and CEO of Lakeside FoodsMember—Audit CommitteeMember—Nominating and Corporate Governance Committee
Benjamin G. BrockPresident and Chief Executive Officer of Astec Industries, Inc.Chairman—Executive Committee
William D. GehlChairman of the Board of IBD Southeastern WisconsinChairman of the Board of FreightCar AmericaMember—Compensation CommitteeMember—Audit Committee
James B. BakerManaging Partner of River Associates Investments, LLCChairman—Audit CommitteeMember—Compensation Committee
W. Norman SmithVice Chairman of Astec Industries, Inc.Vice Chairman of the BoardMember—Executive Committee
William G. DoreyFormer Chief Executive Officer and President of Granite Construction, Inc.Chairman—Compensation Committee Member—Audit CommitteeMember—Nominating and Corporate Governance Committee
William B. SansomChairman of the Board and Chief Executive Officer of The H.T. Hackney CompanyMember—Audit CommitteeMember—Nominating and Corporate Governance CommitteeLead Independent Director
Daniel K. FriersonChairman of the Board and Chief Executive Officer of the Dixie Group, Inc.Chairman—Nominating and Corporate Governance CommitteeMember—Audit CommitteeMember—Executive Committee
Charles F. Potts Chairman of the Board of Heritage Construction and MaterialsMember—Audit Committee Member—Compensation Committee
Benjamin G. Brock President and Chief Executive Officer
Jaco van der Merwe Group President Energy
Richard J. Dorris Executive Vice President and Chief Operating Officer
Jeffrey J. Elliott Group Vice President Aggregate and Mining
W. Norman Smith Vice Chairman
David C. Silvious Vice President, Chief Financial Officer and Treasurer
Steve Claude Group President Infrastructure
Stephen C. Anderson Vice President of Administration, Corporate Secretary and Director of Investor Relations
Richard A. Patek Group President Aggregate and Mining
Robin A. Leffew Corporate Controller
PICTURED, FROM LEFT TO RIGHT:
PICTURED, LEFT TO RIGHT, TOP TO BOTTOM:
47 | ASTEC INDUSTRIES, INC. | 2016 ANNUAL REPORT

FINANCIAL INFORMATION
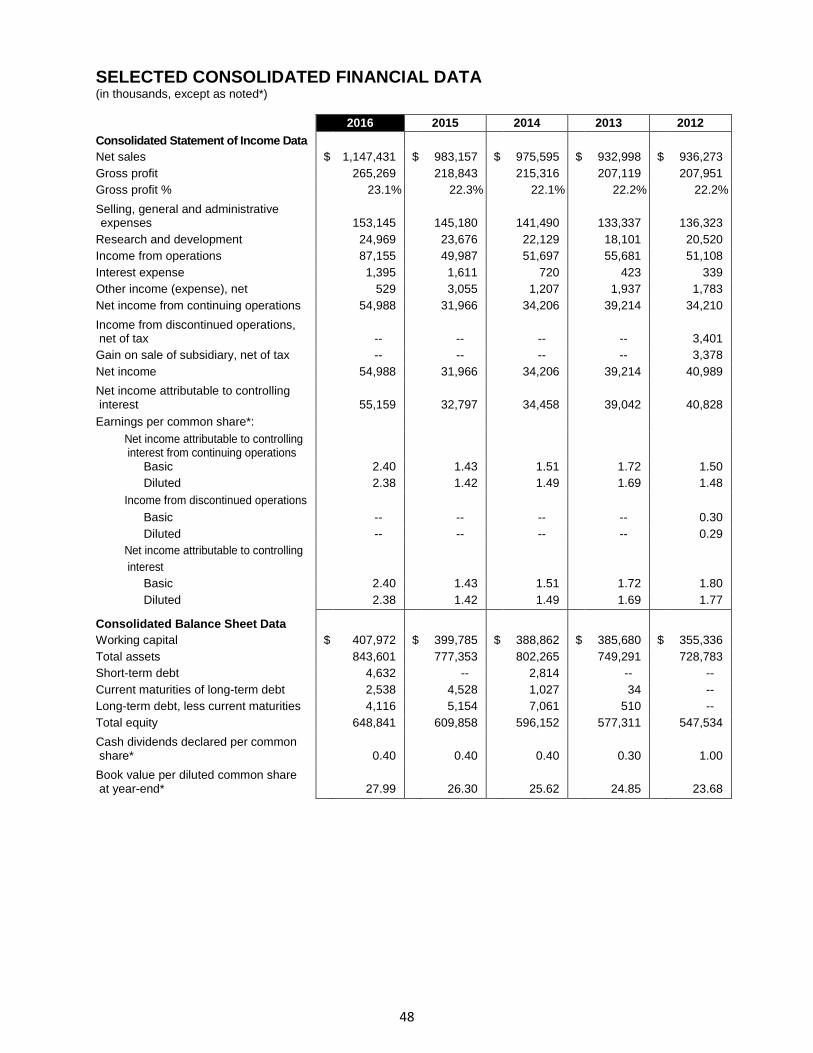
SELECTED CONSOLIDATED FINANCIAL DATA (in thousands, except as noted*)
48
2016 2015 2014 2013 2012 Consolidated Statement of Income Data Net sales $ 1,147,431 $ 983,157 $ 975,595 $ 932,998 $ 936,273 Gross profit 265,269 218,843 215,316 207,119 207,951 Gross profit % 23.1% 22.3% 22.1% 22.2% 22.2% Selling, general and administrative expenses
153,145
145,180
141,490
133,337
136,323 Research and development 24,969 23,676 22,129 18,101 20,520 Income from operations 87,155 49,987 51,697 55,681 51,108 Interest expense 1,395 1,611 720 423 339 Other income (expense), net 529 3,055 1,207 1,937 1,783 Net income from continuing operations 54,988 31,966 34,206 39,214 34,210 Income from discontinued operations, net of tax
--
--
--
--
3,401 Gain on sale of subsidiary, net of tax -- -- -- -- 3,378 Net income 54,988 31,966 34,206 39,214 40,989 Net income attributable to controlling interest
55,159
32,797
34,458
39,042
40,828 Earnings per common share*:
Net income attributable to controlling interest from continuing operations
Basic 2.40 1.43 1.51 1.72 1.50 Diluted 2.38 1.42 1.49 1.69 1.48
Income from discontinued operations Basic -- -- -- -- 0.30 Diluted -- -- -- -- 0.29
Net income attributable to controlling interest
Basic 2.40 1.43 1.51 1.72 1.80 Diluted 2.38 1.42 1.49 1.69 1.77
Consolidated Balance Sheet Data Working capital $ 407,972 $ 399,785 $ 388,862 $ 385,680 $ 355,336 Total assets 843,601 777,353 802,265 749,291 728,783 Short-term debt 4,632 -- 2,814 -- -- Current maturities of long-term debt 2,538 4,528 1,027 34 -- Long-term debt, less current maturities 4,116 5,154 7,061 510 -- Total equity 648,841 609,858 596,152 577,311 547,534 Cash dividends declared per common share*
0.40
0.40
0.40
0.30
1.00
Book value per diluted common share at year-end*
27.99
26.30
25.62
24.85
23.68

SUPPLEMENTARY FINANCIAL DATA (in thousands, except as noted*)
49
Quarterly Financial Highlights (Unaudited)
First Quarter
Second Quarter
Third Quarter
Fourth Quarter
2016 Net sales $ 278,721 $ 294,394 $ 247,752 $ 326,564 Gross profit 71,956 73,452 55,389 64,472
Net income 17,678 18,141 6,835 12,334 Net income attributable to controlling interest 17,743 18,192 6,838 12,386 Earnings per common share*
Net income attributable to controlling interest:
Basic 0.77 0.79 0.30 0.54 Diluted 0.77 0.79 0.30 0.53
2015 Net sales $ 288,748 $ 268,042 $ 211,350 $ 215,017 Gross profit 66,045 62,233 45,138 45,427
Net income 14,917 11,658 1,958 3,433 Net income attributable to controlling interest 15,105 11,805 2,292 3,595 Earnings per common share*
Net income attributable to controlling interest:
Basic 0.66 0.51 0.10 0.16 Diluted 0.65 0.51 0.10 0.16
Common Stock Price* 2016 High $ 47.97 $ 57.51 $ 62.75 $ 71.88 2016 Low 33.08 44.21 51.73 52.08 2015 High $ 43.85 $ 45.48 $ 43.78 $ 41.99 2015 Low 33.90 40.64 33.02 30.76
The Company’s common stock is traded in the Nasdaq National Market under the symbol ASTE. Prices shown are the high and low sales prices as announced by the Nasdaq National Market. The Company paid quarterly dividends of $0.10 per common share to shareholders in each quarter of 2015 and 2016. As determined by the proxy search on the record date for the Company’s 2016 annual shareholders’ meeting, the number of holders of record is approximately 220.
MANAGEMENT’S DISCUSSION AND ANALYSIS OF FINANCIAL CONDITION AND RESULTS OF OPERATIONS (Dollar and share amounts in thousands, except per share amounts, unless otherwise specified)
50
The following discussion contains forward-looking statements that involve inherent risks and uncertainties. Actual results may differ materially from those contained in these forward-looking statements. For additional information regarding forward-looking statements, see “Forward-looking Statements” on page 63.
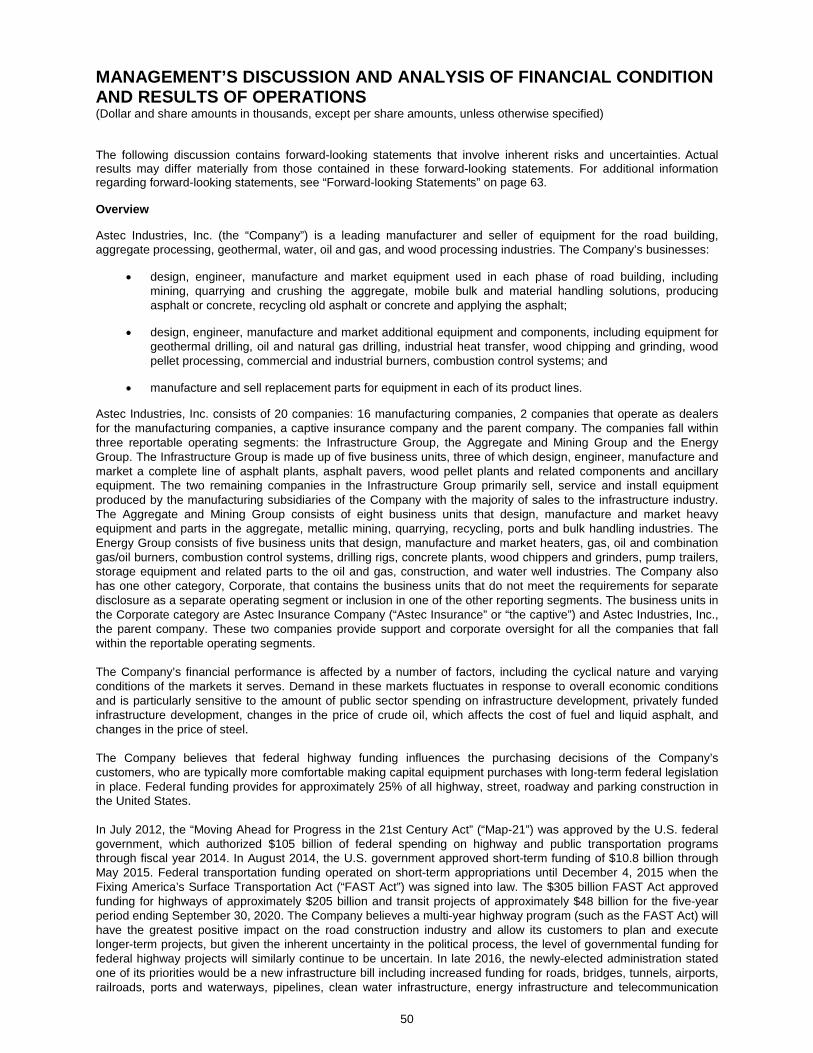
Overview Astec Industries, Inc. (the “Company”) is a leading manufacturer and seller of equipment for the road building, aggregate processing, geothermal, water, oil and gas, and wood processing industries. The Company’s businesses:
• design, engineer, manufacture and market equipment used in each phase of road building, including mining, quarrying and crushing the aggregate, mobile bulk and material handling solutions, producing asphalt or concrete, recycling old asphalt or concrete and applying the asphalt;
• design, engineer, manufacture and market additional equipment and components, including equipment for
geothermal drilling, oil and natural gas drilling, industrial heat transfer, wood chipping and grinding, wood pellet processing, commercial and industrial burners, combustion control systems; and
• manufacture and sell replacement parts for equipment in each of its product lines.
Astec Industries, Inc. consists of 20 companies: 16 manufacturing companies, 2 companies that operate as dealers for the manufacturing companies, a captive insurance company and the parent company. The companies fall within three reportable operating segments: the Infrastructure Group, the Aggregate and Mining Group and the Energy Group. The Infrastructure Group is made up of five business units, three of which design, engineer, manufacture and market a complete line of asphalt plants, asphalt pavers, wood pellet plants and related components and ancillary equipment. The two remaining companies in the Infrastructure Group primarily sell, service and install equipment produced by the manufacturing subsidiaries of the Company with the majority of sales to the infrastructure industry. The Aggregate and Mining Group consists of eight business units that design, manufacture and market heavy equipment and parts in the aggregate, metallic mining, quarrying, recycling, ports and bulk handling industries. The Energy Group consists of five business units that design, manufacture and market heaters, gas, oil and combination gas/oil burners, combustion control systems, drilling rigs, concrete plants, wood chippers and grinders, pump trailers, storage equipment and related parts to the oil and gas, construction, and water well industries. The Company also has one other category, Corporate, that contains the business units that do not meet the requirements for separate disclosure as a separate operating segment or inclusion in one of the other reporting segments. The business units in the Corporate category are Astec Insurance Company (“Astec Insurance” or “the captive”) and Astec Industries, Inc., the parent company. These two companies provide support and corporate oversight for all the companies that fall within the reportable operating segments. The Company’s financial performance is affected by a number of factors, including the cyclical nature and varying conditions of the markets it serves. Demand in these markets fluctuates in response to overall economic conditions and is particularly sensitive to the amount of public sector spending on infrastructure development, privately funded infrastructure development, changes in the price of crude oil, which affects the cost of fuel and liquid asphalt, and changes in the price of steel. The Company believes that federal highway funding influences the purchasing decisions of the Company’s customers, who are typically more comfortable making capital equipment purchases with long-term federal legislation in place. Federal funding provides for approximately 25% of all highway, street, roadway and parking construction in the United States. In July 2012, the “Moving Ahead for Progress in the 21st Century Act” (“Map-21”) was approved by the U.S. federal government, which authorized $105 billion of federal spending on highway and public transportation programs through fiscal year 2014. In August 2014, the U.S. government approved short-term funding of $10.8 billion through May 2015. Federal transportation funding operated on short-term appropriations until December 4, 2015 when the Fixing America’s Surface Transportation Act (“FAST Act”) was signed into law. The $305 billion FAST Act approved funding for highways of approximately $205 billion and transit projects of approximately $48 billion for the five-year period ending September 30, 2020. The Company believes a multi-year highway program (such as the FAST Act) will have the greatest positive impact on the road construction industry and allow its customers to plan and execute longer-term projects, but given the inherent uncertainty in the political process, the level of governmental funding for federal highway projects will similarly continue to be uncertain. In late 2016, the newly-elected administration stated one of its priorities would be a new infrastructure bill including increased funding for roads, bridges, tunnels, airports, railroads, ports and waterways, pipelines, clean water infrastructure, energy infrastructure and telecommunication
MANAGEMENT’S DISCUSSION AND ANALYSIS (CONTINUED)
51
needs. The funding for the bill as proposed would rely in part on direct federal spending as well as increased private sector funding in exchange for federal tax credits. Governmental funding that is committed or earmarked for federal highway projects is always subject to repeal or reduction. Although continued funding under the FAST Act or funding of a bill passed by the new administration is expected, it may be at lower levels than originally approved or anticipated. In addition, Congress could pass legislation in future sessions that would allow for the diversion of previously appropriated highway funds for other purposes, or it could restrict funding of infrastructure projects unless states comply with certain federal policies. The level of future federal highway construction is uncertain and any future funding may be at levels lower than those currently approved or that have been approved in the past. The public sector spending described above is needed to fund road, bridge and mass transit improvements. The Company believes that increased funding is unquestionably needed to restore the nation’s highways to a quality level required for safety, fuel efficiency and mitigation of congestion. In the Company’s opinion, amounts needed for such improvements are significantly greater than amounts approved to date, and funding mechanisms such as the federal usage fee per gallon of gasoline, which is still at the 1993 level of 18.4 cents per gallon, would likely need to be increased along with other measures to generate the funds needed.
In addition to public sector funding, the economies in the markets the Company serves, the price of oil and its impact on customers’ purchasing decisions and the price of steel may each affect the Company’s financial performance. Economic downturns generally result in decreased purchasing by the Company’s customers, which, in turn, causes reductions in sales and increased pricing pressure on the Company’s products. Rising interest rates also typically negatively impact customers’ attitudes toward purchasing equipment. The Federal Reserve has maintained historically low interest rates in response to the economic downturn which began in 2009; however, the Federal Reserve raised the Federal Funds Rate in late 2015 and again in 2016, and may implement additional increases in 2017. Significant portions of the Company’s revenues from the Infrastructure Group relate to the sale of equipment involved in the production, handling, recycling or installation of asphalt mix. Liquid asphalt is a by-product of oil production. An increase or decrease in the price of oil impacts the cost of asphalt, which is likely to alter demand for asphalt and therefore affect demand for certain Company products. While increasing oil prices may have a negative financial impact on many of the Company’s customers, the Company’s equipment can use a significant amount of recycled asphalt pavement, thereby partially mitigating the effect of increased oil prices on the final cost of asphalt for the customer. The Company continues to develop products and initiatives to reduce the amount of oil and related products required to produce asphalt mix. Oil price volatility makes it difficult to predict the costs of oil-based products used in road construction such as liquid asphalt and gasoline. Oil prices in 2016 were relatively stable throughout the first half of the year and began to rise near year end. Minor fluctuations in oil prices should not have a significant impact on customers’ buying decisions. Other factors such as political uncertainty in oil producing countries, interruptions in oil production due to disasters, whether natural or man-made, or other economic factors could significantly impact oil prices which could negatively impact demand for the Company’s products. However, the Company believes the continued funding of the FAST Act federal highway bill passed in December 2015 has a greater potential to impact the buying decisions of the Company’s customers than does the fluctuation of oil prices in 2017. Contrary to the impact of oil prices on many of the Company’s Infrastructure Group products as discussed above, the products manufactured by the Energy Group, which are used in drilling for oil and natural gas, in heaters for refineries and oil sands, and in double fluid pump trailers for fracking and oil and gas extraction, would benefit from higher oil and natural gas prices, to the extent that such higher prices lead to increased development in the oil and natural gas production industries. The Company believes further development of domestic oil and natural gas production capabilities is needed and would positively impact the domestic economy and the Company’s business.
Steel is a major component in the Company’s equipment. Steel prices rose significantly during the first half of 2016 but then began to decline due to slowing steel consumption and retreating energy prices in the third quarter of 2016. Steel prices began to moderately rise again in late 2016 due to improvements in energy costs and anticipated GDP growth. The Company expects this trend to continue through the first half of 2017. The Company continues to utilize forward-looking contracts (with no minimum or specified quantity guarantees) coupled with advanced steel purchases to minimize the impact of any price increases. The Company will review the trends in steel prices entering into the second half of 2017 and establish future contract pricing accordingly. In addition to the factors stated above, many of the Company’s markets are highly competitive, and its products compete worldwide with a number of other manufacturers and dealers that produce and sell similar products. From 2010 through mid-2012, a weak U.S. dollar, combined with improving economic conditions in certain foreign
MANAGEMENT’S DISCUSSION AND ANALYSIS (CONTINUED)
52
economies, had a positive impact on the Company’s international sales. The continued strengthening of the U.S. dollar from mid-2012 through 2016 has negatively impacted pricing in certain foreign markets the Company serves. The Company expects the U.S. dollar to remain strong in the near term relative to most foreign currencies. Increasing domestic interest rates or weakening economic conditions abroad could cause the U.S. dollar to continue to strengthen, which could negatively impact the Company’s international sales. In the United States and internationally, the Company’s equipment is marketed directly to customers as well as through dealers. During 2016, approximately 75% to 80% of equipment sold by the Company was sold directly to the end user. The Company expects this ratio to remain relatively consistent through 2017. The Company is operated on a decentralized basis with a complete management team for each operating subsidiary. Finance, insurance, legal, shareholder relations, corporate accounting and other corporate matters are primarily handled at the corporate level (i.e., Astec Industries, Inc., the parent company). The engineering, design, sales, manufacturing and basic accounting functions are handled at each individual subsidiary. Standard accounting procedures are prescribed and followed in all reporting.
During 2016, the Company implemented revised profit sharing plans whereby corporate officers, subsidiary presidents and other employees at each subsidiary have the opportunity to earn profit sharing incentives based upon the Company’s and/or the individual groups or subsidiaries’ return on capital employed, EBITDA margin and safety. Corporate officers’ and subsidiary Presidents’ awards calculated at targeted performance are between 35% and 100% of their base salary, depending upon their responsibilities and the plans allow for awards of up to 200% of the target. Each subsidiary has the opportunity to earn up to 10% of its after-tax profit as a profit sharing incentive award to be paid to its employees. The Company also implemented revised long-term incentive plans during 2016 whereby corporate officers, subsidiary presidents and other corporate or subsidiary management employees will be awarded Restricted Stock Units (“RSUs”) if certain goals based upon the Company’s Total Shareholder’s Return (“TSR”) as compared to a peer group and pretax profit margin are met. The grant date value of Corporate officers and subsidiary Presidents’ awards calculated at targeted performance are between 20% and 100% of their base salary, depending upon their responsibilities and the plans allow for awards of up to 200% of the target. Additional RSUs will be granted to other key subsidiary management employees based upon individual subsidiary pretax profit margins and Company TSR as compared to a peer group. Results of Operations: 2016 vs. 2015
Net Sales Net sales increased $164,274 or 16.7% to $1,147,431 in 2016 from $983,157 in 2015. Sales are generated primarily from new equipment purchases made by customers for use in construction of privately funded infrastructure, public sector spending on infrastructure and sales of equipment for the aggregate, mining, wood pellet, quarrying and recycling markets, and for oil and gas and geothermal industries. Domestic sales for 2016 were $941,273 or 82.0% of net sales compared to $722,287 or 73.5% of net sales for 2015, an increase of $218,985 or 30.3%. The overall increase in domestic sales for 2016 compared to 2015 reflects the strengthening economic conditions for the Company’s products in the domestic market and a $135,187 increase in pellet plant sales between years. International sales for 2016 were $206,158 or 18.0% of net sales compared to $260,870 or 26.5% of net sales for 2015, a decrease of $54,711 or 21.0%. The Company continued to experience a challenging market for its products internationally in 2016 compared to 2015 caused by competitive pressures due to the strengthening of the U.S. dollar as we compete with local manufacturers that do not price their products based on the U.S. dollar and the continued sluggishness in the global mining industry. Sales reported by the Company for 2016 would have been $10,148 higher had 2016 foreign exchange rates been the same as 2015 rates. The Company continues its efforts to grow its international business by increasing its presence in the markets it serves. Parts sales as a percentage of net sales decreased 400 basis points to 23.0% in 2016 from 27.0% in 2015. In U.S. dollars, parts sales decreased 0.6% to $263,457 in 2016 from $265,092 in 2015. Gross Profit Gross profit as a percentage of sales increased to 23.1% in 2016 as compared to 22.3% in 2015. In U.S. dollars, gross profit increased 21.2% to $265,269 in 2016 from $218,843 in 2015. Gross margins increased in 2016 due to a release of pent-up demand from the lack of a long-term federal highway bill, which led to increased margins in the Infrastructure Group as well as margins recorded for pellet plant sales by the Company.
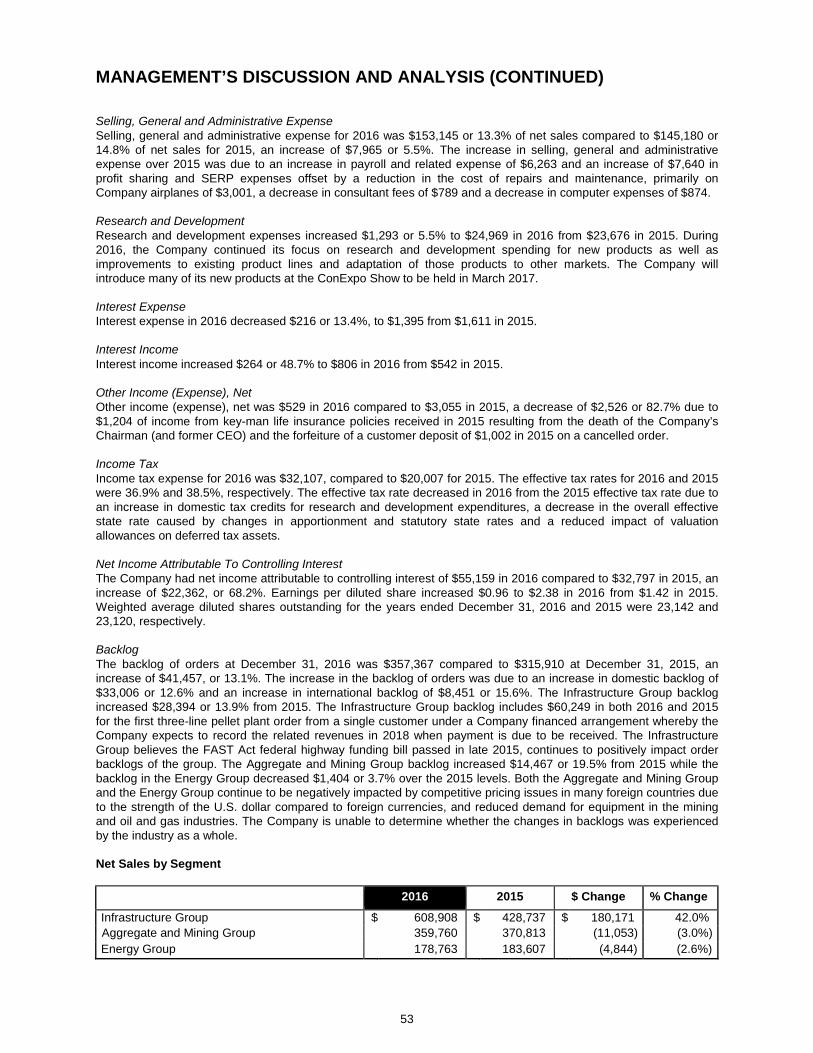
MANAGEMENT’S DISCUSSION AND ANALYSIS (CONTINUED)
53
Selling, General and Administrative Expense Selling, general and administrative expense for 2016 was $153,145 or 13.3% of net sales compared to $145,180 or 14.8% of net sales for 2015, an increase of $7,965 or 5.5%. The increase in selling, general and administrative expense over 2015 was due to an increase in payroll and related expense of $6,263 and an increase of $7,640 in profit sharing and SERP expenses offset by a reduction in the cost of repairs and maintenance, primarily on Company airplanes of $3,001, a decrease in consultant fees of $789 and a decrease in computer expenses of $874. Research and Development Research and development expenses increased $1,293 or 5.5% to $24,969 in 2016 from $23,676 in 2015. During 2016, the Company continued its focus on research and development spending for new products as well as improvements to existing product lines and adaptation of those products to other markets. The Company will introduce many of its new products at the ConExpo Show to be held in March 2017. Interest Expense Interest expense in 2016 decreased $216 or 13.4%, to $1,395 from $1,611 in 2015. Interest Income Interest income increased $264 or 48.7% to $806 in 2016 from $542 in 2015. Other Income (Expense), Net Other income (expense), net was $529 in 2016 compared to $3,055 in 2015, a decrease of $2,526 or 82.7% due to $1,204 of income from key-man life insurance policies received in 2015 resulting from the death of the Company’s Chairman (and former CEO) and the forfeiture of a customer deposit of $1,002 in 2015 on a cancelled order. Income Tax Income tax expense for 2016 was $32,107, compared to $20,007 for 2015. The effective tax rates for 2016 and 2015 were 36.9% and 38.5%, respectively. The effective tax rate decreased in 2016 from the 2015 effective tax rate due to an increase in domestic tax credits for research and development expenditures, a decrease in the overall effective state rate caused by changes in apportionment and statutory state rates and a reduced impact of valuation allowances on deferred tax assets. Net Income Attributable To Controlling Interest The Company had net income attributable to controlling interest of $55,159 in 2016 compared to $32,797 in 2015, an increase of $22,362, or 68.2%. Earnings per diluted share increased $0.96 to $2.38 in 2016 from $1.42 in 2015. Weighted average diluted shares outstanding for the years ended December 31, 2016 and 2015 were 23,142 and 23,120, respectively. Backlog The backlog of orders at December 31, 2016 was $357,367 compared to $315,910 at December 31, 2015, an increase of $41,457, or 13.1%. The increase in the backlog of orders was due to an increase in domestic backlog of $33,006 or 12.6% and an increase in international backlog of $8,451 or 15.6%. The Infrastructure Group backlog increased $28,394 or 13.9% from 2015. The Infrastructure Group backlog includes $60,249 in both 2016 and 2015 for the first three-line pellet plant order from a single customer under a Company financed arrangement whereby the Company expects to record the related revenues in 2018 when payment is due to be received. The Infrastructure Group believes the FAST Act federal highway funding bill passed in late 2015, continues to positively impact order backlogs of the group. The Aggregate and Mining Group backlog increased $14,467 or 19.5% from 2015 while the backlog in the Energy Group decreased $1,404 or 3.7% over the 2015 levels. Both the Aggregate and Mining Group and the Energy Group continue to be negatively impacted by competitive pricing issues in many foreign countries due to the strength of the U.S. dollar compared to foreign currencies, and reduced demand for equipment in the mining and oil and gas industries. The Company is unable to determine whether the changes in backlogs was experienced by the industry as a whole. Net Sales by Segment 2016 2015 $ Change % Change
Infrastructure Group $ 608,908 $ 428,737 $ 180,171 42.0% Aggregate and Mining Group 359,760 370,813 (11,053) (3.0%) Energy Group 178,763 183,607 (4,844) (2.6%)
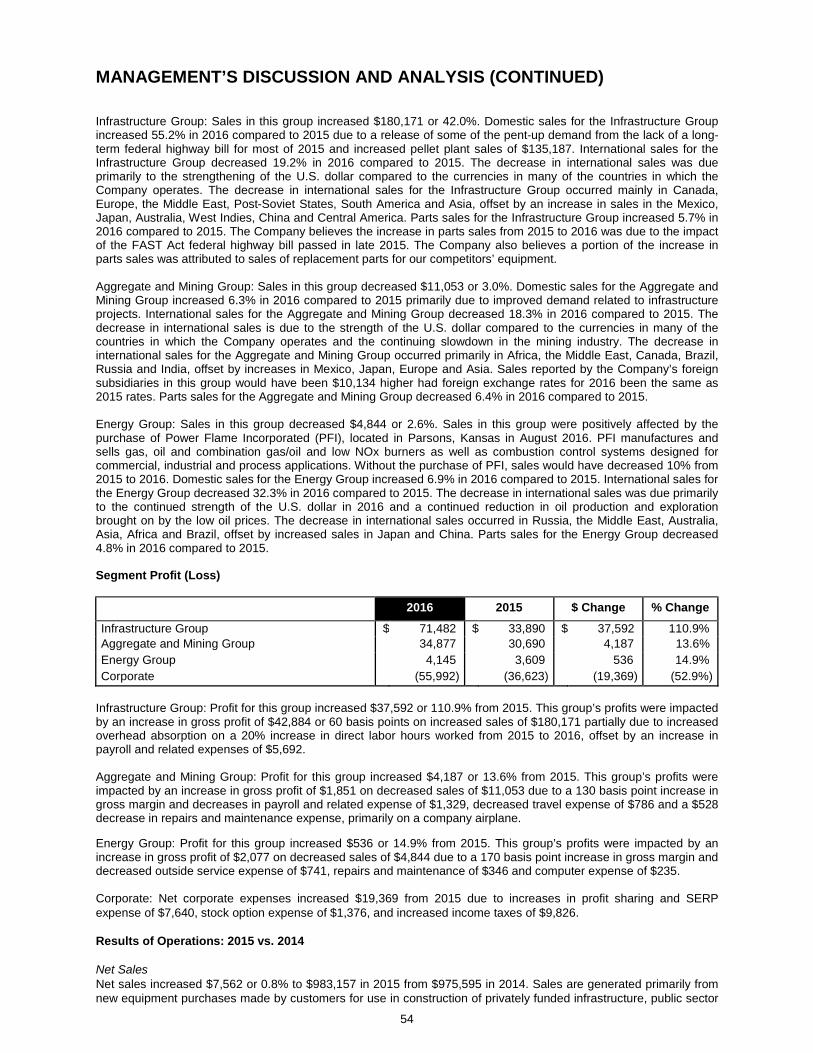
MANAGEMENT’S DISCUSSION AND ANALYSIS (CONTINUED)
54
Infrastructure Group: Sales in this group increased $180,171 or 42.0%. Domestic sales for the Infrastructure Group increased 55.2% in 2016 compared to 2015 due to a release of some of the pent-up demand from the lack of a long-term federal highway bill for most of 2015 and increased pellet plant sales of $135,187. International sales for the Infrastructure Group decreased 19.2% in 2016 compared to 2015. The decrease in international sales was due primarily to the strengthening of the U.S. dollar compared to the currencies in many of the countries in which the Company operates. The decrease in international sales for the Infrastructure Group occurred mainly in Canada, Europe, the Middle East, Post-Soviet States, South America and Asia, offset by an increase in sales in the Mexico, Japan, Australia, West Indies, China and Central America. Parts sales for the Infrastructure Group increased 5.7% in 2016 compared to 2015. The Company believes the increase in parts sales from 2015 to 2016 was due to the impact of the FAST Act federal highway bill passed in late 2015. The Company also believes a portion of the increase in parts sales was attributed to sales of replacement parts for our competitors’ equipment. Aggregate and Mining Group: Sales in this group decreased $11,053 or 3.0%. Domestic sales for the Aggregate and Mining Group increased 6.3% in 2016 compared to 2015 primarily due to improved demand related to infrastructure projects. International sales for the Aggregate and Mining Group decreased 18.3% in 2016 compared to 2015. The decrease in international sales is due to the strength of the U.S. dollar compared to the currencies in many of the countries in which the Company operates and the continuing slowdown in the mining industry. The decrease in international sales for the Aggregate and Mining Group occurred primarily in Africa, the Middle East, Canada, Brazil, Russia and India, offset by increases in Mexico, Japan, Europe and Asia. Sales reported by the Company’s foreign subsidiaries in this group would have been $10,134 higher had foreign exchange rates for 2016 been the same as 2015 rates. Parts sales for the Aggregate and Mining Group decreased 6.4% in 2016 compared to 2015. Energy Group: Sales in this group decreased $4,844 or 2.6%. Sales in this group were positively affected by the purchase of Power Flame Incorporated (PFI), located in Parsons, Kansas in August 2016. PFI manufactures and sells gas, oil and combination gas/oil and low NOx burners as well as combustion control systems designed for commercial, industrial and process applications. Without the purchase of PFI, sales would have decreased 10% from 2015 to 2016. Domestic sales for the Energy Group increased 6.9% in 2016 compared to 2015. International sales for the Energy Group decreased 32.3% in 2016 compared to 2015. The decrease in international sales was due primarily to the continued strength of the U.S. dollar in 2016 and a continued reduction in oil production and exploration brought on by the low oil prices. The decrease in international sales occurred in Russia, the Middle East, Australia, Asia, Africa and Brazil, offset by increased sales in Japan and China. Parts sales for the Energy Group decreased 4.8% in 2016 compared to 2015. Segment Profit (Loss) 2016 2015 $ Change % Change
Infrastructure Group $ 71,482 $ 33,890 $
37,592 110.9% Aggregate and Mining Group 34,877 30,690 4,187 13.6% Energy Group 4,145 3,609 536 14.9% Corporate (55,992) (36,623) (19,369) (52.9%)
Infrastructure Group: Profit for this group increased $37,592 or 110.9% from 2015. This group’s profits were impacted by an increase in gross profit of $42,884 or 60 basis points on increased sales of $180,171 partially due to increased overhead absorption on a 20% increase in direct labor hours worked from 2015 to 2016, offset by an increase in payroll and related expenses of $5,692. Aggregate and Mining Group: Profit for this group increased $4,187 or 13.6% from 2015. This group’s profits were impacted by an increase in gross profit of $1,851 on decreased sales of $11,053 due to a 130 basis point increase in gross margin and decreases in payroll and related expense of $1,329, decreased travel expense of $786 and a $528 decrease in repairs and maintenance expense, primarily on a company airplane. Energy Group: Profit for this group increased $536 or 14.9% from 2015. This group’s profits were impacted by an increase in gross profit of $2,077 on decreased sales of $4,844 due to a 170 basis point increase in gross margin and decreased outside service expense of $741, repairs and maintenance of $346 and computer expense of $235. Corporate: Net corporate expenses increased $19,369 from 2015 due to increases in profit sharing and SERP expense of $7,640, stock option expense of $1,376, and increased income taxes of $9,826. Results of Operations: 2015 vs. 2014
Net Sales Net sales increased $7,562 or 0.8% to $983,157 in 2015 from $975,595 in 2014. Sales are generated primarily from new equipment purchases made by customers for use in construction of privately funded infrastructure, public sector

MANAGEMENT’S DISCUSSION AND ANALYSIS (CONTINUED)
55
spending on infrastructure and sales of equipment for the aggregate, mining, quarrying and recycling markets and for oil and gas and geothermal industries. Domestic sales for 2015 were $722,287 or 73.5% of net sales compared to $654,231 or 67.1% of net sales for 2014, an increase of $68,056 or 10.4%. The overall increase in domestic sales for 2015 compared to 2014 reflects the strengthening economic conditions for the Company’s products in the domestic market. International sales for 2015 were $260,870 or 26.5% of net sales compared to $321,364 or 32.9% of net sales for 2014, a decrease of $60,494 or 18.8%. The Company experienced a challenging market for its products internationally in 2015 compared to 2014 caused by competitive pressures due to the strengthening of the U.S. dollar as we compete with local manufacturers that do not price their products based on the U.S. dollar, the decline in oil prices and the slowdown in the global mining industry. Sales reported by the Company would have been $17,536 higher had 2015 foreign exchange rates been the same as 2014 rates. Parts sales as a percentage of net sales increased 90 basis points to 27.0% in 2015 from 26.1% in 2014. In U.S. dollars, parts sales increased 4.1% to $265,092 in 2015 from $254,747 in 2014. Gross Profit Gross profit as a percentage of sales remained relatively flat at 22.3% in 2015 as compared to 22.1% in 2014. In U.S. dollars, gross profit increased 1.6% to $218,843 in 2015 from $215,316 in 2014. Selling, General and Administrative Expense Selling, general and administrative expense for 2015 was $145,180 or 14.8% of net sales compared to $141,490 or 14.5% of net sales for 2014, an increase of $3,690 or 2.6%. The increase in selling, general and administrative expense over 2014 was due to an increase in payroll and related expense of $2,148, an increase of $2,873 in repairs and maintenance, primarily for repairs on Company airplanes, and an increase in computer expense of $2,087, offset by a reduction in ConExpo expense of $3,162. Research and Development Research and development expenses increased $1,547 or 7.0% to $23,676 in 2015 from $22,129 in 2014. During 2015, the Company continued its focus on research and development spending for new products as well as improvements to existing product lines and adaptation of those products to other markets. Interest Expense Interest expense in 2015 increased $891 or 123.8%, to $1,611 from $720 in 2014. The increase in interest expense was primarily due to the utilization of credit facilities in Brazil to finance equipment purchases and operations of the new manufacturing facility. Interest Income Interest income decreased $880 or 61.9% to $542 in 2015 from $1,422 in 2014. The decrease was due to the Company agreeing to defer interest payments on a customer’s purchase of the first wood pellet processing plant produced by the Company until amortization of the financing begins. Interest income received from pellet plant financing was $622 in 2014. Other Income (Expense), Net Other income (expense), net was $3,055 in 2015 compared to $1,207 in 2014, an increase of $1,848 or 153.1% due to $1,204 of income from key-man life insurance policies in 2015 resulting from the death of the Company’s Chairman (and former CEO). Income Tax Income tax expense for 2015 was $20,007, compared to $19,400 for 2014. The effective tax rates for 2015 and 2014 were 38.5% and 36.2%, respectively. The effective tax rate increased in 2015 over the 2014 effective tax rate due primarily to the tax effect of weakening foreign currencies and reductions in domestic tax credits for research and development. The tax benefit of the weakening foreign currency was recognized in other comprehensive income and not in income tax expense. Net Income Attributable To Controlling Interest The Company had net income attributable to controlling interest of $32,797 in 2015 compared to $34,458 in 2014, a decrease of $1,661, or 4.8%. Earnings per diluted share decreased $0.07 to $1.42 in 2015 from $1.49 in 2014. Weighted average diluted shares outstanding for the years ended December 31, 2015 and 2014 were 23,120 and 23,105, respectively.

MANAGEMENT’S DISCUSSION AND ANALYSIS (CONTINUED)
56
Backlog The backlog of orders at December 31, 2015 was $313,291 compared to $332,051 at December 31, 2014, a decrease of $18,760, or 5.6%. The decrease in the backlog of orders was due to a decrease in international backlog of $55,595 or 50.7% offset by an increase in domestic backlog of $36,835 or 16.6%. The Infrastructure Group backlog increased $56,640 or 38.5% from 2014. The Infrastructure Group backlog includes $60,249 in 2015 and $59,275 in 2014 for a three-line pellet plant order for one customer. An additional pellet plant order for $29,273 for a second pellet plant customer is in the 2015 backlog with an estimated sale date in the first half of 2016. The Infrastructure Group experienced an increase in order activity for asphalt equipment in the latter part of 2015 which the Company believes to be due to the passage of the federal highway funding bill, the FAST Act, on December 4, 2015. The increased backlog for the Infrastructure Group was offset by a decrease in backlog for the Aggregate and Mining Group of $15,305 and a decrease in the Energy Group backlog from 2014 of $60,095. Both of these groups were negatively impacted by competitive pricing issues in many foreign countries due to the strength of the U.S. dollar compared to foreign currencies, and reduced demand for equipment in mining and oil and gas industries. The Company is unable to determine whether the decrease in backlogs was experienced by the industry as a whole. Net Sales by Segment 2015 2014 $ Change % Change
Infrastructure Group $ 428,737 $ 386,356 $ 42,381 11.0% Aggregate and Mining Group 370,813 384,883 (14,070) (3.7%) Energy Group 183,607 204,356 (20,749) (10.2%)
Infrastructure Group: Sales in this group increased $42,381 or 11.0% from 2014. Domestic sales increased 24.2% due to a release of some of the pent-up demand from the lack of a long-term federal highway bill for most of 2015. International sales decreased 25.7%. The decrease in international sales was due primarily to the strengthening of the U.S. dollar compared to the currencies in many of the countries in which the Company operates. Sales reported by the Company’s foreign subsidiaries in this group, would have been $4,872 higher had 2015 foreign exchange rates been the same as 2014 rates. The decrease in international sales occurred mainly in Russia, Australia and South America, offset by an increase in sales in the Middle East, Canada and other European countries. Parts sales increased 16.7% in 2015 compared to 2014. The Company believes the increase in parts sales from 2014 to 2015 was due in part to customers’ decisions to repair existing equipment instead of purchasing new equipment in response to the lack of a long-term federal highway bill for the majority of 2015. The Company also believes a portion of the increase in parts sales was attributed to sales of replacement parts for our competitors’ equipment. Aggregate and Mining Group: Sales in this group decreased $14,070 or 3.7% from 2014. Domestic sales increased 7.4% primarily due to improved demand related to infrastructure projects. International sales decreased 17.6%. The decrease in international sales is due to the strength of the U.S. dollar compared to the currencies in many of the countries in which the Company operates and the continuing slowdown in the mining industry. The decrease in international sales occurred primarily in Canada, China, Brazil, South America, Central America, Russia and other Asian countries. Sales reported by the Company’s foreign subsidiaries in this group would have been $12,664 higher had 2015 foreign exchange rates been the same as 2014 rates. Parts sales decreased 1.1% in 2015 compared to 2014. Energy Group: Sales in this group decreased $20,749 or 10.2% from 2014. Domestic sales decreased 10.7% primarily due to a decline in product demand resulting from the decline in oil prices. International sales decreased 8.5%. The decrease in international sales was due primarily to the strengthening of the U.S. dollar in 2015 and a severe reduction in oil production and exploration brought on by the near collapse of the price of oil. The decrease in international sales occurred in South America, Canada and Africa, offset by increased sales in Australia and Russia. Parts sales decreased 12.7% in 2015 compared to 2014. Segment Profit (Loss) 2015 2014 $ Change % Change
Infrastructure Group $ 33,890 $ 29,477 $
4,413 15.0% Aggregate and Mining Group 30,690 32,900 (2,210) (6.7%) Energy Group 3,609 10,316 (6,707) (65.0%) Corporate (36,623) (35,270) (1,353) (3.8%)
Infrastructure Group: Profit for this group increased $4,413 or 15.0%. This group’s profits were impacted by an increase in gross profit of $12,532 on a $42,381 increase in sales offset by a $2,045 increase in computer related expense and a $3,117 increase in payroll and related expenses.
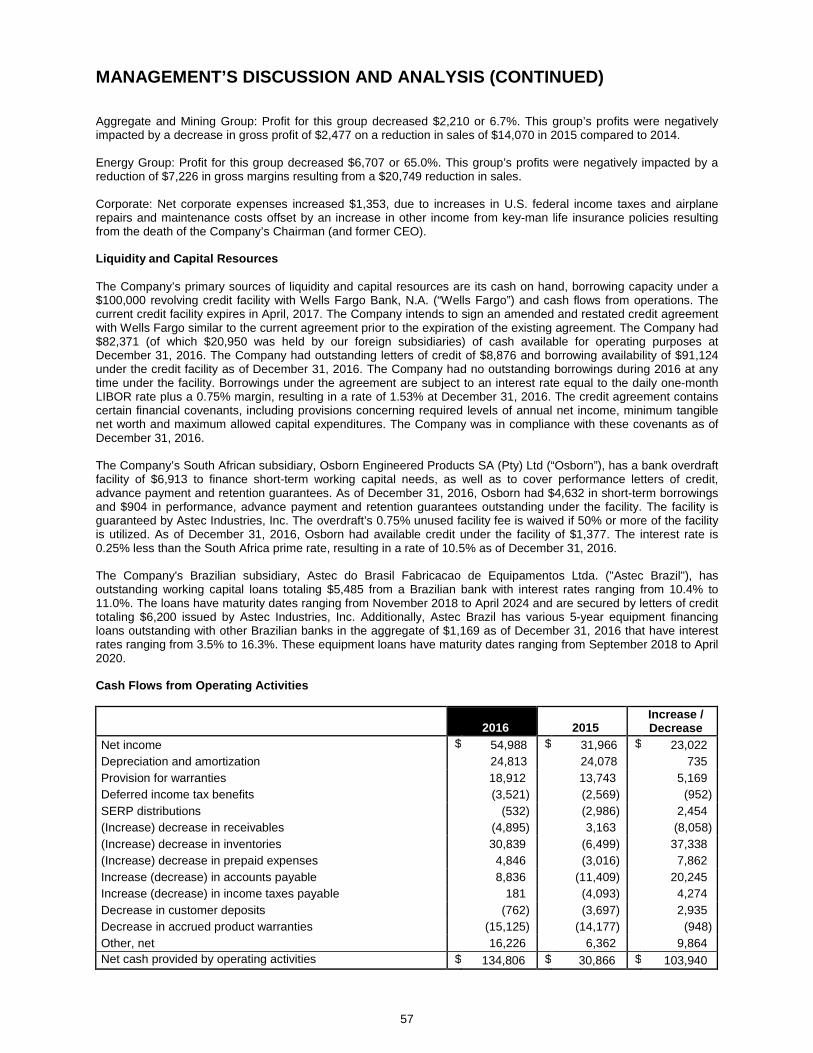
MANAGEMENT’S DISCUSSION AND ANALYSIS (CONTINUED)
57
Aggregate and Mining Group: Profit for this group decreased $2,210 or 6.7%. This group’s profits were negatively impacted by a decrease in gross profit of $2,477 on a reduction in sales of $14,070 in 2015 compared to 2014. Energy Group: Profit for this group decreased $6,707 or 65.0%. This group’s profits were negatively impacted by a reduction of $7,226 in gross margins resulting from a $20,749 reduction in sales. Corporate: Net corporate expenses increased $1,353, due to increases in U.S. federal income taxes and airplane repairs and maintenance costs offset by an increase in other income from key-man life insurance policies resulting from the death of the Company’s Chairman (and former CEO). Liquidity and Capital Resources
The Company’s primary sources of liquidity and capital resources are its cash on hand, borrowing capacity under a $100,000 revolving credit facility with Wells Fargo Bank, N.A. (“Wells Fargo”) and cash flows from operations. The current credit facility expires in April, 2017. The Company intends to sign an amended and restated credit agreement with Wells Fargo similar to the current agreement prior to the expiration of the existing agreement. The Company had $82,371 (of which $20,950 was held by our foreign subsidiaries) of cash available for operating purposes at December 31, 2016. The Company had outstanding letters of credit of $8,876 and borrowing availability of $91,124 under the credit facility as of December 31, 2016. The Company had no outstanding borrowings during 2016 at any time under the facility. Borrowings under the agreement are subject to an interest rate equal to the daily one-month LIBOR rate plus a 0.75% margin, resulting in a rate of 1.53% at December 31, 2016. The credit agreement contains certain financial covenants, including provisions concerning required levels of annual net income, minimum tangible net worth and maximum allowed capital expenditures. The Company was in compliance with these covenants as of December 31, 2016. The Company’s South African subsidiary, Osborn Engineered Products SA (Pty) Ltd (“Osborn”), has a bank overdraft facility of $6,913 to finance short-term working capital needs, as well as to cover performance letters of credit, advance payment and retention guarantees. As of December 31, 2016, Osborn had $4,632 in short-term borrowings and $904 in performance, advance payment and retention guarantees outstanding under the facility. The facility is guaranteed by Astec Industries, Inc. The overdraft’s 0.75% unused facility fee is waived if 50% or more of the facility is utilized. As of December 31, 2016, Osborn had available credit under the facility of $1,377. The interest rate is 0.25% less than the South Africa prime rate, resulting in a rate of 10.5% as of December 31, 2016. The Company's Brazilian subsidiary, Astec do Brasil Fabricacao de Equipamentos Ltda. ("Astec Brazil"), has outstanding working capital loans totaling $5,485 from a Brazilian bank with interest rates ranging from 10.4% to 11.0%. The loans have maturity dates ranging from November 2018 to April 2024 and are secured by letters of credit totaling $6,200 issued by Astec Industries, Inc. Additionally, Astec Brazil has various 5-year equipment financing loans outstanding with other Brazilian banks in the aggregate of $1,169 as of December 31, 2016 that have interest rates ranging from 3.5% to 16.3%. These equipment loans have maturity dates ranging from September 2018 to April 2020. Cash Flows from Operating Activities
2016
2015
Increase / Decrease
Net income $ 54,988 $ 31,966 $ 23,022 Depreciation and amortization 24,813 24,078 735 Provision for warranties 18,912 13,743 5,169 Deferred income tax benefits (3,521) (2,569) (952) SERP distributions (532) (2,986) 2,454 (Increase) decrease in receivables (4,895) 3,163 (8,058) (Increase) decrease in inventories 30,839 (6,499) 37,338 (Increase) decrease in prepaid expenses 4,846 (3,016) 7,862 Increase (decrease) in accounts payable 8,836 (11,409) 20,245 Increase (decrease) in income taxes payable 181 (4,093) 4,274 Decrease in customer deposits (762) (3,697) 2,935 Decrease in accrued product warranties (15,125) (14,177) (948) Other, net 16,226 6,362 9,864 Net cash provided by operating activities $ 134,806 $ 30,866 $ 103,940
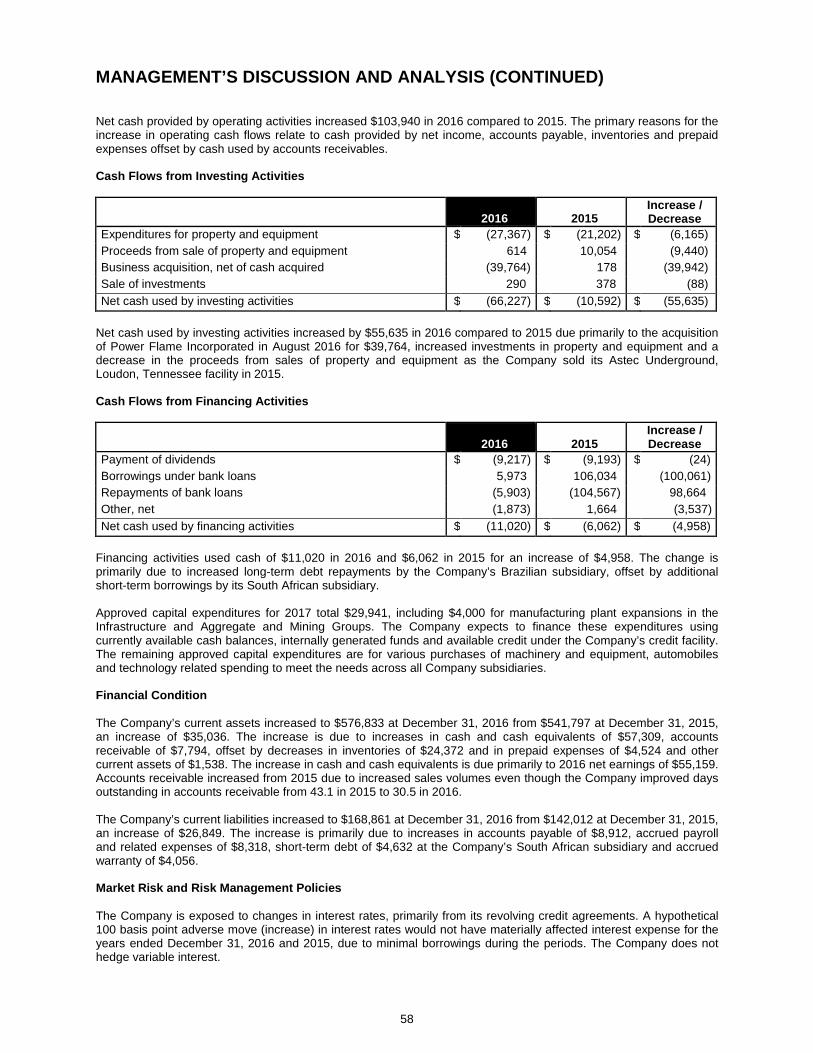
MANAGEMENT’S DISCUSSION AND ANALYSIS (CONTINUED)
58
Net cash provided by operating activities increased $103,940 in 2016 compared to 2015. The primary reasons for the increase in operating cash flows relate to cash provided by net income, accounts payable, inventories and prepaid expenses offset by cash used by accounts receivables. Cash Flows from Investing Activities
2016
2015
Increase / Decrease
Expenditures for property and equipment $ (27,367) $ (21,202) $ (6,165) Proceeds from sale of property and equipment 614 10,054 (9,440) Business acquisition, net of cash acquired (39,764) 178 (39,942) Sale of investments 290 378 (88) Net cash used by investing activities $ (66,227) $ (10,592) $ (55,635)
Net cash used by investing activities increased by $55,635 in 2016 compared to 2015 due primarily to the acquisition of Power Flame Incorporated in August 2016 for $39,764, increased investments in property and equipment and a decrease in the proceeds from sales of property and equipment as the Company sold its Astec Underground, Loudon, Tennessee facility in 2015. Cash Flows from Financing Activities
2016
2015
Increase / Decrease
Payment of dividends $ (9,217) $ (9,193) $ (24) Borrowings under bank loans 5,973 106,034 (100,061) Repayments of bank loans (5,903) (104,567) 98,664 Other, net (1,873) 1,664 (3,537) Net cash used by financing activities $ (11,020) $ (6,062) $ (4,958)
Financing activities used cash of $11,020 in 2016 and $6,062 in 2015 for an increase of $4,958. The change is primarily due to increased long-term debt repayments by the Company’s Brazilian subsidiary, offset by additional short-term borrowings by its South African subsidiary. Approved capital expenditures for 2017 total $29,941, including $4,000 for manufacturing plant expansions in the Infrastructure and Aggregate and Mining Groups. The Company expects to finance these expenditures using currently available cash balances, internally generated funds and available credit under the Company’s credit facility. The remaining approved capital expenditures are for various purchases of machinery and equipment, automobiles and technology related spending to meet the needs across all Company subsidiaries. Financial Condition The Company’s current assets increased to $576,833 at December 31, 2016 from $541,797 at December 31, 2015, an increase of $35,036. The increase is due to increases in cash and cash equivalents of $57,309, accounts receivable of $7,794, offset by decreases in inventories of $24,372 and in prepaid expenses of $4,524 and other current assets of $1,538. The increase in cash and cash equivalents is due primarily to 2016 net earnings of $55,159. Accounts receivable increased from 2015 due to increased sales volumes even though the Company improved days outstanding in accounts receivable from 43.1 in 2015 to 30.5 in 2016. The Company’s current liabilities increased to $168,861 at December 31, 2016 from $142,012 at December 31, 2015, an increase of $26,849. The increase is primarily due to increases in accounts payable of $8,912, accrued payroll and related expenses of $8,318, short-term debt of $4,632 at the Company’s South African subsidiary and accrued warranty of $4,056. Market Risk and Risk Management Policies The Company is exposed to changes in interest rates, primarily from its revolving credit agreements. A hypothetical 100 basis point adverse move (increase) in interest rates would not have materially affected interest expense for the years ended December 31, 2016 and 2015, due to minimal borrowings during the periods. The Company does not hedge variable interest.

MANAGEMENT’S DISCUSSION AND ANALYSIS (CONTINUED)
59
The Company is subject to foreign exchange risk at its foreign operations. Foreign operations represent 15.8% and 17.1% of total assets at December 31, 2016 and 2015, respectively, and 9.5% and 10.4% of total revenue for the years ended December 31, 2016 and 2015, respectively. Each period the balance sheets and related results of operations of the Company’s foreign subsidiaries are translated from their functional foreign currency into U.S. dollars for reporting purposes. As the U.S. dollar strengthens against those foreign currencies, the foreign denominated net assets and operating results become less valuable in the Company’s reporting currency. When the U.S. dollar weakens against those currencies, the foreign denominated net assets and operating results become more valuable in the Company’s reporting currency. At each reporting date, the fluctuation in the value of the net assets and operating results due to foreign exchange rate changes is recorded as an adjustment to other comprehensive income in equity. The Company views its investments in foreign subsidiaries as long-term and does not hedge the net investments in foreign subsidiaries. From time to time the Company’s foreign subsidiaries enter into transactions not denominated in their functional currency. In these situations, the Company evaluates the need to hedge those transactions against foreign currency rate fluctuations. When the Company determines a need to hedge a transaction, the subsidiary enters into a foreign currency exchange contract. The Company does not apply hedge accounting to these contracts and, therefore, recognizes the fair value of these contracts in the consolidated balance sheets and the change in the fair value of the contracts in current earnings. Due to the limited exposure to foreign exchange rate risk, a 10% fluctuation in the foreign exchange rates at December 31, 2016 or 2015 would not have a material impact on the Company’s consolidated financial statements. Contractual Obligations Contractual obligations and the period in which payments are due as of December 31, 2016 are as follows: Payments Due by Period Contractual Obligations
Total
Less Than 1 Year
1 to 3 Years
3 to 5 Years
More Than 5 Years
Operating lease obligations $ 3,647 $ 1,337 $ 1,647 $ 642 $ 21 Inventory purchase obligations 3,356 3,356 -- -- -- Debt obligations 12,384 7,683 3,512 593 596 Total $ 19,387 $ 12,376 $ 5,159 $ 1,235 $ 617
The above table excludes the Company’s liability for unrecognized tax benefits, which totaled $238 at December 31, 2016, since the timing of cash settlements to the respective taxing authorities cannot be reliably predicted. In 2016, the Company made contributions of approximately $415 to its pension plan, compared to $284 in 2015. The Company has no planned contributions to the pension plan in 2017. The Company’s funding policy is to make at least the minimum annual contributions required by applicable regulations. Contingencies Management has reviewed all claims and lawsuits and has made adequate provision for any losses that can be reasonably estimated. Based upon currently available information and with the advice of counsel, management believes that the ultimate outcome of its current claims and legal proceedings, individually and in the aggregate, will not have a material adverse effect on the Company’s financial position, cash flows or results of operations. However, claims and legal proceedings are subject to inherent uncertainties and rulings unfavorable to the Company could occur. If an unfavorable ruling were to occur, there exists the possibility of a material adverse effect on the Company’s financial position, cash flows or results of operations. Certain customers have financed purchases of the Company’s products through arrangements in which the Company is contingently liable for customer debt aggregating $6,516 at December 31, 2016. These obligations have average remaining terms of 2.0 years. The Company has recorded a liability of $332 related to these guarantees at December 31, 2016. The Company is contingently liable under letters of credit of approximately $9,977, primarily for performance guarantees to customers, banks or insurance carriers. Off-balance Sheet Arrangements
As of December 31, 2016, the Company does not have off-balance sheet arrangements as defined by Item 303(a)(4) of Regulation S-K.
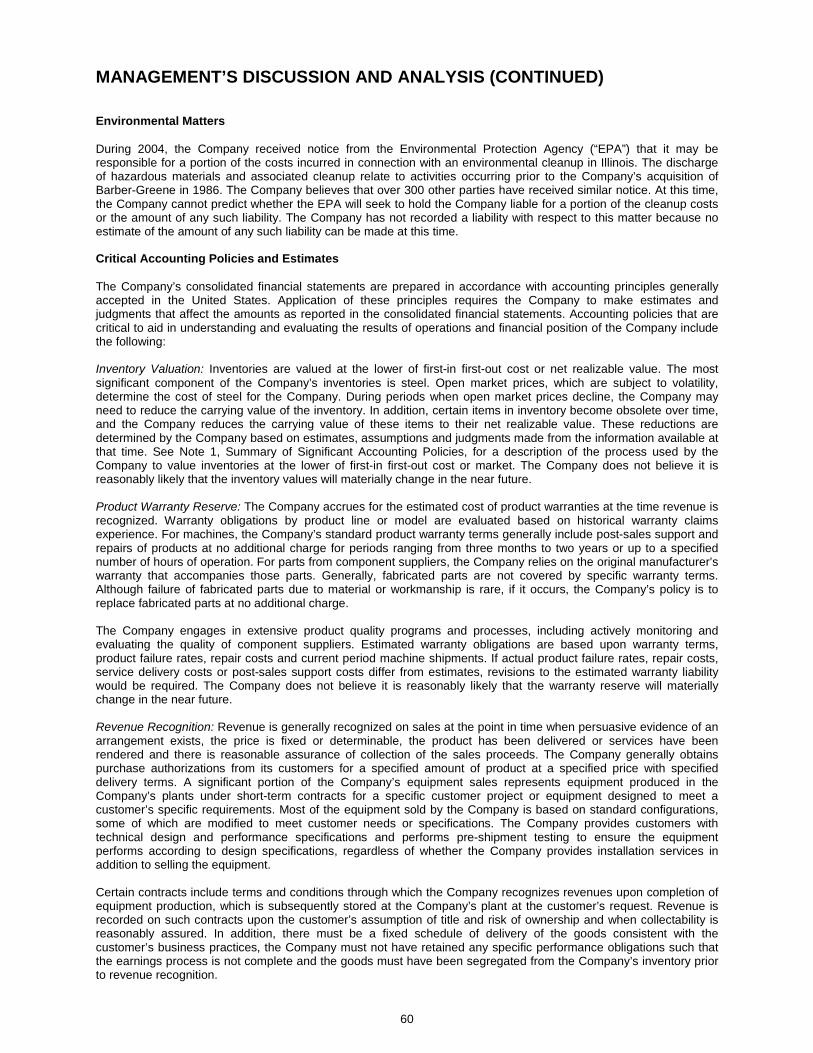
MANAGEMENT’S DISCUSSION AND ANALYSIS (CONTINUED)
60
Environmental Matters During 2004, the Company received notice from the Environmental Protection Agency (“EPA”) that it may be responsible for a portion of the costs incurred in connection with an environmental cleanup in Illinois. The discharge of hazardous materials and associated cleanup relate to activities occurring prior to the Company’s acquisition of Barber-Greene in 1986. The Company believes that over 300 other parties have received similar notice. At this time, the Company cannot predict whether the EPA will seek to hold the Company liable for a portion of the cleanup costs or the amount of any such liability. The Company has not recorded a liability with respect to this matter because no estimate of the amount of any such liability can be made at this time. Critical Accounting Policies and Estimates The Company’s consolidated financial statements are prepared in accordance with accounting principles generally accepted in the United States. Application of these principles requires the Company to make estimates and judgments that affect the amounts as reported in the consolidated financial statements. Accounting policies that are critical to aid in understanding and evaluating the results of operations and financial position of the Company include the following: Inventory Valuation: Inventories are valued at the lower of first-in first-out cost or net realizable value. The most significant component of the Company’s inventories is steel. Open market prices, which are subject to volatility, determine the cost of steel for the Company. During periods when open market prices decline, the Company may need to reduce the carrying value of the inventory. In addition, certain items in inventory become obsolete over time, and the Company reduces the carrying value of these items to their net realizable value. These reductions are determined by the Company based on estimates, assumptions and judgments made from the information available at that time. See Note 1, Summary of Significant Accounting Policies, for a description of the process used by the Company to value inventories at the lower of first-in first-out cost or market. The Company does not believe it is reasonably likely that the inventory values will materially change in the near future. Product Warranty Reserve: The Company accrues for the estimated cost of product warranties at the time revenue is recognized. Warranty obligations by product line or model are evaluated based on historical warranty claims experience. For machines, the Company’s standard product warranty terms generally include post-sales support and repairs of products at no additional charge for periods ranging from three months to two years or up to a specified number of hours of operation. For parts from component suppliers, the Company relies on the original manufacturer’s warranty that accompanies those parts. Generally, fabricated parts are not covered by specific warranty terms. Although failure of fabricated parts due to material or workmanship is rare, if it occurs, the Company’s policy is to replace fabricated parts at no additional charge. The Company engages in extensive product quality programs and processes, including actively monitoring and evaluating the quality of component suppliers. Estimated warranty obligations are based upon warranty terms, product failure rates, repair costs and current period machine shipments. If actual product failure rates, repair costs, service delivery costs or post-sales support costs differ from estimates, revisions to the estimated warranty liability would be required. The Company does not believe it is reasonably likely that the warranty reserve will materially change in the near future. Revenue Recognition: Revenue is generally recognized on sales at the point in time when persuasive evidence of an arrangement exists, the price is fixed or determinable, the product has been delivered or services have been rendered and there is reasonable assurance of collection of the sales proceeds. The Company generally obtains purchase authorizations from its customers for a specified amount of product at a specified price with specified delivery terms. A significant portion of the Company’s equipment sales represents equipment produced in the Company’s plants under short-term contracts for a specific customer project or equipment designed to meet a customer’s specific requirements. Most of the equipment sold by the Company is based on standard configurations, some of which are modified to meet customer needs or specifications. The Company provides customers with technical design and performance specifications and performs pre-shipment testing to ensure the equipment performs according to design specifications, regardless of whether the Company provides installation services in addition to selling the equipment.
Certain contracts include terms and conditions through which the Company recognizes revenues upon completion of equipment production, which is subsequently stored at the Company’s plant at the customer’s request. Revenue is recorded on such contracts upon the customer’s assumption of title and risk of ownership and when collectability is reasonably assured. In addition, there must be a fixed schedule of delivery of the goods consistent with the customer’s business practices, the Company must not have retained any specific performance obligations such that the earnings process is not complete and the goods must have been segregated from the Company’s inventory prior to revenue recognition.

MANAGEMENT’S DISCUSSION AND ANALYSIS (CONTINUED)
61
The Company has certain sales accounted for as multiple-element arrangements, whereby revenue attributable to the sale of a product is recognized when the product is shipped, and the revenue attributable to services provided with respect to the product (such as installation services) is recognized when the service is performed. Consideration is allocated to deliverables using the relative selling price method using vendor specific objective evidence, if it exists. Otherwise, the Company uses third-party evidence of selling price or the Company’s best estimate of the selling price for the deliverables. The Company evaluates sales with multiple deliverable elements (such as an agreement to deliver equipment and related installation services) to determine whether revenue related to individual elements should be recognized separately, or as a combined unit. In addition to the previously mentioned general revenue recognition criteria, the Company only recognizes revenue on individual delivered elements when there is objective and reliable evidence that the delivered element has a determinable value to the customer on a standalone basis and there is no right of return. The Company has certain sales accounted for under the percentage of completion method using the ratio of costs incurred to estimated total costs. Revenue, in an amount equal to cost incurred, is recognized until there is sufficient information to determine the estimated profit on the project with a reasonable level of certainty. The factors considered in this evaluation include the stage of design completion, the stage of equipment manufacturing completion, the state of construction completion, the status of outstanding subcontracts, certainty of quantities of labor and materials, certainty of schedule and the relationship with the customer. Goodwill and Other Intangible Assets: Intangible assets are classified into two categories: (1) intangible assets with definite lives subject to amortization, and (2) goodwill. Intangible assets with definite lives are tested for impairment if conditions exist that indicate the carrying value may not be recoverable. Risk factors that may be considered include an economic downturn in the general economy, a geographic market or the commercial and residential construction industries, a change in the assessment of future operations as well as the cyclical nature of our industry and the customization of the equipment we sell, each of which may cause adverse fluctuations in operating results. Other risk factors considered would be an increase in the price or a decrease in the availability of oil that could reduce the demand for our products in addition to the significant fluctuations in the purchase price of raw materials that could have a negative impact on the cost of production and gross margins as well as others more fully described in the Risk Factors section of our Form 10-K. An impairment charge is recorded when the carrying value of the definite lived intangible asset is not recoverable by the cash flows generated from the use of the asset. Some of the inputs used in the impairment testing are highly subjective and are affected by changes in business factors and other conditions. Changes in any of the inputs could have an effect on future tests and result in impairment charges.
Goodwill is not amortized but is tested for impairment annually or more frequently if events or circumstances indicate that such intangible assets or goodwill might be impaired. See Note 1, Summary of Significant Accounting Policies, for a description of testing performed by the Company to determine if the recorded value of intangible assets or goodwill has been impaired. The useful lives of identifiable intangible assets are determined after considering the specific facts and circumstances related to each intangible asset. Factors considered when determining useful lives include the contractual term of any agreement, the history of the asset, the Company’s long-term strategy for the use of the asset, any laws or other local regulations which could impact the useful life of the asset, and other economic factors, including competition and specific market conditions. Intangible assets that are deemed to have definite lives are amortized, generally on a straight-line basis, over their useful lives, ranging from 3 to 19 years. Income Taxes: The Company accounts for income taxes under the guidance of FASB Accounting Standards Codification Topic 740-10, “Income Taxes”. Deferred tax assets and liabilities are recognized for the future tax consequences attributable to differences between financial statement carrying amounts of existing assets and liabilities and their respective tax bases and operating loss and tax credit carryforwards. Deferred tax assets and liabilities are measured using enacted tax rates expected to apply to taxable income in the years in which those temporary differences are expected to be recovered or settled. A valuation allowance, that represents a reserve on deferred tax assets for which utilization is not more likely than not, is recorded. Judgment is required in determining the provision for income taxes, deferred tax assets and liabilities and the valuation allowance recorded against net deferred tax assets. Income tax contingency accruals are determined and recorded under the guidance of ASC Topic 740-10. Liabilities for uncertain income tax positions are based on a two-step process. The first step is to evaluate the tax position for recognition by determining if the weight of available evidence indicates that it is more likely than not that the position will be sustained on audit, including resolution of related appeals or litigation processes, if any. The second step requires an estimate and measurement of the tax benefit as the largest amount that is more than 50% likely to be realized upon ultimate settlement. It is inherently difficult and subjective to estimate such amounts, as the Company must determine the probability of various possible outcomes. We reevaluate these uncertain tax positions on a quarterly basis or when new information becomes available. These reevaluations are based on factors including, but not limited to, changes in facts or circumstances, changes in tax law, successfully settled issues under audit, expirations due to statutes, and new audit activity. Such a change in recognition or measurement could result in the recognition of a tax benefit or an increase to accrued taxes.
MANAGEMENT’S DISCUSSION AND ANALYSIS (CONTINUED)
62
Recent Accounting Pronouncements
In May 2014, the Financial Accounting Standards Board (‘FASB”) issued Accounting Standards Update (“ASU”) No. 2014-09, "Revenue from Contracts with Customers", which supersedes existing revenue guidance under U.S. GAAP. The standard's core principle is that a company will recognize revenue when it transfers promised goods or services to customers in an amount that reflects the consideration to which the company expects to be entitled in exchange for those goods or services. The implementation of this new standard will require companies to use more judgment and to make more estimates than under current guidance. The standard, as amended, is effective for public companies for annual periods beginning after December 15, 2017. The Company plans to adopt the new standard effective January 1, 2018. Due to the decentralized structure of the Company, Corporate management requested documented revenue streams from its’ 16 manufacturing subsidiaries to assist in its effort to determine the effect the new standard will have on its financial reporting. A meeting was also held in September 2016 with corporate management, controllers of the manufacturing subsidiaries, and an outside revenue expert to further review the Company’s revenue streams and the change in timing of when revenue may be recognized under the new guidance. The Company is still in the process of finalizing this review. Therefore, the Company has not yet determined the extent of the impact adoption of this new standard will have on the Company’s financial position or results of operation. In July 2015, the FASB issued ASU No. 2015-11, "Inventory (Topic 330): Simplifying the Measurement of Inventory", which changes the measurement basis for inventory from the lower of cost or market to lower of cost and net realizable value and also eliminates the requirement for companies to consider replacement cost or net realizable value less an approximate normal profit margin when determining the recorded value of inventory. The standard is effective for public companies in fiscal years beginning after December 15, 2016. The Company early adopted the standard effective October 1, 2016. In January 2016, the FASB issued ASU No. 2016-01, “Financial Instruments—Overall (Subtopic 825-10)”, which requires, among other things, equity investments with readily determinable fair values, except those accounted for under the equity method of accounting or those that result in consolidation of the investee, to be measured at fair value with changes in fair value recognized in net income. The standard is effective for public companies in fiscal years beginning after December 15, 2017, and the Company expects to adopt the standard effective January 1, 2018. The Company has not yet determined what impact, if any, the adoption of this new standard will have on the Company's financial position or results of operations. In February 2016, the FASB issued ASU No. 2016-02, “Leases (Topic 842)”, which significantly changes the accounting for operating leases by lessees. The accounting applied by lessors is largely unchanged from that applied under previous guidance. The new guidance requires lessees to recognize lease assets and lease liabilities in the balance sheet, initially measured at the present value of the lease payments, for leases which were classified as operating leases under previous guidance. Lease cost included in the statement of income will be calculated so that the cost of the lease is allocated over the lease term, generally on a straight-line basis. Lessees may make an accounting policy election to exclude leases with a term of 12 months or less from the requirement to record related assets and liabilities. The new standard is effective for public companies for fiscal years beginning after December 15, 2018. The Company plans to adopt the new standard effective January 1, 2019. The Company does not expect the adoption of this standard to have a material impact on its results of operations; however, the Company has not determined the impact the adoption of this new standard will have on its financial position. In March 2016, the FASB issued ASU No. 2016-08, “Revenue from Contracts with Customers (Topic 606)”, which does not change the core principles of ASU No. 2014-09 discussed above, but rather clarifies the implementation guidance in order to eliminate the potential for diversity in practice arising from inconsistent application of the principal versus agent guidance. Under the new guidance, when an entity determines it is a principal in a transaction, the entity recognizes revenue in the gross amount of consideration; however in transactions where an entity determines it in an agent, the entity recognizes revenue in the amount of any fee or commission to which it expects to be entitled. The standard is effective for public companies for annual periods beginning after December 15, 2017. The Company plans to adopt the new standard effective January 1, 2018. The Company has not yet determined what impact, if any, the adoption of this new standard will have on the Company's financial position or results of operations. In June 2016, the FASB issued ASU No. 2016-13, “Financial Instruments – Credit Losses (Topic 326), Measurement of Credit Losses on Financial Instruments”. The standard changes how credit losses are measured for most financial assets and certain other instruments that currently are not measured through net income. The standard will require an expected loss model for instruments measured at amortized cost as opposed to the current incurred loss approach. In valuing available for sale debt securities, allowances will be required to be recorded, rather than the current approach of reducing the carrying amount, for other than temporary impairments. A cumulative adjustment to retained earnings is to be recorded as of the beginning of the period of adoption to reflect the impact of applying the provisions of the standard. The standard is effective for public companies for periods beginning after December 15, 2019 and the Company expects to adopt the new standard as of January 1, 2020. The Company has not yet
MANAGEMENT’S DISCUSSION AND ANALYSIS (CONTINUED)
63
determined what impact, if any, the adoption of this new standard will have on the Company's financial position or results of operations. In August 2016, the FASB issued ASU No. 2016-15, “Classification of Certain Cash Receipts and Cash Payments (a consensus of the Emerging Issues Task Force) which clarifies how certain cash receipts and cash payments should be presented on the statement of cash flows. The statement also addresses how the predominance principle should be applied when cash payments have aspects of more than one class of cash flows. The standard is effective for public companies in fiscal years beginning after December 15, 2017, and the Company expects to adopt the standard effective January 1, 2018. The Company has not determined the impact, if any, the adoption of this new standard will have on the Company's statement of cash flows. In October 2016, the FASB issued ASU No. 2016-16, “Intra-Entity Transfers of Assets Other Than Inventory” which requires companies to account for the income tax effects of intercompany sales and transfers of assets other than inventory, such as intangible assets, when the transfer occurs. This is a change from current guidance, which requires companies to defer the income tax effects of intercompany transfers of assets until the asset has been sold to an outside party or otherwise recognized by being depreciated, amortized, or impaired. The new guidance will require companies to defer the income tax effects of only intercompany transfers of inventory. The standard is effective for public companies in fiscal years beginning after December 15, 2018. Early adoption is permitted as of the beginning of an annual period and requires companies to apply a modified retrospective approach. The Company plans to adopt the new standard effective January 1, 2019. The Company has not yet determined what impact the adoption of this new standard will have on the Company's financial position or results of operations. Forward-Looking Statements
This annual report contains forward-looking statements made pursuant to the safe harbor provisions of the Private Securities Litigation Reform Act of 1995. Statements contained anywhere in this Annual Report that are not limited to historical information are considered forward-looking statements within the meaning of Section 21E of the Securities Exchange Act of 1934, including, without limitation, statements regarding:
• execution of the Company’s growth and operation strategy; • plans for technological innovation; • compliance with covenants in our credit facility; • liquidity and capital expenditures; • sufficiency of working capital, cash flows and available capacity under the Company’s credit facilities; • compliance with government regulations; • compliance with manufacturing and delivery timetables; • forecasting of results; • general economic trends and political uncertainty; • government funding and growth of highway construction and commercial projects; • taxes or usage fees; • interest rates; • integration of acquisitions; • industry trends; • pricing, demand and availability of steel, oil and liquid asphalt; • development of domestic oil and natural gas production; • condition of the economy; • strength of the U.S. dollar relative to foreign currencies; • the success of new product lines; • presence in the international marketplace; • suitability of our current facilities; • future payment of dividends; • competition in our business segments; • product liability and other claims; • protection of proprietary technology; • demand for products; • future fillings of backlogs; • employees; • the seasonality of our business; • tax assets and reserves for uncertain tax positions; • critical accounting policies and the impact of accounting changes; • anticipated future operations in our Brazilian operations;
MANAGEMENT’S DISCUSSION AND ANALYSIS (CONTINUED)
64
• our backlog; • ability to satisfy contingencies; • contributions to retirement plans and plan expenses; • reserve levels for self-insured insurance plans and product warranties; • construction of new manufacturing facilities; • supply of raw materials; and • inventory
These forward-looking statements are based largely on management’s expectations, which are subject to a number of known and unknown risks, uncertainties and other factors discussed in this report and in other documents filed by the Company with the Securities and Exchange Commission, which may cause actual results, financial or otherwise, to be materially different from those anticipated, expressed or implied by the forward-looking statements. All forward-looking statements included in this document are based on information available to the Company on the date hereof, and the Company assumes no obligation to update any such forward-looking statements to reflect future events or circumstances. You can identify these statements by forward-looking words such as “expect”, “believe”, “anticipate”, “goal”, “plan”, “intend”, “estimate”, “may”, “will”, “should”, “could” and similar expressions. In addition to the risks and uncertainties identified elsewhere herein and in other documents filed by us with the Securities and Exchange Commission, the risk factors described in this document under the caption "Risk Factors" should be carefully considered when evaluating our business and future prospects, including without limitation risks relating to: changes or delays in highway funding; rising interest rates; changes in oil prices; changes in steel prices; changes in the general economy; unexpected capital expenditures and decreases in liquidity; the timing of large contracts; production capacity; general business conditions in the industry; non-compliance with covenants in the Company’s credit facilities; demand for the Company’s products; and those other factors listed from time to time in the Company’s reports filed with the Securities and Exchange Commission. Certain of the risks, uncertainties and other factors discussed above are more fully described in the section entitled “Risk Factors” in the Company’s Annual Report on Form 10-K for the year ended December 31, 2016.

ASTEC INDUSTRIES, INC. MANAGEMENT’S REPORT ON INTERNAL CONTROL OVER FINANCIAL REPORTING
65
The management of Astec Industries, Inc. (the “Company”) is responsible for establishing and maintaining adequate internal control over financial reporting for the Company. The Company’s internal control over financial reporting is a process designed to provide reasonable assurance regarding the reliability of financial reporting and the preparation of financial statements for external purposes in accordance with U.S. generally accepted accounting principles. The Company’s internal control over financial reporting includes those policies and procedures that (i) pertain to the maintenance of records that, in reasonable detail, accurately and fairly reflect the transactions and dispositions of assets of the Company; (ii) provide reasonable assurance that transactions are recorded as necessary to permit preparation of financial statements in accordance with generally accepted accounting principles, and that receipts and expenditures of the Company are being made only in accordance with authorizations of management and directors of the Company; and (iii) provide reasonable assurance regarding prevention or timely detection of unauthorized acquisition, use, or disposition of the Company’s assets that could have a material effect on the financial statements. Because of its inherent limitations, internal control over financial reporting may not prevent or detect misstatements. Also, projections of any evaluation of effectiveness to future periods are subject to the risk that controls may become inadequate because of changes in conditions, or that the degree of compliance with the policies and procedures may deteriorate. Management, under the supervision and with the participation of the Company’s principal executive officer and principal financial officer, has evaluated the effectiveness of the Company’s internal control over financial reporting as of December 31, 2016. In making this assessment, management used the criteria set forth by the Committee of Sponsoring Organizations of the Treadway Commission (COSO), Internal Control - Integrated Framework (2013). The scope of management’s assessment of the effectiveness of the Company’s internal control over financial reporting as of December 31, 2016 excluded the business unit that the Company acquired on August 1, 2016 (Power Flame Incorporated). The total consolidated assets with respect to the excluded business were $42,281,000 as of December 31, 2016, and the total consolidated revenues with respect to the excluded business were $13,636,000 for the year ended December 31, 2016. Management will complete its assessment of the internal controls over financial reporting of these newly-acquired operations during 2017. Based on its assessment, management concluded that, as of December 31, 2016, the Company’s internal control over financial reporting was effective. KPMG LLP, the Company’s independent registered public accounting firm, has issued an attestation report on the Company’s internal control over financial reporting as of December 31, 2016.
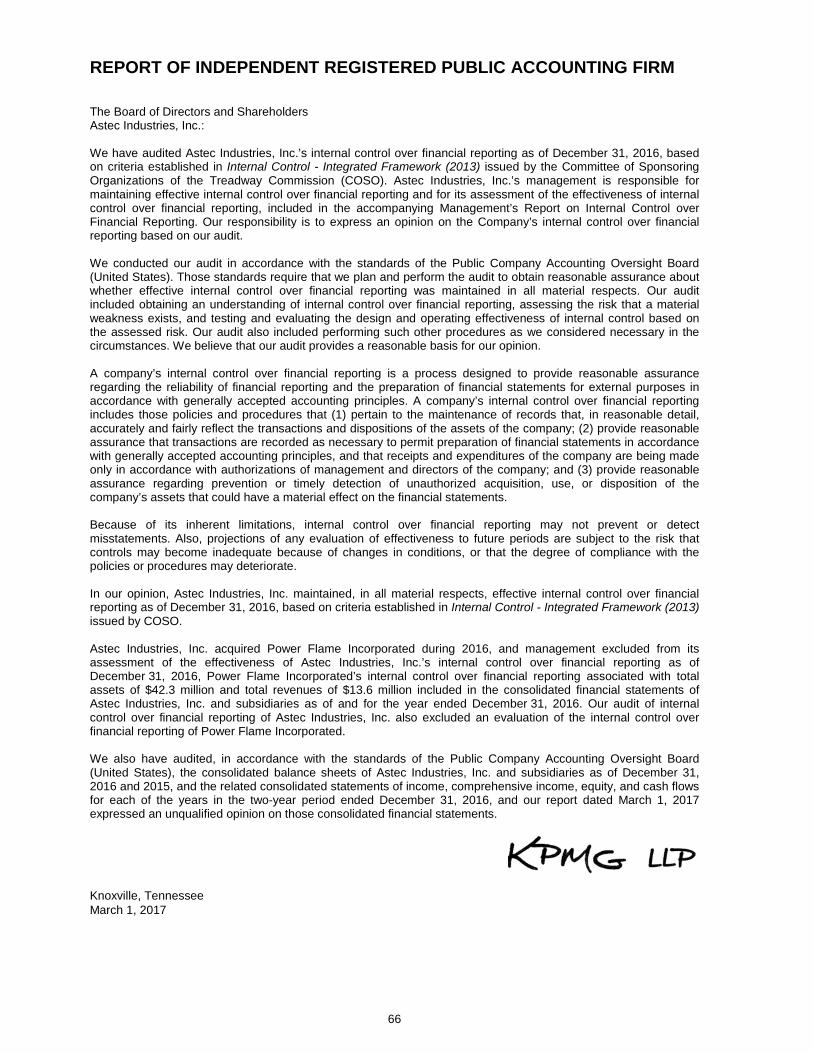
REPORT OF INDEPENDENT REGISTERED PUBLIC ACCOUNTING FIRM
66
The Board of Directors and Shareholders Astec Industries, Inc.: We have audited Astec Industries, Inc.’s internal control over financial reporting as of December 31, 2016, based on criteria established in Internal Control - Integrated Framework (2013) issued by the Committee of Sponsoring Organizations of the Treadway Commission (COSO). Astec Industries, Inc.’s management is responsible for maintaining effective internal control over financial reporting and for its assessment of the effectiveness of internal control over financial reporting, included in the accompanying Management’s Report on Internal Control over Financial Reporting. Our responsibility is to express an opinion on the Company’s internal control over financial reporting based on our audit. We conducted our audit in accordance with the standards of the Public Company Accounting Oversight Board (United States). Those standards require that we plan and perform the audit to obtain reasonable assurance about whether effective internal control over financial reporting was maintained in all material respects. Our audit included obtaining an understanding of internal control over financial reporting, assessing the risk that a material weakness exists, and testing and evaluating the design and operating effectiveness of internal control based on the assessed risk. Our audit also included performing such other procedures as we considered necessary in the circumstances. We believe that our audit provides a reasonable basis for our opinion. A company’s internal control over financial reporting is a process designed to provide reasonable assurance regarding the reliability of financial reporting and the preparation of financial statements for external purposes in accordance with generally accepted accounting principles. A company’s internal control over financial reporting includes those policies and procedures that (1) pertain to the maintenance of records that, in reasonable detail, accurately and fairly reflect the transactions and dispositions of the assets of the company; (2) provide reasonable assurance that transactions are recorded as necessary to permit preparation of financial statements in accordance with generally accepted accounting principles, and that receipts and expenditures of the company are being made only in accordance with authorizations of management and directors of the company; and (3) provide reasonable assurance regarding prevention or timely detection of unauthorized acquisition, use, or disposition of the company’s assets that could have a material effect on the financial statements. Because of its inherent limitations, internal control over financial reporting may not prevent or detect misstatements. Also, projections of any evaluation of effectiveness to future periods are subject to the risk that controls may become inadequate because of changes in conditions, or that the degree of compliance with the policies or procedures may deteriorate. In our opinion, Astec Industries, Inc. maintained, in all material respects, effective internal control over financial reporting as of December 31, 2016, based on criteria established in Internal Control - Integrated Framework (2013) issued by COSO. Astec Industries, Inc. acquired Power Flame Incorporated during 2016, and management excluded from its assessment of the effectiveness of Astec Industries, Inc.’s internal control over financial reporting as of December 31, 2016, Power Flame Incorporated’s internal control over financial reporting associated with total assets of $42.3 million and total revenues of $13.6 million included in the consolidated financial statements of Astec Industries, Inc. and subsidiaries as of and for the year ended December 31, 2016. Our audit of internal control over financial reporting of Astec Industries, Inc. also excluded an evaluation of the internal control over financial reporting of Power Flame Incorporated. We also have audited, in accordance with the standards of the Public Company Accounting Oversight Board (United States), the consolidated balance sheets of Astec Industries, Inc. and subsidiaries as of December 31, 2016 and 2015, and the related consolidated statements of income, comprehensive income, equity, and cash flows for each of the years in the two-year period ended December 31, 2016, and our report dated March 1, 2017 expressed an unqualified opinion on those consolidated financial statements.
Knoxville, Tennessee March 1, 2017

REPORT OF INDEPENDENT REGISTERED PUBLIC ACCOUNTING FIRM
67
The Board of Directors and Shareholders of Astec Industries, Inc. We have audited the accompanying consolidated statements of income, comprehensive income, equity and cash flows for the year ended December 31, 2014. These financial statements are the responsibility of the Company's management. Our responsibility is to express an opinion on these financial statements based on our audit. We conducted our audit in accordance with the standards of the Public Company Accounting Oversight Board (United States). Those standards require that we plan and perform the audit to obtain reasonable assurance about whether the financial statements are free of material misstatement. An audit includes examining, on a test basis, evidence supporting the amounts and disclosures in the financial statements. An audit also includes assessing the accounting principles used and significant estimates made by management, as well as evaluating the overall financial statement presentation. We believe that our audit provides a reasonable basis for our opinion. In our opinion, the financial statements referred to above present fairly, in all material respects, the consolidated results of Astec Industries, Inc.’s operations and its cash flows for the year ended December 31, 2014, in conformity with U.S. generally accepted accounting principles.
Chattanooga, Tennessee March 2, 2015

REPORT OF INDEPENDENT REGISTERED PUBLIC ACCOUNTING FIRM
68
The Board of Directors and Shareholders Astec Industries, Inc.: We have audited the accompanying consolidated balance sheets of Astec Industries, Inc. and subsidiaries as of December 31, 2016 and 2015, and the related consolidated statements of income, comprehensive income, equity, and cash flows for each of the years in the two-year period ended December 31, 2016. These consolidated financial statements are the responsibility of the Company's management. Our responsibility is to express an opinion on these consolidated financial statements based on our audits. We conducted our audits in accordance with the standards of the Public Company Accounting Oversight Board (United States). Those standards require that we plan and perform the audit to obtain reasonable assurance about whether the financial statements are free of material misstatement. An audit includes examining, on a test basis, evidence supporting the amounts and disclosures in the financial statements. An audit also includes assessing the accounting principles used and significant estimates made by management, as well as evaluating the overall financial statement presentation. We believe that our audits provide a reasonable basis for our opinion. In our opinion, the consolidated financial statements referred to above present fairly, in all material respects, the financial position of Astec Industries, Inc. and subsidiaries as of December 31, 2016 and 2015, and the results of their operations and their cash flows for each of the years in the two-year period ended December 31, 2016, in conformity with U.S. generally accepted accounting principles. We also have audited, in accordance with the standards of the Public Company Accounting Oversight Board (United States), Astec Industries, Inc.’s internal control over financial reporting as of December 31, 2016, based on criteria established in Internal Control - Integrated Framework (2013) issued by the Committee of Sponsoring Organizations of the Treadway Commission (COSO), and our report dated March 1, 2017 expressed an unqualified opinion on the effectiveness of the Company’s internal control over financial reporting.
Knoxville, Tennessee March 1, 2017
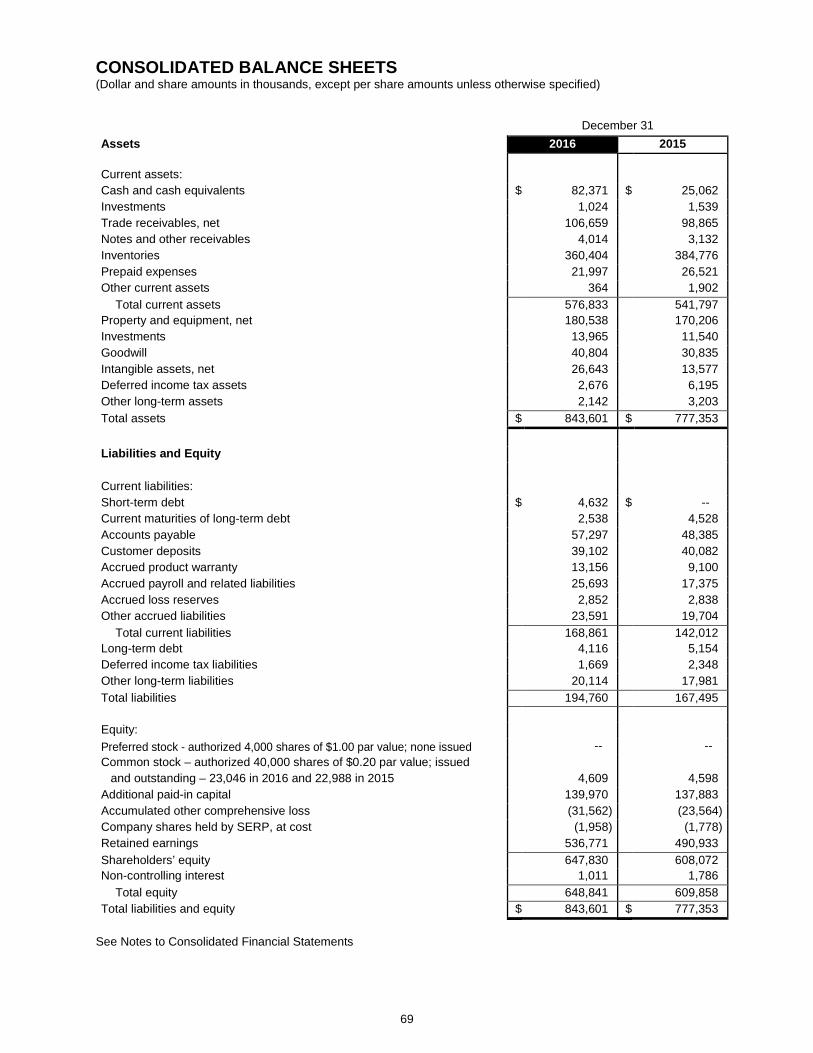
CONSOLIDATED BALANCE SHEETS (Dollar and share amounts in thousands, except per share amounts unless otherwise specified)
69
December 31 Assets 2016 2015
Current assets: Cash and cash equivalents $ 82,371 $ 25,062 Investments 1,024 1,539 Trade receivables, net 106,659 98,865 Notes and other receivables 4,014 3,132 Inventories 360,404 384,776 Prepaid expenses 21,997 26,521 Other current assets 364 1,902
Total current assets 576,833 541,797 Property and equipment, net 180,538 170,206 Investments 13,965 11,540 Goodwill 40,804 30,835 Intangible assets, net 26,643 13,577 Deferred income tax assets 2,676 6,195 Other long-term assets 2,142 3,203 Total assets $ 843,601 $ 777,353
Liabilities and Equity Current liabilities: Short-term debt $ 4,632 $ -- Current maturities of long-term debt 2,538 4,528 Accounts payable 57,297 48,385 Customer deposits 39,102 40,082 Accrued product warranty 13,156 9,100 Accrued payroll and related liabilities 25,693 17,375 Accrued loss reserves 2,852 2,838 Other accrued liabilities 23,591 19,704
Total current liabilities 168,861 142,012 Long-term debt 4,116 5,154 Deferred income tax liabilities 1,669 2,348 Other long-term liabilities 20,114 17,981 Total liabilities 194,760 167,495 Equity: Preferred stock - authorized 4,000 shares of $1.00 par value; none issued -- -- Common stock – authorized 40,000 shares of $0.20 par value; issued
and outstanding – 23,046 in 2016 and 22,988 in 2015 4,609 4,598 Additional paid-in capital 139,970 137,883 Accumulated other comprehensive loss (31,562) (23,564) Company shares held by SERP, at cost (1,958) (1,778) Retained earnings 536,771 490,933 Shareholders’ equity 647,830 608,072 Non-controlling interest 1,011 1,786
Total equity 648,841 609,858 Total liabilities and equity $ 843,601 $ 777,353
See Notes to Consolidated Financial Statements

CONSOLIDATED STATEMENTS OF INCOME (in thousands, except per share data)
70
Year Ended December 31
2016 2015 2014 Net sales $ 1,147,431 $ 983,157 $ 975,595 Cost of sales 882,162 764,314 760,279 Gross profit 265,269 218,843 215,316 Selling, general and administrative expenses 153,145 145,180 141,490 Research and development expenses 24,969 23,676 22,129 Income from operations 87,155 49,987 51,697 Other income:
Interest expense 1,395 1,611 720 Interest income 806 542 1,422 Other income (expense), net 529 3,055 1,207
Income before income taxes 87,095 51,973 53,606 Income taxes 32,107 20,007 19,400 Net income 54,988 31,966 34,206 Net loss attributable to non-controlling interest (171) (831) (252) Net income attributable to controlling interest $ 55,159 $ 32,797 $ 34,458 Earnings per Common Share: Net income attributable to controlling interest:
Basic $ 2.40 $ 1.43 $ 1.51 Diluted 2.38 1.42 1.49
Weighted average number of common shares outstanding: Basic 22,992 22,934 22,819 Diluted 23,142 23,120 23,105
See Notes to Consolidated Financial Statements
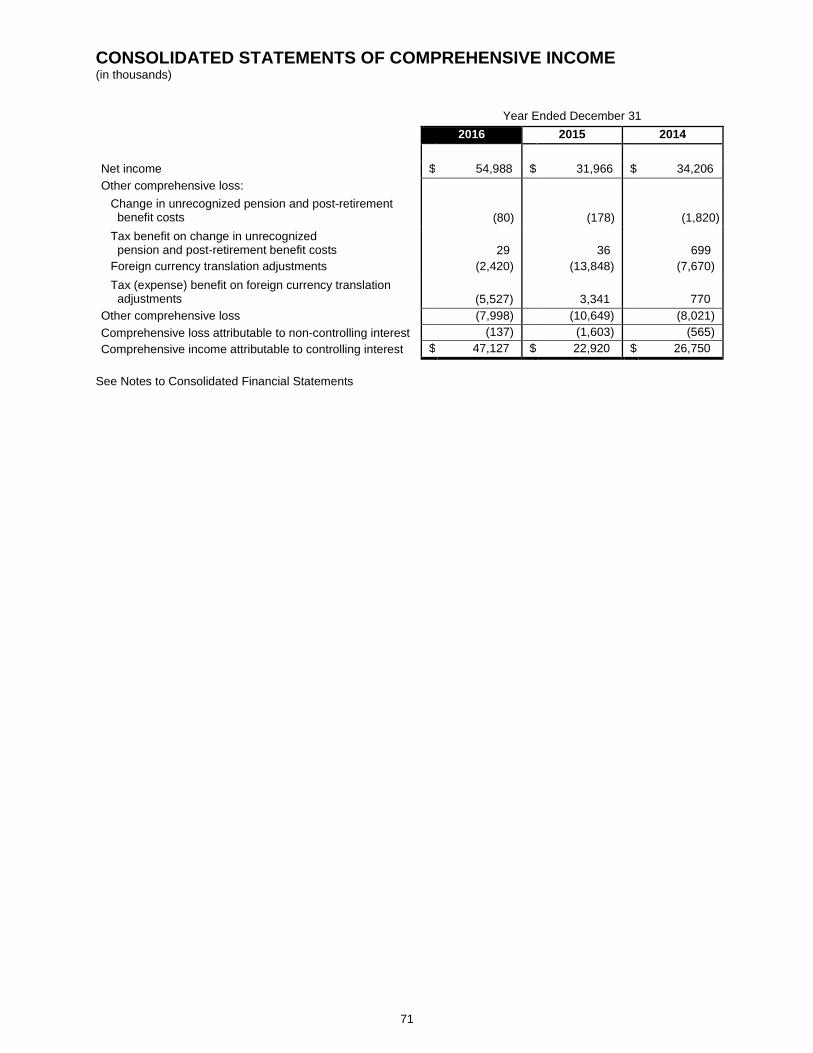
CONSOLIDATED STATEMENTS OF COMPREHENSIVE INCOME (in thousands)
71
Year Ended December 31
2016 2015 2014 Net income $ 54,988 $ 31,966 $ 34,206 Other comprehensive loss:
Change in unrecognized pension and post-retirement benefit costs
(80)
(178)
(1,820)
Tax benefit on change in unrecognized pension and post-retirement benefit costs
29
36
699 Foreign currency translation adjustments (2,420) (13,848) (7,670) Tax (expense) benefit on foreign currency translation adjustments
(5,527)
3,341
770 Other comprehensive loss (7,998) (10,649) (8,021) Comprehensive loss attributable to non-controlling interest (137) (1,603) (565) Comprehensive income attributable to controlling interest $
47,127 $
22,920 $
26,750
See Notes to Consolidated Financial Statements
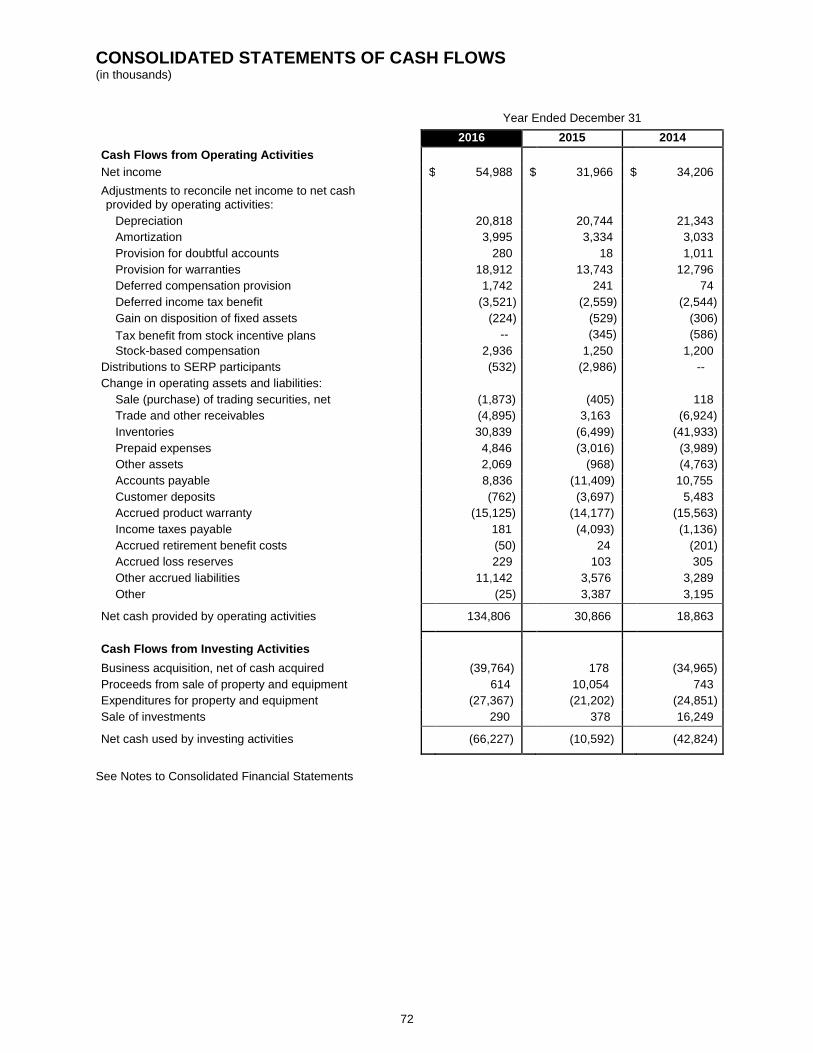
CONSOLIDATED STATEMENTS OF CASH FLOWS (in thousands)
72
Year Ended December 31
2016
2015 2014 Cash Flows from Operating Activities Net income $ 54,988 $ 31,966 $ 34,206 Adjustments to reconcile net income to net cash provided by operating activities:
Depreciation 20,818 20,744 21,343 Amortization 3,995 3,334 3,033 Provision for doubtful accounts 280 18 1,011 Provision for warranties 18,912 13,743 12,796 Deferred compensation provision 1,742 241 74 Deferred income tax benefit (3,521) (2,559) (2,544) Gain on disposition of fixed assets (224) (529) (306) Tax benefit from stock incentive plans -- (345) (586) Stock-based compensation 2,936 1,250 1,200
Distributions to SERP participants (532) (2,986) -- Change in operating assets and liabilities:
Sale (purchase) of trading securities, net (1,873) (405) 118 Trade and other receivables (4,895) 3,163 (6,924) Inventories 30,839 (6,499) (41,933) Prepaid expenses 4,846 (3,016) (3,989) Other assets 2,069
(968) (4,763)
Accounts payable 8,836
(11,409) 10,755 Customer deposits (762) (3,697) 5,483 Accrued product warranty (15,125) (14,177) (15,563) Income taxes payable 181 (4,093) (1,136) Accrued retirement benefit costs (50) 24 (201) Accrued loss reserves 229 103 305 Other accrued liabilities 11,142 3,576 3,289 Other (25)
3,387 3,195
Net cash provided by operating activities 134,806 30,866 18,863
Cash Flows from Investing Activities Business acquisition, net of cash acquired (39,764) 178 (34,965) Proceeds from sale of property and equipment 614 10,054 743 Expenditures for property and equipment (27,367) (21,202) (24,851) Sale of investments 290 378 16,249
Net cash used by investing activities (66,227) (10,592) (42,824)
See Notes to Consolidated Financial Statements
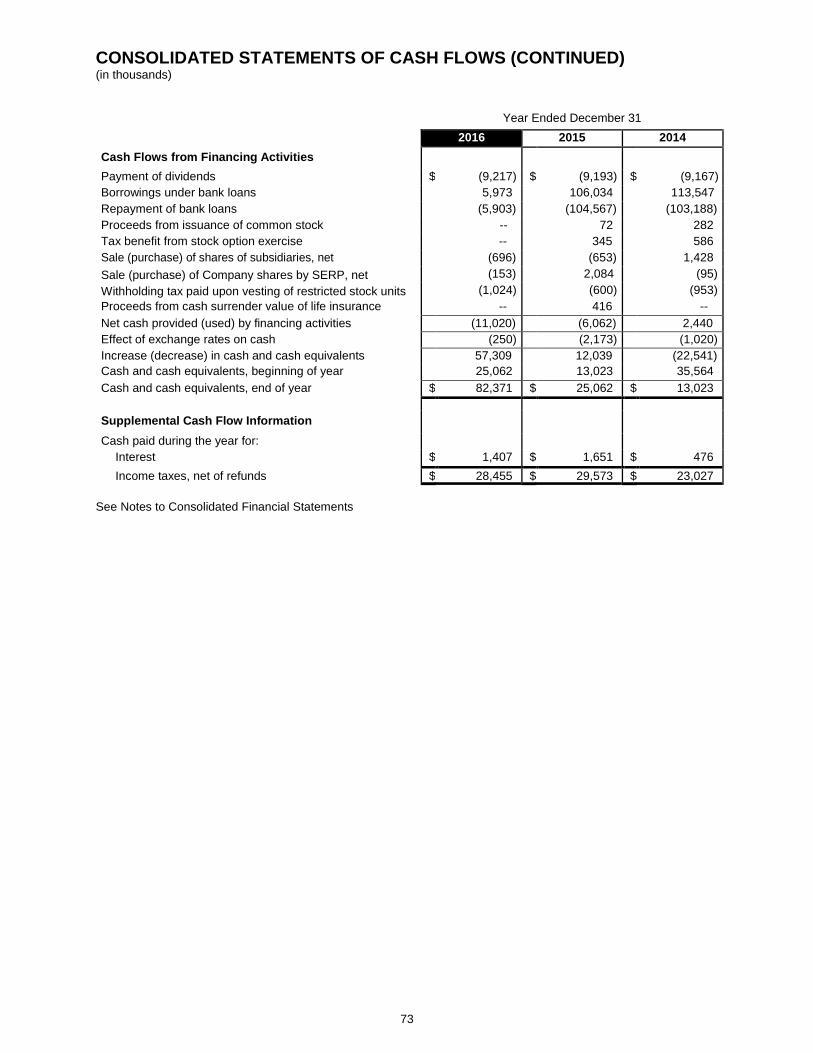
CONSOLIDATED STATEMENTS OF CASH FLOWS (CONTINUED) (in thousands)
73
Year Ended December 31
2016 2015 2014 Cash Flows from Financing Activities Payment of dividends $ (9,217) $ (9,193) $ (9,167) Borrowings under bank loans 5,973 106,034 113,547 Repayment of bank loans (5,903) (104,567) (103,188) Proceeds from issuance of common stock -- 72 282 Tax benefit from stock option exercise -- 345 586 Sale (purchase) of shares of subsidiaries, net (696) (653) 1,428 Sale (purchase) of Company shares by SERP, net (153) 2,084 (95) Withholding tax paid upon vesting of restricted stock units (1,024) (600) (953) Proceeds from cash surrender value of life insurance -- 416 -- Net cash provided (used) by financing activities (11,020) (6,062) 2,440 Effect of exchange rates on cash (250) (2,173) (1,020) Increase (decrease) in cash and cash equivalents 57,309 12,039 (22,541) Cash and cash equivalents, beginning of year 25,062 13,023 35,564 Cash and cash equivalents, end of year $ 82,371 $ 25,062 $ 13,023
Supplemental Cash Flow Information Cash paid during the year for:
Interest $ 1,407 $ 1,651 $ 476 Income taxes, net of refunds $ 28,455 $ 29,573 $ 23,027
See Notes to Consolidated Financial Statements
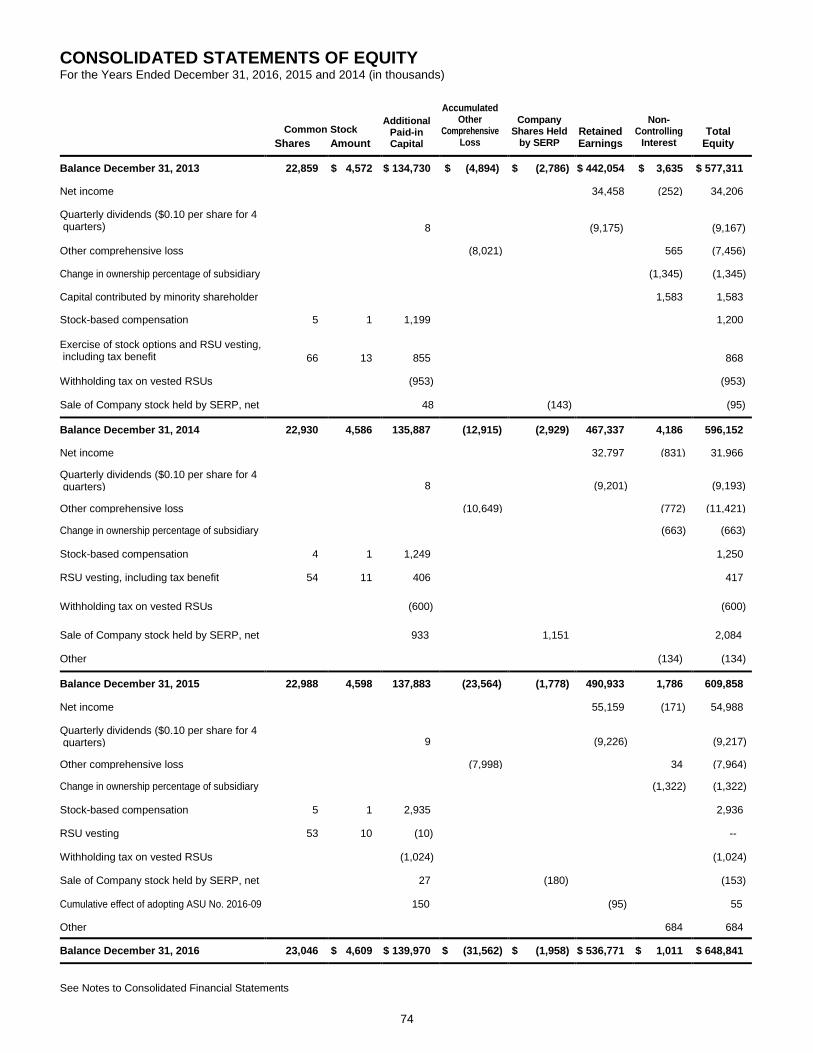
CONSOLIDATED STATEMENTS OF EQUITY For the Years Ended December 31, 2016, 2015 and 2014 (in thousands)
74
Shares
Amount
Additional
Paid-in Capital
Accumulated Other
Comprehensive Loss
Company
Shares Held by SERP
Retained Earnings
Non-
Controlling Interest
Total Equity
Balance December 31, 2013 22,859 $ 4,572 $ 134,730 $ (4,894) $ (2,786) $ 442,054 $ 3,635 $ 577,311
Net income 34,458 (252) 34,206
Quarterly dividends ($0.10 per share for 4 quarters) 8 (9,175) (9,167)
Other comprehensive loss (8,021) 565 (7,456)
Change in ownership percentage of subsidiary (1,345) (1,345)
Capital contributed by minority shareholder 1,583 1,583
Stock-based compensation 5 1 1,199 1,200
Exercise of stock options and RSU vesting, including tax benefit 66 13 855 868
Withholding tax on vested RSUs (953) (953)
Sale of Company stock held by SERP, net 48 (143) (95)
Balance December 31, 2014 22,930 4,586 135,887 (12,915) (2,929) 467,337 4,186 596,152
Net income 32,797 (831) 31,966
Quarterly dividends ($0.10 per share for 4 quarters) 8 (9,201) (9,193)
Other comprehensive loss (10,649) (772) (11,421)
Change in ownership percentage of subsidiary (663) (663)
Stock-based compensation 4 1 1,249 1,250
RSU vesting, including tax benefit 54 11 406 417
Withholding tax on vested RSUs (600) (600)
Sale of Company stock held by SERP, net 933 1,151 2,084
Other (134) (134)
Balance December 31, 2015 22,988 4,598 137,883 (23,564) (1,778) 490,933 1,786 609,858
Net income 55,159 (171) 54,988
Quarterly dividends ($0.10 per share for 4 quarters) 9 (9,226) (9,217)
Other comprehensive loss (7,998) 34 (7,964)
Change in ownership percentage of subsidiary (1,322) (1,322)
Stock-based compensation 5 1 2,935 2,936
RSU vesting 53 10 (10) --
Withholding tax on vested RSUs (1,024) (1,024)
Sale of Company stock held by SERP, net 27 (180) (153)
Cumulative effect of adopting ASU No. 2016-09 150 (95) 55
Other 684 684
Balance December 31, 2016 23,046 $ 4,609 $ 139,970 $ (31,562) $ (1,958) $ 536,771 $ 1,011 $ 648,841
See Notes to Consolidated Financial Statements
Common Stock

NOTES TO CONSOLIDATED FINANCIAL STATEMENTS (Dollar and share amounts in thousands, except per share amounts unless otherwise specified)
75
1. Summary of Significant Accounting Policies Basis of Presentation - The consolidated financial statements include the accounts of Astec Industries, Inc. and its domestic and foreign subsidiaries (the “Company”). The Company’s significant wholly-owned and consolidated subsidiaries at December 31, 2016 are as follows: Astec Australia Pty Ltd Astec do Brasil Fabricacao de Equipamentos Ltda. (92% owned) Astec, Inc. Astec Insurance Company Astec Mobile Machinery GmbH Astec Mobile Screens, Inc. Breaker Technology, Inc. Breaker Technology Ltd. Carlson Paving Products, Inc. CEI Enterprises, Inc. GEFCO, Inc. Heatec, Inc. Johnson Crushers International, Inc. Kolberg-Pioneer, Inc. Osborn Engineered Products SA (Pty) Ltd Peterson Pacific Corp. (99% owned) Power Flame Incorporated Roadtec, Inc. Telestack Limited Telsmith, Inc. All intercompany accounts and transactions have been eliminated in consolidation. Use of Estimates - The preparation of financial statements in conformity with U.S. generally accepted accounting principles requires management to make estimates and assumptions that affect the amounts reported and disclosed in the financial statements and accompanying notes. Actual results could differ from those estimates. Foreign Currency Translation - Subsidiaries located in Australia, Brazil, Canada, Germany, Northern Ireland, and South Africa operate primarily using local functional currencies. Accordingly, assets and liabilities of these subsidiaries are translated using exchange rates in effect at the end of the period, and revenues and costs are translated using average exchange rates for the period. The resulting adjustments are presented as a separate component of accumulated other comprehensive loss. Foreign currency transaction gains and losses, net are included in cost of sales and amounted to losses of $246, $1,377 and $1,971 in 2016, 2015 and 2014, respectively. Fair Value of Financial Instruments - For cash and cash equivalents, trade receivables, other receivables, revolving debt and accounts payable, the carrying amount approximates the fair value because of the short-term nature of those instruments. Trading equity investments are valued at their estimated fair value based on their quoted market prices and debt securities are valued based upon a mix of observable market prices and model driven prices derived from a matrix of observable market prices for assets with similar characteristics obtained from a nationally recognized third party pricing service. Financial assets and liabilities are categorized as of the end of each reporting period based upon the level of judgment associated with the inputs used to measure their fair value. The inputs used to measure the fair value are identified in the following hierarchy:
Level 1 - Unadjusted quoted prices in active markets for identical assets or liabilities. Level 2 - Unadjusted quoted prices in active markets for similar assets or liabilities; or
unadjusted quoted prices for identical or similar assets or liabilities in markets that are not active; or inputs other than quoted prices that are observable for the asset or liability.
Level 3 - Inputs reflect management’s best estimate of what market participants would
use in pricing the asset or liability at the measurement date. Consideration is given to the risk inherent in the valuation technique and the risk inherent in the inputs to the model.
All financial assets and liabilities held by the Company at December 31, 2016 and 2015 are classified as Level 1 or Level 2, as summarized in Note 3, Fair Value Measurements. Cash and Cash Equivalents - All highly liquid investments with an original maturity of three months or less when purchased are considered to be cash and cash equivalents.
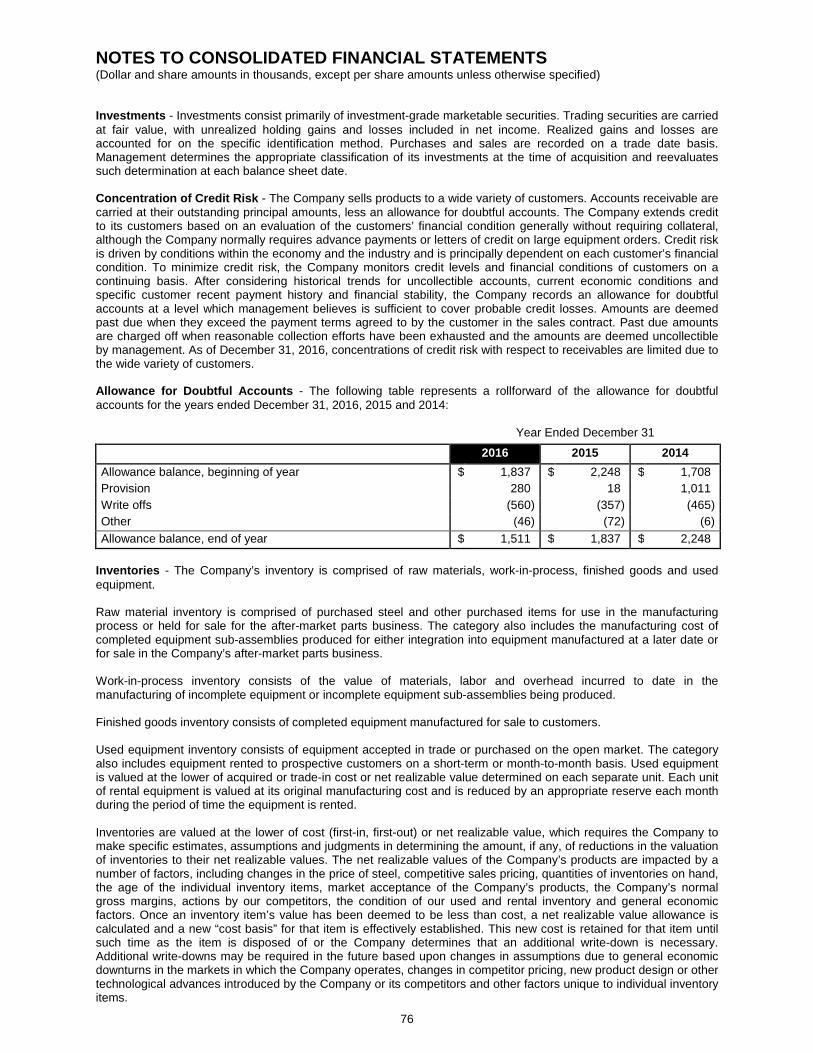
NOTES TO CONSOLIDATED FINANCIAL STATEMENTS (Dollar and share amounts in thousands, except per share amounts unless otherwise specified)
76
Investments - Investments consist primarily of investment-grade marketable securities. Trading securities are carried at fair value, with unrealized holding gains and losses included in net income. Realized gains and losses are accounted for on the specific identification method. Purchases and sales are recorded on a trade date basis. Management determines the appropriate classification of its investments at the time of acquisition and reevaluates such determination at each balance sheet date. Concentration of Credit Risk - The Company sells products to a wide variety of customers. Accounts receivable are carried at their outstanding principal amounts, less an allowance for doubtful accounts. The Company extends credit to its customers based on an evaluation of the customers’ financial condition generally without requiring collateral, although the Company normally requires advance payments or letters of credit on large equipment orders. Credit risk is driven by conditions within the economy and the industry and is principally dependent on each customer’s financial condition. To minimize credit risk, the Company monitors credit levels and financial conditions of customers on a continuing basis. After considering historical trends for uncollectible accounts, current economic conditions and specific customer recent payment history and financial stability, the Company records an allowance for doubtful accounts at a level which management believes is sufficient to cover probable credit losses. Amounts are deemed past due when they exceed the payment terms agreed to by the customer in the sales contract. Past due amounts are charged off when reasonable collection efforts have been exhausted and the amounts are deemed uncollectible by management. As of December 31, 2016, concentrations of credit risk with respect to receivables are limited due to the wide variety of customers. Allowance for Doubtful Accounts - The following table represents a rollforward of the allowance for doubtful accounts for the years ended December 31, 2016, 2015 and 2014: Year Ended December 31
2016 2015 2014 Allowance balance, beginning of year $ 1,837 $ 2,248 $ 1,708 Provision 280 18 1,011 Write offs (560) (357) (465) Other (46) (72) (6) Allowance balance, end of year $ 1,511 $ 1,837 $ 2,248
Inventories - The Company’s inventory is comprised of raw materials, work-in-process, finished goods and used equipment. Raw material inventory is comprised of purchased steel and other purchased items for use in the manufacturing process or held for sale for the after-market parts business. The category also includes the manufacturing cost of completed equipment sub-assemblies produced for either integration into equipment manufactured at a later date or for sale in the Company’s after-market parts business. Work-in-process inventory consists of the value of materials, labor and overhead incurred to date in the manufacturing of incomplete equipment or incomplete equipment sub-assemblies being produced. Finished goods inventory consists of completed equipment manufactured for sale to customers. Used equipment inventory consists of equipment accepted in trade or purchased on the open market. The category also includes equipment rented to prospective customers on a short-term or month-to-month basis. Used equipment is valued at the lower of acquired or trade-in cost or net realizable value determined on each separate unit. Each unit of rental equipment is valued at its original manufacturing cost and is reduced by an appropriate reserve each month during the period of time the equipment is rented. Inventories are valued at the lower of cost (first-in, first-out) or net realizable value, which requires the Company to make specific estimates, assumptions and judgments in determining the amount, if any, of reductions in the valuation of inventories to their net realizable values. The net realizable values of the Company’s products are impacted by a number of factors, including changes in the price of steel, competitive sales pricing, quantities of inventories on hand, the age of the individual inventory items, market acceptance of the Company’s products, the Company’s normal gross margins, actions by our competitors, the condition of our used and rental inventory and general economic factors. Once an inventory item’s value has been deemed to be less than cost, a net realizable value allowance is calculated and a new “cost basis” for that item is effectively established. This new cost is retained for that item until such time as the item is disposed of or the Company determines that an additional write-down is necessary. Additional write-downs may be required in the future based upon changes in assumptions due to general economic downturns in the markets in which the Company operates, changes in competitor pricing, new product design or other technological advances introduced by the Company or its competitors and other factors unique to individual inventory items.
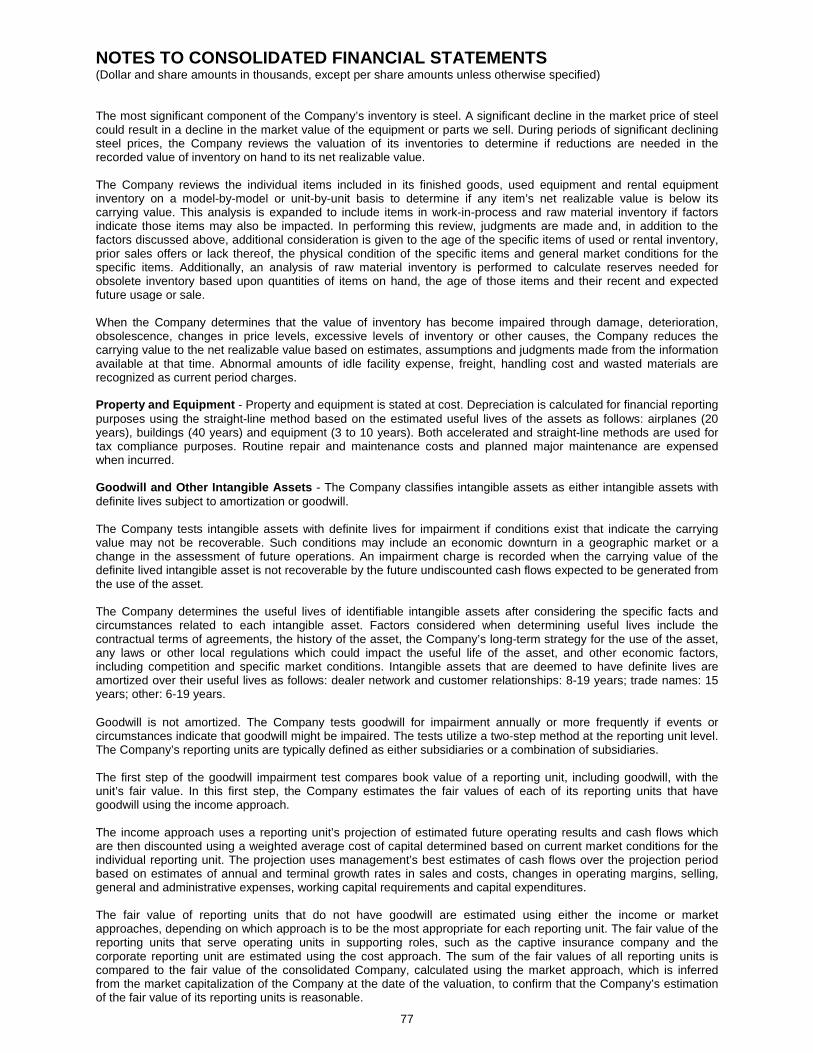
NOTES TO CONSOLIDATED FINANCIAL STATEMENTS (Dollar and share amounts in thousands, except per share amounts unless otherwise specified)
77
The most significant component of the Company’s inventory is steel. A significant decline in the market price of steel could result in a decline in the market value of the equipment or parts we sell. During periods of significant declining steel prices, the Company reviews the valuation of its inventories to determine if reductions are needed in the recorded value of inventory on hand to its net realizable value. The Company reviews the individual items included in its finished goods, used equipment and rental equipment inventory on a model-by-model or unit-by-unit basis to determine if any item’s net realizable value is below its carrying value. This analysis is expanded to include items in work-in-process and raw material inventory if factors indicate those items may also be impacted. In performing this review, judgments are made and, in addition to the factors discussed above, additional consideration is given to the age of the specific items of used or rental inventory, prior sales offers or lack thereof, the physical condition of the specific items and general market conditions for the specific items. Additionally, an analysis of raw material inventory is performed to calculate reserves needed for obsolete inventory based upon quantities of items on hand, the age of those items and their recent and expected future usage or sale. When the Company determines that the value of inventory has become impaired through damage, deterioration, obsolescence, changes in price levels, excessive levels of inventory or other causes, the Company reduces the carrying value to the net realizable value based on estimates, assumptions and judgments made from the information available at that time. Abnormal amounts of idle facility expense, freight, handling cost and wasted materials are recognized as current period charges. Property and Equipment - Property and equipment is stated at cost. Depreciation is calculated for financial reporting purposes using the straight-line method based on the estimated useful lives of the assets as follows: airplanes (20 years), buildings (40 years) and equipment (3 to 10 years). Both accelerated and straight-line methods are used for tax compliance purposes. Routine repair and maintenance costs and planned major maintenance are expensed when incurred. Goodwill and Other Intangible Assets - The Company classifies intangible assets as either intangible assets with definite lives subject to amortization or goodwill. The Company tests intangible assets with definite lives for impairment if conditions exist that indicate the carrying value may not be recoverable. Such conditions may include an economic downturn in a geographic market or a change in the assessment of future operations. An impairment charge is recorded when the carrying value of the definite lived intangible asset is not recoverable by the future undiscounted cash flows expected to be generated from the use of the asset. The Company determines the useful lives of identifiable intangible assets after considering the specific facts and circumstances related to each intangible asset. Factors considered when determining useful lives include the contractual terms of agreements, the history of the asset, the Company’s long-term strategy for the use of the asset, any laws or other local regulations which could impact the useful life of the asset, and other economic factors, including competition and specific market conditions. Intangible assets that are deemed to have definite lives are amortized over their useful lives as follows: dealer network and customer relationships: 8-19 years; trade names: 15 years; other: 6-19 years. Goodwill is not amortized. The Company tests goodwill for impairment annually or more frequently if events or circumstances indicate that goodwill might be impaired. The tests utilize a two-step method at the reporting unit level. The Company’s reporting units are typically defined as either subsidiaries or a combination of subsidiaries. The first step of the goodwill impairment test compares book value of a reporting unit, including goodwill, with the unit’s fair value. In this first step, the Company estimates the fair values of each of its reporting units that have goodwill using the income approach. The income approach uses a reporting unit’s projection of estimated future operating results and cash flows which are then discounted using a weighted average cost of capital determined based on current market conditions for the individual reporting unit. The projection uses management’s best estimates of cash flows over the projection period based on estimates of annual and terminal growth rates in sales and costs, changes in operating margins, selling, general and administrative expenses, working capital requirements and capital expenditures. The fair value of reporting units that do not have goodwill are estimated using either the income or market approaches, depending on which approach is to be the most appropriate for each reporting unit. The fair value of the reporting units that serve operating units in supporting roles, such as the captive insurance company and the corporate reporting unit are estimated using the cost approach. The sum of the fair values of all reporting units is compared to the fair value of the consolidated Company, calculated using the market approach, which is inferred from the market capitalization of the Company at the date of the valuation, to confirm that the Company’s estimation of the fair value of its reporting units is reasonable.
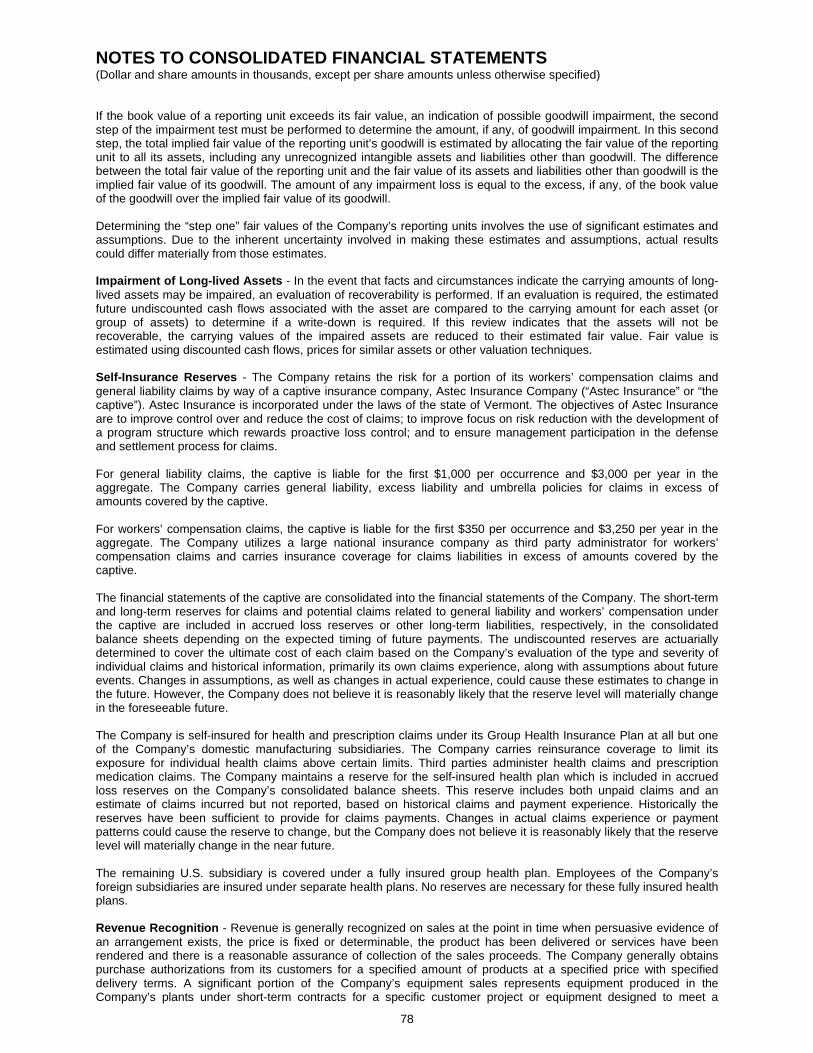
NOTES TO CONSOLIDATED FINANCIAL STATEMENTS (Dollar and share amounts in thousands, except per share amounts unless otherwise specified)
78
If the book value of a reporting unit exceeds its fair value, an indication of possible goodwill impairment, the second step of the impairment test must be performed to determine the amount, if any, of goodwill impairment. In this second step, the total implied fair value of the reporting unit’s goodwill is estimated by allocating the fair value of the reporting unit to all its assets, including any unrecognized intangible assets and liabilities other than goodwill. The difference between the total fair value of the reporting unit and the fair value of its assets and liabilities other than goodwill is the implied fair value of its goodwill. The amount of any impairment loss is equal to the excess, if any, of the book value of the goodwill over the implied fair value of its goodwill. Determining the “step one” fair values of the Company’s reporting units involves the use of significant estimates and assumptions. Due to the inherent uncertainty involved in making these estimates and assumptions, actual results could differ materially from those estimates. Impairment of Long-lived Assets - In the event that facts and circumstances indicate the carrying amounts of long-lived assets may be impaired, an evaluation of recoverability is performed. If an evaluation is required, the estimated future undiscounted cash flows associated with the asset are compared to the carrying amount for each asset (or group of assets) to determine if a write-down is required. If this review indicates that the assets will not be recoverable, the carrying values of the impaired assets are reduced to their estimated fair value. Fair value is estimated using discounted cash flows, prices for similar assets or other valuation techniques. Self-Insurance Reserves - The Company retains the risk for a portion of its workers’ compensation claims and general liability claims by way of a captive insurance company, Astec Insurance Company (“Astec Insurance” or “the captive”). Astec Insurance is incorporated under the laws of the state of Vermont. The objectives of Astec Insurance are to improve control over and reduce the cost of claims; to improve focus on risk reduction with the development of a program structure which rewards proactive loss control; and to ensure management participation in the defense and settlement process for claims. For general liability claims, the captive is liable for the first $1,000 per occurrence and $3,000 per year in the aggregate. The Company carries general liability, excess liability and umbrella policies for claims in excess of amounts covered by the captive. For workers’ compensation claims, the captive is liable for the first $350 per occurrence and $3,250 per year in the aggregate. The Company utilizes a large national insurance company as third party administrator for workers’ compensation claims and carries insurance coverage for claims liabilities in excess of amounts covered by the captive. The financial statements of the captive are consolidated into the financial statements of the Company. The short-term and long-term reserves for claims and potential claims related to general liability and workers’ compensation under the captive are included in accrued loss reserves or other long-term liabilities, respectively, in the consolidated balance sheets depending on the expected timing of future payments. The undiscounted reserves are actuarially determined to cover the ultimate cost of each claim based on the Company’s evaluation of the type and severity of individual claims and historical information, primarily its own claims experience, along with assumptions about future events. Changes in assumptions, as well as changes in actual experience, could cause these estimates to change in the future. However, the Company does not believe it is reasonably likely that the reserve level will materially change in the foreseeable future. The Company is self-insured for health and prescription claims under its Group Health Insurance Plan at all but one of the Company’s domestic manufacturing subsidiaries. The Company carries reinsurance coverage to limit its exposure for individual health claims above certain limits. Third parties administer health claims and prescription medication claims. The Company maintains a reserve for the self-insured health plan which is included in accrued loss reserves on the Company’s consolidated balance sheets. This reserve includes both unpaid claims and an estimate of claims incurred but not reported, based on historical claims and payment experience. Historically the reserves have been sufficient to provide for claims payments. Changes in actual claims experience or payment patterns could cause the reserve to change, but the Company does not believe it is reasonably likely that the reserve level will materially change in the near future. The remaining U.S. subsidiary is covered under a fully insured group health plan. Employees of the Company’s foreign subsidiaries are insured under separate health plans. No reserves are necessary for these fully insured health plans. Revenue Recognition - Revenue is generally recognized on sales at the point in time when persuasive evidence of an arrangement exists, the price is fixed or determinable, the product has been delivered or services have been rendered and there is a reasonable assurance of collection of the sales proceeds. The Company generally obtains purchase authorizations from its customers for a specified amount of products at a specified price with specified delivery terms. A significant portion of the Company’s equipment sales represents equipment produced in the Company’s plants under short-term contracts for a specific customer project or equipment designed to meet a
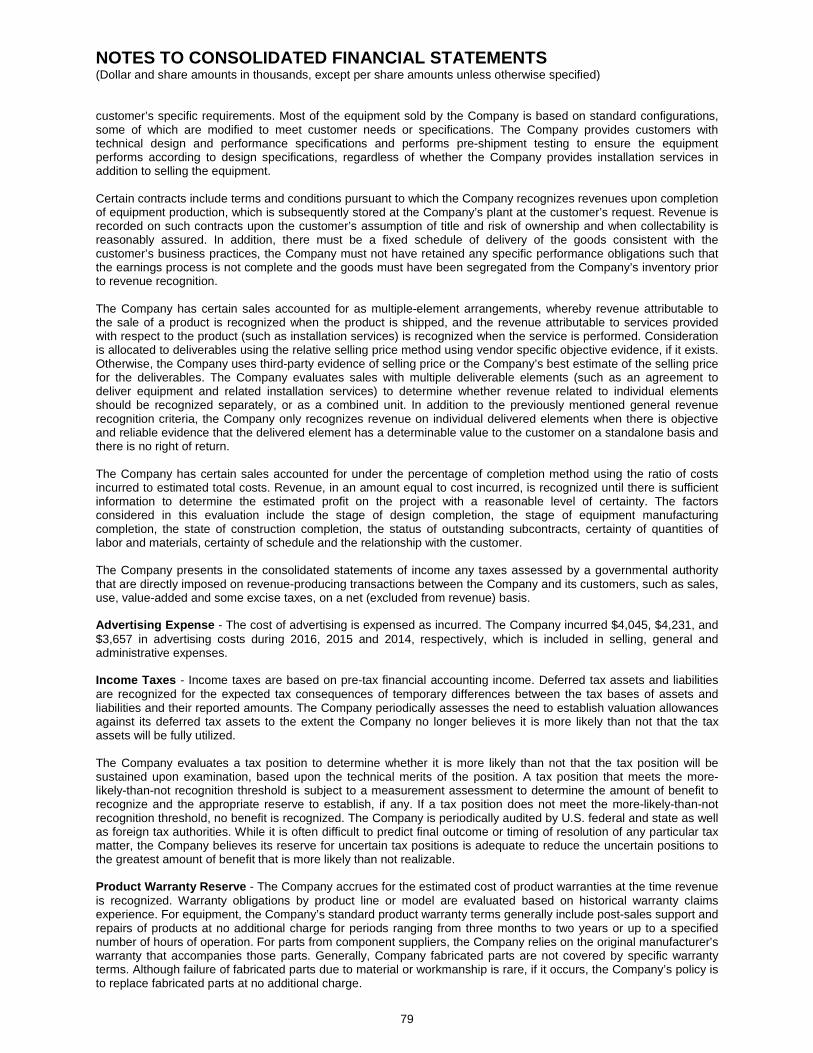
NOTES TO CONSOLIDATED FINANCIAL STATEMENTS (Dollar and share amounts in thousands, except per share amounts unless otherwise specified)
79
customer’s specific requirements. Most of the equipment sold by the Company is based on standard configurations, some of which are modified to meet customer needs or specifications. The Company provides customers with technical design and performance specifications and performs pre-shipment testing to ensure the equipment performs according to design specifications, regardless of whether the Company provides installation services in addition to selling the equipment. Certain contracts include terms and conditions pursuant to which the Company recognizes revenues upon completion of equipment production, which is subsequently stored at the Company’s plant at the customer’s request. Revenue is recorded on such contracts upon the customer’s assumption of title and risk of ownership and when collectability is reasonably assured. In addition, there must be a fixed schedule of delivery of the goods consistent with the customer’s business practices, the Company must not have retained any specific performance obligations such that the earnings process is not complete and the goods must have been segregated from the Company’s inventory prior to revenue recognition. The Company has certain sales accounted for as multiple-element arrangements, whereby revenue attributable to the sale of a product is recognized when the product is shipped, and the revenue attributable to services provided with respect to the product (such as installation services) is recognized when the service is performed. Consideration is allocated to deliverables using the relative selling price method using vendor specific objective evidence, if it exists. Otherwise, the Company uses third-party evidence of selling price or the Company’s best estimate of the selling price for the deliverables. The Company evaluates sales with multiple deliverable elements (such as an agreement to deliver equipment and related installation services) to determine whether revenue related to individual elements should be recognized separately, or as a combined unit. In addition to the previously mentioned general revenue recognition criteria, the Company only recognizes revenue on individual delivered elements when there is objective and reliable evidence that the delivered element has a determinable value to the customer on a standalone basis and there is no right of return. The Company has certain sales accounted for under the percentage of completion method using the ratio of costs incurred to estimated total costs. Revenue, in an amount equal to cost incurred, is recognized until there is sufficient information to determine the estimated profit on the project with a reasonable level of certainty. The factors considered in this evaluation include the stage of design completion, the stage of equipment manufacturing completion, the state of construction completion, the status of outstanding subcontracts, certainty of quantities of labor and materials, certainty of schedule and the relationship with the customer. The Company presents in the consolidated statements of income any taxes assessed by a governmental authority that are directly imposed on revenue-producing transactions between the Company and its customers, such as sales, use, value-added and some excise taxes, on a net (excluded from revenue) basis. Advertising Expense - The cost of advertising is expensed as incurred. The Company incurred $4,045, $4,231, and $3,657 in advertising costs during 2016, 2015 and 2014, respectively, which is included in selling, general and administrative expenses. Income Taxes - Income taxes are based on pre-tax financial accounting income. Deferred tax assets and liabilities are recognized for the expected tax consequences of temporary differences between the tax bases of assets and liabilities and their reported amounts. The Company periodically assesses the need to establish valuation allowances against its deferred tax assets to the extent the Company no longer believes it is more likely than not that the tax assets will be fully utilized. The Company evaluates a tax position to determine whether it is more likely than not that the tax position will be sustained upon examination, based upon the technical merits of the position. A tax position that meets the more-likely-than-not recognition threshold is subject to a measurement assessment to determine the amount of benefit to recognize and the appropriate reserve to establish, if any. If a tax position does not meet the more-likely-than-not recognition threshold, no benefit is recognized. The Company is periodically audited by U.S. federal and state as well as foreign tax authorities. While it is often difficult to predict final outcome or timing of resolution of any particular tax matter, the Company believes its reserve for uncertain tax positions is adequate to reduce the uncertain positions to the greatest amount of benefit that is more likely than not realizable. Product Warranty Reserve - The Company accrues for the estimated cost of product warranties at the time revenue is recognized. Warranty obligations by product line or model are evaluated based on historical warranty claims experience. For equipment, the Company’s standard product warranty terms generally include post-sales support and repairs of products at no additional charge for periods ranging from three months to two years or up to a specified number of hours of operation. For parts from component suppliers, the Company relies on the original manufacturer’s warranty that accompanies those parts. Generally, Company fabricated parts are not covered by specific warranty terms. Although failure of fabricated parts due to material or workmanship is rare, if it occurs, the Company’s policy is to replace fabricated parts at no additional charge.

NOTES TO CONSOLIDATED FINANCIAL STATEMENTS (Dollar and share amounts in thousands, except per share amounts unless otherwise specified)
80
The Company engages in extensive product quality programs and processes, including actively monitoring and evaluating the quality of our component suppliers. Estimated warranty obligations are based upon warranty terms, product failure rates, repair costs and current period machine shipments. If actual product failure rates, repair costs, service delivery costs or post-sales support costs differ from our estimates, revisions to the estimated warranty liability may be required. Pension and Retirement Plans - The determination of obligations and expenses under the Company’s pension plan is dependent on the Company’s selection of certain assumptions used by independent actuaries in calculating such amounts. Those assumptions are described in Note 12, Pension and Retirement Plans and include among others, the discount rate, expected return on plan assets and the expected mortality rates. In accordance with U.S. generally accepted accounting principles, actual results that differ from assumptions are accumulated and amortized over future periods and, therefore, generally affect the recognized expense in such periods. Significant differences in actual experience or significant changes in the assumptions used may materially affect the pension obligations and future expenses. The Company recognizes the overfunded or underfunded status of its pension plan as an asset or liability. Actuarial gains and losses, amortization of prior service cost (credit) and amortization of transition obligations are recognized through other comprehensive income in the year in which the changes occur. The Company measures the funded status of its pension plan as of the date of the Company’s fiscal year-end. Stock-based Compensation - The Company recognizes the cost of employee services received in exchange for equity awards in the financial statements based on the grant date calculated fair value of the awards. The Company recognizes stock-based compensation expense over the period during which an employee is required to provide service in exchange for the award (the vesting period). The Company’s equity awards are further described in Note 16, Shareholders’ Equity. Earnings Per Share - Basic earnings per share is based on the weighted average number of common shares outstanding and diluted earnings per share includes potential dilutive effects of restricted stock units and shares held in the Company’s supplemental executive retirement plan. The following table sets forth a reconciliation of the number of shares used in the computation of basic and diluted earnings per share: Year Ended December 31
2016 2015 2014 Denominator:
Denominator for basic earnings per share 22,992 22,934 22,819 Effect of dilutive securities:
Employee stock options and restricted stock units 85 123 176 Supplemental executive retirement plan 65 63 110
Denominator for diluted earnings per share 23,142 23,120 23,105 Antidilutive options were not included in the diluted earnings per share computation for the years presented. The number of antidilutive options in each of the three years ended December 31, 2016 was not material. Derivatives and Hedging Activities - The Company recognizes all derivatives in the consolidated balance sheets at their fair value. Derivatives that are not hedges are adjusted to fair value through income. If the derivative is a hedge, depending on the nature of the hedge, changes in the fair value of derivatives are either offset against the change in fair value of assets, liabilities, or firm commitments through income or recognized in other comprehensive income until the hedged item is recognized in income. The ineffective portion of a derivative’s change in fair value is immediately recognized in income. From time to time the Company’s foreign subsidiaries enter into foreign currency exchange contracts to mitigate exposure to fluctuation in currency exchange rates. See Note 13, Derivative Financial Instruments, regarding foreign exchange contracts outstanding at December 31, 2016 and 2015. Shipping and Handling Fees and Cost - The Company records revenues earned for shipping and handling as revenue, while the cost of shipping and handling is classified as cost of goods sold. Business Combinations - The Company accounts for business combinations using the acquisition method. Accordingly, intangible assets are recorded apart from goodwill if they arise from contractual or legal rights or if they are separable from goodwill. Related third party acquisition costs are expensed as incurred and contingent consideration is booked at its fair value as part of the purchase price.

NOTES TO CONSOLIDATED FINANCIAL STATEMENTS (Dollar and share amounts in thousands, except per share amounts unless otherwise specified)
81
Subsequent Events Review - Management has evaluated events occurring between December 31, 2016 and the date these consolidated financial statements were filed with the Securities and Exchange Commission for proper recording or disclosure therein. Recent Accounting Pronouncements - In May 2014, the Financial Accounting Standards Board (‘FASB”) issued Accounting Standards Update (“ASU”) No. 2014-09, "Revenue from Contracts with Customers", which supersedes existing revenue guidance under U.S. GAAP. The standard's core principle is that a company will recognize revenue when it transfers promised goods or services to customers in an amount that reflects the consideration to which the company expects to be entitled in exchange for those goods or services. The implementation of this new standard will require companies to use more judgment and to make more estimates than under current guidance. The standard, as amended, is effective for public companies for annual periods beginning after December 15, 2017. The Company plans to adopt the new standard effective January 1, 2018. Due to the decentralized structure of the Company, Corporate management requested documented revenue streams from its’ 16 manufacturing subsidiaries to assist in its effort to determine the effect the new standard will have on its financial reporting. A meeting was also held in September 2016 with corporate management, controllers of the manufacturing subsidiaries, and an outside revenue expert to further review the Company’s various revenue streams and the change in timing of when revenue may be recognized under the new guidance. The Company is still in the process of finalizing this review. Therefore, the Company has not yet determined the extent of the impact adoption of this new standard will have on the Company's financial position or results of operations. In July 2015, the FASB issued ASU No. 2015-11, "Inventory (Topic 330): Simplifying the Measurement of Inventory", which changes the measurement basis for inventory from the lower of cost or market to lower of cost and net realizable value and also eliminates the requirement for companies to consider replacement cost or net realizable value less an approximate normal profit margin when determining the recorded value of inventory. The standard is effective for public companies in fiscal years beginning after December 15, 2016. The Company early adopted the standard effective October 1, 2016. In January 2016, the FASB issued ASU No. 2016-01, “Financial Instruments - Overall (Subtopic 825-10)”, which requires, among other things, equity investments with readily determinable fair values, except those accounted for under the equity method of accounting or those that result in consolidation of the investee, to be measured at fair value with changes in fair value recognized in net income. The standard is effective for public companies in fiscal years beginning after December 15, 2017, and the Company expects to adopt the standard effective January 1, 2018. The Company has not yet determined what impact, if any, the adoption of this new standard will have on the Company's financial position or results of operations. In February 2016, the FASB issued ASU No. 2016-02, “Leases (Topic 842)”, which significantly changes the accounting for operating leases by lessees. The accounting applied by lessors is largely unchanged from that applied under previous guidance. The new guidance requires lessees to recognize lease assets and lease liabilities in the balance sheet, initially measured at the present value of the lease payments, for leases which were classified as operating leases under previous guidance. Lease cost included in the statement of income will be calculated so that the cost of the lease is allocated over the lease term, generally on a straight-line basis. Lessees may make an accounting policy election to exclude leases with a term of 12 months or less from the requirement to record related assets and liabilities. The new standard is effective for public companies for fiscal years beginning after December 15, 2018. The Company plans to adopt the new standard effective January 1, 2019. The Company does not expect the adoption of this standard to have a material impact on its results of operations; however, the Company has not determined the impact the adoption of this new standard will have on its financial position. In March 2016, the FASB issued ASU No. 2016-08, “Revenue from Contracts with Customers (Topic 606)”, which does not change the core principles of ASU No. 2014-09 discussed above, but rather clarifies the implementation guidance in order to eliminate the potential for diversity in practice arising from inconsistent application of the principal versus agent guidance. Under the new guidance, when an entity determines it is a principal in a transaction, the entity recognizes revenue in the gross amount of consideration; however in transactions where an entity determines it in an agent, the entity recognizes revenue in the amount of any fee or commission to which it expects to be entitled. The standard is effective for public companies for annual periods beginning after December 15, 2017. The Company plans to adopt the new standard effective January 1, 2018. The Company has not yet determined what impact, if any, the adoption of this new standard will have on the Company's financial position or results of operations. In March 2016, the FASB issued ASU No. 2016-09, “Compensation - Stock Compensation (Topic 718)”, as part of its Simplification Initiative. The standard’s provisions impact several aspects of the accounting for share-based payment transactions, including the income tax consequences, classification of awards as either equity or liabilities and classification in the statement of cash flows. The standard is effective for public companies for annual periods beginning after December 15, 2016, with early adoption permitted. The Company adopted the new standard effective January 1, 2016 and has recorded a cumulative effect adjustment in retained earnings as of January 1, 2016 of $95, net of tax, related to the adoption of the new provisions allowing for restricted stock unit forfeitures to be accounted for at the time they occur as opposed to being estimated during the vesting period. Additionally, income tax benefits

NOTES TO CONSOLIDATED FINANCIAL STATEMENTS (Dollar and share amounts in thousands, except per share amounts unless otherwise specified)
82
of $220, which would have been recorded in additional paid-in capital under prior guidance, have been recorded in 2016 consolidated income related to excess tax benefits resulting from the vesting of restricted stock units in 2016. As allowed under the provision’s guidelines, amounts for 2015 have not been restated in the accompanying financial statements. In June 2016, the FASB issued ASU No. 2016-13, “Financial Instruments – Credit Losses (Topic 326), Measurement of Credit Losses on Financial Instruments”. The standard changes how credit losses are measured for most financial assets and certain other instruments that currently are not measured through net income. The standard will require an expected loss model for instruments measured at amortized cost as opposed to the current incurred loss approach. In valuing available for sale debt securities, allowances will be required to be recorded, rather than the current approach of reducing the carrying amount, for other than temporary impairments. A cumulative adjustment to retained earnings is to be recorded as of the beginning of the period of adoption to reflect the impact of applying the provisions of the standard. The standard is effective for public companies for periods beginning after December 15, 2019 and the Company expects to adopt the new standard as of January 1, 2020. The Company has not yet determined what impact, if any, the adoption of this new standard will have on the Company's financial position or results of operations. In August 2016, the FASB issued ASU No. 2016-15, “Classification of Certain Cash Receipts and Cash Payments (a consensus of the Emerging Issues Task Force)” which clarifies how certain cash receipts and cash payments should be presented on the statement of cash flows. The statement also addresses how the predominance principle should be applied when cash payments have aspects of more than one class of cash flows. The standard is effective for public companies in fiscal years beginning after December 15, 2017, and the Company expects to adopt the standard effective January 1, 2018. The Company has not determined the impact, if any, the adoption of this new standard will have on the Company's statement of cash flows. In October 2016, the FASB issued ASU No. 2016-16, “Intra-Entity Transfers of Assets Other Than Inventory” which requires companies to account for the income tax effects of intercompany sales and transfers of assets other than inventory, such as intangible assets, when the transfer occurs. This is a change from current guidance, which requires companies to defer the income tax effects of intercompany transfers of assets until the asset has been sold to an outside party or otherwise recognized by being depreciated, amortized, or impaired. The new guidance will require companies to defer the income tax effects of only intercompany transfers of inventory. The standard is effective for public companies in fiscal years beginning after December 15, 2018. Early adoption is permitted as of the beginning of an annual period and requires companies to apply a modified retrospective approach. The Company plans to adopt the new standard effective January 1, 2019. The Company has not yet determined what impact the adoption of this new standard will have on the Company's financial position or results of operations. 2. Inventories Inventories consist of the following: December 31
2016 2015 Raw materials and parts $ 137,763 $ 141,967 Work-in-process 115,613 113,859 Finished goods 84,898 104,879 Used equipment 22,130 24,071 Total $ 360,404 $ 384,776
3. Fair Value Measurements The Company has various financial instruments that must be measured at fair value on a recurring basis, including marketable debt and equity securities held by Astec Insurance, and marketable equity securities held in an unqualified Supplemental Executive Retirement Plan (“SERP”). The financial assets held in the SERP also constitute a liability of the Company for financial reporting purposes. The Company’s subsidiaries also occasionally enter into foreign currency exchange contracts to mitigate exposure to fluctuations in currency exchange rates. For cash and cash equivalents, trade receivables, other receivables, revolving debt and accounts payable, the carrying amount approximates the fair value because of the short-term nature of these instruments. Investments are carried at their fair value based on quoted market prices for identical or similar assets or, where no quoted prices exist, other observable inputs for the asset. The fair values of foreign currency exchange contracts are based on quotations from various banks for similar instruments using models with market based inputs.
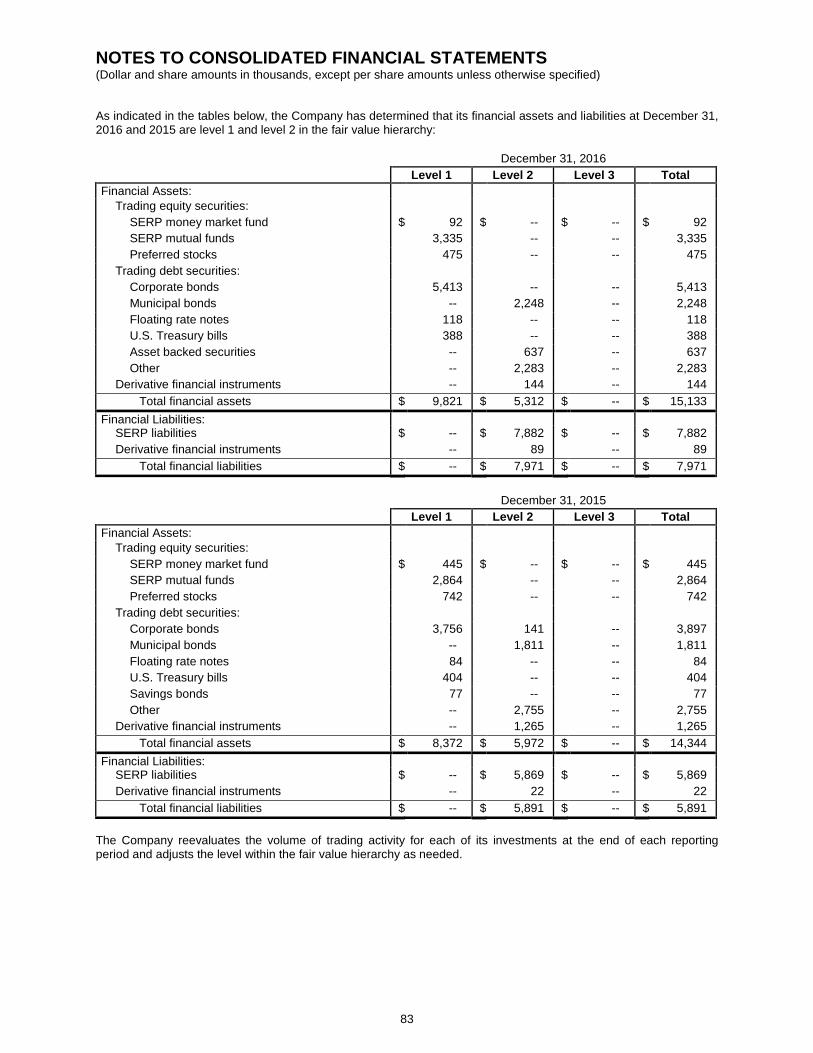
NOTES TO CONSOLIDATED FINANCIAL STATEMENTS (Dollar and share amounts in thousands, except per share amounts unless otherwise specified)
83
As indicated in the tables below, the Company has determined that its financial assets and liabilities at December 31, 2016 and 2015 are level 1 and level 2 in the fair value hierarchy: December 31, 2016 Level 1 Level 2 Level 3 Total Financial Assets:
Trading equity securities: SERP money market fund $ 92 $ -- $ -- $ 92 SERP mutual funds 3,335 -- -- 3,335 Preferred stocks 475 -- -- 475
Trading debt securities: Corporate bonds 5,413 -- -- 5,413 Municipal bonds -- 2,248 -- 2,248 Floating rate notes 118 -- -- 118 U.S. Treasury bills 388 -- -- 388 Asset backed securities -- 637 -- 637 Other -- 2,283 -- 2,283
Derivative financial instruments -- 144 -- 144 Total financial assets $ 9,821 $ 5,312 $ -- $ 15,133
Financial Liabilities: SERP liabilities $ -- $ 7,882 $ -- $ 7,882 Derivative financial instruments -- 89 -- 89
Total financial liabilities $ -- $ 7,971 $ -- $ 7,971 December 31, 2015 Level 1 Level 2 Level 3 Total Financial Assets:
Trading equity securities: SERP money market fund $ 445 $ -- $ -- $ 445 SERP mutual funds 2,864 -- -- 2,864 Preferred stocks 742 -- -- 742
Trading debt securities: Corporate bonds 3,756 141 -- 3,897 Municipal bonds -- 1,811 -- 1,811 Floating rate notes 84 -- -- 84 U.S. Treasury bills 404 -- -- 404 Savings bonds 77 -- -- 77 Other -- 2,755 -- 2,755
Derivative financial instruments -- 1,265 -- 1,265 Total financial assets $ 8,372 $ 5,972 $ -- $ 14,344
Financial Liabilities: SERP liabilities $ -- $ 5,869 $ -- $ 5,869 Derivative financial instruments -- 22 -- 22
Total financial liabilities $ -- $ 5,891 $ -- $ 5,891 The Company reevaluates the volume of trading activity for each of its investments at the end of each reporting period and adjusts the level within the fair value hierarchy as needed.
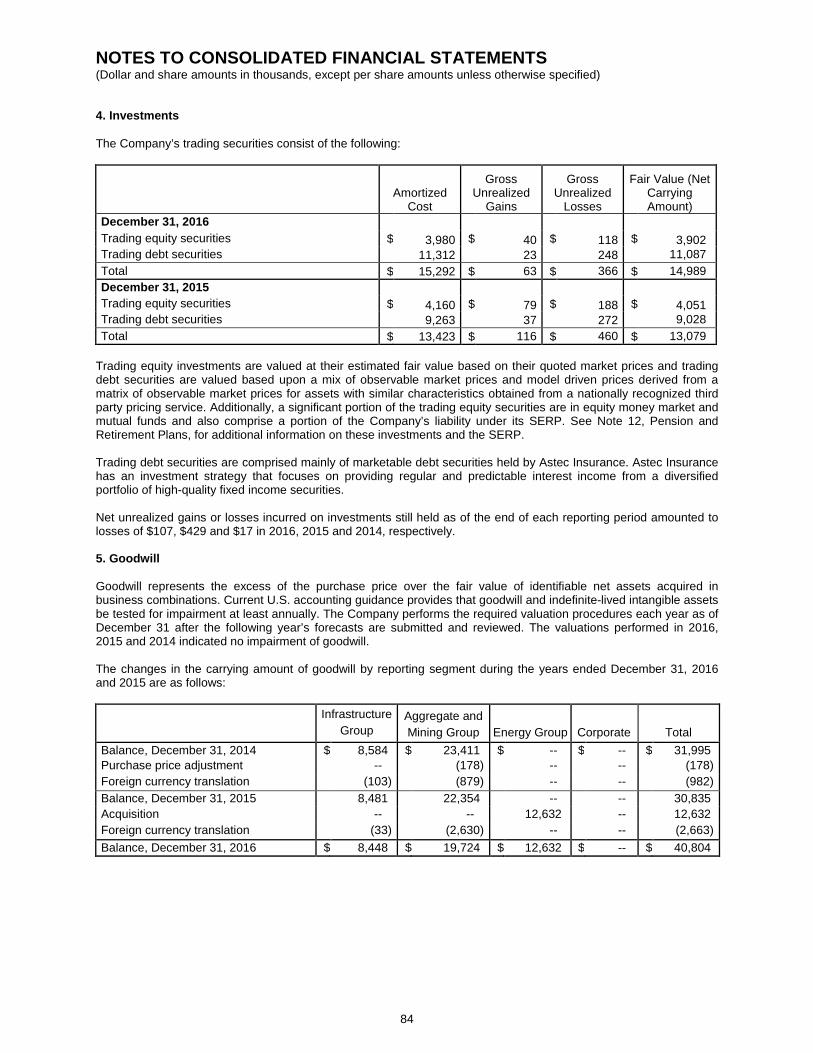
NOTES TO CONSOLIDATED FINANCIAL STATEMENTS (Dollar and share amounts in thousands, except per share amounts unless otherwise specified)
84
4. Investments The Company’s trading securities consist of the following:
Amortized Cost
Gross Unrealized
Gains
Gross Unrealized
Losses
Fair Value (Net Carrying Amount)
December 31, 2016 3,980
40
118
3,902 Trading equity securities $ $ $ $
Trading debt securities 11,312 23 248 11,087 Total $ 15,292 $ 63 $ 366 $ 14,989 December 31, 2015
4,160
79
188
4,051 Trading equity securities $ $ $ $ Trading debt securities 9,263 37 272 9,028 Total $ 13,423 $ 116 $ 460 $ 13,079
Trading equity investments are valued at their estimated fair value based on their quoted market prices and trading debt securities are valued based upon a mix of observable market prices and model driven prices derived from a matrix of observable market prices for assets with similar characteristics obtained from a nationally recognized third party pricing service. Additionally, a significant portion of the trading equity securities are in equity money market and mutual funds and also comprise a portion of the Company’s liability under its SERP. See Note 12, Pension and Retirement Plans, for additional information on these investments and the SERP. Trading debt securities are comprised mainly of marketable debt securities held by Astec Insurance. Astec Insurance has an investment strategy that focuses on providing regular and predictable interest income from a diversified portfolio of high-quality fixed income securities. Net unrealized gains or losses incurred on investments still held as of the end of each reporting period amounted to losses of $107, $429 and $17 in 2016, 2015 and 2014, respectively. 5. Goodwill Goodwill represents the excess of the purchase price over the fair value of identifiable net assets acquired in business combinations. Current U.S. accounting guidance provides that goodwill and indefinite-lived intangible assets be tested for impairment at least annually. The Company performs the required valuation procedures each year as of December 31 after the following year’s forecasts are submitted and reviewed. The valuations performed in 2016, 2015 and 2014 indicated no impairment of goodwill. The changes in the carrying amount of goodwill by reporting segment during the years ended December 31, 2016 and 2015 are as follows:
Infrastructure
Group Aggregate and Mining Group Energy Group Corporate Total
Balance, December 31, 2014 $ 8,584 $ 23,411 $ -- $ -- $ 31,995 Purchase price adjustment -- (178) -- -- (178) Foreign currency translation (103) (879) -- -- (982) Balance, December 31, 2015 8,481 22,354 -- -- 30,835 Acquisition -- -- 12,632 -- 12,632 Foreign currency translation (33) (2,630) -- -- (2,663) Balance, December 31, 2016 $ 8,448 $ 19,724 $ 12,632 $ -- $
40,804
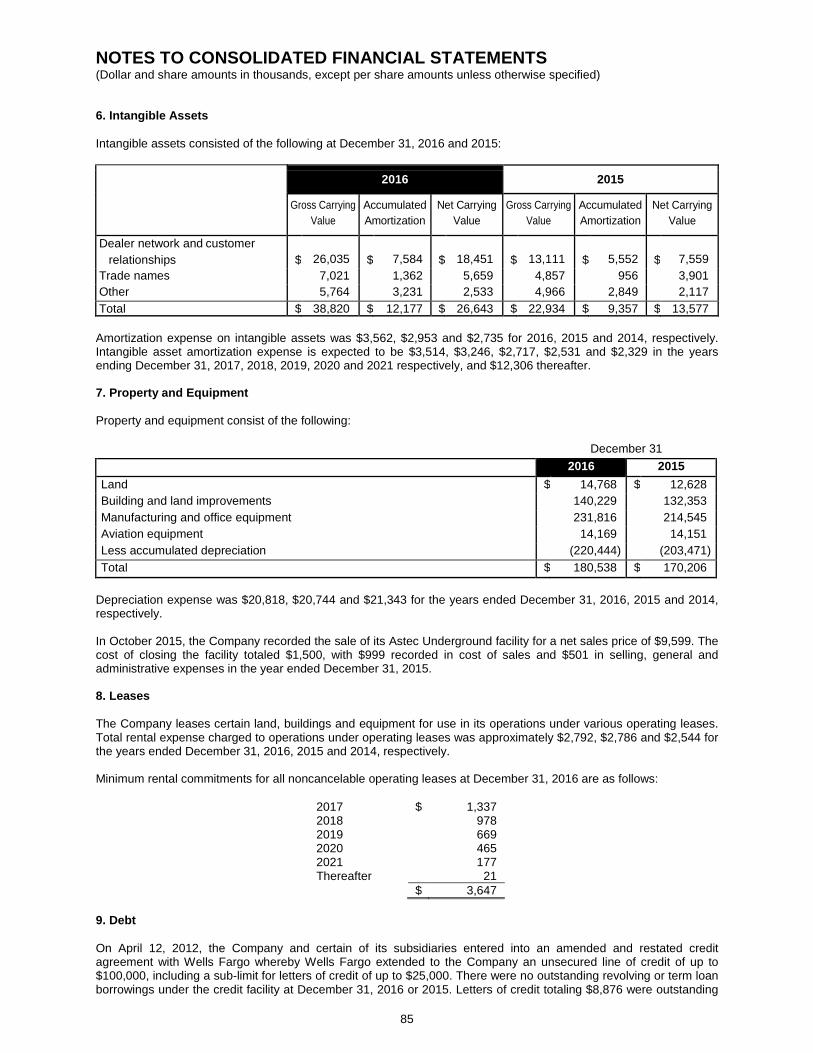
NOTES TO CONSOLIDATED FINANCIAL STATEMENTS (Dollar and share amounts in thousands, except per share amounts unless otherwise specified)
85
6. Intangible Assets Intangible assets consisted of the following at December 31, 2016 and 2015:
2016 2015
Gross Carrying
Value AccumulatedAmortization
Net Carrying Value
Gross Carrying Value
AccumulatedAmortization
Net Carrying Value
Dealer network and customer relationships
$ 26,035
$ 7,584
$ 18,451
$ 13,111
$ 5,552
$ 7,559
Trade names 7,021 1,362 5,659 4,857 956 3,901 Other 5,764 3,231 2,533 4,966 2,849 2,117 Total $ 38,820 $ 12,177 $ 26,643 $ 22,934 $ 9,357 $ 13,577
Amortization expense on intangible assets was $3,562, $2,953 and $2,735 for 2016, 2015 and 2014, respectively. Intangible asset amortization expense is expected to be $3,514, $3,246, $2,717, $2,531 and $2,329 in the years ending December 31, 2017, 2018, 2019, 2020 and 2021 respectively, and $12,306 thereafter. 7. Property and Equipment Property and equipment consist of the following: December 31 2016 2015 Land $ 14,768 $ 12,628 Building and land improvements 140,229 132,353 Manufacturing and office equipment 231,816 214,545 Aviation equipment 14,169 14,151 Less accumulated depreciation (220,444) (203,471) Total $ 180,538 $ 170,206
Depreciation expense was $20,818, $20,744 and $21,343 for the years ended December 31, 2016, 2015 and 2014, respectively. In October 2015, the Company recorded the sale of its Astec Underground facility for a net sales price of $9,599. The cost of closing the facility totaled $1,500, with $999 recorded in cost of sales and $501 in selling, general and administrative expenses in the year ended December 31, 2015. 8. Leases The Company leases certain land, buildings and equipment for use in its operations under various operating leases. Total rental expense charged to operations under operating leases was approximately $2,792, $2,786 and $2,544 for the years ended December 31, 2016, 2015 and 2014, respectively.
Minimum rental commitments for all noncancelable operating leases at December 31, 2016 are as follows:
2017 $ 1,337 2018 978 2019 669 2020 465 2021 177 Thereafter 21 $ 3,647
9. Debt On April 12, 2012, the Company and certain of its subsidiaries entered into an amended and restated credit agreement with Wells Fargo whereby Wells Fargo extended to the Company an unsecured line of credit of up to $100,000, including a sub-limit for letters of credit of up to $25,000. There were no outstanding revolving or term loan borrowings under the credit facility at December 31, 2016 or 2015. Letters of credit totaling $8,876 were outstanding
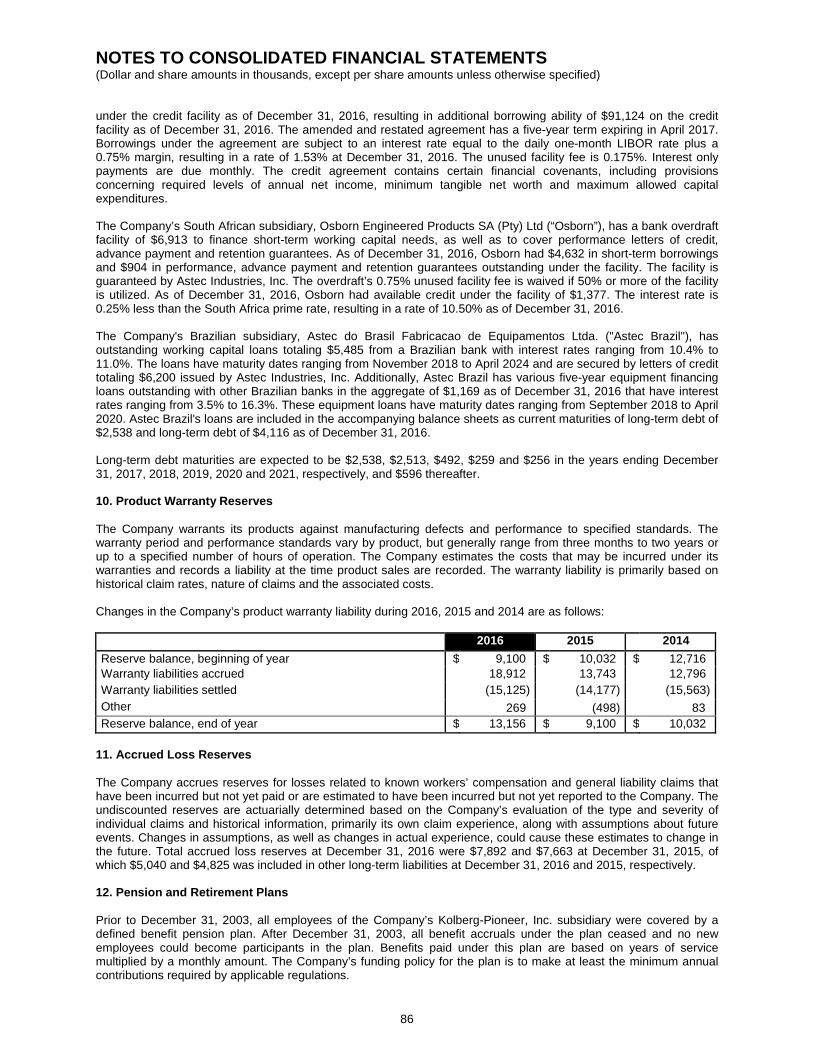
NOTES TO CONSOLIDATED FINANCIAL STATEMENTS (Dollar and share amounts in thousands, except per share amounts unless otherwise specified)
86
under the credit facility as of December 31, 2016, resulting in additional borrowing ability of $91,124 on the credit facility as of December 31, 2016. The amended and restated agreement has a five-year term expiring in April 2017. Borrowings under the agreement are subject to an interest rate equal to the daily one-month LIBOR rate plus a 0.75% margin, resulting in a rate of 1.53% at December 31, 2016. The unused facility fee is 0.175%. Interest only payments are due monthly. The credit agreement contains certain financial covenants, including provisions concerning required levels of annual net income, minimum tangible net worth and maximum allowed capital expenditures. The Company’s South African subsidiary, Osborn Engineered Products SA (Pty) Ltd (“Osborn”), has a bank overdraft facility of $6,913 to finance short-term working capital needs, as well as to cover performance letters of credit, advance payment and retention guarantees. As of December 31, 2016, Osborn had $4,632 in short-term borrowings and $904 in performance, advance payment and retention guarantees outstanding under the facility. The facility is guaranteed by Astec Industries, Inc. The overdraft’s 0.75% unused facility fee is waived if 50% or more of the facility is utilized. As of December 31, 2016, Osborn had available credit under the facility of $1,377. The interest rate is 0.25% less than the South Africa prime rate, resulting in a rate of 10.50% as of December 31, 2016. The Company's Brazilian subsidiary, Astec do Brasil Fabricacao de Equipamentos Ltda. ("Astec Brazil"), has outstanding working capital loans totaling $5,485 from a Brazilian bank with interest rates ranging from 10.4% to 11.0%. The loans have maturity dates ranging from November 2018 to April 2024 and are secured by letters of credit totaling $6,200 issued by Astec Industries, Inc. Additionally, Astec Brazil has various five-year equipment financing loans outstanding with other Brazilian banks in the aggregate of $1,169 as of December 31, 2016 that have interest rates ranging from 3.5% to 16.3%. These equipment loans have maturity dates ranging from September 2018 to April 2020. Astec Brazil's loans are included in the accompanying balance sheets as current maturities of long-term debt of $2,538 and long-term debt of $4,116 as of December 31, 2016. Long-term debt maturities are expected to be $2,538, $2,513, $492, $259 and $256 in the years ending December 31, 2017, 2018, 2019, 2020 and 2021, respectively, and $596 thereafter. 10. Product Warranty Reserves The Company warrants its products against manufacturing defects and performance to specified standards. The warranty period and performance standards vary by product, but generally range from three months to two years or up to a specified number of hours of operation. The Company estimates the costs that may be incurred under its warranties and records a liability at the time product sales are recorded. The warranty liability is primarily based on historical claim rates, nature of claims and the associated costs. Changes in the Company’s product warranty liability during 2016, 2015 and 2014 are as follows: 2016 2015 2014 Reserve balance, beginning of year $ 9,100 $ 10,032 $ 12,716 Warranty liabilities accrued 18,912 13,743 12,796 Warranty liabilities settled (15,125) (14,177) (15,563) Other 269 (498) 83 Reserve balance, end of year $ 13,156 $ 9,100 $ 10,032
11. Accrued Loss Reserves The Company accrues reserves for losses related to known workers’ compensation and general liability claims that have been incurred but not yet paid or are estimated to have been incurred but not yet reported to the Company. The undiscounted reserves are actuarially determined based on the Company’s evaluation of the type and severity of individual claims and historical information, primarily its own claim experience, along with assumptions about future events. Changes in assumptions, as well as changes in actual experience, could cause these estimates to change in the future. Total accrued loss reserves at December 31, 2016 were $7,892 and $7,663 at December 31, 2015, of which $5,040 and $4,825 was included in other long-term liabilities at December 31, 2016 and 2015, respectively.
12. Pension and Retirement Plans Prior to December 31, 2003, all employees of the Company’s Kolberg-Pioneer, Inc. subsidiary were covered by a defined benefit pension plan. After December 31, 2003, all benefit accruals under the plan ceased and no new employees could become participants in the plan. Benefits paid under this plan are based on years of service multiplied by a monthly amount. The Company’s funding policy for the plan is to make at least the minimum annual contributions required by applicable regulations.
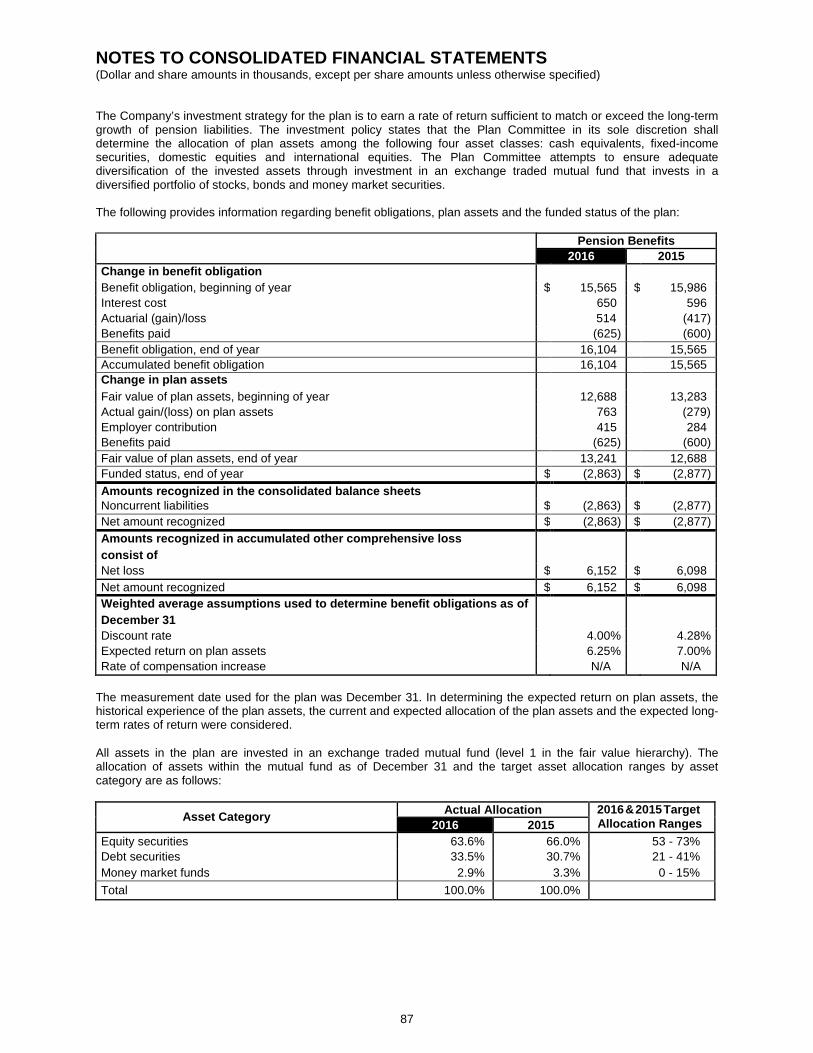
NOTES TO CONSOLIDATED FINANCIAL STATEMENTS (Dollar and share amounts in thousands, except per share amounts unless otherwise specified)
87
The Company’s investment strategy for the plan is to earn a rate of return sufficient to match or exceed the long-term growth of pension liabilities. The investment policy states that the Plan Committee in its sole discretion shall determine the allocation of plan assets among the following four asset classes: cash equivalents, fixed-income securities, domestic equities and international equities. The Plan Committee attempts to ensure adequate diversification of the invested assets through investment in an exchange traded mutual fund that invests in a diversified portfolio of stocks, bonds and money market securities. The following provides information regarding benefit obligations, plan assets and the funded status of the plan: Pension Benefits 2016 2015 Change in benefit obligation Benefit obligation, beginning of year $ 15,565 $ 15,986 Interest cost 650 596 Actuarial (gain)/loss 514 (417) Benefits paid (625) (600) Benefit obligation, end of year 16,104 15,565 Accumulated benefit obligation 16,104 15,565 Change in plan assets Fair value of plan assets, beginning of year 12,688 13,283 Actual gain/(loss) on plan assets 763 (279) Employer contribution 415 284 Benefits paid (625) (600) Fair value of plan assets, end of year 13,241 12,688 Funded status, end of year $ (2,863) $ (2,877) Amounts recognized in the consolidated balance sheets Noncurrent liabilities $ (2,863) $ (2,877) Net amount recognized $ (2,863) $ (2,877) Amounts recognized in accumulated other comprehensive loss consist of
Net loss $ 6,152 $ 6,098 Net amount recognized $ 6,152 $ 6,098 Weighted average assumptions used to determine benefit obligations as of December 31
Discount rate 4.00% 4.28% Expected return on plan assets 6.25% 7.00% Rate of compensation increase N/A N/A
The measurement date used for the plan was December 31. In determining the expected return on plan assets, the historical experience of the plan assets, the current and expected allocation of the plan assets and the expected long-term rates of return were considered. All assets in the plan are invested in an exchange traded mutual fund (level 1 in the fair value hierarchy). The allocation of assets within the mutual fund as of December 31 and the target asset allocation ranges by asset category are as follows:
Asset Category Actual Allocation 2016 & 2015 Target Allocation Ranges 2016 2015
Equity securities 63.6% 66.0% 53 - 73% Debt securities 33.5% 30.7% 21 - 41% Money market funds 2.9% 3.3% 0 - 15% Total 100.0% 100.0%

NOTES TO CONSOLIDATED FINANCIAL STATEMENTS (Dollar and share amounts in thousands, except per share amounts unless otherwise specified)
88
Net periodic benefit cost for 2016, 2015 and 2014 included the following components: Pension Benefits
2016 2015 2014 Components of net periodic benefit cost Interest cost $ 650 $ 596 $ 620 Expected return on plan assets (782) (840) (816) Amortization of actuarial loss 480 500 295 Net periodic benefit cost 348 256 99 Other changes in plan assets and benefit obligations recognized in other comprehensive income
Net actuarial loss for the year 533 702 2,115 Amortization of net loss (480) (500) (295) Total recognized in other comprehensive income 53 202 1,820
Total recognized in net periodic benefit cost and other comprehensive income $ 401
$ 458
$ 1,919
Weighted average assumptions used to determine net periodic benefit cost for years ended December 31
Discount rate 4.28% 3.81% 4.60% Expected return on plan assets 7.00% 7.00% 7.00%
No contributions are expected to be funded by the Company during 2017. Amounts in accumulated other comprehensive loss expected to be recognized in net periodic benefit cost in 2017 for the amortization of a net loss is $530. The following estimated future benefit payments are expected in the years indicated: Pension Benefits 2017 $ 730 2018 780 2019 840 2020 870 2021 900 2022 - 2025 4,780
The Company sponsors a 401(k) defined contribution plan to provide eligible employees with additional income upon retirement. The Company’s contributions to the plan are based on employee contributions. The Company’s contributions totaled $5,943, $5,292 and $5,134 in 2016, 2015 and 2014, respectively. The Company maintains a SERP for certain of its executive officers. The plan is a non-qualified deferred compensation plan administered by the Board of Directors of the Company, pursuant to which the Company makes quarterly cash contributions of a certain percentage of executive officers’ compensation. Investments are self-directed by participants and can include Company stock. Upon retirement, participants receive their apportioned share of the plan assets in the form of cash. Assets of the SERP consist of the following: December 31, 2016 December 31, 2015 Cost Market Cost Market Company stock $ 1,958 $ 3,428 $ 1,778 $ 2,560 Equity securities 3,474 4,454 3,402 3,309 Total $ 5,432 $ 7,882 $ 5,180 $ 5,869
The Company periodically adjusts the deferred compensation liability such that the balance of the liability equals the total fair market value of all assets held by the trust established under the SERP. Such liabilities are included in other long-term liabilities on the consolidated balance sheets. The equity securities are included in investments in the

NOTES TO CONSOLIDATED FINANCIAL STATEMENTS (Dollar and share amounts in thousands, except per share amounts unless otherwise specified)
89
consolidated balance sheets and classified as trading equity securities. See Note 4, Investments, for additional information. The cost of the Company stock held by the plan is included as a reduction in shareholders’ equity in the consolidated balance sheets. The change in the fair market value of Company stock held in the SERP results in a charge or credit to selling, general and administrative expenses in the consolidated statements of income because the acquisition cost of the Company stock in the SERP is recorded as a reduction of shareholders’ equity and is not adjusted to fair market value; however, the related liability is adjusted to the fair market value of the stock as of each period end. The Company recognized expense of $1,742, $241 and $74 in 2016, 2015 and 2014, respectively, related to the change in the fair value of the Company stock held in the SERP. 13. Derivative Financial Instruments The Company is exposed to certain risks relating to its ongoing business operations. The primary risk managed by using derivative instruments is foreign currency risk. From time to time the Company’s foreign subsidiaries enter into foreign currency exchange contracts to mitigate exposure to fluctuations in currency exchange rates. The fair value of the derivative financial instrument is recorded on the Company’s balance sheet and is adjusted to fair value at each measurement date. The changes in fair value are recognized in the consolidated statements of income in the current period. The Company does not engage in speculative transactions nor does it hold or issue derivative financial instruments for trading purposes. The average U.S. dollar equivalent notional amount of outstanding foreign currency exchange contracts was $11,784 during 2016. At December 31, 2016, the Company reported $144 of derivative assets in other current assets and $89 of derivative liabilities in other current liabilities. The Company reported $935 of derivative assets in other current assets, $330 of derivative assets in other long-term assets and $22 of derivative liabilities in other current liabilities at December 31, 2015. The Company recognized, as a component of cost of sales, a net loss on the change in fair value of derivative instruments of $336 for the year ended December 31, 2016 and net gains on the change in fair value of derivative instruments of $606 and $438 for the years ended December 31, 2015 and 2014, respectively. There were no derivatives that were designated as hedges at December 31, 2016 or 2015. 14. Income Taxes For financial reporting purposes, income before income taxes includes the following components: Year Ended December 31
2016 2015 2014 United States $ 87,326 $ 57,846 $ 57,651 Foreign (231) (5,873) (4,045) Income before income taxes $ 87,095 $ 51,973 $ 53,606
The provision for income taxes consists of the following: Year Ended December 31 2016 2015 2014 Current provision:
Federal $ 30,623 $ 19,758 $ 18,713 State 4,098 2,553 2,992 Foreign 907 255 243
Total current provision 35,628 22,566 21,948 Deferred provision (benefit):
Federal (2,653) (1,183) (1,627) State (1,213) (275) (222) Foreign 345 (1,101) (699)
Total deferred benefit (3,521) (2,559) (2,548) Total provision (benefit):
Federal 27,970 18,575 17,086 State 2,885 2,278 2,770 Foreign 1,252 (846) (456)
Total tax provision $ 32,107 $ 20,007 $ 19,400

NOTES TO CONSOLIDATED FINANCIAL STATEMENTS (Dollar and share amounts in thousands, except per share amounts unless otherwise specified)
90
The Company’s income tax provision is computed based on the domestic and foreign federal statutory rates and the average state statutory rates, net of related federal benefit. The provision for income taxes differs from the amount computed by applying the statutory federal income tax rate to income before income taxes. A reconciliation of the provision for income taxes at the statutory federal income tax rate to the amount provided is as follows: Year Ended December 31 2016 2015 2014 Tax at the statutory federal income tax rate $ 30,483 $ 18,191 $ 18,762 Qualified production activity deduction (1,641) (1,174) (1,360) State income tax, net of federal income tax 1,876 1,386 1,727 Other permanent differences 673 393 840 Research and development tax credits (785) (291) (1,323) Change in valuation allowance 1,638 2,036 1,675 Other items (137) (534) (921) Total tax provision $ 32,107 $ 20,007 $ 19,400
Deferred income taxes reflect the net tax effects of temporary differences between the carrying amounts of assets and liabilities for financial reporting purposes and the amounts used for income tax purposes. Significant components of the Company’s deferred tax assets and liabilities are as follows (certain amounts for 2015 have been reclassified from amounts previously reported to conform to 2016 presentation): December 31
2016 2015 Deferred tax assets:
Inventory reserves $ 8,507 $ 7,828 Warranty reserves 4,527 2,852 Bad debt reserves 456 436 State tax loss carryforwards 3,403 3,006 Accrued vacation 2,351 2,174 SERP 299 275 Deferred compensation 2,124 1,328 Restricted stock units 1,845 1,893 Pension and post-employment benefits 2,530 2,571 Foreign net operating losses 5,461 5,134 Other 2,516 9,315 Valuation allowances (8,280) (8,065)
Total deferred tax assets 25,739 28,747 Deferred tax liabilities:
Property and equipment 20,167 19,799 Intangibles 1,244 1,961 Goodwill 1,605 1,835 Pension 1,205 1,305 Outside basis differences 511 --
Total deferred tax liabilities 24,732 24,900 Total net deferred assets $ 1,007 $ 3,847
As of December 31, 2016, the Company has state net operating loss carryforwards of $79,856, foreign net operating loss carryforwards of approximately $17,339, and state tax credit carryforwards of $65 for tax purposes, which will be available to offset future taxable income. If not used, these carryforwards will expire between 2017 and 2029. A significant portion of the valuation allowance for deferred tax assets relates to the future utilization of state and foreign net operating loss and state tax credit carryforwards. Future utilization of these net operating loss and state tax credit carryforwards is evaluated by the Company on a periodic basis and the valuation allowance is adjusted accordingly. In 2016, the valuation allowance on these carryforwards was increased by $183 due to uncertainty about whether
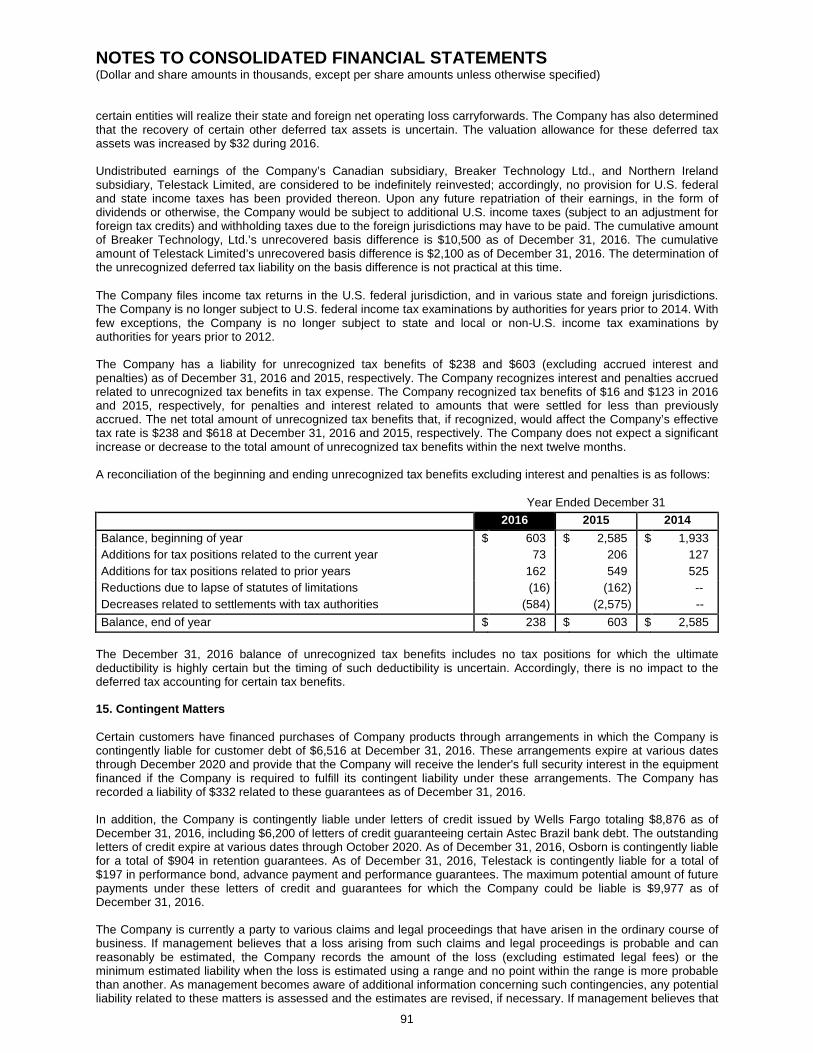
NOTES TO CONSOLIDATED FINANCIAL STATEMENTS (Dollar and share amounts in thousands, except per share amounts unless otherwise specified)
91
certain entities will realize their state and foreign net operating loss carryforwards. The Company has also determined that the recovery of certain other deferred tax assets is uncertain. The valuation allowance for these deferred tax assets was increased by $32 during 2016. Undistributed earnings of the Company’s Canadian subsidiary, Breaker Technology Ltd., and Northern Ireland subsidiary, Telestack Limited, are considered to be indefinitely reinvested; accordingly, no provision for U.S. federal and state income taxes has been provided thereon. Upon any future repatriation of their earnings, in the form of dividends or otherwise, the Company would be subject to additional U.S. income taxes (subject to an adjustment for foreign tax credits) and withholding taxes due to the foreign jurisdictions may have to be paid. The cumulative amount of Breaker Technology, Ltd.’s unrecovered basis difference is $10,500 as of December 31, 2016. The cumulative amount of Telestack Limited’s unrecovered basis difference is $2,100 as of December 31, 2016. The determination of the unrecognized deferred tax liability on the basis difference is not practical at this time. The Company files income tax returns in the U.S. federal jurisdiction, and in various state and foreign jurisdictions. The Company is no longer subject to U.S. federal income tax examinations by authorities for years prior to 2014. With few exceptions, the Company is no longer subject to state and local or non-U.S. income tax examinations by authorities for years prior to 2012. The Company has a liability for unrecognized tax benefits of $238 and $603 (excluding accrued interest and penalties) as of December 31, 2016 and 2015, respectively. The Company recognizes interest and penalties accrued related to unrecognized tax benefits in tax expense. The Company recognized tax benefits of $16 and $123 in 2016 and 2015, respectively, for penalties and interest related to amounts that were settled for less than previously accrued. The net total amount of unrecognized tax benefits that, if recognized, would affect the Company’s effective tax rate is $238 and $618 at December 31, 2016 and 2015, respectively. The Company does not expect a significant increase or decrease to the total amount of unrecognized tax benefits within the next twelve months. A reconciliation of the beginning and ending unrecognized tax benefits excluding interest and penalties is as follows: Year Ended December 31 2016 2015 2014 Balance, beginning of year $ 603 $ 2,585 $ 1,933 Additions for tax positions related to the current year 73 206 127 Additions for tax positions related to prior years 162 549 525 Reductions due to lapse of statutes of limitations (16) (162) -- Decreases related to settlements with tax authorities (584) (2,575) -- Balance, end of year $ 238 $ 603 $ 2,585
The December 31, 2016 balance of unrecognized tax benefits includes no tax positions for which the ultimate deductibility is highly certain but the timing of such deductibility is uncertain. Accordingly, there is no impact to the deferred tax accounting for certain tax benefits. 15. Contingent Matters Certain customers have financed purchases of Company products through arrangements in which the Company is contingently liable for customer debt of $6,516 at December 31, 2016. These arrangements expire at various dates through December 2020 and provide that the Company will receive the lender's full security interest in the equipment financed if the Company is required to fulfill its contingent liability under these arrangements. The Company has recorded a liability of $332 related to these guarantees as of December 31, 2016. In addition, the Company is contingently liable under letters of credit issued by Wells Fargo totaling $8,876 as of December 31, 2016, including $6,200 of letters of credit guaranteeing certain Astec Brazil bank debt. The outstanding letters of credit expire at various dates through October 2020. As of December 31, 2016, Osborn is contingently liable for a total of $904 in retention guarantees. As of December 31, 2016, Telestack is contingently liable for a total of $197 in performance bond, advance payment and performance guarantees. The maximum potential amount of future payments under these letters of credit and guarantees for which the Company could be liable is $9,977 as of December 31, 2016. The Company is currently a party to various claims and legal proceedings that have arisen in the ordinary course of business. If management believes that a loss arising from such claims and legal proceedings is probable and can reasonably be estimated, the Company records the amount of the loss (excluding estimated legal fees) or the minimum estimated liability when the loss is estimated using a range and no point within the range is more probable than another. As management becomes aware of additional information concerning such contingencies, any potential liability related to these matters is assessed and the estimates are revised, if necessary. If management believes that
NOTES TO CONSOLIDATED FINANCIAL STATEMENTS (Dollar and share amounts in thousands, except per share amounts unless otherwise specified)
92
a loss arising from such claims and legal proceedings is either (i) probable but cannot be reasonably estimated or (ii) reasonably possible but not probable, the Company does not record the amount of the loss, but does make specific disclosure of such matter. Based upon currently available information and with the advice of counsel, management believes that the ultimate outcome of its current claims and legal proceedings, individually and in the aggregate, will not have a material adverse effect on the Company's financial position, cash flows or results of operations. However, claims and legal proceedings are subject to inherent uncertainties and rulings unfavorable to the Company could occur. If an unfavorable ruling were to occur, there exists the possibility of a material adverse effect on the Company's financial position, cash flows or results of operations. During 2004, the Company received notice from the Environmental Protection Agency ("EPA") that it may be responsible for a portion of the costs incurred in connection with an environmental cleanup in Illinois. The discharge of hazardous materials and associated cleanup relate to activities occurring prior to the Company's acquisition of Barber-Greene in 1986. The Company believes that over 300 other parties have received similar notices. At this time, the Company cannot predict whether the EPA will seek to hold the Company liable for a portion of the cleanup costs or the amount of any such liability. The Company has not recorded a liability with respect to this matter because no estimate of the amount of any such liability can be made at this time. 16. Shareholders’ Equity The Company rewards key members of management with restricted stock units (“RSUs”) each year based upon the financial performance of the Company and its subsidiaries. Under the terms of the Company’s shareholder-approved 2011 Incentive Plan, up to 700 shares of newly-issued Company stock is available for awards. Awards granted in 2016 and prior vest at the end of five years from the date of grant, or at the time a recipient retires after reaching age 65, if earlier, while awards to be granted after 2016 are scheduled to have a three-year vesting period. The fair value of the RSUs vesting during 2016, 2015 and 2014 was $3,289, $2,785 and $3,045, respectively. The grant date tax benefit was increased by $220, $336 and $470, respectively, upon the vesting of RSUs in 2016, 2015 and 2014. Compensation expense of $2,426, $1,019 and $961 was recorded in the years ended December 31, 2016, 2015 and 2014, respectively, to reflect the fair value of RSUs granted (or anticipated to be granted for 2016 performance) amortized over the portion of the vesting period occurring during the period. Related income tax benefits of $934, $362 and $348 were recorded in 2016, 2015 and 2014, respectively. Based upon the grant date fair value of RSUs, it is anticipated that $4,712 of additional compensation costs will be recognized in future periods through 2021 for RSUs earned through December 31, 2016. The weighted average period over which this additional compensation cost will be expensed is 3.2 years. RSUs do not participate in Company-paid dividends. Changes in restricted stock units during the year ended December 31, 2016 are as follows:
2016
Weighted Average Grant Date Fair Value
Unvested restricted stock units, beginning of year 147 $ 36.83 Units granted 44 44.52 Units forfeited (1) 39.10 Units vested (78) 34.42
Unvested restricted stock units, end of year 112 41.48 The grant date fair value of the restricted stock units granted during 2016, 2015 and 2014 was $1,946, $937 and $561, respectively. 17. Operations by Industry Segment and Geographic Area The Company has three reportable segments, each of which is comprised of multiple business units that offer similar products and services and meet the requirements for aggregation. A brief description of each segment is as follows: Infrastructure Group - This segment consists of five business units, three of which design, engineer, manufacture and market a complete line of portable, stationary and relocatable hot-mix asphalt plants, wood pellet plants, asphalt pavers, material transfer vehicles, stabilizers, milling machines, paver screeds and related ancillary equipment. The other two business units in this segment primarily operate as Company-owned dealers in the foreign countries in which they are domiciled. These two business units sell, service and install products produced by the manufacturing subsidiaries of the Company, and a majority of their sales are to customers in the infrastructure industry. The principal purchasers of the products produced by this group are asphalt producers, highway and heavy equipment contractors, wood pellet processors and foreign and domestic governmental agencies. During 2016, the Infrastructure
NOTES TO CONSOLIDATED FINANCIAL STATEMENTS (Dollar and share amounts in thousands, except per share amounts unless otherwise specified)
93
Group had sales to one pellet plant customer totaling $135,187, or 11.8% of total Company sales. Portions of the equipment sold to this customer were manufactured by each of the Company’s segments. Aggregate and Mining Group - This segment consists of eight business units that design, engineer, manufacture and market a complete line of jaw crushers, cone crushers, horizontal shaft impactors, vertical shaft impactors, material handling, roll rock crushers and stationary rockbreaker systems, vibrating feeders and high frequency vibrating screens, conveyors, inclined, vertical and horizontal screens and sand classifying and washing equipment. The principal purchasers of products produced by this group are distributors, open mine operators, quarry operators, port and inland terminal operators, highway and heavy equipment contractors and foreign and domestic governmental agencies. This group includes the operations of Telestack Limited, which was acquired in April 2014. Energy Group - This segment consists of five business units that design, engineer, manufacture and market a complete line of drilling rigs for the oil and gas, geothermal and water well industries, high pressure diesel pump trailers for fracking and cleaning oil and gas wells, commercial and industrial burners, combustion control systems, a variety of industrial heaters to fit a broad range of applications including heating equipment for refineries, roofing material plants, chemical processing, rubber plants, oil sands and energy related processing, heat transfer processing equipment, thermal fluid storage tanks, waste heat recovery equipment, whole-tree pulpwood and biomass chippers and horizontal grinders. The principal purchasers of products produced by this group are oil, gas and water well drilling industry contractors, processors of oil, gas and biomass for energy production and contractors in the construction and demolition recycling markets. This group includes the operations of Power Flame Incorporated, which was acquired in August 2016. Corporate - This category consists of business units that do not meet the requirements for separate disclosure as an operating segment or inclusion in one of the other reporting segments and includes the Company's parent company, Astec Industries, Inc., and Astec Insurance. The Company evaluates performance and allocates resources to its operating segments based on profit or loss from operations before U.S. federal income taxes and corporate overhead and thus these costs are included in the Corporate category. The accounting policies of the reportable segments are the same as those described in the summary of significant accounting policies. Intersegment sales and transfers are valued at prices comparable to those for unrelated parties.
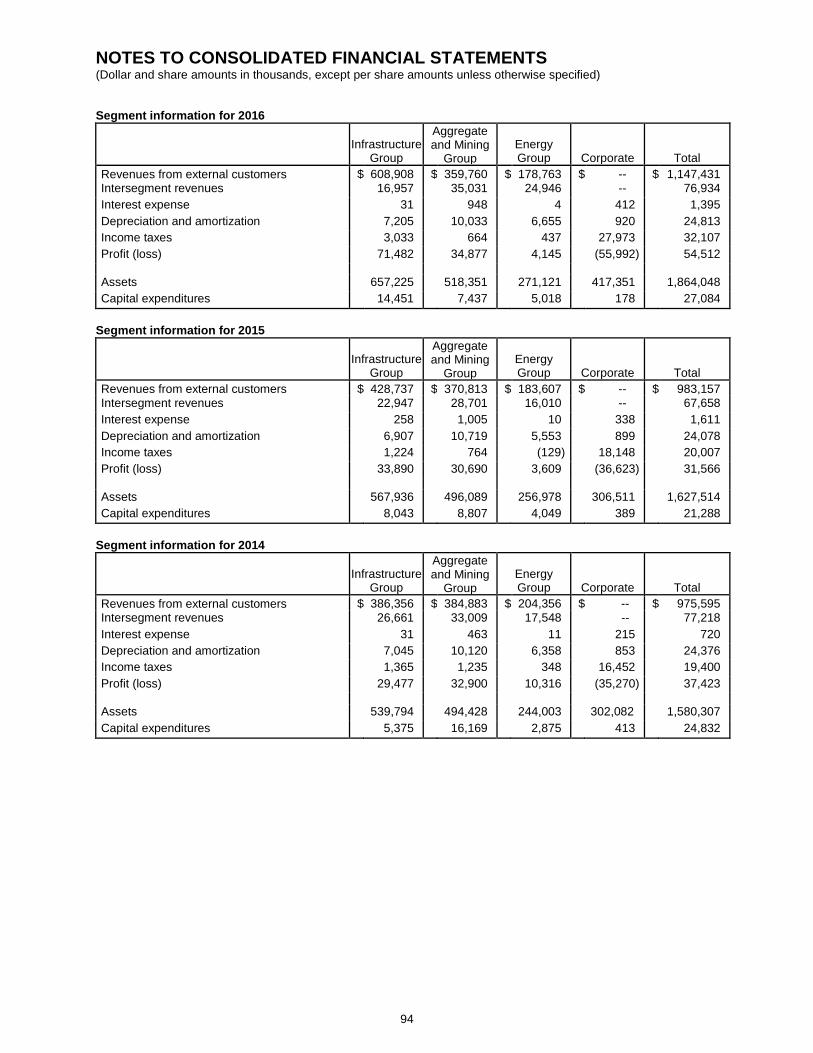
NOTES TO CONSOLIDATED FINANCIAL STATEMENTS (Dollar and share amounts in thousands, except per share amounts unless otherwise specified)
94
Segment information for 2016
Infrastructure Group
Aggregate and Mining
Group Energy Group Corporate Total
Revenues from external customers $ 608,908 $ 359,760 $ 178,763 $ -- $ 1,147,431 Intersegment revenues 16,957 35,031 24,946 -- 76,934 Interest expense 31 948 4 412 1,395 Depreciation and amortization 7,205 10,033 6,655 920 24,813 Income taxes 3,033 664 437 27,973 32,107 Profit (loss) 71,482 34,877 4,145 (55,992) 54,512 Assets 657,225 518,351 271,121 417,351 1,864,048 Capital expenditures 14,451 7,437 5,018 178 27,084
Segment information for 2015
Infrastructure Group
Aggregate and Mining
Group Energy Group Corporate Total
Revenues from external customers $ 428,737 $ 370,813 $ 183,607 $ -- $ 983,157 Intersegment revenues 22,947 28,701 16,010 -- 67,658 Interest expense 258 1,005 10 338 1,611 Depreciation and amortization 6,907 10,719 5,553 899 24,078 Income taxes 1,224 764 (129) 18,148 20,007 Profit (loss) 33,890 30,690 3,609 (36,623) 31,566 Assets 567,936 496,089 256,978 306,511 1,627,514 Capital expenditures 8,043 8,807 4,049 389 21,288
Segment information for 2014
Infrastructure Group
Aggregate and Mining
Group Energy Group Corporate Total
Revenues from external customers $ 386,356 $ 384,883 $ 204,356 $ -- $ 975,595 Intersegment revenues 26,661 33,009 17,548 -- 77,218 Interest expense 31 463 11 215 720 Depreciation and amortization 7,045 10,120 6,358 853 24,376 Income taxes 1,365 1,235 348 16,452 19,400 Profit (loss) 29,477 32,900 10,316 (35,270) 37,423 Assets 539,794 494,428 244,003 302,082 1,580,307 Capital expenditures 5,375 16,169 2,875 413 24,832
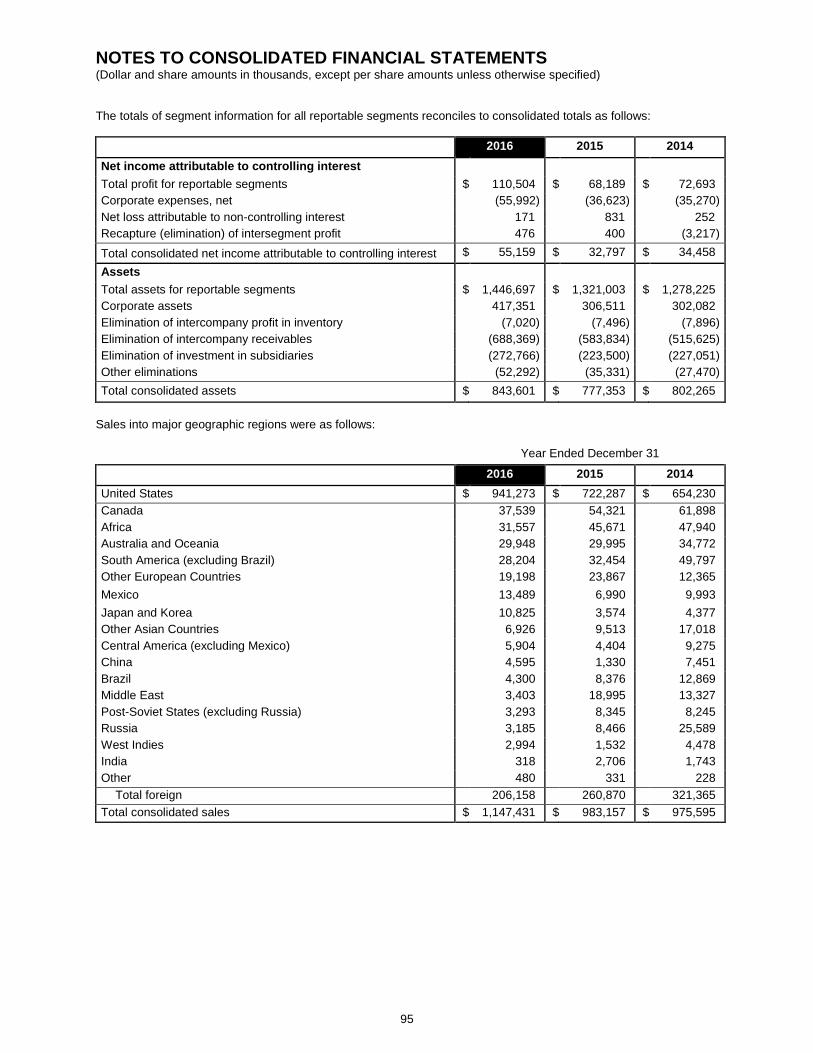
NOTES TO CONSOLIDATED FINANCIAL STATEMENTS (Dollar and share amounts in thousands, except per share amounts unless otherwise specified)
95
The totals of segment information for all reportable segments reconciles to consolidated totals as follows: 2016 2015 2014 Net income attributable to controlling interest Total profit for reportable segments $ 110,504 $ 68,189 $ 72,693 Corporate expenses, net (55,992) (36,623) (35,270) Net loss attributable to non-controlling interest 171 831 252 Recapture (elimination) of intersegment profit 476 400 (3,217)
Total consolidated net income attributable to controlling interest $ 55,159 $ 32,797 $ 34,458 Assets Total assets for reportable segments $ 1,446,697 $ 1,321,003 $ 1,278,225 Corporate assets 417,351 306,511 302,082 Elimination of intercompany profit in inventory (7,020) (7,496) (7,896) Elimination of intercompany receivables (688,369) (583,834) (515,625) Elimination of investment in subsidiaries (272,766) (223,500) (227,051) Other eliminations (52,292) (35,331) (27,470) Total consolidated assets $ 843,601 $ 777,353 $ 802,265
Sales into major geographic regions were as follows: Year Ended December 31
2016 2015 2014 United States $ 941,273 $ 722,287 $ 654,230 Canada 37,539 54,321 61,898 Africa 31,557 45,671 47,940 Australia and Oceania 29,948 29,995 34,772 South America (excluding Brazil) 28,204 32,454 49,797 Other European Countries 19,198 23,867 12,365 Mexico 13,489 6,990 9,993 Japan and Korea 10,825 3,574 4,377 Other Asian Countries 6,926 9,513 17,018 Central America (excluding Mexico) 5,904 4,404 9,275 China 4,595 1,330 7,451 Brazil 4,300 8,376 12,869 Middle East 3,403 18,995 13,327 Post-Soviet States (excluding Russia) 3,293 8,345 8,245 Russia 3,185 8,466 25,589 West Indies 2,994 1,532 4,478 India 318 2,706 1,743 Other 480 331 228
Total foreign 206,158 260,870 321,365 Total consolidated sales $ 1,147,431 $ 983,157 $ 975,595

NOTES TO CONSOLIDATED FINANCIAL STATEMENTS (Dollar and share amounts in thousands, except per share amounts unless otherwise specified)
96
Long-lived assets by major geographic region are as follows: December 31
2016 2015 United States $ 151,470 $ 141,727 Brazil 11,288 9,780 South Africa 5,372 5,116 Northern Ireland 4,279 5,116 Australia 4,234 4,351 Canada 2,860 2,987 Germany 1,035 1,129
Total foreign 29,068 28,479 Total $ 180,538 $ 170,206
18. Accumulated Other Comprehensive Loss The balance of related after-tax components comprising accumulated other comprehensive loss is summarized below: December 31
2016 2015 Foreign currency translation adjustment $ (27,839) $ (19,891) Unrecognized pension and post-retirement benefit cost, net of tax of
$2,261 and $2,232, respectively (3,723)
(3,673)
Accumulated other comprehensive loss $ (31,562) $ (23,564) See Note 12, Pension and Retirement Plans, for discussion of the amounts recognized in accumulated other comprehensive income related to the Company’s Kolberg-Pioneer, Inc. defined pension plan. 19. Other Income (Expense) - Net Other income (expense), net consists of the following: Year Ended December 31
2016 2015 2014 Investment income (loss) $ (276) $ (381) $ 64 Licensing fees 546 641 831 Income from life insurance policies -- 1,204 -- Other 259 1,591 312 Total $ 529 $ 3,055 $ 1,207
20. Business Combinations In August 2016, the Company acquired substantially all of the assets and certain liabilities of Power Flame Incorporated (“PFI”) for a total purchase price of $39,765. The purchase price was paid in cash with $4,000 deposited into escrow for a period of time not to exceed two years pending final resolution of certain post-closing adjustments and any indemnification claims. The Company’s allocation of the purchase price resulted in the recognition of $12,632 of goodwill and $17,990 of other intangible assets consisting of technology (19 year useful life), trade names (15 year useful life) and customer relationships (18 year useful life). The revenues and results of operations of PFI were not significant in relation to the Company’s financial statements for the period ended December 31, 2016 and would not have been material on a proforma basis to any earlier period. PFI’s operating results are included in the Energy Group beginning in the third quarter of 2016. PFI, located in Parsons, Kansas, began operations in 1948 and manufactures and sells gas, oil and combination gas/oil and low NOx burners with outputs ranging from 400 thousand BTU’s per hour to 120 million BTU’s per hour as well as combustion control systems designed for commercial, industrial and process heating applications.
NOTES TO CONSOLIDATED FINANCIAL STATEMENTS (Dollar and share amounts in thousands, except per share amounts unless otherwise specified)
97
On April 1, 2014, the Company purchased 100% of the stock of Telestack Limited (“Telestack”) for a total purchase price of $36,183. The purchase price was paid in cash with $2,500 deposited into escrow for a period of time not to exceed one year and was subject to certain post-closing adjustments. The post-closing adjustments were finalized during the first quarter of 2015 resulting in a decrease in the purchase price of $178. The adjusted purchase price allocation includes the recognition of $18,078 of goodwill and $14,445 of other intangible assets based on the exchange rate as of the acquisition date, consisting of trade names (15 year useful life), patents (5 to 10 year useful lives), non-compete agreements (3 year useful life) and customer relationships (11 year useful life). Telestack’s operating results are included in the Aggregate and Mining Group beginning in the second quarter of 2014. Telestack, located in Omagh, Northern Ireland, began operations in 1999 and specializes in the complete in-house design, manufacture, installation and commissioning of a complete line of material handling systems used extensively in the port, aggregate and mining industries. Telestack markets its products throughout the world by a combination of direct sales and distribution through dealers.
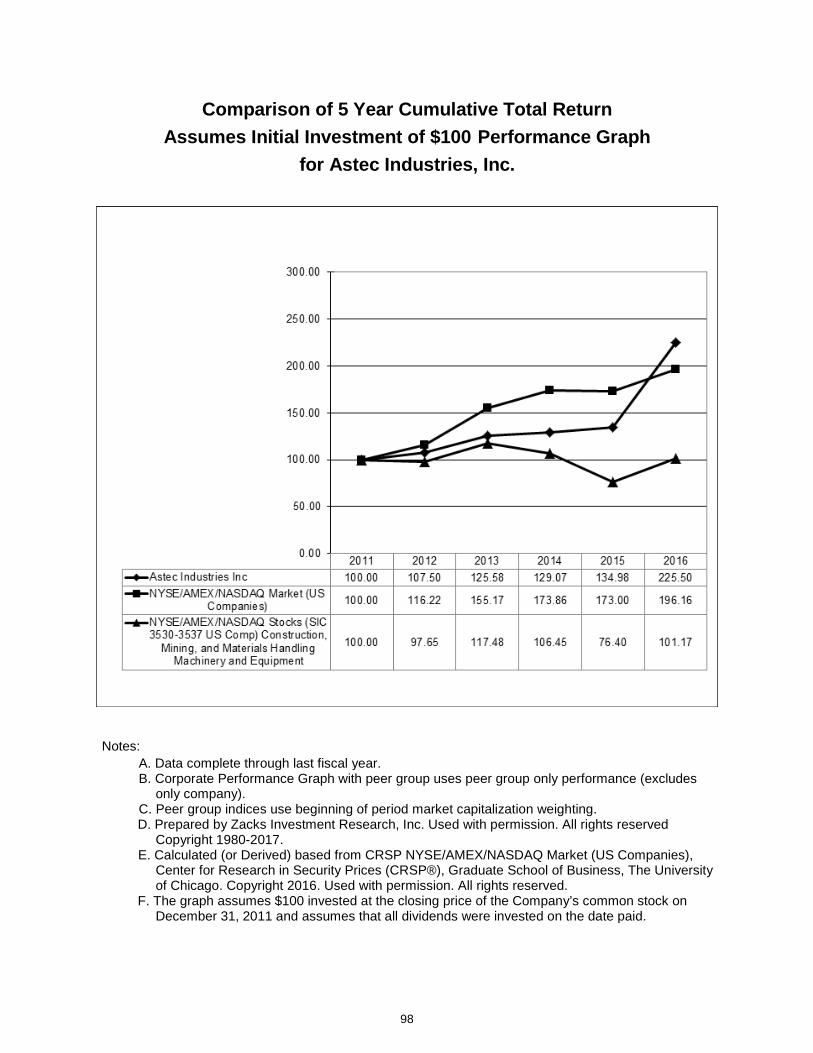
98
Comparison of 5 Year Cumulative Total Return Assumes Initial Investment of $100 Performance Graph
for Astec Industries, Inc.
Notes: A. Data complete through last fiscal year. B. Corporate Performance Graph with peer group uses peer group only performance (excludes
only company). C. Peer group indices use beginning of period market capitalization weighting.
D. Prepared by Zacks Investment Research, Inc. Used with permission. All rights reserved Copyright 1980-2017.
E. Calculated (or Derived) based from CRSP NYSE/AMEX/NASDAQ Market (US Companies), Center for Research in Security Prices (CRSP®), Graduate School of Business, The University of Chicago. Copyright 2016. Used with permission. All rights reserved.
F. The graph assumes $100 invested at the closing price of the Company’s common stock on December 31, 2011 and assumes that all dividends were invested on the date paid.
An
nu
al R
ep
ort
Des
ign
by
Fal
k H
arri
son
/ fa
lkh
arri
son
.co
m
INFRASTRUCTURE GROUP
10 Astec and Dillman Equipment 12 Roadtec 14 Carlson Paving Products 16 Astec Australia 18 Astec Mobile Machinery
AGGREGATE & MINING GROUP
20 Telsmith 22 Osborn Engineered Products 24 Breaker Technology 26 Astec do Brasil 28 Kolberg-Pioneer 30 Johnson Crushers
International 32 Astec Mobile Screens 34 Telestack
ENERGY GROUP
36 Heatec 38 CEI Enterprises 40 Peterson Pacific Corp. 42 GEFCO 44 Power Flame
CORPORATE INFORMATION 46 Corporate Executive Officers
(in thousands, except as noted*) 2016 2015 2014 2013 2012
OPERATING RESULTS Net sales $1,147,431 $983,157 $975,595 $932,998 $936,273
Net income attributable to controlling interest 55,159 32,797 34,458 39,042 40,828
FINANCIAL POSITION
Total assets $ 843,601 $777,353 $802,265 $749,291 $728,783
Working capital 407,972 399,785 388,862 385,680 355,336
Equity 648,841 609,858 596,152 577,311 547,534
PER COMMON SHARE*
Net income attributable to controlling interest
Basic $ 2.40 $ 1.43 $ 1.51 $ 1.72 $ 1.80
Diluted 2.38 1.42 1.49 1.69 1.77
Book value per common share at year end 27.99 26.30 25.62 24.85 23.68
OTHER DATA Weighted average number of common
shares outstanding
Basic 22,992 22,934 22,819 22,749 22,680
Diluted 23,142 23,120 23,105 23,081 23,051
Associates* 4,218 3,740 3,952 3,708 3,860
FINANCIAL OVERVIEW
CONTENTS
01 Our Industry-Leading Footprint 02 Letter to Shareholders 06 New Technologies
OTHER INFORMATION
Transfer AgentComputershare250 Royall Street, Canton, MA 02021800.617.6437www.computershare.com/investor
Stock ExchangeNASDAQ, National Market—ASTE
AuditorsKPMG LLP, Knoxville, TN
General Counsel and LitigationChambliss, Bahner & Stophel, P.C., Chattanooga, TN
Securities CounselAlston & Bird LLP, Atlanta, GA
Investor RelationsStephen C. Anderson, 423.553.5934
Corporate OfficeAstec Industries, Inc. 1725 Shepherd Road Chattanooga, TN 37421Ph 423.899.5898 Fax 423.899.4456www.astecindustries.com
The form 10-K, as filed with the Securities and Exchange Commission, may be obtained at no cost by any shareholder upon written request to Astec Industries, Inc., Attention Investor Relations.
The Company’s Code of Conduct is posted at www.astecindustries.com.
The Annual Meeting will be held on April 27, 2017, at 10:00 A.M. EST in the Training Center of Astec, Inc. located at 4101 Jerome Avenue, Chattanooga, TN 37407.
23431_Astec_2016AnnualReportCvr.indd 2 2/28/17 3:09 PM

Corporate Headquarters:1725 Shepherd Road
Chattanooga, Tennessee 37421 USA
Tel: 423.899.5898 • Fax: 423.899.4456
www.astecindustries.com